sacramento q industrial real estate...the greatest positive net absorption of 217,649 square feet,...
TRANSCRIPT
INDUSTRIAL SACRAMENTO
AVERAGE ASKING RATESWEIGHTED AVERAGE RENT BASED ON TOTAL SQUARE FOOTAGE
NET & GROSS ABSORPTIONNET - TOTAL SQ. FT. OCCUPIED LESS THE SQ. FT. VACATED & GROSS - TOTAL SQ. FT. OCCUPIED
VACANCY RATE & AVAILABILITY RATEALL SPACE NOT CURRENTLY OCCUPIED & ALL SPACE CURRENTLY MARKETED
MARKET OVERVIEW
uIndustrial Market: The Sacramento industrial market fared well during the third quarter of 2018 as the overall vacancy rate further decreased to an all-time low of 4.20%. At the close of the third quarter, net absorption was positive at just over 420,000 square feet.
uVacancy Rates: In comparison to the previous quarter, the vacancy rate decreased to 4.20%, which remains the lowest vacancy rate seen to-date for the Sacramento Region. The largest submarkets – Power Inn, West Sacramento and Roseville/Rocklin – had vacancy rates of 4.10%, 5.44% and 3.48%. Among the largest submarkets, some of the lowest vacancy rates were also seen in the Sunrise and Marysville/Yuba City submarkets with rates at 1.42% and 1.19%, respectively. Alternatively, the highest vacancy rates were still seen in the South Sacramento submarket with an overall rate of 23.56%.
uLease Rates: At the end of the third quarter, the average asking triple net lease rate for the Sacramento industrial market was $0.56, which is a $0.04 increase from the previous quarter. Within the two largest submarkets – Power Inn and West Sacramento – the average asking lease rates were $0.84 and $0.53 per square foot. Some of the highest asking lease rates were seen in the South Sacramento submarket with an average of $1.11 per square foot. Alternatively, the lowest lease rates were seen in the Davis/Woodland and Richards submarkets with average asking rates of $0.36 and $0.40 per square foot, respectively.
uSale & Lease Transactions: Transaction activity at the close of the third quarter was 2.63 million square feet, which is an increase from the previous quarter’s figure of 3.57 million square feet. Given that there is often a delay for final figures to be totaled, this quarter’s figure will slightly increase in the next market report.
uAbsorption: The industrial market ended the third quarter with 420,103 square feet of positive net absorption. The Roseville/Rocklin submarket had the greatest positive net absorption of 217,649 square feet, and the West Sacramento submarket had the second highest net absorption of 205,271 square feet. Alternatively, the Power Inn submarket experienced 90,134 square feet of negative net absorption.
uDevelopment: Eleven industrial projects are currently under construction in the Sacramento market. The largest of those projects is a 417,637 square foot Class B industrial building in the McClellan submarket expected to be delivered May 2019. The second largest industrial project under construc-tion is a 244,408 square foot Class A warehouse building in the West Sacramento submarket and expected to be delivered March 2019. Currently, there are 14.45 million square feet of proposed industrial space for the Sacramento market.
uThird Quarter Review: Overall, the Sacramento industrial market has out-paced other commercial property types with continually low vacancy rates and increasing lease rates. Among other positive trends, net absorption has remained positive for fourteen consecutive quarters. According to the most recent Sacramento employment figures, the unemployment rate in the Sacramento-Roseville-Arden Arcade MSA was 3.8% in August of 2018.
SACRAMENTO INDUSTRIAL TRENDS | THIRD QUARTER 2018ARROWS REPRESENT CHANGES FROM THE PREVIOUS QUARTER
4.20%
5.67%
2.00%
4.00%
6.00%
8.00%
10.00%
12.00%
14.00%
16.00%
18.00%
20.00%
2010 2011 2012 2013 2014 2015 2016 2017 YTD
Perc
enta
ge
Vacancy Rate Availability Rate
$0.56
$-
$0.10
$0.20
$0.30
$0.40
$0.50
$0.60
Q3 2016 Q4 2016 Q1 2017 Q2 2017 Q3 2017 Q4 2017 Q1 2018 Q2 2018 Q3 2018
Aver
age
Aski
ng R
ates
(NN
N)
420,103
1,654,669
-
500,000
1,000,000
1,500,000
2,000,000
2,500,000
3,000,000
3,500,000
Q3 2016 Q4 2016 Q1 2017 Q2 2017 Q3 2017 Q4 2017 Q1 2018 Q2 2018 Q3 2018
Squa
re F
eet
Net Gross
Building Great Relationships Since 1977THESE STATISTICS ENCOMPASS THE ENTIRE SURVEY, WHICH INCLUDES ALL INDUSTRIAL PROPERTY TYPES 10,000 SQUARE FEET AND LARGER.
Q32018
C O M M E R C I A LR E A L E S T A T EM A R K E T T R E N D S
R E A L E S TAT E S E R V I C E S
Vacancy Lease Rates (NNN) Net Absorption Transaction Activity
M A R K E T INDICATORS
Q3 2018
4.20% $0.56 420,103 2,635,454
Q2 2018
4.70% $0.52 852,655 3,576,608
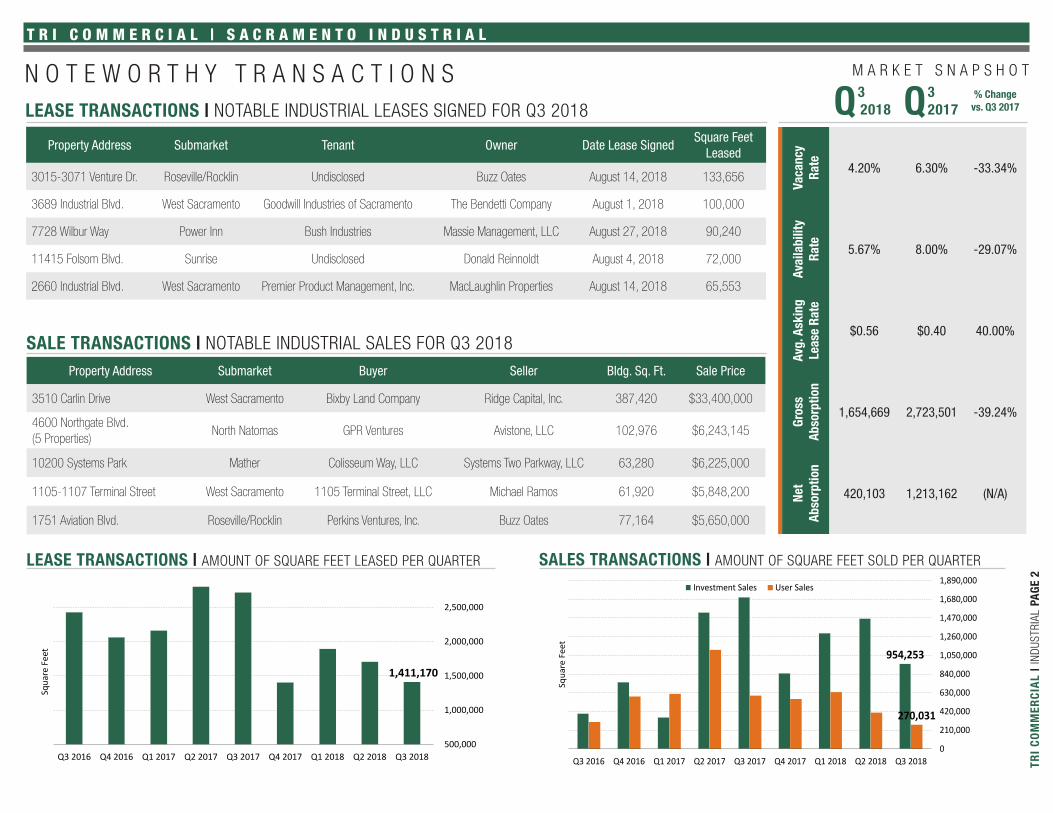
SALES TRANSACTIONS | AMOUNT OF SQUARE FEET SOLD PER QUARTER
N O T E W O R T H Y T R A N S A C T I O N SLEASE TRANSACTIONS | NOTABLE INDUSTRIAL LEASES SIGNED FOR Q3 2018
Property Address Submarket Tenant Owner Date Lease SignedSquare Feet
Leased
3015-3071 Venture Dr. Roseville/Rocklin Undisclosed Buzz Oates August 14, 2018 133,656
3689 Industrial Blvd. West Sacramento Goodwill Industries of Sacramento The Bendetti Company August 1, 2018 100,000
7728 Wilbur Way Power Inn Bush Industries Massie Management, LLC August 27, 2018 90,240
11415 Folsom Blvd. Sunrise Undisclosed Donald Reinnoldt August 4, 2018 72,000
2660 Industrial Blvd. West Sacramento Premier Product Management, Inc. MacLaughlin Properties August 14, 2018 65,553
SALE TRANSACTIONS | NOTABLE INDUSTRIAL SALES FOR Q3 2018Property Address Submarket Buyer Seller Bldg. Sq. Ft. Sale Price
3510 Carlin Drive West Sacramento Bixby Land Company Ridge Capital, Inc. 387,420 $33,400,000
4600 Northgate Blvd. (5 Properties)
North Natomas GPR Ventures Avistone, LLC 102,976 $6,243,145
10200 Systems Park Mather Colisseum Way, LLC Systems Two Parkway, LLC 63,280 $6,225,000
1105-1107 Terminal Street West Sacramento 1105 Terminal Street, LLC Michael Ramos 61,920 $5,848,200
1751 Aviation Blvd. Roseville/Rocklin Perkins Ventures, Inc. Buzz Oates 77,164 $5,650,000
T R I C O M M E R C I A L | S A C R A M E N T O I N D U S T R I A L
M A R K E T S N A P S H O T
TRI
CO
MM
ERC
IAL
| IND
USTR
IAL
PAGE
2
LEASE TRANSACTIONS | AMOUNT OF SQUARE FEET LEASED PER QUARTER
1,411,170
500,000
1,000,000
1,500,000
2,000,000
2,500,000
Q3 2016 Q4 2016 Q1 2017 Q2 2017 Q3 2017 Q4 2017 Q1 2018 Q2 2018 Q3 2018
Squa
re F
eet
Building Great Relationships Since 1977
954,253
270,031
0
210,000
420,000
630,000
840,000
1,050,000
1,260,000
1,470,000
1,680,000
1,890,000
Q3 2016 Q4 2016 Q1 2017 Q2 2017 Q3 2017 Q4 2017 Q1 2018 Q2 2018 Q3 2018
Squa
re F
eet
Investment Sales User Sales
Q3 2018 Q3
2017% Change
vs. Q3 2017
Vaca
ncy
Rate 4.20% 6.30% -33.34%
Avai
labi
lity
Rate 5.67% 8.00% -29.07%
Avg.
Ask
ing
Leas
e Ra
te
$0.56 $0.40 40.00%
Gros
sAb
sorp
tion
1,654,669 2,723,501 -39.24%
Net
Abso
rptio
n
420,103 1,213,162 (N/A)

Submarket Total Buildings
Net Rentable
Square Feet
Vacant Square
Feet
Vacancy Rate
Q3 2018
OccupiedSquare
Feet
OccupancyRate
Q3 2018
Available Square
Feet
Availability Rate
Q3 2018
Net Absorption
Q3 2018
YTD Net
Absorption
Gross Absorption
Q3 2018
YTD Gross
Abosorption
Under ConstructionSquare Feet
Proposed Square
Feet
Average Asking Rate
(All Classes)
Auburn/Newcastle 85 2,234,921 19,895 0.89% 2,215,026 99.11% 84,020 3.76% 0 (3,461) 0 13,685 0 0 $0.48
Davis/Woodland 188 16,203,720 959,648 5.92% 15,244,072 94.08% 921,524 5.69% 43,297 210,792 92,774 511,091 0 491,565 $0.36
Downtown 85 2,526,602 36,381 1.44% 2,490,221 98.56% 36,381 1.44% 4,000 7,731 4,000 22,314 0 0 $0.55
East Sacramento 22 550,941 0 0.00% 550,941 100.00% 17,250 3.13% 0 0 0 0 0 0 -
Elk Grove/Laguna 117 5,727,591 210,988 3.68% 5,513,779 96.27% 263,150 4.59% 20,566 151,596 29,246 201,046 8,000 922,559 $0.58
Folsom/El Dorado 104 3,187,608 174,416 5.47% 3,013,192 94.53% 203,118 6.37% (23,447) (33,308) 1,395 20,452 0 0 $0.67
Marysville/Yuba City 148 6,322,128 74,977 1.19% 6,247,151 98.81% 258,927 4.10% 29,100 53,148 31,500 77,000 0 0 $0.41
Mather 125 3,886,441 127,530 3.28% 3,758,911 96.72% 156,626 4.03% (1,385) 79,349 19,135 134,407 51,156 89,593 $0.49
McClellan 290 13,516,433 261,642 1.94% 13,267,982 98.16% 329,338 2.44% 102,400 530,962 163,068 727,795 462,737 52,108 $0.69
Natomas/Northgate 204 12,551,076 412,773 3.29% 12,161,953 96.90% 1,013,592 8.08% (60,736) (194,563) 114,599 415,921 0 8,351,202 $0.56
NE Sacramento 190 4,999,729 230,455 4.61% 4,769,274 95.39% 333,198 6.66% 2,252 28,655 89,270 146,604 0 0 $0.78
Power Inn 567 24,428,956 1,002,452 4.10% 23,439,456 95.95% 1,646,127 6.74% (90,134) 13,903 318,213 972,115 0 1,780,840 $0.84
Richards 84 4,028,809 75,445 1.87% 3,953,364 98.13% 75,445 1.87% (21,896) 45,182 25,000 117,822 0 0 $0.40
Roseville/Rocklin 284 16,314,616 567,028 3.48% 15,750,318 96.54% 617,280 3.78% 217,649 813,494 272,096 1,077,805 0 1,239,260 $0.41
South Sacramento 122 4,010,719 944,851 23.56% 3,065,868 76.44% 949,651 23.68% (45,101) (59,521) 4,500 11,700 0 600,000 $1.11
Sunrise 331 9,667,158 136,914 1.42% 9,533,844 98.62% 274,198 2.84% 38,267 150,407 189,460 430,048 0 0 $0.67
West Sacramento 324 18,541,381 1,009,227 5.44% 17,561,404 94.71% 1,258,009 6.78% 205,271 1,213,852 300,413 1,910,850 473,016 915,500 $0.53
Industrial Market Totals 3,270 148,698,829 6,244,622 4.20% 142,536,756 95.86% 8,437,834 5.67% 420,103 3,008,218 1,654,669 6,790,655 994,909 14,442,627 $0.56
10,000-29,999 2,014 33,442,026 1,011,368 3.02% 32,471,190 97.10% 1,493,047 4.46% (12,205) (20,664) 340,464 884,033 59,156 332,133 $0.90
30,000-49,999 519 19,859,328 680,315 3.43% 19,196,589 96.66% 1,093,788 5.51% (189,785) (29,963) 130,999 680,114 45,100 230,740 $0.83
50,000-99,999 443 29,629,155 782,515 2.64% 28,871,081 97.44% 1,603,401 5.41% 196,771 488,544 478,959 1,386,141 65,300 930,307 $0.54
100,000-199,999 184 24,113,554 987,898 4.10% 23,125,656 95.90% 1,050,442 4.36% 83,283 569,128 228,279 1,087,131 163,308 2,651,301 $0.48
200,000-299,999 60 14,289,762 359,080 2.51% 13,930,682 97.49% 530,725 3.71% (130,680) 388,486 0 619,585 244,408 703,130 $0.48
300,000 Plus 50 27,365,004 2,423,446 8.86% 24,941,558 91.14% 2,666,431 9.74% 472,719 1,612,687 475,968 2,133,651 417,637 9,595,016 $0.37
Industrial Market Totals 3,270 148,698,829 6,244,622 4.20% 142,536,756 95.86% 8,437,834 5.67% 420,103 3,008,218 1,654,669 6,790,655 994,909 14,442,627 $0.56
T R I C O M M E R C I A L | S A C R A M E N T O I N D U S T R I A L S U B M A R K E T S T A T I S T I C S
TRI
CO
MM
ERC
IAL
| IND
USTR
IAL
PAGE
3
Average asking rates represented are triple net.
T H I R D Q U A R T E R 2 0 1 8 | M A R K E T T R E N D S

ABOUT TRI COMMERCIAL
Since 1977, we have consistently proven that we come to the table with real-time knowledge of the opportunities and challenges
our clients face. Our value is providing the expertise to help you seize the opportunities, overcome the challenges and complete your
transaction. Our agents truly value the relationship more than the transaction. We train our agents to be more than industrial brokers, we
train industrial specialists. TRI handles all elements of the industrial market from incubator warehouse, or flex product, to multi-tenant,
big box, distribution and manufacturing. Across this broad spectrum, we’re also equipped to handle all types of transactions, from land
transactions, parcelization and owner/user sales, to leasing, build-to-suits, development and investment sales. We know the process
from beginning to end, in all its variations. For more than 38 years, TRI has had a dominant presence in Northern California, with an
interconnected network of nearly 100 industry specialists, all at your disposal. Quite simply, our mission is to be your broker of choice.
To learn more about TRI Commercial and our real estate services, please visit: www.tricommercial.comBRE Lic. #00532032
SACRAMENTOINDUSTRIAL
The Information in this document was obtained from sources we deem reliable; however, no
warranty or representation, expressed or implied, is made as to the accuracy of the information
contained herein. The market statistics represent properties that are 10,000 square feet or larger.
This quarterly market report is a research document of TRI Commerical and may be found on our
website at www.tricommercial.com. CoStar was the main source of information used in this report.
Building Great Relationships Since 1977
Report Prepared By:Bianca Cruz
TRI CONTACT INFORMATION
San Francisco100 Pine St., Suite 1000San Francisco, CA 94111Tel: (415) 268-2200 | Fax: (415) 268-2289
Oakland1404 Franklin St., PenthouseOakland, CA 94607Tel: (510) 622-8466 | Fax: (510) 336-8296
Walnut Creek1777 Oakland Blvd., Suite 100Walnut Creek, CA 94596Tel: (925) 296-3300 | Fax: (925) 296-3399
Sacramento 1515 River Park Drive, Suite 200Sacramento, CA 95815Tel: (916) 669-4500 | Fax: (916) 669-4598
Roseville 532 Gibson Drive, Suite 200Roseville, CA 95678Tel: (916) 677-8000 | Fax: (916) 677-8199
Rocklin2209 Plaza Drive, Suite 100Rocklin, CA 95765Tel: (916) 960-5700 | Fax: (916) 960-5799
R E A L E S TAT E S E R V I C E S
NORTHERN CALIFORNIA MAP | TRI OFFICE LOCATIONS:
A full service commerical real estate company
MAP IS NOT TO SCALE
SF
Walnut Creek
SacramentoRoseville
Rocklin
Oakland
Main Office