sacramento river hydrologic regionwater.ca.gov/legacyfiles/urbanwatermanagement... · basins and...
TRANSCRIPT
C A L I F O R N I A ’ S G R O U N D W A T E R U P D A T E 2 0 0 3 155
Ch
ap
te
r 7
| So
ut
h C
oa
st
Hy
dr
ol o
gi c
Re
gi o
n
Sacramento River Hydrologic Region
156 D W R - B U L L E T I N 1 1 8
C h a p t e r 7 | S a c r a m e n t o R i v e r H y d r o l o g i c R e g i o n
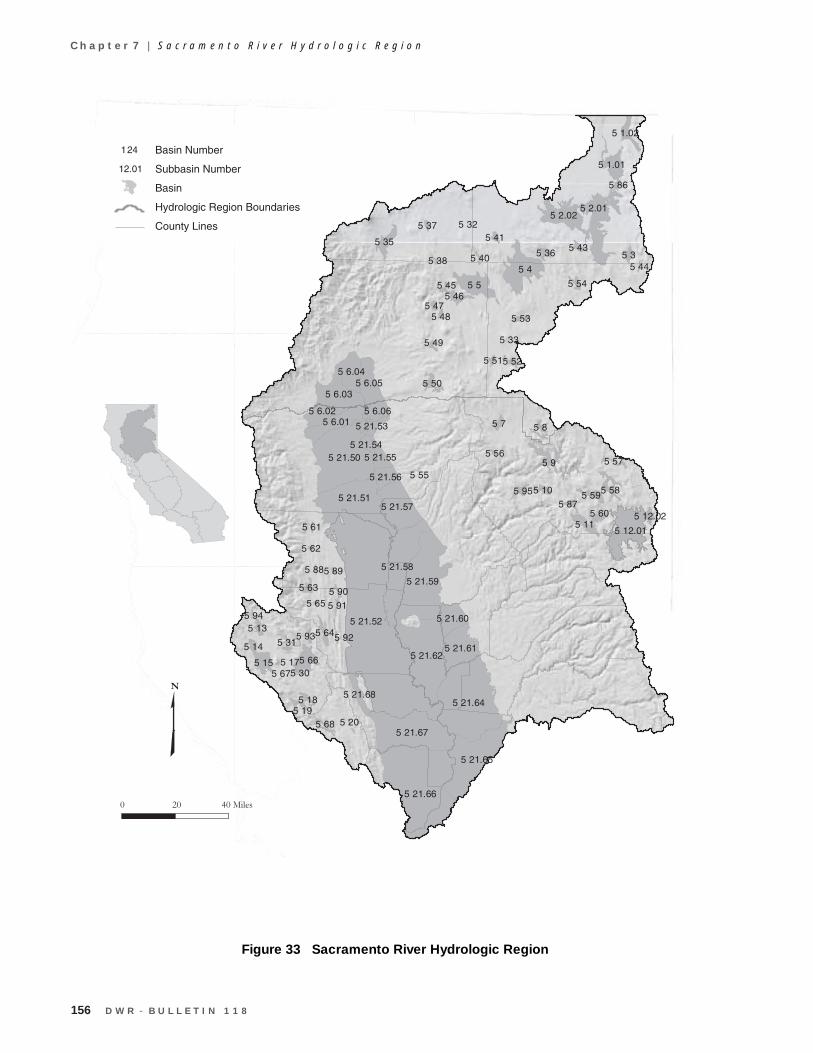
Figure 33 Sacramento River Hydrologic Region
C A L I F O R N I A ’ S G R O U N D W A T E R U P D A T E 2 0 0 3 157
Ch
ap
te
r 7
| Sa
cr
am
en
to
Ri v
er
Hy
dr
ol o
gi c
Re
gi o
n
Basins and Subbasins of the Sacramento River Hydrologic Region
5-30 Lower Lake Valley5-31 Long Valley5-35 Mccloud Area5-36 Round Valley5-37 Toad Well Area5-38 Pondosa Town Area5-40 Hot Springs Valley5-41 Egg Lake Valley5-43 Rock Prairie Valley5-44 Long Valley5-45 Cayton Valley5-46 Lake Britton Area5-47 Goose Valley5-48 Burney Creek Valley5-49 Dry Burney Creek Valley5-50 North Fork Battle Creek5-51 Butte Creek Valley5-52 Gray Valley5-53 Dixie Valley5-54 Ash Valley5-56 Yellow Creek Valley5-57 Last Chance Creek Valley5-58 Clover Valley5-59 Grizzly Valley5-60 Humbug Valley5-61 Chrome Town Area5-62 Elk Creek Area5-63 Stonyford Town Area5-64 Bear Valley5-65 Little Indian Valley5-66 Clear Lake Cache Formation5-68 Pope Valley5-86 Joseph Creek5-87 Middle Fork Feather River5-88 Stony Gorge Reservoir5-89 Squaw Flat5-90 Funks Creek5-91 Antelope Creek5-92 Blanchard Valley5-93 North Fork Cache Creek5-94 Middle Creek
5-95 Meadow Valley
Basin/subbasins Basin nameBasin/subbasins Basin name
5-1 Goose Lake Valley 5-1.01 Lower Goose Lake Valley 5-1.02 Fandango Valley5-2 Alturas Area 5-2.01 South Fork Pitt River 5-2.02 Warm Springs Valley5-3 Jess Valley5-4 Big Valley5-5 Fall River Valley5-6 Redding Area 5-6.01 Bowman 5-6.02 Rosewood 5-6.03 Anderson 5-6.04 Enterprise 5-6.05 Millville 5-6.06 South Battle Creek5-7 Lake Almanor Valley5-8 Mountain Meadows Valley5-9 Indian Valley5-10 American Valley5-11 Mohawk Valley5-12 Sierra Valley 5-12.01 Sierra Valley 5-12.02 Chilcoot5-13 Upper Lake Valley5-14 Scotts Valley5-15 Big Valley5-16 High Valley5-17 Burns Valley5-18 Coyote Valley5-19 Collayomi Valley5-20 Berryessa Valley5-21 Sacramento Valley 5-21.50 Red Bluff 5-21.51 Corning 5-21.52 Colusa 5-21.53 Bend 5-21.54 Antelope 5-21.55 Dye Creek 5-21.56 Los Molinos 5-21.57 Vina 5-21.58 West Butte 5-21.59 East Butte 5-21.60 North Yuba 5-21.61 South Yuba 5-21.62 Sutter
5-21.64 North American 5-21.65 South American 5-21.66 Solano 5-21.67 Yolo 5-21.68 Capay Valley
158 D W R - B U L L E T I N 1 1 8
C h a p t e r 7 | S a c r a m e n t o R i v e r H y d r o l o g i c R e g i o n
Description of the RegionThe Sacramento River HR covers approximately 17.4 million acres (27,200 square miles). The regionincludes all or large portions of Modoc, Siskiyou, Lassen, Shasta, Tehama, Glenn, Plumas, Butte, Colusa,Sutter, Yuba, Sierra, Nevada, Placer, Sacramento, El Dorado, Yolo, Solano, Lake, and Napa counties (Figure33). Small areas of Alpine and Amador counties are also within the region. Geographically, the regionextends south from the Modoc Plateau and Cascade Range at the Oregon border, to the Sacramento-SanJoaquin Delta. The Sacramento Valley, which forms the core of the region, is bounded to the east by thecrest of the Sierra Nevada and southern Cascades and to the west by the crest of the Coast Range andKlamath Mountains. Other significant features include Mount Shasta and Lassen Peak in the southernCascades, Sutter Buttes in the south central portion of the valley, and the Sacramento River, which is thelongest river system in the State of California with major tributaries the Pit, Feather, Yuba, Bear andAmerican rivers. The region corresponds approximately to the northern half of RWQCB 5. The Sacramentometropolitan area and surrounding communities form the major population center of the region. With theexception of Redding, cities and towns to the north, while steadily increasing in size, are more rural thanurban in nature, being based in major agricultural areas. The 1995 population of the entire region was 2.372million.
The climate in the northern, high desert plateau area of the region is characterized by cold snowy winterswith only moderate precipitation and hot dry summers. This area depends on adequate snowpack to providerunoff for summer supply. Annual precipitation ranges from 10 to 20 inches. Other mountainous areas in thenorthern and eastern portions of the region have cold wet winters with large amounts of snow, whichtypically provide abundant runoff for summer supplies. Annual precipitation ranges from 40 to more than 80inches. Summers are generally mild in these areas. The Coast Range and southern Klamath Mountainsreceive copious amounts of precipitation, but most of the runoff flows to the coast in the North Coastaldrainage. Sacramento Valley comprises the remainder of the region. At a much lower elevation than the restof the region, the valley has mild winters with moderate precipitation. Annual precipitation varies fromabout 35 inches in Redding to about 18 inches in Sacramento. Summers in the valley are hot and dry.
Most of the mountainous portions of the region are heavily forested and sparsely populated. Three majornational forests (Mendocino, Trinity, and Shasta) make up the majority of lands in the Coast Range, southernKlamath Mountains, and the southern Cascades; these forests and the region’s rivers and lakes provideabundant recreational opportunities. In the few mountain valleys with arable land, alfalfa, grain and pastureare the predominant crops. In the foothill areas of the region, particularly adjacent to urban centers, suburbanto rural housing development is occurring along major highway corridors. This development is leading tourban sprawl and is replacing the former agricultural production on those lands. In the Sacramento Valley,agriculture is the largest industry. Truck, field, orchard, and rice crops are grown on approximately 2.1million acres. Rice represents about 23 percent of the total irrigated acreage.
The Sacramento River HR is the main water supply for much of California’s urban and agricultural areas.Annual runoff in the HR averages about 22.4 maf, which is nearly one-third of the State’s total naturalrunoff. Major water supplies in the region are provided through surface storage reservoirs. The two largestsurface water projects in the region are USBR’s Shasta Lake (Central Valley Project) on the upperSacramento River and Lake Oroville (DWR’s State Water Project) on the Feather River. In all, there aremore than 40 major surface water reservoirs in the region. Municipal, industrial, and agricultural supplies tothe region are about 8 maf, with groundwater providing about 2.5 maf of that total. Much of the remainderof the runoff goes to dedicated natural flows, which support various environmental requirements, includingin-stream fishery flows and flushing flows in the Delta.
C A L I F O R N I A ’ S G R O U N D W A T E R U P D A T E 2 0 0 3 159
Ch
ap
te
r 7
| Sa
cr
am
en
to
Ri v
er
Hy
dr
ol o
gi c
Re
gi o
n
Groundwater DevelopmentGroundwater provides about 31 percent of the water supply for urban and agricultural uses in the region, andhas been developed in both the alluvial basins and the hard rock uplands and mountains. There are 88 basins/subbasins delineated in the region. These basins underlie 5.053 million acres (7,900 square miles), about 29percent of the entire region. The reliability of the groundwater supply varies greatly. The Sacramento Valleyis recognized as one of the foremost groundwater basins in the State, and wells developed in the sediments ofthe valley provide excellent supply to irrigation, municipal, and domestic uses. Many of the mountainvalleys of the region also provide significant groundwater supplies to multiple uses.
Geologically, the Sacramento Valley is a large trough filled with sediments having variable permeabilities; asa result, wells developed in areas with coarser aquifer materials will produce larger amounts of water thanwells developed in fine aquifer materials. In general, well yields are good and range from one-hundred toseveral thousand gallons per minute. Because surface water supplies have been so abundant in the valley,groundwater development for agriculture primarily supplement the surface supply. With the changingenvironmental laws and requirements, this balance is shifting to a greater reliance on groundwater, andconjunctive use of both supplies is occurring to a greater extent throughout the valley, particularly in droughtyears. Groundwater provides all or a portion of municipal supply in many valley towns and cities. Redding,Anderson, Chico, Marysville, Sacramento, Olivehurst, Wheatland, Willows, and Williams rely to differingdegrees on groundwater. Red Bluff, Corning, Woodland, Davis, and Dixon are completely dependent ongroundwater. Domestic use of groundwater varies, but in general, rural unincorporated areas rely completelyon groundwater.
In the mountain valleys and basins with arable land, groundwater has been developed to supplement surfacewater supplies. Most of the rivers and streams of the area have adjudicated water rights that go back to theearly 1900s, and diversion of surface water has historically supported agriculture. Droughts and increasedcompetition for supply have led to significant development of groundwater for irrigation. In some basins, thefractured volcanic rock underlying the alluvial fill is the major aquifer for the area. In the rural mountainareas of the region, domestic supplies come almost entirely from groundwater. Although a few mountaincommunities are supplied in part by surface water, most rely on groundwater. These groundwater suppliesare generally quite reliable in areas that have sufficient aquifer storage or where surface water replenishessupply throughout the year. In areas that depend on sustained runoff, water levels can be significantlydepleted in drought years and many old, shallow wells can be dewatered. During 2001, an extreme droughtyear on the Modoc Plateau, many well owners experienced problems with water supply.
Groundwater development in the fractured rocks of the foothills of the southern Cascades and Sierra Nevadais fraught with uncertainty. Groundwater supplies from fractured rock sources are highly variable in terms ofwater quantity and water quality and are an uncertain source for large-scale residential development.Originally, foothill development relied on water supply from springs and river diversions with flumes andditches for conveyance that date back to gold mining era operations. Current development is primarily basedon individual private wells, and as pressures for larger scale development increase, questions about thereliability of supply need to be addressed. Many existing foothill communities have considerable experiencewith dry or drought year shortages. In Butte County residents in Cohasset, Forest Ranch, and Magalia havehad to rely on water brought up the ridges in tanker trucks. The suggested answer has been the developmentof regional water supply projects. Unfortunately, the area’s development pattern of small, geographicallydispersed population centers does not lend itself to the kind of financial base necessary to support suchprojects.
160 D W R - B U L L E T I N 1 1 8
C h a p t e r 7 | S a c r a m e n t o R i v e r H y d r o l o g i c R e g i o n
Groundwater QualityGroundwater quality in the Sacramento River HR is generally excellent. However, there are areas with localgroundwater problems. Natural water quality impairments occur at the north end of the Sacramento Valley inthe Redding subbasin, and along the margins of the valley and around the Sutter Buttes, where Cretaceous-age marine sedimentary rocks containing brackish to saline water are near the surface. Water from the olderunderlying sediments mixes with the fresh water in the younger alluvial aquifer and degrades the quality.Wells constructed in these areas typically have high TDS. Other local natural impairments are moderatelevels of hydrogen sulfide in groundwater in the volcanic and geothermal areas in the western portion of theregion. In the Sierra foothills, there is potential for encountering uranium and radon-bearing rock or sulfidemineral deposits containing heavy metals. Human-induced impairments are generally associated withindividual septic system development in shallow unconfined portions of aquifers or in fractured hard rockareas where insufficient soil depths are available to properly leach effluent before it reaches the localgroundwater supply.
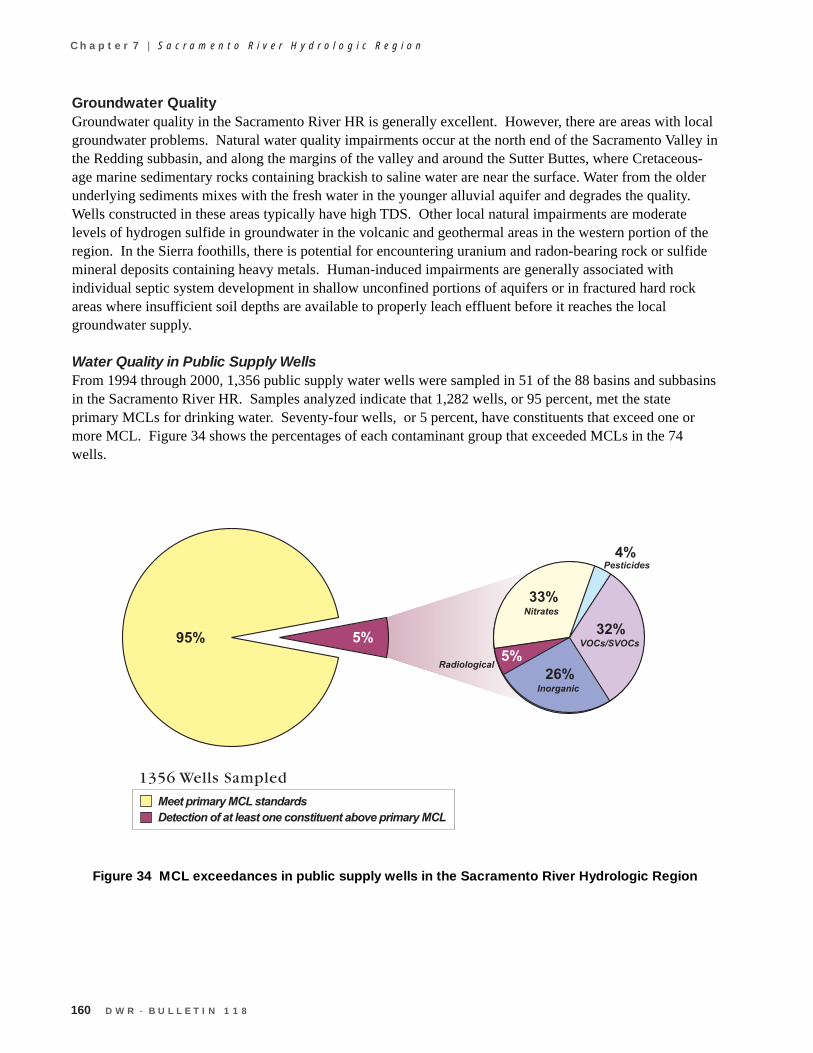
Water Quality in Public Supply WellsFrom 1994 through 2000, 1,356 public supply water wells were sampled in 51 of the 88 basins and subbasinsin the Sacramento River HR. Samples analyzed indicate that 1,282 wells, or 95 percent, met the stateprimary MCLs for drinking water. Seventy-four wells, or 5 percent, have constituents that exceed one ormore MCL. Figure 34 shows the percentages of each contaminant group that exceeded MCLs in the 74wells.
Figure 34 MCL exceedances in public supply wells in the Sacramento River Hydrologic Region
C A L I F O R N I A ’ S G R O U N D W A T E R U P D A T E 2 0 0 3 161
Ch
ap
te
r 7
| Sa
cr
am
en
to
Ri v
er
Hy
dr
ol o
gi c
Re
gi o
n
Table 25 lists the three most frequently occurring contaminants in each of the six contaminant groups andshows the number of wells in the HR that exceeded the MCL for those contaminants.
Table 25 Most frequently occurring contaminants by contaminant group in theSacramento River Hydrologic Region
Contaminant group Contaminant - # of wells Contaminant - # of wells Contaminant - # of wellsInorganics – Primary Cadmium – 4 Chromium (Total) – 3 3 tied at 2
Inorganics – Secondary Manganese – 221 Iron – 166 Specific Conductance – 3
Radiological Gross Alpha – 4
Nitrates Nitrate (as NO3) – 22 Nitrate + Nitrite – 5 Nitrate Nitrogen (NO
3-N) – 2
Pesticides Di(2-Ethylhexyl)phthalate – 4
VOCs/SVOCs PCE – 11 TCE – 7 Benzene – 4
PCE = TetrachloroethyleneTCE = TrichloroethyleneVOC = Volatile Organic CompoundsSVOC = Semivolatile Organic Compound
Changes from Bulletin 118-80
Some modifications from the groundwater basins presented in Bulletin 118-80 are incorporated in this report.These are listed in Table 26.
Table 26 Modifications since Bulletin 118-80 of groundwater basins and subbasinsin Sacramento River Hydrologic Region
Basin name New number Old numberFandango Valley 5-1.02 5-39
Bucher Swamp Valley deleted 5-42
Modoc Plateau Recent deleted 5-32Volcanic Areas
Modoc Plateau Pleistocene deleted 5-33Volcanic Areas
Mount Shasta Area deleted 5-34
Sacramento Valley Eastside deleted 5-55Tuscan Formation Highlands
Clear Lake Pleistocene deleted 5-67Volcanics
162 D W R - B U L L E T I N 1 1 8
C h a p t e r 7 | S a c r a m e n t o R i v e r H y d r o l o g i c R e g i o n
No additional basins were assigned to the Sacramento River HR in this revision. However, four basins havebeen divided into subbasins. Goose Lake Valley Groundwater Basin (5-1) has been subdivided into twosubbasins, Fandango Valley (5-39) was modified to be a subbasin of Goose Lake Valley. Redding AreaGroundwater Basin has been subdivided into six subbasins, Sierra Valley Groundwater Basin has beensubdivided into two subbasins, and the Sacramento Valley Groundwater Basin has been subdivided into 18subbasins.
There are several deletions of groundwater basins from Bulletin 118-80. Bucher Swamp Valley Basin (5-42)was deleted due to a thin veneer of alluvium over rock. Modoc Plateau Recent Volcanic Areas (5-32),Modoc Plateau Pleistocene Volcanic Areas (5-33), Mount Shasta Area (5-34), Sacramento Valley EastsideTuscan Formation Highlands (5-55), and Clear Lake Pleistocene Volcanics (5-67) are volcanic aquifers andwere not assigned basin numbers in this bulletin. These are considered to be groundwater source areas asdiscussed in Chapter 6.
C A L I F O R N I A ’ S G R O U N D W A T E R U P D A T E 2 0 0 3 163
Ch
ap
te
r 7
| Sa
cr
am
en
to
Ri v
er
Hy
dr
ol o
gi c
Re
gi o
n
Wel
l Yie
lds
(gpm
)Ty
pes
of M
onito
ring
TD
S (m
g/L
)
Gro
undw
ater
Bas
in/S
ubba
sin
Bas
in N
ame
Are
a (a
cres
)B
udge
t Typ
eM
axim
um A
vera
geL
evel
s Q
ualit
yT
itle
22A
vera
geR
ange
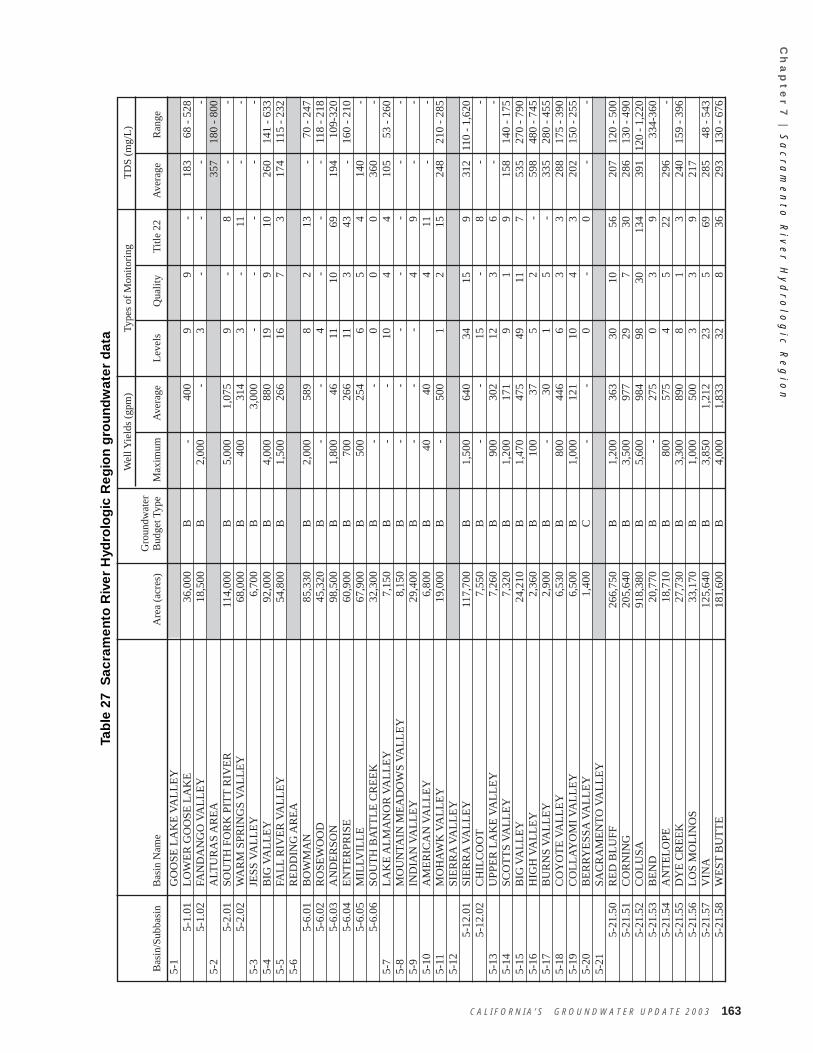
Tab
le 2
7 S
acra
men
to R
iver
Hyd
rolo
gic
Reg
ion
gro
un
dw
ater
dat
a
5-1
GO
OSE
LA
KE
VA
LL
EY
5-1.
01L
OW
ER
GO
OSE
LA
KE
36,
000
B -
400
99
-18
368
- 5
285-
1.02
FAN
DA
NG
O V
AL
LE
Y 1
8,50
0B
2,0
00 -
3 -
- -
-5-
2A
LTU
RA
S A
RE
A35
718
0 -
800
5-2.
01SO
UT
H F
OR
K P
ITT
RIV
ER
114
,000
B 5
,000
1,0
759
-8
- -
5-2.
02W
AR
M S
PRIN
GS
VA
LL
EY
68,
000
B 4
00 3
143
-11
- -
5-3
JESS
VA
LL
EY
6,7
00B
3,0
00 -
- -
- -
5-4
BIG
VA
LL
EY
92,
000
B 4
,000
880
199
1026
014
1 -
633
5-5
FAL
L R
IVE
R V
AL
LE
Y 5
4,80
0B
1,5
00 2
6616
73
174
115
- 23
25-
6R
ED
DIN
G A
RE
A5-
6.01
BO
WM
AN
85,
330
B 2
,000
589
82
13 -
70 -
247
5-6.
02R
OSE
WO
OD
45,
320
B -
-4
- -
-11
8 -
218
5-6.
03A
ND
ER
SON
98,
500
B 1
,800
46
1110
6919
410
9-32
05-
6.04
EN
TE
RPR
ISE
60,
900
B 7
00 2
6611
343
-16
0 -
210
5-6.
05M
ILLV
ILL
E 6
7,90
0B
500
254
65
414
0 -
5-6.
06SO
UT
H B
AT
TL
E C
RE
EK
32,
300
B -
-0
00
360
-5-
7L
AK
E A
LM
AN
OR
VA
LL
EY
7,1
50B
- -
104
410
553
- 2
605-
8M
OU
NTA
IN M
EA
DO
WS
VA
LL
EY
8,1
50B
- -
- -
- -
-5-
9IN
DIA
N V
AL
LE
Y 2
9,40
0B
- -
-4
9 -
-5-
10A
ME
RIC
AN
VA
LL
EY
6,8
00B
40
40
411
- -
5-11
MO
HA
WK
VA
LL
EY
19,
000
B -
500
12
1524
821
0 -
285
5-12
SIE
RR
A V
AL
LE
Y5-
12.0
1SI
ER
RA
VA
LL
EY
117
,700
B 1
,500
640
3415
931
211
0 - 1
,620
5-12
.02
CH
ILC
OO
T 7
,550
B -
-15
-8
- -
5-13
UPP
ER
LA
KE
VA
LL
EY
7,2
60B
900
302
123
6 -
-5-
14SC
OT
TS
VA
LL
EY
7,3
20B
1,2
00 1
719
19
158
140
- 17
55-
15B
IG V
AL
LE
Y 2
4,21
0B
1,4
70 4
7549
117
535
270
- 79
05-
16H
IGH
VA
LL
EY
2,3
60B
100
37
52
-59
848
0 -
745
5-17
BU
RN
S V
AL
LE
Y 2
,900
B -
30
15
-33
528
0 -
455
5-18
CO
YO
TE
VA
LL
EY
6,5
30B
800
446
63
328
817
5 -
390
5-19
CO
LL
AY
OM
I V
AL
LE
Y 6
,500
B 1
,000
121
104
320
215
0 -
255
5-20
BE
RR
YE
SSA
VA
LL
EY
1,4
00C
- -
0 -
0 -
-5-
21SA
CR
AM
EN
TO
VA
LL
EY
5-21
.50
RE
D B
LU
FF 2
66,7
50B
1,2
00 3
6330
1056
207
120
- 50
05-
21.5
1C
OR
NIN
G 2
05,6
40B
3,5
00 9
7729
730
286
130
- 49
05-
21.5
2C
OL
USA
918
,380
B 5
,600
984
9830
134
391
120
- 1,2
205-
21.5
3B
EN
D 2
0,77
0B
- 2
750
39
334-
360
5-21
.54
AN
TE
LO
PE 1
8,71
0B
800
575
45
2229
6 -
5-21
.55
DY
E C
RE
EK
27,
730
B 3
,300
890
81
324
015
9 -
396
5-21
.56
LO
S M
OL
INO
S 3
3,17
0B
1,0
00 5
003
39
217
5-21
.57
VIN
A 1
25,6
40B
3,8
50 1
,212
235
6928
548
- 5
435-
21.5
8W
EST
BU
TT
E 1
81,6
00B
4,0
00 1
,833
328
3629
313
0 -
676
164 D W R - B U L L E T I N 1 1 8
C h a p t e r 7 | S a c r a m e n t o R i v e r H y d r o l o g i c R e g i o n
Wel
l Yie
lds
(gpm
)Ty
pes
of M
onito
ring
TD
S (m
g/L
)
Gro
undw
ater
Bas
in/S
ubba
sin
Bas
in N
ame
Are
a (a
cres
)B
udge
t Typ
eM
axim
um A
vera
geL
evel
s Q
ualit
yT
itle
22A
vera
geR
ange
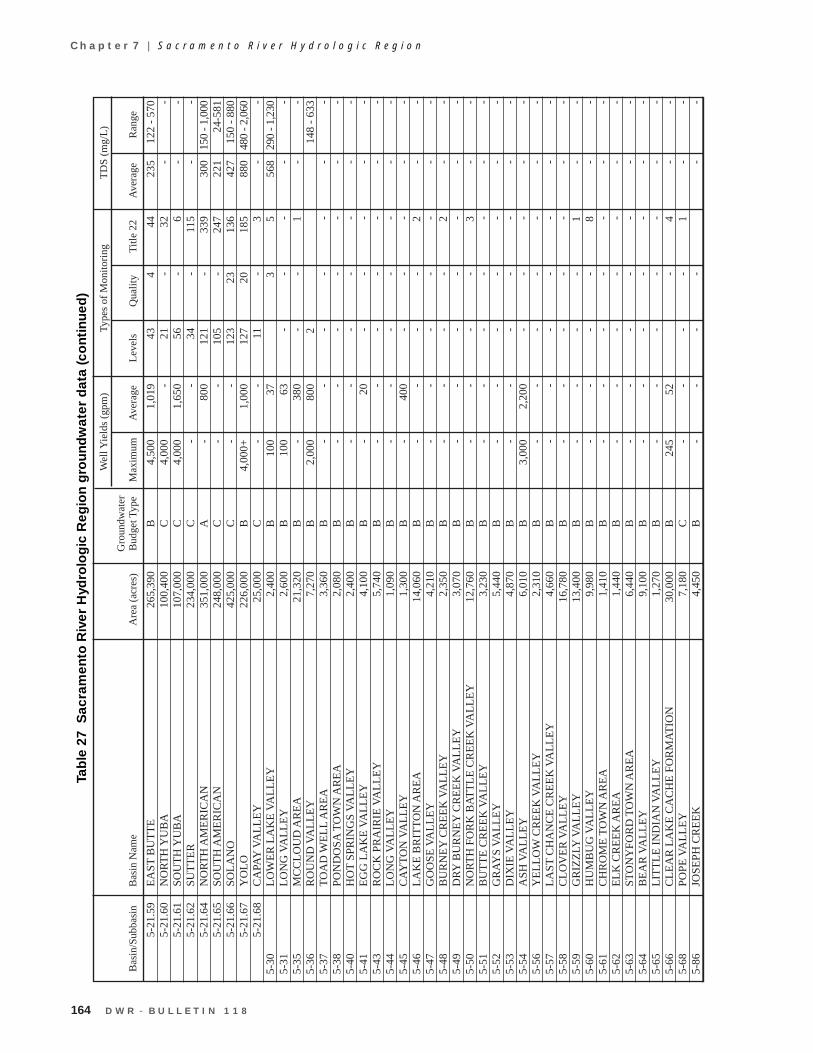
Tab
le 2
7 S
acra
men
to R
iver
Hyd
rolo
gic
Reg
ion
gro
un
dw
ater
dat
a (c
on
tin
ued
)
5-21
.59
EA
ST B
UT
TE
265
,390
B 4
,500
1,0
1943
444
235
122
- 57
05-
21.6
0N
OR
TH
YU
BA
100
,400
C 4
,000
-21
-32
- -
5-21
.61
SOU
TH
YU
BA
107
,000
C 4
,000
1,6
5056
-6
- -
5-21
.62
SUT
TE
R 2
34,0
00C
- -
34 -
115
- -
5-21
.64
NO
RT
H A
ME
RIC
AN
351
,000
A -
800
121
-33
930
015
0 - 1
,000
5-21
.65
SOU
TH
AM
ER
ICA
N 2
48,0
00C
- -
105
-24
722
124
-581
5-21
.66
SOL
AN
O 4
25,0
00C
- -
123
2313
642
715
0 -
880
5-21
.67
YO
LO
226
,000
B 4
,000
+ 1
,000
127
2018
588
048
0 - 2
,060
5-21
.68
CA
PAY
VA
LL
EY
25,
000
C -
-11
-3
- -
5-30
LO
WE
R L
AK
E V
AL
LE
Y 2
,400
B 1
00 3
73
556
829
0 - 1
,230
5-31
LO
NG
VA
LL
EY
2,6
00B
100
63
- -
- -
-5-
35M
CC
LO
UD
AR
EA
21,
320
B -
380
- -
1 -
-5-
36R
OU
ND
VA
LL
EY
7,2
70B
2,0
00 8
002
148
- 63
35-
37T
OA
D W
EL
L A
RE
A 3
,360
B -
- -
- -
- -
5-38
PON
DO
SA T
OW
N A
RE
A 2
,080
B -
- -
- -
- -
5-40
HO
T S
PRIN
GS
VA
LL
EY
2,4
00B
- -
- -
- -
-5-
41E
GG
LA
KE
VA
LL
EY
4,1
00B
- 2
0 -
- -
- -
5-43
RO
CK
PR
AIR
IE V
AL
LE
Y 5
,740
B -
- -
- -
- -
5-44
LO
NG
VA
LL
EY
1,0
90B
- -
- -
- -
-5-
45C
AY
TO
N V
AL
LE
Y 1
,300
B -
400
- -
- -
-5-
46L
AK
E B
RIT
TO
N A
RE
A 1
4,06
0B
- -
- -
2 -
-5-
47G
OO
SE V
AL
LE
Y 4
,210
B -
- -
- -
- -
5-48
BU
RN
EY
CR
EE
K V
AL
LE
Y 2
,350
B -
- -
-2
- -
5-49
DR
Y B
UR
NE
Y C
RE
EK
VA
LL
EY
3,0
70B
- -
- -
- -
-5-
50N
OR
TH
FO
RK
BA
TT
LE
CR
EE
K V
AL
LE
Y 1
2,76
0B
- -
- -
3 -
-5-
51B
UT
TE
CR
EE
K V
AL
LE
Y 3
,230
B -
- -
- -
- -
5-52
GR
AY
S V
AL
LE
Y 5
,440
B -
- -
- -
- -
5-53
DIX
IE V
AL
LE
Y 4
,870
B -
- -
- -
- -
5-54
ASH
VA
LL
EY
6,0
10B
3,0
00 2
,200
- -
- -
-5-
56Y
EL
LO
W C
RE
EK
VA
LL
EY
2,3
10B
- -
- -
- -
-5-
57L
AST
CH
AN
CE
CR
EE
K V
AL
LE
Y 4
,660
B -
- -
- -
- -
5-58
CL
OV
ER
VA
LL
EY
16,
780
B -
- -
- -
- -
5-59
GR
IZZ
LY V
AL
LE
Y 1
3,40
0B
- -
- -
1 -
-5-
60H
UM
BU
G V
AL
LE
Y 9
,980
B -
- -
-8
- -
5-61
CH
RO
ME
TO
WN
AR
EA
1,4
10B
- -
- -
- -
-5-
62E
LK
CR
EE
K A
RE
A 1
,440
B -
- -
- -
- -
5-63
STO
NY
FOR
D T
OW
N A
RE
A 6
,440
B -
- -
- -
- -
5-64
BE
AR
VA
LL
EY
9,1
00B
- -
- -
- -
-5-
65L
ITT
LE
IN
DIA
N V
AL
LE
Y 1
,270
B -
- -
- -
- -
5-66
CL
EA
R L
AK
E C
AC
HE
FO
RM
AT
ION
30,
000
B 2
45 5
2 -
4 -
-5-
68PO
PE V
AL
LE
Y 7
,180
C -
- -
-1
- -
5-86
JOSE
PH C
RE
EK
4,4
50B
- -
- -
- -
C A L I F O R N I A ’ S G R O U N D W A T E R U P D A T E 2 0 0 3 165
Ch
ap
te
r 7
| Sa
cr
am
en
to
Ri v
er
Hy
dr
ol o
gi c
Re
gi o
n
Wel
l Yie
lds
(gpm
)Ty
pes
of M
onito
ring
TD
S (m
g/L
)
Gro
undw
ater
Bas
in/S
ubba
sin
Bas
in N
ame
Are
a (a
cres
)B
udge
t Typ
eM
axim
um A
vera
geL
evel
s Q
ualit
yT
itle
22A
vera
geR
ange
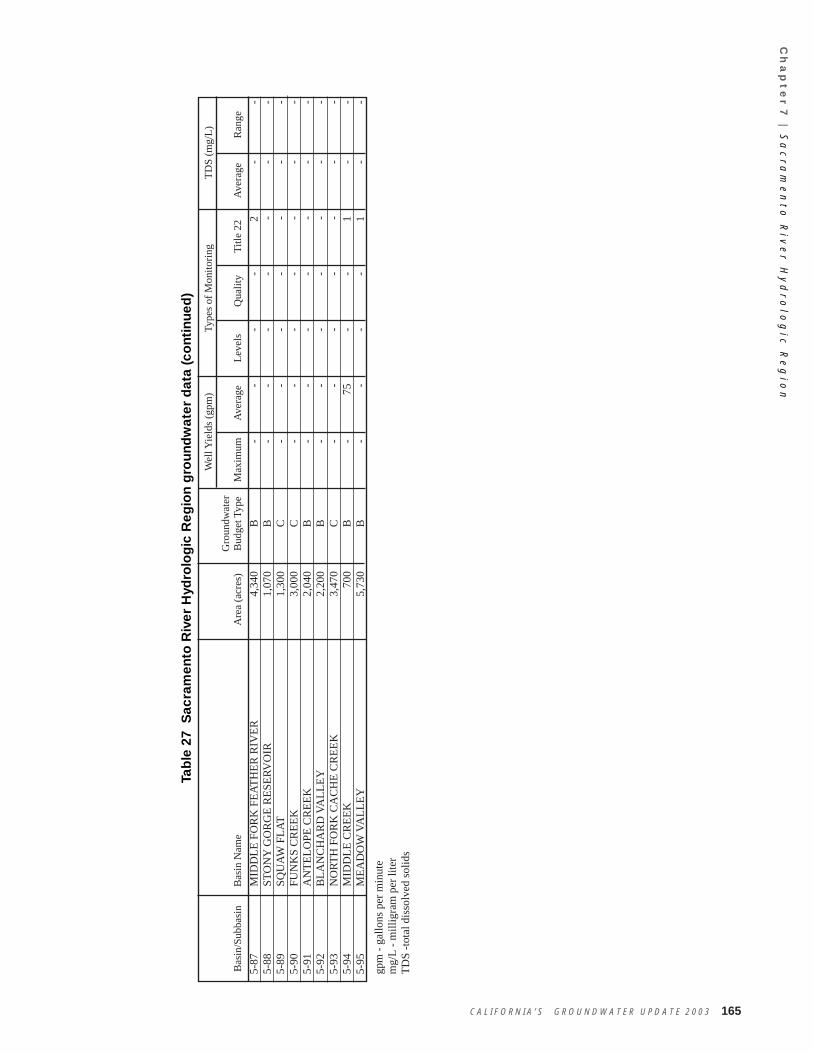
Tab
le 2
7 S
acra
men
to R
iver
Hyd
rolo
gic
Reg
ion
gro
un
dw
ater
dat
a (c
on
tin
ued
)
5-87
MID
DL
E F
OR
K F
EA
TH
ER
RIV
ER
4,3
40B
- -
- -
2 -
-5-
88ST
ON
Y G
OR
GE
RE
SER
VO
IR 1
,070
B -
- -
- -
- -
5-89
SQU
AW
FL
AT
1,3
00C
- -
- -
- -
-5-
90FU
NK
S C
RE
EK
3,0
00C
- -
- -
- -
-5-
91A
NT
EL
OPE
CR
EE
K 2
,040
B -
- -
- -
- -
5-92
BL
AN
CH
AR
D V
AL
LE
Y 2
,200
B -
- -
- -
- -
5-93
NO
RT
H F
OR
K C
AC
HE
CR
EE
K 3
,470
C -
- -
- -
- -
5-94
MID
DL
E C
RE
EK
700
B -
75
- -
1 -
-5-
95M
EA
DO
W V
AL
LE
Y 5
,730
B -
- -
-1
- -
gpm
- g
allo
ns p
er m
inut
em
g/L
- m
illig
ram
per
lite
rT
DS
-tot
al d
isso
lved
sol
ids
Sacramento River Hydrologic Region California’s Groundwater Sacramento Valley Groundwater Basin Bulletin 118
Last update 2/27/04
Sacramento Valley Groundwater Basin, East Butte Subbasin
• Groundwater Basin Number: 5-21.59 • County: Butte, Sutter • Surface Area: 265,390 acres (415 square miles) Basin Boundaries and Hydrology The East Butte Subbasin is the portion of the Sacramento Valley Groundwater Basin bounded on the west and northwest by Butte Creek, on the northeast by the Cascade Ranges, on the southeast by the Feather River and the south by the Sutter Buttes. The northeast boundary along the Cascade Ranges is primarily a geographic boundary with some groundwater recharge occurring beyond that boundary. The subbasin is contiguous with the West Butte Subbasin at depth. Annual precipitation is approximately 18 inches in the valley increasing to 27 inches towards the eastern foothills. Hydrogeologic Information Water-Bearing Formations The East Butte aquifer system is comprised of deposits of late Tertiary to Quaternary age. The Quaternary deposits include Holocene stream channel deposits and basin deposits, Pleistocene deposits of the Modesto and Riverbank formations, and Sutter Buttes alluvium. The Tertiary deposits include the Tuscan and Laguna formations. Holocene Stream Channel Deposits. These deposits consist of unconsolidated gravel, sand, silt and clay derived from the erosion, reworking, and deposition of adjacent Quaternary stream terrace alluvial deposits. The thickness varies from 1- to 80-feet (Helley and Harwood 1985). These deposits represent the upper part of the unconfined zone of the aquifer and are moderately-to-highly permeable; however, the thickness and areal extent of the deposits limit the water-bearing capability. Holocene Basin Deposits. These deposits are the result of sediment-laden floodwaters that rose above the natural levees of streams and rivers to spread across low-lying areas. They consist primarily of silts and clays and may be locally interbedded with stream channel deposits. These deposits result from deposition from erosion from portions of the Cascade Ranges to the Sutter Buttes. Thickness of the deposits range to 150 feet (DWR 2000). These deposits have low permeability and generally yield low quantities of water to wells. The quality of groundwater produced from the basin deposits is often poor (USBR 1960). Pleistocene Modesto Formation. The Modesto Formation in this subbasin consists of poorly indurated gravel and cobbles with sand, silt, and clay derived from reworking and deposition of the Tuscan Formation, Laguna Formation, and the Riverbank Formation. Surface exposure of the formation is west of the Feather River extending from south of the Thermalito Afterbay to the southern subbasin boundary. The formation may extend across the entire subbasin, underlying basin deposits, with thicknesses ranging from 50- to 150-feet (DWR 2000).
Sacramento River Hydrologic Region California’s Groundwater Sacramento Valley Groundwater Basin Bulletin 118
Last update 2/27/04
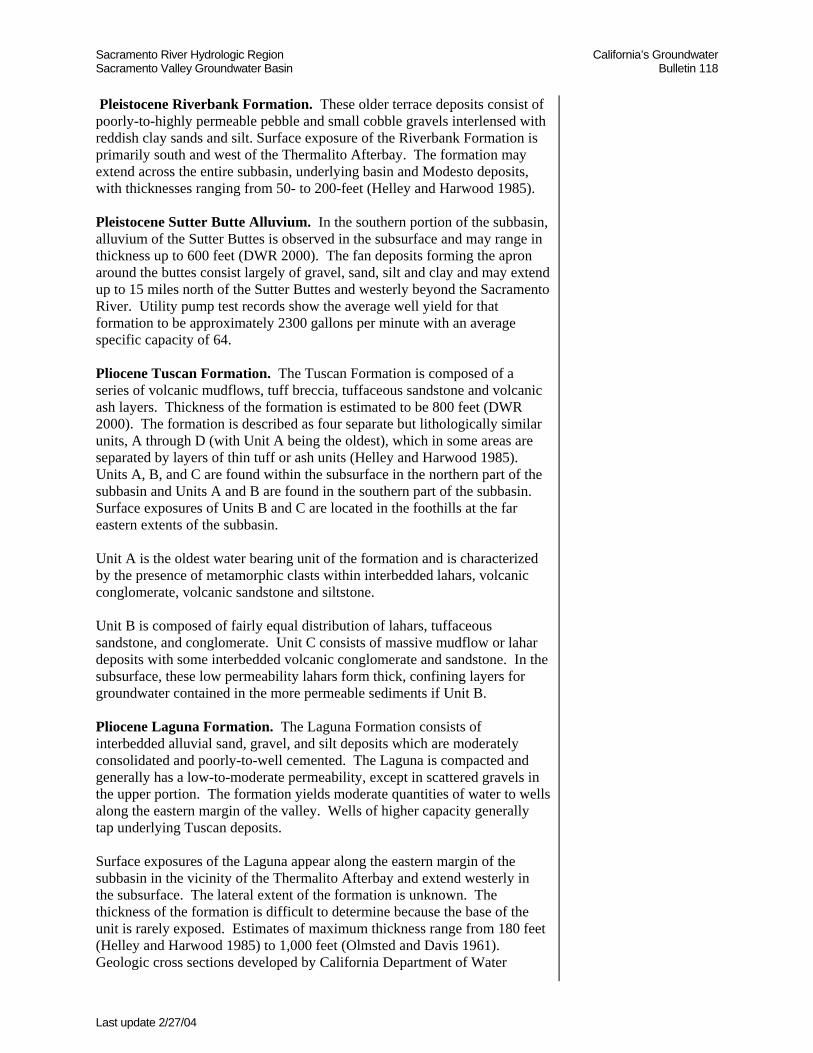
Pleistocene Riverbank Formation. These older terrace deposits consist of poorly-to-highly permeable pebble and small cobble gravels interlensed with reddish clay sands and silt. Surface exposure of the Riverbank Formation is primarily south and west of the Thermalito Afterbay. The formation may extend across the entire subbasin, underlying basin and Modesto deposits, with thicknesses ranging from 50- to 200-feet (Helley and Harwood 1985). Pleistocene Sutter Butte Alluvium. In the southern portion of the subbasin, alluvium of the Sutter Buttes is observed in the subsurface and may range in thickness up to 600 feet (DWR 2000). The fan deposits forming the apron around the buttes consist largely of gravel, sand, silt and clay and may extend up to 15 miles north of the Sutter Buttes and westerly beyond the Sacramento River. Utility pump test records show the average well yield for that formation to be approximately 2300 gallons per minute with an average specific capacity of 64. Pliocene Tuscan Formation. The Tuscan Formation is composed of a series of volcanic mudflows, tuff breccia, tuffaceous sandstone and volcanic ash layers. Thickness of the formation is estimated to be 800 feet (DWR 2000). The formation is described as four separate but lithologically similar units, A through D (with Unit A being the oldest), which in some areas are separated by layers of thin tuff or ash units (Helley and Harwood 1985). Units A, B, and C are found within the subsurface in the northern part of the subbasin and Units A and B are found in the southern part of the subbasin. Surface exposures of Units B and C are located in the foothills at the far eastern extents of the subbasin. Unit A is the oldest water bearing unit of the formation and is characterized by the presence of metamorphic clasts within interbedded lahars, volcanic conglomerate, volcanic sandstone and siltstone. Unit B is composed of fairly equal distribution of lahars, tuffaceous sandstone, and conglomerate. Unit C consists of massive mudflow or lahar deposits with some interbedded volcanic conglomerate and sandstone. In the subsurface, these low permeability lahars form thick, confining layers for groundwater contained in the more permeable sediments if Unit B. Pliocene Laguna Formation. The Laguna Formation consists of interbedded alluvial sand, gravel, and silt deposits which are moderately consolidated and poorly-to-well cemented. The Laguna is compacted and generally has a low-to-moderate permeability, except in scattered gravels in the upper portion. The formation yields moderate quantities of water to wells along the eastern margin of the valley. Wells of higher capacity generally tap underlying Tuscan deposits. Surface exposures of the Laguna appear along the eastern margin of the subbasin in the vicinity of the Thermalito Afterbay and extend westerly in the subsurface. The lateral extent of the formation is unknown. The thickness of the formation is difficult to determine because the base of the unit is rarely exposed. Estimates of maximum thickness range from 180 feet (Helley and Harwood 1985) to 1,000 feet (Olmsted and Davis 1961). Geologic cross sections developed by California Department of Water
Sacramento River Hydrologic Region California’s Groundwater Sacramento Valley Groundwater Basin Bulletin 118
Last update 2/27/04
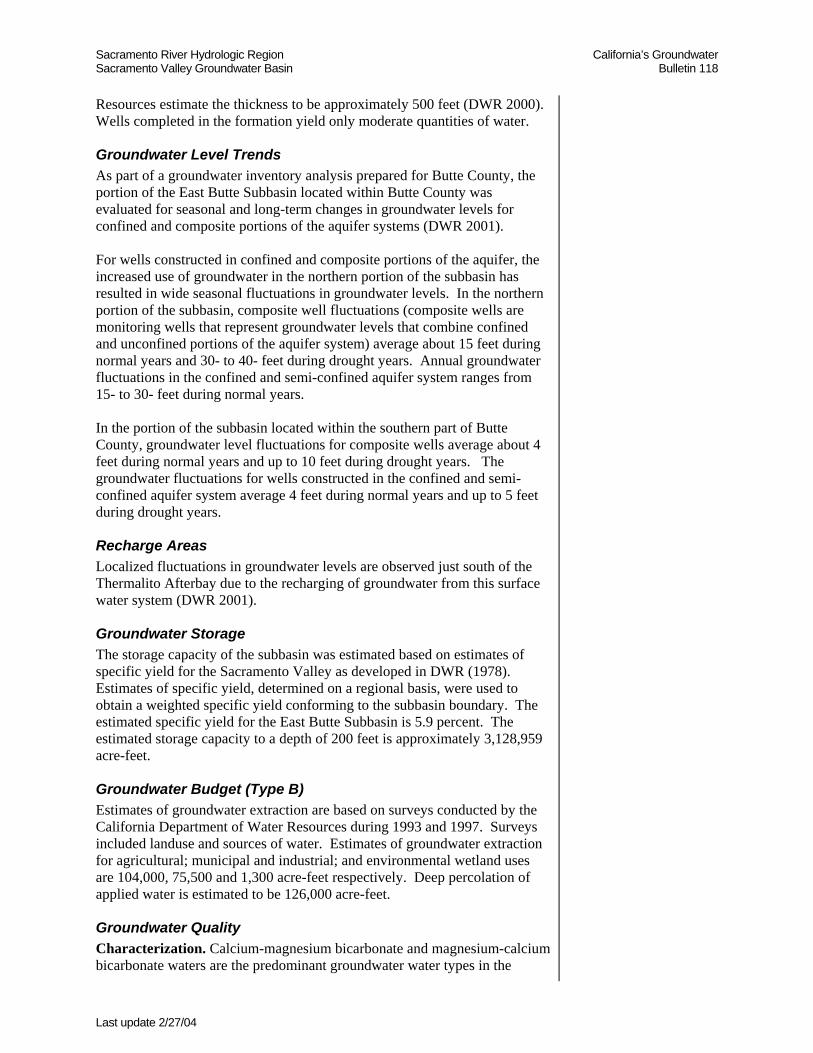
Resources estimate the thickness to be approximately 500 feet (DWR 2000). Wells completed in the formation yield only moderate quantities of water. Groundwater Level Trends As part of a groundwater inventory analysis prepared for Butte County, the portion of the East Butte Subbasin located within Butte County was evaluated for seasonal and long-term changes in groundwater levels for confined and composite portions of the aquifer systems (DWR 2001). For wells constructed in confined and composite portions of the aquifer, the increased use of groundwater in the northern portion of the subbasin has resulted in wide seasonal fluctuations in groundwater levels. In the northern portion of the subbasin, composite well fluctuations (composite wells are monitoring wells that represent groundwater levels that combine confined and unconfined portions of the aquifer system) average about 15 feet during normal years and 30- to 40- feet during drought years. Annual groundwater fluctuations in the confined and semi-confined aquifer system ranges from 15- to 30- feet during normal years. In the portion of the subbasin located within the southern part of Butte County, groundwater level fluctuations for composite wells average about 4 feet during normal years and up to 10 feet during drought years. The groundwater fluctuations for wells constructed in the confined and semi-confined aquifer system average 4 feet during normal years and up to 5 feet during drought years. Recharge Areas Localized fluctuations in groundwater levels are observed just south of the Thermalito Afterbay due to the recharging of groundwater from this surface water system (DWR 2001). Groundwater Storage The storage capacity of the subbasin was estimated based on estimates of specific yield for the Sacramento Valley as developed in DWR (1978). Estimates of specific yield, determined on a regional basis, were used to obtain a weighted specific yield conforming to the subbasin boundary. The estimated specific yield for the East Butte Subbasin is 5.9 percent. The estimated storage capacity to a depth of 200 feet is approximately 3,128,959 acre-feet. Groundwater Budget (Type B) Estimates of groundwater extraction are based on surveys conducted by the California Department of Water Resources during 1993 and 1997. Surveys included landuse and sources of water. Estimates of groundwater extraction for agricultural; municipal and industrial; and environmental wetland uses are 104,000, 75,500 and 1,300 acre-feet respectively. Deep percolation of applied water is estimated to be 126,000 acre-feet. Groundwater Quality Characterization. Calcium-magnesium bicarbonate and magnesium-calcium bicarbonate waters are the predominant groundwater water types in the
Sacramento River Hydrologic Region California’s Groundwater Sacramento Valley Groundwater Basin Bulletin 118
Last update 2/27/04
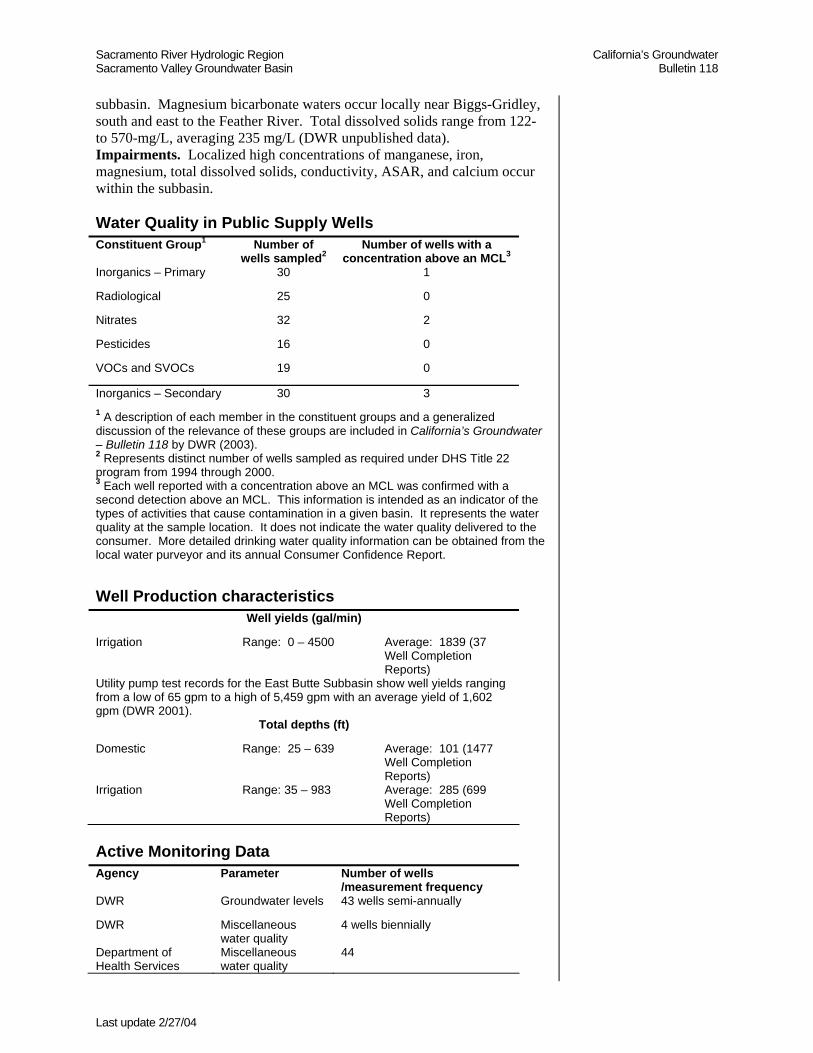
subbasin. Magnesium bicarbonate waters occur locally near Biggs-Gridley, south and east to the Feather River. Total dissolved solids range from 122- to 570-mg/L, averaging 235 mg/L (DWR unpublished data). Impairments. Localized high concentrations of manganese, iron, magnesium, total dissolved solids, conductivity, ASAR, and calcium occur within the subbasin. Water Quality in Public Supply Wells Constituent Group1 Number of
wells sampled2 Number of wells with a
concentration above an MCL3 Inorganics – Primary 30 1
Radiological 25 0
Nitrates 32 2
Pesticides 16 0
VOCs and SVOCs 19 0
Inorganics – Secondary 30 3 1 A description of each member in the constituent groups and a generalized discussion of the relevance of these groups are included in California’s Groundwater – Bulletin 118 by DWR (2003). 2 Represents distinct number of wells sampled as required under DHS Title 22 program from 1994 through 2000. 3 Each well reported with a concentration above an MCL was confirmed with a second detection above an MCL. This information is intended as an indicator of the types of activities that cause contamination in a given basin. It represents the water quality at the sample location. It does not indicate the water quality delivered to the consumer. More detailed drinking water quality information can be obtained from the local water purveyor and its annual Consumer Confidence Report.
Well Production characteristics Well yields (gal/min)
Irrigation Range: 0 – 4500 Average: 1839 (37 Well Completion Reports)
Utility pump test records for the East Butte Subbasin show well yields ranging from a low of 65 gpm to a high of 5,459 gpm with an average yield of 1,602 gpm (DWR 2001).
Total depths (ft)
Domestic Range: 25 – 639 Average: 101 (1477 Well Completion Reports)
Irrigation Range: 35 – 983 Average: 285 (699 Well Completion Reports)
Active Monitoring Data Agency Parameter Number of wells
/measurement frequency DWR Groundwater levels 43 wells semi-annually
DWR Miscellaneous water quality
4 wells biennially
Department of Health Services
Miscellaneous water quality
44
Sacramento River Hydrologic Region California’s Groundwater Sacramento Valley Groundwater Basin Bulletin 118
Last update 2/27/04
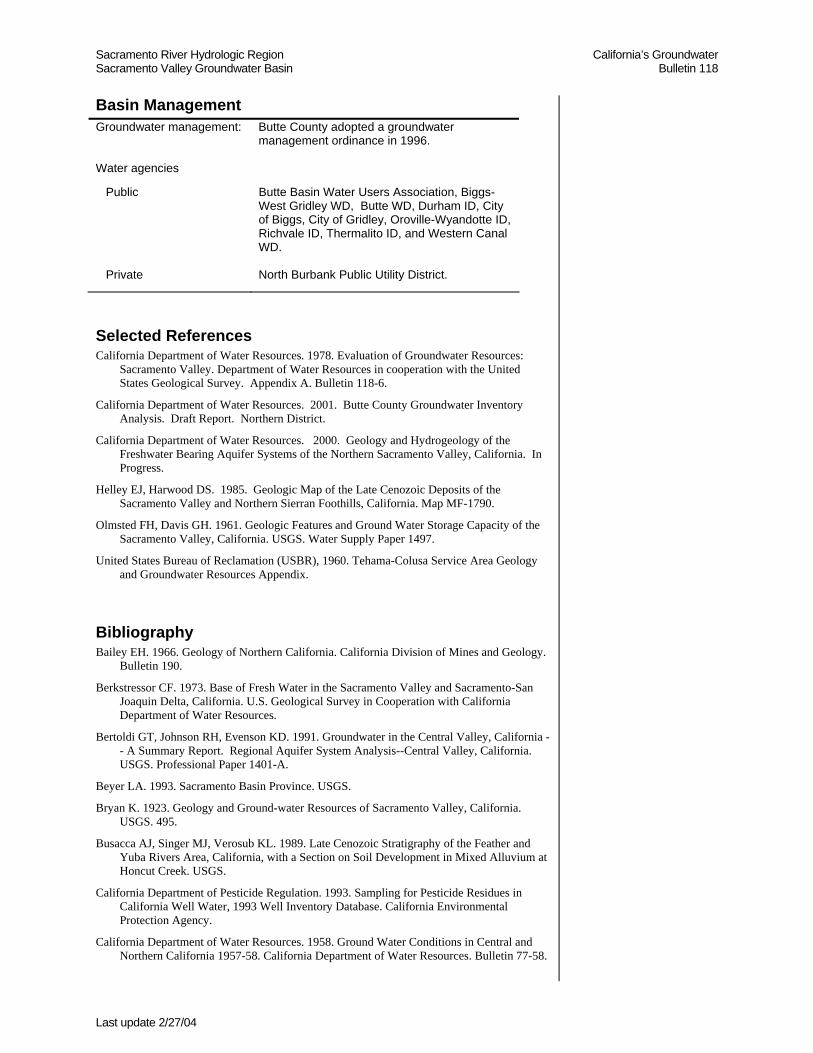
Basin Management Groundwater management: Butte County adopted a groundwater
management ordinance in 1996.
Water agencies
Public Butte Basin Water Users Association, Biggs-West Gridley WD, Butte WD, Durham ID, City of Biggs, City of Gridley, Oroville-Wyandotte ID, Richvale ID, Thermalito ID, and Western Canal WD.
Private North Burbank Public Utility District.
Selected References California Department of Water Resources. 1978. Evaluation of Groundwater Resources:
Sacramento Valley. Department of Water Resources in cooperation with the United States Geological Survey. Appendix A. Bulletin 118-6.
California Department of Water Resources. 2001. Butte County Groundwater Inventory Analysis. Draft Report. Northern District.
California Department of Water Resources. 2000. Geology and Hydrogeology of the Freshwater Bearing Aquifer Systems of the Northern Sacramento Valley, California. In Progress.
Helley EJ, Harwood DS. 1985. Geologic Map of the Late Cenozoic Deposits of the Sacramento Valley and Northern Sierran Foothills, California. Map MF-1790.
Olmsted FH, Davis GH. 1961. Geologic Features and Ground Water Storage Capacity of the Sacramento Valley, California. USGS. Water Supply Paper 1497.
United States Bureau of Reclamation (USBR), 1960. Tehama-Colusa Service Area Geology and Groundwater Resources Appendix.
Bibliography Bailey EH. 1966. Geology of Northern California. California Division of Mines and Geology.
Bulletin 190.
Berkstressor CF. 1973. Base of Fresh Water in the Sacramento Valley and Sacramento-San Joaquin Delta, California. U.S. Geological Survey in Cooperation with California Department of Water Resources.
Bertoldi GT, Johnson RH, Evenson KD. 1991. Groundwater in the Central Valley, California -- A Summary Report. Regional Aquifer System Analysis--Central Valley, California. USGS. Professional Paper 1401-A.
Beyer LA. 1993. Sacramento Basin Province. USGS.
Bryan K. 1923. Geology and Ground-water Resources of Sacramento Valley, California. USGS. 495.
Busacca AJ, Singer MJ, Verosub KL. 1989. Late Cenozoic Stratigraphy of the Feather and Yuba Rivers Area, California, with a Section on Soil Development in Mixed Alluvium at Honcut Creek. USGS.
California Department of Pesticide Regulation. 1993. Sampling for Pesticide Residues in California Well Water, 1993 Well Inventory Database. California Environmental Protection Agency.
California Department of Water Resources. 1958. Ground Water Conditions in Central and Northern California 1957-58. California Department of Water Resources. Bulletin 77-58.
Sacramento River Hydrologic Region California’s Groundwater Sacramento Valley Groundwater Basin Bulletin 118
Last update 2/27/04
California Department of Water Resources. 1960. Northeastern Counties Investigation. California Department of Water Resources. Bulletin 58.
California Department of Water Resources. 1964. Groundwater Conditions in Central and Northern California, 1961-62. California Department of Water Resources.
California Department of Water Resources. 1964. Quality of Ground Water in California 1961-62, Part 1: Northern and Central California. California Department of Water Resources. Bulletin 66-62.
California Department of Water Resources. 1966. Precipitation in the Central Valley. Coordinated Statewide Planning Program. California Department of Water Resources, Sacramento District. Office Report.
California Department of Water Resources. 1975. California's Ground Water. California Department of Water Resources. Bulletin 118.
California Department of Water Resources. 1975. Progress Report Sacramento And Redding Basins Groundwater Study. California Department of Water Resources, Northern and Central Districts, in cooperation with the U.S. Geological Survey. Bulletin 118.
California Department of Water Resources. 1976. Progress Report in Ground Water Development Studies, North Sacramento Valley. California Department of Water Resources, Northern District. Memorandum Report.
California Department of Water Resources. 1980. Ground Water Basins in California. California Department of Water Resources. Bulletin 118-80.
California Department of Water Resources. 1987. Progress Report Sacramento and Redding Basins Ground Water Study. California Department of Water Resources, Northern and Central Districts, in cooperation with the U.S. Geological Survey.
California Department of Water Resources. 1993. Sacramento Valley Basin Groundwater Levels -- Butte County. California Department of Water Resources, Northern District. District Report.
California Department of Water Resources. 1994. Butte and Sutter Basins Water Data Atlas. California Department of Water Resources, Northern District. District Report.
California Department of Water Resources. 1995. Sacramento Valley Groundwater Quality Investigation. California Department of Water Resources, Northern District.
California Department of Water Resources. 1998. California Water Plan Update. California Department of Water Resources. Bulletin 160-98, Volumes 1 and 2.
California Deptartment of Public Works. 1950. Views and Recommendations of State of California on Proposed Report of Chief of Engineers, U.S. Army, on Butte Creek and Cherokee Canal, California. Sacramento: California. Deptartment of Public Works.
California Division of Water Resources. 1940. Butte Creek Adjudication. Butte Creek and Tributaries Above Western Dam, Butte County, California. Sacramento.
California Division of Water Resources. 1942. Butte Creek Adjudication. Sacramento: 74 p.
California Reclamation Board. 1986. Butte Basin Overflow Area Plan of Flood Control: Draft; Project Proposal and Environmental Impact Report. Sacramento: Department of Water Resources Reclamation Board.
Cherven VB, Edmondson WF. 1992. Structural Geology of the Sacramento Basin: Annual Meeting, Pacific Section AAPG, Sacramento, California, April 27, 1992 - May 2,1992.
Dickinson WR, Ingersoll RV, Grahm SA. 1979. Paleogene Sediment Dispersal and Paleotectonics in Northern California. Geological Society of America: Bulletin 90:1458-1528.
Fogelman RP. 1976. Descriptions and Chemical Analysis for Selected Wells in the Central Sacramento Valley, California. USGS. OF-76-472.
Fogelman RP. 1978. Chemical Quality of Ground Water in the Central Sacramento Valley, California. USGS. Water Resources Investigations 77-133.
Fogelman RP. 1982. Dissolved-solids Concentrations of Groundwater in the Sacramento Valley, California. USGS. HA-645.
Sacramento River Hydrologic Region California’s Groundwater Sacramento Valley Groundwater Basin Bulletin 118
Last update 2/27/04
Fogelman RP. 1983. Ground Water Quality in the Sacramento Valley, California, Water Types and Potential Nitrate and Boron Problem Areas. USGS. HA-651.
Fogelman RP, Rockwell GL. 1977. Descriptions and Chemical Analysis for Selected Wells in the Eastern Sacramento Valley, California. USGS. OF-77-486.
Fogleman RP. 1979. Chemical Quality of Ground Water in the Eastern Sacramento Valley, California. USGS.
Harwood DS, Helley EJ. 1982. Preliminary Structure Contour Map of the Sacramento Valley, California, Showing Major Late Cenozoic Structural Features and Depth to Basement. USGS.
Harwood DS, Helley EJ. 1987. Late Cenozoic Tectonism of the Sacramento Valley. USGS.
Harwood DS, Helley EJ, Doukas MP. 1981. Geologic Map of the Chico Monocline and Northeastern Part of the Sacramento Valley, California. USGS.
Harwood DS, Murchey BL. 1990. Biostratigraphic, Tectonic, and Paleogeographic Ties Between Upper Paleozoic Volcanic and Basinal Rocks in the Northern Sierra Terrane, California. Geological Society of America Special Paper.
Hawkins FF, Anderson L. 1985. Late Quaternary Tectonics of Part of the Northern Sierra Nevada, California. Geological Society of America.
Hill KA, Webber JD. 1999. Butte Creek Spring-run Chinook Salmon, Oncorhynchus Tshawytscha, Juvenile Outmigration and Life History, 1995-1998. Sacramento: State of California Resources Agency Department. of Fish and Game. 46 p.
Hull LC. 1984. Geochemistry of Groundwater in the Sacramento Valley, California. Central Valley of California RASA Project. USGS. Professional Paper 1401-B.
Lydon PA. 1969. Geology and Lahars of the Tuscan Formation, Northern California. The Geological Society of America.
Mankinen EA. 1978. Paleomagnetic Evidence for a Late Cretaceous Deformation of the Great Valley Sequence, Sacramento Valley, California. USGS.
Mitten HT. 1972. Estimated Ground-water Pumpage in the Northern Part of the Sacramento Valley, California,1966-69. USGS.
Mitten HT. 1973. Estimated Ground-water Pumpage in the Northern Part of the Sacramento Valley, California, 1970-71. USGS.
Page RW. 1974. Base and Thickness of the Post-Eocene Continental Deposits in the Sacramento Valley, California. U.S. Geological Survey in cooperation with California Department of Water Resources. Water Resources Investigations 45-73.
Page RW. 1986. Geology of the Fresh Groundwater Basin of the Central Valley, California, with Texture Maps and Sections. Regional Aquifer System Analysis. USGS. Professional Paper 1401-C.
Planert M, Williams JS. 1995. Ground Water Atlas of the United States, Segment 1, California, Nevada. USGS. HA-730-B.
Poland JF, Evenson RE. 1966. Hydrogeology and Land Subsidence, Great Central Valley, California, Geology of Northern California. California Division of Mines and Geology. 239-247 p.
Russell RD. 1931. The Tehama Formation of Northern California [Ph.D]: University of California.
Saucedo GJ, Wagner DL. 1992. Geologic Map of the Chico Quadrangle, California. California Division of Mines and Geology.
United States Army Corps of Engineers Sacramento District. 1957. Little Chico - Butte Creeks General Design. Sacramento, Calif.: United States Army Corps of Engineers Sacramento District.
U.S.Geological Survey. 1981. Water Resources Data for California; Volume 4, Northern Central Valley Basins and the Great Basin from Honey Lake Basin to Oregon State Line. USGS.
Sacramento River Hydrologic Region California’s Groundwater Sacramento Valley Groundwater Basin Bulletin 118
Last update 2/27/04
Williamson AK, Prudic DE, Swain LA. 1985. Groundwater Flow in the Central Valley, California. USGS. OF-85-345.
Williamson AK, Prudic DE, Swain LA. 1989. Groundwater Flow in the Central Valley, California. Regional Aquifer-System Analysis--Central Valley, California. USGS. Professional Paper 1401-D.
Errata Changes made to the basin description will be noted here.