sadc course in statistics analysing numeric variables module b2, session 15
Post on 20-Dec-2015
220 views
TRANSCRIPT

SADC Course in Statistics
Analysing numeric variables
Module B2, Session 15

2To put your footer here go to View > Header and Footer
Learning Objectives
students should be able to •Group numeric variables
•So they can be analysed like categorical variables
•Summarise numeric variables•Without grouping
•Apply the objectives of Session 14•to the analysis of numeric variables
•Outline a simple table or graph• for a numeric variable
•Complete a simple table or graph• given an objective and an outline.

3To put your footer here go to View > Header and Footer
Contents
• Introduction of the ideas
• Practical 1• How to process numeric variables
• Practical 2• Using Rice survey and the Tanzania survey
• Discussion
4To put your footer here go to View > Header and Footer
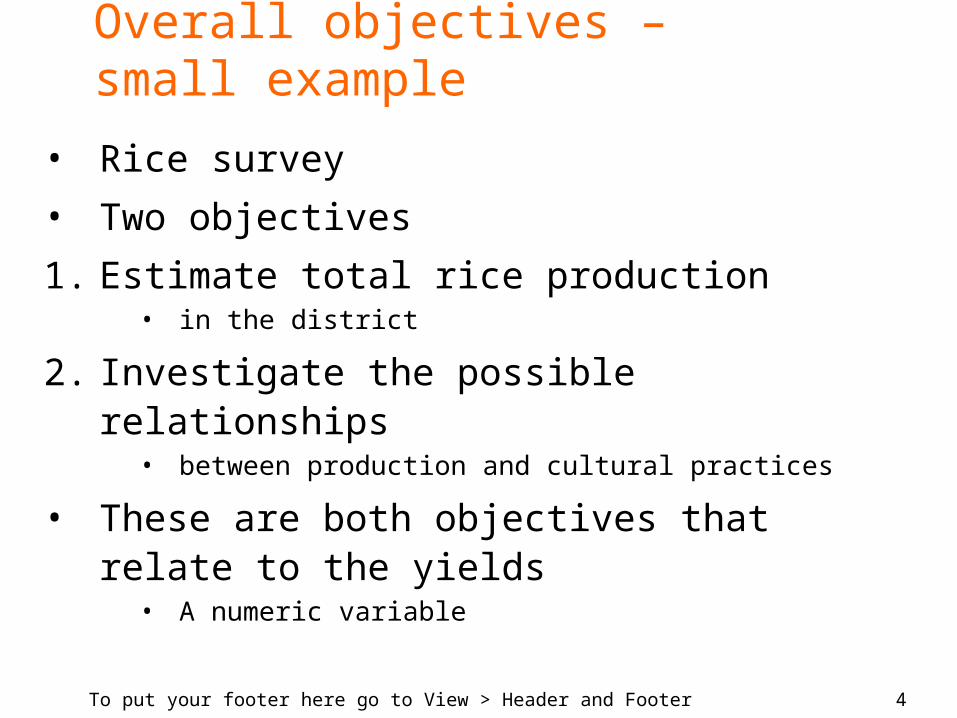
Overall objectives – small example
• Rice survey
• Two objectives
1. Estimate total rice production • in the district
2. Investigate the possible relationships• between production and cultural practices
• These are both objectives that relate to the yields
• A numeric variable
5To put your footer here go to View > Header and Footer
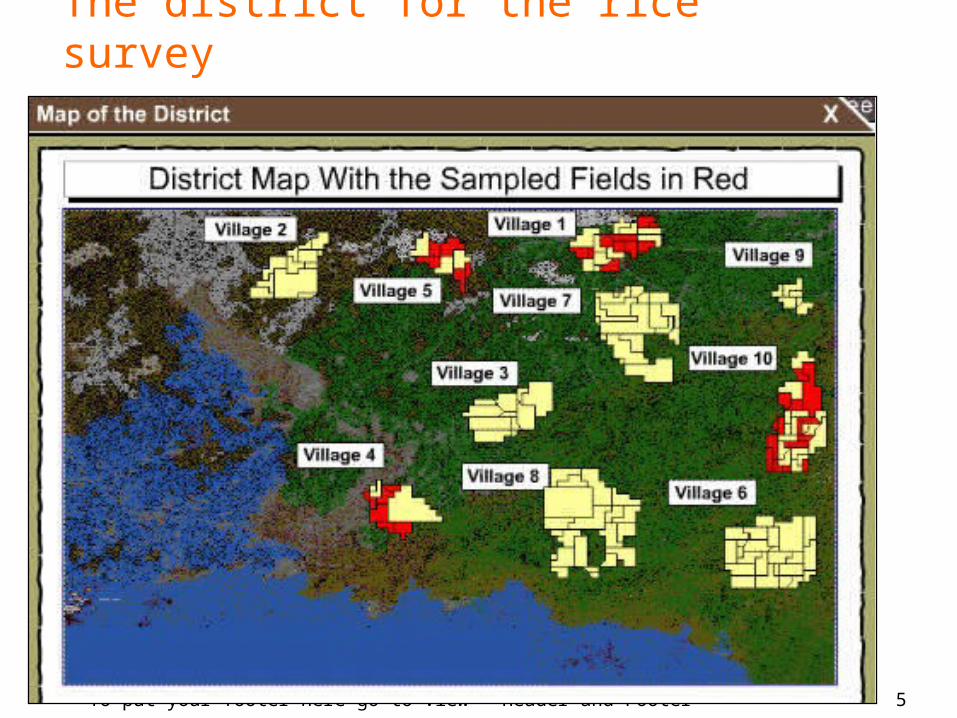
The district for the rice survey
6To put your footer here go to View > Header and Footer
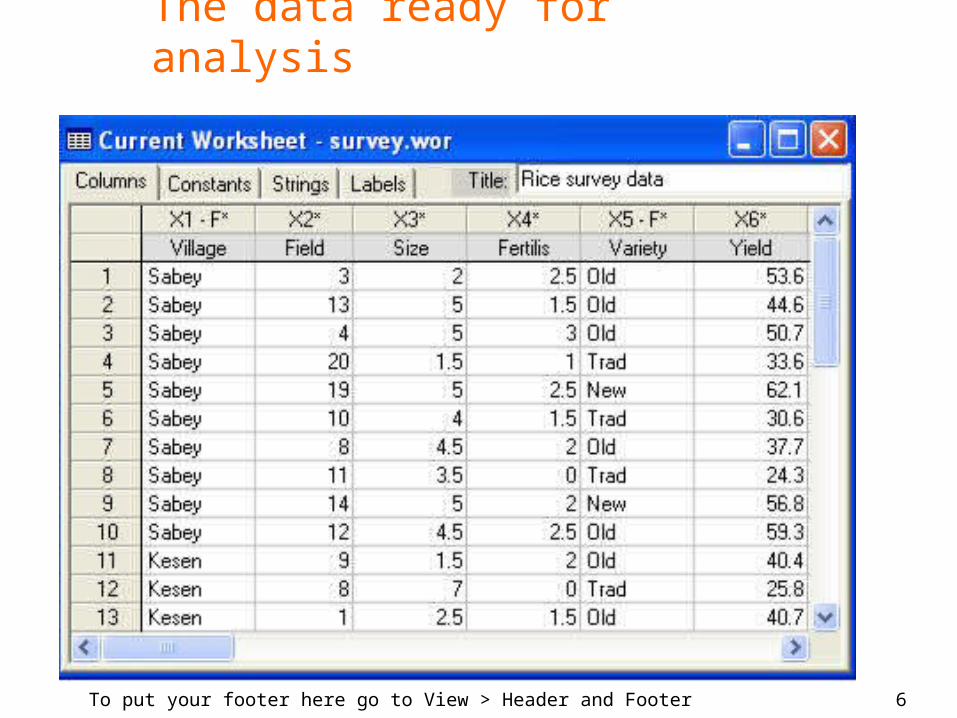
The data ready for analysis
7To put your footer here go to View > Header and Footer
Objectives and measurements
• The objectives led to the questions• the measurements we took
• 1st objective – total yield in the district• So we measured the yield on sampled plots
• 2nd objective – relationships with cultural practice
• so we asked about size of field, fertilizer, variety
• See how the objectives lead directly to the questions in the survey
• The “students” also gave simple objectives• Just from looking at the data

8To put your footer here go to View > Header and Footer

9To put your footer here go to View > Header and Footer
For the categorical variables:
These tables and graphs were to satisfy the objectives

10To put your footer here go to View > Header and Footer
Practical work
• The practical benefits from discussion• So it is good for students to work in pairs
• As in the last session• First the rice survey data are analysed• Then a larger data set is used• This time we start with the rice data• Then move on to the sunshine data• That was organised in Session 10
• Now go and do the practical

11To put your footer here go to View > Header and Footer
Key points
• We review the key points from the practical work
• Using both the rice data
• And the sunshine data

12To put your footer here go to View > Header and Footer
For a numeric variable
• Either they can be grouped• The grouped variable is then categorical • The categories are in order• So it is an ordered categorical variable
• Or they can be analysed as they stand
• Both were investigated in the practical work

13To put your footer here go to View > Header and Footer
Grouping a numeric variable
• The practical illustrates 3 methods
• A simple method • Also gives practice in using logical calculations
• Two alternatives • Make use of IF statements• Which also can be used to add labels to the groups• They are also described in the Excel guide chapter 4• For which there is also a demonstration

14To put your footer here go to View > Header and Footer
Sunshine data - objectives
• The solar cooker can only be used• when there is sufficient sun
• Morning sun is needed• To cook lunch – 3 hours in period from 9am to 1pm
• Afternoon sun is needed• To cook dinner
• One hour of sun either time• Is sufficient to pasteurise water
• The hourly sunshine data were organised• In Session 10 – given these needs

15To put your footer here go to View > Header and Footer
The data – ready for analysis
Total sun (hrs) between 9am and 1pm
From these 12 values. What is the chance of
cooking?
16To put your footer here go to View > Header and Footer
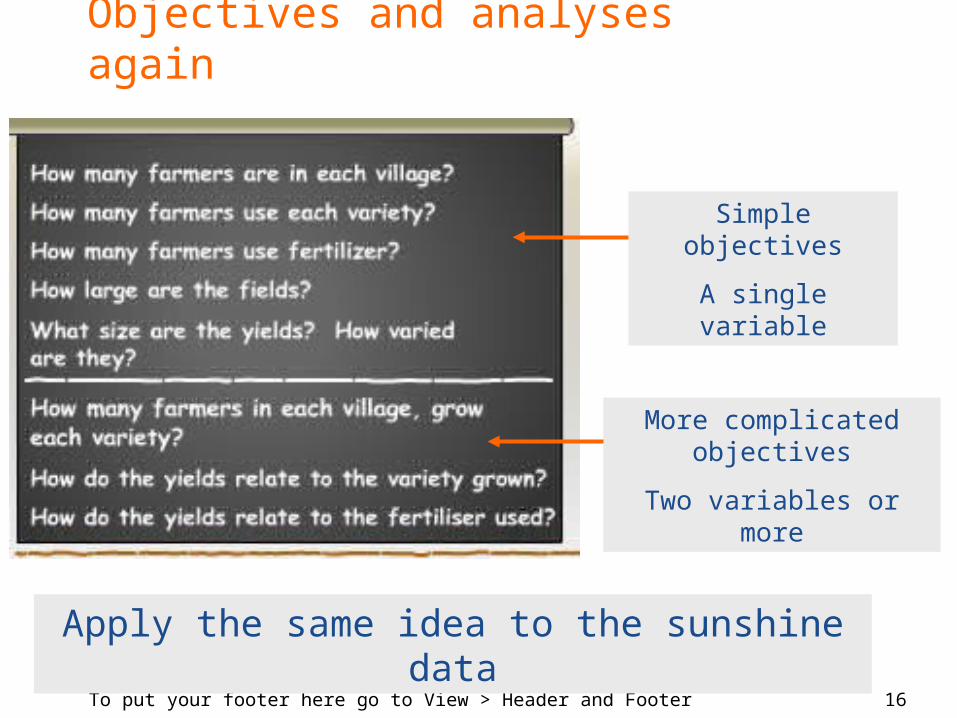
Objectives and analyses again
Simple objectives
A single variable
More complicated objectives
Two variables or more
Apply the same idea to the sunshine data

17To put your footer here go to View > Header and Footer
Sunshine data - objectives• How often is
cooking possible in the morning?
• How often is cooking possible in relation to the early-morning sunshine
• Simple objective– one variable
• More complicated objective– two variables

18To put your footer here go to View > Header and Footer
So:
Are you now able to
• Group numeric variables• So they can be analysed like categorical variables
• Summarise numeric variables• Without grouping
• Apply the objectives of Session 14• to the analysis of numeric variables
• Outline a simple table or graph• for a numeric variable
• Complete a simple table or graph• given an objective and an outline.

19To put your footer here go to View > Header and Footer