safe and accessible: bringing poor savers into the … · safe and accessible: bringing poor savers...
TRANSCRIPT
FocusNoteNO. 37 SEPTEMBER 2006
Building financial systems for the poor
Despite significant evidence to the contrary, many financial institution managers andpolicy makers do not believe poor people save money. They tend to assume that poorpeople are “too poor to save,” that they prefer to consume rather than save excessincome, or that when they do save it is only to access a loan.1
The numbers, however, paint a different picture. Research has repeatedly demon-strated that saving is central to poor people’s economic management strategies.Projects such as the Financial Diaries initiatives in India, Bangladesh, and South Africa;MicroSave in eastern and western Africa; and studies by the International Food PolicyResearch Institute, for example, have documented savings practices among the poor.2
What is unclear is how well formal financial institutions satisfy poor savers’ needs.Although over 90 percent of adults in industrialized economies typically have accounts infinancial institutions, market studies in some areas of the developing world indicate pen-etration rates as low as 6 percent. Access to savings services for the poor thus varies widely.
Understanding this variation and its root causes is the primary goal of CGAP’sCountry-Level Savings Assessments (see Box 1). The assessments explore opportuni-ties and constraints encountered by formal institutions in meeting demand for depositservices among the poor.3 This Focus Note summarizes the findings from Country-Level Savings Assessments in Benin, Bosnia, Mexico, the Philippines, and Uganda,which suggest five strategies for improving poor people’s access to savings services.
Although these five countries were chosen for the assessments, in part, because of theirdiversity, the findings of the assessments are strikingly similar in many ways. All five assess-ments found high demand for savings services but low usage of formal financial institu-tions, which lag behind informal savings mechanisms in fulfilling key client preferences.
Institutional capacity and incentives are the primary factors behind the inability of for-mal financial institutions to compete with informal savings approaches. However, sup-portive industry infrastructure and policy frameworks also play important roles.
SAFE AND ACCESSIBLE:
BRINGING POOR SAVERS INTO THE FORMAL FINANCIAL SYSTEM
The author of this Focus Note
is Rani Deshpande, a mico-
finance specialist at CGAP.
The author thanks Brigit Helms
for her guidance in writing this
note; Rich Rosenberg, Ousa
Sananikone, Jeanette
Thomas, and Elizabeth
Littlefield for their comments;
and Mark Pickens and
Jasmina Glisovic-Mezieres for
their editorial and research
assistance.
© 2006, Consultative Group to
Assist the Poor
The Consultative Group to
Assist the Poor (CGAP) is a
consortium of 33 development
agencies that support microfi-
nance. More information is
available on the CGAP Web
site (www.cgap.org).
1 Interviews conducted as part of CGAP’s five Country-Level Savings Assessments, where review teams met with over
300 individuals knowledgeable about the financial system, indicate that these beliefs are widespread.2 For more information on these findings see Rutherford 2003, Ruthven and Kumar 2002, the Financial Diaries Web site
(www.financialdiaries.com), and Zeller and Sharma 2000.3 Formal institutions are defined as those registered with the government. Generally, these include banks of all kinds;
nonbank financial intermediaries, including microfinance institutions; and cooperatives licensed to take deposits. When
not regulated or supervised, the latter are sometimes referred to as semi-formal.
2
Improving small deposit services, therefore, requireswork at all levels of the financial system.
Low Usage Does Not Mean Low Demand
The prevailing perception that poor people do notsave may stem from the low penetration of formalsavings mechanisms, the most common of whichare accounts in financial institutions. In Mexico,recent studies estimate that less than 25 percent ofthe urban population, and as little as 6 percent ofthe rural population, has any kind of account in afinancial institution (World Bank 2005 and WorldBank 2001). In the Philippines, only 12 percent ofsurvey respondents in small cities kept money in abank (Micro-Enterprise Bank and Karlan, Ashraf,and Wesley 2004). And in Uganda, only 10 per-cent of rural residents report using a financial insti-tution (Wright and Rippey 2003 and Pelrin andKabatalya 2005). Thus, low penetration rates offinancial institutions are evident regardless ofurban or rural distinctions.
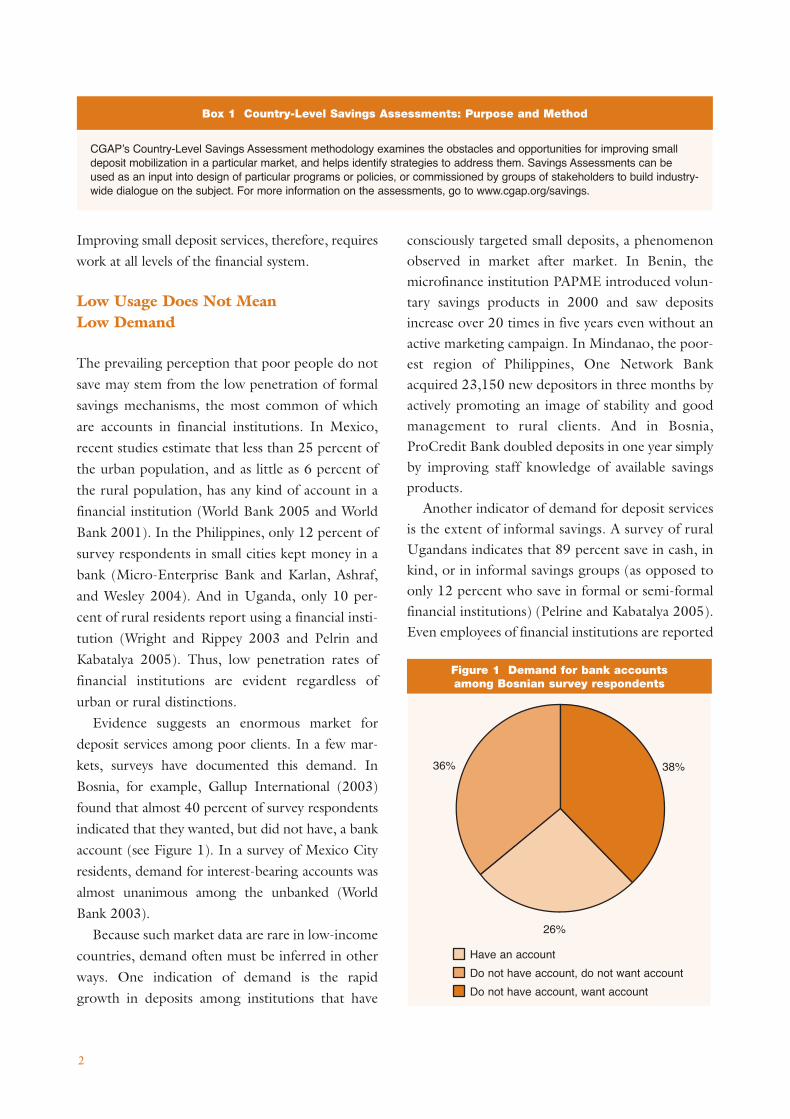
Evidence suggests an enormous market fordeposit services among poor clients. In a few mar-kets, surveys have documented this demand. InBosnia, for example, Gallup International (2003)found that almost 40 percent of survey respondentsindicated that they wanted, but did not have, a bankaccount (see Figure 1). In a survey of Mexico Cityresidents, demand for interest-bearing accounts wasalmost unanimous among the unbanked (WorldBank 2003).
Because such market data are rare in low-incomecountries, demand often must be inferred in otherways. One indication of demand is the rapidgrowth in deposits among institutions that have
consciously targeted small deposits, a phenomenonobserved in market after market. In Benin, themicrofinance institution PAPME introduced volun-tary savings products in 2000 and saw depositsincrease over 20 times in five years even without anactive marketing campaign. In Mindanao, the poor-est region of Philippines, One Network Bankacquired 23,150 new depositors in three months byactively promoting an image of stability and goodmanagement to rural clients. And in Bosnia,ProCredit Bank doubled deposits in one year simplyby improving staff knowledge of available savingsproducts.
Another indicator of demand for deposit servicesis the extent of informal savings. A survey of ruralUgandans indicates that 89 percent save in cash, inkind, or in informal savings groups (as opposed toonly 12 percent who save in formal or semi-formalfinancial institutions) (Pelrine and Kabatalya 2005).Even employees of financial institutions are reported
Figure 1 Demand for bank accounts among Bosnian survey respondents
38%36%
26%
Have an account
Do not have account, do not want account
Do not have account, want account
CGAP’s Country-Level Savings Assessment methodology examines the obstacles and opportunities for improving smalldeposit mobilization in a particular market, and helps identify strategies to address them. Savings Assessments can beused as an input into design of particular programs or policies, or commissioned by groups of stakeholders to build industry-wide dialogue on the subject. For more information on the assessments, go to www.cgap.org/savings.
Box 1 Country-Level Savings Assessments: Purpose and Method
3
to operate their own rotating savings and credit asso-ciations among staff.
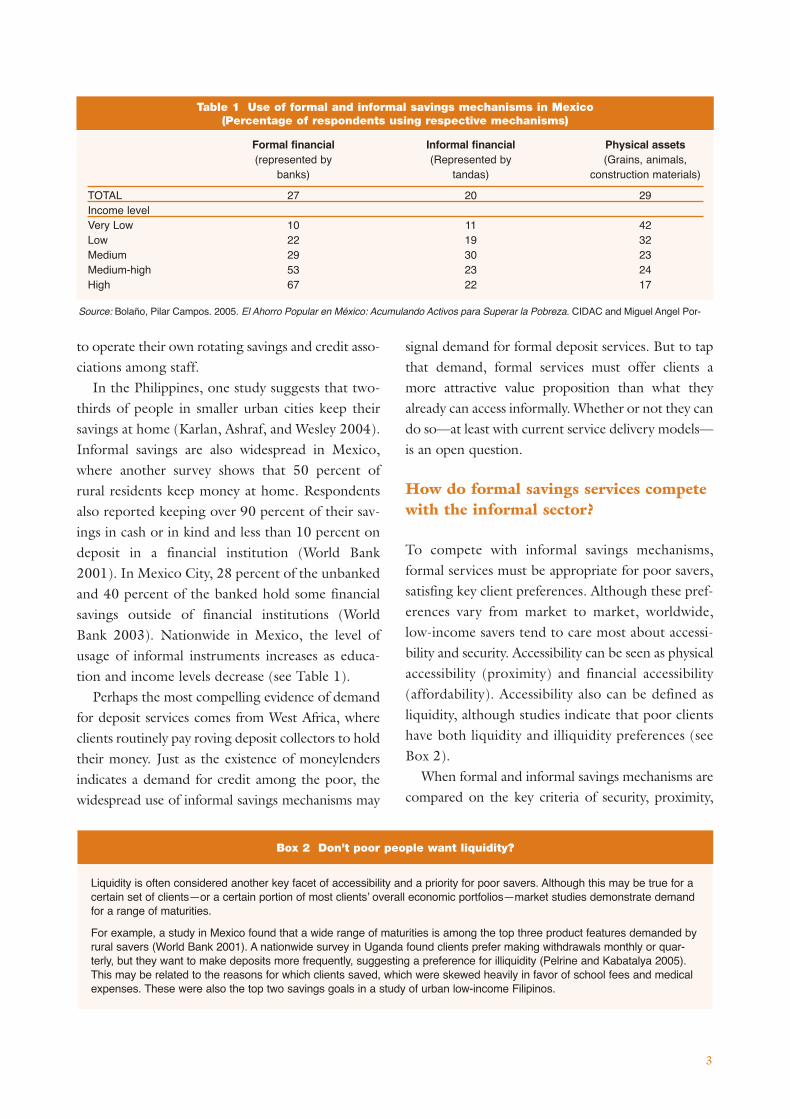
In the Philippines, one study suggests that two-thirds of people in smaller urban cities keep theirsavings at home (Karlan, Ashraf, and Wesley 2004).Informal savings are also widespread in Mexico,where another survey shows that 50 percent ofrural residents keep money at home. Respondentsalso reported keeping over 90 percent of their sav-ings in cash or in kind and less than 10 percent ondeposit in a financial institution (World Bank2001). In Mexico City, 28 percent of the unbankedand 40 percent of the banked hold some financialsavings outside of financial institutions (WorldBank 2003). Nationwide in Mexico, the level ofusage of informal instruments increases as educa-tion and income levels decrease (see Table 1).
Perhaps the most compelling evidence of demandfor deposit services comes from West Africa, whereclients routinely pay roving deposit collectors to holdtheir money. Just as the existence of moneylendersindicates a demand for credit among the poor, thewidespread use of informal savings mechanisms may
signal demand for formal deposit services. But to tapthat demand, formal services must offer clients amore attractive value proposition than what theyalready can access informally. Whether or not they cando so—at least with current service delivery models—is an open question.
How do formal savings services competewith the informal sector?
To compete with informal savings mechanisms,formal services must be appropriate for poor savers,satisfing key client preferences. Although these pref-erences vary from market to market, worldwide,low-income savers tend to care most about accessi-bility and security. Accessibility can be seen as physicalaccessibility (proximity) and financial accessibility(affordability). Accessibility also can be defined asliquidity, although studies indicate that poor clientshave both liquidity and illiquidity preferences (seeBox 2).
When formal and informal savings mechanisms arecompared on the key criteria of security, proximity,
Formal financial Informal financial Physical assets(represented by (Represented by (Grains, animals,
banks) tandas) construction materials)
TOTAL 27 20 29Income levelVery Low 10 11 42Low 22 19 32Medium 29 30 23Medium-high 53 23 24High 67 22 17
Table 1 Use of formal and informal savings mechanisms in Mexico(Percentage of respondents using respective mechanisms)
Source: Bolaño, Pilar Campos. 2005. El Ahorro Popular en México: Acumulando Activos para Superar la Pobreza. CIDAC and Miguel Angel Por-
Liquidity is often considered another key facet of accessibility and a priority for poor savers. Although this may be true for acertain set of clients—or a certain portion of most clients’ overall economic portfolios—market studies demonstrate demandfor a range of maturities.
For example, a study in Mexico found that a wide range of maturities is among the top three product features demanded byrural savers (World Bank 2001). A nationwide survey in Uganda found clients prefer making withdrawals monthly or quar-terly, but they want to make deposits more frequently, suggesting a preference for illiquidity (Pelrine and Kabatalya 2005).This may be related to the reasons for which clients saved, which were skewed heavily in favor of school fees and medicalexpenses. These were also the top two savings goals in a study of urban low-income Filipinos.
Box 2 Don’t poor people want liquidity?
4
and affordability, the reasons behind low usage of
formal services are clear.
Proximity
Informal mechanisms out compete formal financial
institutions when it comes to both dimensions of
accessibility. In terms of proximity, it is hard to beat
saving at home: cash stuffed into a mattress (or a
bamboo post in one’s house, as is done in the
Philippines) is always accessible and carries no extra
costs to the saver in terms of time or travel.
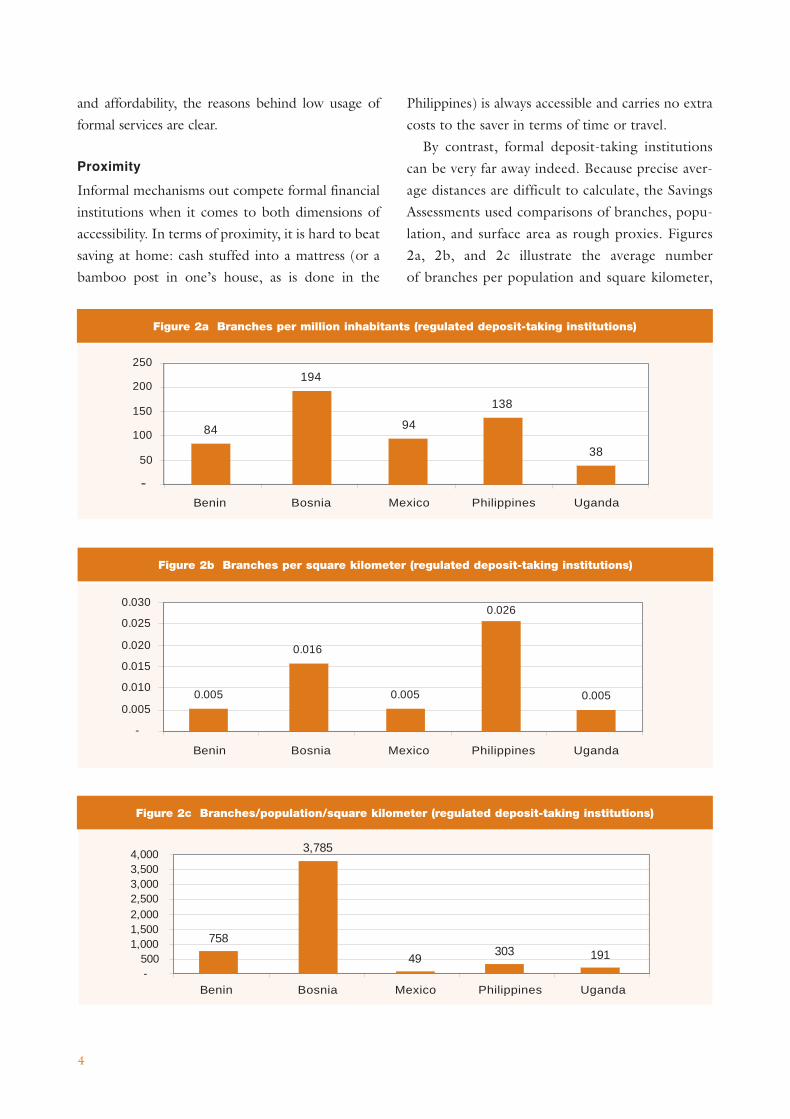
By contrast, formal deposit-taking institutions
can be very far away indeed. Because precise aver-
age distances are difficult to calculate, the Savings
Assessments used comparisons of branches, popu-
lation, and surface area as rough proxies. Figures
2a, 2b, and 2c illustrate the average number
of branches per population and square kilometer,
Benin Bosnia Mexico Philippines Uganda
0.005
0.016
0.005
0.026
0.005
-
0.005
0.010
0.015
0.020
0.025
0.030
Figure 2b Branches per square kilometer (regulated deposit-taking institutions)
Benin Bosnia Mexico Philippines Uganda
758
3,785
49303 191
-500
1,0001,5002,0002,5003,0003,5004,000
Figure 2c Branches/population/square kilometer (regulated deposit-taking institutions)
84
194
94
138
3850
100
150
200
250
Benin Bosnia Mexico Philippines Uganda
-
Figure 2a Branches per million inhabitants (regulated deposit-taking institutions)
5
separately and combined, across the countriesstudied. The tremendous variation in these num-bers shows little correlation to income level, withboth Mexico (annual per capita GNI of almost$7000) and Benin (annual per capita GNI under$300) scoring similarly.
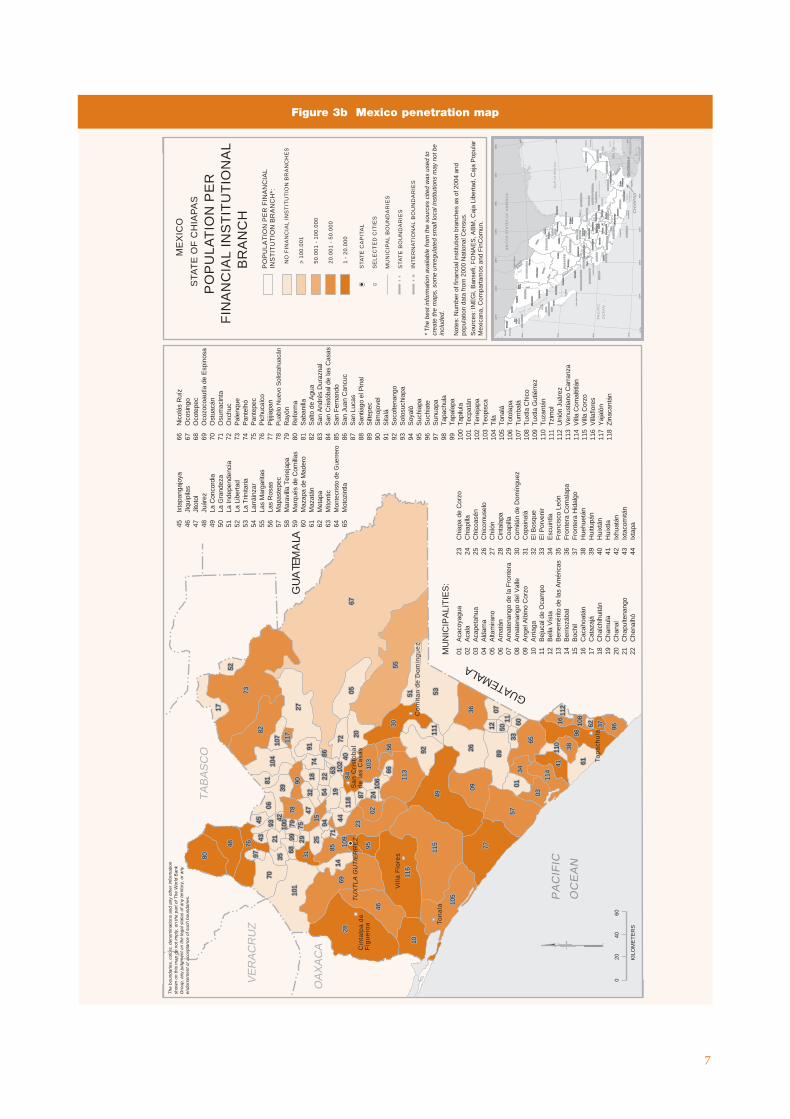
Within countries, however, CGAP found a muchstronger relationship between income level and thedistribution of deposit-taking institutions. In thePhilippines, the correlation between the number ofsubsistence poor and the number of people perbranch of deposit-taking institutions in differentregions was 0.68. In Mexico, the correlationbetween the number of people per branch and thelevel of marginalization in different states was 0.62.4
Figures 3a and 3b illustrate this disparity ingreater detail. (See pages 6 and 7.) In parts ofMexico City, for example, population per branch isless than 3,000. However, in certain districts ofChiapas (Mexico’s poorest state), this ratio exceeds100,000. Several districts have no branches ofdeposit-taking institutions at all. Similar situationswere observed in Benin, Bosnia, the Philippines, andUganda; maps showing the distribution of branchesfor deposit-taking institutions in these countries areavailable in the Country-Level Savings Assessment
section of the Savings Information Resource Center(www.cgap.org/savings).
Affordability
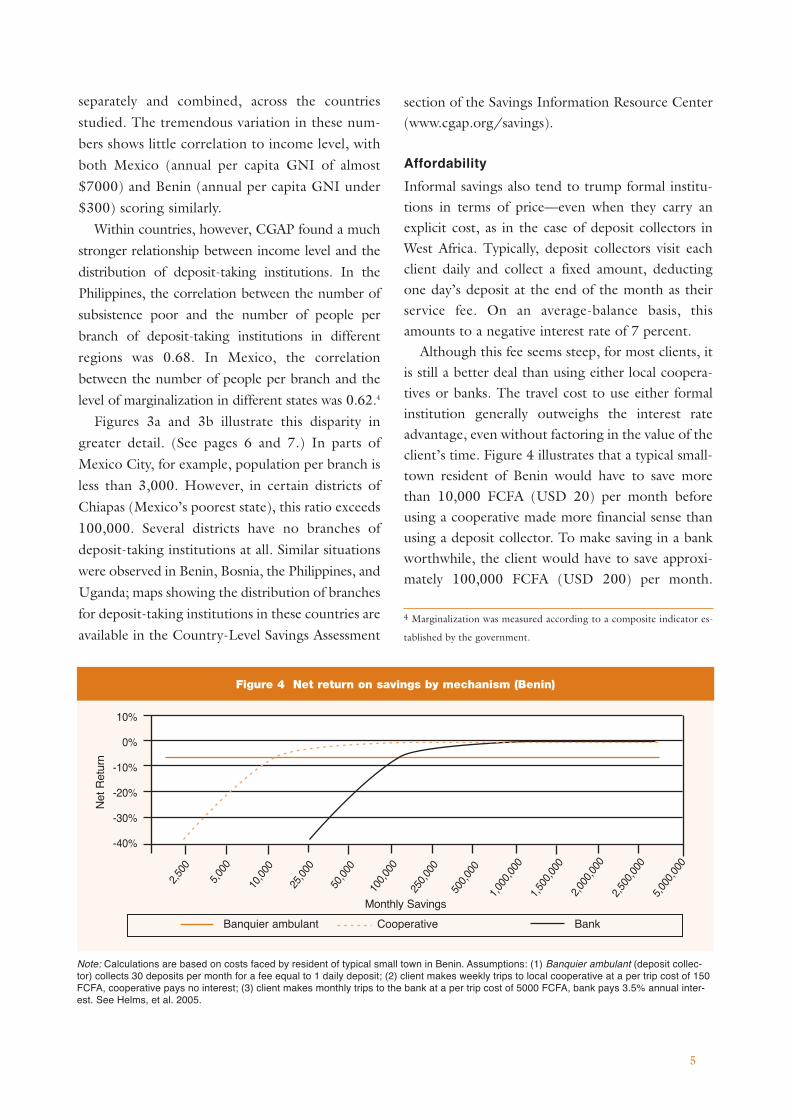
Informal savings also tend to trump formal institu-tions in terms of price—even when they carry anexplicit cost, as in the case of deposit collectors inWest Africa. Typically, deposit collectors visit eachclient daily and collect a fixed amount, deductingone day’s deposit at the end of the month as theirservice fee. On an average-balance basis, thisamounts to a negative interest rate of 7 percent.
Although this fee seems steep, for most clients, itis still a better deal than using either local coopera-tives or banks. The travel cost to use either formalinstitution generally outweighs the interest rateadvantage, even without factoring in the value of theclient’s time. Figure 4 illustrates that a typical small-town resident of Benin would have to save morethan 10,000 FCFA (USD 20) per month beforeusing a cooperative made more financial sense thanusing a deposit collector. To make saving in a bankworthwhile, the client would have to save approxi-mately 100,000 FCFA (USD 200) per month.
4 Marginalization was measured according to a composite indicator es-
tablished by the government.
10%
0%
-10%
-20%
-30%
-40%
2,50
0
5,00
0
10,0
00
25,0
00
50,0
00
100,
000
250,
000
500,
000
1,00
0,00
0
1,50
0,00
0
2,00
0,00
0
2,50
0,00
0
5,00
0,00
0Figure 4 Net return on savings by mechanism (Benin)
Note: Calculations are based on costs faced by resident of typical small town in Benin. Assumptions: (1) Banquier ambulant (deposit collec-tor) collects 30 deposits per month for a fee equal to 1 daily deposit; (2) client makes weekly trips to local cooperative at a per trip cost of 150FCFA, cooperative pays no interest; (3) client makes monthly trips to the bank at a per trip cost of 5000 FCFA, bank pays 3.5% annual inter-est. See Helms, et al. 2005.
Banquier ambulant Cooperative Bank
Net
Ret
urn
Monthly Savings
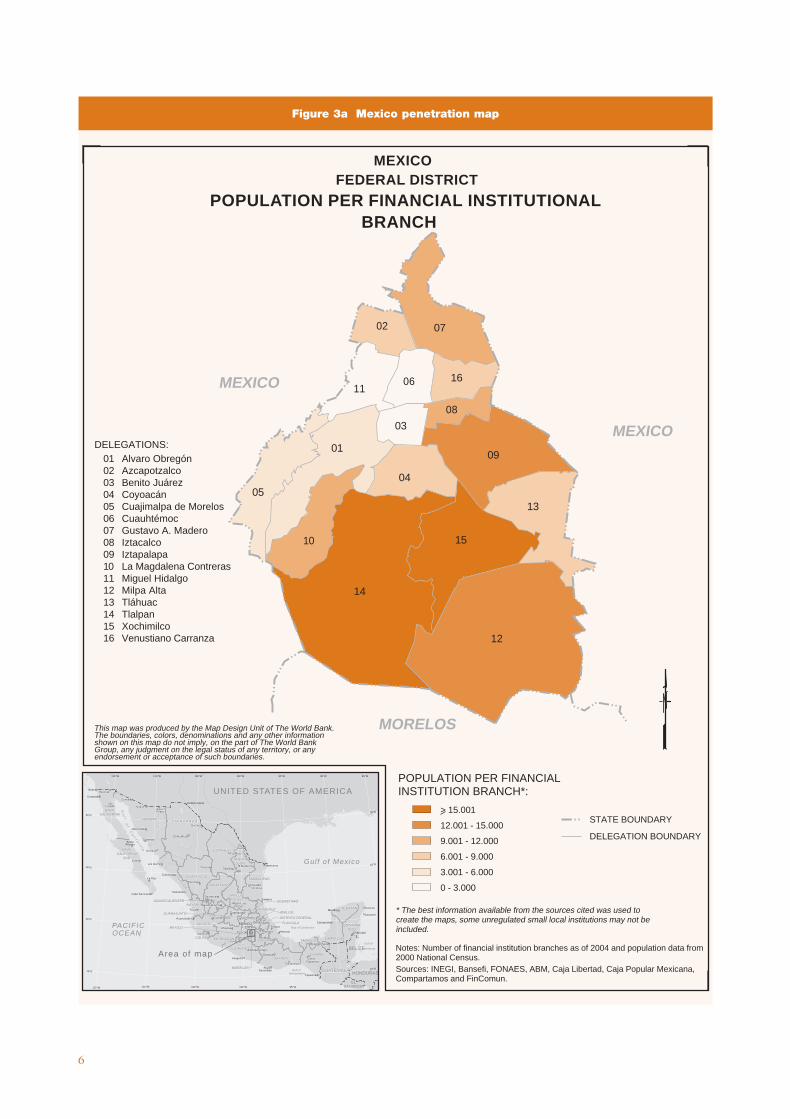
Figure 3a Mexico penetration map
6
11
09
07
03
15
01
04
14
16
05
06
13
02
12
10
08
MEXICO
MEXICO
MORELOS
CAMPECHECAMPECHE
CHIAPASCHIAPAS
TABASCOTABASCO
OAXACAOAXACA
GUERREROGUERRERO
COLIMACOLIMA
JALISCOJALISCO
NAYARITNAYARIT
ZACATECASZACATECAS
TAMAULIPASTAMAULIPAS
NUEVONUEVOLEONLEON
C O A H U I L AC O A H U I L A
C H I H U A H U AC H I H U A H U ASONORASONORA
D U R A N G OD U R A N G O
SAN LUISSAN LUISPOTOSIPOTOSI
MICHOACANMICHOACAN PUEBLAPUEBLA
VERACRUZVERACRUZ YUCATANYUCATAN
QUINTANAQUINTANAROOROO
SIN
AL
OA
SI N
AL
OA
MazatlMazatláánn
TorreTorreóónnMatamorosMatamoros
LaredoLaredo
OjinagaOjinaga
Los MochisLos Mochis
NavojoaNavojoa
NogalesNogalesSanSan
FelipeFelipe
LoretoLoreto
SonoitaSonoita
AguaAguaPrietaPrieta
GuaymasGuaymas
TehuantepecTehuantepec
FronteraFrontera
VillahermosaVillahermosa
TuxtlaTuxtlaGutierrezGutierrez
OaxacaOaxaca
ChilpancingoChilpancingo
ColimaColima
GuadalajaraGuadalajara
TepicTepic
DurangoDurango
SaltSaltííllollo
ChihuahuaChihuahua
CuliacCuliacáánn
HermosilloHermosillo
MexicaliMexicali
GuanajuatoGuanajuato
PachucaPachuca
AguascalientesAguascalientes
QuerQueréétarotaro
MoreliaMorelia
TolucaToluca
CuernavacaCuernavaca PueblaPuebla
TlaxcalaTlaxcala
JalapaJalapa
San LuisSan LuisPotosPotosíí
CiudadCiudadVictVictóóriaria
ZacatecasZacatecas
MonterreyMonterrey
MEXICOMEXICOCITYCITY
YYaaqquu ii
RRiiooBBrraavvoo
FFuueerrttee
SSaallaaddoo
LLeerrmm
aa
BBaall ssaass
UUssuummaacciinnttaa
CCoonncchhooss
BAJABAJACALIFORNIACALIFORNIA
BAJABAJACALIFORNIACALIFORNIA
SURSUR
MEXICOMEXICO
MORELOSMORELOS
DISTRITO FEDERALDISTRITO FEDERAL
HIDALGOHIDALGOGUANAJUATOGUANAJUATO
AGUASCALIENTESAGUASCALIENTES
TLAXCALATLAXCALA
QUERQUERÉÉTAROTARO
RioGrande
GUAGUATEMALATEMALA
CAMPECHE
CHIAPAS
TABASCO
OAXACA
GUERRERO
COLIMA
JALISCO
NAYARIT
ZACATECAS
TAMAULIPAS
NUEVOLEON
C O A H U I L A
C H I H U A H U A
BAJACALIFORNIA
BAJACALIFORNIA
SUR
SONORA
D U R A N G O
SAN LUISPOTOSI
MICHOACAN
MEXICO
MORELOS
DISTRITO FEDERAL
PUEBLA
HIDALGOVERACRUZ
GUANAJUATO
AGUASCALIENTES
TLAXCALA
YUCATAN
QUINTANAROO
SIN
AL
OA
QUERÉTARO
Tapachula
PuertoEscondido
Acapulco
PuertoVallerta
Mazatlán
TorreónMatamoros
Laredo
Ojinaga
Los Mochis
Navojoa
Nogales
Ensanada
Tijuana
SanFelipe
SantaRosalia
Loreto
Cabo San Lucas
Sonoita
AguaPrieta
Ciudad Juárez
Guaymas
Veracruz
Tampico
Tehuantepec
Cozumel
Cancun
Frontera
Chetumal
Merida
Villahermosa
Campeche
TuxtlaGutierrez
Oaxaca
Chilpancingo
Colima
Guadalajara
Tepic
Durango
Saltíllo
Chihuahua
Culiacán
Hermosillo
Mexicali
La Paz
Guanajuato
Pachuca
Aguascalientes
Querétaro
Morelia
Toluca
Cuernavaca Puebla
Tlaxcala
Jalapa
San LuisPotosí
CiudadVictória
Zacatecas
Monterrey
MEXICOCITY
UNITED STATES OF AMERICA
GUATEMALA
BELIZE
HONDURAS
ELSALVADOR
Yaqui
RioGrande
RioBravo
Fuerte
Salado
Lerm
a
Bal sas
Usumacinta
Conchos
PACIFICOCEAN
Gulf of Mexico
Bay of Campeche
Gulf ofTehuantepec
Gulf of
Honduras
Gu
l fo
fC
al i f o
r ni a
115°W
30°N30°N
25°N
15°N
25°N
20°N
15°N
110°W
110°W
105° 001W ° 59W ° 09W °W
105° 001W ° 59W °W
85°W
115°W
Area of map
DELEGATIONS:01020304050607080910111213141516
This map was produced by the Map Design Unit of The World Bank.The boundaries, colors, denominations and any other informationshown on this map do not imply, on the part of The World BankGroup, any judgment on the legal status of any territory, or anyendorsement or acceptance of such boundaries.
> 15.001
12.001 - 15.000
9.001 - 12.000
6.001 - 9.000
3.001 - 6.000
0 - 3.000
POPULATION PER FINANCIALINSTITUTION BRANCH*:
STATE BOUNDARY
DELEGATION BOUNDARY
Alvaro ObregónAzcapotzalcoBenito JuárezCoyoacánCuajimalpa de MorelosCuauhtémocGustavo A. MaderoIztacalcoIztapalapaLa Magdalena ContrerasMiguel HidalgoMilpa AltaTláhuacTlalpanXochimilcoVenustiano Carranza
Sources: INEGI, Bansefi, FONAES, ABM, Caja Libertad, Caja Popular Mexicana,Compartamos and FinComun.
Notes: Number of financial institution branches as of 2004 and population data from2000 National Census.
* The best information available from the sources cited was used tocreate the maps, some unregulated small local institutions may not beincluded.
MEXICOFEDERAL DISTRICT
POPULATION PER FINANCIAL INSTITUTIONALBRANCH
7
TU
XT
LA G
UT
IER
RE
Z
Tap
ach
ula
Co
mit
an
de
Do
min
gu
ez
Sa
n C
rist
ob
al
de
las
Ca
sas
Cin
talp
a d
eF
igu
ero
a
Vill
a F
lore
s
Ton
ala
02
03
09
10
15
16
23
28
30
31
34
36
37
38
41
46
48
49
5556
57
65
67
69
7376 77
78
80
82
84
90
95
96
98
100
103
105
108
109
113
114
115
116
117
5351
111 12
26
6033
07
1150
112
6261
110
89
01
92
66
106
2487
118
441954
2263 10
240
72
2005
86
7418
3247
79 75 9425
101
70
3597
214345 93
06
4239
8110
410
7
52
17 27
91
148568
99
71
29
TA
BA
SC
O
VE
RA
CR
UZ
OA
XA
CA
GUATEMALA
ALA
META
UG
PA
CIF
IC
OC
EA
N
CA
MP
EC
HE
CA
MP
EC
HE
TA
BA
SC
OT
AB
AS
CO
OA
XA
CA
OA
XA
CA
GU
ER
RE
RO
GU
ER
RE
RO
CO
LIM
AC
OLI
MA
JALI
SC
OJA
LIS
CO
NA
YA
RIT
NA
YA
RIT
ZA
CA
TE
CA
SZ
AC
AT
EC
AS
TA
MA
ULI
PA
ST
AM
AU
LIP
AS
NU
EV
ON
UE
VO
LEO
NLE
ON
CO
AH
UIL
AC
OA
HU
ILA
CH
IHU
AH
UA
CH
IHU
AH
UA
SO
NO
RA
SO
NO
RA
DU
RA
NG
OD
UR
AN
GO
SA
N L
UIS
SA
N L
UIS
PO
TO
SI
PO
TO
SI
MIC
HO
AC
AN
MIC
HO
AC
AN
PU
EB
LAP
UE
BLA
VE
RA
CR
UZ
VE
RA
CR
UZ
YU
CA
TA
NY
UC
AT
AN
QU
INT
AN
AQ
UIN
TA
NA
RO
OR
OO
S I NA L O
A
S I NA L O
A
Ma
zatl
Ma
zatláá
nn
To
rre
To
rreóó
nnM
ata
mo
ros
Ma
tam
oro
s
La
red
oL
are
do
Ojin
ag
aO
jina
ga
Lo
s M
och
isL
os
Mo
chis
Na
vojo
aN
avo
joa
No
ga
les
No
ga
les
Sa
nS
an
Fe
lipe
Fe
lipe
Lo
reto
Lo
reto
So
no
ita
So
no
ita
Ag
ua
Ag
ua
Pri
eta
Pri
eta
Gu
aym
as
Gu
aym
as
Te
hu
an
tep
ec
Te
hu
an
tep
ec
Fro
nte
raF
ron
tera
Vill
ah
erm
osa
Vill
ah
erm
osa
Tu
xtla
Tu
xtla
Gu
tie
rre
zG
uti
err
ez
Oa
xaca
Oa
xaca
Ch
ilpa
nci
ng
oC
hilp
an
cin
go
Co
lima
Co
lima
Gu
ad
ala
jara
Gu
ad
ala
jara
Te
pic
Te
pic
Du
ran
go
Du
ran
go
Sa
ltS
altíí
llollo
Ch
ihu
ah
ua
Ch
ihu
ah
ua
Cu
liac
Cu
liacáá
nn
He
rmo
sillo
He
rmo
sillo
Me
xica
liM
exi
cali
Gu
an
aju
ato
Gu
an
aju
ato
Pa
chu
caP
ach
uca
Ag
ua
sca
lien
tes
Ag
ua
sca
lien
tes
Qu
er
Qu
eréé
taro
taro
Mo
relia
Mo
relia
To
luca
To
luca
Cu
ern
ava
caC
ue
rna
vaca
Pu
eb
laP
ue
bla
Tla
xca
laT
laxc
alaJa
lap
aJa
lap
a
Sa
n L
uis
Sa
n L
uis
Po
tos
Po
tosíí
Ciu
da
dC
iud
ad
Vic
tV
ictóó
ria
ria
Za
cate
cas
Za
cate
cas
Mo
nte
rre
yM
on
terr
ey
ME
XIC
OM
EX
ICO
CIT
YC
ITY
YYaaqquuii
RRii
oo BBrraavvoo
FFuueerr
tt ee
SSaallaa
ddoo
LLeerrmmaa
BBaallss
aass
UUssuu
mmaacc
iinnttaa
CCoonncc
hhooss
BA
JAB
AJA
CA
LIF
OR
NIA
CA
LIF
OR
NIA
BA
JAB
AJA
CA
LIF
OR
NIA
CA
LIF
OR
NIA
SU
RS
UR
ME
XIC
OM
EX
ICO
MO
RE
LOS
MO
RE
LOS
DIS
TR
ITO
FE
DE
RA
LD
IST
RIT
O F
ED
ER
AL
HID
ALG
OH
IDA
LGO
GU
AN
AJU
AT
OG
UA
NA
JUA
TO
AG
UA
SC
ALI
EN
TE
SA
GU
AS
CA
LIE
NT
ES
TLA
XC
ALA
TLA
XC
ALA
QU
ER
QU
ERÉÉ
TA
RO
TA
RO
Rio Gra
nde
GU
AG
UAT
EM
ALA
TE
MA
LA
CA
MP
EC
HE
TA
BA
SC
O
OA
XA
CA
GU
ER
RE
RO
CO
LIM
A
JALI
SC
O
NA
YA
RIT
ZA
CA
TE
CA
S
TA
MA
ULI
PA
S
NU
EV
OLE
ON
CO
AH
UIL
A
CH
IHU
AH
UA
BA
JAC
ALI
FO
RN
IA
BA
JAC
ALI
FO
RN
IAS
UR
SO
NO
RA
DU
RA
NG
O
SA
N L
UIS
PO
TO
SI
MIC
HO
AC
AN
ME
XIC
O
MO
RE
LOS
DIS
TR
ITO
FE
DE
RA
L
PU
EB
LA
HID
ALG
OV
ER
AC
RU
ZG
UA
NA
JUA
TO
AG
UA
SC
ALI
EN
TE
S
TLA
XC
ALA
YU
CA
TA
N
QU
INT
AN
AR
OO
S I NA L O
A
QU
ER
ÉT
AR
O
Ta
pa
chu
la
Pu
ert
oE
sco
nd
ido
Aca
pu
lco
Pu
ert
oV
alle
rta
Ma
zatl
án
To
rre
ón
Ma
tam
oro
s
La
red
o
Ojin
ag
a
Lo
s M
och
is
Na
vojo
a
No
ga
les
En
san
ad
a
Tiju
an
a
Sa
nF
elip
e
Sa
nta
Ro
salia Lo
reto
Ca
bo
Sa
n L
uca
s
So
no
ita
Ag
ua
Pri
eta
Ciu
da
d J
uá
rez
Gu
aym
as
Ve
racr
uz
Ta
mp
ico
Te
hu
an
tep
ec
Co
zum
el
Ca
ncu
n
Fro
nte
ra
Ch
etu
ma
l
Me
rid
a
Vill
ah
erm
osa
Ca
mp
ech
e
Tu
xtla
Gu
tie
rre
z
Oa
xaca
Ch
ilpa
nci
ng
o
Co
lima
Gu
ad
ala
jara
Te
pic
Du
ran
go
Sa
ltíl
lo
Ch
ihu
ah
ua
Cu
liacá
n
He
rmo
sillo
Me
xica
li
La
Pa
z
Gu
an
aju
ato
Pa
chu
ca
Ag
ua
sca
lien
tes
Qu
eré
taro
Mo
relia
To
luca
Cu
ern
ava
caP
ue
bla
Tla
xca
laJala
pa
Sa
n L
uis
Po
tosí
Ciu
da
dV
ictó
ria
Za
cate
cas
Mo
nte
rre
y
ME
XIC
OC
ITY
UN
ITE
D S
TA
TE
S O
F A
ME
RIC
A
GU
AT
EM
ALA
BE
LIZ
E
HO
ND
UR
AS
EL
SA
LVA
DO
R
Yaqui
Rio Gra
nde
Ri
o Bravo
Fuer
t e
Sala
do
Lerma
Bals
as
Usu
mac
inta
Conc
hos
PA
CIF
IC
OC
EA
N
Gu
lf o
f M
ex
ico
Bay
of C
ampe
che
Gul
f of
Tehu
ante
pec
Gul
f of
Hon
dura
s
G u l f o fC
a l if o r n i a
115
°W
30°N
30°N
25°N
15°N
25°N
20°N
15°N
110
°W
110
° W
105
°0
01W
°5 9
W°
0 9W
° W
105
°0
01W
°5
9W
°W
85°W
115
°W
CH
IAP
AS
The
bou
ndar
ies,
col
ors,
den
omin
atio
ns a
nd a
ny o
ther
info
rmat
ion
show
n on
this
map
do
not i
mpl
y, o
n th
e pa
rt o
f The
Wor
ld B
ank
Gro
up, a
ny ju
dgm
ent o
n th
e le
gal s
tatu
s of
any
terr
itory
, or
any
endo
rsem
ent o
r ac
cept
ance
of s
uch
boun
darie
s.
PO
PU
LA
TIO
N P
ER
FIN
AN
CIA
LIN
ST
ITU
TIO
N B
RA
NC
H*:
N
O F
INA
NC
IAL
IN
ST
ITU
TIO
N B
RA
NC
HE
S
>
10
0.0
01
5
0.0
01
- 1
00
.00
0
2
0.0
01
- 5
0.0
00
1
- 2
0.0
00
020
4060
KIL
OM
ET
ER
S
ME
XIC
O
STA
TE
OF
CH
IAP
AS
PO
PU
LA
TIO
N P
ER
FIN
AN
CIA
L I
NS
TIT
UT
ION
AL
BR
AN
CH
ST
AT
E C
AP
ITA
L
SE
LE
CT
ED
CIT
IES
MU
NIC
IPA
L B
OU
ND
AR
IES
ST
AT
E B
OU
ND
AR
IES
INT
ER
NA
TIO
NA
L B
OU
ND
AR
IES
01 02 03 04 05 06 07 08 09 10 11 12 13 14 15 16 17 18 19 20 21 22
Sou
rces
: IN
EG
I, B
anse
fi, F
ON
AE
S, A
BM
, Caj
a Li
bert
ad, C
aja
Pop
ular
Mex
ican
a, C
ompa
rtam
os a
nd F
inC
omun
.
Not
es: N
umbe
r of
fina
ncia
l ins
titut
ion
bran
ches
as
of 2
004
and
popu
latio
n da
ta fr
om 2
000
Nat
iona
l Cen
sus.
* T
he b
est i
nfor
mat
ion
avai
labl
e fr
om th
e so
urce
s ci
ted
was
use
d to
crea
te th
e m
aps,
som
e un
regu
late
d sm
all l
ocal
inst
itutio
ns m
ay n
ot b
ein
clud
ed.
MU
NIC
IPA
LIT
IES
:
66 67 68 69 70 71 72 73 74 75 76 77 78 79 80 81 82 83 84 85 86 87 88 89 90 91 92 93 94 95 96 97 98 99 100
101
102
103
104
105
106
107
108
109
110
111
112
113
114
115
116
117
118
23 24 25 26 27 28 29 30 31 32 33 34 35 36 37 38 39 40 41 42 43 44
45 46 47 48 49 50 51 52 53 54 55 56 57 58 59 60 61 62 63 64 65
Aca
coya
gua
Aca
laA
cape
tahu
aA
ldam
aA
ltam
irano
Am
atán
Am
aten
ango
de
la F
ront
era
Am
aten
ango
del
Val
leA
ngel
Alb
ino
Cor
zoA
rria
gaB
ejuc
al d
e O
cam
poB
ella
Vis
taB
enem
érito
de
las
Am
éric
asB
errio
zába
lB
ochi
lC
acah
oatá
nC
ataz
ajá
Cha
lchi
huitá
nC
ham
ula
Cha
nal
Cha
pulte
nang
oC
hena
lhó
Chi
apa
de C
orzo
Chi
apill
aC
hico
asén
Chi
com
usel
oC
hiló
nC
inta
lapa
Coa
pilla
Com
itán
de D
omín
guez
Cop
aina
láE
l Bos
que
El P
orve
nir
Esc
uint
laF
ranc
isco
Leó
nF
ront
era
Com
alap
aF
ront
era
Hid
algo
Hue
huet
ánH
uitiu
pán
Hui
xtán
Hui
xtla
Ixhu
atán
Ixta
com
itán
Ixta
pa
Ixta
pang
ajoy
aJi
quip
ilas
Jito
tol
Juár
ezLa
Con
cord
iaLa
Gra
ndez
aLa
Inde
pend
enci
aLa
Lib
erta
dLa
Trin
itaria
Larr
áinz
arLa
s M
arga
ritas
Las
Ros
asM
apas
tepe
cM
arav
illa
Ten
ejap
aM
arqu
és d
e C
omill
asM
azap
a de
Mad
ero
Maz
atán
Met
apa
Mito
ntic
Mon
tecr
isto
de
Gue
rrer
oM
otoz
intla
Nic
olás
Ruí
zO
cosi
ngo
Oco
tepe
cO
cozo
coau
tla d
e E
spin
osa
Ost
uacá
nO
sum
acin
taO
xchu
cP
alen
que
Pan
telh
óP
ante
pec
Pic
huca
lco
Piji
jiapa
nP
uabl
o N
uevo
Sol
ista
huac
ánR
ayón
Ref
orm
aS
aban
illa
Sal
to d
e A
gua
San
And
rés
Dur
azna
lS
an C
ristó
bal d
e la
s C
asas
San
Fer
nand
oS
an J
uan
Can
cuc
San
Luc
asS
antia
go e
l Pin
alS
iltep
ecS
imoj
ovel
Sita
láS
ocol
tena
ngo
Sol
osuc
hiap
aS
oyal
óS
uchi
apa
Suc
hiat
eS
unua
paT
apac
hula
Tap
alap
aT
apilu
laT
ecpa
tán
Ten
ejap
aT
eopi
sca
Tila
Ton
alá
Tot
olap
aT
umba
láT
uxtla
Chi
coT
uxtla
Gut
iérr
ezT
uzan
tán
Tzi
mol
Uni
ón J
uáre
zV
enus
tiano
Car
ranz
aV
illa
Com
altit
lán
Vill
a C
orzo
Vill
aflo
res
Yaj
alón
Zin
acan
tán
Figure 3b Mexico penetration map
8
These minimum amounts are equivalent to 12 daysand 120 days, respectively, of minimum wage inBenin. Given that many people in Benin earn farless than the minimum wage, formal savings serv-ices are beyond the reach of many poor people.
Formal financial institutions tended to pricethemselves out of the market for poor people’s sav-ings across the markets studied by CGAP. The“threshold costs” of basic deposit products—i.e.,the amount of money needed for opening fees,minimum balances, and shares, in the case of coop-eratives—were often many times what poor peoplecould afford. This was especially true in safer, regu-lated institutions, such as banks.
In CGAP’s analysis, “basic deposit products”were defined as the lowest-cost savings or transactionaccount in a given institution. Because of minimumbalance requirements for other products, thesedemand deposit or current accounts are often thefirst or only type of account poor clients can afford.
CGAP’s research found that threshold costs tendto decrease as branch density (the number ofbranches per population) increases. Across thecountries studied, the correlation between thresh-old costs (measured as a multiple of minimumwage) and population per branch was -0.78 for alldeposit-taking institutions. The correlation wasstronger (-0.83) when only bank branches wereconsidered (see Appendix 2). Although based on alimited sample of countries, the results support theexpectation that competition brings down price.
Security
Although informal options have advantages overfinancial institutions based on proximity and afford-ability, comparisons between informal and formaloptions based on security are less conclusive. Depositcollectors are rarely subject to regulation or supervi-sion, and reports of them absconding with client sav-ings are common. Saving at home carries its ownrisks, such as theft or loss from fire or flood. Butbanks also fail. In fact, every one of the markets stud-ied by CGAP had suffered a banking system crisis inthe past 10–20 years—well within the memory of the
current generation of savers, with the expectedimpact on client confidence. Still, the most thoroughstudy of security in informal savings to date indicatesthat informal mechanisms are far riskier than evenunsupervised deposit-taking institutions (Wright andMutesasira 2002).
Ironically, security often emerges as savers’ top pri-ority in surveys of low-income clients. Why, then, dopoor clients seem to prefer informal to formal sav-ings? Behavioral finance suggests that familiar risks orthose perceived to be under an individual’s controltend to be underestimated compared with risks thatare unfamiliar or perceived to be not within a per-son’s control (Hertwig et al. 2004). The risk inher-ent in saving at home, with a trusted depositcollector, or in livestock that one has been tendingsince childhood, may thus be underestimated com-pared with the risk of saving in an unfamiliar institu-tion with opaque management. Because importantmeasures of security in a formal institution—such asloan losses—are not directly observable, it is easy forclients to misjudge the relative security of informalversus formal savings options. Given the widespreadabsence of systems to signal institutional soundness,comparing the security of different formal institu-tions is also a challenge for customers.
Trade-offs between security and accessibility
Often, financial institutions that are most accessibleto poor clients—especially in rural areas—are lesssecure (in terms of financial soundness and there-fore risk to savings) than institutions that targetwealthier clientele. In the Philippines, for example,rural banks have higher nonperforming loan ratiosthan either thrift or commercial banks. In Uganda,the average reported portfolio at risk (PAR) greaterthan 30 days in savings and credit cooperatives(SACCOs) reach as high as 42 percent, comparedwith single digits for regulated institutions.5
However, these regulated institutions are seldomlocated outside primary and secondary cities.
5 PAR 30 equals the outstanding balance of loans with any payment more
than 30 days late, divided by the outstanding balance of all loans.
9
Reliable data are seldom available for institu-tions serving the poor. In Uganda, PAR data areavailable for only 147 SACCOs out of an estimatedtotal of 750–900 currently active in the country. Inthe Philippines, even the total number of financialcooperatives in operation is unknown. The onlyperformance data available come from a smallnumber of co-ops selected for a donor-fundedtechnical assistance project because of their prom-ise for improvement. At the time of entry into thisproject in 1997, their collective PAR 30 was 54.6percent (although by 2005 this had declined to8.76 percent).
No single type of deposit-taking institution gen-erally offers low-income clients security, proximity,and affordability. Therefore, clients tend to usesavings instruments whose advantages they can seeand that they can access. Proximity and affordabil-ity—features offered par excellence by informalmechanisms—are clearly visible to clients. Lack ofsecurity is not. Poor savers may thus be sacrificingwhat they most value in a deposit service—secu-rity—by using informal mechanisms that provideclear evidence of proximity and affordability but donot necessarily provide security. Conversely, formalinstitutions that offer secure savings opportunitieshave difficulty penetrating the savings market forpoor clients because they tend to be inaccessible topoor clients.
Why Can’t Formal InstitutionsCompete?
Why do so few formal financial institutions offerboth security and access to poor savers? CGAP’sSavings Assessments have identified a constellationof causes at three levels of the financial system.
Inadequate management capacity and
high cost structure
The skills needed to manage savings programs aredifferent, and often more sophisticated, than thoseneeded to run credit programs. Capable manage-ment, staff, and systems are crucial for mobilizingsavings. But high-capacity management often car-
ries a high price tag, and institutions that operate inpoor and rural areas usually need to maintain a lowcost structure.
To be able to afford high-capacity management,institutions, such as cooperatives, need to achieveeconomies of scale. Some institutions achieveeconomies of scale by consolidating and becomingbranches of a single “mother cooperative.” Theconsolidation of 60 independent cooperatives tobecome Caja Popular Mexicana is an example of asuccessful transformation. Between 2001 and 2005,Caja Popular Mexicana saw capital adequacyincrease by three times, operating expenses halved,delinquency fall by two-thirds, and assets and mem-bership double. However, this transformation tooksome 15 years of work by the consolidating creditunions and $4 million in donor funds for skilled,credible technical assistance providers.
Institutions that already have the capacity tosafely manage deposits need to focus on loweringdelivery costs to be able to serve low-income mar-kets. Advancements in technology have made indus-try professionals enthusiastic about the potential ofdeveloping technology-enabled channels to lowercosts for delivering services, including deposits.Unfortunately, this type of cost-cutting itself mayrequire substantial up-front investment.
In Uganda, one micro-deposit-taking institutionestimates that it has invested $200,000 in develop-ing a system using smart cards and point-of-sale ter-minals (in addition to considerable investment bypublic and private donors). Despite this investment,the new system has yet to be rolled out at scale.
Another strategy increasingly used by banks tolower service delivery costs is to take advantage ofretail infrastructure that is already in place. InMexico, one bank established mini-branches insidea network of appliance stores and was able to open4 million savings accounts in two years—moreaccounts than the entire “popular finance” sector,with comparable average balances.6
6 The “popular finance” or finanzas populares sector in Mexico refers to
institutions, such as MFIs and cooperatives, that serve the traditionally
unbanked.
In the Philippines, Banco de Oro enablescashiers at a major retailer to act as service pointsfor the bank’s main mass-market product, a reload-able payroll and debit card. In two years, this prod-uct mobilized $5.6 million in balances on 700,000cards in force (in a country with a working popula-tion of about 50 million). In both the Mexican andFilipino cases, the bank and cooperating retailer areowned by the same parent company.
Few outlets for excess liquidity
Excess liquidity in financial institutions limits incen-tives to mobilize additional deposits—especially poorpeople’s deposits, which tend to be perceived apriori as short term, unstable, and costly. Unfortu-nately, regulated financial institutions in manymarkets already have more than enough depositsrelative to lending or investment opportunities,especially in the short term. At the time of thePhilippines CGAP assessment, for example, savingsin banks were 150 percent of bank loans to theprivate sector. In Benin, the proportion was roughlysimilar. In Bosnia, although the banking system wasslightly under-liquid overall, excess liquidity wasconcentrated in the short term (under one year),with 60 percent of deposits against only 25 percentof loans.7
At the institutional level, excess liquidity may becaused by a lack of suitable lending opportunities(real or perceived). Especially among banks, demandfor on-lending funds can be limited, particularly incountries where government debt is not an attrac-tive investment opportunity.
Although particular institutions may betemporarily under- or over-liquid, in developedcountries these imbalances are usually corrected byliquidity management mechanisms. However, manydeveloping-country markets lack these liquiditymanagement mechanisms. Even Bosnia, which is, bysome measures, the most advanced financial systemstudied by CGAP, lacks overnight markets, repur-chase agreements, and other tools commonly usedby banks to manage liquidity.8
Lack of liquidity management mechanisms wasespecially common among cooperatives, perhapsbecause of the fear of spreading risk from badlymanaged to well-managed co-ops. The disincentive tosavings mobilization posed by excess liquidity in coop-eratives can be especially damaging for poor clients,because co-ops tend to be more accessible than othertypes of institutions. Better liquidity managementtools would make deposits more attractive.
In Uganda, stakeholders are considering ways toplace excess co-op liquidity in regulated institutionsthat offer safe, remunerative investments—or directlyinto Ugandan government bonds, which offer attrac-tive rates. Either option is less risky than encouragingthese cooperatives to ramp up lending (especiallyuncollateralized lending like microcredit) in light oftheir high loan delinquency rates.
Unfair competition from “cheap and easy”
wholesale funds
Unfortunately, deposit mobilization often is discour-aged by wholesale financing from apexes (usuallygovernment owned). In countries as diverse asUganda and the Philippines, donors and govern-ments provide millions of dollars in wholesalefinancing to deposit-taking institutions that areamong the most accessible to poor clients (SACCOsin Uganda and rural banks in the Philippines).
Second-tier financing in both Uganda and thePhilippines is at near-market rates, so the funds arenot as cheap as they could be. Still, relatively easyaccess to wholesale funds has served as a disincentivefor financial institutions to pursue additional depositsto finance portfolio growth. If these funds werecrowding out deposits in shaky institutions, thismight be considered a benefit to savers. However,
10
7 Nor were excess funds being soaked up by treasury bonds. In the
Philippines, these were returning around the same rate as inflation; in
Benin, government bond issues were extremely uncommon; and in
Bosnia, the government is currently prohibited from issuing sovereign
debt.8 Foreign-owned banks in Bosnia can alleviate excess short-term liquid-
ity by sending short-term deposits abroad to their parent banks in re-
turn for longer-term lines of credit. But most financial institutions do
not have this option.
11
ally, access to the payment system is restricted tomore highly regulated institutions and often requiresa hefty security deposit with the payments clearing-house. Payment systems are, in fact, often owned bylarge banks. These attributes tend to put access topayments systems beyond the reach of small financialinstitutions that cater to the poor. The inability ofthese institutions to make clients’ savings accessiblein multiple locations or to provide payments servicesmakes depositing with them less attractive.
However, a new breed of payments providerpromises to make payment services more widelyavailable. Some of these providers use mobile phoneslinked to bank accounts for domestic and interna-tional money transfers, purchases, loan repayments,and cash withdrawals. Often these transactionsinvolve a debit card and a network of point-of-saledevices located in financial institutions and retailestablishments (see Box 3) (Ivatury 2006).
the logic of wholesale funders leads them to channelfunds to the strongest, not the weakest, institutions.Incentives are therefore dampened for the very insti-tutions best able to safeguard client deposits.
A common rationale for second-tier credit lines isthe mismatch that sometimes exists between financialinstitution over-liquidity in the short term and under-liquidity in the longer term. But often, short-termfunds are much more stable than commonly thoughtand could be used for longer-term lending. Occasion-ally, regulation also can underestimate the stability ofshort-term deposits: in Bosnia, 95 percent of depositsunder 30 days must be lent out for the same term—a very limited market in a country with no overnightinterbank lending.
Incomplete payment systems
Access to the payment system can greatly affect aninstitution’s ability to capture deposits. Tradition-
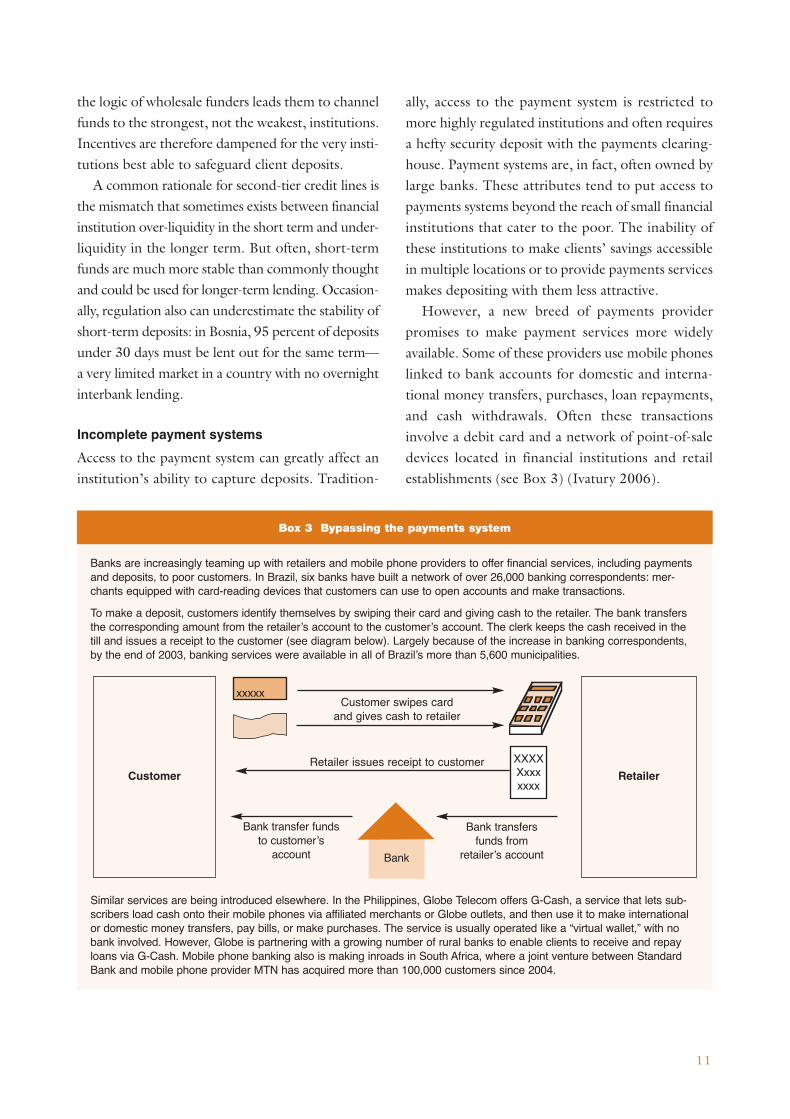
Banks are increasingly teaming up with retailers and mobile phone providers to offer financial services, including paymentsand deposits, to poor customers. In Brazil, six banks have built a network of over 26,000 banking correspondents: mer-chants equipped with card-reading devices that customers can use to open accounts and make transactions.
To make a deposit, customers identify themselves by swiping their card and giving cash to the retailer. The bank transfersthe corresponding amount from the retailer’s account to the customer’s account. The clerk keeps the cash received in thetill and issues a receipt to the customer (see diagram below). Largely because of the increase in banking correspondents,by the end of 2003, banking services were available in all of Brazil’s more than 5,600 municipalities.
Similar services are being introduced elsewhere. In the Philippines, Globe Telecom offers G-Cash, a service that lets sub-scribers load cash onto their mobile phones via affiliated merchants or Globe outlets, and then use it to make internationalor domestic money transfers, pay bills, or make purchases. The service is usually operated like a “virtual wallet,” with nobank involved. However, Globe is partnering with a growing number of rural banks to enable clients to receive and repayloans via G-Cash. Mobile phone banking also is making inroads in South Africa, where a joint venture between StandardBank and mobile phone provider MTN has acquired more than 100,000 customers since 2004.
Box 3 Bypassing the payments system
Customer Retailer
Customer swipes card and gives cash to retailer
Retailer issues receipt to customer
xxxxx
XXXXXxxxxxxx
Bank
Bank transfer fundsto customer’s
account
Bank transfersfunds from
retailer’s account
Uneven regulation and supervision
Regulation and supervision, which can be highlyrestrictive for some types of institutions and looseor nonexistent for others, can perpetuate a situationwhere safe institutions have few incentives to pur-sue poor depositors, and accessible institutions can-not guarantee the safety of deposits.
Postal banks are a case in point. In many markets,they maintain some of the most extensive networksof service points for deposit taking, and they offerpayment services. However, many postal banks arenot subject to banking regulation. Because they areconsidered part of the postal service, their assets areat risk of leakage into loss-making postal systems.This is the case with Caisse Nationale d’Epargne, thepostal savings bank in Benin that is in the process ofseparating from the postal service.
Policy frameworks are often inappropriate forfinancial cooperatives as well. In Uganda, for exam-ple, SACCOs are not governed by dedicated legisla-tion. They operate under a variety of legal regimes,including the Cooperatives, Companies, and NGOActs. In many countries, they are not monitored byappropriate financial regulators, but rather by agen-cies in charge of all cooperatives. In Uganda, this isthe Ministry of Tourism, Trade, and Industry, whichis widely acknowledged to lack the capacity to super-vise the 1400 SACCOs currently registered.
Where a dedicated agency for cooperatives doesexist, as in the Philippines, that agency typically ischarged with promoting cooperatives as well asmonitoring them, resulting in a conflict of interestthat can weaken the supervisory function.Delegating supervision to membership-based feder-ations also can produce a conflict of interest, becausemember institutions may seek to leave the federationto avoid strict supervision. In Mexico, where multi-ple federations have been set up to supervise coop-eratives, institutions have reportedly switched theirmemberships to avoid possible sanctions.
For other types of institutions, regulation and su-pervision can be so strict that it ensures the securityof deposits, but limits outreach. In Mexico, bankingregulations that mandate expensive infrastructure re-
12
quirements discourage rural branches. A similar phe-nomenon is at work in Uganda, where investmentsrequired by the new Micro-Deposit Taking Institu-tions (MDI) Act have at least temporarily slowedbranch expansion among newly regulated MDIs.9 Bydriving up costs, these regulations can limit safer in-stitutions to wealthier areas. Worldwide efforts tocombat money laundering and the financing of ter-rorism are also threatening to make small transac-tions unviable for financial institutions.10
In addition, partnerships that could help safeinstitutions extend their outreach are often discour-aged by financial regulators in the name of safety. InBosnia and Uganda, for example, regulators recov-ering from recent systemic crises have prohibitedagency relationships that would allow unregulatedinstitutions to handle transactions on behalf of reg-ulated ones.
It would be irresponsible to suggest that regula-tions like these be loosened without careful analysisof the implications of such a change. Strict regula-tion and supervision is, after all, part of the reasonthat safe institutions are safe. Nor is strict regulationand supervision the primary bottleneck to extend-ing quality deposit services to the poor. Evidencefor this can be found in countries like Uganda,where significant donor and government invest-ments in creating a separate regulatory category forMDIs has not yet led to significant increases in out-reach.
Furthermore, there is a legitimate place for unsu-pervised deposit-taking institutions in the financialsystem, specifically for those that take only depositsfrom members and are too small to supervise costefficiently (where supervision costs are measuredagainst the institution’s assets). Research in Ugandashows that even unsupervised institutions tend tobe safer than informal savings options (Wright andMutasesira 2002).
9 The 2004 MDI Act allows a limited number of MFIs that meet high
performance thresholds to transform into regulated financial intermedi-
aries supervised by the Bank of Uganda.10 For more information, see Isern et al. 2005.
Strategies for Supporting Small-BalanceSavings Mobilization
What can be done to help financial institutions pro-vide both safe and accessible deposit services?CGAP’s Country-Level Savings Assessments iden-tifies five strategies that could alleviate key demand-and supply-side constraints. Although the impor-tance of specific constraints varies from country tocountry, the strategies developed are relevant toalmost all of the five markets studied.
Document the market. Generating solid dataon the size of the low-income market and clientpreferences for deposit services provides institu-tions with a sound basis for business planning andproduct development. Making these data widelyavailable and visible could contribute to a change inmind set that might encourage previously inacces-sible institutions to reach out to poor savers withdeposit services. Donor-subsidized market studiescan increase awareness and contribute to this attitu-dinal shift. The one market—Uganda—in whichCGAP found ready acceptance of the propositionthat the poor do save was also the market whereclient preferences were the best documented.
Help clients make smart savings choices.Many clients find it difficult to accurately assess therisks of different savings instruments, both formaland informal. Consumer education and financialliteracy training can help poor clients judge the rel-ative risks of available savings options and use themto manage household finances more effectively.
Client education on how to assess a financial insti-tution’s safety is especially valuable. Client knowl-edge of the indicators of institutional soundness mayhelp alleviate some of their uncertainty aboutentrusting their savings to formal financial institu-tions. Such mechanisms could build on the ratingsystems often used by apexes, federations, and tech-nical assistance projects and can be promoted toclients through public education campaigns.
Increase capacity in accessible institutionsand lower costs in safe institutions. To competemore effectively with informal savings mechanisms,
13
financial intermediaries must offer products thatcombine the security of well-run institutions withthe proximity and affordability of informal instru-ments. For regulated institutions, such as banks, thekey is developing less costly delivery mechanismswhile maintaining high levels of depositor protec-tion. Technologies such as mobile phones andpoint-of-sale networks hold promise, but oftenrequire substantial up-front investment. In the shortterm, offering incentives for regulated institutionsto reach out to unserved markets may be an effec-tive use of subsidies. For institutions that buildpoints of service in poor areas, incentives couldinclude a share of the government’s payments busi-ness, temporary exclusivity rights in certain areas, ortax breaks.
For less tightly regulated institutions, such ascooperatives, strengthening management is oftenmore important. Both types of institutions shoulduse data on client preferences to design productsthat respond to specific client needs. Donors, train-ing and technical assistance providers, policy mak-ers, regulators, and supervisors all have roles to playin helping institutions make these upgrades.
Align liquidity-related incentives. Finding out-lets for excess liquidity in strong institutions mayheighten their incentive to offer deposit services topoor clients. Helping institutions take and manageintelligent lending risks, for example in the micro-credit market, could drive deposit collection.Improved liquidity management mechanisms thatenable institutions to place excess funds into safe,remunerative investments also could increase theirappetite for deposits.
At the very least, donors and governments shouldthink twice about pumping more liquidity intoalready over-liquid systems through cheap, easilyaccessible credit lines. There may be alternatives thatbetter preserve incentives for deposit collection. Forexample, an emergency liquidity fund that “guaran-tees” short-term deposits could help financialinstitutions transform them into longer-term assets.In countries with very strict asset-liability regulation,increasing the proportion of short-term deposits that
can be transformed into longer-term loans could beanother potential solution. A study of the truestability of short-term deposits in a given institu-tional or country context should underpin boththese strategies.
Establish balanced regulatory and supervi-sory frameworks. Regulatory and supervisoryframeworks exert a strong influence over financialinstitutions’ ability and incentives to provide securedeposit services to low-income savers. In light ofpast crises, they often exhibit a bias toward ensur-ing systemic stability. But the restrictions entailedby this approach can inhibit outreach to poorclients. Often, this pressures regulated institutionsto innovate outside the law. For such institutions,permitting limited piloting of new products anddelivery methods may be a constructive alternativeto closing off all avenues for experimentation.
Stronger monitoring is often needed for moreaccessible institutions, especially for postal banksand large cooperatives that approach the definitionof institutions that take deposits from the public.Financial authorities often are reluctant to regulatea plethora of small institutions because of the costsinvolved. As a compromise, some countries have orare considering delegating supervision to member-ship-based federations of institutions. These effortshave been largely unsuccessful, and internationalexperiences may hold useful lessons.
For smaller institutions that cannot be cost-effectively supervised, nonprudential systems thatinvolve collecting and posting performance data—as well as communicating clearly to members that
14
these institutions are not supervised—may be apractical alternative. The emphasis on performancedata also could help build institutional capacity—anecessary counterpart to improved policy and effi-cient industry infrastructure.
Conclusion
Poor people worldwide want safe, accessible savingsmechanisms. Formal financial institutions cannotfulfill this demand until they can offer services thatare secure, affordable, and located where poorclients live and work. In the meantime, poor peoplewill continue to hide money at home, lock up assetsin animals, or entrust cash to informal providers—with all the risks those mechanisms entail. Funders,policy makers, and financial institutions themselvesmust work at all levels of the financial system toalign incentives and create the capacity for formalinstitutions to tap the demand for savings services.
These efforts translate into different activities,depending on the local context. While offeringincentives to banks to downscale in deposit mobi-lization may be the most promising strategy in onecountry, staunching the flow of subsidized on-lend-ing funds to cooperatives or strengthening postalbank management may be more important inanother. Regardless of the specific action, safety andaccessibility are the goals. If financial institutionscan offer these, they will not only increase access tosavings services for poor people, but also createaccess to a fortune of deposits for themselves.
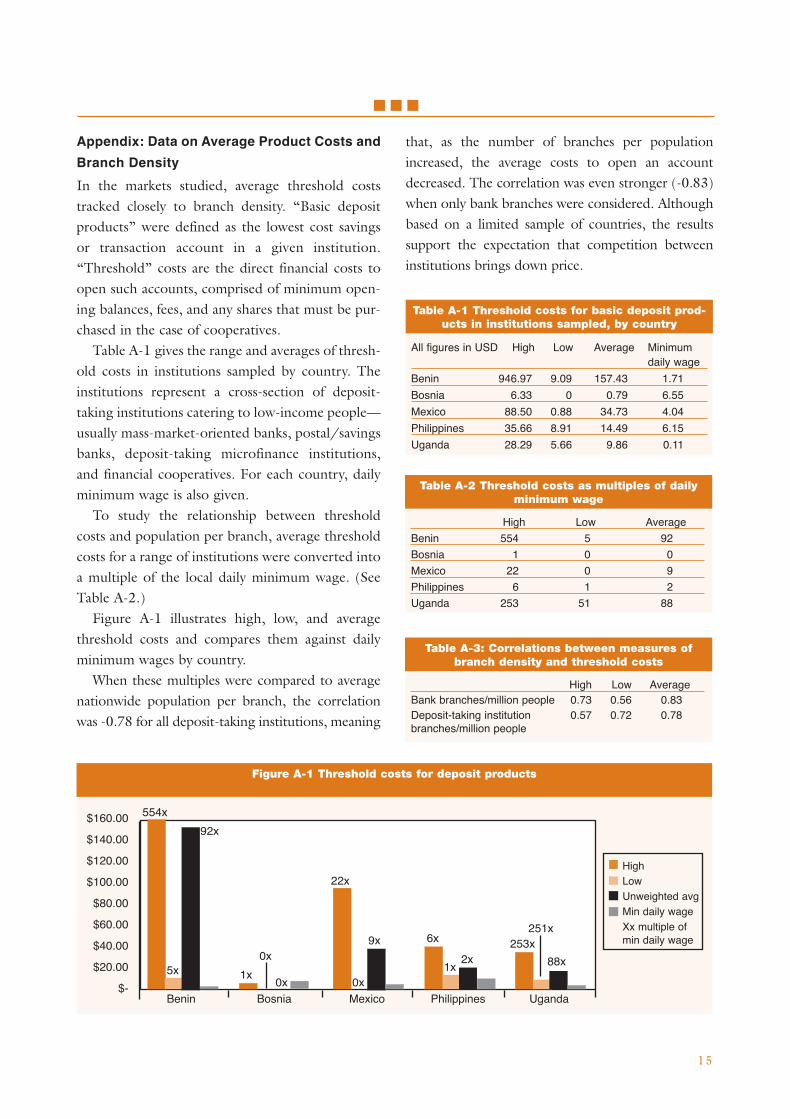
Appendix: Data on Average Product Costs and
Branch Density
In the markets studied, average threshold coststracked closely to branch density. “Basic depositproducts” were defined as the lowest cost savingsor transaction account in a given institution.“Threshold” costs are the direct financial costs toopen such accounts, comprised of minimum open-ing balances, fees, and any shares that must be pur-chased in the case of cooperatives.
Table A-1 gives the range and averages of thresh-old costs in institutions sampled by country. Theinstitutions represent a cross-section of deposit-taking institutions catering to low-income people—usually mass-market-oriented banks, postal/savingsbanks, deposit-taking microfinance institutions,and financial cooperatives. For each country, dailyminimum wage is also given.
To study the relationship between thresholdcosts and population per branch, average thresholdcosts for a range of institutions were converted intoa multiple of the local daily minimum wage. (SeeTable A-2.)
Figure A-1 illustrates high, low, and averagethreshold costs and compares them against dailyminimum wages by country.
When these multiples were compared to averagenationwide population per branch, the correlationwas -0.78 for all deposit-taking institutions, meaning
that, as the number of branches per populationincreased, the average costs to open an accountdecreased. The correlation was even stronger (-0.83)when only bank branches were considered. Althoughbased on a limited sample of countries, the resultssupport the expectation that competition betweeninstitutions brings down price.
15
■ ■ ■
$160.00
$140.00
$120.00
$100.00
$80.00
$60.00
$40.00
$20.00
$-
554x
251x253x
2x1x
6x9x
0x
22x
0x
0x
1x
92x
5x88x
Figure A-1 Threshold costs for deposit products
Benin Bosnia Mexico Philippines Uganda
High LowUnweighted avgMin daily wageXx multiple of min daily wage
Table A-1 Threshold costs for basic deposit prod-ucts in institutions sampled, by country
All figures in USD High Low Average Minimum daily wage
Benin 946.97 9.09 157.43 1.71
Bosnia 6.33 0 0.79 6.55
Mexico 88.50 0.88 34.73 4.04
Philippines 35.66 8.91 14.49 6.15
Uganda 28.29 5.66 9.86 0.11
Table A-2 Threshold costs as multiples of dailyminimum wage
High Low Average
Benin 554 5 92
Bosnia 1 0 0
Mexico 22 0 9
Philippines 6 1 2
Uganda 253 51 88
Table A-3: Correlations between measures ofbranch density and threshold costs
High Low AverageBank branches/million people 0.73 0.56 0.83Deposit-taking institution 0.57 0.72 0.78branches/million people
Please share this
Focus Note with your
colleagues or request extra
copies of this paper or others
in this series.
CGAP welcomes
your comments on this paper.
All CGAP publications are
available on the CGAP Web site
at www.cgap.org.
CGAP
1818 H Street, NW
MSN P3 - 300
Washington, DC 20433 USA
Tel: 202-473-9594
Fax: 202-522-3744
Email:
FocusNote
No. 37
References
Bolaño, Pilar Campos. 2005. El Ahorro Popular en México: Acumulando Activos para Superar la Pobreza. Mex-ico City, Mexico: CIDAC and Miguel Angel Porrúa.
Financial Diaries Web site. www.financialdiaries.com.
Hertwig, Ralph, Greg Barron, Elke Webber, and Ido Erev. 2004. “Decisions from Experience and the Effectof Rare Events in Risky Choice.” Psychological Science 15 (8): 534–9.
Helms, Brigit, Rani Deshpande, Mark Pickens, and Nazaire Sado. 2005. Benin Country-Level Savings As-sessment. Washington, D.C.: CGAP, August.
Isern, Jennifer, David Porteous, Raul Hernandez-Coss, and Chinyere Egwuagu. 2005. “AML/CFT Regu-lation: Implications for Financial Service Providers That Serve Low-Income People.” CGAP Fo-cus Note 29. Washington, D.C.: CGAP, July.
Ivatury, Gautam. 2006. “Using Technology to Build Inclusive Financial Systems.” CGAP Focus Note 32.Washington, D.C.: CGAP, January.
Karlan, D. S., N. Ashraf, and Y. Wesley. 2004. Market Survey Report. Universities of Princeton and Harvard.Mimeo.
Mareco Index Bosnia Gallup International. 2003. Omnibus Survey. Mareco Index Bosnia Gallup Interna-tional, June.
Micro-Enterprise Bank. Market research. Manila, Philippines: Micro-Enterprise Bank.
Pelrine, Richard, and Olive Kabatalya. 2005. “Savings Habits, Needs and Priorities in Rural Uganda.” Kam-pala: USAID/Rural SPEED, September.
Rutherford, Stuart. 2003. “Money Talks: Conversations with Poor People in Bangladesh about ManagingMoney.” Journal of Microfinance 5(2).
Ruthven, O., and S. Kumar. 2002. “Fine-Grain Finance: Financial Choice & Strategy Among the Poor inRural North India.” Finance & Development Working Paper 57, IDPM, University of Manches-ter.
World Bank. 2001. “Mexico Rural Finance: Savings Mobilization Potential and Deposit Instruments in Mar-ginal Areas.” Report No. 21286-ME. Washington, D.C.: World Bank, June 4.
———. 2005. “Broadening Access to Financial Services among the Urban Population: Mexico City’s Un-banked.” Washington, D.C.: World Bank.
Wright, Graham, and Leonard Mutesasira. 2002. “The Relative Risks to the Savings of Poor People.” Nairobi:MicroSave.
Wright, Graham, and Paul Rippey. 2003. “The Competitive Environment in Uganda: Implications for Mi-crofinance Institutions and their Clients.” Kampala: MicroSave/FSDU/Imp-Act, September.
Zeller, Manfred, and Manohar Sharma. 2000. “Many Borrow, More Save, and All Insure: Implications forFood and Micro-finance Policy.” Food Policy 25(2): 143–67.
■ ■ ■