safe midwifery staffing for maternity settings
TRANSCRIPT

1
2
3
4
5
6
Safe midwifery staffing for maternity settings 7
8
The relationship between midwifery staffing at a local level and maternal 9
and neonatal outcomes, and factors affecting these requirements 10
11
Evidence Review 1 12
13
A report for the National Institute for Health and Care Excellence 14
Prepared by Bazian Ltd. 15
Version: 4 16
17
18
19
20
21
22
23
24
25
26
27
28
29
30
31
32
33
34
35
36
37
Terms of Use 38
This analysis has been produced by Bazian Ltd for NICE. It must not be distributed to, or accessed or used by, anyone else 39
without prior written permission from Bazian Ltd. Commercial use is not permitted without prior written agreement from 40
Bazian. Bazian Ltd has taken care in the preparation of this literature search, but makes no warranty as to its accuracy 41
and will not be liable to any person relying on or using it for any purpose. 42
43
Acknowledgements 44
We would like to thank the NICE project team (Lorraine Taylor, Sheryl Warttig, Thomas Hudson, and 45
Jasdeep Hayre) for performing the searches and for their support in producing the review. 46
47
We also thank Sandall J, Murrells T, Dodwell M, Gibson R, Bewley S, Coxon K et al. (2014) for use of 48
the report “The efficient use of the maternity workforce and the implications for safety & quality in 49
maternity care. Health Service and Delivery Research 2014; in press”. 50
51
The Sandall et al. project was funded by the Health Service and Delivery Research Programme 52
(10/1011/94) and will be published in full in the Health Service and Delivery Research journal. 53
Further information available at: http://www.nets.nihr.ac.uk/projects/hsdr/10101194 54
55
The version of Sandall et al. that was considered in this evidence review and by the Safe Staffing 56
Advisory Committee was a draft version of the manuscript dated May 2014. That version underwent 57
a full peer and editorial review process in line with the NIHR Journals Library policy.58

Page 3 of 129
Bazian Ltd Registered office: 25 St James's Street, London, SW1A 1HG
Company Registered in England and Wales No: 3724527. VAT Registration No. 340 4368 76.
Contents 59
Table of abbreviations .............................................................................................. 4 60
Executive summary ............................................. 5 1.61
Introduction .......................................................................................................... 5 62
Methods ............................................................................................................... 5 63
Results ................................................................................................................ 5 64
Discussion and conclusions ......................................................................................... 6 65
Introduction ..................................................... 7 2.66
Context ............................................................................................................... 7 67
Aims and objectives of the review ................................................................................ 7 68
Identification of possible equality and equity issues ........................................................... 8 69
Review team ......................................................................................................... 9 70
Methods .......................................................... 9 3.71
Search methods ...................................................................................................... 9 72
Sifting of studies and full text appraisal ......................................................................... 9 73
Quality assessment and applicability appraisal ................................................................ 11 74
Methods of data extraction, synthesis and presentation ..................................................... 11 75
In press information ................................................................................................ 11 76
Findings ........................................................ 12 4.77
Question 1: What maternal and neonatal activities and outcomes are associated with midwifery 78
staffing at a local level? ........................................................................................... 12 79
Questions 2-6: What factors affect safe midwifery staffing at a local level? .............................. 34 80
Question 2: What maternal and neonatal factors affect midwifery staffing requirements, at any point 81
in time, at a local level? ........................................................................................... 37 82
Question 3: What environmental factors affect safe midwifery staffing requirements? ................. 53 83
Question 4: What staffing factors affect safe midwifery staffing requirements at a local level? ....... 66 84
Question 5: What unit level management factors affect midwifery staffing requirements? ............. 74 85
Question 6: What organisational factors influence safe midwifery staffing at a unit level? ............. 77 86
Discussion ...................................................... 78 5.87
Appendix A: Bibliography .................................... 82 7.88
Included studies (n=8) ............................................................................................. 82 89
Studies excluded at full text appraisal (n=141) ................................................................ 84 90
Appendix B: Study protocol/methods ...................... 94 8.91
Operational definitions ............................................................................................ 94 92
Process overview ................................................................................................... 94 93
Appendix C: Search Strategy ............................... 112 9.94
Appendix D: Evidence tables ............................. 129 10.95
96
97
98
99
100

Page 4 of 129
Bazian Ltd Registered office: 25 St James's Street, London, SW1A 1HG
Company Registered in England and Wales No: 3724527. VAT Registration No. 340 4368 76.
Table of abbreviations 101
AMU Alongside midwifery unit
AR Absolute risk
CEFM Continuous Electronic Fetal Monitoring
CI Confidence interval
C-Section Caesarean section
DwBI Delivery with bodily integrity
FMU Free standing midwifery unit
FTE Full time equivalent
HIE Hypoxic ischaemic encephalopathy
IVD instrumental vaginal delivery
MW:LW Midwives: Labouring women
LBW Low birthweight
MVA Multivariate analysis
NA Not applicable
NHS National Health Service
NICE National Institute for Heath and Clinical Excellence
NICE CG NICE Clinical Guideline
NICE QS NICE Quality Standard
NICU Neonatal Intensive Care Unit
NNU Neonatal unit
NR Not reported
NSCCRT North Staffordshire Changing Childbirth Research Team
OECD Organisation for Economic Cooperation and Development
O&G Obstetrics and gynaecology
OR Odds ratio
OU Obstetric unit
PPH Postpartum Haemorrhage
RCOG Royal College of Obstetrics and Gynaecology
RCT Randomised controlled trial
RR Relative risk
SCBU Special Care Baby Unit
SD Standard deviation
SE Standard error
SHA Strategic Health Authority
SSBR Birth weight standardised stillbirth rate
SVD Spontaneous vaginal delivery
UVA Univariate analysis
VLBW Very low birthweight

Page 5 of 129
Bazian Ltd Registered office: 25 St James's Street, London, SW1A 1HG
Company Registered in England and Wales No: 3724527. VAT Registration No. 340 4368 76.
Executive summary 1.102
Introduction 103
The National Institute for Health and Care Excellence (NICE) has been asked by the Department of 104
Health and NHS England to develop an evidence-based guideline on safe staffing in maternity settings. 105
106
This review is one of one of a series of reviews to inform the maternity safe staffing guideline. It aims 107
to explore evidence to inform guidance related to the following six questions, set out in the scope: 108
109
● Question 1: What maternal and neonatal activities and outcomes are associated with midwifery 110
staffing at a local level? 111
● Question 2: What maternal and neonatal factors affect midwifery staffing requirements, at any 112
point in time, at a local level? 113
● Question 3: What environmental factors affect safe midwifery staffing requirements? 114
● Question 4: What staffing factors affect safe midwifery staffing requirements at a local level? 115
● Question 5: What unit level management factors affect midwifery staffing requirements? 116
● Question 6: What organisational factors influence safe midwifery staffing at a unit level? 117
118
Question 7 in the final scope about approaches for identifying midwifery staffing requirements and 119
skill mix at a local level, and the economic aspects of safe maternity staffing are being reviewed 120
separately in related reports. 121
122
Methods 123
Systematic searches were performed in June 2014 (see Appendix for details). The review considered 124
English language primary studies from 1998 and onwards. Studies had to be performed in Organisation 125
for Economic Cooperation and Development (OECD) countries for inclusion. Primary research assessing 126
the relationship between midwife staffing levels and the outcomes specified in the scope (Question 127
1), and modifiers of this relationship (Question 2-6) were included. 128
129
Studies were critically appraised using an adapted version of the NICE quality appraisal checklists for 130
quantitative studies reporting correlations and for intervention studies. Evidence was synthesised 131
narratively. 132
133
Results 134
Of the 6,672 studies (including duplicates) identified, 8 primary studies were included, all of which 135
were carried out in the UK. These included 1 RCT, 2 cohort studies, and 5 correlational studies. One 136
study was of low quality [-], six of moderate quality [+], and one of good quality [++]. Only the RCT 137
and cohort studies allowed assessment of midwife staffing before, or at the point of, the outcomes 138
occurring. Therefore only these studies allow assessment of whether midwife staffing levels might be 139
directly contributing to the outcomes seen. 140
141
Overall few significant associations between midwife staffing levels and outcomes were identified. 142
The evidence suggests that increased midwife staffing may be associated with an increased likelihood 143
of delivery with bodily integrity (no uterine damage, 2nd/3rd/4th degree tear, stitches, episiotomy, 144
or C-section), reduced maternal readmissions within 28 days, and reduced decision-to-delivery times 145
for emergency C-sections. However, it may not be associated with overall C-section rates, composite 146
Page 6 of 129
Bazian Ltd Registered office: 25 St James's Street, London, SW1A 1HG
Company Registered in England and Wales No: 3724527. VAT Registration No. 340 4368 76.
‘healthy mother’ or ‘health baby’ outcomes, rates of ‘normal’ or ‘straightforward’ births, or stillbirth 147
or neonatal mortality. 148
149
No studies were identified which assessed the links between midwife staffing and on maternal 150
mortality or never events (such as maternal death due to post-partum haemorrhage after elective 151
caesarean section, wrongly prepared high-risk injectable medication, intravenous administration of 152
epidural medication, or retained foreign objects post-procedure) or serious fetal/neonatal events 153
such as Erb’s palsy secondary to shoulder dystocia, meconium aspiration syndrome, hypoxic ischaemic 154
encephalopathy (HIE). 155
156
These studies provided limited evidence on potential modifiers of the effect of midwife staffing levels 157
on outcomes. Maternal clinical risk and parity were the only factors which were formally tested for an 158
interaction. Both appear to be modifiers of the effect of midwife staffing levels on outcomes, and 159
also themselves appear to have a large impact on outcomes. 160
161
Discussion and conclusions 162
Overall there is limited evidence, with relatively few relevant studies (8 studies included), and most 163
of these using correlational designs, which limits their ability to determine causality. All of the 164
included studies were carried out in the UK, so it is likely to be applicable to the NHS in England. 165
While the number of studies is small, some of these have analysed recent data (2008-2011), and have 166
analysed data for over 600,000 births across the majority of trusts within England. Most of the 167
outcomes assessed are intrapartum outcomes, and none of the studies looked at the relationship 168
between midwife staffing and outcomes specifically within alongside or freestanding midwifery units, 169
or for births at home. This limits applicability to these settings and to outcomes outside of the 170
intrapartum period. 171
172
Only one study formally assessed the interaction between modifying factors and midwife staffing 173
levels. This study found that maternal clinical risk and parity showed significant interaction with 174
midwife staffing for various maternal and neonatal outcomes. Limited conclusions can be drawn 175
regarding the effects of other modifying factors on safe midwife staffing requirements. 176
177

Page 7 of 129
Bazian Ltd Registered office: 25 St James's Street, London, SW1A 1HG
Company Registered in England and Wales No: 3724527. VAT Registration No. 340 4368 76.
Introduction 2.178
Context 179
The National Institute for Health and Care Excellence (NICE) has been asked by the Department of 180
Health and NHS England to develop an evidence-based guideline on safe staffing of maternity 181
settings. NICE was identified in the high profile Francis report on Mid Staffordshire (2010) and the 182
Berwick report on improving the safety of patients in England (2013) as a lead organisation in 183
developing advice on NHS staffing. 184
185
A number of recent reports have also highlighted the need for safe staffing guidelines, including: 186
House of Commons Public Accounts Committee (2014) Maternity services in England 187
National Audit Office (2013) Maternity services in England 188
National Quality Board (2013) How to ensure the right people, with the right skills, are in the 189
right place at the right time – a guide to nursing, midwifery and care staffing capacity and 190
capability 191
Department of Health (2013) Hard truths: the journey to putting patients first 192
King’s Fund (2011) Staffing in maternity units. Getting the right people in the right place at 193
the right time 194
King’s Fund (2008) Safe births: everybody’s business. An independent inquiry into the safety 195
of maternity services in England 196
RCOG, RCM, RCA, RCPCH (2007) Safer childbirth. Minimum standards for the organisation and 197
delivery of care in labour. 198
The WI and NCT (2013) Support overdue: women’s experiences of maternity services 199
200
The need for staffing in maternity settings to be reviewed is influenced by a number of factors, 201
including the increasing numbers of births in the UK annually, and population trends such as the 202
increasing prevalence of obesity, older age at first pregnancy, increasing use of fertility treatments, 203
and other socio-demographic factors leading to greater medical and social complexity of pregnancies 204
and births. In addition, there are greater expectations for personalised care (Department of Health 205
2007 and 2010), and changing service delivery models which include movement towards women 206
choosing their birth location. 207
208
Midwifery roles are also changing, including changes to antenatal roles such as antenatal scanning and 209
health improvement messages, to care in labour such as provision of critical care, and to postnatal 210
roles, such as newborn checks and safeguarding, and the resulting administrative demands of these 211
changes. The potential for litigation also means that maternity services carry higher insurance costs 212
than other services. 213
214
Aims and objectives of the review 215
This evidence review aims to covers six questions set out in the final scope for the ‘Safe midwifery 216
staffing for maternity settings’ guideline: 217
218
● Question 1: What maternal and neonatal activities and outcomes are associated with midwifery 219
staffing at a local level? 220
o Is there evidence that demonstrates a minimum staffing threshold of safe midwifery 221
care at a local level? 222
223

Page 8 of 129
Bazian Ltd Registered office: 25 St James's Street, London, SW1A 1HG
Company Registered in England and Wales No: 3724527. VAT Registration No. 340 4368 76.
● Question 2: What maternal and neonatal factors affect midwifery staffing requirements, at any 224
point in time, at a local level? These include: 225
o Number of women pregnant or in labour 226
o Maternal risk factors including medical and social complexity and safeguarding 227
o Neonatal needs 228
o Stage of the maternity care pathway (e.g. antenatal, intra-partum, postnatal) 229
230
● Question 3: What environmental factors affect safe midwifery staffing requirements? These 231
include: 232
o Local geography and demographic 233
o Birth settings and unit size and physical layout 234
235
● Question 4: What staffing factors affect safe midwifery staffing requirements at a local level? 236
These include: 237
o Midwifery skill mix 238
o Availability of and care provided by other healthcare staff (e.g. maternity support 239
workers, obstetricians, anaesthetists, paediatricians and specialist midwives) 240
o Requirements to provide additional services (e.g. high dependency care, public 241
health roles, vaccinations) 242
243
● Question 5: What unit level management factors affect midwifery staffing requirements? These 244
include: 245
o Maternity team management and administration approaches 246
o Models of midwifery care (e.g. caseloading/named midwife/social enterprises) 247
o Staff and student supervision and the supernumerary arrangements 248
249
● Question 6: What organisational factors influence safe midwifery staffing at a unit level? These 250
include: 251
o Management structures and approaches 252
o Organisational culture 253
o Organisational policies and procedures, including staff training 254
255
Question 7 in the final scope (relating to approaches for identifying midwifery staffing requirements 256
and skill mix at a local level such as toolkits) and the economic aspects of safe maternity staffing 257
have been reviewed separately. 258
259
Identification of possible equality and equity issues 260
The review covers all maternity service provision by midwives, and aims to identify factors which 261
modify safe midwifery staffing. The factors being assessed may include factors relating to 262
inequalities, such as maternal risk factors including age as well as social complexity and safeguarding, 263
and local demographic factors such as deprivation and ethnicity. Where these factors are identified as 264
affecting safe midwifery staffing this will be described. 265
266
In addition, outcomes of interest include NICE standards for delivery of midwifery care, some of 267
which relate to groups who may experience equalities in care, such as that women with complex 268
social factors accessing appropriate services (NICE clinical guideline [CG] 10), and completion of 269
screening questions for previous or current mental health problems at first antenatal and postnatal 270
contact (CG45; NICE quality standard 37). 271
Page 9 of 129
Bazian Ltd Registered office: 25 St James's Street, London, SW1A 1HG
Company Registered in England and Wales No: 3724527. VAT Registration No. 340 4368 76.
272
Review team 273
Searches for the review were carried out by NICE, and all subsequent stages of the review carried out 274
by Bazian Ltd. 275
276
Methods 3.277
This systematic review was conducted in accordance with the draft Developing NICE guidelines 278
manual. The protocol for the methods of the review are presented in Appendix B. 279
280
Search methods 281
The search was carried out by a NICE information specialist and detailed methods for the search are 282
provided in Appendix C. 283
284
Briefly, searches were performed in literature databases (Medline and Medline-in process, Embase, 285
Cochrane Database of Systematic Reviews, Database of Abstracts of Reviews of Effects, Health 286
Management Information Consortium, Cochrane Central Register of Controlled Trials, Health 287
Technology Assessment Database, Cumulative Index to Nursing and Allied Health, British Nursing 288
Index) and on key websites in June 2014. Systematic reviews were used for citation searching and as 289
sources of potentially relevant primary studies. The search included English language primary studies 290
from 1998 and onwards. This is because midwifery practices have advanced over the years, making 291
older studies of limited relevance to midwifery practice today. This cut-off date was chosen following 292
advice from a topic expert. Studies also had to be performed in Organisation for Economic 293
Cooperation and Development (OECD) countries for inclusion, to increase relevance of included 294
evidence to the UK setting. 295
296
Sifting of studies and full text appraisal 297
The searches retrieved 5,526 unique citations, these were read at title level to remove any clearly 298
non-relevant material (first pass appraisal, see protocol in Appendix B for details). This led to the 299
selection of 748 studies to be appraised at title and abstract level (second pass appraisal, see 300
Appendix B). An additional 55 studies (46 after duplicates removed) were identified as potentially 301
relevant during appraisal of the searches for the related reviews or through citation in relevant 302
studies, or through submission to NICE. These studies were also appraised at title and abstract level. 303
Of these 794 studies, 149 citations were selected for retrieval and full text appraisal using the same 304
criteria as the second pass appraisal. Five of the selected studies were not able to be obtained in full 305
text (see Appendix A for references); assessment of their titles and abstracts suggested that they 306
were not of high relevance to the current review (likely to be news items, be in isolated populations 307
potentially of low relevance to the NHS, or assess methods of calculating required for midwife 308
staffing). Of the full texts appraised, 8 studies were selected for inclusion (see Figure 1 for PRISMA 309
flowchart). Details of studies excluded at full text appraisal and reasons for their exclusion are 310
provided in Appendix A. A 10% double appraisal was conducted at the three sifting levels, and good 311
inter-rater agreement was achieved (first pass: 96.6%; second pass: 87.3%; full text: 100%). 312
313
314

Page 10 of 129
Bazian Ltd Registered office: 25 St James's Street, London, SW1A 1HG
Company Registered in England and Wales No: 3724527. VAT Registration No. 340 4368 76.
315
316
Figure 1: PRISMA flowchart 317
318

Page 11 of 129
Bazian Ltd Registered office: 25 St James's Street, London, SW1A 1HG
Company Registered in England and Wales No: 3724527. VAT Registration No. 340 4368 76.
Quality assessment and applicability appraisal 319
Quality was assessed using modified versions of the checklists in the draft NICE unified methods 320
manual for ‘quantitative studies reporting correlations and associations’ for the correlation and 321
cohort studies, and for ‘quantitative intervention studies’ for the RCT (see protocol in Appendix B for 322
details). Modifications were made to remove less relevant items from the checklists (e.g. given the 323
type of intervention being studies blinding was not feasible, therefore the item on blinding was 324
removed), or to make more relevant to the current review by making the considerations under the 325
individual items more specific (e.g. under item 4.2 in the correlation study checklist on analytical 326
methods, querying whether there was adjustment for clustering of data in units/wards/hospitals, and 327
adjustment/control for ward/unit/hospital characteristics where relevant). 328
329
Quality ratings include: 330
● [++] All or most of the checklist criteria have been fulfilled, and where they have not been 331
fulfilled the conclusions are very unlikely to alter. 332
● [+] Some of the checklist criteria have been fulfilled, and where they have not been fulfilled, or 333
are not adequately described, the conclusions are unlikely to alter. 334
● [-] Few or no checklist criteria have been fulfilled and the conclusions are likely or very likely to 335
alter. 336
337
Methods of data extraction, synthesis and presentation 338
Study data was extracted into evidence tables based on the draft NICE unified manual (see Appendix). 339
Evidence table templates were agreed with NICE prior to data extraction. All quantitative outcomes 340
were verified by a second analyst. 341
342
The evidence was synthesised by outcome for each question, presented both narratively and 343
summarised in table form. 344
345
In press information 346
The included study by Sandall et al. was in press at the time of drafting of this report. The version of 347
Sandall et al. that was considered in this evidence review and by the Safe Staffing Advisory 348
Committee was a draft version of the manuscript dated May 2014. That version underwent a full 349
peer and editorial review process in line with the NIHR Journals Library policy.350

Page 12 of 129
Bazian Ltd Registered office: 25 St James's Street, London, SW1A 1HG
Company Registered in England and Wales No: 3724527. VAT Registration No. 340 4368 76.
Findings 4.351
Question 1: What maternal and neonatal activities and outcomes are associated 352
with midwifery staffing at a local level? 353
Overview of studies 354
Eight studies were identified which assessed the relationship between outcomes and midwife staffing. 355
The characteristics of these studies are summarised in Tables 1 and 2, with further details provided in 356
the accompanying Evidence tables in Appendix D. 357
358
Seven of the 8 studies were observational. The eighth study was a cluster RCT with randomisation at 359
the level of the geographical area. Broadly, the analyses provided by the 8 included studies were as 360
follows: 361
Sandall et al. in press (quality score ++) looked at the correlation between trust level 362
midwife staffing and outcomes 363
Rowe et al. 2014 (quality score +) looked at the correlation between unit level midwife 364
under staffing and outcomes 365
Cerbinskaite et al. 2011 (quality score -) looked at the association between delivery suite 366
midwife staffing at the time of time of emergency C-section and outcomes 367
Gerova et al. 2010 (quality score +) looked at the correlation between trust level midwife 368
staffing and outcomes 369
Tucker et al. 2003 (quality score +) looked at the association between unit staffing at the 370
time of admission and outcomes 371
Joyce et al. 2002 (quality score +) and Joyce et al. 2004 (quality score +) looked at the 372
correlation between hospital level midwife staffing and outcomes using the same data set 373
North Staffordshire Changing Childbirth research team (NSCCRT) 2000 (quality score +) 374
was a cluster RCT comparing the effects of midwifery caseload care versus traditional shared 375
care on outcomes, and reported caseloads in both groups. 376
377
Five correlational studies assessed staffing levels averaged across the study time period and outcomes 378
in that period (Sandall et al. in press [++], Rowe et al. 2014 [+], Gerova et al. 2010 [+], Joyce et al. 379
2002 [+], Joyce et al. 2004 [+]). Two cohort studies assessed the relationship between staffing levels 380
at the time of each woman’s admission/delivery (Tucker et al. 2003 [+]) or delivery (Cerbinskaite et 381
al. 2011 [-]) and outcomes. The latter (Cerbinskaite et al. 2011 [-]) assessed staffing levels and each 382
woman’s outcome simultaneously (i.e. cross-sectionally). 383
384
The studies included between 1 unit or hospital and 64 units (where stated), with 2 studies assessing 385
all births within 143 or 144 NHS trusts. The smallest study assessed 333 grade 1 and 2 emergency C-386
section births, while the largest assessed all 665,969 births across 143 NHS trusts. 387
388
The average midwife staffing levels in the observational studies were between 31.5 to 33.8 births per 389
midwife full time equivalent (FTE) per annum where stated. The only study that reported consultant 390
midwife staffing levels reported 1,642.5 births per consultant midwife FTE per annum across the 144 391
NHS trusts assessed (Gerova et al. 2010 [+]). 392
393
Seven studies covered maternal outcomes and 4 studies covered fetal/neonatal outcomes (some 394
studies covered both types of outcomes). 395
396
397
Page 13 of 129
Bazian Ltd Registered office: 25 St James's Street, London, SW1A 1HG
Company Registered in England and Wales No: 3724527. VAT Registration No. 340 4368 76.
Methodological and applicability considerations 398
The 2 cohort studies and 1 RCT provide a more direct assessment of the potential for a causal 399
association between staffing levels and outcomes, as the staffing levels are known to be in effect 400
before (or at the same time as) the outcomes occur. In the correlational studies staffing levels and 401
outcomes are both assessed as an average over the study period. Therefore they would not be able to 402
detect changes in staffing levels and outcomes over time. This could reduce ability to detect 403
relationship between midwife staffing and outcomes. 404
405
As outcomes are assessed at the same time as staffing levels in these correlational studies they may 406
also be affected by reverse causation. For example, a unit may staff differently as a result of the case 407
mix of women they see, potentially having higher staffing levels if they anticipate more complex case 408
mixes. This could impact the relationships seen between staffing levels and outcomes if the case mix 409
is not adequately adjusted for. 410
411
The 2 studies carrying out analyses at the trust level (Sandall et al. in press [++] and Gerova et al. 412
2010 [+]) would not be able to identify variation in outcomes associated with differences in staffing at 413
the local (individual unit) level. This may also reduce ability to detect effect of staffing at the local 414
level. However, due to the limited amount of data available assessing the impact of midwife staffing, 415
these trust-level studies have been included. 416
417
The RCT reported caseloads for the two groups (35-40 women per midwife in the caseload group, a 418
“caseload” of 100-150 women in the shared care group), but it was unclear how this related to overall 419
staffing at the level of midwives per woman as the number of midwives was not clearly stated for the 420
shared care group. Therefore, although the pattern of how the women were cared for was clear, it 421
was not clear that overall the groups differed in the average number of women per midwife. In 422
addition, the RCT aimed to compare models of care (specifically care division or distribution) rather 423
than the effect of different staffing levels, and although staffing levels may have differed, the 424
outcomes are likely to reflect the overall effect of the different models of care, rather than staffing 425
levels specifically. 426
427
Only one study described any aspect of skill mix (Gerova et al. 2010 [+]), and it described the number 428
of consultant midwives and midwives separately (unclear if the consultant midwives were included in 429
the midwife total). None of the other studies explicitly described the skill mix, type or duties of the 430
midwives. Four studies (Joyce et al. 2002 [+], Joyce et al. 2004 [+], Tucker et al. 2003 [+], Rowe et 431
al. 2010 [+]) assessed midwife staffing at the hospital/obstetric unit level, these staffing figures 432
presumably cover staff providing all midwifery care at that hospital/unit, which could include 433
antenatal and postnatal care as well as intrapartum care. One study (Cerbinskaite et al. 2011 [-]) 434
specifically looked at midwife staffing of the delivery suite at the time of delivery and therefore was 435
focused specifically on intrapartum staffing. The RCT (NSCCRT 2000 [+]) looked at staffing within 436
study areas, with duties for caseload midwives at least likely to cover all stages of care. The 2 studies 437
assessed staffing at the trust level, which is also likely to include midwives involved in all stages of 438
midwife care (Sandall et al. in press [++], Gerova et al. 2010 [+]). 439
440
441
442
443
444
445

Page 14 of 129
Bazian Ltd Registered office: 25 St James's Street, London, SW1A 1HG
Company Registered in England and Wales No: 3724527. VAT Registration No. 340 4368 76.
446
Table 1: Included study characteristics – study designs and participants 447
Study
Quality score
Years
studied
Country Study design # women/births
/deliveries
Outcomes assessed Key participant inclusions
/exclusions
Sandall et al. in press
Quality score: ++
2010-2011 UK (England) Correlational 665,969 births Maternal: Healthy mother (also composite healthy
mother and baby), DwBI, SVD, intact perineum,
normal birth, elective C-section, emergency C-
section, all C-section
Fetal/neonatal: Healthy baby (also composite
healthy mother and baby)
None
Rowe et al. 2014
Quality score: +
2009-2010 UK (England) Correlational 32,257 births Maternal: Straightforward birth, normal birth,
intrapartum C-section, IVD, epidural, augmentation
Fetal/neonatal: None
Only low risk women with full
term births planned to be in the
obstetric unit included (C-sections
before labour, multiple
pregnancies, or stillbirths before
labour were excluded)
Cerbinskaite et al.
2011
Quality score: -
2006 UK (England) Cohort (cross
sectional
analysis)
333 grade 1 & 2 C-
sections
(5,167 births)
Maternal: Decision-to-delivery interval, transfer time
to theatre, time between arrival in theatre to
operation start
Fetal/neonatal: None
Only grade 1 and 2 emergency C-
section births included in midwife
staffing analyses. Time of day
analyses excluded elective C-
section births
Gerova et al. 2010
Quality score: +
2008-2009 UK (England) Correlational 615,042 women Maternal: Maternal readmission within 28 days
Fetal/neonatal: None
None
Joyce et al. 2004
Quality score: +
1994-1996 UK (England) Correlational 540,834 births Maternal: None
Fetal/neonatal: Still birth, neonatal mortality
None
Page 15 of 129
Bazian Ltd Registered office: 25 St James's Street, London, SW1A 1HG
Company Registered in England and Wales No: 3724527. VAT Registration No. 340 4368 76.
Study
Quality score
Years
studied
Country Study design # women/births
/deliveries
Outcomes assessed Key participant inclusions
/exclusions
Tucker et al. 2003
Quality score: +
2000 UK (Scotland) Cohort 3,083 births Maternal: None
Fetal/neonatal: CEFM use, inappropriate or
appropriate CEFM, lag time for senior doctor response
to serious fetal heart trace abnormality, neonatal
resuscitation
Only non-multiple, non-elective
C-section live births included in
analysis of fetal outcomes
Joyce et al. 2002
Quality score: +
1994-1996 UK (England) Correlational 540,834 births Maternal: C-section, epidural use in labour, IVD
Fetal/neonatal: None
None
NSCCRT 2000
Quality score: +
NR UK (England) Cluster RCT 1,505 women Maternal: Duration of labour, method of delivery
(normal, IVD, emergency or elective C-section,
multiple and breech delivery), gestation length,
attended by known midwife, induction,
augmentation, episiotomy, intact perineum, perineal
laceration or tear
Fetal/neonatal: Stillbirth and neonatal death,
advanced neonatal resuscitation, admission to NNU,
low birthweight
None
C-section caesarean section, CEFM continuous electronic fetal monitoring, DwBI delivery with bodily integrity, IVD instrumental vaginal delivery, NNU neonatal unit, NR 448
not reported, NSCCRT North Staffordshire Changing Childbirth Research Team, RCT randomised controlled trial449

Page 16 of 129
Bazian Ltd Registered office: 25 St James's Street, London, SW1A 1HG
Company Registered in England and Wales No: 3724527. VAT Registration No. 340 4368 76.
Table 2: Included study characteristics – units and staffing 450
Study (overall quality
score)
# units/ hospitals/
trusts
Type(s) of delivery unit(s) Level at which staffing assessed Average midwife staffing level
Sandall et al. in press
Quality score: ++
143 NHS trusts Mixed. Consultant led with
or without midwife led
(alongside or freestanding)
Staffing at trust level (i.e. across all stages of
care) across the study period
3.08 FTE midwives per 100 maternities (32.5 maternities
per FTE midwife)
Rowe et al. 2014
Quality score: +
36 obstetric units NR (likely consultant-led) Staffing at the obstetric unit level across the
study period
NR (median 29.6% of shifts per trust where number of
women>number of midwives)
Cerbinskaite et al. 2011
Quality score: -
1 obstetric unit NR (tertiary referral
hospital)
Delivery suite staffing at the time of C-
section
NR
Gerova et al. 2010
Quality score: +
144 NHS trusts NR (likely to have been
mixed)
Staffing at trust level (i.e. across all stages of
care) across the study period
31.5 births per midwife FTE pa
1,642.5 births per consultant midwife FTE pa
Joyce et al. 2004
Quality score: +
64 obstetric units Consultant-led Staffing at hospital level across the study
period
29.6 midwives per 1,000 deliveries pa (33.8 deliveries per
midwife pa; unclear if FTE)
Tucker et al. 2003
Quality score: +
23 obstetric units Consultant-led Staffing on the unit at the time of admission
(assessed 4 times a day)
NR (15% of observations where number of women>number
of midwives)
Joyce et al. 2002
Quality score: +
64 obstetric units Consultant-led Staffing at hospital level across the study
period
29.6 midwives per 1,000 deliveries pa (33.8 deliveries per
midwife pa; unclear if FTE)
NSCCRT 2000
Quality score: +
1 hospital (32 GP
practices in 6 areas)
NR (district general
hospital)
Included community and hospital midwives,
who provided all stages of care across the
study period
NR (Caseload care group had a caseload of 35-40 women
per midwife, standard care group had a caseload of 100-
150 women)
FTE full time equivalent, GP general practitioner, NHS National Health Service, NR not reported451

Page 17 of 129
Bazian Ltd Registered office: 25 St James's Street, London, SW1A 1HG
Company Registered in England and Wales No: 3724527. VAT Registration No. 340 4368 76.
The majority of the outcomes assessed by the studies related to intrapartum care, with some 452
outcomes addressing postnatal care (mainly neonatal outcomes likely to occur while the neonate was 453
still in hospital and one maternal readmission outcome). None of the studies assessed outcomes 454
specifically relating to the antenatal period, such as access to antenatal care before 10 weeks, access 455
to appropriate antenatal services for women with complex social factors, or women being offered a 456
minimum set of antenatal test results. 457
458
None of the studies looked specifically at the relationship between midwife staffing in alongside or 459
freestanding midwifery units or of midwives providing home births and outcomes. 460
461
The studies by Joyce et al. analysed data from 1994 to 1996, and the RCT was carried out prior to 462
2000, and their results may not be representative of current UK practice. 463
464
465
Summary of evidence/results 466
The evidence has been split by outcome into maternal and neonatal outcomes. A top level summary 467
of findings of the association between midwife staffing levels and maternal and neonatal outcomes is 468
presented in Table 3. 469

Page 18 of 129
Bazian Ltd Registered office: 25 St James's Street, London, SW1A 1HG
Company Registered in England and Wales No: 3724527. VAT Registration No. 340 4368 76.
Table 3: Overview of study results for Question 1 470
Outcome
Number of
women/births
n= (range)
Direction of effect of increased midwife
staffing on outcome:
(number of studies and quality score)
Increase No association Reduction
Maternal outcomes
Delivery with bodily integrity 665,969 1 ++
Attended by known midwife in labour 1,505 1 +
Duration of labour 1,505 1 +
Straightforward birth 32,257 1 +
Emergency C-section process timings 333 1 -
Maternal readmissions within 28 days 615,042 1 +
Any caesarean section 540,834 to 665,969 1 ++, 1 +
Elective caesarean section 1,505 to 665,969 1 ++, 1 +
Healthy mother 665,969 1 ++
Normal birth 1,505 to 665,969 1 ++, 2+
Non-intact perineum 1,505 1 +
Multiple and breech delivery 1,505 1 +
Instrumental vaginal delivery 1,505 to 540,834 3 +
Spontaneous vaginal delivery 665,969 1 ++
Induction 1,505 1 +
Intact perineum 1,505 to 665,969 1 ++ 1 +
Emergency caesarean section 1,505 to 665,969 1 + 1 ++, 1 +
Augmentation 1,505 to 32,257 1 + 1 +
Epidural use 1,505 to 540,834 2 + 1 +
Maternal mortality or never events No evidence
Other delivery of care outcomes No evidence
Fetal/neonatal outcomes
Healthy baby 665,969 1 ++
Stillbirth and neonatal mortality 1,505 to 540,834 2 +
Neonatal resuscitation 1,505 to 3,083 1 + 1 +
Neonatal unit admission 1,505 to 3,083 2 +
Gestational length 1,505 1 +
Low birth weight 1,505 1 +
Apgar score of <7 at 5 minutes 3,083 1 +
Continuous electronic fetal monitoring 3,083 1 +
Other fetal/neonatal outcomes No evidence
471

Page 19 of 129
Bazian Ltd Registered office: 25 St James's Street, London, SW1A 1HG
Company Registered in England and Wales No: 3724527. VAT Registration No. 340 4368 76.
Maternal outcomes 472
Seven studies assessed maternal outcomes (Sandall et al. in press [++]; Rowe et al. 2014 [+]; 473
Cerbinskaite et al. 2011 [-]; Gerova et al. 2010 [+]; Tucker et al. 2003 [+]; Joyce et al. 2002 [+]; 474
NSCCRT 2000 [+]) and their results are summarised in Tables 4 to 6. Similar outcomes have been 475
grouped together, with sections for overall and perineal outcomes, mode of birth outcomes, and 476
delivery of care outcomes. However, many of the outcomes are related (e.g. some outcomes are 477
composites of other outcomes which have also been assessed). 478
479
Overall and perineal outcomes 480
One large correlational study (Sandall et al. in press [++]) across 143 NHS trusts in England (665,969 481
births) reported on the composite outcome of “healthy mother” (delivery with bodily integrity, 482
return home in 2 days or less, and no instrumental delivery, maternal sepsis, anaesthetic 483
complication, or readmission within 28 days). It found no significant association between the ratio of 484
FTE midwives to maternities at trust level and the healthy mother outcome, although the direction of 485
effect was towards a small benefit (OR 1.088, 95% CI 0.963 to 1.230, p=0.1759). 486
487
When it looked at delivery with bodily integrity alone (no uterine damage, 2nd/3rd/4th degree tear, 488
stitches, episiotomy, or C-section) higher midwife staffing was associated with a small but significant 489
increase in odds of delivery with bodily integrity (OR 1.110, 95% CI 1.005 to 1.227, p=0.0399). 490
491
The study carried out sensitivity analyses in the 50 trusts with only a single obstetric unit (i.e. 492
reducing the analyses to effectively a unit level analysis plus home births within the trust). These 493
analyses found that the size of the effect of midwife staffing on delivery with bodily integrity (β 494
increased from 0.105 to 0.113) and intact perineum (main analyses for the latter reported below, β 495
increased from 0.124 to 0.147, ORs not reported) increased relative to the trust level analyses, but 496
the relationship became non-significant. This suggests that the effect of midwife staffing may remain 497
when analysed at the unit level, but that these analyses lack power to detect this effect. 498
499
This large correlational study (Sandall et al. in press [++]) and one RCT (NSCCRT 2000 [+]) looked at 500
the outcome of intact perineum. Sandall et al. in press [++] found that higher midwife staffing was 501
associated with increased odds of intact perineum (OR 1.132, 95% CI 1.010 to 1.268, p=0.0324). The 502
RCT compared caseload midwifery (35-40 women per midwife) versus shared care (caseload reported 503
as 100-150 women, but midwives would share care of these women). It found no significant difference 504
in likelihood of having an intact perineum between the groups (absolute risk 48% with caseload care 505
vs. 49% with shared care, p=0.72). The RCT also found no significant difference between caseload 506
care and shared care in perineal laceration, tears, or episiotomy. The differences between groups in 507
the RCT for these outcomes were very small, but tended to favour shared care. 508
509
The RCT found that the duration of labour was significantly longer in the caseload group than the 510
shared care group (duration <8 hours: 58.5% with caseload care vs. 68.4% with shared care; p≤0.001 511
for trend across durations). The authors suggested that this could be due to earlier identification of 512
labour in the caseload group, with midwives seeing women at home. 513
514
515
Page 20 of 129
Bazian Ltd Registered office: 25 St James's Street, London, SW1A 1HG
Company Registered in England and Wales No: 3724527. VAT Registration No. 340 4368 76.
Table 4: Summary of association between midwife staffing and maternal outcomes (overall and perineal outcomes; plus one mode of birth outcome) 516
Study Staffing
variable
Healthy
mother*
Delivery with
bodily
integrity*
Duration of
labour
Intact
perineum
Perineal
laceration
Perineal tear Episiotomy Multiple and
breech
delivery
Sandall et al. in
press
FTE
midwives/100
maternities
(↑)
OR 1.088 (95%
CI 0.963 to
1.230,
p=0.1759)
↑
OR 1.110
(95% CI 1.005 to
1.227,
p=0.0399)
↑
OR 1.132
(95% CI 1.010 to
1.268,
p=0.0324)
NSCCRT 2000
(AR figures)‡
Caseload vs.
standard care
↓
<8 hours: 58.5%
vs. 68.4%
(p <0.001 trend
across all
durations)
(↓)
48% vs. 49%
(p=0.72)
(↓)
24.6% vs. 24.5%
(p=0.67)
(↓)
32.2% vs. 30%
(p=0.40)
(↑)
(23.5% vs. 24%)
(p=0.94)
(=)
2% vs. 2%
(p=0.15 trend
across all
modes of
delivery)
↑ Significantly better outcome with increased staffing; ↓ significantly worse outcome with increased staffing; ( ) bracketed arrows indicate non-significant effects; (=) equivalent outcomes; 517
(≈) no reported or no clear direction of non-significant effect. Effects shown for the most adjusted analyses. ‡Unadjusted results 518
*Composite outcomes, definitions: Healthy mother: delivery with bodily integrity (DwBI), return home in ≤2 days, and no instrumental delivery, maternal sepsis, anaesthetic complication, or 519
readmission within 28 days; DwBI: no uterine damage, 2nd/3rd/4th degree tear, stitches, episiotomy, or C-section.520


Page 22 of 129
Bazian Ltd Registered office: 25 St James's Street, London, SW1A 1HG
Company Registered in England and Wales No: 3724527. VAT Registration No. 340 4368 76.
Mode of birth outcomes 521
Table 5 summarises the 4 studies reporting on mode of birth outcomes (Sandall et al. in press [++]; 522
Rowe et al. 2014 [+]; Joyce et al 2002 [++]; NSCCRT 2000 [+]). These were the most commonly 523
reported types of outcomes across studies. Overall few outcomes showed statistical significance. 524
525
Three studies found no significant effect of midwife staffing levels on “normal birth”, although the 526
direction of effect tended to be towards small benefit with higher staffing (Sandall et al. in press 527
[++]; Rowe et al. 2014 [+]; NSCCRT 2000 [+]). The two observational studies (Sandall et al. in press 528
[++]; Rowe et al. 2014 [+]) used the same definition of normal birth (no induction, instrumental 529
delivery, C-section, episiotomy or general or regional anaesthetic), while the RCT (NSCCRT 2000 [+]) 530
did not provide an explicit definition of normal birth, but it appeared to exclude instrumental 531
delivery, C-section, or multiple and breech delivery. 532
533
One large correlational study (Sandall et al. in press [++]) (665,969 births) found that midwife staffing 534
at trust level was not associated with the likelihood of normal birth (OR 1.062, 95% CI 0.968 to 1.166, 535
p=0.2048). 536
537
One RCT (NSCCRT 2000 [+])(1,505 women) found no significant difference between caseload and 538
shared care in normal births (not defined, appeared to exclude instrumental delivery, C-section, or 539
multiple and breech delivery; 70% with caseload care vs. 69% with shared care, p=0.15 for overall 540
comparison of modes of delivery). 541
542
One correlational study (Rowe et al. 2014 [+]) (32,257 births) found no significant association 543
between midwife staffing at the unit level and normal birth among low risk women with a term birth 544
which was planned to be in the obstetric unit (nulliparous women: R2 0.1%, β=0.01, p=0.89; 545
multiparous: R2 1.7%, β=-0.05, p=0.48; direction of betas reported in the text here have been 546
inverted from those reported in the original paper to reflect the effect of higher staffing rather than 547
lower staffing, as analyses in the paper were based on % “understaffed” shifts, where women 548
outnumbered midwives on the delivery suite/labour ward). 549
550
Three studies assessed the effect of midwife staffing levels on epidural use (Rowe et al. 2014 [+], 551
Joyce et al. 2002 [+], NSCCRT 2000 [+]) and found some suggestion that increased staffing may be 552
associated with a reduction in this outcome. 553
554
One correlational study (Rowe et al. 2014 [+]) (32,257 births) found no significant association 555
between midwife staffing and epidural use, although the direction of effect was towards a small 556
reduction in nulliparous women (nulliparous: R2 0.9%, β=-0.05, p=0.59; multiparous: R2 0%, β=0.00, 557
p=0.94). A second correlational study (Joyce et al. 2002 [+]) (540,834 births) found that increased 558
midwife staffing at the hospital level was associated with reduced epidural use in labour (i.e. not in 559
C-sections) in univariate analyses (R2 0.081, β=-0.532, p=0.049). However, the effect was no longer 560
significant in multivariate analyses, with the final model including only father being in manual or 561
‘other’ social class, and woman being 40 years old or older, suggesting that differences seen in the 562
univariate analysis may be related to these differences. One RCT (NSCCRT 2000)(1,505 women) found 563
that caseload care (where midwives had lower caseloads) reduced epidural use (not specified if all 564
epidural use or use in labour) compared with shared care (10.4% with caseload care vs. 15% with 565
shared care, p=0.01). 566
567
Three studies found no significant effect of midwife staffing levels on the outcome of instrumental 568
vaginal delivery (Rowe et al. 2014 [+]; Joyce et al. 2002 [+]; NSCCRT 2000 [+]). In general the 569
Page 23 of 129
Bazian Ltd Registered office: 25 St James's Street, London, SW1A 1HG
Company Registered in England and Wales No: 3724527. VAT Registration No. 340 4368 76.
direction of the non-significant effects were towards a small benefit with increased midwife staffing, 570
except for in multiparous low risk women with term births (Rowe et al. 2014 [+]). 571
572
One correlational study (Rowe et al. 2014 [+]) (32,257 births) found no significant associations 573
between midwife staffing at the unit level and instrumental delivery among low risk women with a 574
term birth which was planned to be in the obstetric unit (nulliparous: R2 0.2%, β=-0.02, p=0.80; 575
multiparous: R2 5.6%, β=0.04, p=0.07; direction of betas reported here inverted from those reported 576
in the original paper to reflect the effect of higher staffing for consistency with other studies). A 577
second correlational study (Joyce et al. 2002 [+]) (540,834 births) found no significant association 578
between midwife staffing at the unit level and instrumental delivery in univariate analysis (R2 0.055, 579
β=-0.087, p=0.105). The RCT (NSCCRT 2000 [+])(1,505 women) found no significant difference 580
between caseload care and shared care in instrumental vaginal delivery (10% with caseload care vs. 581
11.5% with shared care; p=0.15 for comparison across all modes of delivery). 582
583
Two studies assessed the effect of midwife staffing on caesarean sections (C-sections) as a whole 584
(Sandall et al. in press [++]; Joyce et al. 2002 [+]). 585
586
One large correlational study (Sandall et al. in press [++]) found no significant association between 587
midwife staffing at the trust level and C-sections overall (OR 1.000, 95% CI 0.919 to 1.087, p=0.9962). 588
Another large correlational study (Joyce et al. 2002 [+]) found no significant association between 589
midwife staffing at the hospital level and C-sections overall in univariate analyses, although the 590
direction of effect was towards a reduction (R2 0.038, β=-0.117, p=0.181). 591
592
Two studies (Sandall et al. in press [++]; NSCCRT 2000) assessed the effect of midwife staffing on both 593
elective C-sections and emergency C-sections separately. In both cases there were no significant 594
effects, but in both studies the trend was for small increases in elective C-sections with increased 595
midwife staffing and reduced emergency C-sections with increased midwife staffing. The large 596
correlational study (Sandall et al. in press [++]) (665,969 births) assessed midwife staffing at the trust 597
level and found an OR of 1.032 (95% CI 0.936 to 1.137, p=0.5303) for elective C-sections and an OR of 598
0.978 (95% CI 0.897 to 1.066, p=0.6085) for emergency C sections. The smaller RCT found similar 599
trends for the caseload care group (which had lower caseloads) compared to the standard care group 600
(elective C-section: 10% with caseload care vs. 7% with shared care; emergency C-section: 8% with 601
caseload care vs. 10.5% with shared care; p=0.15 for overall comparison of modes of delivery). 602
603
However, the direction of effect for emergency C-sections differed in the correlational study by Rowe 604
et al. 2014 [+] (32,257 births to low risk women planned as vaginal births in the obstetric unit). It 605
assessed intrapartum C-sections only (i.e. excluding those performed before labour). This is likely to 606
exclude elective C-sections, also only births planned to be vaginal were included, this means that the 607
intrapartum C-sections are likely to be emergency (i.e. unplanned) C-sections. It stratified analyses 608
by parity, and found that increased midwife staffing (less under-staffing) at the unit level was 609
associated with a significant increase in intrapartum C-section rates in nulliparous women, but not 610
multiparous women, although the direction of effect was the same (nulliparous: R2 17.6%, β=0.10, 611
p=0.03; multiparous: R2 12.6%, β=0.05, p=0.11; direction of betas reported here inverted from those 612
reported in the original paper to reflect the effect of higher staffing for consistency with other 613
studies). The fact that it only includes low risk women who planned to give birth vaginally (rather 614
than all women) and that its approach to analysis used percentage of shifts with understaffing rather 615
than actual staffing levels could contribute to the differences seen to the other studies. 616
617

Page 24 of 129
Bazian Ltd Registered office: 25 St James's Street, London, SW1A 1HG
Company Registered in England and Wales No: 3724527. VAT Registration No. 340 4368 76.
Two studies assessed use of labour augmentation, and found conflicting results. One correlational 618
study (Rowe et al. 2014 [+]) (32,257 births) found that this was significantly increased with increased 619
midwife staffing in multiparous women, the direction and magnitude of the increase were similar in 620
nulliparous women but did not reach significance (multiparous: R2 11.1%, β=0.09, p=0.05; nulliparous: 621
R2 5.6%, β=0.10, p=0.16). The reason for the difference in significance was not clear, but may relate 622
to the power of the individual analyses (numbers of nulliparous and multiparous women not reported 623
separately). The RCT found that augmentation with oxytocin was significantly less common with 624
caseload care (where midwife caseload was lower) than with shared care (46% with caseload care vs. 625
53% with shared care, p=0.01). 626
627
Individual studies assessed the outcomes of spontaneous vaginal delivery, straightforward birth, and 628
induction. 629
630
The correlational study (Rowe et al. 2014 [+]) (32,257 births) assessed the effect of midwife staffing 631
and straightforward birth (defined as birth without forceps or ventouse, intrapartum caesarean 632
section, third or fourth degree perineal trauma or blood transfusion). It stratified analyses by parity 633
and did not report results pooled across parities. It found that increased midwife staffing in the 634
delivery suite was associated with a reduced likelihood of straightforward birth in multiparous women 635
(R2 15.1%, β=-0.08, p=0.01), the direction of effect was the same for nulliparous women but this 636
relationship did not reach significance (R2 3.5%, β=-0.06, p=0.31; direction of betas inverted from 637
those reported in the original paper to reflect the effect of higher staffing). Overall, the study 638
authors noted that chance could not be ruled out for the midwife staffing findings as results were not 639
consistently significant across multiple outcomes. 640
641
One large correlational study (Sandall et al. in press [++]) (665,969 births) found that midwife staffing 642
at trust level was not associated with spontaneous vaginal delivery (OR 1.025, 95% CI 0.948 to 1.109, 643
p=0.5362). 644
645
One RCT (NSCCRT 2000 [+]) found no effect of caseload care (lower midwife caseload) on induction 646
(17.4% with caseload care vs. 18% with shared care, p=0.78) or on multiple and breech delivery (2% 647
in both groups, p=0.15 for comparison across all modes of delivery, reported in Table 4). 648
649
650
Page 25 of 129
Bazian Ltd Registered office: 25 St James's Street, London, SW1A 1HG
Company Registered in England and Wales No: 3724527. VAT Registration No. 340 4368 76.
Table 5: Summary of association between midwife staffing and maternal outcomes (mode of birth) 651
Study Staffing
variable
Normal
birth*
Straight-
forward
birth
Spontaneous
vaginal
delivery
Instrumental
vaginal
delivery*
Elective C-
section
Emergency
C-section
Any C-
section
Epidural Induction Augment-
ation
Sandall et
al. in press
[++]
FTE
midwives/100
maternities
(↑)
OR 1.062
(95% CI
0.968 to
1.166,
p=0.2048)
(↑)
OR 1.025
(95% CI 0.948
to 1.109,
p=0.5362)
(↓)
OR 1.032
(95% CI
0.936 to
1.137,
p=0.5303)
(↑)
OR 0.978
(95% CI
0.897 to
1.066,
p=0.6085)
(=)
OR 1.000
(95% CI
0.919 to
1.087,
p=0.9962)
Rowe et al.
2014 [+]
Less midwife
under staffing
(<1 midwife
per woman)‡
Nullip
(↑)
Β 0.01
(p=0.89)
Multip
(↓)
Β -0.05
(p=0.48)
Nullip
(↓)
Β -0.06
(p=0.31)
Multip
↓
Β -0.08
(p=0.01)
Nullip
(↑)
Β -0.02
(p=0.80)
Multip
(↓)
Β 0.04
(p=0.07)
Nullip¶
↓
Β 0.10
(p=0.03)
Multip¶
(↓)
Β 0.05
(p=0.11)
Nullip
(↑)
Β -0.05
(p=0.59)
Multip
(=)
Β 0.00
(p=0.94)
Nullip
(↓)
Β 0.10
(p=0.16)
Multip
(↓)
Β 0.09
(p=0.05)
Joyce et al
2002 [+]†
Midwives/1000
deliveries/year
Univariate
(↑)
Β -0.087
(p=0.105)
Univariate
(↑)
Β -0.117
(p=0.181)
Univariate
↑
Β -0.532
(p=0.049)
Multivariate
NS

Page 26 of 129
Bazian Ltd Registered office: 25 St James's Street, London, SW1A 1HG
Company Registered in England and Wales No: 3724527. VAT Registration No. 340 4368 76.
Study Staffing
variable
Normal
birth*
Straight-
forward
birth
Spontaneous
vaginal
delivery
Instrumental
vaginal
delivery*
Elective C-
section
Emergency
C-section
Any C-
section
Epidural Induction Augment-
ation
NSCCRT 2000
[+] (AR
figures)†
Caseload vs.
standard care
(↑)
70% vs. 69%
(p=0.15 for
trend across
all modes of
delivery)
(↑)
10% vs.
11.5%
(p=0.15 for
trend across
all modes)
(↓)
10% vs. 7%
(p=0.15 for
trend across
all modes)
(↑)
8% vs. 10.5%
(p=0.15 for
trend across
all modes)
↑
10.4% vs.
15%
(p=0.01)
(↑)
17.4% vs.
18%
(p=0.78)
↑
46% vs. 53%
(p=0.01)
↑ Significantly better outcome with increased staffing; ↓significantly worse outcome with increased staffing; = equivalent outcome; ( ) brackets around arrows indicate non-significant 652
directions of effect with increased staffing. Effects are shown for the most adjusted analyses presented in the study. †Unadjusted results. ‡Results are reported in a way that shows association 653
with higher staffing (i.e. less under staffing). ¶ Intrapartum C-section (i.e. not those performed before labour. NS not significant. *Composite outcome definitions: Normal birth: Sandall and 654
Rowe studies - no induction, instrumental delivery, C-section, episiotomy or general or regional (epidural or spinal) anaesthetic; NSCCRT study – not explicitly defined, based on reporting in 655
results table appeared to exclude instrumental delivery, C-section, or multiple and breech delivery. Straightforward birth: no instrumental delivery, intrapartum C-section, 3rd or 4th degree 656
perineal trauma or blood transfusion. Instrumental vaginal delivery: delivery using forceps or ventouse. Nullip nulliparous, multip multiparous657

Page 27 of 129
Bazian Ltd Registered office: 25 St James's Street, London, SW1A 1HG
Company Registered in England and Wales No: 3724527. VAT Registration No. 340 4368 76.
Delivery of care 658
Table 6 summarises the 3 studies that assessed delivery of care outcomes (Cerbinskaite et al. 2011 [-659
]; Gerova et al. 2010 [+];NSCCRT 2000 [+]). This outcome group showed the most significant 660
associations with midwife staffing. However, these outcomes were each only assessed in a single 661
study, which reduces confidence in their validity. 662
663
One cross sectional analysis of a cohort study (Cerbinskaite et al. 2011 [-]) (333 grade 1 and 2 664
emergency C-sections) looked at the relationship between midwife staffing at the time of emergency 665
C-section and whether the decision-to-delivery interval was within 30 minutes (reported to be based 666
on NICE recommended optimal decision-to-delivery interval for C-sections in cased of confirmed or 667
suspected acute fetal compromise). It found that the decision-to-delivery interval was significantly 668
more likely to be less than 30 minutes if there was 1 midwife per labouring woman (MW:LW) on the 669
delivery suite or more (grade 1 C-section: 93.9% with MW:LW ≥1 vs. 55.0% with MW:LW <1, p<0.001; 670
grade 2 C-section: 53.6% with MW:LW ≥1 vs. 11.6% with MW:LW <1, p<0.001). 671
672
The study also looked at transfer time to the operating theatre. Again it found that transfer time 673
was significantly more likely to be less than 15 minutes if there was 1 midwife per labouring woman 674
(MW:LW) or more on the delivery suite (grade 1 C-section: 98.8% with MW:LW ≥1 vs. 85.0% with 675
MW:LW <1, p<0.001; grade 2 C-section: 92.3% with MW:LW ≥1 vs. 67.4% with MW:LW <1, p<0.001). 676
677
The study found no effect of midwife staffing on interval between arrival in theatre and start of the 678
operation (figures and p value not reported). As staffing was assessed at the time of the C-section 679
this study offers a more temporally linked assessment of staffing and outcome than most other 680
studies. However, the analyses were still essentially cross sectional, and as such cannot establish 681
cause and effect. 682
683
One correlational study (Gerova et al. 2010 [+]) (615,042 women) looked at the relationship between 684
midwife staffing at the trust level and maternal readmissions within 28 days. It found that higher 685
midwife staffing was associated with significantly reduced risk of maternal readmission (β=-4.810, 95% 686
CI -4.873 to -4.743, p<0.001). 687
688
One RCT (NSCCRT 2000 [+]) found that women receiving caseload care were significantly more likely 689
to be attended by a known midwife or midwifery partner in labour than those receiving shared care 690
(94.7% with caseload care vs. 6.7% with standard care, p<0.001). 691
692
No studies addressed maternal death as an outcome, or never events such as maternal death due to 693
post- partum haemorrhage after elective caesarean section, wrongly prepared high-risk injectable 694
medication, intravenous administration of epidural medication, or retained foreign objects post-695
procedure.696

Page 28 of 129
Bazian Ltd Registered office: 25 St James's Street, London, SW1A 1HG
Company Registered in England and Wales No: 3724527. VAT Registration No. 340 4368 76.
697
Table 6: Summary of association between midwife staffing and maternal outcomes (delivery of care) 698
Study Staffing variable Emergency C-section
decision-to-delivery
interval <30 minutes
Transfer time to theatre
<15 min
Pre-operative time in
theatre
Attended by known
midwife or midwifery
partner in labour
Maternal readmission to
hospital
Cerbinskaite et al.
2011 [-]
Midwife: labouring
woman ratio
Interval <30 min 1:1 or
better vs. worse than
1:1†
Grade 1CS
↑
93.9% vs. 55.0%
(p<0.001)
Grade 2CS
↑
53.6% vs. 11.6%
(p<0.001)
Grade 1CS
↑
98.8% vs. 85.0%
(p<0.001)
Grade 2CS
↑
92.3% vs. 67.4%
(p<0.001)
Grade 1CS
(≈)
Grade 2CS
(≈)
(figures not reported)
Gerova et al. 2010
[+]
Midwife FTE per birth
(midwife ratio)
↑
Β -4.810
(95% CI -4.873 to -4.746)
NSCCRT 2000 [+]† Caseload vs. standard
care
↑
94.7% vs. 6.7%
p=0.001
↑Significantly better outcome with increased staffing; ↓significantly worse outcome with increased staffing 699
( ) Brackets indicate non-significantly directions of effect with increased staffing; (=) equivalent effect; (≈) no reported or no clear direction of non-significant effect. 700
Effects shown for the most adjusted analyses. † Unadjusted analyses. 701
*Composite outcomes, definitions below: 702
Inappropriate CEFM – Either given CEFM when there was no recorded indication for its use, or not given CEFM if there was a recorded indication for its use.703

Page 29 of 129
Bazian Ltd Registered office: 25 St James's Street, London, SW1A 1HG
Company Registered in England and Wales No: 3724527. VAT Registration No. 340 4368 76.
Fetal/neonatal outcomes 704
Table 7 summarises the findings of the 4 studies (Sandall et al. in press [++], Joyce et al. 2004 [+], 705
NSCCRT 2000 [+], Tucker et al. 2003 [+]) assessing the link between midwife staffing levels and 706
fetal/neonatal outcomes. 707
708
One large correlational study (Sandall et al. in press [++]) across 143 NHS trusts in England (665,969 709
births) reported on the composite outcome of “healthy baby” (baby’s weight 2.5 to 4.5 kg, 710
gestational age 37 to 42 weeks, and live baby). It found no significant effect of midwife staffing on 711
the healthy baby outcome, although the direction of effect was towards a small benefit (OR 1.029, 712
95% CI 0.912 to 1.161, p=0.6456). In sensitivity analyses that excluded preterm births and stillbirths, 713
midwife staffing levels were associated with a greater effect on healthy baby outcome although this 714
did not reach significance (OR 1.172, 95% CI 0.991 to 1.387, p=0.063). 715
716
One large correlational study (Joyce et al. 2004 [+]) and one RCT (NSCCRT 2000 [+]) assessed 717
stillbirth and neonatal mortality rates. The correlational study (540,834 births) found no significant 718
effect of midwife staffing on still birth or neonatal mortality in univariate analyses, with opposite 719
directions of the non-significant effects for the two outcomes (still birth: β=0.012, p=0.65; neonatal 720
mortality: β=-0.012, p=0.50; rates standardised for birthweight). The authors reported that no 721
avoidable factors relating to midwifery care were seen for any of the deaths. 722
723
The RCT (NSCCRT 2000 [+])(1,505 women) pooled still birth and neonatal mortality rates, and found 724
no significant difference in this outcome between caseload and standard care, although there rate 725
was approximately halved in the caseload care group (0.7% with caseload care vs. 1.5% with standard 726
care, difference -0.8%, 95% CI -1.8% to 0.2%, p=0.28). The RCT lacked power to assess an effect on 727
this outcome (it would have needed 4,000 women in each arm to have 85% power to detect this level 728
of difference as statistically significant at the p≤0.05 level). 729
730
One cohort study (Tucker et al. 2003 [+]) (3,083 live births) looked at the relationship between 731
midwife staffing at the time of admission and use of continuous electronic fetal monitoring (CEFM). 732
It found no significant difference between the ratio of available to required midwives (based on 733
Birthrate Plus) and use of CEFM (OR 1.00, 95% CI 0.77 to 1.29), inappropriate use of CEFM (includes 734
use of CEFM when not indicated and lack of use when indicated; OR 1.44, 95% CI 0.85 to 2.45), 735
appropriate use of CEFM for high risk cases (OR 0.90, 95% CI 0.63 to 1.30), or appropriate use of CEFM 736
for low risk cases (OR 1.12, 95% CI 0.85 to 1.47). There was also no significant effect of workload at 737
the time of detection of a serious fetal heart trace abnormality and time to senior medical response, 738
although the direction of the effect was towards benefit (β=-7.8 minutes, 95% CI -52.4 to 36.8 739
minutes). 740
741
The RCT (NSCCRT 2000 [+]) and cohort study described above (Tucker et al. 2003 [+]) assessed the 742
effect of midwife staffing on neonatal resuscitation. The RCT (1,505 women) found no significant 743
difference between caseload and standard care in use of advanced resuscitation (intubation and 744
ventilation: 1.2% with caseload care vs. 0.8% with standard care; difference 0.4%, 95% CI -0.6% to 745
1.4%; p=0.51). The cohort study (3,083 live births) assessed the impact of the ratio of available to 746
required midwives immediately at or before the time of birth, with the required numbers of midwives 747
calculated using Birthrate Plus. It found that higher midwife staffing was associated with a small but 748
statistically significant reduction in the use of neonatal resuscitation not including resuscitation with 749
bag and mask only (OR 0.97, 95% CI 0.94 to 0.99). The direction of effect for all neonatal 750

Page 30 of 129
Bazian Ltd Registered office: 25 St James's Street, London, SW1A 1HG
Company Registered in England and Wales No: 3724527. VAT Registration No. 340 4368 76.
resuscitation including resuscitation with bag and mask only was also towards benefit with a higher 751
staffing ratio, but this did not quite reach significance (OR 0.98, 95% CI 0.96 to 1.00). 752
753
The RCT and cohort study also assessed the effect of midwife staffing on admission to the neonatal 754
unit (NNU). The RCT (NSCCRT 2000 [+]) found no significant difference between caseload and 755
standard care in admission to the NNU, with the direction of effect favouring the higher caseload 756
shared care group (5.8% with caseload care vs. 4.6% with shared care; difference 1.2%, 95% CI -0.8% 757
to 3.2%; p=0.34). The cohort study (Tucker et al. 2003 [+]) also found no difference between midwife 758
staffing level and admission to the NNU for over 48 hours, although the direction of effect was 759
towards small benefit with higher staffing (OR 0.97, 95% CI 0.95 to 1.00). 760
761
The RCT (NSCCRT 2000 [+]) found no significant difference between caseload and shared care in 762
gestation length (p=0.16 for trend) or low birth weight (<2.5 kg: 6.7% with caseload care vs. 6.9% 763
with standard care; difference -0.2%, 95% CI -2.2% to 1.7%; p=0.96). The cohort study by Tucker et al. 764
2003 [+] found no significant effect of the ratio of available to required midwives at or before the 765
time of birth on Apgar score of <7 at 5 minutes (OR 0.98, 95% CI 0.94 to 1.04). 766
767
768

Page 31 of 129
Bazian Ltd Registered office: 25 St James's Street, London, SW1A 1HG
Company Registered in England and Wales No: 3724527. VAT Registration No. 340 4368 76.
Table 7: Summary of association between midwife staffing and fetal/neonatal outcomes 769
Study Staffing
variable
Healthy
baby*
Still birth
and
neonatal
mortality
Gestation
length
Low birth
weight
(<2.5kg)
Apgar <7 at
5 minutes
Neonatal re-
suscitation*
Overall
CEFM use
and
appropriate
CEFM
In-
appropriate
CEFM
Time to
response to
fetal heart
trace
abnormality
Admission to
the NNU
Sandall et
al. in press
[++]
FTE
midwives/100
maternities
(↑)
OR 1.029
(95% CI 0.912
to 1.161,
p=0.6456)
Joyce et al.
2004 [+]
Midwives/1000
deliveries
Still birth:
(↓)
β 0.012†
(p=0.65)
Neonatal
mortality:
(↑)
β -0.012†
(p=0.50)
NSCCRT
2000 [+]
(AR
figures)†
Caseload vs.
standard care
(↑)
0.7% vs. 1.5%
(p=0.28)
(≈)
(p=0.16 for
trend)
(↑)
6.7% vs. 6.9%
(p=0.96)
Advanced:
(↓)
1.2% vs. 0.8%
(p=0.51)
(↓)
5.8% vs. 4.6%
(p=0.34)

Page 32 of 129
Bazian Ltd Registered office: 25 St James's Street, London, SW1A 1HG
Company Registered in England and Wales No: 3724527. VAT Registration No. 340 4368 76.
Study Staffing
variable
Healthy
baby*
Still birth
and
neonatal
mortality
Gestation
length
Low birth
weight
(<2.5kg)
Apgar <7 at
5 minutes
Neonatal re-
suscitation*
Overall
CEFM use
and
appropriate
CEFM
In-
appropriate
CEFM
Time to
response to
fetal heart
trace
abnormality
Admission to
the NNU
Tucker et
al. 2003 [+]
Ratio of
available to
required
midwives‡
(↑)
OR 0.98
(95% CI 0.94
to 1.04)
Any:
(↑)
OR 0.98
(95% CI 0.96
to 1.00)
Excluding
bag/mask
only:
↑
OR 0.97
(95% CI 0.94
to 0.99)
Overall:
(=)
OR 1.00
(95% CI 0.77
to 1.29)
Appropriate
CEFM in high
risk women:
(↓)
OR 0.90
(95% CI 0.63
to 1.30)
Appropriate
CEFM in low
risk women:
(↑)
OR 1.12
(95% CI 0.85
to 1.47)
(↓)
OR 1.44
(95% CI 0.85
to 2.45)
(↑)
Β -7.8
minutes
95% CI -52.4
to 36.8)
(↑)
OR 0.97 (95%
CI 0.95 to
1.00)¶
↑ Significantly better outcome with increased staffing; ↓ significantly worse outcome with increased staffing. ( ) Brackets indicate non-significant directions of effect with increased staffing 770
Effects shown for the most adjusted analyses reported in the study. † Unadjusted analyses. ‡ Based on Birthrate Plus. ¶ Admission to NNU >48 hours. *Composite outcome definitions: Healthy 771
baby: baby’s weight 2.5 to 4.5 kg, gestational age 37 to 42 weeks, and live baby. Any neonatal resuscitation: bag and mask with or without drugs, intubation for intermittent positive pressure 772
ventilation with or without drugs, or drugs only (does not include facial oxygen). Neonatal resuscitation excluding bag/mask only: any resuscitation excluding resuscitations with bag and mask 773
and no drugs. Advanced neonatal resuscitation: intubation and ventilation 774
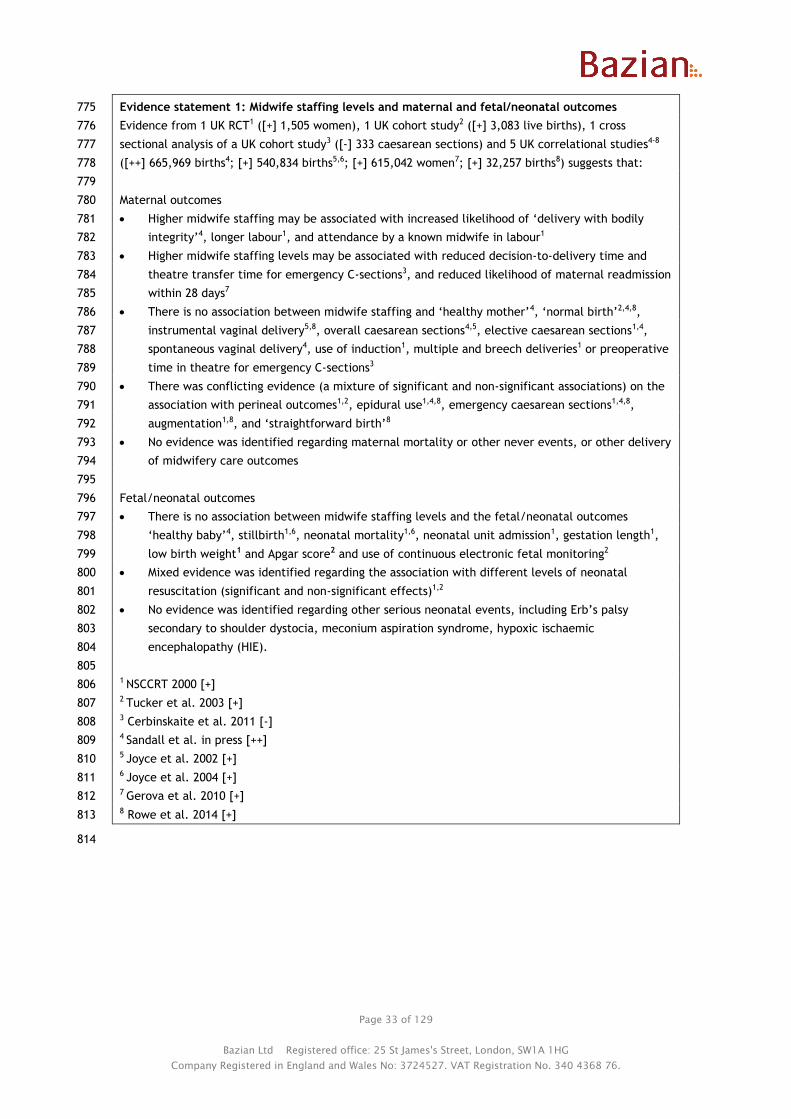
Page 33 of 129
Bazian Ltd Registered office: 25 St James's Street, London, SW1A 1HG
Company Registered in England and Wales No: 3724527. VAT Registration No. 340 4368 76.
Evidence statement 1: Midwife staffing levels and maternal and fetal/neonatal outcomes 775
Evidence from 1 UK RCT1 ([+] 1,505 women), 1 UK cohort study2 ([+] 3,083 live births), 1 cross 776
sectional analysis of a UK cohort study3 ([-] 333 caesarean sections) and 5 UK correlational studies4-8 777
([++] 665,969 births4; [+] 540,834 births5,6; [+] 615,042 women7; [+] 32,257 births8) suggests that: 778
779
Maternal outcomes 780
Higher midwife staffing may be associated with increased likelihood of ‘delivery with bodily 781
integrity’4, longer labour1, and attendance by a known midwife in labour1 782
Higher midwife staffing levels may be associated with reduced decision-to-delivery time and 783
theatre transfer time for emergency C-sections3, and reduced likelihood of maternal readmission 784
within 28 days7 785
There is no association between midwife staffing and ‘healthy mother’4, ‘normal birth’2,4,8, 786
instrumental vaginal delivery5,8, overall caesarean sections4,5, elective caesarean sections1,4, 787
spontaneous vaginal delivery4, use of induction1, multiple and breech deliveries1 or preoperative 788
time in theatre for emergency C-sections3 789
There was conflicting evidence (a mixture of significant and non-significant associations) on the 790
association with perineal outcomes1,2, epidural use1,4,8, emergency caesarean sections1,4,8, 791
augmentation1,8, and ‘straightforward birth’8 792
No evidence was identified regarding maternal mortality or other never events, or other delivery 793
of midwifery care outcomes 794
795
Fetal/neonatal outcomes 796
There is no association between midwife staffing levels and the fetal/neonatal outcomes 797
‘healthy baby’4, stillbirth1,6, neonatal mortality1,6, neonatal unit admission1, gestation length1, 798
low birth weight1 and Apgar score2 and use of continuous electronic fetal monitoring2 799
Mixed evidence was identified regarding the association with different levels of neonatal 800
resuscitation (significant and non-significant effects)1,2 801
No evidence was identified regarding other serious neonatal events, including Erb’s palsy 802
secondary to shoulder dystocia, meconium aspiration syndrome, hypoxic ischaemic 803
encephalopathy (HIE). 804
805 1 NSCCRT 2000 [+] 806 2 Tucker et al. 2003 [+] 807 3 Cerbinskaite et al. 2011 [-] 808 4 Sandall et al. in press [++] 809 5 Joyce et al. 2002 [+] 810 6 Joyce et al. 2004 [+] 811 7 Gerova et al. 2010 [+] 812 8 Rowe et al. 2014 [+] 813
814

Page 34 of 129
Bazian Ltd Registered office: 25 St James's Street, London, SW1A 1HG
Company Registered in England and Wales No: 3724527. VAT Registration No. 340 4368 76.
Questions 2-6: What factors affect safe midwifery staffing at a local level? 815
Questions 2 to 6 aim to identify potential modifiers of the relationship between midwife staffing 816
levels and outcomes. Modifiers would affect the midwife staffing levels required to achieve an 817
specified outcome. For example, the presence of a given modifier (e.g. a large proportion of women 818
with low clinical risk, or more consultant obstetricians on the ward) might make it possible to achieve 819
the same level of safety with lower midwife staffing levels than if the modifier wasn’t present (e.g. if 820
there were few or no women with low clinical risk, or there were fewer consultant obstetricians on 821
the ward), or vice versa. 822
823
The potential modifying factors addressed in this review are: 824
Maternal and neonatal factors 825
Environmental factors 826
Staffing factors 827
Management factors 828
Organisational factors 829
830
Ideally, studies looking for factors that influence the relationship between midwifery staffing and 831
maternal and neonatal outcomes would do this in a direct way. For example, this could be by splitting 832
the population into those with and without a particular modifier (stratifying) and looking at the effect 833
of midwife staffing levels in the two different groups. If the effect in the two groups is significantly 834
different, this would suggest that the factor is modifying the effect of midwife staffing (an 835
interaction effect). 836
837
Few studies were identified which took this approach to looking at modifier variables, and the only 838
variables assessed in this way were maternal factors. Only the study by Sandall et al. (in press) 839
carried out formal interaction analyses for some maternal variables (clinical risk and parity), while a 840
few studies stratified at least some of their analyses by individual maternal factors (Rowe et al. 2014 841
[+]; Cerbinskaite et al. 2011 [-], Tucker et al. 2003 [+]), but did not formally look for interaction 842
between these and the effects of midwife staffing. Without statistical tests for interaction firm 843
conclusions about their effect on safe midwife staffing requirements cannot be drawn. 844
845
To address this the previous evidence reviews for the first NICE safe staffing guideline (on safe nurse 846
staffing in adult acute care wards) the review assumed that the presence of a significant relationship 847
between a factor of interest and an outcome after adjustment for staffing levels identified a factor 848
which might modify the effect of nurse staffing or require different levels of nurse staffing to achieve 849
similar outcomes when it was not present. This approach was taken for the patient-related, staffing, 850
and geographical factors. For management approaches and organisational factors, the review first 851
identified the outcomes which were potentially influenced by nurse staffing levels, and then focused 852
on these outcomes in the questions which these potential modifiers. 853
854
The current review has assessed only the most directly relevant evidence to answer these questions, 855
i.e. studies which attempt to explicitly link the factors of interest with midwifery staffing levels and 856
outcomes (direct evidence), or that have assessed the impact of factors of interest as well as midwife 857
staffing on outcomes, noting whether the analyses adjusted for midwife staffing. The latter studies 858
only offer indirect evidence of a potential effect of the factors on safe nurse staffing. It is also worth 859
noting that other studies which assess the effect of these factors on outcomes may exist, these would 860
not have been picked up by the search unless they included some mention of midwife staffing. 861
862

Page 35 of 129
Bazian Ltd Registered office: 25 St James's Street, London, SW1A 1HG
Company Registered in England and Wales No: 3724527. VAT Registration No. 340 4368 76.
The same 8 studies described under Question 1 above form the evidence base for Questions 2 to 6. 863
Table 8 summarises the results of the studies included for each question: 864
● 7 of the studies were included for Question 2 (maternal and neonatal factors) 865
● 6 of the studies were included for Question 3 (environmental factors) 866
● 5 of the studies were included for Question 4 (staffing factors) 867
● 2 of the studies were included for Question 5 (management factors) 868
● no studies were included for Question 6 (organisational factors). 869
870
The results are discussed in greater detail for each question in the sections below. Where there is 871
direct evidence of a potential relationship between a factor and safe midwife staffing, this is 872
described first in each section, followed by any less direct evidence of the potential to modify an 873
effect.874

Page 36 of 129
Bazian Ltd Registered office: 25 St James's Street, London, SW1A 1HG
Company Registered in England and Wales No: 3724527. VAT Registration No. 340 4368 76.
Table 8: Overview of study results for Questions 2 to 6 875
Outcome
Number of
women/births
n= (range)
Association of factors with outcomes:
(number of studies and quality score)
Association
found for all
outcomes
assessed
Mixed findings
(association
for some
measures/
outcomes)
No association
Question 2: Maternal and neonatal factors
Number of women in labour 333 to 3,083 1 - 1 +
Maternal clinical risk 333 to 665,969 [1 ++], 1 +, 1
+, 1 -
1 +
Parity 32,257 to 665,969 [1 ++], 1 + 2 +
Maternal age 540,834 to
665,969
1 ++ 1 +, 1+ 1 +
Interventions used 333 to 540,834 1 +, 1+, 1 -
Birthweight 540,834 1 + 1 +
Stage of maternity care pathway, other
maternal and neonatal factors
No evidence
Question 3: Environmental factors
Local geography 665,969 1 ++
Local demography 540,834 to
665,969
1 ++, 2+ 1 +
Birth settings 32,257 to 665,969 1 ++, 1 +
Unit size 32,257 to 665,969 1+ 1 ++, 3 +
Dedicated maternity theatre 540,834 2 +
Other physical layout factors No evidence
Question 4: Staffing factors
Midwifery skill mix 615,042 1 +
Availability of other staff 540,834 to
665,969
1 + 1 ++, 1 +, 1 +
Time of day 333 1 -
Additional services provided by
midwives, division of tasks with support
workers
No evidence
Question 5: Management factors
Models of care 1,505 1 +
Service provision and risk management 540,834 1 +
Team management and administration
approaches; supervision and
supernumerary arrangements
No evidence
Question 6: Organisational factors
Any organisational factors No evidence
Underline indicates analysis of the factor’s effect on outcomes adjusted for midwife staffing or 876
possible interaction suggested by different effect of midwife staffing on outcomes if stratified by 877
the factor. [ ] Square brackets indicate significant interaction between that factor and midwife 878
staffing in formal interaction analysis.879

Page 37 of 129
Bazian Ltd Registered office: 25 St James's Street, London, SW1A 1HG
Company Registered in England and Wales No: 3724527. VAT Registration No. 340 4368 76.
Question 2: What maternal and neonatal factors affect midwifery staffing 880
requirements, at any point in time, at a local level? 881
Maternal and neonatal factors were assessed in 7 studies: Cerbinskaite et al. 2011 [-], Tucker et al. 882
2003 [+], Sandall et al. in press [++], Rowe et al. 2014 [+], Gerova et al. 2010 [+], Joyce et al. 2002 883
[+], and Joyce et al. 2004 [+]. 884
885
The potential maternal and neonatal modifying factors addressed by these studies included: 886
Number of women in labour 887
Maternal/fetal clinical risk factors 888
Interventions used 889
Neonatal characteristics (birth weight) 890
891
Number of labouring women 892
No studies directly assessed the impact of number of labouring women on safe midwife staffing. Two 893
studies assessing midwife staffing also looked at the relationship between number of labouring women 894
or bed occupancy in the unit on outcomes (Cerbinskaite et al. 2011 [-], Tucker et al. 2003 [+]). Their 895
results are summarised in Table 9. 896
897
Cerbinskaite et al. 2011 [-] (333 emergency grade 1 and 2 C-sections) reported that decision-to-898
delivery interval was longer for both grade 1 and 2 C-sections when there were more labouring 899
women on the delivery suite (results displayed graphically). The authors reported that for grade 1 C-900
sections the decision-to-delivery interval for grade 1 C-sections was “rarely” over 30 minutes if there 901
were fewer than 8 women on the suite, but “frequently” exceeded 30 minutes if there were more 902
women (absolute figures not reported). Results were not adjusted for staffing levels or other 903
potential confounders. The effect of number of women on outcomes was not statistically tested on its 904
own, rather the ratio of labouring women to midwives available was assessed. Therefore it is not 905
possible to assess the impact of number of labouring women specifically, independently to the ratio 906
of midwives to labouring women. 907

Page 38 of 129
Bazian Ltd Registered office: 25 St James's Street, London, SW1A 1HG
Company Registered in England and Wales No: 3724527. VAT Registration No. 340 4368 76.
908
Table 9: Association between number of labouring women and outcomes 909
Study (factor
assessed)
Associated outcomes Outcomes not
associated
Analyses adjusted for
midwife staffing?
Outcomes associated with
midwife staffing
Midwife staffing analyses
adjusted for modifying factor?
Cerbinskaite et al.
2011 [-]
(labouring women
on the delivery
suite)
Delivery of care
outcomes:
Decision-to-delivery
interval (grade 1 & 2
emergency C-
sections)*
None No Decision-to-delivery interval
(grade 1 & 2 emergency C-
sections)
No (although number of labouring
women was part of the midwife
staffing ratio i.e.
midwives:labouring women)
Tucker et al. 2003
[+] (labour ward
bed occupancy)
None CEFM-use and response
related outcomes,
neonatal outcomes
(Apgar score <7 at 5
minutes, any neonatal
resuscitation, neonatal
resuscitation excluding
bag and mask only,
admission to the NNU
for >48 hours)
Unclear Neonatal resuscitation excluding
bag and mask only
Unclear
*Figures showed graphically, significance not reported; C-section caesarean section, CEFM continuous electronic fetal monitoring 910

Page 39 of 129
Bazian Ltd Registered office: 25 St James's Street, London, SW1A 1HG
Company Registered in England and Wales No: 3724527. VAT Registration No. 340 4368 76.
One cohort study by Tucker et al. 2003 [+] (3,083 live births) analysed the effect of unit occupancy (% 911
beds occupied) on outcomes. It was unclear whether these results were adjusted for midwife staffing 912
(and vice versa). Similarly to midwife staffing levels, occupancy appeared to have been assessed 4 913
times daily, with analyses assessing the effect of occupancy at the time of admission for continuous 914
electronic fetal monitoring [CEFM] outcomes, immediately before or at the time of birth for neonatal 915
outcomes, and at the time of first serious heart trace abnormality for response time outcome. 916
917
It found that occupancy was not significantly associated with any of the delivery of care or neonatal 918
outcomes assessed (effect of each 10% increase in occupancy on: having CEFM OR 1.01, 95% CI 0.93 to 919
1.10); having inappropriate CEFM OR 1.06, 95% CI 0.90 to 1.24; having appropriate CEFM in high risk 920
women: OR 0.96, 95% CI 0.86 to 1.08; having appropriate CEFM in low risk women: OR 0.99, 95% CI 921
0.91 to 1.07; lag time until senior medical attendance for a serious fetal heart trace abnormality: -6.7 922
minutes, 95% CI -21.8 to 8.4 minutes; Apgar score <7 at 5 minutes: 0.97, 95% CI 0.83 to 1.15; any 923
neonatal resuscitation: OR 1.04, 95% CI 0.97 to 1.11; neonatal resuscitation excluding bag and mask 924
only: OR 1.07, 95% CI 0.95 to 1.21; admission to the NNU for >48 hours: OR 1.04, 95% CI 0.95 to 1.13). 925
No tests for interaction between occupancy levels and midwife staffing were carried out, therefore 926
any relationship between these is unclear. 927
928
Maternal/fetal risk factors 929
One study (Sandall et al. in press [++]) specifically tested for interactions between maternal risk 930
factors (clinical risk and parity) and midwife staffing, while 3 studies stratified at least some of their 931
results by maternal clinical risk (Tucker et al. 2003 [+]), grade of emergency C-section (Cerbinskaite 932
et al. 2011 [-]) or parity (Rowe et al. 2014 [+]), but did not carry out formal interaction tests. As well 933
as these studies, 3 additional studies which looked at the association between midwife staffing and 934
outcomes also looked at the association between maternal risk factors and outcomes (Gerova et al. 935
2010 [+], Joyce et al. 2002 [+], Joyce et al. 2004 [+]). These are described at the end of this section, 936
as they offer less direct evidence about a possible effect of maternal risk factors on midwife safe 937
staffing levels. Table 10 summarises the findings of the studies. 938

Page 40 of 129
Bazian Ltd Registered office: 25 St James's Street, London, SW1A 1HG
Company Registered in England and Wales No: 3724527. VAT Registration No. 340 4368 76.
Table 10: Association between maternal/fetal risk factors and safe midwifery staffing and outcomes 939
Study (factor
assessed)
Associated outcomes Outcomes not
associated
Analyses of adjusted
for midwife staffing?
Outcomes associated with
midwife staffing
Midwife staffing analyses
adjusted for modifying factor?
Sandall et al. in
press [++]
Interaction
analyses
(maternal clinical
risk, parity, age;
interaction
assessed for
maternal clinical
risk and parity
only)
Factors interacting
with midwife staffing:
Maternal clinical risk
for healthy mother
and baby outcomes
(p≤0.009 for all)
Parity for intact
perineum outcome
(p=0.007)
Delivery with bodily
integrity, spontaneous
vaginal delivery
NA (interaction
analyses)
Delivery with bodily integrity,
intact perineum
Yes
Outcomes associated
with factors:
All healthy mother and
baby outcomes, mode
of delivery outcomes,
and C-section
outcomes
None Yes
Cerbinskaite et al.
2011 [-]
(grade of C-
section)
Possible interaction
suggested in
stratified analyses:
Decision-to-delivery
interval, transfer time
to theatre (interaction
not formally tested)
Pre-operative time in
theatre
NA (stratified midwife
staffing analyses)
Decision-to-delivery interval,
transfer time to theatre (grade 1
& 2 C-sections)(UVA)
NA (stratified by C-section grade)

Page 41 of 129
Bazian Ltd Registered office: 25 St James's Street, London, SW1A 1HG
Company Registered in England and Wales No: 3724527. VAT Registration No. 340 4368 76.
Study (factor
assessed)
Associated outcomes Outcomes not
associated
Analyses of adjusted
for midwife staffing?
Outcomes associated with
midwife staffing
Midwife staffing analyses
adjusted for modifying factor?
Tucker et al. 2003
[+]
(maternal/fetal
risk)
Possible interaction
suggested in
stratified analyses:
Appropriate CEFM
monitoring (maternal
risk category)
(interaction not
formally tested)
None NA (stratified midwife
staffing analyses)
Neonatal resuscitation excluding
bag and mask
No (not for risk category, although
analyses were adjusted for various
maternal/fetal risk variables)
Outcomes associated
with factors:
Use of continuous
electronic fetal
monitoring (various
maternal/fetal clinical
risk variables)
Not clear No Neonatal resuscitation excluding
bag and mask
Yes
Rowe et al. 2014
[+]
(parity)
Possible interaction
suggested in
stratified analyses:
straightforward birth,
augmentation,
intrapartum C-section,
normal birth and
instrumental vaginal
delivery, epidural
rates (interaction not
formally tested)
None NA (stratified midwife
staffing analyses)
Straightforward birth,
intrapartum C-section
NA (stratified by parity)
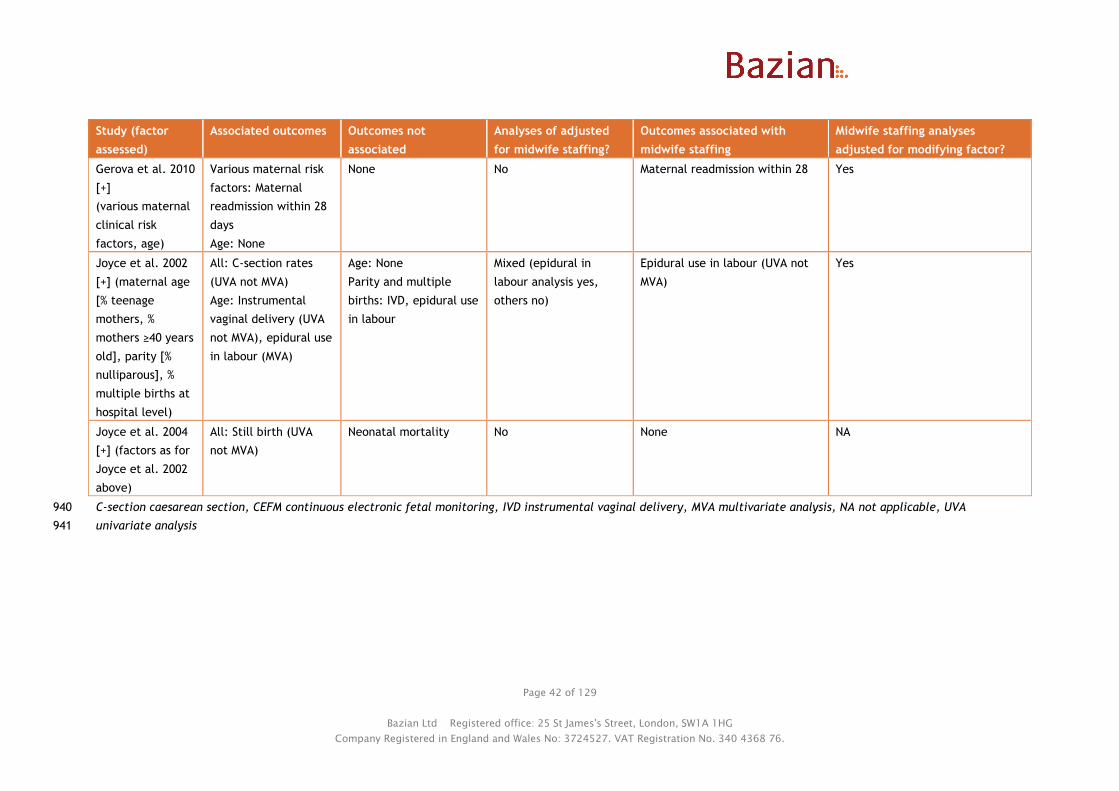
Page 42 of 129
Bazian Ltd Registered office: 25 St James's Street, London, SW1A 1HG
Company Registered in England and Wales No: 3724527. VAT Registration No. 340 4368 76.
Study (factor
assessed)
Associated outcomes Outcomes not
associated
Analyses of adjusted
for midwife staffing?
Outcomes associated with
midwife staffing
Midwife staffing analyses
adjusted for modifying factor?
Gerova et al. 2010
[+]
(various maternal
clinical risk
factors, age)
Various maternal risk
factors: Maternal
readmission within 28
days
Age: None
None No Maternal readmission within 28 Yes
Joyce et al. 2002
[+] (maternal age
[% teenage
mothers, %
mothers ≥40 years
old], parity [%
nulliparous], %
multiple births at
hospital level)
All: C-section rates
(UVA not MVA)
Age: Instrumental
vaginal delivery (UVA
not MVA), epidural use
in labour (MVA)
Age: None
Parity and multiple
births: IVD, epidural use
in labour
Mixed (epidural in
labour analysis yes,
others no)
Epidural use in labour (UVA not
MVA)
Yes
Joyce et al. 2004
[+] (factors as for
Joyce et al. 2002
above)
All: Still birth (UVA
not MVA)
Neonatal mortality No None NA
C-section caesarean section, CEFM continuous electronic fetal monitoring, IVD instrumental vaginal delivery, MVA multivariate analysis, NA not applicable, UVA 940
univariate analysis941
Page 43 of 129
Bazian Ltd Registered office: 25 St James's Street, London, SW1A 1HG
Company Registered in England and Wales No: 3724527. VAT Registration No. 340 4368 76.
The correlational study by Sandall et al. in press [++] (665,969 deliveries) found that there was an 942
interaction between midwife staffing and the woman’s clinical risk (based on presence or absence of 943
medical conditions or situations listed in NICE intrapartum care guidelines as increasing risk for the 944
woman or baby) for all healthy mother and baby outcomes, with greater benefit of increased staffing 945
in lower risk women (OR for outcome in lower risk vs. higher risk, p for interaction: healthy mother 946
OR 1.12 vs. 1.06, p=0.001; healthy baby OR 1.09 vs. OR 1.02, p=0.009; healthy mother and baby OR 947
1.12 vs. 1.06, p=0.007). There was no interaction between midwife staffing and clinical risk for the 948
other outcomes assessed (delivery with bodily integrity, p=0.15; spontaneous vaginal delivery, p=0.98; 949
intact perineum, p=0.77). 950
951
There was also an interaction between midwife staffing and parity for the outcome of intact 952
perineum, with greater benefit of increased staffing seen in women who had 4 or more children (OR 953
1.25 vs. OR 1.11 to 1.18 for lower parities; p for interaction = 0.007). There was no interaction 954
between midwife staffing and parity for the other outcomes assessed (delivery with bodily integrity, 955
p=0.33; spontaneous vaginal delivery, p=0.98). 956
957
Overall, the study found that woman’s clinical risk, parity, and age were the largest determinants of 958
outcomes, with about 98-99% of variability in outcomes across trusts estimated to be due to maternal 959
differences, and 1-2% of the variation due to differences between the trusts. 960
961
As well as looking at the impact of maternal clinical risk and parity on safe midwife staffing levels, 962
the study also looked at the effect of these variables and maternal age, and ethnicity on outcomes in 963
their own right (results for ethnicity reported under demography in question 2). Based on relative chi 964
squared values, maternal clinical risk and parity were the variables with the largest impact on 965
outcomes: 966
● Maternal clinical risk showed a dominant (relative chi squared value ≥10,000) significant 967
effect for all outcomes except intact perineum (range from 945 for intact perineum to 968
54,882 for all C-sections). Increasing clinical risk was associated with reduced chances of 969
positive outcomes (healthy mother and baby outcomes and mode of birth outcomes) and 970
increased chances of C-section outcomes. 971
● Parity showed a strong (relative chi squared values 1,000 to <10,000) or dominant significant 972
effect and over for all outcomes except healthy baby (range from 615 for healthy baby to 973
14,185 for delivery with bodily integrity, 3 effects dominant: healthy mother, intact 974
perineum, and delivery with bodily integrity). Increasing parity was associated with 975
increased chances of positive outcomes (mode of birth outcomes, healthy mother, and 976
healthy mother and baby) and reduced chances of emergency and all C-section, while the 977
relationship was not linear (monotonic) across all parities for healthy baby (least likely for 978
nulliparous women and most likely for women with 1 previous baby) and elective C section 979
(least likely for nulliparous women and most likely for women with 2 children). 980
● Maternal age group showed moderate (relative chi squared values 100 to <1000) or strong 981
significant effects for all outcomes except healthy baby (range 14 for healthy baby to 1,746 982
for spontaneous vaginal delivery, 4 strong effects: healthy mother, delivery with bodily 983
integrity, spontaneous vaginal delivery, and all C-sections). Increasing age was associated 984
with reduced chances of most positive outcomes (healthy mother and baby and mode of 985
delivery outcomes) and elective C-sections, and increased likelihood of emergency C-section 986
and all C-section. The relationship was not linear (monotonic) across all ages for healthy 987
baby (increasing likelihood up to age 40 to 45, but lowest for women aged 45 and over) and 988
intact perineum (most likely for age 19 and under and reducing likelihood to age 39, then 989
increasing slightly from age 40). 990

Page 44 of 129
Bazian Ltd Registered office: 25 St James's Street, London, SW1A 1HG
Company Registered in England and Wales No: 3724527. VAT Registration No. 340 4368 76.
991
The only other factors showing relative chi squared values over 10 were maternal ethnicity (range 6 992
for healthy baby to 158 for intact perineum) and deprivation of the area of residence (range 2 for all 993
C-section to 337 for intact perineum). All other factors (rural-urban classification, Strategic Health 994
Authority, trust size, university trust status, type of birth settings/units in the trust, FTE staff 995
available including FTE midwives, and staff ratios) had smaller effects on all outcomes. These results 996
were all from multilevel modelling, which included midwife staffing levels as well as other variables. 997
998
These results show the difficulties in using anything other than formal interaction analyses to assess 999
interactions with safe maternity staffing. For example, maternal clinical risk is itself significantly 1000
associated with all outcomes assessed, even after adjustment for midwife staffing levels. This could 1001
be interpreted as suggesting that maternal clinical risk could affect safe midwifery staffing levels for 1002
all of these outcomes. However, maternal clinical risk only interacts with midwife staffing levels for 1003
healthy mother and baby outcomes, and not the other outcomes assessed (delivery with bodily 1004
integrity, intact perineum, and spontaneous vaginal delivery). This is despite midwife staffing also 1005
being significantly associated with delivery with bodily integrity and intact perineum. 1006
1007
A cross sectional analysis of the cohort study by Cerbinskaite et al. 2011 [-] (333 emergency C-1008
sections) stratified results by grade of emergency C-section: grade 1 bring those where there was 1009
immediate threat to the life of the woman or fetus, and grade 2 being evidence of maternal or fetal 1010
compromise which is not immediately life threatening. It found that decision-to-delivery interval and 1011
transfer time to the operating theatre were significantly shorter with higher midwife staffing for both 1012
grades of C-section. For both outcomes the relative improvement with increased midwife staffing was 1013
greater for grade 2 C-sections (1:1 midwives:labouring women or more vs. fewer midwives than 1014
labouring women, decision-to-delivery interval ≤30 minutes: RR 1.71 for grade 1 vs. 4.62 for grade 2; 1015
transfer time ≤15 minutes: RR 1.16 for grade 1 vs. 1.37 for grade 2; RRs reviewer calculated). Midwife 1016
staffing was reported not to impact the time taken between arrival in the theatre to start of the 1017
operation (figures not reported), and this time span did not differ between grade 1 and 2 C-sections 1018
(mean: 19.1 minutes [SD 9.6] for grade 1 vs. 20.4 minutes [SD 8.6] for grade 2, p=0.201). The analyses 1019
of grade 1 C sections may not be as robust and have less power than those for grade 2 C-sections, as 1020
there were fewer grade 1 C-sections. 1021
1022
Without a formal test for interaction it is not possible to say whether the differences were 1023
statistically significant. However, they appear to suggest that higher midwife staffing may have a 1024
greater effect on timings of the less urgent grade 2 C-sections than the most urgent grade 1 C-1025
sections. This may reflect the urgency of grade 1 C-sections resulting in their prioritisation over other 1026
tasks even at lower midwife staffing levels, while the speed of the less urgent grade 2 sections may 1027
be more susceptible to midwife staffing levels at the time. However, due to the urgency of grade 1 C-1028
sections even if delays are shorter or less common than for grade 2 C-sections, this could still have a 1029
greater impact on outcomes. 1030
1031
The cohort study by Tucker et al. 2003 [+] (3,083 live births) stratified one of its outcomes 1032
(appropriate use of continuous electronic fetal monitoring) by maternal risk (not further defined). It 1033
found that increasing staffing was associated with a non-significant reduction in risk of appropriate 1034
CEFM monitoring in high risk women (OR 0.90), but a non-significant increase in risk of CEFM 1035
monitoring in low risk women (OR 1.12). Without formal interaction analysis it is not possible to say 1036
with certainty that clinical risk showed significant interaction with midwife staffing for this outcome. 1037
However, the different directions of effect suggest potential interaction. 1038
1039

Page 45 of 129
Bazian Ltd Registered office: 25 St James's Street, London, SW1A 1HG
Company Registered in England and Wales No: 3724527. VAT Registration No. 340 4368 76.
This study also reported that various maternal/fetal variables were associated with the use of 1040
continuous electronic fetal monitoring (CEFM): pre-eclampsia, suspected abruption, previous C-1041
section, preterm labour, no liquor, meconium stained liquor, use of oxytocin to accelerate labour, 1042
epidural, fetal heart rate anomaly at admission or in labour (figures not reported). Most of these 1043
would be indications for use of CEFM (e.g. fetal heart rate anomaly), which could explain the 1044
association seen. These factors were adjusted for in the analyses of impact of midwife staffing on 1045
CEFM monitoring. Results of univariate analysis were not reported, but after adjustment for these 1046
factors midwife staffing levels were not associated with any of the CEFM-related outcomes. The same 1047
variables (except for fetal heart rate anomaly variables) were adjusted for in the analyses of neonatal 1048
outcomes (Apgar score, neonatal resuscitation, or admission to the NNU) but it was not clearly 1049
reported whether this was because these factors were associated with these outcomes. Again no 1050
results of univariate analyses were reported, and midwife staffing showed no significant association 1051
with outcomes, except for a reduction in neonatal resuscitation excluding bag and mask resuscitation 1052
only (see Question 1 for details). Also, these analyses were not adjusted for midwife staffing levels. 1053
1054
The correlational study by Rowe et al. 2014 [+] (32,257 births to low risk women) did not formally 1055
assess interactions between parity and midwife staffing, but did stratify analyses by parity. The 1056
findings were not consistent across outcomes (see Tables in Question 1 for summary). For some 1057
outcomes the direction of effect differed: increased staffing was associated with a non-significant 1058
increase in normal birth and instrumental vaginal delivery in nulliparous women but non-significant 1059
reductions in multiparous women. Midwife staffing levels showed no association with epidural rates in 1060
multiparous women, but were associated with a non-significant reduction in epidurals in nulliparous 1061
women. For other outcomes the direction of effect was the same but significance differed: increased 1062
midwife staffing was associated with a reduction in straightforward birth and augmentation which was 1063
significant for multiparous but not nulliparous women (sizes of effect similar), and with an increase in 1064
intrapartum C-section which was significant for nulliparous but not multiparous women. For the latter 1065
groups power may explain differences in significance rather than interaction. Without formal 1066
interaction analysis it is not possible to say with certainty whether parity significantly interacted with 1067
midwife staffing for any outcomes in this study. 1068
1069
Additional indirect evidence from 3 studies supported that maternal and fetal characteristics are 1070
significantly associated with various process outcomes (e.g. epidural use in labour, C-section, 1071
instrumental vaginal delivery). They may therefore interact with or influence safe midwife staffing 1072
levels, but without formal tests of interaction it is not possible to say this with certainty. 1073
1074
One large correlational study (Gerova et al. 2010 [+]) found that the following maternal variables 1075
were associated with an significantly increased risk of maternal readmission within 28 days of 1076
discharge in multivariate regression analysis (presence of ≥1 maternal comorbidities (β 0.168 [SE 1077
0.068], p=0.014), ≥1 maternal admission in the past 12 months (0.499 [0.044], 0.741 [0.083], 0.995 1078
[0.108] for 1,2, or 3 admissions respectively, p<0.001 for all), longer pre-birth length of stay (0.114 1079
[0.03], 0.452 [0.100], 0.746 [0.223] for 1-4, 5-16 and 17+ days’ stay respectively, p≤0.001 for all), 1080
longer post-birth length of stay (0.231 [0.047], 0.437 [0.067] for 1-4 and 5-16 days’ stay respectively, 1081
p<0.001 for both), having a more complicated delivery (normal delivery with complications: 0.360 1082
[0.041], assisted delivery with complications: 0.444 [0.094], C-section: 0.472 [0.050], C-section with 1083
complications: 0.518 [0.041], p<0.001 for all). Maternal age was not significantly associated with 1084
readmission risk overall. These analyses did not include midwife or other staffing variables. The 1085
regression model was used to derive an expected readmission rate for each woman, and summed each 1086
trust, and this was used in the staffing regression model to adjust for between-trust differences in 1087
these variations. Midwife staffing levels were significantly associated with 28 day readmissions after 1088

Page 46 of 129
Bazian Ltd Registered office: 25 St James's Street, London, SW1A 1HG
Company Registered in England and Wales No: 3724527. VAT Registration No. 340 4368 76.
this risk adjustment. As unadjusted figures for the effects of midwife staffing ratios were not 1089
reported, and without formal interaction analyses it is difficult to determine whether these factors 1090
might directly affect safe midwife staffing. 1091
1092
One correlational study (Joyce et al. 2002 [+]) (540,834 births) assessed the impact of maternal/fetal 1093
characteristics at the unit level as well as midwife and other staffing on outcomes (C-section, 1094
instrumental vaginal delivery, epidural use). The maternal/fetal characteristics assessed were: % 1095
teenage mothers, % mothers >40 years old, % nulliparous, and % multiple births. 1096
1097
In univariate analyses, increased maternal age (% mothers ≥40 years old: β=2.08 [SE 0.627], p=0.002) 1098
and more multiple births (β=1.55 [SE 0.430], p=0.001) were associated with increased C-section rates, 1099
and fewer nulliparous women with reduced C-section rates (β=-0.32 [SE 0.148], p=0.033). Increased 1100
maternal age was also associated with increased instrumental vaginal delivery (IVD) and use of 1101
epidural in labour (% mothers >40 years old, for IVD: β=1.895 [SE 0.408], p<0.001; epidural rate: 1102
β=12.87 [SE 1.737], p<0.001), with the opposite for lower maternal age (% teenage mothers: β=-0.968 1103
[SE 0.158], p<0.001; epidural rate: β=-4.66 [SE 0.828], p<0.001). Parity and multiple births were not 1104
associated with epidural rates in labour or IVD in univariate analyses. 1105
1106
The only maternal characteristic which remained in the final multivariate models was % mothers aged 1107
40 or over, which was associated with a significant increase in rate of epidural use in labour (β=6.30 1108
[SE 1.310], overall model R2 0.637, p<0.001, model also included only % fathers in manual/other 1109
social class). The associations seen may represent preferences for or confidence to request epidurals 1110
by older women and those in higher social classes. Higher midwife staffing was associated with a 1111
significant reduction in epidural use in labour (but not other outcomes) in univariate analyses, but did 1112
not remain in the final multiple regression model. 1113
1114
A later publication by Joyce et al. 2004 [+], appeared to use the same data set, and looked at the 1115
effect of the same variables on the outcomes of stillbirth and neonatal mortality. Several of the unit 1116
level maternal characteristics were significantly associated with birth weight standardised stillbirth 1117
rates in univariate analyses, with an increase in stillbirth rates seem with fewer nulliparous women 1118
(β=-0.079, p=0.037), more births to teenage women (β=0.183, p=0.038), and fewer babies from 1119
multiple births (β=-0.485, p=0.001, SE figures not reported). Parental and other groups of related 1120
variables showed high levels of inter-correlation, so they were combined using principal component 1121
analysis before carrying out multiple regression. The parental combined variable included the 1122
significant maternal variables plus % births to fathers of manual or “other” social class, and was not 1123
retained in the final multiple regression model for standardised stillbirth rate. None of the maternal 1124
variables were associated with birth weight standardised neonatal mortality rates. Midwife staffing 1125
was not significantly associated with either outcome in univariate analysis. 1126
1127
Interventions used 1128
None of the studies identified looked specifically at the effect of the interventions used on safe 1129
midwifery staffing levels. Three studies looking at the association between midwife staffing and 1130
outcomes also assessed the effect of intervention type or use and outcomes (Cerbinskaite et al. 2011 1131
[-], Joyce et al. 2002 [+], Joyce et al. 2004 [+]). See Table 11 for a summary of their findings. 1132
1133
One cross sectional analysis of a cohort study (Cerbinskaite et al. 2011 [-]) (333 emergency grade 1 1134
and 2 C-sections) found that type of anaesthesia in grade 1 C sections was significantly associated 1135
with decision-to-delivery interval (p=0.007). Mean decision-to-delivery interval was significantly 1136

Page 47 of 129
Bazian Ltd Registered office: 25 St James's Street, London, SW1A 1HG
Company Registered in England and Wales No: 3724527. VAT Registration No. 340 4368 76.
shorter with general anaesthesia (19.7 minutes [SD 8.5]) than with spinal blockade (27.0 minutes [SD 1137
8.2], p<0.001). The mean decision-to-delivery interval with epidural top up (26.0 minutes [SD 18.7]) 1138
was similar to that for spinal blockade (no pairwise statistical comparisons reported). 1139
1140
For grade 2 C-sections, the type of anaesthesia was not significantly associated with decision-to-1141
delivery interval (mean [SD]: 29.2 [15.4] with epidural top up vs. 30.1 [19.4] with general anaesthetic 1142
vs. 34.7 [12.0] with spinal blockade; p=0.681). Higher midwife staffing levels were associated with a 1143
reduced decision-to-delivery interval for both grade 1 and 2 C-sections. 1144
1145
The effect of type of anaesthesia on decision-to-delivery interval was in at least in part due to 1146
differences in time from arrival in theatre to start of the operation for grade 1 C-sections, where type 1147
of anaesthesia had a significant effect (p<0.001), which was not seen for grade 2 C-sections 1148
(p=0.335). For grade 1 C-sections this interval was significantly shorter with general anaesthesia 1149
(mean 14.4 minutes [SD 6.0]) than with spinal blockade (24.6 [SD 9.6], p<0.001), or with epidural top 1150
up (20.0 [SD 11.4], p=0.032). Midwife staffing had no impact on this outcome for grade 1 or 2 C-1151
sections. 1152
1153
Midwife staffing influences decision-to-delivery interval for grade 1 and 2 C-sections, as does type of 1154
anaesthetic for grade 1 C-sections. This suggests that type of anaesthetic and midwife staffing may 1155
potentially interact to influence decision-to-delivery interval. However, without any statistical 1156
assessment of the interaction it is not possible to draw firm conclusions about their relationship. None 1157
of the figures from this study were adjusted for staffing levels or other potential confounders. 1158
1159
One correlational study (Joyce et al. 2002 [+]) (540,834 births) assessed the impact of intervention 1160
rates as well as midwife and other staffing on outcomes (C-section, instrumental vaginal delivery, 1161
epidural use). The demographic variables assessed were: overall epidural rate/100 deliveries, rate of 1162
epidural use in labour (i.e. not for C-sections)/100 labour deliveries, induction rate/100 deliveries, 1163
instrumental vaginal delivery rate/100 births, and C-section rate/100 deliveries. 1164
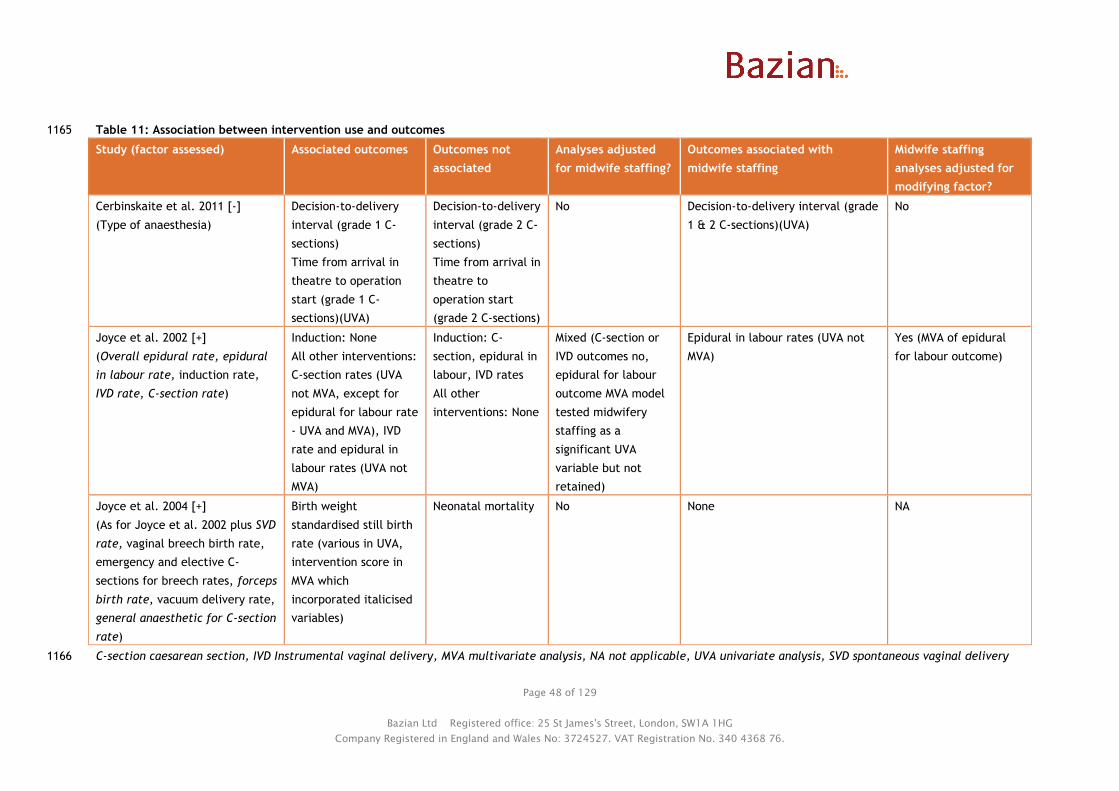
Page 48 of 129
Bazian Ltd Registered office: 25 St James's Street, London, SW1A 1HG
Company Registered in England and Wales No: 3724527. VAT Registration No. 340 4368 76.
Table 11: Association between intervention use and outcomes 1165
Study (factor assessed) Associated outcomes Outcomes not
associated
Analyses adjusted
for midwife staffing?
Outcomes associated with
midwife staffing
Midwife staffing
analyses adjusted for
modifying factor?
Cerbinskaite et al. 2011 [-]
(Type of anaesthesia)
Decision-to-delivery
interval (grade 1 C-
sections)
Time from arrival in
theatre to operation
start (grade 1 C-
sections)(UVA)
Decision-to-delivery
interval (grade 2 C-
sections)
Time from arrival in
theatre to
operation start
(grade 2 C-sections)
No Decision-to-delivery interval (grade
1 & 2 C-sections)(UVA)
No
Joyce et al. 2002 [+]
(Overall epidural rate, epidural
in labour rate, induction rate,
IVD rate, C-section rate)
Induction: None
All other interventions:
C-section rates (UVA
not MVA, except for
epidural for labour rate
- UVA and MVA), IVD
rate and epidural in
labour rates (UVA not
MVA)
Induction: C-
section, epidural in
labour, IVD rates
All other
interventions: None
Mixed (C-section or
IVD outcomes no,
epidural for labour
outcome MVA model
tested midwifery
staffing as a
significant UVA
variable but not
retained)
Epidural in labour rates (UVA not
MVA)
Yes (MVA of epidural
for labour outcome)
Joyce et al. 2004 [+]
(As for Joyce et al. 2002 plus SVD
rate, vaginal breech birth rate,
emergency and elective C-
sections for breech rates, forceps
birth rate, vacuum delivery rate,
general anaesthetic for C-section
rate)
Birth weight
standardised still birth
rate (various in UVA,
intervention score in
MVA which
incorporated italicised
variables)
Neonatal mortality No None NA
C-section caesarean section, IVD Instrumental vaginal delivery, MVA multivariate analysis, NA not applicable, UVA univariate analysis, SVD spontaneous vaginal delivery1166

Page 49 of 129
Bazian Ltd Registered office: 25 St James's Street, London, SW1A 1HG
Company Registered in England and Wales No: 3724527. VAT Registration No. 340 4368 76.
In general, higher rates of the individual interventions (except induction rates) were associated with 1167
significant increases in the other interventions in univariate analyses. Higher overall epidural rate 1168
(β=0.142 [SE 0.033], p<0.001), epidural in labour rate (β=0.147 [SE 0.045], p=0.002), and instrumental 1169
vaginal delivery rate (β=0.407 [SE 0.180], p=0.028), were associated with increased C-section rates. 1170
Higher overall epidural rate (β=0.155 [SE 0.016], p<0.001), epidural in labour rate (β=0.195 [SE 1171
0.022], p<0.001), and C-section rate (β=0.199 [SE 0.088], p=0.028), were associated with increased 1172
instrumental vaginal delivery rates. Higher instrumental vaginal delivery rates (β=3.942 [SE 0.418], 1173
p<0.001), and C-section rate (β=1.762 [SE 0.404], p<0.001), were associated with increased overall 1174
epidural rate. Higher midwife staffing levels were associated with reduced epidural rate in univariate 1175
analyses, but not the other outcomes. 1176
1177
In the final multiple regression models epidural rates for labour remained a significant predictor of C-1178
section rates (β=0.126 [SE 0.039], overall model R2 0.435, p<0.001, model also included delivery bed 1179
rate and junior obstetrician/gynaecologist staffing levels) and instrumental vaginal delivery rates 1180
(β=0.123 [SE 0.028], overall model R2 0.644, p<0.001, model also included father’s social class only). 1181
The other intervention rates were not retained in the final models. As midwife staffing levels were 1182
associated with epidural rates in univariate analysis (but not multivariate analysis), and epidural rates 1183
are a significant predictor of other interventions (C-section and instrumental vaginal delivery), these 1184
factors may interact, but without formal tests for this it is not possible to say this with certainty. 1185
1186
A later publication by Joyce et al. 2004 [+], used the same data set, and looked at the effect of the 1187
same variables plus a few additional intervention/non-intervention variables (spontaneous vaginal 1188
delivery/100 births, vaginal births/100 breeches, emergency C-sections/100 breeches, elective C-1189
sections/100 breeches, forceps/100 births, vacuum delivery/100 births, general anaesthetics/100 C-1190
sections) on the outcomes of stillbirth and neonatal mortality. None of the intervention variables (or 1191
midwife staffing) were significantly associated with neonatal mortality in univariate analyses. 1192
1193
In univariate analyses a number of the intervention variables showed a significant association with 1194
birth weight standardised stillbirth rates (SSBR), with the following associated with increased SSBR: 1195
more spontaneous vaginal deliveries (β=0.088, p=0.002), fewer C-sections (β=-0.091, p=0.026), fewer 1196
forceps deliveries (β=-0.176, p=0.035), fewer instrumental deliveries (β=-0.153, p=0.008), fewer 1197
epidurals overall (β=-0.036, p=0.001), fewer epidurals for labour (β=-0.042, p=0.005), more general 1198
anaesthetics for C-sections (β=0.032, p=0.002; SEs not reported). Due to a high level of inter-1199
correlation between intervention and other related variables, the study combined these using 1200
principal components analysis to give two principal components. One of these remained significant in 1201
the final multiple regression model, with more interventions associated with significantly lower birth 1202
weight standardised stillbirth rates (β=-0.21 [SE 0.07], p=0.003, R2 for overall model 0.27, model also 1203
included number of consultant obstetricians per 1000 births). For an increase in one interquartile 1204
range in the intervention score (2.47 units), there was a reduction of 0.52 in the SSBR (larger than the 1205
0.26 reduction seen with an interquartile increase in obstetrician variable). 1206
1207
Whether there is an interaction between an interventionist approach and safe midwife staffing levels 1208
is not possible to say with certainty. Midwife staffing was not associated with the outcomes which 1209
were associated with the intervention variables in multiple regression models. It was associated with 1210
a reduction in epidural rates in univariate analysis, so if epidural (and intervention) rates are 1211
associated with outcomes then there could be interaction. Without formal interaction analyses it is 1212
not possible to say with certainty. 1213
1214
1215

Page 50 of 129
Bazian Ltd Registered office: 25 St James's Street, London, SW1A 1HG
Company Registered in England and Wales No: 3724527. VAT Registration No. 340 4368 76.
Neonatal risk factors or needs 1216
No studies directly assessed whether neonatal risk factors or needs affected safe midwife staffing 1217
levels. Two publications (Joyce et al. 2002 [+], Joyce et al. 2004 [+]) based on analysis of the same 1218
observational data assessed the association between birth weight and outcomes. See Table 12 for a 1219
summary of their findings. 1220
1221
One correlational study (Joyce et al. 2002 [+]) (540,834 births) assessed the impact of neonatal 1222
characteristics as well as midwife and other staffing on outcomes (C-section, instrumental vaginal 1223
delivery, epidural use). The neonatal characteristics assessed were: mean birth weight and % very low 1224
birth weight (<1.5kg). 1225
1226
Higher mean birth weight was associated with a reduced C-section rate (β=-0.014 [SE 0.006], p=0.040) 1227
while the opposite was true of increased proportion of very low birth weight babies (β=1.31 [SE 1228
0.429], p=0.004). These relationships may relate to multiple births and premature births, where lower 1229
birth weight and C-sections may be more likely (multiple births were also significantly associated with 1230
C-sections in univariate analysis, while gestational age was not a variable tested). Neither neonatal 1231
characteristic remained significantly associated with C-section in the multiple regression model. They 1232
were not associated with the other outcomes in univariate analysis (instrumental vaginal delivery or 1233
epidural use in labour). Midwife staffing was associated with epidural rate in univariate analyses but 1234
was not retained in the final multiple regression model; it was not associated with the other 1235
outcomes. 1236
1237
A later publication by Joyce et al. 2004 [+], appeared to use the same data set, and looked at the 1238
effect of the same variables on the outcomes of stillbirth and neonatal mortality. Birth weight 1239
accounted for over 70% of the variability in overall death rates (stillbirth and neonatal) (mean birth 1240
weight: R2 0.708, p<0.001; % births <1.5kg: R2 0.752, p<0.001; % births <2.5kg: R2 0.719, p<0.001; 1241
betas not reported). Therefore stillbirth and neonatal mortality rates were standardised for birth 1242
weight, and rather than including birth weight variables in subsequent analyses. Midwife staffing was 1243
not significantly associated with either outcome in univariate analysis. 1244

Page 51 of 129
Bazian Ltd Registered office: 25 St James's Street, London, SW1A 1HG
Company Registered in England and Wales No: 3724527. VAT Registration No. 340 4368 76.
Table 12: Association between birth weight and outcomes 1245
Study (factor
assessed)
Associated outcomes Outcomes not
associated
Analyses of adjusted
for midwife staffing?
Outcomes associated with
midwife staffing
Midwife staffing analyses
adjusted for modifying factor?
Joyce et al. 2002
[+]
(mean birth
weight; very low
birth weight
[VLBW])
C-section (UVA not
MVA)
Epidural use in labour,
instrumental vaginal
delivery
No Epidural use in labour (univariate
not multivariate)
No
Joyce et al. 2004
[+]
(mean birth
weight; LBW;
VLBW)
Pooled stillbirth &
neonatal mortality
(UVA, not included in
MVA)
None No None Yes (mortality rates standardised
by birth weight)
C-section caesarean section, LBW low birth weight (<2.5 kg), MVA multivariate analysis, UVA univariate analysis, VLBW very low birth weight (<1.5 kg) 1246

Page 52 of 129
Bazian Ltd Registered office: 25 St James's Street, London, SW1A 1HG
Company Registered in England and Wales No: 3724527. VAT Registration No. 340 4368 76.
1247
Stage of maternity care pathway 1248
None of the studies identified looked specifically at the effect of stage of the maternity care pathway 1249
on safe midwifery staffing levels. 1250
1251
Five of the observational studies dealt specifically with midwife staffing on obstetric units (Rowe et 1252
al. 2014 [+], Cerbinskaite et al. 2011 [-], Joyce et al. 2002 [+], Joyce et al. 2004 [+], Tucker et al. 1253
2003 [+]). The other two observational studies looked at midwife staffing at the trust level (Sandall et 1254
al. in press [++], Gerova et al. 2010 [+]) and therefore would cover all care provided at all stages of 1255
the maternity care pathway. The RCT (NSCCRT 2000 [+]) also covered all stages of the maternity care 1256
pathway. 1257
1258
1259
Evidence statement 2: Effect of maternal and neonatal factors on midwifery staffing 1260
requirements 1261
Evidence from 1 UK cohort study1 ([+] 3,083 live births), 1 cross sectional analysis of a UK cohort 1262
study2 ([-] 333 caesarean sections) and 5 UK correlational studies3-7 ([++] 665,969 births3; [+] 540,834 1263
births4,5; [+] 615,042 women6; [+] 32,257 births7) suggests that: 1264
1265
Maternal clinical risk and parity may modify the association between midwife staffing and a 1266
range of outcomes1,2,3,7, they are also associated with some maternal and neonatal 1267
outcomes1,3,4,6 although not all associations were formally tested for significance, adjusted for 1268
midwife staffing, or remained significant after adjustment for confounders 1269
Maternal age3,4,5,6 and use of intrapartum interventions2,4,5 may be associated with some 1270
maternal and neonatal outcomes, although not all analyses were adjusted for midwife staffing or 1271
remained significant after adjustment for confounders 1272
Mixed results were found for the association between number of women in labour on the 1273
ward1,2 and birthweight4,5 and maternal and neonatal outcomes in analyses not adjusted for 1274
midwife staffing 1275
No evidence was identified on the effect of stage of the maternity care pathway on midwife 1276
staffing requirements. 1277
1278 1 Tucker et al. 2003 [+] 1279 2 Cerbinskaite et al. 2011 [-] 1280 3 Sandall et al. in press [++] 1281 4 Joyce et al. 2002 [+] 1282 5 Joyce et al. 2004 [+] 1283 6 Gerova et al. 2010 [+] 1284 7 Rowe et al. 2014 [+] 1285
1286
1287
1288

Page 53 of 129
Bazian Ltd Registered office: 25 St James's Street, London, SW1A 1HG
Company Registered in England and Wales No: 3724527. VAT Registration No. 340 4368 76.
Question 3: What environmental factors affect safe midwifery staffing 1289
requirements? 1290
Environmental studies were assessed in 6 studies: Sandall et al. in press [++], Joyce et al. 2002 [+], 1291
Joyce et al. 2004 [+], Gerova et al. 2010 [+], Rowe et al. 2014 [+], and Tucker et al. 2003 [+]. 1292
1293
The potential maternal and neonatal modifying factors addressed by these studies included: 1294
● Local geography (urban-rural classification, region) 1295
● Local demography (deprivation, ethnicity, social class) 1296
● Birth settings (types of unit available within the trust, presence of an alongside midwifery unit, 1297
proportion of planned out of hospital and out of obstetric unit births within the trust) 1298
● Unit size (number of births, delivery beds, or neonatal unit beds) 1299
● Physical layout (presence of dedicated maternity theatre) 1300
1301
Local geography 1302
No studies directly assessed the potential impact of local geography on safe midwife staffing. One 1303
correlational study (Sandall et al. in press [++]) assessed the association between the geographical 1304
location (urban-rural classification, which included the type of area and population density), and the 1305
region (Strategic Health Authority, SHA) of the women’s residence on trust-level outcomes. See Table 1306
13 for a summary of their findings. 1307
1308
In multilevel models including a midwife staffing variable, there was some variability in outcome 1309
across the SHAs, with the East Midlands performing best on a number of outcomes, and London the 1310
worst. For example, for the healthy mother and baby outcome ORs ranged from 1.253 (East Midlands, 1311
p=0.0480) to 0.907 (London, p=0.3329). Only some of the differences were statistically significant, for 1312
example, variations in C-section outcomes, spontaneous vaginal delivery, and intact perineum were 1313
not significant (see Evidence table for details, comparison/reference group was South West SHA). 1314
1315
In sensitivity analyses which only included the 50 trusts which only had a single obstetric unit (i.e. 1316
where exposures and outcomes would effectively refer to a single unit only), the performance of 1317
trusts in London improved for some outcomes (e.g. moving from worst to 5th best for the healthy 1318
mother outcome). This suggests that within individual regions there is variability in outcomes 1319
between units within trusts which is influencing results. 1320
1321
There was also variability across the urban-rural classifications, with living in an area falling into the 1322
“Village – less sparse” classification tending to be associated with better outcomes, and “Urban ≥10k – 1323
sparse” or “Hamlet and isolated dwelling – sparse” associated with poorer outcomes. For example, for 1324
the healthy baby outcome ORs ranged from 1.104 (Village – less sparse, p=0.0146) to 0.797 (Urban 1325
≥10k - sparse, p=0.0478). Only some of the differences were significant for example, variations in C-1326
section outcomes were not significant (see Evidence Table for details, “Hamlet and isolated dwelling- 1327
less sparse” was the reference/comparator group). 1328
1329
The presence of significant associations between both local geography measures and healthy mother 1330
and baby outcomes, delivery with bodily integrity, and normal birth, and between urban-rural 1331
classification and the outcomes of spontaneous vaginal delivery and intact perineum after 1332
adjustment for midwife staffing suggests that these factors could influence safe midwife staffing 1333
levels. This may particularly be the case for the outcome of delivery with bodily integrity, which also 1334
shows a significant association with midwife staffing levels. 1335
1336

Page 54 of 129
Bazian Ltd Registered office: 25 St James's Street, London, SW1A 1HG
Company Registered in England and Wales No: 3724527. VAT Registration No. 340 4368 76.
Table 13: Association between local geography and demography and outcomes 1337
Study (factor assessed) Associated outcomes Outcomes
not
associated
Analyses adjusted for
midwife staffing?
Outcomes associated with
midwife staffing
Midwife staffing
analyses adjusted for
modifying factor?
Geography
Sandall et al. 2011 [++]
(urban-rural classification,
region based on Strategic
Health Authority)
Urban-rural classification and
region: Healthy mother and
baby outcomes, delivery with
bodily integrity (DwBI), and
normal birth
Urban-rural classification:
spontaneous vaginal delivery
(SVD), intact perineum
C-section
outcomes
Yes Delivery with bodily integrity,
intact perineum
Yes
Demography
Sandall et al. in press [++]
(Deprivation, maternal
ethnicity)
Healthy mother and baby
outcomes, DwBI, normal birth,
SVD, intact perineum, C-section
outcomes
None Yes Delivery with bodily integrity,
intact perineum
Yes
Joyce et al. 2002 [+]
(Deprivation, social class)
Deprivation: None
Social class: epidural in labour
(MVA), instrumental vaginal
delivery (MVA)
C-section Mixed (epidural in
labour analysis yes,
other analyses no)
Epidural in labour (UVA, not MVA) Yes
Joyce et al. 2004 [+]
(Deprivation, social class)
Deprivation: Neonatal mortality
(UVA)
1. Social class: Still births
(UVA not MVA)
None No None NA
Gerova et al. 2010 [+]
(Deprivation, ethnicity)
Maternal readmission within 28
days of discharge
None No Maternal readmission within 28
days of discharge
Yes
C-section caesarean section, DwBI Delivery with bodily integrity, MVA multivariate analysis, SVD spontaneous vaginal delivery, UVA univariate analysis 1338

Page 55 of 129
Bazian Ltd Registered office: 25 St James's Street, London, SW1A 1HG
Company Registered in England and Wales No: 3724527. VAT Registration No. 340 4368 76.
Local demography 1339
No studies directly assessed the impact of local demography on safe midwife staffing levels. Four 1340
studies which assessed midwife staffing also assessed the effect of local demographic variables on the 1341
same outcomes (Sandall et al. in press [++], Joyce et al. 2002 [+], Joyce et al. 2004 [+], Gerova et al. 1342
2010 [+]). See Table 13 for a summary of their findings. 1343
1344
One correlational study (Sandall et al. in press [++]) (665,969 births) assessed the association between 1345
ethnicity and index of multiple deprivation (based on postcode of residence) on trust-level outcomes. 1346
1347
In multilevel models which adjusted for midwife staffing, women who were Caribbean (Black or Black 1348
British) or mixed Black and White Caribbean had a number of better outcomes compared with other 1349
ethnicities (highest rates of healthy mother, healthy mother and baby, delivery with bodily integrity, 1350
normal birth, spontaneous vaginal delivery, and intact perineum). Indian women had a number of 1351
poorer outcomes (lowest rates of healthy mother, healthy mother and baby, delivery with bodily 1352
integrity, and spontaneous vaginal delivery). Relationships between ethnicity and outcomes were 1353
minor to moderate in strength, and there was significant variation in outcome by ethnicity among all 1354
of the outcomes assessed (see Evidence table for details; comparison/reference group “any other 1355
ethnic group”). 1356
1357
In these models increasing deprivation was linearly associated with increased likelihood of healthy 1358
mother outcome (most deprived vs. least deprived quintile OR 1.382), healthy mother and baby 1359
outcome (OR 1.323), delivery with bodily integrity (OR 1.457), normal births (OR 1.125), spontaneous 1360
vaginal delivery (OR 1.100) and intact perineum (OR 1.546) but decreased likelihood of healthy baby 1361
outcome (OR 0.854, p<0.0001 for all comparisons). Relationships for C-sections were significant, but 1362
mixed in terms of direction of the effect, with increasing deprivation associated with an increased 1363
risk of emergency C-section (OR 1.113, p<0.0001), but reduced risk of elective C-section (OR 0.816, 1364
p<0.0001), and overall C-section (OR 0.971, p=0.019). These relationships were minor to moderate in 1365
strength. 1366
1367
One correlational study (Joyce et al. 2002 [+]) (540,834 births) assessed the impact of demographic 1368
characteristics at the unit level as well as midwife and other staffing on outcomes (C-section, 1369
instrumental vaginal delivery, epidural use). The demographic variables assessed were: % fathers in 1370
the manual or “other” social class and mean Townsend deprivation score of the district of birth. 1371
1372
In univariate analyses, deprivation was not significantly associated with any of the outcomes (increase 1373
in Townsend score indicates greater deprivation so betas show effect of increasing deprivation; C-1374
section: β=0.337, p=0.116; instrumental vaginal delivery: β=-0.167, p=0.269; epidural in labour: 1375
β=0.395, p=0.607). This may differ from the findings of Sandall et al. due to the use of a different 1376
measure of deprivation (Townsend score versus Index of Multiple Deprivation), different time periods 1377
assessed (1994-1996 for Joyce et al. and 2010-2011 for Sandall et al.), the lack of adjustment for 1378
midwife staffing and other factors in the analysis by Joyce et al., or differences in the level of 1379
analysis (unit level for Joyce et al. and trust level for Sandall et al.). 1380
1381
In univariate analyses, an increase in the percentage of fathers in the manual or “other” social class 1382
was significantly associated with reduced instrumental vaginal delivery rate (β=-0.193 [SE 0.024], 1383
p<0.001) and reduced epidural rate (β=-0.96 [SE 0.120], p<0.001), but was not significantly associated 1384
with C-section rates (β=-0.08 [SE 0.048], p=0.088). 1385
1386
Page 56 of 129
Bazian Ltd Registered office: 25 St James's Street, London, SW1A 1HG
Company Registered in England and Wales No: 3724527. VAT Registration No. 340 4368 76.
In the final multiple regression models, father’s manual or “other” social class, remained significantly 1387
associated with reduced instrumental vaginal delivery rate (β=-0.105 [SE 0.029], overall R2 0.644 and 1388
p<0.001 for model, which included epidural rate as the only other variable), and also with epidural 1389
rate (β=-0.49 [SE 0.094], overall R2 0.637 and p<0.001 for model, which included % mothers aged ≥40 1390
as the only other variable). Midwife staffing level had only been associated with epidural rate in 1391
univariate analysis (β=-0.532 [SE 0.264], p=0.049), but did not remain significant in the final multiple 1392
regression model. 1393
1394
There is some evidence that higher levels of midwife staffing are also associated with reduced 1395
epidural use (see Question 1), if father’s social class also influences this outcome they may interact. 1396
However, without a stratified analysis by father’s social class or interaction analysis it is difficult to 1397
assess the impact of father’s social class on safe midwife staffing levels. 1398
1399
A later publication by Joyce et al. 2004 [+], used the same data set, and looked at the effect of the 1400
same variables on the outcomes of stillbirth and neonatal mortality. In univariate analysis increased 1401
deprivation was the only variable associated with an increase in birth weight standardised neonatal 1402
mortality (β=0.106, p=0.106), and as such multiple regression was not carried out. An increasing 1403
proportion of babies with paternal manual or “other” social class was associated with an increase in 1404
birth weight standardised still birth (β=0.039, p=0.008), but this variable was not retained in the final 1405
multiple regression model. Midwife staffing was not associated with either of these outcomes in 1406
univariate analysis. 1407
1408
The correlational study by Gerova et al. 2010 [+] assessed a number of individual level variables on 1409
maternal readmission within 28 days of discharge. It found that living in the most deprived areas was 1410
associated with significantly higher risk of readmission (Carstairs deprivation index score 5 vs. 1 [least 1411
deprived]: β=0.133 [SE 0.048], p=0.006), as was Black or Black British vs. White ethnicity (0.238 1412
[0.056], p<0.001). These analyses did not include staffing variables. 1413
1414
Birth settings 1415
No studies directly assessed the impact of birth settings on safe midwife staffing levels. Two studies 1416
which assessed midwife staffing also assessed the effect of birth setting variables (type of birth units 1417
available in the trust, whether the trust was a university hospital trust, presence of a midwifery unit 1418
alongside the obstetric unit [AMU], % of births planned to be outside of the obstetric unit and % of 1419
births planned to be outside of the hospital) on the same outcomes (Sandall et al. in press [++], Rowe 1420
et al. 2014 [+]). See Table 14 for a summary of their findings. 1421
1422
One correlational study (Sandall et al. in press [++]) (665,969 births) assessed the association between 1423
type of birth units available within the trust (obstetric units alone, or with alongside midwifery units 1424
[AMU] and/or freestanding midwifery units [FMU]) and whether the trust included a university 1425
hospital on trust-level outcomes. 1426
1427
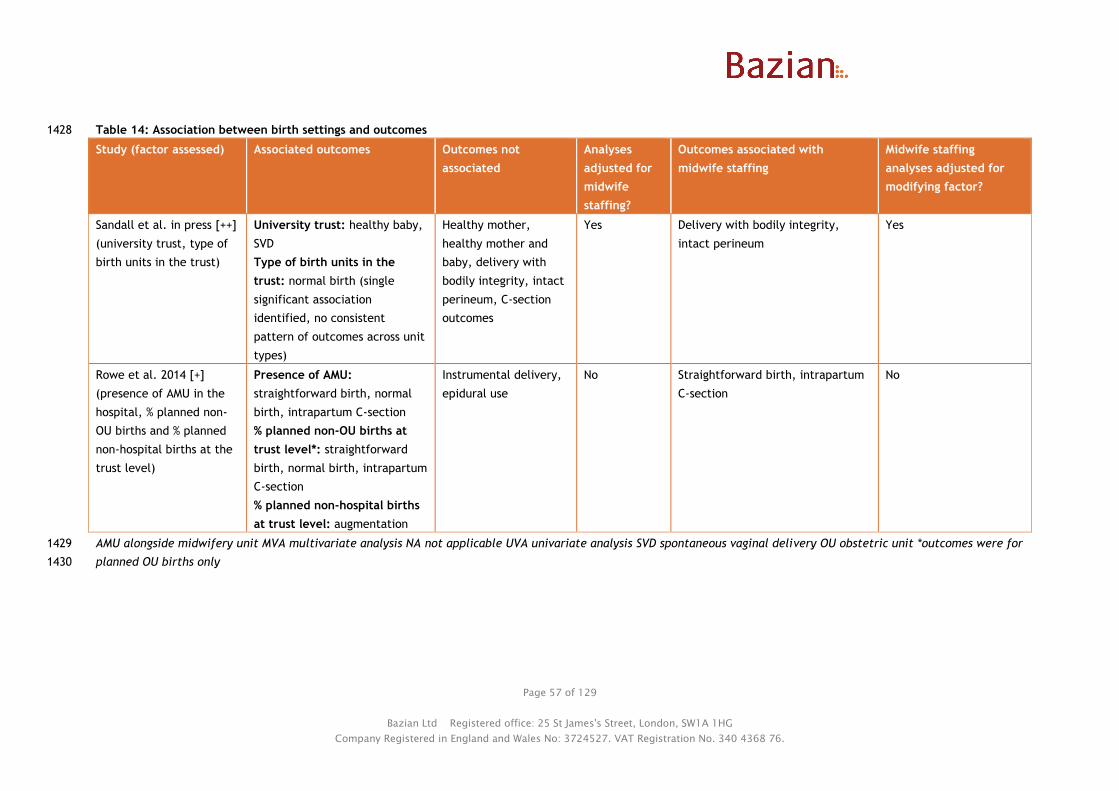
Page 57 of 129
Bazian Ltd Registered office: 25 St James's Street, London, SW1A 1HG
Company Registered in England and Wales No: 3724527. VAT Registration No. 340 4368 76.
Table 14: Association between birth settings and outcomes 1428
Study (factor assessed) Associated outcomes Outcomes not
associated
Analyses
adjusted for
midwife
staffing?
Outcomes associated with
midwife staffing
Midwife staffing
analyses adjusted for
modifying factor?
Sandall et al. in press [++]
(university trust, type of
birth units in the trust)
University trust: healthy baby,
SVD
Type of birth units in the
trust: normal birth (single
significant association
identified, no consistent
pattern of outcomes across unit
types)
Healthy mother,
healthy mother and
baby, delivery with
bodily integrity, intact
perineum, C-section
outcomes
Yes Delivery with bodily integrity,
intact perineum
Yes
Rowe et al. 2014 [+]
(presence of AMU in the
hospital, % planned non-
OU births and % planned
non-hospital births at the
trust level)
Presence of AMU:
straightforward birth, normal
birth, intrapartum C-section
% planned non-OU births at
trust level*: straightforward
birth, normal birth, intrapartum
C-section
% planned non-hospital births
at trust level: augmentation
Instrumental delivery,
epidural use
No Straightforward birth, intrapartum
C-section
No
AMU alongside midwifery unit MVA multivariate analysis NA not applicable UVA univariate analysis SVD spontaneous vaginal delivery OU obstetric unit *outcomes were for 1429
planned OU births only1430
Page 58 of 129
Bazian Ltd Registered office: 25 St James's Street, London, SW1A 1HG
Company Registered in England and Wales No: 3724527. VAT Registration No. 340 4368 76.
Unadjusted rates of outcomes showed that university hospital trusts performed less well than non-1431
university trusts on all outcomes (statistical comparisons not provided). In multilevel models adjusted 1432
for midwife staffing and other variables, compared to women from a university hospital trust, women 1433
from non-university trusts were more likely to give birth to a healthy baby (OR 1.134, 95% CI 1.016 to 1434
1.265, p=0.0253) and to have a spontaneous vaginal delivery (OR 1.090, 95% CI 1.012 to1.175, 1435
p=0.024), but the effect was small (based on relative chi squared values). 1436
1437
University trust status did not have a significant association with other outcomes, although the 1438
direction of effect was consistently towards better outcomes at non-university hospital trusts (healthy 1439
mother, healthy mother and baby, normal birth, delivery with bodily integrity, intact perineum, 1440
elective C-section, emergency C-section, or all C-section). While the results did take into account 1441
women’s clinical risk, this may still reflect that university hospitals may deal with more complicated 1442
pregnancies. 1443
1444
In sensitivity analyses including only the 50 trusts with a single obstetric unit (i.e. reducing it to an 1445
approximation of unit level analysis, with the exception of home births) the direction of effects 1446
changed, and attending a university trust no longer appeared disadvantageous. Non-university trusts 1447
were no longer better for the healthy baby indicator or for spontaneous vaginal delivery, and 1448
performed worse than university trusts for the normal birth outcome (β=-0.207 [SE 0.106], p=0.050). 1449
The reason for this reversal of effect is not clear, as it could reflect a variety of causes, for example 1450
poorer university hospital outcomes in university trusts with more than one obstetric unit, or poorer 1451
non-university hospital outcomes in university trusts with more than one obstetric unit reducing 1452
overall outcomes at that trust. The results suggest that a unit level analysis is needed to determine 1453
associations between university hospital status and outcomes. 1454
1455
There was not a clear pattern of unadjusted outcomes by type birth units available within the trust. 1456
In multilevel models the only significant association identified was for the outcome of normal birth, 1457
where trusts with obstetric units alone had a significantly lower rate of normal births than those with 1458
obstetric units (OUs) and FMUs (OR 0.885, 95% CI 0.789 to 0.992, p=0.0362). There was not a 1459
consistent pattern of non-significant outcomes across the different type of birth units available (see 1460
Evidence Table for details, comparator/reference group trusts with OU and FMU). 1461
1462
The correlational study by Rowe et al. 2014 [+] (32,257 births to low risk women planned to take 1463
place vaginally and in an obstetric unit) assessed the association between presence of an AMU, % of 1464
planned non-obstetric unit births (i.e. at home, an AMU or [FMU]) and of planned out of hospital 1465
births (i.e. at home or in an FMU) in the NHS trust which included the obstetric unit, and mode of 1466
birth outcomes for that obstetric unit (straightforward birth, normal birth, intrapartum C-section, 1467
and instrumental delivery, and use of epidural or augmentation). 1468
1469
Although the study assessed the impact of the presence of alternative types of birth units the 1470
outcomes were solely assessed in births which were planned to take place within an obstetric unit. In 1471
the analyses outcome rates were adjusted for maternal/fetal characteristics but not adjusted for 1472
midwife staffing or other variables. The study considered p<0.05 to be statistically significant (i.e. 1473
p=0.05 was not significant). Results in this study were for low risk women only, and therefore may not 1474
apply to higher risk women. 1475
1476
Presence of an AMU was associated with a significant reduction in straightforward birth or normal 1477
birth in multiparous women, the direction of effect was the same in nulliparous women but this did 1478
not reach significance (straightforward birth: nulliparous R2 1.4%, β=-1.40, p=0.55; multiparous R2 1479
Page 59 of 129
Bazian Ltd Registered office: 25 St James's Street, London, SW1A 1HG
Company Registered in England and Wales No: 3724527. VAT Registration No. 340 4368 76.
14.8%, β=-3.14, p=0.04; normal birth: nulliparous R2 10.1%, β=-5.16, p=0.08; multiparous R2 21.1%, 1480
β=-6.35, p=0.02). It was also associated with a significant increase in intrapartum C-section for 1481
nulliparous women, the direction of effect was the same in multiparous women but this did not reach 1482
significance (nulliparous R2 22.8%, β=4.99, p=0.03; multiparous R2 23.1%, β=3.23, p=0.06). The 1483
association between presence of an AMU and increased use of augmentation just missed significance 1484
in nulliparous women (nulliparous R2 14.0%, β=5.59, p=0.05; multiparous R2 9.6%, β=2.73, p=0.07). All 1485
other associations were not significant. Study authors noted that chance could not be ruled out as 1486
results were not consistently significant across multiple outcomes. 1487
1488
A higher percentage of planned non-obstetric unit births in the NHS trust was significantly associated 1489
with a reduced rate of straightforward births and normal births in multiparous women in the obstetric 1490
unit, with the same direction of effect in nulliparous women but not reaching significance 1491
(straightforward birth: nulliparous R2 8.2% β=-0.17, p=0.06; multiparous R2 26.3% β=-0.22, p=0.01; 1492
normal birth: nulliparous R2 6.1% β=-0.20, p=0.08; multiparous R2 17.4% β=-0.25, p=0.01). A higher 1493
percentage of planned non-obstetric unit births was also associated with an increased rate of 1494
intrapartum C-sections in both parity groups (nulliparous: R2 31.8% β=0.31, p=0.02; multiparous: R2 1495
43.4% β=0.23, p=0.01). Associations with other outcomes were non-significant. 1496
1497
A higher percentage of planned out of hospital births (i.e. at home of in an FMU) was associated with 1498
a significantly reduced rate of augmentation in nulliparous women, with the same direction of effect 1499
in multiparous women but not reaching significance (nulliparous: R2 13.7% β=-0.73, p=0.02; 1500
multiparous: R2 1.3% β=-0.13, p=0.43). All other associations were not significant. 1501
1502
Outcome rates in this study only included planned obstetric unit births, so transfers from home, or 1503
AMUs/FMUs would not contribute to these rates. If the lowest risk women in a population selectively 1504
choose to give birth in non-obstetric unit or non-hospital setting, this could be reflected by poorer 1505
outcomes in the women who choose to give birth in the obstetric unit. However, as outcome rates 1506
were adjusted for maternal/fetal demographic and clinical characteristics, they should not be 1507
influencing the results. The study carried out additional exploratory analyses to try and understand 1508
the association seen with % of non-obstetric unit and non-hospital births. No association was found 1509
between the proportion of planned non-obstetric unit births in a trust and the proportion of planned 1510
obstetric unit births which were to higher risk women (data not shown). The relationships between 1511
the proportion of planned obstetric units births which were to higher risk women and outcomes in the 1512
low risk women were reported to be not consistent (data not shown). There was significant positive 1513
correlation between most intervention rates in low risk and higher risk women planning to give birth 1514
in the same obstetric unit; there was less correlation for intrapartum C-section rates. This led the 1515
authors to suggest that intervention rates may be affected by some common factors across settings, 1516
or by an institutional level factor such as an “interventionist culture”. 1517
1518
The authors also suggested that results could be affected by reverse causality, that is, if lower risk 1519
women know that units have higher intervention rates (as rates are available online), they may plan 1520
to have their birth outside of hospital to avoid this. They also suggest the possibility of selection bias, 1521
in that women planning to give birth in obstetric units despite potentially knowing about high 1522
intervention rates, could be less averse to intervention. 1523
1524
One important distinction between the results from Rowe et al. 2014 [+] and those of Sandall et al. is 1525
that the latter included outcomes of women who gave birth in all settings and gives only overall trust 1526
level results, and does not separate outcomes by setting (except for trusts with only obstetric units). 1527
While the study by Rowe et al. 2014 looked at associations with the % of births within the trust which 1528
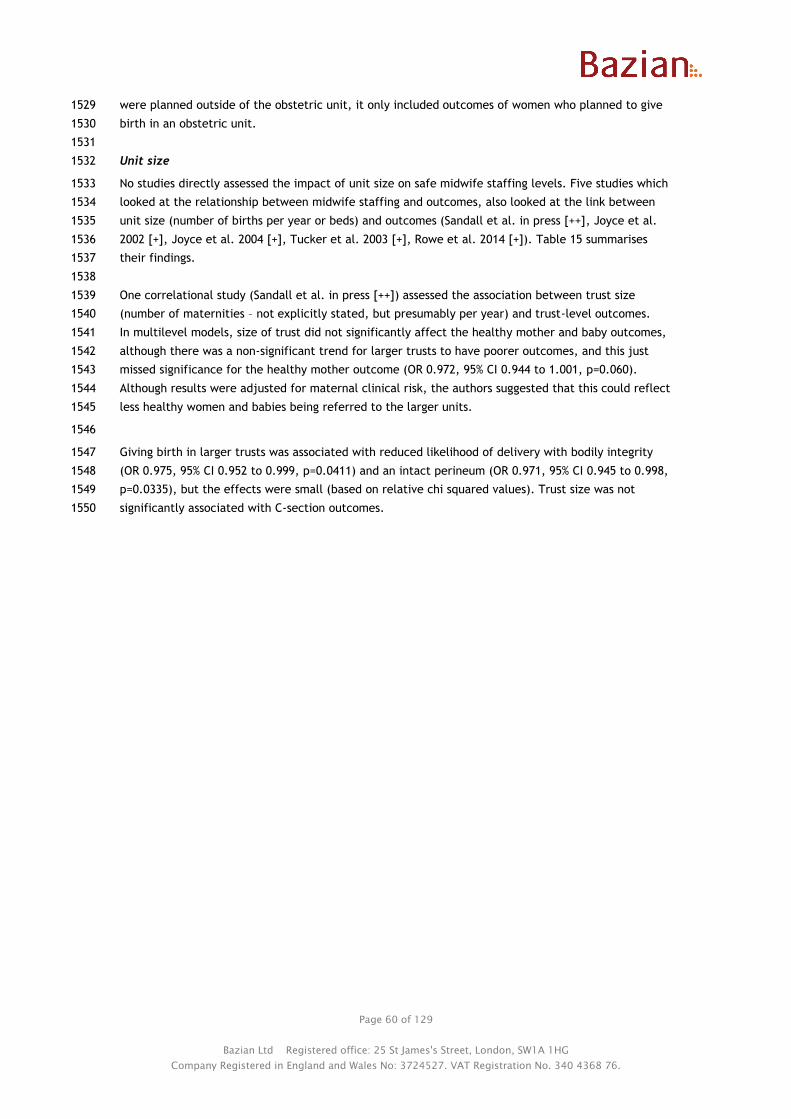
Page 60 of 129
Bazian Ltd Registered office: 25 St James's Street, London, SW1A 1HG
Company Registered in England and Wales No: 3724527. VAT Registration No. 340 4368 76.
were planned outside of the obstetric unit, it only included outcomes of women who planned to give 1529
birth in an obstetric unit. 1530
1531
Unit size 1532
No studies directly assessed the impact of unit size on safe midwife staffing levels. Five studies which 1533
looked at the relationship between midwife staffing and outcomes, also looked at the link between 1534
unit size (number of births per year or beds) and outcomes (Sandall et al. in press [++], Joyce et al. 1535
2002 [+], Joyce et al. 2004 [+], Tucker et al. 2003 [+], Rowe et al. 2014 [+]). Table 15 summarises 1536
their findings. 1537
1538
One correlational study (Sandall et al. in press [++]) assessed the association between trust size 1539
(number of maternities – not explicitly stated, but presumably per year) and trust-level outcomes. 1540
In multilevel models, size of trust did not significantly affect the healthy mother and baby outcomes, 1541
although there was a non-significant trend for larger trusts to have poorer outcomes, and this just 1542
missed significance for the healthy mother outcome (OR 0.972, 95% CI 0.944 to 1.001, p=0.060). 1543
Although results were adjusted for maternal clinical risk, the authors suggested that this could reflect 1544
less healthy women and babies being referred to the larger units. 1545
1546
Giving birth in larger trusts was associated with reduced likelihood of delivery with bodily integrity 1547
(OR 0.975, 95% CI 0.952 to 0.999, p=0.0411) and an intact perineum (OR 0.971, 95% CI 0.945 to 0.998, 1548
p=0.0335), but the effects were small (based on relative chi squared values). Trust size was not 1549
significantly associated with C-section outcomes. 1550
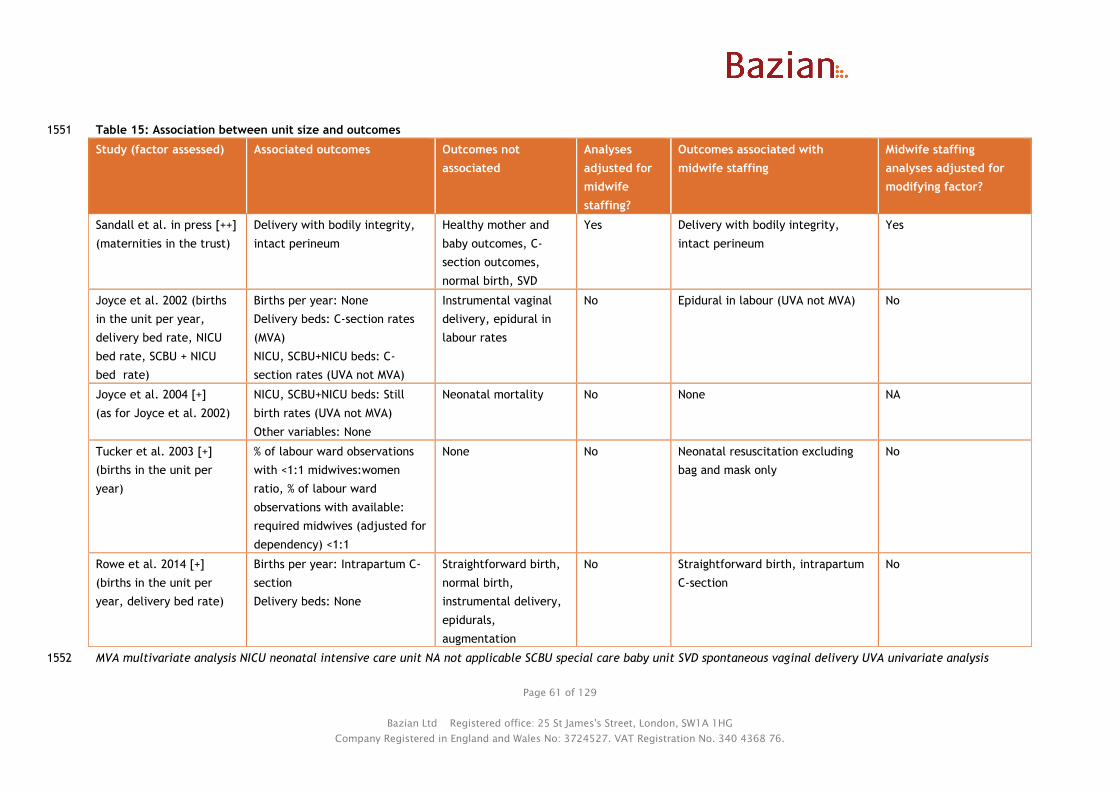
Page 61 of 129
Bazian Ltd Registered office: 25 St James's Street, London, SW1A 1HG
Company Registered in England and Wales No: 3724527. VAT Registration No. 340 4368 76.
Table 15: Association between unit size and outcomes 1551
Study (factor assessed) Associated outcomes Outcomes not
associated
Analyses
adjusted for
midwife
staffing?
Outcomes associated with
midwife staffing
Midwife staffing
analyses adjusted for
modifying factor?
Sandall et al. in press [++]
(maternities in the trust)
Delivery with bodily integrity,
intact perineum
Healthy mother and
baby outcomes, C-
section outcomes,
normal birth, SVD
Yes Delivery with bodily integrity,
intact perineum
Yes
Joyce et al. 2002 (births
in the unit per year,
delivery bed rate, NICU
bed rate, SCBU + NICU
bed rate)
Births per year: None
Delivery beds: C-section rates
(MVA)
NICU, SCBU+NICU beds: C-
section rates (UVA not MVA)
Instrumental vaginal
delivery, epidural in
labour rates
No Epidural in labour (UVA not MVA) No
Joyce et al. 2004 [+]
(as for Joyce et al. 2002)
NICU, SCBU+NICU beds: Still
birth rates (UVA not MVA)
Other variables: None
Neonatal mortality No None NA
Tucker et al. 2003 [+]
(births in the unit per
year)
% of labour ward observations
with <1:1 midwives:women
ratio, % of labour ward
observations with available:
required midwives (adjusted for
dependency) <1:1
None No Neonatal resuscitation excluding
bag and mask only
No
Rowe et al. 2014 [+]
(births in the unit per
year, delivery bed rate)
Births per year: Intrapartum C-
section
Delivery beds: None
Straightforward birth,
normal birth,
instrumental delivery,
epidurals,
augmentation
No Straightforward birth, intrapartum
C-section
No
MVA multivariate analysis NICU neonatal intensive care unit NA not applicable SCBU special care baby unit SVD spontaneous vaginal delivery UVA univariate analysis1552
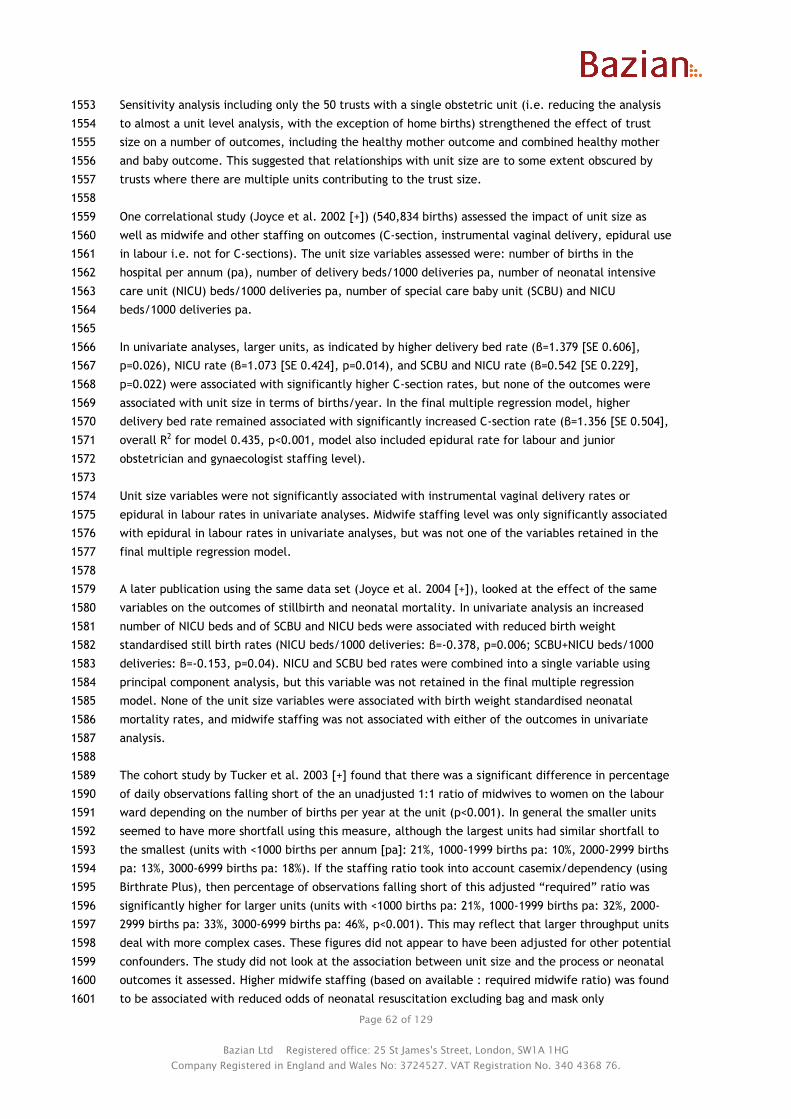
Page 62 of 129
Bazian Ltd Registered office: 25 St James's Street, London, SW1A 1HG
Company Registered in England and Wales No: 3724527. VAT Registration No. 340 4368 76.
Sensitivity analysis including only the 50 trusts with a single obstetric unit (i.e. reducing the analysis 1553
to almost a unit level analysis, with the exception of home births) strengthened the effect of trust 1554
size on a number of outcomes, including the healthy mother outcome and combined healthy mother 1555
and baby outcome. This suggested that relationships with unit size are to some extent obscured by 1556
trusts where there are multiple units contributing to the trust size. 1557
1558
One correlational study (Joyce et al. 2002 [+]) (540,834 births) assessed the impact of unit size as 1559
well as midwife and other staffing on outcomes (C-section, instrumental vaginal delivery, epidural use 1560
in labour i.e. not for C-sections). The unit size variables assessed were: number of births in the 1561
hospital per annum (pa), number of delivery beds/1000 deliveries pa, number of neonatal intensive 1562
care unit (NICU) beds/1000 deliveries pa, number of special care baby unit (SCBU) and NICU 1563
beds/1000 deliveries pa. 1564
1565
In univariate analyses, larger units, as indicated by higher delivery bed rate (β=1.379 [SE 0.606], 1566
p=0.026), NICU rate (β=1.073 [SE 0.424], p=0.014), and SCBU and NICU rate (β=0.542 [SE 0.229], 1567
p=0.022) were associated with significantly higher C-section rates, but none of the outcomes were 1568
associated with unit size in terms of births/year. In the final multiple regression model, higher 1569
delivery bed rate remained associated with significantly increased C-section rate (β=1.356 [SE 0.504], 1570
overall R2 for model 0.435, p<0.001, model also included epidural rate for labour and junior 1571
obstetrician and gynaecologist staffing level). 1572
1573
Unit size variables were not significantly associated with instrumental vaginal delivery rates or 1574
epidural in labour rates in univariate analyses. Midwife staffing level was only significantly associated 1575
with epidural in labour rates in univariate analyses, but was not one of the variables retained in the 1576
final multiple regression model. 1577
1578
A later publication using the same data set (Joyce et al. 2004 [+]), looked at the effect of the same 1579
variables on the outcomes of stillbirth and neonatal mortality. In univariate analysis an increased 1580
number of NICU beds and of SCBU and NICU beds were associated with reduced birth weight 1581
standardised still birth rates (NICU beds/1000 deliveries: β=-0.378, p=0.006; SCBU+NICU beds/1000 1582
deliveries: β=-0.153, p=0.04). NICU and SCBU bed rates were combined into a single variable using 1583
principal component analysis, but this variable was not retained in the final multiple regression 1584
model. None of the unit size variables were associated with birth weight standardised neonatal 1585
mortality rates, and midwife staffing was not associated with either of the outcomes in univariate 1586
analysis. 1587
1588
The cohort study by Tucker et al. 2003 [+] found that there was a significant difference in percentage 1589
of daily observations falling short of the an unadjusted 1:1 ratio of midwives to women on the labour 1590
ward depending on the number of births per year at the unit (p<0.001). In general the smaller units 1591
seemed to have more shortfall using this measure, although the largest units had similar shortfall to 1592
the smallest (units with <1000 births per annum [pa]: 21%, 1000-1999 births pa: 10%, 2000-2999 births 1593
pa: 13%, 3000-6999 births pa: 18%). If the staffing ratio took into account casemix/dependency (using 1594
Birthrate Plus), then percentage of observations falling short of this adjusted “required” ratio was 1595
significantly higher for larger units (units with <1000 births pa: 21%, 1000-1999 births pa: 32%, 2000-1596
2999 births pa: 33%, 3000-6999 births pa: 46%, p<0.001). This may reflect that larger throughput units 1597
deal with more complex cases. These figures did not appear to have been adjusted for other potential 1598
confounders. The study did not look at the association between unit size and the process or neonatal 1599
outcomes it assessed. Higher midwife staffing (based on available : required midwife ratio) was found 1600
to be associated with reduced odds of neonatal resuscitation excluding bag and mask only 1601

Page 63 of 129
Bazian Ltd Registered office: 25 St James's Street, London, SW1A 1HG
Company Registered in England and Wales No: 3724527. VAT Registration No. 340 4368 76.
resuscitation (see Question 1). Therefore if unit size affects likelihood of reaching this ratio, it could 1602
also influence this outcome. 1603
1604
The correlational study by Rowe et al. 2014 [+] (32,257 births to low risk women planned to take 1605
place vaginally, in an obstetric unit) assessed the association between two unit size variables (number 1606
of births in the obstetric unit over 1 year and number of delivery beds) and mode of birth outcomes 1607
for obstetric units (straightforward birth, normal birth, intrapartum C-section, and instrumental 1608
delivery, and use of epidural or augmentation). 1609
1610
Larger unit size in terms of number of births in the unit in a year was significantly associated with 1611
reduced rates of intrapartum C-section in multiparous women, but just missed significance in 1612
nulliparous women (the study considered p<0.05 to be significant; nulliparous: R2 5.8% β=-0.08, 1613
p=0.05; multiparous: R2 10.6% β=-0.07, p=0.01). The association between increased number of births 1614
and increased likelihood of straightforward birth in multiparous women just missed significance 1615
(nulliparous: R2 0.1% β=-0.01, p=0.88; multiparous: R2 8.8% β=0.08, p=0.05). Relationships between 1616
number of births in the unit and other outcomes were not significant, and number of delivery beds 1617
was not associated with any outcome. Outcome rates were adjusted for maternal/fetal 1618
characteristics but analyses were not adjusted midwife staffing or other variables. The effect on C-1619
section rate (a reduction with increased unit size) was in the opposite direction of effect seen in 1620
Joyce et al. 2002 [+]. This may reflect the different populations in the studies (low risk women in 1621
Rowe et al. and all women in Joyce et al.), differences in outcome assessed (intrapartum C-section in 1622
Rowe et al. and any C-section in Joyce et al.) or differences in adjustment for maternal clinical risk 1623
(Rowe et al. adjusted for more variables). 1624
1625
1626
Physical layout 1627
No studies directly assessed the potential impact of physical layout and safe midwife staffing. Two 1628
correlational studies (Joyce et al. 2002 [+], Joyce et al. 2004 [+]) analysed the same data set (540,834 1629
births), and assessed the impact of a dedicated maternity theatre as well as midwife and other 1630
staffing on outcomes (C-section, instrumental vaginal delivery, epidural use in labour i.e. not for C-1631
sections, still birth and neonatal mortality). Table 16 summarises their findings. 1632
1633
Presence of a dedicated maternity theatre was not significantly associated with any of the outcomes 1634
(C-section p=0.177, instrumental vaginal delivery p=0.530, epidural use in labour p=0.180, birth 1635
weight standardised still birth rate p=0.51, birth weight standardised neonatal mortality rate p=0.88). 1636
Of these outcomes, midwife staffing was only associated with epidural use in labour in univariate (but 1637
not multivariate) analysis. The vast majority of units had a dedicated maternity theatre (92.5%), and 1638
this may reduce ability to detect an association with the outcomes. 1639
1640

Page 64 of 129
Bazian Ltd Registered office: 25 St James's Street, London, SW1A 1HG
Company Registered in England and Wales No: 3724527. VAT Registration No. 340 4368 76.
Evidence statement 3: Effect of environmental factors on midwifery staffing requirements 1641
Evidence from 1 UK cohort study1 ([+] 3,083 live births) and 5 UK correlational studies2-6 ([++] 665,969 1642
births2; [+] 540,834 births3,4; [+] 615,042 women5; [+] 32,257 births6) suggests that: 1643
1644
Local geography2 and demography2,3,4,5 may be associated with some maternal and neonatal 1645
outcomes although not all associations were adjusted for midwife staffing, or remained 1646
significant after adjustment for confounders. 1647
Mixed results were found for the association between various birth setting related variables and 1648
maternal and neonatal outcomes2,6. The study2 that adjusted for midwife staffing levels found 1649
that the association between university trusts and outcomes were not robust to sensitivity 1650
analysis, and that most other associations between birth settings available in the trust were not 1651
significant and did not show a consistent pattern. 1652
Mixed results were found for the association between various measures of unit size and 1653
maternal and neonatal outcomes1,2,3,4,6. Different studies looking at the same unit size measures 1654
(maternities/births per year or delivery beds) obtained differing results for the same outcome 1655
(C-section)2,3,4,6 in terms of significance or direction of effect. The study2 that adjusted for 1656
midwife staffing levels found an association between number of maternities at trust level and 1657
some outcomes. A second study found an association between births per year in the unit ad 1658
ability to reach either a 1:1 ratio of midwives or the case mix adjusted ratio. 1659
Presence of a dedicated maternity theatre is not associated with maternal and neonatal 1660
outcomes in analyses unadjusted for midwife staffing. 1661
No evidence was identified on the effect of other physical layout factors on midwife staffing 1662
requirements. 1663
1664 1 Tucker et al. 2003 [+] 1665 2 Sandall et al. in press [++] 1666 3 Joyce et al. 2002 [+] 1667 4 Joyce et al. 2004 [+] 1668 5 Gerova et al. 2010 [+] 1669 6 Rowe et al. 2014 [+] 1670
1671
1672
Page 65 of 129
Bazian Ltd Registered office: 25 St James's Street, London, SW1A 1HG
Company Registered in England and Wales No: 3724527. VAT Registration No. 340 4368 76.
Table 16: Association between physical layout and outcomes 1673
Study (factor
assessed)
Associated outcomes Outcomes not
associated
Analyses of adjusted
for midwife staffing?
Outcomes associated with
midwife staffing
Midwife staffing analyses
adjusted for modifying factor?
Joyce et al. 2002
[+]
(presence of a
dedicated
maternity
theatre)
None C-section, instrumental
vaginal delivery,
epidural use in labour
i.e. not for C-sections
No Epidural in labour (UVA, not
MVA)
No
Joyce et al. 2004
[+] (as for Joyce
et al 2002)
None Still birth and neonatal
mortality
No None NA
MVA multivariate analysis UVA univariate analysis1674

Page 66 of 129
Bazian Ltd Registered office: 25 St James's Street, London, SW1A 1HG
Company Registered in England and Wales No: 3724527. VAT Registration No. 340 4368 76.
1675
Question 4: What staffing factors affect safe midwifery staffing requirements at a 1676
local level? 1677
Staffing factors were assessed in 5 studies: Gerova et al. 2010 [+], Sandall et al. in press [++], Joyce 1678
et al. 2002 [+], Joyce et al. 2004 [+], and Cerbinskaite et al. 2011 [-]. 1679
1680
The potential staffing modifying factors addressed by these studies included: 1681
● Midwifery skill mix 1682
● Availability of other healthcare staff 1683
● Time of day 1684
1685
Midwifery skill mix 1686
Only one study looked at the impact of midwifery skill mix at a trust level on outcomes (Gerova et 1687
al. 2010 [+]). Its findings are summarised in Table 17. 1688
1689
This correlational study (615,042 women) assessed the association between ratio of consultant 1690
midwives FTE per birth to midwives FTE per birth on maternal readmissions within 28 days of 1691
discharge from the postnatal ward (taking maternal characteristics into account). A higher ratio of 1692
consultant midwives to midwives was associated with a significantly reduced likelihood of maternal 1693
readmission (β=-4.348, 95% CI –4.408 to -4.289, p<0.001), as were midwife FTE per birth and 1694
consultant obstetrician and gynaecologist to midwife ratios assessed in the multivariate regression 1695
model (results reported under Questions 1 and 3). It was unclear whether the “midwife” group in this 1696
analysis included consultant midwives or not. The model was adjusted for maternal risk factors for 1697
readmission and also other staffing variables, including midwife staffing. 1698
1699
1700
1701
1702

Page 67 of 129
Bazian Ltd Registered office: 25 St James's Street, London, SW1A 1HG
Company Registered in England and Wales No: 3724527. VAT Registration No. 340 4368 76.
Table 17: Association between availability of midwifery skill mix, other healthcare staff and outcomes 1703
Study (factor assessed) Associated outcomes Outcomes not
associated
Analyses of adjusted for
midwife staffing?
Outcomes associated with
midwife staffing
Midwife staffing
analyses adjusted for
modifying factor?
Midwifery skill mix
Gerova et al. 2010 [+]
(consultant midwife:
midwife ratio)
Maternal readmission
within 28 days of
discharge
None Yes Maternal readmission within 28
days of discharge
Yes
Availability of other healthcare staff
Gerova et al. 2010 [+]
(consultant O&G:
midwife ratio,
registered nurse:
midwife ratio)
Maternal readmission
within 28 days of
discharge
None Yes Maternal readmission within 28
days of discharge
Yes
Sandall et al. in press
[++]
(obstetric doctor:
midwife ratio, support
worker: midwife ratio,
obstetric doctor and
support worker staffing,
all staffing level i.e.
doctor, midwife, and
support worker)
All staffing level:
delivery with bodily
integrity, intact
perineum
Other staffing variables:
none
Healthy mother and
baby outcomes, C-
section outcomes,
normal birth,
spontaneous vaginal
delivery
Mixed (analysis including
all staffing levels and
doctor: midwife and
support worker: midwife
ratios not adjusted for a
separate midwife
staffing variable)
Delivery with bodily integrity,
intact perineum
Mixed (analysis did not
adjust for all staffing
levels and doctor:
midwife and support
worker: midwife ratios)

Page 68 of 129
Bazian Ltd Registered office: 25 St James's Street, London, SW1A 1HG
Company Registered in England and Wales No: 3724527. VAT Registration No. 340 4368 76.
Study (factor assessed) Associated outcomes Outcomes not
associated
Analyses of adjusted for
midwife staffing?
Outcomes associated with
midwife staffing
Midwife staffing
analyses adjusted for
modifying factor?
Joyce et al. 2002 [+]
(junior O&G staffing,
consultant O&G staffing,
consultant O&G ward
sessions/week,
consultant anaesthetist
sessions/week)
Junior O&G staffing: C-
section (MVA), epidural
use in labour (UVA not
MVA)
Consultant O&G staffing:
C-section (UVA not MVA)
Consultant O&G ward
sessions/week: None
Consultant anaesthetist
sessions/week: epidural
use in labour (UVA not
MVA)
Instrumental vaginal
delivery
Mixed (only epidural use
in labour analysis)
Epidural in labour (UVA not MVA) No
Joyce et al. 2004 [+]
(as for 2002 publication
above plus consultant
paediatrician staffing,
junior paediatrician
staffing)
Consultant O&G staffing:
still birth (MVA)
All other staffing
variables: None
Neonatal mortality No None NA
Time of day
Cerbinskaite et al. 2011
[-]
(time of day)
Decision to perform
grade 2 emergency C-
section, type of
anaesthetic used
Decision to perform
grade 1 emergency C-
section, decision-to-
delivery interval (grade
1&2)
No Decision-to-delivery interval (grade
1 & 2 emergency C-sections)
No
O&G obstetricians and gynaecologists MVA multivariate analysis NA not applicable UVA univariate analysis1704
Page 69 of 129
Bazian Ltd Registered office: 25 St James's Street, London, SW1A 1HG
Company Registered in England and Wales No: 3724527. VAT Registration No. 340 4368 76.
1705
1706
Availability of other healthcare staff 1707
Two studies looked specifically at the effect of availability of other healthcare staff on safe 1708
midwifery staffing levels, by looking at the relationship between ratios of other healthcare 1709
staff:midwives on outcomes (Gerova et al. 2010 [+], Sandall et al. in press [++]). As well as these 1710
studies, 2 studies which looked at the relationship of midwife staffing on outcomes also looked at the 1711
relationship of other healthcare staff to these outcomes (Joyce et al. 2002 [+], Joyce et al. 2004 [+]). 1712
Table 17 summarises their results. 1713
1714
One correlational study (Gerova et al. 2010 [+]) (615,042 women) assessed the association between 1715
ratios of consultant obstetrician and gynaecologist FTE per birth : midwife FTE per birth and 1716
registered nurse per birth : midwife FTE per birth to on maternal readmissions within 28 days of 1717
discharge from the postnatal ward (taking maternal characteristics into account). A higher ratio of 1718
consultants to midwives was associated with a significantly reduced likelihood of maternal 1719
readmission (β=-3.563, 95% CI -3.605 to -3.522, p<0.001), as was midwife FTE per birth and consultant 1720
midwife:midwife ratio (results reported under Questions 1 and above). However, a higher ratio of 1721
registered nurses to midwives was associated with an increased risk of maternal readmission 1722
(β=3.133, 95% CI 3.115 to 3.151, p<0.001). It was unclear whether the nurses in question were 1723
specifically part of maternity services, but this was assumed to be the case. The study did not include 1724
healthcare assistants (including maternity support workers) in the model as there was colinearity with 1725
other staff groups. These results came from a multivariate model adjusted for maternal risk factors 1726
for readmission, and including the staffing variables described above. 1727
1728
The large correlational study by Sandall et al. in press [++], carried out analyses of the effect of 1729
obstetric doctor: midwife ratio and support worker: midwife ratio at trust level on a range of 1730
outcomes (healthy mother and baby outcomes, mode of delivery outcomes, and C-section outcomes, 1731
see Table 18 for summary of results). None of the associations were found to be significant in 1732
multivariate analyses. In general, a higher doctor to midwife ratio was associated with a non-1733
significant improvement in outcomes. 1734
1735
Higher support worker to midwife ratio was generally associated with a non-significant worsening of 1736
outcomes. (An increase in elective C-sections is not necessarily a worse outcome, if it reduces need 1737
for emergency C-sections, but in this case both elective and emergency C-sections were increased 1738
with increasing support staff:midwife ratios.) 1739
1740
The exception was normal birth (no induction, instrumental delivery, C-section, episiotomy or general 1741
or regional anaesthetic) where the direction of non-significant effect was for reduced likelihood with 1742
a greater doctor: midwife ratio (OR 0.849) and increased likelihood with a greater support worker: 1743
midwife ratio (OR 1.031). There is the possibility that this outcome reflects more about the potential 1744
to perform these activities (e.g. C-section) when the staff mix includes fewer doctors:midwives and 1745
more support workers:midwives, rather than differences in clinical need. It could also to some extent 1746
reflect reverse causality, with trusts staffing to match their population’s clinical need. 1747
1748
This study also looked at the association between doctor and support staff levels per 100 maternities 1749
separately (i.e. not in relation to midwife staffing) on outcomes. Multilevel modelling showed that 1750
maternal factors had the greatest effect on outcomes, and staffing variables (including midwife 1751
staffing only had minor effects (relative chi squared values all <10). 1752
Page 70 of 129
Bazian Ltd Registered office: 25 St James's Street, London, SW1A 1HG
Company Registered in England and Wales No: 3724527. VAT Registration No. 340 4368 76.
1753
In these models none of the staffing level variables (including midwife staffing) were significantly 1754
related to healthy mother and baby outcomes or C-section outcomes. There was a non-significant 1755
trend for an increased level of support worker staffing to be associated with a reduction in the 1756
likelihood of healthy mother and combined healthy mother and baby outcomes (healthy mother: OR 1757
0.892, 95% CI 0.776 to 1.026, p=0.11; healthy mother and baby: OR 0.897, 95% CI 0.781 to 1.031, 1758
p=0.13). Higher levels of doctor staffing were associated with a non-significant trend for reduced C-1759
section rate (OR 0.857, 95% CI 0.709 to 1.036, p=0.11). Higher levels of overall staffing (i.e. of all 1760
staff combined) were associated with significantly increased likelihood of delivery with bodily 1761
integrity (OR 1.079, 95% CI 1.016 to 1.147, p=0.0135) and intact perineum (OR 1.092, 95% CI 1.019 to 1762
1.170, p=0.0127). 1763
1764
The study also carried out interaction analyses to look at the effect of maternal clinical risk and 1765
parity on the associations between doctor and support worker staffing and outcomes. It found that 1766
there was significant interaction for some outcomes (see Evidence Table for details). In general, 1767
support worker staffing level had less of a negative effect in lower risk women and their babies for 1768
the healthy mother and baby outcomes and some mode of delivery and C-section outcomes, and 1769
greater benefit for women with higher parity (4 or more previous children) for the outcome of intact 1770
perineum. 1771
1772
The effect of higher doctor staffing levels by parity varied depending on the outcome, with effects 1773
greater in nulliparous women for some outcomes (healthy mother and baby outcomes, delivery with 1774
bodily integrity and intact perineum) but greater in women with higher parity for other outcomes 1775
(spontaneous vaginal delivery, intact perineum, elective C-section). Similarly for clinical risk, lower 1776
risk women benefitted more from high doctor staffing levels for one outcome (healthy mother) but 1777
higher risk women benefited more for other outcomes (spontaneous vaginal delivery, elective C-1778
section, all C-section). 1779
1780
In sensitivity analyses including only the 50 trusts with a single obstetric unit (i.e. essentially reducing 1781
it to a unit level analysis, plus home births), the relationship between increased support workers and 1782
reduction in likelihood of a healthy baby became significant (β=increased from -0.034 to -0.221, 1783
p=0.048). 1784
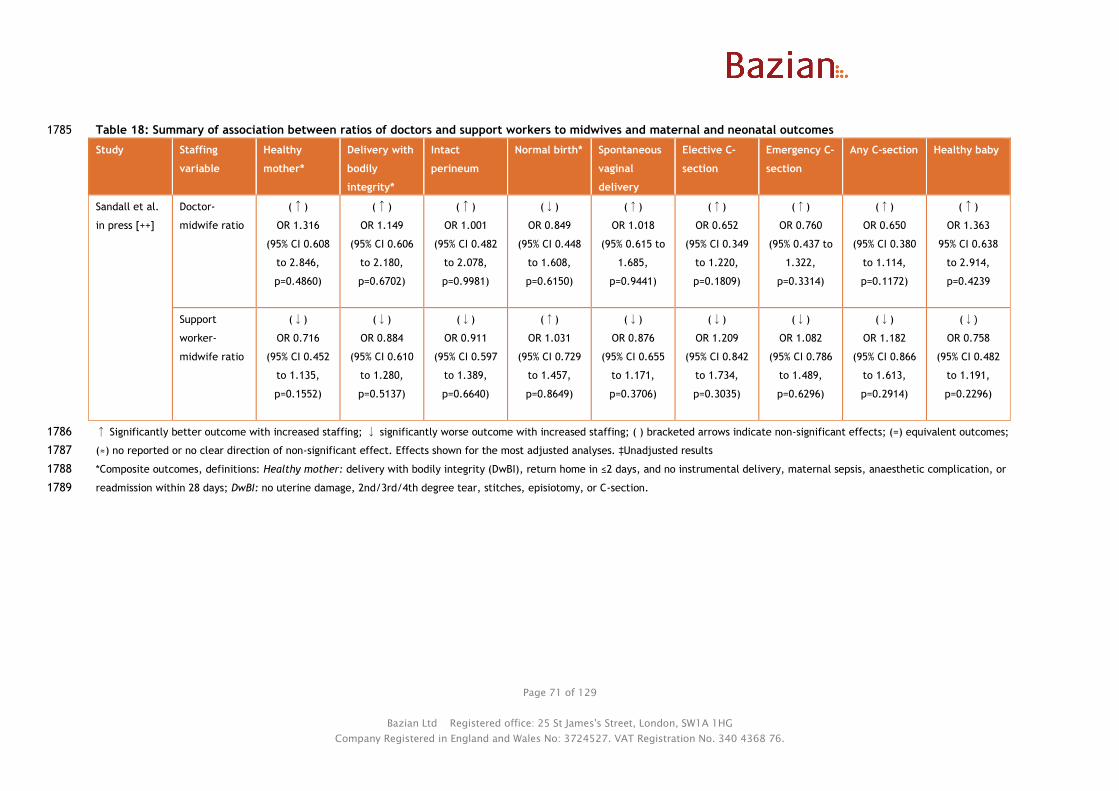
Page 71 of 129
Bazian Ltd Registered office: 25 St James's Street, London, SW1A 1HG
Company Registered in England and Wales No: 3724527. VAT Registration No. 340 4368 76.
Table 18: Summary of association between ratios of doctors and support workers to midwives and maternal and neonatal outcomes 1785
Study Staffing
variable
Healthy
mother*
Delivery with
bodily
integrity*
Intact
perineum
Normal birth* Spontaneous
vaginal
delivery
Elective C-
section
Emergency C-
section
Any C-section Healthy baby
Sandall et al.
in press [++]
Doctor-
midwife ratio
(↑)
OR 1.316
(95% CI 0.608
to 2.846,
p=0.4860)
(↑)
OR 1.149
(95% CI 0.606
to 2.180,
p=0.6702)
(↑)
OR 1.001
(95% CI 0.482
to 2.078,
p=0.9981)
(↓)
OR 0.849
(95% CI 0.448
to 1.608,
p=0.6150)
(↑)
OR 1.018
(95% 0.615 to
1.685,
p=0.9441)
(↑)
OR 0.652
(95% CI 0.349
to 1.220,
p=0.1809)
(↑)
OR 0.760
(95% 0.437 to
1.322,
p=0.3314)
(↑)
OR 0.650
(95% CI 0.380
to 1.114,
p=0.1172)
(↑)
OR 1.363
95% CI 0.638
to 2.914,
p=0.4239
Support
worker-
midwife ratio
(↓)
OR 0.716
(95% CI 0.452
to 1.135,
p=0.1552)
(↓)
OR 0.884
(95% CI 0.610
to 1.280,
p=0.5137)
(↓)
OR 0.911
(95% CI 0.597
to 1.389,
p=0.6640)
(↑)
OR 1.031
(95% CI 0.729
to 1.457,
p=0.8649)
(↓)
OR 0.876
(95% CI 0.655
to 1.171,
p=0.3706)
(↓)
OR 1.209
(95% CI 0.842
to 1.734,
p=0.3035)
(↓)
OR 1.082
(95% CI 0.786
to 1.489,
p=0.6296)
(↓)
OR 1.182
(95% CI 0.866
to 1.613,
p=0.2914)
(↓)
OR 0.758
(95% CI 0.482
to 1.191,
p=0.2296)
↑ Significantly better outcome with increased staffing; ↓ significantly worse outcome with increased staffing; ( ) bracketed arrows indicate non-significant effects; (=) equivalent outcomes; 1786
(≈) no reported or no clear direction of non-significant effect. Effects shown for the most adjusted analyses. ‡Unadjusted results 1787
*Composite outcomes, definitions: Healthy mother: delivery with bodily integrity (DwBI), return home in ≤2 days, and no instrumental delivery, maternal sepsis, anaesthetic complication, or 1788
readmission within 28 days; DwBI: no uterine damage, 2nd/3rd/4th degree tear, stitches, episiotomy, or C-section.1789

Page 72 of 129
Bazian Ltd Registered office: 25 St James's Street, London, SW1A 1HG
Company Registered in England and Wales No: 3724527. VAT Registration No. 340 4368 76.
One correlational study (Joyce et al. 2002 [+]) (540,834 births) assessed the impact of other 1790
healthcare staffing at the unit level as well as midwife staffing on outcomes (C-section, instrumental 1791
vaginal delivery, epidural use). The staffing variables assessed were: consultant obstetrician and 1792
gynaecologists (O&G)/1000 deliveries per annum (pa), junior O&G/1000 deliveries pa, number of 1793
consultant O&G sessions on labour ward/week, number of consultant anaesthetist sessions on labour 1794
ward/week. 1795
1796
In univariate analyses, higher consultant O&G doctor rates and higher junior O&G doctor rates were 1797
both associated with higher C-section rates (consultant O&G: β=1.968 [SE 0.786], p=0.013; junior 1798
O&G: β=0.862 [SE 0.188], p<0.001). Also, more consultant anaesthetist sessions on the ward and 1799
higher junior O&G doctor rates were both associated with higher epidural use in labour (anaesthetist 1800
sessions: β=2.013 [SE 0.993], p=0.047; junior O&G: β=1.539 [SE 0.264], p<0.001). Other associations 1801
were not significant. 1802
1803
In the final multiple regression models the only staffing variable that was retained was junior O&G 1804
rate, where increasing rates were associated with increasing C-section rates (β=0.671 [SE 0.178], 1805
overall model R2 0.435, p<0.001; other model variables epidural for labour rate and delivery bed 1806
rate). 1807
1808
A later analysis using the same data set (Joyce et al. 2004 [+]) looked at the same and some 1809
additional staffing variables on birth weight standardised still birth and neonatal mortality. The 1810
additional variables were number of consultant paediatricians per 1000 births and junior 1811
paediatricians per 1000 births. In univariate analyses the only significant association was between 1812
increasing consultant O&G rates and reduced birth weight standardised still birth rates (β=-0.681, 1813
p=0.006, SE not reported). This variable was retained in the final multiple regression model (β=-0.55 1814
[SE 0.23], p=0.019, overall R2 for model 0.27; only other variable in the model was intervention score, 1815
with more interventions also associated with reduced still birth rates). For one interquartile range 1816
increase in number of consultant obstetricians and gynaecologists/1000 deliveries, birth weight 1817
standardised still birth rate reduced by 0.26. 1818
1819
1820
Time of day 1821
No studies directly assessed the potential impact of time of day and safe midwife staffing. One study 1822
(Cerbinskaite et al. 2011 [-]) assessed impact of time of day as well as midwife staffing on outcomes. 1823
Medical staffing differed between the day and night, but results were not adjusted for this. Whether 1824
midwife staffing differed between the day and night shifts was not reported. Table 17 summarises its 1825
findings. 1826
1827
The study (5,167 births not by elective C-section, 333 emergency grade 1 and 2 C-sections) found that 1828
a decision to perform a grade 1 emergency C-section was equally likely during the day and night 1829
(59/2620 [2.3%] vs. 63/2547 [2.5%], p=0.104). However, grade 2 C-sections were more likely at night 1830
(97/2620 [3.7%] vs. 114/2547 [4.5%], p=0.015). This increase was mainly due to an increase in grade 2 1831
C-sections resulting from cardiotocographic abnormality without fetal blood sampling (37 vs. 62, 1832
p<0.001) and failure to progress in the second stage of labour (11 vs. 20, p=0.01). Time of day was 1833
reported to not affect decision-to-delivery interval for either grade of C-section (results displayed 1834
graphically). Results were not adjusted for midwife or other staffing levels or other potential 1835
confounders. 1836
1837

Page 73 of 129
Bazian Ltd Registered office: 25 St James's Street, London, SW1A 1HG
Company Registered in England and Wales No: 3724527. VAT Registration No. 340 4368 76.
Type of anaesthesia used for grade 1 C-section varied by time of day, with general anaesthesia most 1838
common in the day (31/59 [52.5%] vs. 22/63 [34.9%], p=0.005) and spinal blockade most common at 1839
night (17/59 [28.8%] vs. 29/63 [46.0%], p=0.009). Type of anaesthesia used in grade 2 C-sections did 1840
not vary by time of day (p>0.07 for comparisons of day vs. night for each anaesthetic type). 1841
1842
Lower midwife staffing was associated with a longer decision-to-delivery interval, and the extent of 1843
this effect seemed to greatest for grade 2 C-sections, therefore if grade 2 C-sections are more 1844
common at night, time of day may influence safe midwife staffing levels. In addition, type of 1845
anaesthetic used was affected by time of day, and itself affected decision-to-delivery for grade 1 C-1846
sections but not grade 2 C-sections (see section on interventions used in Question 2). Although time of 1847
day did not directly influence decision-to-delivery interval, these factors (time of day, type of 1848
anaesthetic and midwifery staffing) could interact. Without any statistical assessment of the 1849
interaction between time of day, midwife staffing, other factors, and outcome it is not possible to 1850
draw firm conclusions about their relationship. In addition, this study included a small number of C-1851
sections, within a single obstetric unit and therefore may not be representative of obstetric units as a 1852
whole. 1853
1854
Care provided by other healthcare staff and division of tasks between midwives and maternity 1855
support workers 1856
No studies assessed the effect of specific care provided by other healthcare staff, or division of tasks 1857
between midwives and maternity support workers and safe midwife staffing levels. 1858
1859
Requirements to provide additional services 1860
No studies assessed the effect requirements to provide additional services (e.g. high dependency 1861
care, public health roles, vaccinations) and safe midwife staffing levels. 1862
1863
1864
Evidence statement 4: Effect of staffing factors on midwifery staffing requirements 1865
Evidence from 1 cross sectional analysis of a UK cohort study1 ([-] 333 emergency C-sections) and 4 UK 1866
correlational studies2-5 ([++] 665,969 births2; [+] 540,834 births3,4; [+] 615,042 women5) suggests that: 1867
1868
A higher consultant midwife: midwife ratio is associated with reduced maternal readmission 1869
within 28 days of discharge5. 1870
Higher ratios of obstetric medical staff:midwives at trust level, particularly consultants, may 1871
be associated with improved outcomes2,5 while higher levels of nurses:midwives5 or support 1872
workers:midwives2 may be associated with worse outcomes. However, in one study these 1873
associations were not significant after adjustment for midwife staffing and other factors2. Levels 1874
of doctor staffing2,3,4 (mainly obstetricians and gynaecologists where different specialties were 1875
assessed), support worker staffing2, and all staffing combined2 were found to be associated with 1876
some outcomes, but not all of the associations were adjusted for midwife staffing, or significant 1877
after adjustment for potential confounders. 1878
Mixed results were found for the association between time of day (staffing of differed in the day 1879
and night time) and likelihood of decisions to perform emergency C-section, with associations 1880
identified for grade 2 but not grade 1 C-sections1. 1881
No evidence was identified on the effect of specific care provided by other healthcare staff, 1882
division of tasks between midwives and maternity support workers, or requirement for 1883
midwives to provide other services (e.g. high dependency care, public health roles, 1884
vaccinations) and safe midwife staffing levels. 1885
Page 74 of 129
Bazian Ltd Registered office: 25 St James's Street, London, SW1A 1HG
Company Registered in England and Wales No: 3724527. VAT Registration No. 340 4368 76.
1886 1 Cerbinskaite et al. 2011 [-] 1887 2 Sandall et al. in press [++] 1888 3 Joyce et al. 2002 [+] 1889 4 Joyce et al. 2004 [+] 1890 5 Gerova et al. 2010 [+] 1891
1892
1893
Question 5: What unit level management factors affect midwifery staffing 1894
requirements? 1895
Unit level management factors were assessed by two studies: NSCCRT 2000 [+] and Joyce et al. 2004 1896
[+]. The potential local level management modifying factors addressed by these studies included: 1897
● Models of midwifery care (caseload versus shared care) 1898
● Service provision and risk management processes 1899
1900
Models of care 1901
No studies directly assessed the impact of models of care on safe staffing levels. One cluster RCT 1902
(NSCCRT 2000 [+]) (1,505 women) compared caseload care versus shared care. The caseload group 1903
midwives had a lower caseload (35-40 women) than the shared care group (100-150 women), but it 1904
was unclear whether staffing levels (overall ratio of midwives:women) in the two groups was 1905
different. Its findings are summarised in Table 19. 1906
1907
The RCT found that caseload care significantly increased the likelihood of being attended by a known 1908
midwife or midwifery partner in labour (94.7% vs. 6.7%, p<0.001) and duration of labour (<8 hours 1909
58.5% vs. 68.4%, p for overall trend ≤0.001), and significantly reduced use of epidurals (10% vs. 15%, 1910
p=0.01) and oxytocin/syntocinon augmentation (46% vs. 53%, p=0.01). The increase in length of labour 1911
may have been due to earlier documentation of labour starting if midwives in the caseload group 1912
attended the women at home. There was no significant difference between the groups in mode of 1913
delivery, gestation length, stillbirth and neonatal death, advanced neonatal resuscitation, admission 1914
to the neonatal unit, low birthweight (<2.5 kg), induction, intact perineum, episiotomy, perineal 1915
laceration or perineal tear (results figures reported in under Question 1 above). 1916
1917
As caseload care does improve some outcomes, use of this model of care may affect safe midwife 1918
staffing levels if it does require more midwives to provide it. 1919

Page 75 of 129
Bazian Ltd Registered office: 25 St James's Street, London, SW1A 1HG
Company Registered in England and Wales No: 3724527. VAT Registration No. 340 4368 76.
Table 19: Association between models of care, service provision, and risk management and outcomes 1920
Study (factor assessed) Associated outcomes Outcomes not associated Analyses of
adjusted for
midwife staffing?
Outcomes associated with
midwife staffing
Midwife staffing
analyses adjusted for
modifying factor?
Models of care
NSCCRT 2000 [+]
(caseload care vs. shared
care)
Attendance by known
midwife or midwifery
partner, duration of
labour, epidural use,
augmentation
Mode of delivery, gestation
length, stillbirth and neonatal
death, advanced neonatal
resuscitation, admission to the
NNU, low birthweight,
induction, perineal outcomes
NA (No separate analyses, as
per overall caseload
analyses)
NA
Service provision and risk management
Joyce et al. 2004 [+]
(presence of a 24 hour
epidural service, whether
the unit had a risk
manager, the grade of
person who was the risk
manager (obstetrician,
midwife manager, clinical
midwife, other, or no risk
manager), and the
frequency of perinatal
meetings)
None Still birth, neonatal mortality No None No
NA not applicable NNU neonatal unit1921
Page 76 of 129
Bazian Ltd Registered office: 25 St James's Street, London, SW1A 1HG
Company Registered in England and Wales No: 3724527. VAT Registration No. 340 4368 76.
1922
This RCT was performed before 2000, and may not be representative of current practice. For 1923
example, at that time shared care was the usual model of care in the study areas. However, this 1924
model of care may no longer be seen as standard care within the UK. 1925
1926
No other studies assessing other models of care and meeting inclusion criteria were identified. 1927
1928
Service provision and risk management processes 1929
No studies directly assessed the impact of service provision and risk management processes on safe 1930
staffing levels. One correlational study (Joyce et al. 2004 [+]) (540,834 births) assessed the impact of 1931
various service and risk management processes as well as midwife and other staffing levels on 1932
outcomes (birth weight standardised still birth and neonatal mortality rates). Its findings are 1933
summarised in Table 19. 1934
1935
The variables assessed were: presence of a 24 hour epidural service, whether the unit had a risk 1936
manager, the grade of person who was the risk manager (obstetrician, midwife manager, clinical 1937
midwife, other, or no risk manager), and the frequency of perinatal meetings. None of these variables 1938
were significantly associated with still birth or neonatal mortality rates in univariate analysis, nor was 1939
midwife staffing levels. 1940
1941
Other local level management factors 1942
No studies were identified which met inclusion criteria and assessed the effect of maternity team 1943
management and administration (e.g. shift patterns), staff and student supervision, or supernumerary 1944
arrangements on safe midwifery staffing levels. 1945
1946
1947
Evidence statement 5: Effect of unit level management factors on midwifery staffing 1948
requirements 1949
Evidence from 1 UK RCT1 ([+] 1,505 women) and 1 UK correlational study2 ([+] 540,834 births) suggests 1950
that: 1951
1952
Model of care1 (caseload or shared care) may be associated with some maternal and neonatal 1953
outcomes. 1954
Risk management practices (presence and grade of a risk manager, frequency of perinatal 1955
meetings) and presence of a 24 hour epidural service are not associated with stillbirth and 1956
neonatal mortality rates. 1957
No evidence was identified about the effect of maternity team management and 1958
administration (e.g. shift patterns), staff and student supervision, or supernumerary 1959
arrangements on safe midwifery staffing levels. 1960
1961 1 NSCCRT 2000 [+] 1962 2 Joyce et al. 2004 [+] 1963

Page 77 of 129
Bazian Ltd Registered office: 25 St James's Street, London, SW1A 1HG
Company Registered in England and Wales No: 3724527. VAT Registration No. 340 4368 76.
Question 6: What organisational factors influence safe midwifery staffing at a unit 1964
level? 1965
1966
No studies were identified which met inclusion criteria and assessed the effect of organisational 1967
factors, such as management structures and approaches, organisational culture, organisational 1968
policies and procedures (including staff training) on safe midwifery staffing levels. 1969
1970
1971
Evidence statement 6: Effect of organisational factors on safe midwifery staffing levels 1972
No studies were identified which met inclusion criteria and assessed the effect of organisational 1973
factors, such as management structures and approaches, organisational culture, organisational 1974
policies and procedures (including staff training) on safe midwifery staffing levels. 1975
1976
1977
1978

Page 78 of 129
Bazian Ltd Registered office: 25 St James's Street, London, SW1A 1HG
Company Registered in England and Wales No: 3724527. VAT Registration No. 340 4368 76.
Discussion 5.1979
Overall few significant associations between midwife staffing levels and outcomes were identified. 1980
The evidence suggests that increased midwife staffing may be associated with an increased likelihood 1981
of delivery with bodily integrity (no uterine damage, 2nd/3rd/4th degree tear, stitches, episiotomy, 1982
or C-section), reduced maternal readmissions within 28 days, and reduced decision-to-delivery times 1983
for emergency C-sections. However, it may not be associated with overall C-section rates, composite 1984
‘healthy mother’ or ‘health baby’ outcomes, rates of ‘normal’ or ‘straightforward’ births, or stillbirth 1985
or neonatal mortality. 1986
1987
Interpretation is also complicated by the use of differing, but overlapping, outcomes in different 1988
studies. For example, although delivery with bodily integrity (DwBI) was increased with higher 1989
midwife staffing in one study, another study suggested a possible reduction in straightforward birth 1990
with increasing levels of midwife staffing. Straightforward birth includes some of the same outcomes 1991
as DwBI (straightforward birth defined as no intrapartum C-section or 3rd/4th degree perineal trauma 1992
both of which form part of DwBI, as well as no birth without forceps or ventouse or blood 1993
transfusion). 1994
1995
No studies were identified which assessed the links between midwife staffing and on maternal 1996
mortality or never events (such as maternal death due to post-partum haemorrhage after elective 1997
caesarean section, wrongly prepared high-risk injectable medication, intravenous administration of 1998
epidural medication, or retained foreign objects post-procedure) or serious fetal/neonatal events 1999
such as Erb’s palsy secondary to shoulder dystocia, meconium aspiration syndrome, hypoxic ischaemic 2000
encephalopathy (HIE). 2001
2002
Limited evidence was identified on potential modifiers of the effect of midwife staffing levels on 2003
outcomes, therefore limited conclusions can be drawn about their effects. Only one study (Sandall et 2004
al. in press [++]) formally assessed potential interactions between modifying factors and midwife 2005
staffing levels. Its findings suggested that, maternal clinical risk and parity both appear to be 2006
modifiers, and to themselves have a large impact on outcomes. 2007
2008
Overall the amount of evidence is relatively limited, with relatively few relevant studies (8 studies 2009
included), and most of these using correlational designs, which limits their ability to detect potential 2010
causality. However, all of the relevant studies identified were carried out in the UK, so are likely to 2011
be applicable. Also, while the number of studies is small, some of these have analysed recent data 2012
(2008-2011), and some of these have analysed data for over 600,000 births across the majority of 2013
trusts within England. Most of the outcomes assessed are intrapartum outcomes, and none of the 2014
studies looked at the relationship between midwife staffing and outcome specifically within alongside 2015
or freestanding midwifery units, or for births at home. Therefore results may be less applicable to 2016
these settings. 2017
2018
The limited nature of the empirical evidence has also been noted by other reports, for example, 2019
Gerova et al. 2010 noted that “Most of the studies which have specifically focused on staffing issues 2020
are descriptive in nature, relying primarily on staff opinions, but confirm the perception that lower 2021
staffing levels are associated with adverse outcomes in terms of safety and experience. However 2022
these studies cannot provide estimates of the impact of changes to staffing or provide robust 2023
evidence to guide policy about staffing levels.” A report from the King’s Fund in 2011 (Sandall et al. 2024

Page 79 of 129
Bazian Ltd Registered office: 25 St James's Street, London, SW1A 1HG
Company Registered in England and Wales No: 3724527. VAT Registration No. 340 4368 76.
2011) also noted that “Few studies have examined the relationship between midwifery staffing levels 2025
and patient outcomes.” 2026
2027
Limitations to the studies mean that inference of direct causal links between midwife staffing levels 2028
and outcome is not possible. For example, only 3 included studies attempted to temporally link 2029
individual women’s exposure to midwife staffing levels and their outcomes (Tucker et al. 2003 [+], 2030
Cerbinskaite et al. 2002 [-], and NSCCRT 2000 [+]). The other studies were correlational, and 2031
therefore cannot establish a granular temporal sequence of midwife staffing levels and outcomes, or 2032
establish links for individual women. However, given that staffing levels are generally assessed on a 2033
population level (i.e. as an overall ratio of midwives: women cared for), analysis of exposures of 2034
individual women may not be appropriate or feasible on anything other than a relatively limited 2035
scale. 2036
2037
Seven of the included studies were observational, and despite attempts by some of these to adjust for 2038
confounders, residual confounding cannot be ruled out. The same applies to the RCT (NSCCRT 2000), 2039
despite its design. This is because it compared different models of care rather than specifically 2040
midwife staffing levels, which means that other differences between groups may confound any effect 2041
of differences in staffing levels. RCTs comparing different midwife staffing levels are likely to be 2042
unethical, therefore well-adjusted observational evidence is likely to be the best available evidence 2043
to answer this question. 2044
2045
Another consideration regarding the observational studies, particularly the correlational studies, is 2046
the potential for reverse causality. For example, a unit which deals with more (or less) complicated 2047
pregnancies or births may staff differently as a result, and if these units have worse outcome this may 2048
relate to the complexity of births rather than the staffing levels. 2049
2050
For outcomes which have been found not to be associated with midwife staffing levels, this may be 2051
due to various reasons, including: 2052
A true lack of association between midwife staffing and the given outcome 2053
Insufficient variation in the midwife staffing levels in the studies to be able to detect an 2054
effect (i.e. if the effect may occur below or above a certain staffing threshold which has not 2055
been reached in the studies) 2056
A lack of power to detect an association between midwife staffing and the given outcome, 2057
particularly for less common outcomes 2058
Confounding of results by other staffing levels or other variables and lack of or insufficient 2059
adjustment for these factors in the analyses 2060
The latter two possibilities form part of the quality assessment and scores of the individual studies, 2061
and are noted in cases where they are particularly of concern. 2062
2063
For modifying factors, while there was suggestion of greater benefit of higher midwife staffing for 2064
women of lower clinical risk, this does not necessarily mean that midwife staffing has no impact on 2065
outcomes for women of higher clinical risk. Rather it may reflect that higher risk women may be 2066
prioritised for care even in lower staffing conditions, it may also reflect reverse causality, with higher 2067
risk women being cared for in settings with higher medical rather than midwife staffing. 2068
2069
The majority of directly relevant evidence about potential modifiers of safe midwife staffing levels 2070
related to maternal factors and staffing factors (skill mix of midwives and presence of other 2071
healthcare staff). The absence of evidence for other factors should not be interpreted as evidence of 2072
absence of an effect of these factors on midwife safe staffing. 2073
Page 80 of 129
Bazian Ltd Registered office: 25 St James's Street, London, SW1A 1HG
Company Registered in England and Wales No: 3724527. VAT Registration No. 340 4368 76.
2074
None of the included studies looked specifically at the relationship between midwife staffing in 2075
alongside or freestanding midwifery units or of midwives providing home births and outcomes, and 2076
results may not apply to these settings. 2077
2078
The current evidence review also has some limitations. Due to the limited timescale in which it was 2079
produced a number of pragmatic approaches were taken, based on discussed and agreement with 2080
NICE. For example, the review included only studies which assessed the effect of midwife staffing on 2081
at least one documented safety or process of care outcome. Studies which assessed satisfaction with 2082
care only, qualitative studies or other studies assessing only perceptions of the effect of midwife 2083
staffing were excluded. While satisfaction with care is an important outcome, safety is the key focus 2084
of the safe staffing guidelines. This decision allow the review to focus on a more in-depth assessment 2085
of studies providing objective assessments of safety-related outcomes in the time available, rather 2086
than providing a less in depth review of a wider range of outcomes. 2087
2088
A review of qualitative studies relating to midwife staffing was not feasible within the timescale. This 2089
type of study can provide information about perceptions about potential effects of midwife staffing 2090
levels on causes of events or outcomes, and also about women’s views on care. For example, the 2091
qualitative study by Ashcroft et al. 2003 suggested that some adverse events and unreported ‘near 2092
misses’ were related to midwife shortages, and that this was influenced by clerical duties taking the 2093
midwives away from clinical work and also by poor organisation. However, these studies cannot 2094
provide a quantitative assessment of the links between midwife staffing and outcomes. Ideally the 2095
findings of qualitative research would be followed up with quantitative assessments of the 2096
hypotheses/approaches they generate. 2097
2098
As few studies have directly assessed the impact of midwife staffing on outcomes, another approach 2099
could be to identify all midwife activities shown to be associated with improved outcomes and 2100
calculate times required for a midwife to be able to perform these tasks. However, this reductionist 2101
approach has not been taken here, and it would be unlikely to provide a comprehensive list of tasks, 2102
as many may not have been tested in this way but may still be important. 2103
2104
An alternative approach to look at modifiers of midwife safe staffing levels would be to identify 2105
outcomes affected by midwife staffing, and then search for all studies assessing the impact of the 2106
potential modifiers on these outcomes, whether or not they assess staffing. This was also not feasible 2107
in the timescale, so the review has described links between the factors if interest and outcomes seen 2108
within the studies assessing midwife staffing. However, these findings may not reflect an impact on 2109
midwife safe staffing requirements, and should be interpreted with caution. For example, the results 2110
from Sandall et al. in press [++] show that even if a factor is significantly associated with midwife-2111
staffing-adjusted outcomes (e.g. maternal clinical risk), this does not mean that an interaction 2112
between this factor and midwife staffing exists for all of these outcomes. In addition, other studies 2113
assessing the link between these factors and outcomes may exist which have not been identified or 2114
included by this review, as they have not assessed midwife staffing. 2115
2116
The current review did not aim to assess the effectiveness of caseload or other models of care per se, 2117
rather the impact of models of care on safe midwife staffing levels. As such, studies of models of care 2118
have only been included here if they provided explicit quantitative information about staffing levels 2119
in the two groups. The included RCT (NSCCRT 2000 [+]) came closest to this as it quantified midwife 2120
caseloads in both groups, however, it is not clear whether overall staffing levels differed between 2121
these groups. Other RCTs comparing caseload versus shared care are also likely to have similar 2122

Page 81 of 129
Bazian Ltd Registered office: 25 St James's Street, London, SW1A 1HG
Company Registered in England and Wales No: 3724527. VAT Registration No. 340 4368 76.
caseload differences due to the way in which care is organised in these approaches, but as these were 2123
not explicitly quantified they were not included. 2124
2125
Evidence gaps / need for future research 2126
This review has identified evidence gaps. The amount of research directly relevant to identifying the 2127
relationship between midwife staffing and outcomes is limited. There is even less research which 2128
specifically aims to identify what factors might modify this relationship, and in what way. The 2129
existing research almost all focuses on outcomes in the intrapartum and immediate post-partum 2130
period. The most recent, highest quality study addressed staffing at the trust level, and many studies 2131
could not establish temporal links between midwife staffing levels and outcomes. 2132
2133
Future research could include: 2134
● Studies assessing the impact of differing midwife staffing levels on outcomes in the antenatal 2135
period 2136
● Studies aiming to assess the temporal links between midwife staffing and outcomes 2137
● Unit level analysis specifically assessing modifiers of safe midwife staffing levels, including the 2138
impact of organisational and local level management factors 2139
2140
2141
2142
Page 82 of 129
Bazian Ltd Registered office: 25 St James's Street, London, SW1A 1HG
Company Registered in England and Wales No: 3724527. VAT Registration No. 340 4368 76.
Appendix A: Bibliography 7.2143
Included studies (n=8) 2144
Cerbinskaite A, Malone S, McDermott J et al. (2011) Emergency caesarean section: influences on the 2145
decision-to-delivery interval. Journal of Pregnancy 2011: 640379 2146
2147
Gerova V, Griffiths P, Jones S et al. (2010) The association between midwifery staffing and outcomes 2148
in maternity services in England: observational study using routinely collected data. Preliminary 2149
report and feasibility assessment. London: King's College London. Available from: 2150
http://epubs.surrey.ac.uk/804170/1/NNRUMidwiferyReportDec10.pdf 2151
2152
Joyce R, Webb R, Peacock J. (2002) Predictors of obstetric intervention rates: case-mix, staffing 2153
levels and organisational factors of hospital of birth. Journal of Obstetrics & Gynaecology 22(6): 618-2154
25 2155
2156
Joyce R, Webb R, Peacock JL. (2004) Associations between perinatal interventions and hospital 2157
stillbirth rates and neonatal mortality. Archives of Disease in Childhood Fetal & Neonatal Edition 2158
89(1): F51-F56 2159
2160
North Staffordshire Changing Childbirth Research Team. (2000) A randomised study of midwifery 2161
caseload care and traditional 'shared-care'. Midwifery 16(4): 295-302 2162
2163
Rowe RE, Townend J, Brocklehurst P et al. (2014) Service configuration, unit characteristics and 2164
variation in intervention rates in a national sample of obstetric units in England: an exploratory 2165
analysis. BMJ Open 4(5): e005551 2166
2167
Sandall J, Murrells T, Dodwell M et al. (2014) The efficient use of the maternity workforce and the 2168
implications for safety & quality in maternity care. Health Service and Delivery Research 2014; in 2169
press 2170
2171
Tucker J, Parry G, Penney G et al. (2003) Is midwife workload associated with quality of process of 2172
care (continuous electronic fetal monitoring [CEFM]) and neonatal outcome indicators? A prospective 2173
study in consultant-led labour wards in Scotland. Paediatric and Perinatal Epidemiology 17(4): 369-77 2174
2175
Background and discussion references 2176
Ashcroft B, Elstein M, Boreham N et al. Prospective semistructured observational study to identify risk 2177
attributable to staff deployment, training, and updating opportunities for midwives. British Medical 2178
Journal. 2003;327(7415):584-6. 2179
2180
DH. (2007) Maternity Matters: Choice, access and continuity of care in a safe service. London: 2181
Department of Health. Available from: 2182
http://webarchive.nationalarchives.gov.uk/20130107105354/http://www.dh.gov.uk/prod_consum_d2183
h/groups/dh_digitalassets/@dh/@en/documents/digitalasset/dh_074199.pdf 2184
2185
DH. (2010) Midwifery 2020: Delivering expectations. London: Department of Health. Available from: 2186
https://www.gov.uk/government/uploads/system/uploads/attachment_data/file/216029/dh_1194702187
.pdf 2188
2189

Page 83 of 129
Bazian Ltd Registered office: 25 St James's Street, London, SW1A 1HG
Company Registered in England and Wales No: 3724527. VAT Registration No. 340 4368 76.
DH. (2014) Hard truths: the journey to putting patients first. London: The Stationary Office. Available 2190
from: https://www.gov.uk/government/publications/mid-staffordshire-nhs-ft-public-inquiry-2191
government-response 2192
2193
Francis R. (2013) Report of the Mid Staffordshire NHS Foundation Trust Public Inquiry: Executive 2194
summary. London: The Stationery Office. Available from: 2195
http://www.midstaffspublicinquiry.com/sites/default/files/report/Executive%20summary.pdf 2196
2197
House of Commons Committee of Public Accounts. (2014) Maternity services in England: fortieth 2198
report of session 2013-14. London: The Stationary Office. Available from: 2199
http://www.publications.parliament.uk/pa/cm201314/cmselect/cmpubacc/776/776.pdf 2200
2201
National Advisory Group on the Safety of Patients in England. (2014) A promise to learn – a 2202
commitment to act: Improving the safety of patients in England. London: Department of Health. 2203
Available from: 2204
https://www.gov.uk/government/uploads/system/uploads/attachment_data/file/226703/Berwick_R2205
eport.pdf 2206
2207
National Audit Office. (2013) Maternity services in England. London: The Stationery Office. Available 2208
from: http://www.nao.org.uk/wp-content/uploads/2013/11/10259-001-Maternity-Services-Book-2209
1.pdf 2210
2211
National Quality Board. (2013) How to ensure the right people, with the right skills, are in the right 2212
place at the right time: a guide to nursing, midwifery and care staffing capacity and capability. 2213
Redditch: NHS England. Available from: http://www.england.nhs.uk/wp-2214
content/uploads/2013/11/nqb-how-to-guid.pdf 2215
2216
NCT, National Federation of Women's Institutes. (2013) Support overdue: women's experiences of 2217
maternity services. London: National Federation of Women's Institutes. Available from: 2218
http://www.thewi.org.uk/__data/assets/pdf_file/0006/49857/support-overdue-final-15-may-2219
2013.pdf 2220
2221
NICE. (2014) Safe staffing guideline: Scope. London: National Institute for Health and Care 2222
Excellence. Available from: https://www.nice.org.uk/guidance/gid-2223
safemidwiferystaffingformaternitysettings/resources/safe-midwifery-staffing-for-maternity-settings3 2224
2225
O'Neill O. (2008) Safe births: Everybody's business. Independent inquiry into the safety of maternity 2226
services in England. London: King's Fund. Available from: 2227
http://www.kingsfund.org.uk/sites/files/kf/field/field_publication_file/safe-births-everybodys-2228
business-onora-oneill-february-2008.pdf 2229
2230
RCOG, RCM, RCA et al. (2007) Safer childbirth: minimum standards for the organisation and delivery 2231
of care in labour. London: RCOG Press. Available from: 2232
https://www.rcm.org.uk/sites/default/files/WPRSaferChildbirthReport2007.pdf 2233
2234
Sandall J, Homer C, Sadler E et al. (2011) Staffing in maternity units: getting the right people in the 2235
right place at the right time. London: King's Fund. Available from: 2236
http://www.kingsfund.org.uk/sites/files/kf/staffing-maternity-units-kings-fund-march2011.pdf 2237
2238

Page 84 of 129
Bazian Ltd Registered office: 25 St James's Street, London, SW1A 1HG
Company Registered in England and Wales No: 3724527. VAT Registration No. 340 4368 76.
Studies excluded at full text appraisal (n=141) 2239
No or incomplete midwife staffing level data (n=44) 2240
Allen VM, Jilwah N, Joseph KS et al. The influence of hospital closures in Nova Scotia on perinatal 2241
outcomes. Journal of Obstetrics & Gynaecology Canada: JOGC. 2004;26(12):1077-85. 2242
Bai J, Gyaneshwar R, Bauman A. Models of antenatal care and obstetric outcomes in Sydney South 2243
West. Australian & New Zealand Journal of Obstetrics & Gynaecology. 2008;48(5):454-61. 2244
Barnett C. Realigning the service. Evaluating maternity day care in Ninewells Hospital, Dundee. 2245
Practising Midwife. 2000;3(2):23-5. 2246
Begley C, Devane D, Clarke M et al. Comparison of midwife-led and consultant-led care of healthy 2247
women at low risk of childbirth complications in the Republic of Ireland: a randomised trial. BMC 2248
Pregnancy and Childbirth. 2011;11. 2249
Benatar S, Garrett AB, Howell E et al. Midwifery care at a freestanding birth center: A safe and 2250
effective alternative to conventional maternity care. Health Services Research. 2013;48(5):1750-68. 2251
Benjamin Y, Walsh D, Taub N. A comparison of partnership caseload midwifery care with conventional 2252
team midwifery care: labour and birth outcomes. Midwifery. 2001;17(3):234-40. 2253
Berglund AC, Lindmark GC. Health services effects of a reduced routine programme for antenatal care 2254
- An area-based study. European Journal of Obstetrics Gynecology and Reproductive Biology. 2255
1998;77(2):193-9. 2256
Bernitz S, Rolland R, Blix E et al. Is the operative delivery rate in low-risk women dependent on the 2257
level of birth care? A randomised controlled trial. BJOG: An International Journal of Obstetrics and 2258
Gynaecology. 2011;118(11):1357-64. 2259
Berridge EJ, Mackintosh NJ, Freeth DS. Supporting patient safety: examining communication within 2260
delivery suite teams through contrasting approaches to research observation. Midwifery. 2261
2010;26(5):512-9. 2262
Byrne JP, Crowther CA, Moss JR. A randomised controlled trial comparing birthing centre care with 2263
delivery suite care in Adelaide, Australia. Australian & New Zealand Journal of Obstetrics & 2264
Gynaecology. 2000;40(3):268-74. 2265
Clarke P, Bowcock M, Walsh M et al. Call the midwife: an audit of a telephone triage service. 2266
Essentially MIDIRS. 2012;3(10):17-23. 2267
Collins-Fulea C. Models of organizational structure of midwifery practices located in institutions with 2268
residency programs. Journal of Midwifery & Women's Health. 2009;54(4):287-93. 2269
Dawson A, Cohen D, Candelier C et al. Domiciliary midwifery support in high-risk pregnancy 2270
incorporating telephonic fetal heart rate monitoring: a health technology randomized assessment. 2271
Journal of Telemedicine & Telecare. 1999;5(4):220-30. 2272
Farquhar M. Continuity of care in maternity services: women's views of one team midwifery scheme. 2273
Midwifery. 2000;16(1). 2274

Page 85 of 129
Bazian Ltd Registered office: 25 St James's Street, London, SW1A 1HG
Company Registered in England and Wales No: 3724527. VAT Registration No. 340 4368 76.
Finlay A. Continuity of carer during pregnancy for diabetic women. British Journal of Midwifery. 2275
2000;8(4). 2276
Fraser W, Hatem-Asmar M, Krauss I et al. Comparison of midwifery care to medical care in hospitals in 2277
the Quebec pilot projects study: clinical indicators. L'Equipe dEvaluation des Projets-Pilotes Sages-2278
Femmes. Canadian Journal of Public Health. 2000;Revue(1):I5-11. 2279
Gordon NP, Walton D, McAdam E et al. Effects of providing hospital-based doulas in health 2280
maintenance organization hospitals. Obstetrics and Gynecology. 1999;93(3):422-6. 2281
Griffin R, Richardson M, Morris-Thompson T. An evaluation of the impact of maternity support 2282
workers. British Journal of Midwifery. 2012;20(12):884-9. 2283
Hodnett ED, Stremler R, Willan AR et al. Effect on birth outcomes of a formalised approach to care in 2284
hospital labour assessment units: international, randomised controlled trial. BMJ (Clinical research 2285
ed.). 2008;337:a1021. 2286
Homer C, Davis G, Petocz P et al. Birth centre or labour ward? A comparison of the clinical outcomes 2287
of low-risk women in a NSW hospital. Australian Journal of Advanced Nursing. 2000;18(1):8-12. 2288
Homer CS, Davis GK, Cooke M et al. Women's experiences of continuity of midwifery care in a 2289
randomised controlled trial in Australia. Midwifery. 2002;18(2):102-12. 2290
Homer CSE, Davis GK, Brodie PM et al. Collaboration in maternity care: a randomised controlled trial 2291
comparing community-based continuity of care with standard hospital care. BJOG: An International 2292
Journal of Obstetrics and Gynaecology. 2001;108(1):16-22. 2293
Ickovics JR, Kershaw TS, Westdahl C et al. Group prenatal care and perinatal outcomes - A 2294
randomized controlled trial. Obstetrics and Gynecology. 2007;110(2):330-9. 2295
Johnson M, Stewart H, Langdon R et al. A comparison of the outcomes of partnership caseload 2296
midwifery and standard hospital care in low risk mothers. Australian Journal of Advanced Nursing. 2297
2005;22(3):21-7. 2298
Kashanian M, Javadi F, Haghighi MM. Effect of continuous support during labor on duration of labor 2299
and rate of cesarean delivery. International Journal of Gynecology & Obstetrics. 2010;109(3):198-200. 2300
Lakasing L, Spencer JA. Care management problems on the labour ward: 5 years' experience of 2301
clinical risk management. Journal of Obstetrics & Gynaecology. 2002;22(5):470-6. 2302
Law YY, Lam KY. A randomized controlled trial comparing midwife-managed care and obstetrician-2303
managed care for women assessed to be at low risk in the initial intrapartum period. Journal of 2304
Obstetrics & Gynaecology Research. 1999;25(2):107-12. 2305
Lenaway D, Koepsell TD, Vaughan T et al. Evaluation of a public-private certified nurse-midwife 2306
maternity program for indigent women. American Journal of Public Health. 1998;88(4):675-9. 2307
Lindgren HE, Hildingsson IM, Christensson K et al. Transfers in planned home births related to midwife 2308
availability and continuity: a nationwide population-based study. Birth. 2008;35(1):9-15. 2309

Page 86 of 129
Bazian Ltd Registered office: 25 St James's Street, London, SW1A 1HG
Company Registered in England and Wales No: 3724527. VAT Registration No. 340 4368 76.
Mackintosh N, Watson K, Rance S et al. Value of a modified early obstetric warning system (MEOWS) in 2310
managing maternal complications in the peripartum period: An ethnographic study. BMJ Quality and 2311
Safety. 2014;23(1):26-34. 2312
McCourt C. Research. Working patterns of caseload midwives: a diary analysis. British Journal of 2313
Midwifery. 1998;6(9):580-5. 2314
Morgan M. Quality of midwifery led care : assessing the effects of different models of continuity for 2315
women's satisfaction. Quality in Health Care. 1998;7(2):77-82. 2316
Moster D, Lie RT, Markestad T. Neonatal mortality rates in communities with small maternity units 2317
compared with those having larger maternity units. BJOG: An International Journal of Obstetrics & 2318
Gynaecology. 2001;108(9):904-9. 2319
Rogers J. Maternity services in Sure Start partnerships: trailblazing success. MIDIRS Midwifery Digest. 2320
2008;18(4):485-94. 2321
Rolnick SJ, Hyer B, Jackson J et al. Implementation of an active management of labor guideline in a 2322
managed care setting. Quality Management in Health Care. 1998;6(3):35-42. 2323
Sadler LC, Davison T, McCowan LM. Maternal satisfaction with active management of labor: a 2324
randomized controlled trial. Birth. 2001;28(4):225-35. 2325
Spurgeon P, Hicks C, Barwell F. Antenatal, delivery and postnatal comparisons of maternal 2326
satisfaction with two pilot Changing Childbirth schemes compared with a traditional model of care. 2327
Midwifery. 2001;17(2):123-32. 2328
Stapleton H, Duerden J, Kirkham M. The evaluation of the impact of the supervision of midwives on 2329
professional practice and the quality of midwifery care. London: ENB; 1998. 2330
Symon AG, Paul J, Butchart M et al. Self-rated "no-" and "low-" risk pregnancy: a comparison of 2331
outcomes for women in obstetric-led and midwife-led units in England. Birth. 2007;34(4):323-30. 2332
Tucker J, McVicar A, Pitchforth E et al. Maternity care models in a remote and rural network: 2333
assessing clinical appropriateness and outcome indicators. Quality & Safety in Health Care. 2334
2010;19(2):83-9. 2335
Visintainer PF, Uman J, Horgan K et al. Reduced risk of low weight births among indigent women 2336
receiving care from nurse-midwives. Journal of Epidemiology & Community Health. 2000;54(3):233-8. 2337
Waldenstrom U, Brown S, McLachlan H et al. Does team midwife care increase satisfaction with 2338
antenatal, intrapartum, and postpartum care? A randomized controlled trial. Birth. 2000;27(3):156-2339
67. 2340
Yelland J, Krastev A, Brown S. Enhancing early postnatal care: findings from a major reform of 2341
maternity care in three Australian hospitals. Midwifery. 2009;25(4):392-402. 2342
Yvonne Fontein JACA. The comparison of birth outcomes and birth experiences of low-risk women in 2343
different sized midwifery practices in the Netherlands. Women and Birth. 2010;23(3):103-10. 2344
2345

Page 87 of 129
Bazian Ltd Registered office: 25 St James's Street, London, SW1A 1HG
Company Registered in England and Wales No: 3724527. VAT Registration No. 340 4368 76.
Wrong study design (e.g. systematic reviews, qualitative studies, conference abstracts, news 2346
stories, editorials) (n=40) 2347
Do you think there should be an agreed ratio of maternity care support workers/assistants to 2348
midwives and between the allocation and type of tasks? RCM Midwives. 2006;9(12):498. 2349
RM+RM=better midwifery care: what do we know about associations between registered midwife 2350
staffing levels and better care for women? Policy+, Issue 30. London: King's College London; 2011. 2351
Available from: http://www.kcl.ac.uk/nursing/research/nnru/policy/Policy-Plus-Issues-by-2352
Theme/impactofnursingcare/PolicyIssue30.pdf. 2353
State of maternity services report 2013. London: Royal College of Midwives; 2013. 2354
Towards safer childbirth: minimum standards for the organisation of labour wards: report of a joint 2355
working party. London: Royal College of Obstetricians and Gynaecologists; 1999. 2356
Ashcroft B, Elstein M, Boreham N et al. Prospective semistructured observational study to identify risk 2357
attributable to staff deployment, training, and updating opportunities for midwives. British Medical 2358
Journal. 2003;327(7415):584-6. 2359
Bailey S, Wilson G, Shah K et al. Overworked midwives leads to poor documentation: Is there 2360
correlation between fatigue, workload and quality of documentation? BJOG: An International Journal 2361
of Obstetrics and Gynaecology. 2013;120:416. 2362
Bourke J, McEwan J, Dromgool B et al. Assessing well babies - A midwives program. Journal of 2363
Paediatrics and Child Health. 2013;49(S2):89. 2364
Cerbinskaite A, Ayuk P. Impact of midwife staffing level on outcome of labour. Archives of Disease in 2365
Childhood: Fetal and Neonatal Edition. 2010;95:Fa69. 2366
Chin GSM, Warren N, Kornman LH et al. Comparing multidisciplinary/Obstetric and midwifery birth 2367
centre shift handovers to inform handover improvements. Journal of Paediatrics and Child Health. 2368
2010;46:12. 2369
Cross-Sudworth F, Williams M, Bird I et al. Community midwife caseloads and their effecton stress and 2370
performance. Archives of Disease in Childhood: Fetal and Neonatal Edition. 2010;95:Fa98. 2371
Falconer A, Walker J, Richmond D et al. Midwifery ratios might explain some differences in perinatal 2372
and maternal outcomes. BMJ: British Medical Journal (Overseas & Retired Doctors Edition). 2373
2012;344(7843):26. 2374
Flood M, Forster DA, Davey MA et al. Serious adverse event monitoring in a rct of caseload midwifery 2375
(cosmos). Journal of Paediatrics and Child Health. 2012;48:113. 2376
Forster DA, McLachlan HL, Yelland J et al. Staffing in postnatal units: Is it adequate for the provision 2377
of quality care? Staff perspectives from a state-wide review of postnatal care in Victoria, Australia. 2378
BMC Health Services Research. 2006;6. 2379
Gough K, Bexon K, Bedson R. Staffing on labour ward: is it at a critical level? International Journal of 2380
Obstetric Anesthesia. 2012;21:S52. 2381

Page 88 of 129
Bazian Ltd Registered office: 25 St James's Street, London, SW1A 1HG
Company Registered in England and Wales No: 3724527. VAT Registration No. 340 4368 76.
Grover K. Where are ratios for midwives? Lamp. 2011;68(2):7. 2382
Hartz DL, Tracy S, Kildea S et al. Does caseload midwifery reduce caesarean section operation rates: 2383
The m@ngo trial. Journal of Paediatrics and Child Health. 2012;48:27. 2384
Hartz D, Hall B, Allen J et al. The M@NGO Trial: Does caseload midwifery reduce caesarean section 2385
operation rates? Women & Birth. 2013;26:S8-S9. 2386
Hatem M, Sandall J, Devane D et al. Midwife-led versus other models of care for childbearing women. 2387
Cochrane Database of Systematic Reviews. 2008;(4):CD004667. 2388
Henderson C. The public health role of the midwife in the West Midlands 2001: final report. 2389
Birmingham: University of Birmingham: School of Health Sciences; 2001. 2390
James A, Endacott R, Stenhouse E. Factors affecting the threshold transfer of sick parturients to 2391
higher levels of care. Intensive Care Medicine. 2013;39:S227. 2392
McCourt C, Rayment J, Rance S et al. Organisational strategies and midwives' readiness to provide 2393
care for out of hospital births: an analysis from the birthplace organisational case studies. Midwifery. 2394
2012;28(5):636-45. 2395
McIntosh B, Cookson G, Sandall J. A call to arms: the efficient use of the maternity workforce. British 2396
Journal of Midwifery. 2012;20(2):122-7. 2397
McKenna H, Hasson F. A study of skill mix issues in midwifery: a multimethod approach. Journal of 2398
Advanced Nursing. 2002;37(1):52-61. 2399
McLachlan HL, Forster DA, Davey MA et al. A randomised controlled trial of caseload midwifery for 2400
women at low risk of medical complications (COSMOS): Maternal and infant outcomes. Journal of 2401
Paediatrics and Child Health. 2011;47:33. 2402
McLachlan H, Forster D, Davey MA et al. A randomised controlled trial of caseload midwifery for 2403
women at low risk of medical complications (COSMOS): Primary and secondary outcomes. Women & 2404
Birth. 2011;24:S13. 2405
Michelsen C, Schling S, Gross MM. Models of midwifery care in Germany. Archives of Gynecology and 2406
Obstetrics. 2010;282:S71. 2407
Moffat K, Ryan J, Du PJ et al. Decreasing the caesarean section rate: The project primip bundle of 2408
care. Journal of Paediatrics and Child Health. 2012;48:100. 2409
Morrow J, Forster D, McLachlan H et al. Can we improve women's satisfaction with postnatal care? 2410
Implementing and evaluating individualised postnatal care and caseload midwifery using a before and 2411
after design. Journal of Paediatrics and Child Health. 2011;47(s1):29. 2412
Muglu J, Nallapeta S, Farrukh A. Obstetric performance of multi-ethnic teenage pregnant women in 2413
Manchester attending dedicated antenatal service in a tertiary hospital. International Journal of 2414
Gynecology and Obstetrics. 2009;107:S486. 2415
National Quality Board. How to ensure the right people, with the right skills, are in the right place at 2416
the right time: a guide to nursing, midwifery and care staffing capacity and capability. Redditch: NHS 2417

Page 89 of 129
Bazian Ltd Registered office: 25 St James's Street, London, SW1A 1HG
Company Registered in England and Wales No: 3724527. VAT Registration No. 340 4368 76.
England; 2013. Available from: http://www.england.nhs.uk/wp-content/uploads/2013/11/nqb-how-2418
to-guid.pdf. 2419
Olsen O, Clausen JA. Planned hospital birth versus planned home birth. Cochrane Database of 2420
Systematic Reviews. 2012;(9). 2421
Owen R, Candelier CK. A 'modified' chaps tool - An effective system for handover of care between 2422
medical staff in a maternity unit setting. Archives of Disease in Childhood: Fetal and Neonatal Edition 2423
95, Fa66-Fa67. 2010. 2424
Pyone T, Sorensen BL, Tellier S. Childbirth attendance strategies and their impact on maternal 2425
mortality and morbidity in low-income settings: a systematic review. Acta Obstetricia et Gynecologica 2426
Scandinavica. 2012;91(9):1029-37. 2427
Samangaya RA, Whitworth MK, Mason J et al. Identifying workload and types of admissions in an 2428
obstetric triage department. Archives of Disease in Childhood: Fetal and Neonatal Edition. 2429
2010;95:Fa73. 2430
Saunders A, Jones F, Carlin A et al. UK obstetric critical care provision remains unfit for purpose. 2431
Archives of Disease in Childhood: Fetal and Neonatal Edition. 2013;98:A83. 2432
Sinni SV, Wallace EM, Cross WM. Maternity care - Findings from a clinical audit on pregnancy care and 2433
perceptions of staff who provide that care. Journal of Paediatrics and Child Health. 2012;48:49. 2434
Teate A, Leap N, Rising SS et al. Women's experiences of group antenatal care in Australia-the 2435
CenteringPregnancy Pilot Study. Midwifery. 2011;27(2):138-45. 2436
Tillett J. The economy, unit staffing, and patient outcomes. Journal of Perinatal & Neonatal Nursing. 2437
2009;23(4):301-3. 2438
Yelland A, Winter C, Draycott T et al. Midwifery staffing: Variation and mismatch in demand and 2439
capacity. British Journal of Midwifery. 2013;21(8):579-89. 2440
Yulia A, Moody J, Kitson S et al. An evaluation of three models of care for in-patient induction of 2441
labour: An observational study. Archives of Disease in Childhood: Fetal and Neonatal Edition. 2442
2012;97:A5. 2443
Wrong question (n=27) 2444
The European Working Time Directive and Maternity Services: advice from the Royal College of 2445
Obstetricians and Gynaecologists. London: Royal College of Obstetricians and Gynaecologists; 2004. 2446
Ball JA, Washbrook M. Birthrate Plus: using ratios for maternity workforce planning. British Journal of 2447
Midwifery. 2010;18(11):724-30. 2448
Ball JA, Washbrook M. Developing a real-time assessment of staffing needs in delivery suites. British 2449
Journal of Midwifery. 2010;18(12):780-5. 2450
Ball JA, Washbrook M. Workforce planning in midwifery: an overview of 8 years. British Journal of 2451
Midwifery. 2010;18(8):527-32. 2452

Page 90 of 129
Bazian Ltd Registered office: 25 St James's Street, London, SW1A 1HG
Company Registered in England and Wales No: 3724527. VAT Registration No. 340 4368 76.
Beake S. Maternity services policy: does the rhetoric match the reality? British Journal of Midwifery. 2453
2007;15(2). 2454
Biro MA, Waldenstrom U, Pannifex JH. Team midwifery care in a tertiary level obstetric service: a 2455
randomized controlled trial. Birth. 2000;27(3):168-73. 2456
Brintworth K, Sandall J. What makes a successful home birth service: an examination of the 2457
influential elements by review of one service. Midwifery. 2013;29(6):713-21. 2458
Brocklehurst P, Hardy P, Hollowell J et al. Perinatal and maternal outcomes by planned place of birth 2459
for healthy women with low risk pregnancies: the Birthplace in England national prospective cohort 2460
study. BMJ. 2011;343(d7400). 2461
Camur D, Oztek Z, Caman OK. An estimation method for midwife demand. Cahiers de Sociologie et de 2462
Demographie Medicales. 2010;50(4):529-39. 2463
Freeman LM, Adair V, Timperley H et al. The influence of the birthplace and models of care on 2464
midwifery practice for the management of women in labour. Women & Birth: Journal of the 2465
Australian College of Midwives. 2006;19(4):97-105. 2466
Hundley V, Ryan M. Are women's expectations and preferences for intrapartum care affected by the 2467
model of care on offer? BJOG: An International Journal of Obstetrics & Gynaecology. 2004;111(6):550-2468
60. 2469
Jukkala AM, Kirby RS. Challenges faced in providing safe care in rural perinatal settings. MCN, 2470
American Journal of Maternal Child Nursing. 2009;34(6):365-71. 2471
Le RC, Carayol M, Zeitlin J et al. Level of perinatal care of the maternity unit and rate of cesarean in 2472
low-risk nulliparas. Obstetrics & Gynecology. 2006;107(6):1269-77. 2473
Lieu TA, Wikler C, Capra AM et al. Clinical outcomes and maternal perceptions of an updated model 2474
of perinatal care. Pediatrics. 1998;102(6):1437-44. 2475
Lindsay P. Introduction of maternity care assistants. British Journal of Midwifery. 2004;12(10). 2476
Loper D, Hom E. Creating a patient classification system: one birth center's experience in the triage 2477
process. Journal of Perinatal & Neonatal Nursing. 2000;13(4):31-49. 2478
Malott AM, Davis BM, McDonald H et al. Midwifery care in eight industrialized countries: how does 2479
Canadian midwifery compare? Journal of Obstetrics & Gynaecology Canada: JOGC. 2009;31(10):974-9. 2480
McIntyre MJ, Patrick AM, Jones LK et al. Managing projected midwifery workforce deficits through 2481
collaborative partnerships. Australian Health Review. 2012;36(1):75-8. 2482
Mejia A. Planning midwifery services to deliver continuity of care. Journal of the Operational 2483
Research Society. 1998;49(1). 2484
Page L, McCourt C, Beake S et al. Clinical interventions and outcomes of One-to-One midwifery 2485
practice. Journal of Public Health Medicine. 1999;21(3):243-8. 2486
Page 91 of 129
Bazian Ltd Registered office: 25 St James's Street, London, SW1A 1HG
Company Registered in England and Wales No: 3724527. VAT Registration No. 340 4368 76.
Ramudu L, Bullen M, Paterson S. Neonatal professional links program: enhancing skills through 2487
collaborative learning partnerships. Neonatal, Paediatric & Child Health Nursing. 2006;9(1):4-11. 2488
Simpson J, Barkby I, Lockhart K. Workload and workforce planning: supplementary staffing. Nursing 2489
Management (Harrow). 2010;17(2):24-8. 2490
Strobino DM, Baldwin KM, Grason H et al. The relation of FIMR programs and other perinatal systems 2491
initiatives with maternal and child health activities in the community. Maternal & Child Health 2492
Journal. 2004;8(4):239-49. 2493
Vincent D, Hastings-Tolsma M, Park JH. Down the rabbit hole: examining outcomes of nurse midwifery 2494
care. Journal of Nursing Care Quality. 2004;19(4):361-7. 2495
Wilson B. The Leeds University maternity audit project. International Journal for Quality in Health 2496
Care. 2002;14(3):175-81. 2497
Wolleswinkel-van den Bosch JH, Vredevoogd CB, Borkent-Polet M et al. Substandard factors in 2498
perinatal care in The Netherlands: a regional audit of perinatal deaths. Acta Obstetricia et 2499
Gynecologica Scandinavica. 2002;81(1):17-24. 2500
Yelland A, Winter C, Draycott T et al. Midwifery staffing needs; patterns of variation in demand and 2501
capacity, and their possible effects. BJOG: An International Journal of Obstetrics and Gynaecology. 2502
2013;120:472-3. 2503
2504
Wrong/no outcome or no analysis of the link between midwife staffing and outcome data 2505
(n=14) 2506
Analysing the non-medical staffing data: part 2. Employing Nurses and Midwives. 2003;(77). 2507
Ball J, Bennett B, Washbrook M et al. Birthrate Plus Programme. Factors affecting staffing ratios. 2508
British Journal of Midwifery. 2003;11(6):357-60. 2509
Ball J, Bennett B, Washbrook M et al. Birthrate Plus Programme: Further issues in deciding staffing 2510
needs. British Journal of Midwifery. 2003;11(7):416-9. 2511
Cooke HM, Waters DL, Dyer K et al. Development of a best practice model of midwifery-led antenatal 2512
care. Australian Midwifery. 2004;17(2):21-5. 2513
Dunkley L, Haider S. Nursing & midwifery: workforce risks and opportunities: a report to review the 2514
key workforce risks and opportunities within the Nursing and Midwifery workforces. London: Centre 2515
for Workforce Intelligence; 2011. Available from: http://www.cfwi.org.uk/documents/workforce-2516
risks-and-opportunities-nursing-and-midwifery. 2517
Griffin R, Blunt C, Dunkley-Bent J. The impact of maternity care support workers in NHS Scotland. 2518
London: London South Bank University; 2011. 2519
Kennedy I. Midwife staffing levels 'vary greatly'. Midwives. 2008;11(4):6-7. 2520

Page 92 of 129
Bazian Ltd Registered office: 25 St James's Street, London, SW1A 1HG
Company Registered in England and Wales No: 3724527. VAT Registration No. 340 4368 76.
National Audit Office. Maternity services in England. London: The Stationery Office; 7-11-2013. 2521
Available from: http://www.nao.org.uk/wp-content/uploads/2013/11/10259-001-Maternity-Services-2522
Book-1.pdf . 2523
NCT, National Federation of Women's Institutes. Support overdue: women's experiences of maternity 2524
services. London: National Federation of Women's Institutes; 2013. Available from: 2525
http://www.thewi.org.uk/__data/assets/pdf_file/0006/49857/support-overdue-final-15-may-2526
2013.pdf. 2527
NHS Scotland. Nursing & Midwifery: Workload & Workforce: Planning Project. Edinburgh: Scottish 2528
Executive; 2004. Available from: http://www.scotland.gov.uk/Resource/Doc/47237/0013466.pdf. 2529
Nipper B, Roseghini M. Full-time supervisor of midwives: Is this the future for supervision? British 2530
Journal of Midwifery. 2014;22(1):46-52. 2531
RCOG, RCM, RCA et al. Safer childbirth: minimum standards for the organisation and delivery of care 2532
in labour. London: RCOG Press; 2007. Available from: 2533
https://www.rcm.org.uk/sites/default/files/WPRSaferChildbirthReport2007.pdf. 2534
Redshaw M, Rowe R, Schroeder L et al. Mapping maternity care. The configuration of maternity care 2535
in England. Birthplace in England research programme. Final report part 3. NIHR Service Delivery and 2536
Organisation programme; 2011. Available from: 2537
http://www.netscc.ac.uk/hsdr/files/project/SDO_FR3_08-1604-140_V04.pdf. 2538
Turnbull D, Shields N, McGinley M et al. Professional issues. Can midwife-managed units improve 2539
continuity of care? British Journal of Midwifery. 1999;7(8):499-503. 2540
2541
Wrong publication date (before 1998) (n=11) 2542
Flint C, Poulengeris P, Grant A. The 'Know Your Midwife' scheme--a randomised trial of continuity of 2543
care by a team of midwives. Midwifery. 1989;5(1):11-6. 2544
Gagnon AJ, Waghorn K, Covell C. A randomized trial of one-to-one nurse support of women in labor. 2545
Birth-Issues in Perinatal Care. 1997;24(2):71-7. 2546
Hemminki E, Virta AL, Koponen P et al. A Trial on Continuous Human Support During Labor - 2547
Feasibility, Interventions and Mothers Satisfaction. Journal of Psychosomatic Obstetrics and 2548
Gynecology. 1990;11(4):239-50. 2549
Hundley VA, Cruickshank FM, Lang GD et al. Midwife Managed Delivery Unit - A Randomized 2550
Controlled Comparison with Consultant Led Care. British Medical Journal. 1994;309(6966):1400-4. 2551
Hundley VA, Cruickshank FM, Milne JM et al. Satisfaction and continuity of care: Staff views of care in 2552
a midwife-managed delivery unit. Midwifery. 1995;11(4):163-73. 2553
Rowley MJ, Hensley MJ, Brinsmead MW et al. Continuity of Care by A Midwife Team Versus Routine 2554
Care During Pregnancy and Birth - A Randomized Trial. Medical Journal of Australia. 1995;163(6):289-2555
93. 2556

Page 93 of 129
Bazian Ltd Registered office: 25 St James's Street, London, SW1A 1HG
Company Registered in England and Wales No: 3724527. VAT Registration No. 340 4368 76.
Tucker JS, Hall MH, Howie PW et al. Should obstetricians see women with normal pregnancies? A 2557
multicentre randomised controlled trial of routine antenatal care by general practitioners and 2558
midwives compared with shared care led by obstetricians. British Medical Journal. 2559
1996;312(7030):554-9. 2560
Turnbull D, Holmes A, Shields N et al. Randomised, controlled trial of efficacy of midwife-managed 2561
care. Lancet. 1996;348(9022):213-8. 2562
Waldenstrom U, Nilsson CA. A randomized controlled study of birth center care versus standard 2563
maternity care: Effects on women's health. Birth-Issues in Perinatal Care. 1997;24(1):17-26. 2564
Waldenstrom U, Nilsson CA. Experience of Childbirth in Birth Center Care - A Randomized Controlled-2565
Study. Acta Obstetricia et Gynecologica Scandinavica. 1994;73(7):547-54. 2566
Waldenstrom U, Nilsson CA, Winbladh B. The Stockholm Birth Centre Trial: Maternal and infant 2567
outcome. British journal of obstetrics and gynaecology. 1997;104(4):410-8. 2568
2569
Unable to obtain full texts (n=5) 2570
Midwives and safe staffing ratios in hospital labour wards. Australian Midwifery News. 2004;4(1):12. 2571
Chamberlain M, Nair R, Nimrod C et al. Evaluation of a midwifery birthing center in the Canadian 2572
north. International Journal of Circumpolar Health. 1998;57:Suppl-20. 2573
Kenny C. Midwifery. Staffing link to caesarean rate. Nursing Times. 2001;97(44):9-7. 2574
Ksykiewicz-Dorota A, Adamska-Kuzmicka I. Method of Patient Classification System in obstetric staff 2575
scheduling. II. Demand for direct nursing in the delivery room among mothers who deliver by natural 2576
birth. Annales Universitatis Mariae Curie-Sklodowska - Sectio d - Medicina. 2001;56:301-6. 2577
Ksykiewicz-Dorota A, Adamska-Kuzmicka I. Method of Patient Classification System in obstetric staff 2578
scheduling. III. Demand for direct nursing in the delivery room among mothers who deliver by 2579
Caesarean section. Annales Universitatis Mariae Curie-Sklodowska - Sectio d - Medicina. 2001;56:307-2580
11. 2581
2582
2583
94 of 129
Appendix B: Study protocol/methods 8.2584
Operational definitions 2585
Definitions are based on those used in the first safe staffing review on nursing in acute adult wards 2586
and on the full guideline for NICE CG55 on Intrapartum care. 2587
Midwife staffing: the size and skill mix of the midwife team, relative to the number of women or 2588
neonates cared for expressed as midwife hours per woman/neonate day, women/neonates per 2589
midwife or an equivalent measure. 2590
Local level: The level of hospital, ward or unit. 2591
Skill mix: The composition of the midwife team in terms of grade, qualification and experience. 2592
Management approach: An explicit and defined management measure, intervention or practice as 2593
opposed to passive characteristics like leadership styles. This does not preclude active changes to 2594
leadership styles. 2595
Caseload midwifery: Where one midwife (may be referred to as the named midwife’) provides the 2596
majority of care and takes responsibility for a group of women from the antenatal, through 2597
intrapartum to the postnatal period. It aims for a more personal relationship with the woman than in 2598
team midwifery and involves a small group of midwives. When there is one midwife backing up a 2599
named midwife this system is also known as ‘onetoone’ care. Caseload midwifery schemes tend to 2600
be community based. 2601
Team midwifery: Team midwifery is a team of midwives looking after a group of women and caseload 2602
midwifery aims for a more personal relationship with the woman and involves a small group of 2603
midwives. Sizes of teams vary. The aim of most team midwifery schemes is to increase the chance 2604
that women will be cared for in labour by a midwife they have met antenatally, with the focus on 2605
intrapartum continuity often taking precedence over antenatal and postnatal continuity. Team 2606
midwifery schemes have usually been hospital based, or integrated across hospital and community 2607
settings. 2608
Continuity of care: Refers to both continuity of carer and consistency of care. Often refers to 2609
continuity of carer and describes care provided by a midwife or a small group of midwives, from early 2610
pregnancy to the postnatal period. Team midwifery and caseload midwifery are the two main models 2611
of midwifery care that have evolved as a way of organising services so as to provide continuity of 2612
carer. 2613
One to one care in labour and childbirth: Onetoone care is defined as continuous presence and 2614
support either by husband/partners, midwives or other birth supporters during labour and childbirth. 2615
Continuity of care in maternity services refers to both continuity of carer and consistency of care. 2616
Process overview 2617
● Identifying potentially relevant studies using three sifts based on agreed sifting criteria: 2618
− at title level for the initial sift by information specialists 2619
− at title and abstract level for the second sift by health research analysts 2620
− full text sift by health research analysts 2621
● Assessing quality of the included studies 2622

95 of 129
● Extracting data from included studies 2623
● Assessing the quantity, quality and applicability of evidence available 2624
● Summarising findings in line with process agreed 2625
● Developing evidence statements 2626
2627
Further details of the methods for Review are outlined below. 2628
Searching 2629
Searching for this project will be carried out by NICE. The searches provided by NICE to Bazian will 2630
cover: 2631
● Searches of literature databases 2632
● Grey literature searches 2633
● Primary study reference from relevant systematic reviews 2634
2635
Filtering evidence identified 2636
First pass appraisal 2637
Evidence identified in the search will be filtered at the title level by an information specialist to 2638
remove any clearly non-relevant material. Studies will be excluded on the basis of the following: 2639
● Studies not addressing midwife staffing 2640
● Systematic reviews and meta-analyses 2641
● Non-English language studies 2642
● Non-primary study publications e.g. editorials 2643
● Studies not performed in OECD countries 2644
● Studies about maternity workforce planning at a network, regional or national levels, or optimal 2645
service delivery models 2646
● Studies not relevant to the questions/scope being addressed in the reviews 2647
2648
A random sample of 10% of citations identified in the searches will be double sifted by a second 2649
Information Specialist, and agreement will be reported. Reasons for exclusion of individual studies are 2650
not recorded at this stage. Any uncertainties regarding inclusion/exclusion will be resolved by 2651
discussion with a second information specialist. This stage of screening will act as a “coarse filter” 2652
and err on the side of inclusion, to avoid exclusion of studies that may be relevant. 2653
2654
Second pass appraisal 2655
The filtered references will be tagged in Reference Manager and passed on to a Health Research 2656
Analyst, who will carry out a more detailed assessment of the studies based on title/abstract, to 2657
select relevant studies for full text appraisal. The reasons for exclusion will be: 2658
● Studies not addressing midwife staffing 2659
● Systematic reviews and meta-analyses 2660
● Non-English language studies 2661
● Non-primary study publications e.g. editorials 2662
● Studies not performed in OECD countries 2663
● Studies about maternity workforce planning at a network, regional or national levels, or optimal 2664
service delivery models 2665
● Studies not relevant to the questions/scope being addressed in the reviews 2666
● Studies without abstracts (unless title indicates a high level of relevance) 2667
96 of 129
● Studies comparing care provided by midwives with care provided by another healthcare 2668
professional (e.g. a direct comparison of safety of care provided by a midwife versus that of an 2669
obstetrician) 2670
● Purely qualitative studies (i.e. no quantitative data) 2671
● Studies without any documented safety or delivery of care outcomes (the latter to include 2672
number of complaints), i.e. studies with only qualitative assessment of e.g. 2673
maternal/partner/staff experience and satisfaction alone or perception of workload or delivery 2674
of care would be excluded. If these are outcomes in studies assessing safety and care outcomes 2675
they will be reported. 2676
● Non-comparative studies (this could be a within group comparison, e.g. RCT, cohort, cross-2677
sectional, before/after should be included) 2678
● Conference abstracts/theses 2679
● Simulation studies (e.g. modelling studies) 2680
2681
In addition, comparisons across different types of units (e.g. freestanding and conventional labour 2682
wards) or management/organisational approaches that do not specifically mention midwife staffing 2683
level were initially excluded, but these studies were tagged for further reference. After agreement 2684
with NICE these papers were also reviewed in full text. 2685
2686
All uncertainties regarding inclusion or exclusion (that is, possible includes/excludes where the first 2687
reviewer is unsure) were resolved by discussion with a second analyst, or if uncertainty remains after 2688
discussion, by discussion with NICE. 2689
A 10% sample of titles and abstracts will then be double screened at this stage for eligibility for 2690
inclusion. Agreement and inter-rater reliability will be reported. Any disagreements regarding 2691
inclusion/exclusion will be resolved by discussion, with recourse to a third analyst if needed. This 2692
stage of screening will act as a slightly finer filter than the first pass appraisal, but will again err on 2693
the side of inclusion if details are not included to allow decisions about the eligibility of the paper. 2694
Papers selected for full text appraisal will be tagged in Reference Manager. 2695
Full text appraisal 2696
The full text papers will be appraised by a Health Research Analyst, using the same exclusion criteria 2697
as for the second pass appraisal, in order to select studies that match the review scope as laid out in 2698
Section 2.5. In addition, studies assessing the impact of management and organisational factors on 2699
outcomes will be excluded unless the provide information about midwife staffing levels (i.e. midwives 2700
per woman/neonate in the ward/unit/hospital/other setting) for both groups being compared. 2701
Information on reason for exclusion will be recorded in Reference Manager. The reason for exclusion 2702
will be recorded as: 2703
● Wrong question (e.g. not assessing effect of midwife staffing on outcomes, directly comparing 2704
midwife versus doctor care) 2705
● Wrong study type (e.g. systematic review, qualitative study) 2706
● Wrong population (e.g. not pregnant women, neonates, or women trying to conceive) 2707
● No comparator 2708
● Wrong/no outcome data (e.g. includes studies not linking maternity staffing levels to outcome 2709
data, outcomes outside of scope, no documented safety/delivery of care outcomes) 2710
● No midwife staffing level data (i.e. midwives per woman/neonate in the 2711
ward/unit/hospital/other setting data not provided for both groups being compared). 2712

97 of 129
● Other (e.g. studies in non-OECD countries, non-primary study publications, simulation study, 2713
conference abstract/thesis) 2714
2715
All queries regarding inclusion or exclusion (that is, possible includes/excludes where the first 2716
reviewer is unsure) will be resolved by discussion with a second analyst. A 10% sample of full texts 2717
will be double screened at this stage for eligibility for inclusion. Agreement will be reported. 2718
Scope 2719
The review scope is outlined below, including what is covered and not covered by the review. 2720
Parameters Criteria Additional comments
Level to be covered Local level i.e. individual ward/hospital/midwife
unit/local catchment area for community
midwives
Levels not to be
covered
Maternity workforce planning at network,
regional and national levels and optimal service
delivery models for maternity services
Study types/designs
to be included
Other than the exclusions listed below, any study
design included at early sifting stages. Once
initial sifting stages are complete, we will agree
with NICE any restrictions on study designs based
on the hierarchy of evidence.
Studies types/designs
that will not be
included
Non-OECD studies
Non-English language studies
Studies published before 1999
Systematic reviews (see note)
Case reports/case studies
Letters
Editorials
Primary studies in
systematic reviews
identified in the search
for Q1-5 were assessed
for relevant primary
studies by NICE.
Primary studies
included in Cochrane
systematic reviews
identified in the toolkit
and economic searches
as potentially relevant
to Q1-5 were also
assessed by Bazian for
additional relevant
primary studies.
Exposures/
interventions that
will be covered
See individual question breakdowns in tables
below.
In general the exposure/intervention of interest
is midwife staffing levels:
At any of the following stages of care, i.e.
Will consider whether
these groupings will be
used to group studies
in the review e.g. by
stage of care, setting.
Feasibility is likely to

98 of 129
Parameters Criteria Additional comments
Pre-conception
Antenatal
Care during labour
Postnatal care up to 6 weeks
In any of the following settings:
Home
Community
Obstetric units
Alongside midwifery-led units (i.e.
alongside obstetric units)
Free-standing midwifery-led units
And factors that modify the relationship between
midwife staffing and outcomes, including:
• Maternal and neonatal factors
• Environmental factors
• Staffing factors
• Local level management factors
• Organisational factors
depend on the
evidence identified.
Exposures/
interventions that
will not be covered
Staffing requirements for other
members of the multidisciplinary team
(except as a modifier of the effect of
midwife staffing levels)
Optimal service delivery models for
maternity services
Toolkit studies
Toolkit studies are
being covered by NICE.
Populations (groups)
that will be covered
Women attempting to get pregnant, pregnant
women, women in labour, and neonates and
mothers up to 6 weeks postnatally.
Populations (groups)
that will not be
covered
Mothers and babies after 6 weeks postnatally.
Outcomes that will be Serious preventable events
Maternal death and unexpected
This would include the
inverse of these

99 of 129
Parameters Criteria Additional comments
covered
stillbirths and neonatal death
‘Never events’ (serious, largely
preventable safety incidents), including:
o Maternal death due to post-
partum haemorrhage (PPH)
after elective caesarean
section, wrongly prepared high-
risk injectable medication, IV
administration of epidural
medication, retained foreign
objects post-procedure etc.
RCOG maternity dashboard maternal
events:
o Eclampsia
o Major obstetric haemorrhage
o Major blood transfusion
o Admissions to ITU
o Failed instrumental delivery
o 3rd & 4th degree perineal tears
RCOG maternity dashboard infant events
o Erb’s palsy secondary to
shoulder dystocia
o Meconium aspiration syndrome
o Hypoxic ischaemic
encephalopathy
o Unexpected admission to
special care baby unit
outcomes i.e. if
reported as “maternal
survival”, % without a
never event etc.
Delivery of midwifery care
Measures of quality of midwifery activity
including current NICE standards for delivery of
midwifery care, e.g.:
Women accessing antenatal care before
10 weeks (NICE quality standard [QS] 22)
Women with complex social factors
100 of 129
Parameters Criteria Additional comments
accessing appropriate services (NICE
clinical guideline [CG]110)
Women offered minimum set of
antenatal test results (QS22)
Completion of screening questions for
previous or current mental health
problems at first antenatal and
postnatal contact (CG45; QS37)
Women provided with a named midwife
Mode and location of delivery
Continuity of care during established
labour (CG55)
Provision of 1:1 midwifery care during
labour (CG55)
Completion of recommended care after
caesarean section (CG132)
Completion of recommended neonatal
screening
Completion of education on mode of
infant feeding (CG37 and QS37)
Continuity of care during the postnatal
period (QS37)
Completion of observations and other clinical
paperwork
Drug omission and other midwife associated drug
errors
Duration of postnatal stay
Hospital postnatal readmission for mother or
neonate
Reported feedback
Maternal and/or partner/relative
experience and satisfaction ratings
related to maternity care, e.g.
Maternity Patient Reported Outcome
Measures (PROMS), Maternity Services
Liaison Committee (MSLC) minutes and
available surveys
Reported feedback
outcomes are only
reported for studies
which also reported
safety or delivery of
care outcomes.

101 of 129
Parameters Criteria Additional comments
Complaints relating to maternity care
Staff experience and satisfaction ratings
Other outcomes
Completion and maintenance of relevant
staff training
Staff retention and sickness rates
Staff clinical appraisal and statutory
review rates
Midwife vacancy rates
Closure to admission due to staffing
capacity
Outcomes that will
not be covered
Costs This aspect is being
covered separately
2721
Assessing study quality 2722
This will be based on the appropriate NICE quality checklists in the draft unified manual and the 2723
modified quality checklists used in the first safe staffing review. The modified checklists are below. 2724
Quantitative studies reporting correlations and associations 2725
Guidance topic Maternity safe staffing Comments
Study assessed by
Study identification
Ref ID, Author name, year
Study design
Temporally ordered study designs
ranked higher than cross-sectional in
terms of internal validity
1. Population
1.1 Is the source population or source
area well described?
Was the country (e.g. developed or
non-developed, type of health care
system), setting (hospital, community,
unit type etc.), location (urban, rural),
population demographics etc.
adequately described?
++
+
-
NR
NA
1.2 Is the eligible population or area
representative of the source
population or area?
Was the recruitment of individuals,
++
+
-
NR

102 of 129
clusters or areas well defined (e.g.
advertisement, birth register)?
Was the eligible population
representative of the source?
Were important groups
underrepresented?
NA
1.3 Do the selected participants or
areas represent the eligible
population or area?
Was the method of selection of
individuals/clusters/areas from the
eligible population well described?
What % of selected individuals or
clusters agreed to participate (should
be 60% or more)? Were there any
sources of bias?
Were the inclusion or exclusion criteria
explicit and appropriate?
++
+
-
NR
NA
2. Method of selection of exposure (or comparison) group
2.4 How well were likely confounding
factors
identified and controlled?
Were there likely to be other
confounding factors not considered or
appropriately adjusted for? E.g. patient
outcome analyses adjusted for woman’s
age, comorbidity; also for
unit/ward/hospital/trust
characteristics, including other (non-
midwife) staff
Was this sufficient to cause important
bias?
++
+
-
NR
NA
2.5 Is the study applicable to the UK?
UK ++
Other developed country +
Other -
++
+
-
NR
NA
3. Outcomes
3.1 Were the outcome measures and
procedures reliable?
Were outcome measures subjective or
objective?
How reliable were outcome measures
(e.g. inter- or intra-rater reliability
scores)?
Was there any indication that measures
had been validated (e.g. validated
against a gold standard measure or
assessed for content
++
+
-
NR
NA

103 of 129
validity)?
3.2 Were the outcome measurements
complete?
Were all or most of the outcomes likely
to have been identified? (e.g. was data
on outcomes from hospital records
complete)
++
+
-
NR
NA
4. Analyses
4.1 Was the study sufficiently
powered to detect an intervention
effect (if one exists)?
Were there sufficient
wards/hospitals/units/women/births to
detect an effect?
Large multi-hospital (20+) studies ++
Smaller/single hospital studies with
large numbers of births (100,000 or
more) +
Other -
++
+
-
NR
NA
4.2 Were the analytical methods
appropriate?
Was there adjustment for clustering of
data in units/wards/hospitals?
Was there adjustment/control for
ward/unit/hospital characteristics
where relevant?
++
+
-
NR
NA
4.6 Was the precision of association
given or calculable? Is association
meaningful?
Were confidence intervals or p values
for effect estimates given?
Were CIs wide or were they sufficiently
precise to aid decision-making? If
precision is lacking, is this because the
study is underpowered?
++
+
-
NR
NA
5. Summary
5.1 Are the study results internally
valid (i.e. unbiased)?
How well did the study minimise
sources of bias (i.e. adjusting for
potential confounders)?
Were there significant flaws in the
study design?
(Consider answers to: study design, 2.4,
3.1, 3.2, 2.1, 4.2, 4.6)
++
+
-
5.2 Are the findings generalisable to
the source population (i.e. externally
valid)?
++
+
-

104 of 129
Are there sufficient details given about
the study to determine if the findings
are generalisable to the source
population?
Consider: participants, interventions
and comparisons, outcomes, resource
and policy implications.
(Consider answers to: 1.1, 1.2, 1.3,
2.5, 4.1)
2726
Quantitative intervention studies 2727
Guidance topic Maternity safe staffing Comments
Study assessed by
Study identification
Ref ID, Author name, year
Study design
Randomised designs ranked higher
than non-randomised designs
1. Population
1.1 Is the source population or
source area well described?
Was the country (e.g. developed or
non-developed, type of health care
system), setting (hospital, community,
unit type etc.), location (urban,
rural), population demographics etc.
adequately described?
++
+
-
NR
NA
1.2 Is the eligible population or area
representative of the source
population or area?
Was the recruitment of individuals,
clusters or areas well defined (e.g.
advertisement, birth register)?
Was the eligible population
representative of the source?
Were important groups
underrepresented?
++
+
-
NR
NA
1.3 Do the selected participants or
areas represent the eligible
population or area?
Was the method of selection of
individuals/clusters/areas from the
eligible population well described?
What % of selected individuals or
clusters agreed to participate (should
be 60% or more)? Were there any
sources of bias?
++
+
-
NR
NA

105 of 129
Were the inclusion or exclusion
criteria explicit and appropriate?
2. Method of allocation to intervention (or comparison)
2.1 Allocation to intervention (or
comparison). How was selection bias
minimised?
Was allocation to exposure and
comparison randomised? Was it truly
random ++ or pseudo-randomised +
(e.g. consecutive admissions)?
If not randomised, was significant
confounding likely (−) or not (+)?
If a cross-over, was order of
intervention randomised?
++
+
-
NR
NA
2.2 Were interventions (and
comparisons) well described and
appropriate?
Were interventions and comparisons
described in sufficient detail (i.e.
enough for study to be replicated)?
Was comparisons appropriate (e.g.
usual practice rather than no
intervention)?
If unclear intervention or comparison
score -
++
+
-
NR
NA
2.3 Was the allocation concealed?
Could the person determining
allocation of participants or clusters
to intervention or comparison groups
have influenced the
allocation?
Adequate allocation concealment (++)
would include centralised allocation
or computerised allocation systems.
++
+
-
NR
NA
2.5 Was the exposure to the
intervention and comparison
adequate?
The extent to which the
intervention/control were
implemented were clear and
complete or nearly complete (>95%)
(++)
High implementation of intervention
control (80-95%), unlikely to introduce
important bias (+)
Unclear or low implementation (<80%)
of intervention control, likely to
introduce important bias (-)
++
+
-
NR
NA
2.7 Were other interventions similar ++

106 of 129
in both groups?
Staffing levels of other (non-midwife)
staff equal in both groups, if relevant?
Other interventions similar and groups
treated similarly by research
personnel?
If other staffing levels not
measured/controlled or substantially
different between groups score –
+
-
NR
NA
2.8 Were all participants accounted
for at study conclusion?
Were those lost-to-follow-up (i.e.
dropped or lost pre-,during or post-
intervention) acceptably low (<20%)?
Did the proportion lost differ by
group?
++
+
-
NR
NA
2.9 Did the setting reflect usual UK
practice?
UK ++
Other developed country +
Other –
++
+
-
NR
NA
2.10 Did the intervention or control
comparison reflect usual UK
practice?
Did the intervention or comparison
differ significantly from usual practice
in the UK?
For example, did participants receive
intervention (or comparison) delivered
by a different type/level of staff than
it would normally be in the UK? Were
participants monitored more closely?
++
+
-
NR
NA
3. Outcomes
3.1 Were the outcome measures and
procedures reliable?
Were outcome measures subjective or
objective?
How reliable were outcome measures
(e.g. inter- or intra-rater reliability
scores)?
Was there any indication that
measures had been validated (e.g.
validated against a gold standard
measure or assessed for content
validity)?
++
+
-
NR
NA
3.2 Were the outcome
measurements complete?
Were all or most of the outcomes
likely to have been identified? (e.g.
++
+
-
NR

107 of 129
was data on outcomes from hospital
records complete)
NA
3.4 Were outcomes relevant?
Where surrogate outcome measures
were used, did they measure what
they set out to measure? (e.g. are
these objective, valid and reliable?)
++
+
-
NR
NA
4. Analyses
4.1 Were exposure and comparison
groups similar at baseline? If not,
were these adjusted?
Were there any differences between
groups in important confounders at
baseline?
If so, were these adjusted for in the
analyses (e.g. multivariate analyses or
stratification).
Were there likely to be any residual
differences of relevance?
No difference ++
Difference, but adjusted for +
Difference, not adjusted for, or
unclear -
4.3 Was the study sufficiently
powered to detect an intervention
effect (if one exists)?
At least 80% power to detect a
clinically important difference ++
Some consideration of power but
incomplete (e.g. not achieved,
importance of outcome not reported)
No power calculation -
++
+
-
NR
NA
4.4 Were the estimates of effect
size given or calculable?
Were effect estimates (e.g. relative
risks, absolute risks) given or possible
to calculate?
++
+
-
NR
NA
4.5 Were the analytical methods
appropriate?
Were important differences in follow-
up time and likely confounders
adjusted for?
If a cluster design, were analyses of
sample size (and power), and effect
size performed on clusters (and not
individuals)?
Were subgroup analyses pre-specified?
++
+
-
NR
NA
4.6 Was the precision of ++

108 of 129
intervention effect given? Is it
meaningful?
Were confidence intervals or p values
for effect estimates given?
Were CIs wide or were they
sufficiently precise to aid decision-
making? If precision is lacking, is this
because the study is underpowered?
+
-
NR
NA
5. Summary
5.1 Are the study results internally
valid (i.e. unbiased)?
How well did the study minimise
sources of bias (i.e. adjusting for
potential confounders)?
Were there significant flaws in the
study design?
(Consider answers to: study design,
2.1, 2.2, 2.3, 2.5, 2.7, 2.8, 3.1, 3.2,
4.1, 4.4, 4.5, 4.6)
++
+
-
5.2 Are the findings generalisable to
the source population (i.e.
externally valid)?
Are there sufficient details given
about the study to determine if the
findings are generalisable to the
source population?
Consider: participants, interventions
and comparisons, outcomes, resource
and policy implications.
(Consider answers to: 1.1, 1.2, 1.3,
2.9, 2.10, 4.3)
++
+
-
2728
The quality checklist will be applied to all studies selected for inclusion at full text, with 10% double 2729
appraisal. Any disagreements will be resolved by discussion, with recourse to a third analyst if 2730
needed. 2731
Data extraction templates 2732
Data will be extracted and provided in evidence tables (which will be attached as appendices to the 2733
review). These tables will be based on the templates in the draft NICE unified manual (2014) and the 2734
tables in the first safe staffing reviews (on nurse staffing in adult acute units). The data extraction 2735
table templates were provided to NICE for agreement on the information to be extracted, and are 2736
pasted below. Quantitative outcome data extracted will be check by a second analyst. 2737
Study details Bibliographic reference [authors, title, year etc]
Study aim
Study type
109 of 129
[describe method of allocation if applicable]
Source of funding
[describe role of funding organisation if applicable]
Time period/length of follow up
[Years covered by the study if given]
Country
Quality score
Internal validity
[e.g. ++, +, -]
External validity
[e.g. ++, +, -]
Population and setting Setting
Stage of care
[Antenatal/intrapartum/ post-partum]
Number of hospitals/units
[source, eligible, selected if applicable]
Number of women/births
[source, eligible (including whether multiple births included), selected if
applicable; describe age if stated]
Skill mix/type/duties of midwives
[e.g. specialist midwives, grades of midwives etc. and any key description
of their duties that might affect interpretation
Key characteristics of hospitals/units assessed
[If presented, give variables that give an idea of the type and
characteristics of the hospitals/units being compared. This is to allow
comparison across studies and add nuance to results. These may be
reported in e.g. a baseline characteristics table]
e.g. average or range of:
Births in hospital/year
Midwives/1000 deliveries/year
Consultant O&G sessions on labour ward/week
Number of beds/ 1000 deliveries/year
% with maternity theatres
SBCU beds (including NICU)/1000 deliveries/year
Key characteristics of participants assessed
[[particularly for RCTs]
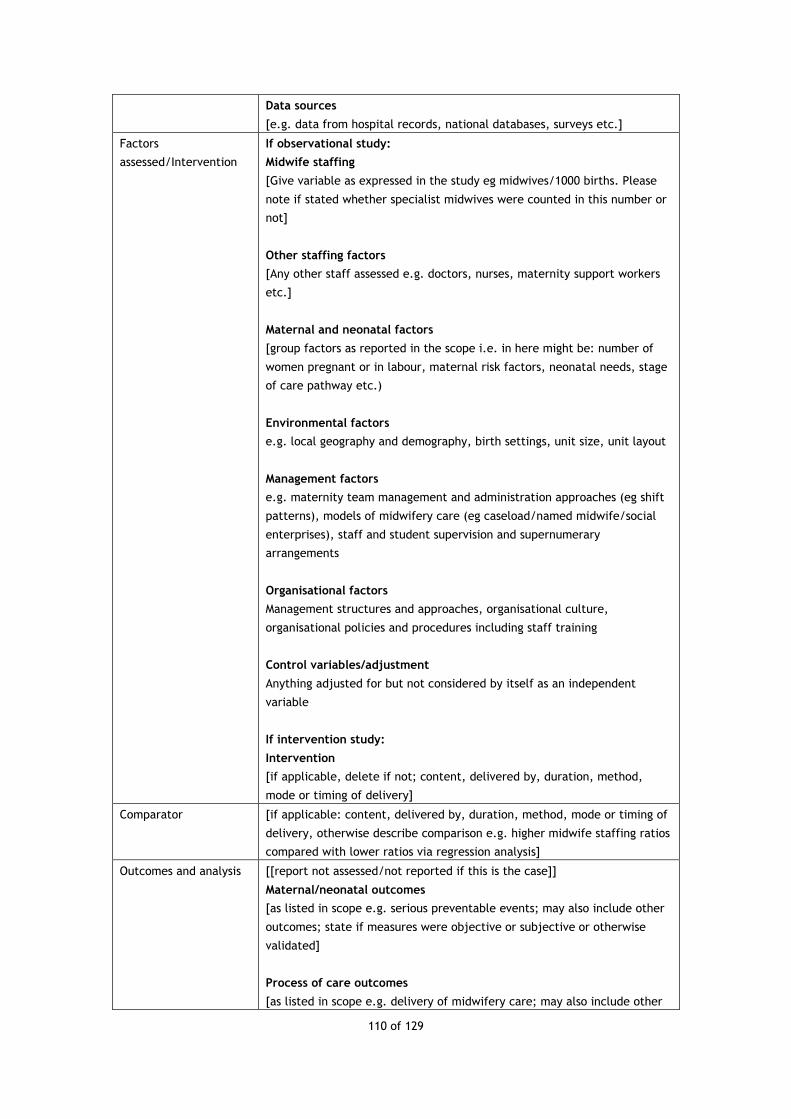
110 of 129
Data sources
[e.g. data from hospital records, national databases, surveys etc.]
Factors
assessed/Intervention
If observational study:
Midwife staffing
[Give variable as expressed in the study eg midwives/1000 births. Please
note if stated whether specialist midwives were counted in this number or
not]
Other staffing factors
[Any other staff assessed e.g. doctors, nurses, maternity support workers
etc.]
Maternal and neonatal factors
[group factors as reported in the scope i.e. in here might be: number of
women pregnant or in labour, maternal risk factors, neonatal needs, stage
of care pathway etc.)
Environmental factors
e.g. local geography and demography, birth settings, unit size, unit layout
Management factors
e.g. maternity team management and administration approaches (eg shift
patterns), models of midwifery care (eg caseload/named midwife/social
enterprises), staff and student supervision and supernumerary
arrangements
Organisational factors
Management structures and approaches, organisational culture,
organisational policies and procedures including staff training
Control variables/adjustment
Anything adjusted for but not considered by itself as an independent
variable
If intervention study:
Intervention
[if applicable, delete if not; content, delivered by, duration, method,
mode or timing of delivery]
Comparator [if applicable: content, delivered by, duration, method, mode or timing of
delivery, otherwise describe comparison e.g. higher midwife staffing ratios
compared with lower ratios via regression analysis]
Outcomes and analysis [[report not assessed/not reported if this is the case]]
Maternal/neonatal outcomes
[as listed in scope e.g. serious preventable events; may also include other
outcomes; state if measures were objective or subjective or otherwise
validated]
Process of care outcomes
[as listed in scope e.g. delivery of midwifery care; may also include other

111 of 129
outcomes; state if measures were objective or subjective or otherwise
validated]
Reported feedback
[as listed in scope e.g. experience and satisfaction, complaints; may also
include other outcomes]
Other outcomes
[as listed in scope e.g. staff training, retention, sickness, vacancies,
clinical appraisal and statutory review rates, or closure of unit to
admissions; state if measures were objective or subjective or otherwise
validated]
Analysis
Brief summary of analysis to aid interpretation
Results Maternal/neonatal outcomes
[give means with SE/SD/CI; median with IQR or range, regression
coefficients, relative measures, effect sizes, CIs, p values, NNT and
considerations of heterogeneity if applicable etc.]
e.g. Mean C-section rate 18.0 per 100 deliveries (SD 3.84; range 8.0 to
33.4)
Process of care outcomes
Reported feedback
Other outcomes
Notes/comments Author conclusions
Author limitations
Review team limitations
[include inadequately reported or missing data]
Other comments
2738
Narrative and quantitative summaries 2739
These will follow the guidelines outlined in the draft unified NICE manual (2014). GRADE assessment 2740
will not be used, as agreed with NICE. They will be drafted by one analyst, with another analyst 2741
reading through for consistency and clarity. 2742
2743

112 of 129
Appendix C: Search Strategy 9.2744
Note on the relationship with other maternity staffing searches 2745
This appendix outlines the searches carried out for this review, which was carried out in order to 2746
inform NICE’s safer staffing guidance for maternity services. It should be read in conjunction with the 2747
protocol for this review, and with the appendices for the associated reviews (i.e. those assessing 2748
approaches for identifying midwifery staffing requirements and skill mix at a local level and the 2749
economic/cost aspects of safe maternity staffing). 2750
References which were identified during each of the associated reviews were shared with the other 2751
(maternity staffing) review groups if they were thought to be relevant to their review questions. 2752
Database search strategies 2753
2754
Medline and Medline-in process 2755
Platform: Ovid 2756
Search date: 13/6/2014 2757
2758
1 Midwifery/ 2759
2 midwi*.tw. 2760
3 Nurse Midwives/ 2761
4 (maternity adj3 worker*).tw. 2762
5 (maternity adj3 staff*).tw. 2763
6 (maternity adj3 assistant*).tw. 2764
7 (midwi* adj3 assistant*).tw. 2765
8 (midwi* adj3 staff*).tw. 2766
9 (midwi* adj3 worker*).tw. 2767
10 (msw* not "municipal solid").tw. 2768
11 or/1-10 2769
12 (staff* adj3 (level* or ratio* or resourc* or model* or number* or mix* or rota* or rosta* or roster* 2770
or schedul* or overtime or supervision or supervisory or sufficient* or sufficiency or adequate* or 2771
adequac* or target* or insufficient* or insufficienc* or inadequate* or inadequac* or short or shortage* 2772
or efficient* or efficienc* or inefficien* or burnout or stress or fatigue or magnet)).tw. 2773
13 (skillmix* or "skill mix*").tw. 2774
14 (staffmix* or "staff mix*").tw. 2775
15 staffing.tw. 2776
16 understaff*.tw. 2777
17 "under staff*".tw. 2778
18 "Personnel Staffing and Scheduling"/ 2779
19 Health Manpower/ 2780
20 manpower.tw,fs. 2781
21 (workload* or workforce* or shift or shiftwork* or shifts or overtime or capacity).tw. 2782
22 Workload/ 2783
23 ("missed care" or "missing care").tw. 2784
24 "care left undone".tw. 2785
25 (hours adj2 day).tw. 2786
26 (work* adj2 hours).tw. 2787
27 (hours adj2 care).tw. 2788
28 (caseload or "case load*").tw. 2789
29 (turnover or "turn over").tw. 2790
30 (FTE or "full-time equivalent").tw. 2791
31 or/12-30 2792
32 11 and 31 2793
33 (midwi* adj3 assistant* adj3 (level* or ratio* or resourc* or model* or number* or mix* or rota* or 2794
rosta* or roster* or schedul* or overtime or supervision or supervisory or sufficient* or sufficiency or 2795

113 of 129
adequate* or adequac* or target* or insufficient* or insufficienc* or inadequate* or inadequac* or short 2796
or shortage* or efficient* or efficienc* or inefficien* or burnout or stress or fatigue or magnet)).tw. 2797
34 (midwi* adj3 worker* adj3 (level* or ratio* or resourc* or model* or number* or mix* or rota* or 2798
rosta* or roster* or schedul* or overtime or supervision or supervisory or sufficient* or sufficiency or 2799
adequate* or adequac* or target* or insufficient* or insufficienc* or inadequate* or inadequac* or short 2800
or shortage* or efficient* or efficienc* or inefficien* or burnout or stress or fatigue or magnet)).tw. 2801
35 (maternity adj3 assistant* adj3 (level* or ratio* or resourc* or model* or number* or mix* or rota* 2802
or rosta* or roster* or schedul* or overtime or supervision or supervisory or sufficient* or sufficiency or 2803
adequate* or adequac* or target* or insufficient* or insufficienc* or inadequate* or inadequac* or short 2804
or shortage* or efficient* or efficienc* or inefficien* or burnout or stress or fatigue or magnet)).tw. 2805
36 (maternity adj3 worker* adj3 (level* or ratio* or resourc* or model* or number* or mix* or rota* 2806
or rosta* or roster* or schedul* or overtime or supervision or supervisory or sufficient* or sufficiency or 2807
adequate* or adequac* or target* or insufficient* or insufficienc* or inadequate* or inadequac* or short 2808
or shortage* or efficient* or efficienc* or inefficien* or burnout or stress or fatigue or magnet)).tw. 2809
37 (midwi* adj3 (level* or ratio* or resourc* or model* or number* or mix* or rota* or rosta* or 2810
roster* or schedul* or overtime or supervision or supervisory or sufficient* or sufficiency or adequate* 2811
or adequac* or target* or insufficient* or insufficienc* or inadequate* or inadequac* or short or 2812
shortage* or efficient* or efficienc* or inefficien* or burnout or stress or fatigue or magnet)).tw. 2813
38 or/33-37 2814
39 "named midwi*".tw. 2815
40 32 or 38 or 39 2816
41 40 2817
42 limit 41 to (english language and yr="1998 -Current") 2818
43 limit 42 to (comment or editorial or news or letter) 2819
44 42 not 43 2820
45 Animals/ 2821
46 Humans/ 2822
47 45 not 46 2823
48 44 not 47 2824
49 perinatal care/ma, og, ec, st 2825
50 delivery rooms/ma, og, ec, st 2826
51 birthing centers/ma, og, ec, st 2827
52 Midwifery/ma, og, ec 2828
53 Nurse midwives/ma, og, ec 2829
54 or/49-53 2830
55 limit 54 to (english language and yr="1998 -Current") 2831
56 limit 55 to (comment or editorial or letter or news) 2832
57 55 not 56 2833
58 Animals/ 2834
59 Humans/ 2835
60 58 not 59 2836
61 57 not 60 2837
62 48 or 61 2838
2839

114 of 129
Embase 2840
Platform: Ovid 2841
Search date: 13/6/2014 2842
2843
1 exp Midwife/ 2844
2 midwi*.tw. 2845
3 Nurs Midwife/ 2846
4 (maternity adj3 worker*).tw. 2847
5 (maternity adj3 staff*).tw. 2848
6 (maternity adj3 assistant*).tw. 2849
7 (midwi* adj3 assistant*).tw. 2850
8 (midwi* adj3 staff*).tw. 2851
9 (midwi* adj3 worker*).tw. 2852
10 (msw* not "municipal solid").tw. 2853
11 or/1-10 2854
12 (staff* adj3 (level* or ratio* or resourc* or model* or number* or mix* or rota* or rosta* or 2855
roster* or schedul* or overtime or supervision or supervisory or sufficient* or sufficiency or adequate* 2856
or adequac* or target* or insufficient* or insufficienc* or inadequate* or inadequac* or short or 2857
shortage* or efficient* or efficienc* or inefficien* or burnout or stress or fatigue or magnet)).tw. 2858
13 (skillmix* or "skill mix*").tw. 2859
14 (staffmix* or "staff mix*").tw. 2860
15 staffing.tw. 2861
16 understaff*.tw. 2862
17 "under staff*".tw. 2863
18 skill mix/ 2864
19 personnel management/ 2865
20 exp health care personnel management/ 2866
21 manpower/ 2867
22 manpower planning/ 2868
23 work schedule/ 2869
24 workload/ 2870
25 working time/ 2871
26 shift worker/ 2872
27 manpower.tw. 2873
28 (workload* or workforce* or shift or shiftwork* or shifts or overtime or capacity).tw. 2874
29 Workload/ 2875
30 magnet hospital/ 2876
31 burnout/ 2877
32 personnel shortage/ 2878
33 ("missed care" or "missing care").tw. 2879
34 "care left undone".tw. 2880
35 (hours adj2 day).tw. 2881
36 (work* adj2 hours).tw. 2882
37 (hours adj2 care).tw. 2883
38 (caseload or "case load*").tw. 2884
39 (turnover or "turn over").tw. 2885
40 (FTE or "full-time equivalent").tw. 2886
41 or/12-40 2887
42 11 and 41 2888
43 (midwi* adj3 assistant* adj3 (level* or ratio* or resourc* or model* or number* or mix* or rota* 2889
or rosta* or roster* or schedul* or overtime or supervision or supervisory or sufficient* or sufficiency 2890
or adequate* or adequac* or target* or insufficient* or insufficienc* or inadequate* or inadequac* or 2891
short or shortage* or efficient* or efficienc* or inefficien* or burnout or stress or fatigue or 2892
magnet)).tw. 2893
44 (midwi* adj3 worker* adj3 (level* or ratio* or resourc* or model* or number* or mix* or rota* or 2894
rosta* or roster* or schedul* or overtime or supervision or supervisory or sufficient* or sufficiency or 2895
adequate* or adequac* or target* or insufficient* or insufficienc* or inadequate* or inadequac* or 2896

115 of 129
short or shortage* or efficient* or efficienc* or inefficien* or burnout or stress or fatigue or 2897
magnet)).tw. 2898
45 (maternity adj3 assistant* adj3 (level* or ratio* or resourc* or model* or number* or mix* or 2899
rota* or rosta* or roster* or schedul* or overtime or supervision or supervisory or sufficient* or 2900
sufficiency or adequate* or adequac* or target* or insufficient* or insufficienc* or inadequate* or 2901
inadequac* or short or shortage* or efficient* or efficienc* or inefficien* or burnout or stress or 2902
fatigue or magnet)).tw. 2903
46 (maternity adj3 worker* adj3 (level* or ratio* or resourc* or model* or number* or mix* or rota* 2904
or rosta* or roster* or schedul* or overtime or supervision or supervisory or sufficient* or sufficiency 2905
or adequate* or adequac* or target* or insufficient* or insufficienc* or inadequate* or inadequac* or 2906
short or shortage* or efficient* or efficienc* or inefficien* or burnout or stress or fatigue or 2907
magnet)).tw. 2908
47 (midwi* adj3 (level* or ratio* or resourc* or model* or number* or mix* or rota* or rosta* or 2909
roster* or schedul* or overtime or supervision or supervisory or sufficient* or sufficiency or adequate* 2910
or adequac* or target* or insufficient* or insufficienc* or inadequate* or inadequac* or short or 2911
shortage* or efficient* or efficienc* or inefficien* or burnout or stress or fatigue or magnet)).tw. 2912
48 or/43-47 2913
49 "named midwi*".tw. 2914
50 42 or 48 or 49 2915
51 limit 50 to (english language and yr="1998 -Current") 2916
52 nonhuman/ 2917
53 human/ 2918
54 52 not 53 2919
55 51 not 54 2920
56 limit 55 to (editorial or letter or note) 2921
57 55 not 56 2922
58 limit 57 to embase 2923
Health Management Information Consortium 2924
Platform: Ovid 2925
Search date: 13/6/2014 2926
2927
1 exp midwives/ 2928
2 midwi*.tw. 2929
3 midwifery/ 2930
4 midwifery services/ 2931
5 (maternity adj3 worker*).tw. 2932
6 (maternity adj3 staff*).tw. 2933
7 (maternity adj3 assistant*).tw. 2934
8 (midwi* adj3 assistant*).tw. 2935
9 (midwi* adj3 staff*).tw. 2936
10 (midwi* adj3 worker*).tw. 2937
11 (msw* not "municipal solid").tw. 2938
12 maternity support workers/ 2939
13 or/1-12 2940
14 exp staffing levels/ 2941
15 skill mix/ 2942
16 staff allocation/ 2943
17 exp workload/ 2944
18 workload management/ or workload measurement/ 2945
19 workload analysis/ 2946
20 staff turnover/ 2947
21 occupational stress/ 2948
22 (staff* adj3 (level* or ratio* or resourc* or model* or number* or mix* or rota* or rosta* or 2949
roster* or schedul* or overtime or supervision or supervisory or sufficient* or sufficiency or adequate* 2950
or adequac* or target* or insufficient* or insufficienc* or inadequate* or inadequac* or short or 2951
shortage* or efficient* or efficienc* or inefficien* or burnout or stress or fatigue or magnet)).tw. 2952
23 (skillmix* or "skill mix*").tw. 2953

116 of 129
24 (staffmix* or "staff mix*").tw. 2954
25 staffing.tw. 2955
26 understaff*.tw. 2956
27 "under staff*".tw. 2957
28 manpower.tw. 2958
29 (workload* or workforce* or shift or shiftwork* or shifts or overtime or capacity).tw. 2959
30 Workload/ 2960
31 ("missed care" or "missing care").tw. 2961
32 "care left undone".tw. 2962
33 (hours adj2 day).tw. 2963
34 (work* adj2 hours).tw. 2964
35 (hours adj2 care).tw. 2965
36 (caseload or "case load*").tw. 2966
37 (turnover or "turn over").tw. 2967
38 (FTE or "full-time equivalent").tw. 2968
39 or/14-38 2969
40 13 and 39 2970
41 (midwi* adj3 assistant* adj3 (level* or ratio* or resourc* or model* or number* or mix* or rota* 2971
or rosta* or roster* or schedul* or overtime or supervision or supervisory or sufficient* or sufficiency 2972
or adequate* or adequac* or target* or insufficient* or insufficienc* or inadequate* or inadequac* or 2973
short or shortage* or efficient* or efficienc* or inefficien* or burnout or stress or fatigue or 2974
magnet)).tw. 2975
42 (midwi* adj3 worker* adj3 (level* or ratio* or resourc* or model* or number* or mix* or rota* or 2976
rosta* or roster* or schedul* or overtime or supervision or supervisory or sufficient* or sufficiency or 2977
adequate* or adequac* or target* or insufficient* or insufficienc* or inadequate* or inadequac* or 2978
short or shortage* or efficient* or efficienc* or inefficien* or burnout or stress or fatigue or 2979
magnet)).tw. 2980
43 (maternity adj3 assistant* adj3 (level* or ratio* or resourc* or model* or number* or mix* or 2981
rota* or rosta* or roster* or schedul* or overtime or supervision or supervisory or sufficient* or 2982
sufficiency or adequate* or adequac* or target* or insufficient* or insufficienc* or inadequate* or 2983
inadequac* or short or shortage* or efficient* or efficienc* or inefficien* or burnout or stress or 2984
fatigue or magnet)).tw. 2985
44 (maternity adj3 worker* adj3 (level* or ratio* or resourc* or model* or number* or mix* or rota* 2986
or rosta* or roster* or schedul* or overtime or supervision or supervisory or sufficient* or sufficiency 2987
or adequate* or adequac* or target* or insufficient* or insufficienc* or inadequate* or inadequac* or 2988
short or shortage* or efficient* or efficienc* or inefficien* or burnout or stress or fatigue or 2989
magnet)).tw. 2990
45 (midwi* adj3 (level* or ratio* or resourc* or model* or number* or mix* or rota* or rosta* or 2991
roster* or schedul* or overtime or supervision or supervisory or sufficient* or sufficiency or adequate* 2992
or adequac* or target* or insufficient* or insufficienc* or inadequate* or inadequac* or short or 2993
shortage* or efficient* or efficienc* or inefficien* or burnout or stress or fatigue or magnet)).tw. 2994
46 or/41-45 2995
47 "named midwi*".tw. 2996
48 40 or 46 or 47 2997
49 limit 48 to yr="1998 -Current" 2998
2999
3000

117 of 129
Cochrane Database of Systematic Reviews; Database of Abstracts of Reviews of Effects; Cochrane 3001
Central Register of Controlled Trials; Health Technology Assessment Database 3002
Platform: Wiley 3003
Search date: 13/6/2014 3004
3005
ID Search 3006
#1 MeSH descriptor: [Midwifery] this term only 3007
#2 MeSH descriptor: [Nurse Midwives] this term only 3008
#3 midwi*:ti,ab 3009
#4 (maternity near/4 worker*):ti,ab 3010
#5 (maternity near/4 staff*):ti,ab 3011
#6 (maternity near/4 assistant*):ti,ab 3012
#7 (midwi* near/4 assistant*):ti,ab 3013
#8 (midwi* near/4 staff*):ti,ab 3014
#9 (midwi* near/4 worker*):ti,ab 3015
#10 (msw* not "municipal solid"):ti,ab 3016
#11 #1 or #2 or #3 or #4 or #5 or #6 or #7 or #8 or #9 or #10 3017
#12 (staff* near/4 (level* or ratio* or resourc* or model* or number* or mix* or rota* or rosta* or 3018
roster* or schedul* or overtime or supervision or supervisory or sufficient* or sufficiency or adequate* 3019
or adequac* or target* or insufficient* or insufficienc* or inadequate* or inadequac* or short or 3020
shortage* or efficient* or efficienc* or inefficien* or burnout or stress or fatigue or magnet)):ti,ab 3021
#13 (skillmix* or "skill mix*"):ti,ab 3022
#14 (staffmix* or "staff mix*"):ti,ab 3023
#15 staffing:ti,ab 3024
#16 understaff*:ti,ab 3025
#17 "under staff*":ti,ab 3026
#18 MeSH descriptor: [Personnel Staffing and Scheduling] explode all trees 3027
#19 MeSH descriptor: [Health Manpower] explode all trees 3028
#20 manpower:ti,ab 3029
#21 (workload* or workforce* or shift or shiftwork* or shifts or overtime or capacity):ti,ab 3030
#22 MeSH descriptor: [Workload] this term only 3031
#23 ("missed care" or "missing care"):ti,ab 3032
#24 "care left undone":ti,ab 3033
#25 (hours near/3 day):ti,ab 3034
#26 (work* near/3 hours):ti,ab 3035
#27 (hours near/3 care):ti,ab 3036
#28 (caseload or "case load*"):ti,ab 3037
#29 (turnover or "turn over"):ti,ab 3038
#30 (FTE or "full-time equivalent"):ti,ab 3039
#31 #12 or #13 or #14 or #15 or #16 or #17 or #18 or #19 or #20 or #21 or #22 or #23 or #24 or #25 3040
or #26 or #27 or #28 or #29 or #30 3041
#32 #11 and #31 3042
#33 (midwi* near/4 assistant* near/4 (level* or ratio* or resourc* or model* or number* or mix* or 3043
rota* or rosta* or roster* or schedul* or overtime or supervision or supervisory or sufficient* or 3044
sufficiency or adequate* or adequac* or target* or insufficient* or insufficienc* or inadequate* or 3045
inadequac* or short or shortage* or efficient* or efficienc* or inefficien* or burnout or stress or 3046
fatigue or magnet)):ti,ab 3047
#34 (midwi* near/4 worker* near/4 (level* or ratio* or resourc* or model* or number* or mix* or 3048
rota* or rosta* or roster* or schedul* or overtime or supervision or supervisory or sufficient* or 3049
sufficiency or adequate* or adequac* or target* or insufficient* or insufficienc* or inadequate* or 3050
inadequac* or short or shortage* or efficient* or efficienc* or inefficien* or burnout or stress or 3051
fatigue or magnet)):ti,ab 3052
#35 (maternity near/4 assistant* near/4 (level* or ratio* or resourc* or model* or number* or mix* 3053
or rota* or rosta* or roster* or schedul* or overtime or supervision or supervisory or sufficient* or 3054
sufficiency or adequate* or adequac* or target* or insufficient* or insufficienc* or inadequate* or 3055
inadequac* or short or shortage* or efficient* or efficienc* or inefficien* or burnout or stress or 3056
fatigue or magnet)):ti,ab 3057
118 of 129
#36 (maternity near/4 worker* near/4 (level* or ratio* or resourc* or model* or number* or mix* or 3058
rota* or rosta* or roster* or schedul* or overtime or supervision or supervisory or sufficient* or 3059
sufficiency or adequate* or adequac* or target* or insufficient* or insufficienc* or inadequate* or 3060
inadequac* or short or shortage* or efficient* or efficienc* or inefficien* or burnout or stress or 3061
fatigue or magnet)):ti,ab 3062
#37 (midwi* near/4 (level* or ratio* or resourc* or model* or number* or mix* or rota* or rosta* or 3063
roster* or schedul* or overtime or supervision or supervisory or sufficient* or sufficiency or adequate* 3064
or adequac* or target* or insufficient* or insufficienc* or inadequate* or inadequac* or short or 3065
shortage* or efficient* or efficienc* or inefficien* or burnout or stress or fatigue or magnet)):ti,ab 3066
#38 "named midwi*":ti,ab 3067
#39 #33 or #34 or #35 or #36 or #37 or #38 3068
#40 #32 or #39 Publication Year from 1998 3069
#41 MeSH descriptor: [Perinatal Care] this term only and with qualifier(s): [Economics - EC, 3070
Manpower - MA, Organization & administration - OG, Standards - ST] 3071
#42 MeSH descriptor: [Delivery Rooms] this term only and with qualifier(s): [Economics - EC, 3072
Manpower - MA, Organization & administration - OG, Standards - ST] 3073
#43 MeSH descriptor: [Birthing Centers] this term only and with qualifier(s): [Economics - EC, 3074
Manpower - MA, Organization & administration - OG, Standards - ST] 3075
#44 MeSH descriptor: [Midwifery] this term only and with qualifier(s): [Economics - EC, Manpower - 3076
MA, Organization & administration - OG] 3077
#45 MeSH descriptor: [Nurse Midwives] this term only and with qualifier(s): [Economics - EC, 3078
Organization & administration - OG] 3079
#46 #40 or #41 or #42 or #43 or #44 or #45 Publication Year from 1998 3080
3081
3082

119 of 129
Cumulative Index to Nursing and Allied Health (CINAHL) 3083
Platform: Ebsco 3084
Search date: 17/6/2014 3085
3086
# Query Limiters/Expanders
S48 s47
Limiters - Exclude
MEDLINE records
Search modes -
Boolean/Phrase
S47 s46
Limiters - Published
Date: 19980101-;
Language: English
Search modes -
Boolean/Phrase
S46 S29 OR S30 OR S31 OR S32 OR S33 OR S34 OR S35 OR S36 OR S37
OR S38 OR S39 OR S40 OR S41 OR S42 OR S43 OR S45
Search modes -
Boolean/Phrase
S45 S18 AND S44 Search modes -
Boolean/Phrase
S44 S19 OR S20 OR S21 OR S22 OR S23 OR S24 OR S25 OR S26 OR S27
OR S28
Search modes -
Boolean/Phrase
S43 (MH "Midwives+/EC/ST") Search modes -
Boolean/Phrase
S42 (MH "Delivery Rooms+/EC/ST") Search modes -
Boolean/Phrase
S41 (MH "Intrapartum Care/EC/ST") Search modes -
Boolean/Phrase
S40 AB "named midwi*" Search modes -
Boolean/Phrase
S39 TI "named midwi*" Search modes -
Boolean/Phrase
S38
AB (midwi* N3 (level* OR ratio* OR resourc* OR model* OR
number* OR mix* OR rota* OR rosta* OR roster* OR schedul* OR
overtime OR supervision OR supervisory OR sufficient* OR
sufficiency OR adequate* OR adequac* OR target* OR insufficient*
OR insufficienc* OR inadequate* OR inadequac* OR short OR
shortage* OR efficient* OR efficienc* OR inefficien* OR burnout
OR stress OR fatigue OR magnet))
Search modes -
Boolean/Phrase
S37
TI (midwi* N3 (level* OR ratio* OR resourc* OR model* OR number*
OR mix* OR rota* OR rosta* OR roster* OR schedul* OR overtime
OR supervision OR supervisory OR sufficient* OR sufficiency OR
adequate* OR adequac* OR target* OR insufficient* OR
insufficienc* OR inadequate* OR inadequac* OR short OR shortage*
OR efficient* OR efficienc* OR inefficien* OR burnout OR stress OR
fatigue OR magnet))
Search modes -
Boolean/Phrase

120 of 129
S36
AB (maternity N3 worker* N3 (level* OR ratio* OR resourc* OR
model* OR number* OR mix* OR rota* OR rosta* OR roster* OR
schedul* OR overtime OR supervision OR supervisory OR sufficient*
OR sufficiency OR adequate* OR adequac* OR target* OR
insufficient* OR insufficienc* OR inadequate* OR inadequac* OR
short OR shortage* OR efficient* OR efficienc* OR inefficien* OR
burnout OR stress OR fatigue OR magnet))
Search modes -
Boolean/Phrase
S35
TI (maternity N3 worker* N3 (level* OR ratio* OR resourc* OR
model* OR number* OR mix* OR rota* OR rosta* OR roster* OR
schedul* OR overtime OR supervision OR supervisory OR sufficient*
OR sufficiency OR adequate* OR adequac* OR target* OR
insufficient* OR insufficienc* OR inadequate* OR inadequac* OR
short OR shortage* OR efficient* OR efficienc* OR inefficien* OR
burnout OR stress OR fatigue OR magnet))
Search modes -
Boolean/Phrase
S34
AB (maternity N3 assistant* N3 (level* OR ratio* OR resourc* OR
model* OR number* OR mix* OR rota* OR rosta* OR roster* OR
schedul* OR overtime OR supervision OR supervisory OR sufficient*
OR sufficiency OR adequate* OR adequac* OR target* OR
insufficient* OR insufficienc* OR inadequate* OR inadequac* OR
short OR shortage* OR efficient* OR efficienc* OR inefficien* OR
burnout OR stress OR fatigue OR magnet))
Search modes -
Boolean/Phrase
S33
TI (maternity N3 assistant* N3 (level* OR ratio* OR resourc* OR
model* OR number* OR mix* OR rota* OR rosta* OR roster* OR
schedul* OR overtime OR supervision OR supervisory OR sufficient*
OR sufficiency OR adequate* OR adequac* OR target* OR
insufficient* OR insufficienc* OR inadequate* OR inadequac* OR
short OR shortage* OR efficient* OR efficienc* OR inefficien* OR
burnout OR stress OR fatigue OR magnet))
Search modes -
Boolean/Phrase
S32
AB (midwi* N3 worker* N3 (level* OR ratio* OR resourc* OR model*
OR number* OR mix* OR rota* OR rosta* OR roster* OR schedul* OR
overtime OR supervision OR supervisory OR sufficient* OR
sufficiency OR adequate* OR adequac* OR target* OR insufficient*
OR insufficienc* OR inadequate* OR inadequac* OR short OR
shortage* OR efficient* OR efficienc* OR inefficien* OR burnout
OR stress OR fatigue OR magnet))
Search modes -
Boolean/Phrase
S31
TI (midwi* N3 worker* N3 (level* OR ratio* OR resourc* OR model*
OR number* OR mix* OR rota* OR rosta* OR roster* OR schedul* OR
overtime OR supervision OR supervisory OR sufficient* OR
sufficiency OR adequate* OR adequac* OR target* OR insufficient*
OR insufficienc* OR inadequate* OR inadequac* OR short OR
shortage* OR efficient* OR efficienc* OR inefficien* OR burnout
OR stress OR fatigue OR magnet))
Search modes -
Boolean/Phrase
S30
AB (midwi* N3 assistant* N3 (level* OR ratio* OR resourc* OR
model* OR number* OR mix* OR rota* OR rosta* OR roster* OR
schedul* OR overtime OR supervision OR supervisory OR sufficient*
OR sufficiency OR adequate* OR adequac* OR target* OR
insufficient* OR insufficienc* OR inadequate* OR inadequac* OR
short OR shortage* OR efficient* OR efficienc* OR inefficien* OR
burnout OR stress OR fatigue OR magnet))
Search modes -
Boolean/Phrase
S29 TI (midwi* N3 assistant* N3 (level* OR ratio* OR resourc* OR Search modes -

121 of 129
model* OR number* OR mix* OR rota* OR rosta* OR roster* OR
schedul* OR overtime OR supervision OR supervisory OR sufficient*
OR sufficiency OR adequate* OR adequac* OR target* OR
insufficient* OR insufficienc* OR inadequate* OR inadequac* OR
short OR shortage* OR efficient* OR efficienc* OR inefficien* OR
burnout OR stress OR fatigue OR magnet))
Boolean/Phrase
S28
AB (skillmix* OR "skill mix*" OR staffmix* OR "staff mix*" OR
staffing OR understaff* OR manpower OR workload* OR workforce*
OR shift OR shiftwork* OR shifts OR overtime OR capacity OR
"missed care" OR "missing care" OR "care left undone" OR (hours
N2 day) OR (work* N2 hours) OR (hours N2 care) OR caseload OR
"case load*" OR turnover OR "turn over" OR FTE OR "full-time
equivalent")
Search modes -
Boolean/Phrase
S27
TI (skillmix* OR "skill mix*" OR staffmix* OR "staff mix*" OR
staffing OR understaff* OR manpower OR workload* OR workforce*
OR shift OR shiftwork* OR shifts OR overtime OR capacity OR
"missed care" OR "missing care" OR "care left undone" OR (hours
N2 day) OR (work* N2 hours) OR (hours N2 care) OR caseload OR
"case load*" OR turnover OR "turn over" OR FTE OR "full-time
equivalent")
Search modes -
Boolean/Phrase
S26
AB (staff* N3 (level* OR ratio* OR resourc* OR model* OR number*
OR mix* OR rota* OR rosta* OR roster* OR schedul* OR overtime
OR supervision OR supervisory OR sufficient* OR sufficiency OR
adequate* OR adequac* OR target* OR insufficient* OR
insufficienc* OR inadequate* OR inadequac* OR short OR shortage*
OR efficient* OR efficienc* OR inefficien* OR burnout OR stress OR
fatigue OR magnet))
Search modes -
Boolean/Phrase
S25
TI (staff* N3 (level* OR ratio* OR resourc* OR model* OR number*
OR mix* OR rota* OR rosta* OR roster* OR schedul* OR overtime
OR supervision OR supervisory OR sufficient* OR sufficiency OR
adequate* OR adequac* OR target* OR insufficient* OR
insufficienc* OR inadequate* OR inadequac* OR short OR shortage*
OR efficient* OR efficienc* OR inefficien* OR burnout OR stress OR
fatigue OR magnet))
Search modes -
Boolean/Phrase
S24 MH "MAGNET HOSPITALS" Search modes -
Boolean/Phrase
S23 MH "PERSONNEL TURNOVER" Search modes -
Boolean/Phrase
S22 MH "BURNOUT,PROFESSIONAL" Search modes -
Boolean/Phrase
S21 MH "PERSONNEL SHORTAGE" Search modes -
Boolean/Phrase
S20 MH "WORKLOAD" Search modes -
Boolean/Phrase
S19 MH "PERSONNEL STAFFING AND SCHEDULING+" Search modes -
Boolean/Phrase
S18 S1 OR S2 OR S3 OR S4 OR S5 OR S6 OR S7 OR S8 OR S9 OR S10 OR Search modes -

122 of 129
S11 OR S12 OR S13 OR S14 OR S15 OR S16 OR S17 Boolean/Phrase
S17 AB (msw* NOT "municipal solid") Search modes -
Boolean/Phrase
S16 AB (midwi* N3 assistant*) Search modes -
Boolean/Phrase
S15 AB (midwi* N3 staff*) Search modes -
Boolean/Phrase
S14 AB (midwi* N3 worker*) Search modes -
Boolean/Phrase
S13 AB (maternity N3 assistant*) Search modes -
Boolean/Phrase
S12 AB (maternity N3 staff*) Search modes -
Boolean/Phrase
S11 AB (maternity N3 worker*) Search modes -
Boolean/Phrase
S10 AB midwi* Search modes -
Boolean/Phrase
S9 TI (msw* NOT "municipal solid") Search modes -
Boolean/Phrase
S8 TI (midwi* N3 assistant*) Search modes -
Boolean/Phrase
S7 TI (midwi* N3 staff*) Search modes -
Boolean/Phrase
S6 TI (midwi* N3 worker*) Search modes -
Boolean/Phrase
S5 TI (maternity N3 assistant*) Search modes -
Boolean/Phrase
S4 TI (maternity N3 staff*) Search modes -
Boolean/Phrase
S3 TI (maternity N3 worker*) Search modes -
Boolean/Phrase
S2 TI midwi* Search modes -
Boolean/Phrase
S1 MH "MIDWIVES+" Search modes -
Boolean/Phrase
3087
3088

123 of 129
British Nursing Index (BNI) 3089
Platform: ProQuest 3090
Search date: 17/6/2014 3091
((SU.EXACT.EXPLODE("Midwifery") OR TI,AB((midwi*) OR (maternity NEAR/3 worker*) OR (maternity 3092
NEAR/3 staff*) OR (maternity NEAR/3 assistant*) OR (midwi* NEAR/3 worker*) OR (midwi* NEAR/3 3093
staff*) OR (midwi* NEAR/3 assistant*) OR (msw* NOT "municipal solid"))) AND (TI,AB(skillmix* OR "skill 3094
mix*" OR staffmix* OR "staff mix*" OR staffing OR understaff* OR "under staff*" OR manpower OR 3095
workload* OR workforce* OR shift OR shiftwork* OR shifts OR overtime OR capacity OR "missed care" 3096
OR "missing care" OR "care left undone" OR (hours NEAR/2 day) OR (work* NEAR/2 hours) OR (hours 3097
NEAR/2 care) OR caseload OR "case load*" OR turnover OR "turn over" OR FTE OR "full-time 3098
equivalent") OR (SU.EXACT("SKILL MIX") OR SU.EXACT("STAFFING LEVELS") OR 3099
SU.EXACT("OCCUPATIONAL STRESS") OR SU.EXACT("STAFF : RECRUITMENT AND TURNOVER")) OR 3100
((staff* NEAR/3 (level* OR ratio* OR resourc* OR model* OR number* OR mix* OR rota* OR rosta* OR 3101
roster* OR schedul* OR overtime OR supervision OR supervisory OR sufficient* OR sufficiency OR 3102
adequate* OR adequac* OR target* OR insufficient* OR insufficienc* OR inadequate* OR inadequac* OR 3103
short OR shortage* OR efficient* OR efficienc* OR inefficien* OR burnout OR stress OR fatigue OR 3104
magnet))))) OR ((midwi* NEAR/3 assistant* NEAR/3 (level* OR ratio* OR resourc* OR model* OR 3105
number* OR mix* OR rota* OR rosta* OR roster* OR schedul* OR overtime OR supervision OR 3106
supervisory OR sufficient* OR sufficiency OR adequate* OR adequac* OR target* OR insufficient* OR 3107
insufficienc* OR inadequate* OR inadequac* OR short OR shortage* OR efficient* OR efficienc* OR 3108
inefficien* OR burnout OR stress OR fatigue OR magnet))) OR ((midwi* NEAR/3 worker* NEAR/3 (level* 3109
OR ratio* OR resourc* OR model* OR number* OR mix* OR rota* OR rosta* OR roster* OR schedul* OR 3110
overtime OR supervision OR supervisory OR sufficient* OR sufficiency OR adequate* OR adequac* OR 3111
target* OR insufficient* OR insufficienc* OR inadequate* OR inadequac* OR short OR shortage* OR 3112
efficient* OR efficienc* OR inefficien* OR burnout OR stress OR fatigue OR magnet))) OR ((maternity 3113
NEAR/3 assistant* NEAR/3 (level* OR ratio* OR resourc* OR model* OR number* OR mix* OR rota* OR 3114
rosta* OR roster* OR schedul* OR overtime OR supervision OR supervisory OR sufficient* OR sufficiency 3115
OR adequate* OR adequac* OR target* OR insufficient* OR insufficienc* OR inadequate* OR inadequac* 3116
OR short OR shortage* OR efficient* OR efficienc* OR inefficien* OR burnout OR stress OR fatigue OR 3117
magnet))) OR ((maternity NEAR/3 worker* NEAR/3 (level* OR ratio* OR resourc* OR model* OR 3118
number* OR mix* OR rota* OR rosta* OR roster* OR schedul* OR overtime OR supervision OR 3119
supervisory OR sufficient* OR sufficiency OR adequate* OR adequac* OR target* OR insufficient* OR 3120
insufficienc* OR inadequate* OR inadequac* OR short OR shortage* OR efficient* OR efficienc* OR 3121
inefficien* OR burnout OR stress OR fatigue OR magnet))) OR ((midwi* NEAR/3 (level* OR ratio* OR 3122
resourc* OR model* OR number* OR mix* OR rota* OR rosta* OR roster* OR schedul* OR overtime OR 3123
supervision OR supervisory OR sufficient* OR sufficiency OR adequate* OR adequac* OR target* OR 3124
insufficient* OR insufficienc* OR inadequate* OR inadequac* OR short OR shortage* OR efficient* OR 3125
efficienc* OR inefficien* OR burnout OR stress OR fatigue OR magnet))) OR TI,AB("named midwi*") 3126
The briefer sets below give a slightly more readable record of the above search – the Boolean logic 3127
is… 3128
(20 AND (21 OR 22 OR 29)) 3129
OR 3130
23 OR 24 OR 25 OR 26 OR 27 OR 28 3131
… 3132

124 of 129
3133

125 of 129
3134
3135

126 of 129
3136
3137

127 of 129
Website searches 3138
Note: where more than three pages of search results were retrieved only the first three pages of 3139
results were examined. 3140
Website Keywords
King’s Fund Searched for single words: midwife; midwifery; midwives; maternity
Note – searched for each term separately
Royal College of
Midwives
Browsed research, guidelines sections.
Initially searched for: (staff* OR workforce) AND (ratio* OR shortage* OR
sufficien* OR number*) – zero results
Searched for single words: staffing; ratio*.
Some results inaccessible due to paywall.
Royal College of
Paediatrics and
Child Health
Boolean search for: (staff* OR workforce) AND (ratio* OR shortage* OR
sufficien* OR number*)
Also searched for single words: staffing; workforce; midwife; midwifery;
midwives; maternity.
Some results inaccessible due to paywall.
News stories tracked to source
Department of
Health
Searched publications section for words…
maternity; midwi*
… in …
guidance; impact assessments; independent reports; research; analysis; policy
documents
… publication types
NHS England Searched for key phrases: maternity staffing; midwife staffing; midwifery
staffing; midwives staffing
NHS Scotland
(maternity OR midwi*) AND (staffing OR workforce OR ratio* OR shortage* OR
sufficien* OR number*)
Scottish
Government
Searched publications section for:
(maternity OR midwi*) AND staffing
Welsh
Government
(maternity OR midwi*) AND staffing
NICE Evidence (maternity OR midwi*) AND (staffing OR workforce OR shortage* OR sufficien*
OR number*)
Google Scholar (maternity OR midwi*) AND (staffing OR workforce OR shortage* OR sufficien*
OR number*)
3141
3142
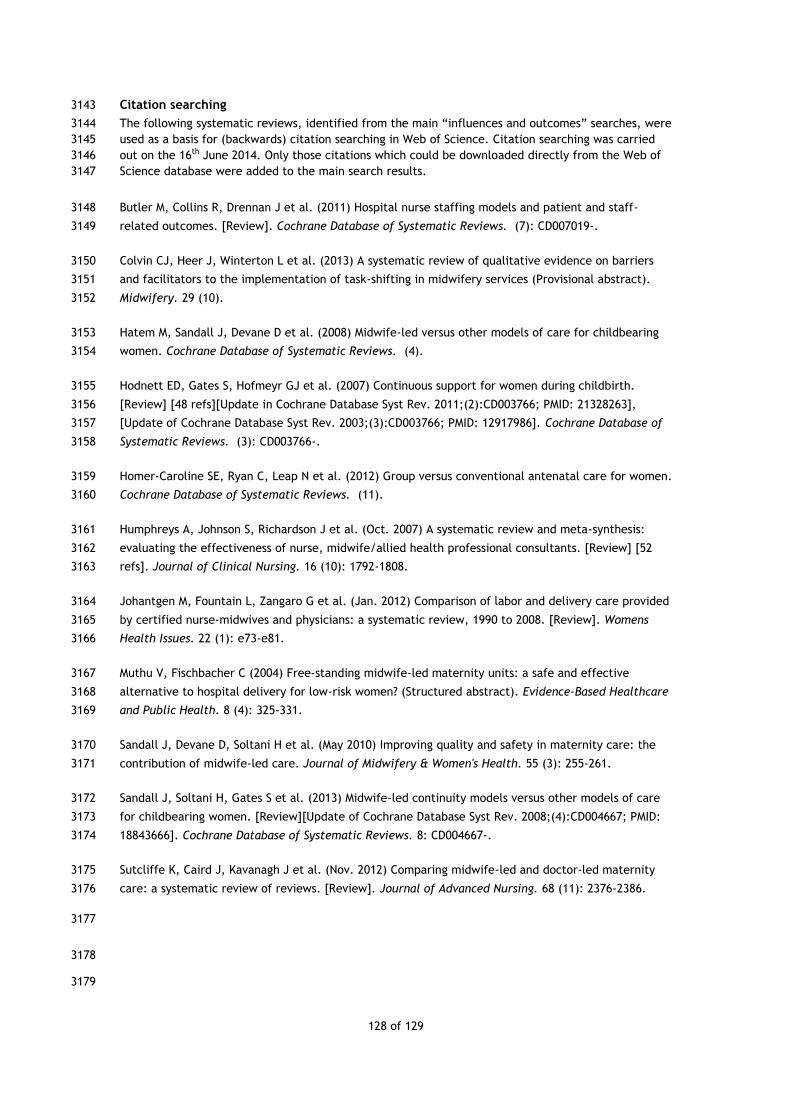
128 of 129
Citation searching 3143
The following systematic reviews, identified from the main “influences and outcomes” searches, were 3144
used as a basis for (backwards) citation searching in Web of Science. Citation searching was carried 3145
out on the 16th June 2014. Only those citations which could be downloaded directly from the Web of 3146
Science database were added to the main search results. 3147
Butler M, Collins R, Drennan J et al. (2011) Hospital nurse staffing models and patient and staff-3148
related outcomes. [Review]. Cochrane Database of Systematic Reviews. (7): CD007019-. 3149
Colvin CJ, Heer J, Winterton L et al. (2013) A systematic review of qualitative evidence on barriers 3150
and facilitators to the implementation of task-shifting in midwifery services (Provisional abstract). 3151
Midwifery. 29 (10). 3152
Hatem M, Sandall J, Devane D et al. (2008) Midwife-led versus other models of care for childbearing 3153
women. Cochrane Database of Systematic Reviews. (4). 3154
Hodnett ED, Gates S, Hofmeyr GJ et al. (2007) Continuous support for women during childbirth. 3155
[Review] [48 refs][Update in Cochrane Database Syst Rev. 2011;(2):CD003766; PMID: 21328263], 3156
[Update of Cochrane Database Syst Rev. 2003;(3):CD003766; PMID: 12917986]. Cochrane Database of 3157
Systematic Reviews. (3): CD003766-. 3158
Homer-Caroline SE, Ryan C, Leap N et al. (2012) Group versus conventional antenatal care for women. 3159
Cochrane Database of Systematic Reviews. (11). 3160
Humphreys A, Johnson S, Richardson J et al. (Oct. 2007) A systematic review and meta-synthesis: 3161
evaluating the effectiveness of nurse, midwife/allied health professional consultants. [Review] [52 3162
refs]. Journal of Clinical Nursing. 16 (10): 1792-1808. 3163
Johantgen M, Fountain L, Zangaro G et al. (Jan. 2012) Comparison of labor and delivery care provided 3164
by certified nurse-midwives and physicians: a systematic review, 1990 to 2008. [Review]. Womens 3165
Health Issues. 22 (1): e73-e81. 3166
Muthu V, Fischbacher C (2004) Free-standing midwife-led maternity units: a safe and effective 3167
alternative to hospital delivery for low-risk women? (Structured abstract). Evidence-Based Healthcare 3168
and Public Health. 8 (4): 325-331. 3169
Sandall J, Devane D, Soltani H et al. (May 2010) Improving quality and safety in maternity care: the 3170
contribution of midwife-led care. Journal of Midwifery & Women's Health. 55 (3): 255-261. 3171
Sandall J, Soltani H, Gates S et al. (2013) Midwife-led continuity models versus other models of care 3172
for childbearing women. [Review][Update of Cochrane Database Syst Rev. 2008;(4):CD004667; PMID: 3173
18843666]. Cochrane Database of Systematic Reviews. 8: CD004667-. 3174
Sutcliffe K, Caird J, Kavanagh J et al. (Nov. 2012) Comparing midwife-led and doctor-led maternity 3175
care: a systematic review of reviews. [Review]. Journal of Advanced Nursing. 68 (11): 2376-2386. 3176
3177
3178
3179

129 of 129
Appendix D: Evidence tables 10.3180
Evidence tables are presented in a separate document. 3181