safer albany plan 2020-2023
TRANSCRIPT

S A F E R A L B A N Y P L A N
2 0 2 0 - 2 0 2 3

Menang acknowledgement
C I T Y O F A L B A N Y 1 0 2 N O R T H R O A D , YA K A M I A | P O B O X 4 8 4 , A L B A N Y, W A 6 3 3 1
P H O N E : ( 0 8 ) 6 8 2 0 3 0 0 0 | E M A I L : S T A F F @ A L B A N Y.W A . G O V. A U | W E B : W W W. A L B A N Y.W A . G O V. A U
THE CITY OF ALBANY
RESPECTFULLY ACKNOWLEDGES THE
MENANG NOONGAR PEOPLE AS THE
TRADITIONAL CUSTODIANS OF THE LAND
ON WHICH THE CITY CONDUCTS ITS
BUSINESS, AND PAYS RESPECT TO
ELDERS PAST AND PRESENT.
1

D O C U M E N T A P P R O V A L
Document Development Officer: Document Owner (Member of EMT):
Senior Community Development Officer (SCDO) Executive Director Community Services
D O C U M E N T C O N T R O L
File Number - Document Type: CM.STD.6 – Plan
Document Reference Number: NS20116840
Status of Document: Council decision: Endorsed 28 July 2020 REF CCS268
Administrative decision: Final
Quality Assurance: Chief Executive Officer, Executive Management Team
Distribution: Public Document
D O C U M E N T R E V I S I O N H I S T O R Y
Version Author Version Description Date Completed
0.1 MGR Draft – v1: Prepared by MGR, post initial workshop held on 31 July 2018
1/8/2018
0.2 SCDO Draft – V2. Prepared by SCDO and reviewed by MCE 20/6/2019
0.3 SCDO Draft – V3 – with updates to legislation as checked by RTL 19/7/2019
0.4 MCE Draft – V4 – reviewed with feedback from EMT 30/10/2019
0.5 SCDO FINAL – with changes from Council and public feedback 28/7/2020
DOCUMENT APPROVAL 2
DOCUMENT CONTROL 2
DOCUMENT REVISION HISTORY 2
EXECUTIVE SUMMARY 4
OVERVIEW 5
Who We Are 6
STRATEGIC CONTEXT 10
LEGISLATIVE CONTEXT 11
RELATED CITY PLANS, STRATEGIES AND POLICIES 12
ROLE OF LOCAL GOVERNMENT IN COMMUNITY SAFETY 12
COMMUNITY SAFETY IN ALBANY 14
Crime Statistics 16
Leading Causes of Injury 18
COMMUNITY PERCEPTIONS OF SAFETY 20
GUIDING PRINCIPLES 22
DEVELOPMENT PROCESS 22
SAFER ALBANY PLAN 24
What is the City of Albany’s role? 24
Safer Albany Plan 24
Priority 1 – Safe Spaces & Places 26
Priority 2 – Community Education & Awareness 28
Priority 3 - Community Partnerships & Collaboration 30
Priority 4 – Building Organisational Capacity 30
IMPLEMENTATION, EVALUATION AND MONITORING 32
Implementation 32
Measuring Performance 32
Evaluating Effectiveness 32
REVIEW POSITION AND DATE 32
REFERENCES 36
DEFINITIONS 36
C O N T E N T S
32

The purpose of this plan is to provide a plan to direct community safety activity within the City of Albany in line with themes 4 and 5 in the City’s Community Strategic Plan.
“There is a strong desire to ensure a sense of belonging and a positive connection between our rural and urban communities. It is important that we know and respect our neighbours, live in communities which support us, and have safe, accessible places to gather and meet. People want to feel welcome, valued and connected.”
Community safety is about how safe people feel both when out within our community and in their own homes. It is an important issue of public concern that impacts upon all those who live, work, visit and do business in Albany.
Safety is not the sole responsibility of the City of Albany. As the recent COVID-19 Pandemic has demonstrated, we all have a part to play in creating a safer community. The Pandemic has also highlighted how important it is that as an organisation, and a community we work together and support each other through difficult times.
The City works closely with a number of agencies including WA Police and Department of Fire & Emergency Services in developing a safe community.
The City of Albany is committed to providing a safe community and has developed this Safer Albany Plan which works towards creating a safer environment. The following are the key priority areas of the plan:
• Safe spaces and places;
• Community awareness and education;
• Community partnerships; and
• Organisational preparedness.
Working together as a community helps to make your neighbourhood safe, secure and vibrant for all who share it.
Community interaction is a shared responsibility that has proven positive effects on building a safer community, preventing crime and developing community spirit.
The City of Albany is committed to working with key partners and the community to increase the safety of our community. This Plan replaces the City of Albany Community Safety and Crime Prevention Plan 2008-2013 and aims to summarise existing City of Albany activities and identify opportunities to make our community safer in the future.
This Plan has been developed using the ‘Australian Safe Communities Framework’ which takes a broad holistic approach to community safety (Australian Safe Communities Foundation. (2012)).
Note: Intentional Injury refers to suicide, assaults, neglect and abandonment. Unintentional Injury incudes most traffic crashes, falls, burns, fire injuries and drowning.
Community safety is an important issue of public concern and is a challenge that demands a cooperative response.
A safe community creates a place that is attractive to live, work, visit and do business.
The City of Albany is in a unique position to build upon existing relationships and develop collaborations to enhance community safety.
The City of Albany recognises that achieving community safety outcomes that are relevant to local issues and concerns is vital for the long term development of Albany, and this is only possible through partnerships and collaboration.
This Plan will provide a framework to develop a planned holistic approach to community safety and crime prevention and guide the City’s focus areas activity for the next four years.
A N D R E W S H A R P E
C H I E F E X E C U T I V E O F F I C E R C I T Y O F A L B A N Y
D E N N I S W E L L I N G T O N
M AY O R
E X E C U T I V E S U M M A R Y O V E R V I E W
4 5
C O M M U N I T Y S A F E T Y
I N J U R YP R E V E N T I O N
C R I M EP R E V E N T I O N
E M E R G E N C YM A N A G E M E N T
I N T E N T I O N A LI N J U R Y
U N I N T E N T I O N A LI N J U R Y
F R E D E R I C K S T O W N W A R D
V A N C O U V E R W A R D
W E S T W A R D
Y A K A M I A W A R D
K A L G A N W A R D
B R E A K S E A W A R D
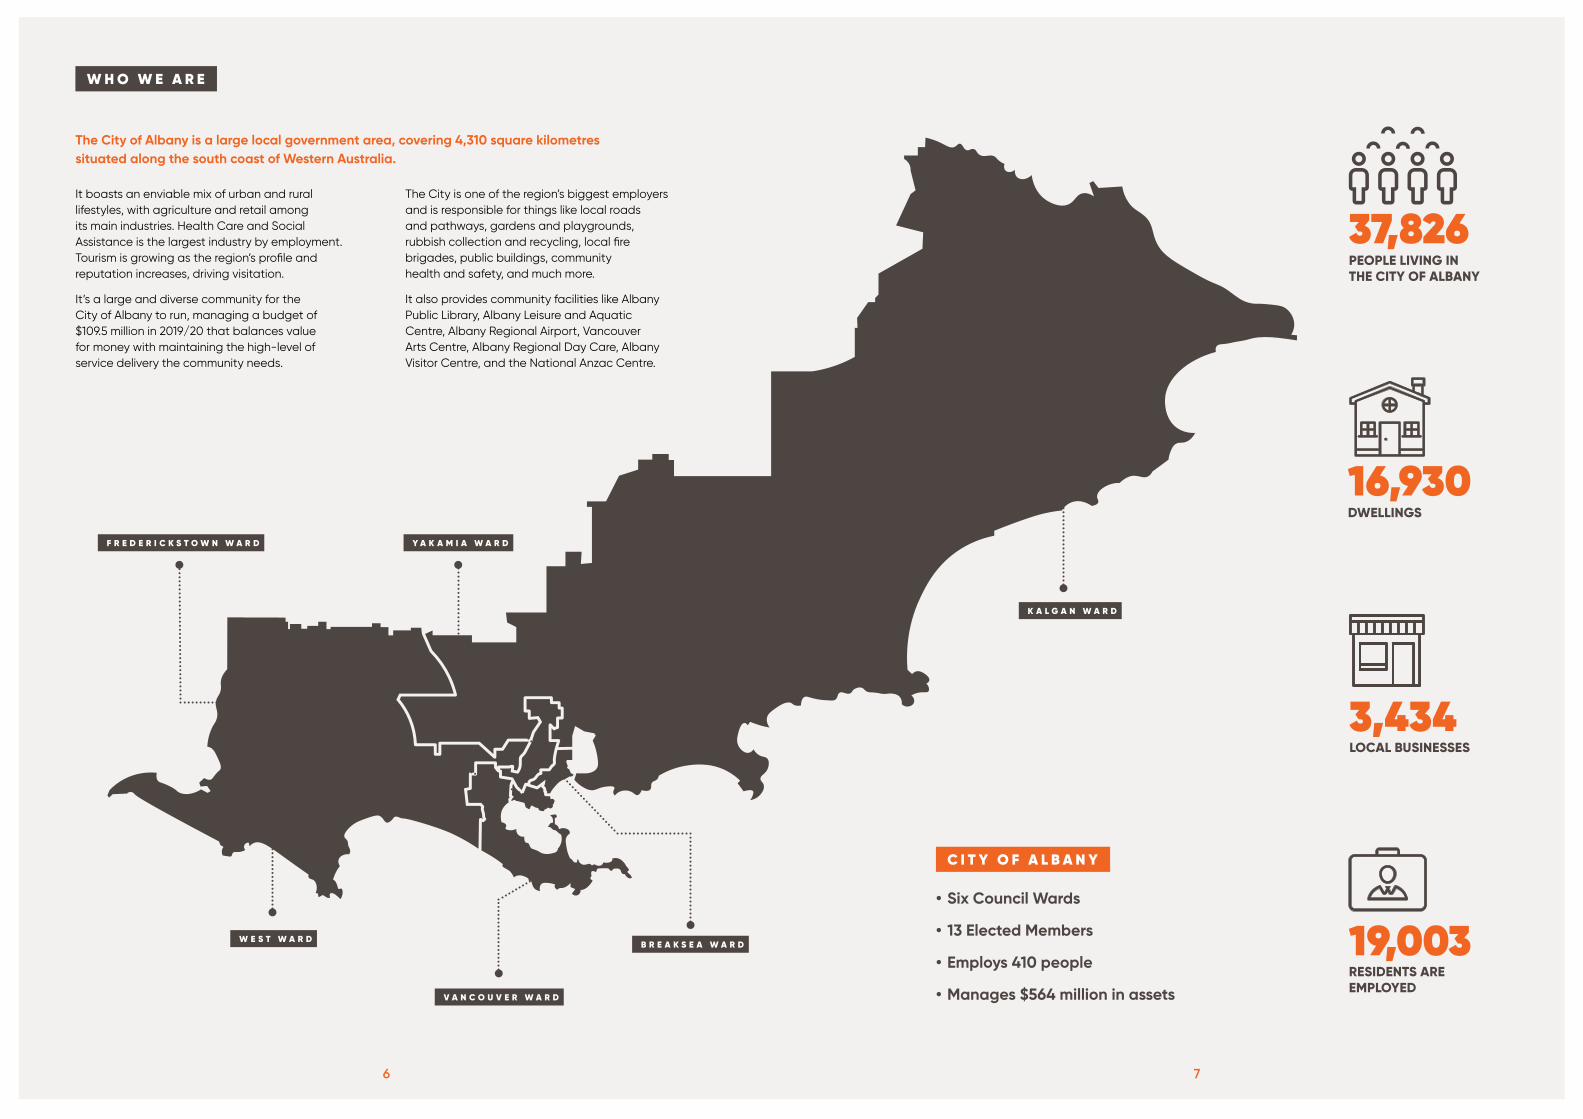
W H O W E A R E
The City of Albany is a large local government area, covering 4,310 square kilometres situated along the south coast of Western Australia.
It boasts an enviable mix of urban and rural lifestyles, with agriculture and retail among its main industries. Health Care and Social Assistance is the largest industry by employment. Tourism is growing as the region’s profile and reputation increases, driving visitation.
It’s a large and diverse community for the City of Albany to run, managing a budget of $109.5 million in 2019/20 that balances value for money with maintaining the high-level of service delivery the community needs.
The City is one of the region’s biggest employers and is responsible for things like local roads and pathways, gardens and playgrounds, rubbish collection and recycling, local fire brigades, public buildings, community health and safety, and much more.
It also provides community facilities like Albany Public Library, Albany Leisure and Aquatic Centre, Albany Regional Airport, Vancouver Arts Centre, Albany Regional Day Care, Albany Visitor Centre, and the National Anzac Centre.
C I T Y O F A L B A N Y
• Six Council Wards
• 13 Elected Members
• Employs 410 people
• Manages $564 million in assets
6 7
37,826 PEOPLE LIVING IN THE CITY OF ALBANY
16,930 DWELLINGS
3,434 LOCAL BUSINESSES
19,003 RESIDENTS ARE EMPLOYED

98

This Plan is closely aligned to the City of Albany’s Community Strategic Plan and vision ‘to be Western Australia’s most sought after and unique regional City to work, live and visit.’
It directly addresses a number of key themes from the Albany 2030 Community Strategic Plan:
Theme 4: Community Health & Participation:
4.1 To build resilient and cohesive communities with a strong sense of community spirit.
4.3 To develop and support a healthy inclusive and accessible community.
There is a strong desire to ensure a sense of belonging and a positive connection between our rural and urban communities. It is important that we know and respect our neighbours, live in communities which support us, and have safe, accessible places to gather and meet. People want to feel welcome, valued and connected.
Theme 5: A Connected and Safe Built Environment:
5.2 To advocate, plan for and build friendly and connected communities.
5.3 To develop and support a health inclusive and accessible community.
The community will know we are succeeding when our community feel safe in their homes and in public spaces and places.
The plan is also interlinked with a number of other Plans and Strategies that have an impact on improving the community’s sense of belonging and safety.
The City of Albany is governed by a number of local, state and federal legislation and strategies in which it must operate and at times enforce. This plan has been developed in consideration of:
• Aboriginal Heritage Act 1972
• Activities on Thoroughfares & Public Places & Trading Local Law 2011
• Building Act 2011
• Building Regulations 2012
• Bushfire Act 1954
• Cat Act 2011
• Cat Regulations 2012
• City of Albany Dog Local Law 2017
• City of Albany Animals Local Law 2001
• Conservation and Land Management Act 1984
• Control of Vehicles (Off-Road Areas) Act 1978
• Country Areas Water Supply Act 1947 & Regulations 1981
• Disability Services Act 1993
• Dog Act 1976
• Dog Regulation 2013
• Emergency Management Act 2005
• Emergency Management Regulations 2006
• Freedom of Information Act 1992
• Heritage Act of Western Australia 2018
• Land Administration Act 1997
• Litter Act 1979
• Local Government (Miscellaneous Provisions Act) 1960
• Local Government Act 1995 & Regulations
• Local Government Property Local Law 2011
• Main Roads Act 1930
• Occupational Health & Safety Act 1984
• Parking & Parking Facilities Local Law 2009
• Public Health Act 2016
• Road Traffic Act 1974 & Regulations
• Road Traffic Code 2000
• Security and Related Activities (Control) Act 1996
• SEMC Plan, Policy & Procedure
• State Emergency Management Plans
• Surveillance Devices Act 1998
• Western Australia CCTV Guidelines
• Western Australian State CCTV Strategy
S T R A T E G I C C O N T E X T L E G I S L A T I V E C O N T E X T
10 11
C O M M U N I T YS T R A T E G I CP L A N
C O R P O R A T EB U S I N E S SP L A N
P O L I C I E S
S T R A T E G I E S
C O M M U N I T YD E V E L O P M E N TS T R A T E G Y
C O M M U N I C A T I O N SA N D E N G A G E M E N TS T R A T E G Y
P U B L I CH E A L T HP L A N
S A F E RA L B A N YP L A N
A G E F R I E N D LYA L B A N Y P L A N
Y O U T HF R I E N D LYA L B A N YS T R A T E G Y
A C C E S S &I N C L U S I O NP L A N

This Plan shares objectives with other plans and strategies. This is due to the importance of an individual’s perception of safety in achieving a positive state of well-being.
“Safe communities are also strong, cohesive, vibrant and participatory communities” (Safe Communities Foundation NZ).
Additional City Plans, Strategies and Policies include:
• Age Friendly Albany Plan
• Albany Local Planning Strategy
• Albany Spatial Data Specifications
• Albany Trails Hub Strategy
• Art in the Domain Guideline
• Art in the Domain Policy
• Beach Closure Policy & Procedure
• Bush Fire Strategic Plan 2014-2019
• Carbon Footprint Reduction Strategy
• Centennial Park Sporting Precinct
• Cycle City Albany
• Community Development Strategy
• Environmental Weed Strategy
• Fire Management Notice
• Graffiti Management Policy
• Heritage Protection Policy
• Local Emergency Management Arrangements
• Long Term Financial Plan
• Master Plan
• Mounts Master Plan
• Natural Reserves Strategy
• Prescribed Burning Management Manual
• Property Management (Leases & Licenses) Policy
• Public Health Plan
• Regulatory Compliance Policy & Guideline
• Road Maintenance, Renewal & Upgrade Community Guidelines
• Strategic Asset Management Plan
• Subdivision Development Guidelines
• Urban Tree Strategy
• Youth Friendly Albany Strategy
The City of Albany plays a pivotal role in community safety in Albany. City planning and approvals, management and maintenance of public spaces, enforcement of local laws and the provision of a wide range of services to businesses, residents, rate payers and visitors, all contribute to public safety.
In addition to planning and service provision, the City plays a critical role in identifying, preparing and responding to community safety issues. While primary responsibility for law enforcement and crime prevention rests with state government agencies such as WA Police, there is also growing recognition that local government is well-placed to facilitate community safety and crime prevention initiatives.
The City liaises with community, state and federal government agencies to facilitate actions that reduce risks and increase community safety.
R E L A T E D C I T Y P L A N S ,S T R A T E G I E S A N D P O L I C I E S
R O L E O F L O C A L G O V E R N M E N TI N C O M M U N I T Y S A F E T Y
12 13

The City is committed in to ensuring a safe community for all. In 2018/19 initiatives included:
The City of Albany is committed to align, facilitate and work with community safety programs, in particular working with the:
• Western Australian Police Force (WAPOL);
• Department of Fire and Emergency Services;
• Kidsafe;
• Royal Life Saving Society;
• Albany Surf Life Saving Club;
• WA Country Health Service;
• St John Ambulance;
• Department of Biodiversity, Conservation and Attractions;
• Albany Police & Community Youth Centre; and
• All community groups and individuals who assist to make our community safer.
The City is also an active member of the following committees and collaborative working groups:
• Albany Family & Domestic Violence Action Group;
• Lower Great Southern Alcohol and other Drug Management Group;
• Local Drug Action Team;
• Great Southern Suicide Prevention Action Group;
• Great Southern Human Services Forum;
• Local Emergency Management Committee;
• Roadwise Albany; and
• Relevant health and injury prevention forums and networks.
C O M M U N I T Y S A F E T Y I N A L B A N Y
2,500S T R E N G T H B U I L D I N G C L A S S E S F O R S E N I O R S
Rangers team responded to 1931 service requests, including:
8,030L I F E G U A R D H O U R S P R O V I D E D A T A L A C
217 3P U B L I C B U I L D I N G S M A I N T A I N E D
C O M M U N I T Y E M E R G E N C Y E D U C A T I O N W O R K S H O P S D E L I V E R E D
14 15
6,138C U S T O M E R S E R V I C E R E Q U E S T S R E S P O N D E D T O A C R O S S A L L D E P A R T M E N T S
106A N I M A L A T T A C K S
889K I L O M E T R E S O F U N S E A L E D R O A D S G R A D E D
162B A R K I N G O R N U I S A N C E D O G S
778K I L O M E T R E S O F S E A L E D R O A D S M A I N T A I N E D
234D O G S I M P O U N D E D ( 1 9 5 R E U N I T E D W I T H T H E I R O W N E R S , 2 8 R E H O M E D , 1 1 D E S T R O Y E D A T O W N E R O R C O U R T D I R E C T I O N O R C O N S I D E R E D T O O A G G R E S S I V E T O R E H O M E )
666R E P O R T S O F D O G S W A N D E R I N G
158H E A L T H C O M P L A I N T S I N V E S T I G A T E D
3,200P E O P L E E N R O L L E D I N S W I M M I N G C L A S S E S
122F I R E S R E S P O N D E D T O B Y V O L U N T E E R B U S H F I R E B R I G A D E S
8S H A R K S I G H T I N G S
147E V E N T A P P L I C A T I O N S A P P R O V E D
391H E A L T H I N S P E C T I O N S C O N D U C T E D
162R E P O R T S O F S T R AY I N G S T O C K

Crime Statistics
The following charts show the number of offences reported to Police from July 2012 to June 2019.
Please note the following:
• These figures are based on reported incidents to the WA Police. Not all crimes are reported to police. Some crimes are more likely to be reported to police than others (for example burglary compared to graffiti);
• The numbers of offences are simply the number of offences occurring (recorded by police) within a specific area and for a specified period of time. These are presented as simple counts. The problem with using crime numbers to gauge the true level of crime is that areas with larger populations will presumably have higher numbers of crime than areas with smaller populations.
• Anti-social behaviour doesn’t necessarily result in a person being charged;
• Police operations can increase the detection of crimes. For example drug offences;
• Offences are categorised as to when they were reported, not when they took place. Therefore some of the offences reported could be historical (e.g. sex offences); and
• Rates displayed in this publication are always presented per 1000 persons unless otherwise indicated. Calculation of rates allows direct comparisons of crime to be made across time since the size of the population is taken into account in the calculation.
NUMBER OF REPORTED ASSAULTS 2014-2018 (TOTAL WITHIN ALBANY VS ALBANY CBD AREA)
160
140
120
100
80
60
40
20
02012 2013 2014 2015 2016 2017 2018
Linear (Assaults)Assaults Linear (CBD)CBD
Jul-
12 –
Oct
-12
–
Jan-
13 –
Ap
r-13
–
Jul-
13 –
Oct
-13
–
Jan-
14 –
Ap
r-14
–
Jul-
14 –
Oct
-14
–
Jan-
15 –
Ap
r-15
–
Jul-
15 –
Oct
-15
–
Jan-
16 –
Ap
r-16
–
Jul-
16 –
Oct
-16
–
Jan-
17 –
Ap
r-17
–
Jul-
17 –
Oct
-17
–
Jan-
18 –
Ap
r-18
–
Jul-
18 –
Oct
-18
–
Jan-
19 –
Ap
r-19
– –
0.80
0.70
0.60
0.50
0.40
0.30
0.20
0.10
0.00
REPORTED ASSAULTS (ALBANY JULY 2012 - JUNE 2019)
Assault Rate Linear (Assault Rate)
Note: This data does not include reports of family and domestic violence incidents. Based on reported offences to Police, the number of non-domestic violence assault has been steadily decreasing.
REPORTED THEFT AND BURGLARY INCIDENTS (ALBANY JULY 2012 TO JUNE 2019)
Jul-
12 –
Oct
-12
–
Jan-
13 –
Ap
r-13
–
Jul-
13 –
Oct
-13
–
Jan-
14 –
Ap
r-14
–
Jul-
14 –
Oct
-14
–
Jan-
15 –
Ap
r-15
–
Jul-
15 –
Oct
-15
–
Jan-
16 –
Ap
r-16
–
Jul-
16 –
Oct
-16
–
Jan-
17 –
Ap
r-17
–
Jul-
17 –
Oct
-17
–
Jan-
18 –
Ap
r-18
–
Jul-
18 –
Oct
-18
–
Jan-
19 –
Ap
r-19
– –
4.00
3.50
3.00
2.50
2.00
1.50
1.00
0.50
0.00
Linear (Theft rate per 1000)Theft rate per 1000 Linear (Burglary rate per 1000)Burglary rate per 1000
Note: Theft refers to shop lifting, bag theft and theft from businesses. Burglary refers to property stolen from homes and vehicles. Theft and burglary are the most common high volume crime.
REPORTED MOTOR VEHICLE THEFT AND DRUG OFFENCES (ALBANY JULY 2012 TO JUNE 2019)
Jul-
12 –
Oct
-12
–
Jan-
13 –
Ap
r-13
–
Jul-
13 –
Oct
-13
–
Jan-
14 –
Ap
r-14
–
Jul-
14 –
Oct
-14
–
Jan-
15 –
Ap
r-15
–
Jul-
15 –
Oct
-15
–
Jan-
16 –
Ap
r-16
–
Jul-
16 –
Oct
-16
–
Jan-
17 –
Ap
r-17
–
Jul-
17 –
Oct
-17
–
Jan-
18 –
Ap
r-18
–
Jul-
18 –
Oct
-18
–
Jan-
19 –
Ap
r-19
– –
2.50
2.00
1.50
1.00
0.50
0.00
Linear (Drug o�ences rate per 1000)Drug o�ences rate per 1000 MV Theft Rate per 1000 pp
Note: Police offence data obtained from WA Local Government through an arrangement with WA Police. Drug offences are usually a result of investigative actions of officers. An increase is a positive outcome as it demonstrates the ongoing work of Police to reduce the impact of drugs on our community.
REPORTED ASSAULT ‘FAMILY’ GREAT SOUTHERN WA POLICE DISTRICT (2011-2018)
Jul-
12 –
Oct
-12
–
Jan-
13 –
Ap
r-13
–
Jul-
13 –
Oct
-13
–
Jan-
14 –
Ap
r-14
–
Jul-
14 –
Oct
-14
–
Jan-
15 –
Ap
r-15
–
Jul-
15 –
Oct
-15
–
Jan-
16 –
Ap
r-16
–
Jul-
16 –
Oct
-16
–
Jan-
17 –
Ap
r-17
–
Jul-
17 –
Oct
-17
–
Jan-
18 –
Ap
r-18
–
Jul-
18 –
Oct
-18
–
Jan-
19 –
Ap
r-19
– –
90
80
70
60
50
40
30
20
10
-
Linear (Assault (Family) Total)Assault (Family) Total Serious Assault (Family)Common Assault (Family)
Please note these are for the WA Police Region. Specific data on Albany is not available from WA Police website.
16 17
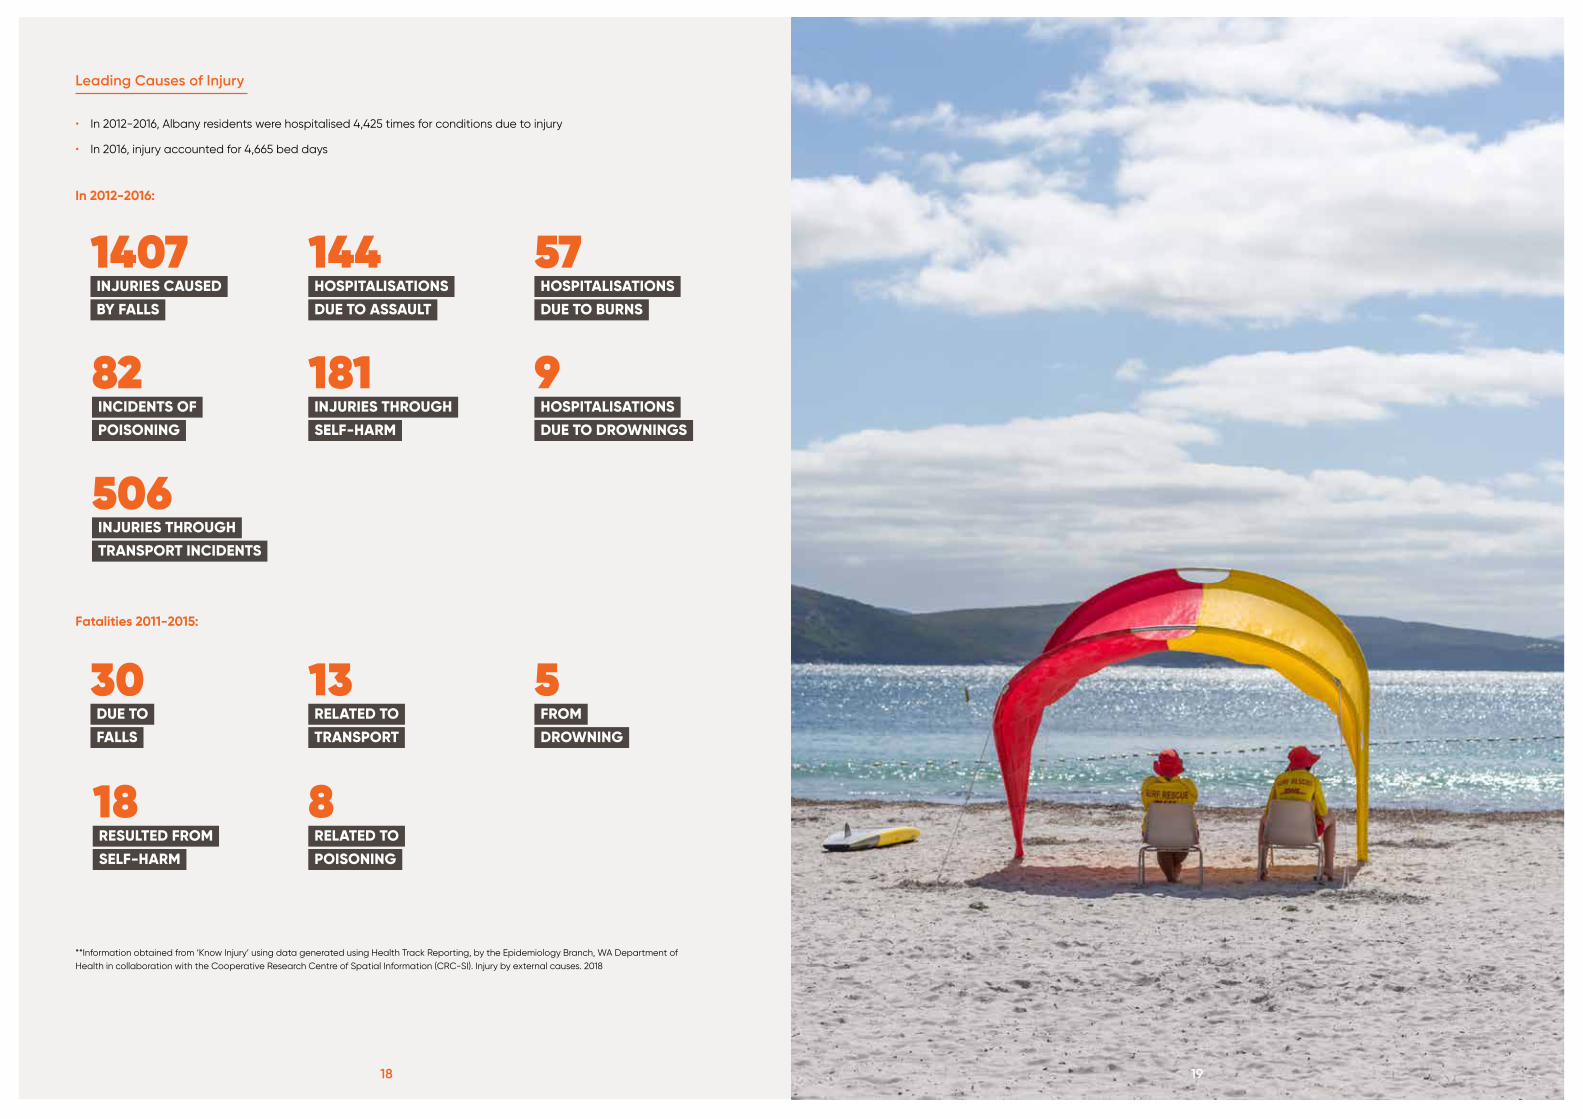
Leading Causes of Injury
• In 2012-2016, Albany residents were hospitalised 4,425 times for conditions due to injury
• In 2016, injury accounted for 4,665 bed days
In 2012-2016:
Fatalities 2011-2015:
**Information obtained from ‘Know Injury’ using data generated using Health Track Reporting, by the Epidemiology Branch, WA Department of Health in collaboration with the Cooperative Research Centre of Spatial Information (CRC-SI). Injury by external causes. 2018
18 19
506INJURIES THROUGH
TRANSPORT INCIDENTS
1407 INJURIES CAUSED
BY FALLS
144HOSPITALISATIONS
DUE TO ASSAULT
57HOSPITALISATIONS
DUE TO BURNS
181INJURIES THROUGH
SELF-HARM
82INCIDENTS OF
POISONING
9HOSPITALISATIONS
DUE TO DROWNINGS
30DUE TO
FALLS
18RESULTED FROM
SELF-HARM
13RELATED TO
TRANSPORT
8RELATED TO
POISONING
5FROM
DROWNING

C O M M U N I T Y P E R C E P T I O N S O F S A F E T Y
An individual’s perception of ‘safety’ is shaped by a number of factors (Shepherdson, 2014). These factors may include:
• Gender;
• Age;
• Ethnicity;
• Socio-economic status; and
• Past experiences of crime.
Additional influences include information from family, friends, work colleagues and the media. The impact of social media is still emerging so it is unclear as to how much it is influencing perceptions and fear of crime (Clare, 2018). There is also additional research to show that an individual’s work, community or home environment also influences their perception of safety.
“Visible graffiti, litter, unmaintained community infrastructure impacts on how ‘safe’ one feels in their home and in the wider community.” (Shepherdson, 2014).
The actual rate of crime can have very little impact on a person’s perception of safety. Respondents to the Australian Survey of Social Attitudes (AuSSA) reported they felt crime had increased, despite national crime trends showing the level of crime had actually dropped over the period in question (Roberts & Indemaur, 2009 in Davis 2010). Similar results are reflected in responses to City of Albany community safety perception surveys conducted in 2014, and again in 2018.
Insights:
• Despite Police statistics indicating a fall in majority of offences, there is still a perception that crime is becoming more of a problem in our community. This could be due to the impact of crime reports in the media and the impact of social media.
• The majority of respondents gauge how safe their community is based on reports in the media and posts on social media;
• There is a perception that crime in Albany is increasing, in comparison to WA Police Statistics which shows the number of offences has decreased over the past six years;
• Respondents felt safer in well-lit locations where there were lots of people, with majority citing that the presence of CCTV did also increase their sense of personal safety.
It is recognised that there are varying views on perceptions of safety and crime within the community and that all levels of government, community groups, businesses and individuals have a role in creating safer public places. Local government in particular is in a unique position to build relationships and create collaboration around reducing fear and perceptions about crime in the community. Fear of crime has become an important issue of public concern; a problem which detracts from the quality of life, and which adversely affects social and economic well-being.
Based on the evidence and feedback from community, the City has identified four key areas for the Safer Albany Plan:
PERCEPTION OF CRIME RATES IN ALBANY (2014 vs 2018)
50
40
30
20
10
0Very Low Low Moderate High Very High
2018
3.09
14.2
43.21
30.25
9.26
2.72
17.93
43.48
28.8
7.07
2014
HOW SAFE IS ALBANY? (2014 vs 2018)
60
50
40
30
20
10
0Very Safe Safe Somewhat safe Unsafe Very Unsafe
2018
7.05
30.13
55.13
6.411.28
5.71
37.71
47.43
8.57
0.57
2014
SINCE YOU HAVE LIVED IN ALBANY CRIME IS? (2014 vs 2018)
More of a problem
About the same
Less of a problem
0 10 20 30 40 50 60 70 80
20182014
69.09
67.95
27.88
29.49
3.03
2.56
20 21
SAFER SPACES & PL ACES
COMMUNITY EDUCATION & AWARENESS
COMMUNITY PARTNERSHIPS & COLL ABORATION
BUILDING ORGANISATIONAL CAPACITY
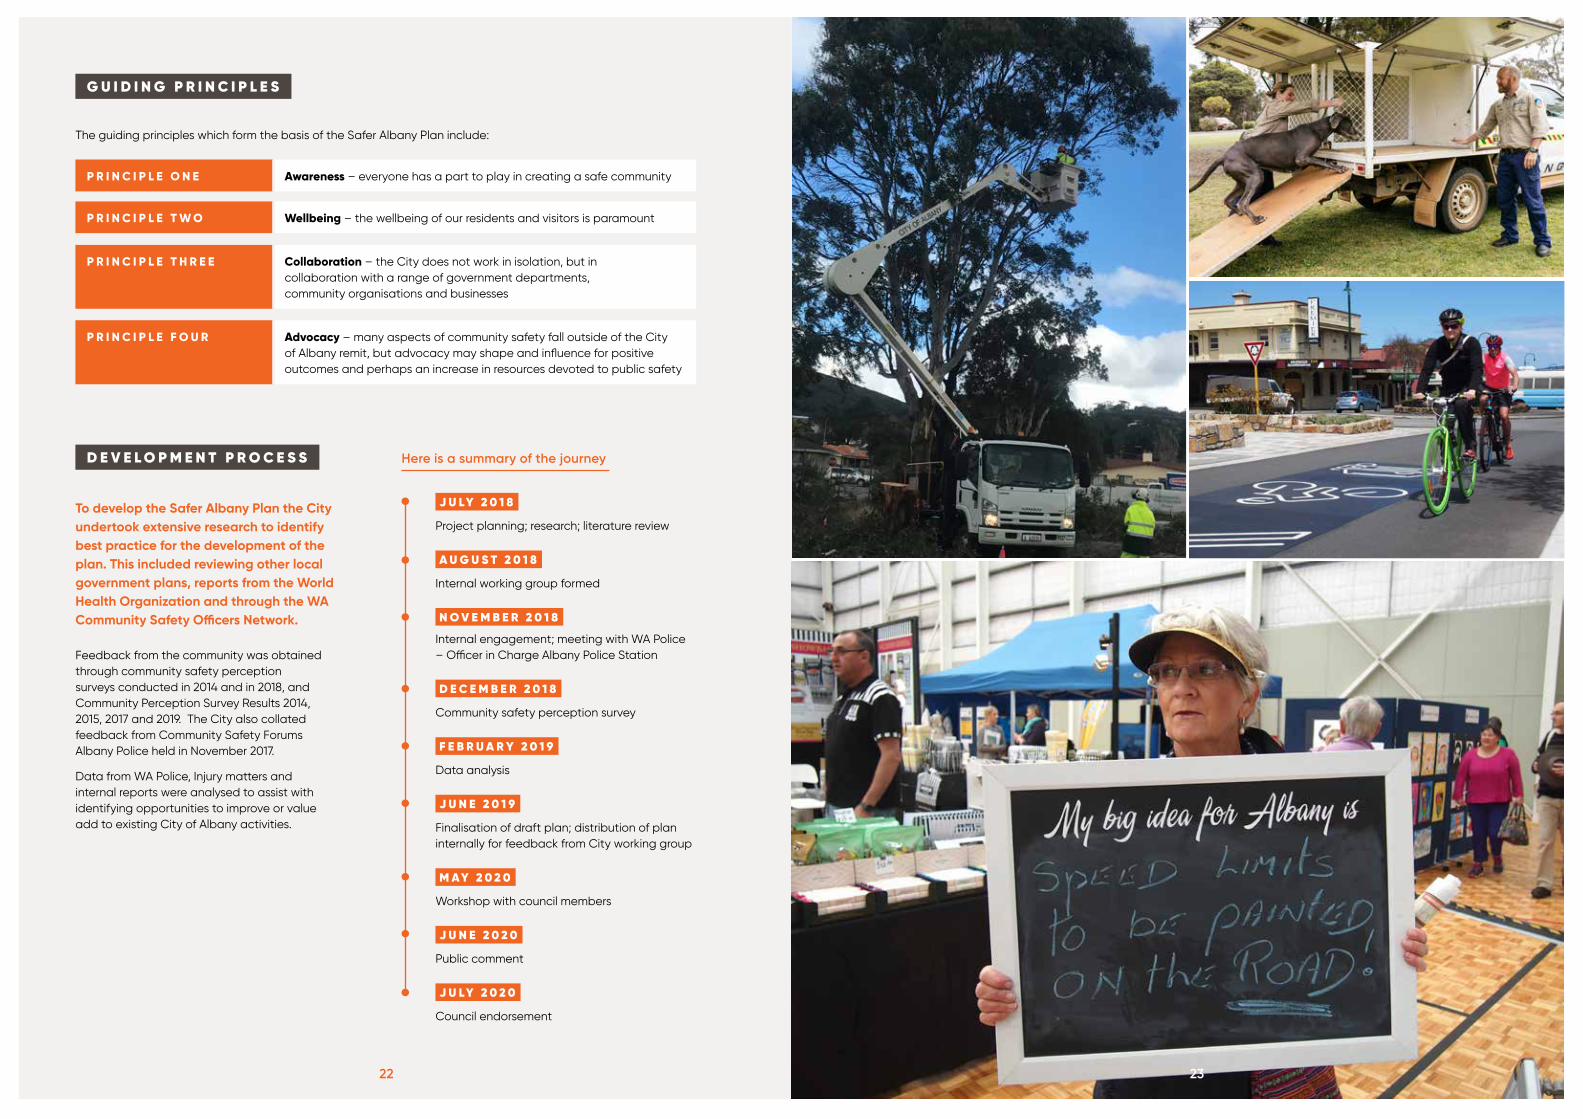
D E V E L O P M E N T P R O C E S S
To develop the Safer Albany Plan the City undertook extensive research to identify best practice for the development of the plan. This included reviewing other local government plans, reports from the World Health Organization and through the WA Community Safety Officers Network.
Feedback from the community was obtained through community safety perception surveys conducted in 2014 and in 2018, and Community Perception Survey Results 2014, 2015, 2017 and 2019. The City also collated feedback from Community Safety Forums Albany Police held in November 2017.
Data from WA Police, Injury matters and internal reports were analysed to assist with identifying opportunities to improve or value add to existing City of Albany activities.
Here is a summary of the journey
J U LY 2 0 1 8
Project planning; research; literature review
A U G U S T 2 0 1 8
Internal working group formed
N O V E M B E R 2 0 1 8
Internal engagement; meeting with WA Police – Officer in Charge Albany Police Station
D E C E M B E R 2 0 1 8
Community safety perception survey
F E B R U A R Y 2 0 1 9
Data analysis
J U N E 2 0 1 9
Finalisation of draft plan; distribution of plan internally for feedback from City working group
M AY 2 0 2 0
Workshop with council members
J U N E 2 0 2 0
Public comment
J U LY 2 0 2 0
Council endorsement
G U I D I N G P R I N C I P L E S
The guiding principles which form the basis of the Safer Albany Plan include:
P R I N C I P L E O N E Awareness – everyone has a part to play in creating a safe community
P R I N C I P L E T W O Wellbeing – the wellbeing of our residents and visitors is paramount
P R I N C I P L E T H R E E Collaboration – the City does not work in isolation, but in collaboration with a range of government departments, community organisations and businesses
P R I N C I P L E F O U R Advocacy – many aspects of community safety fall outside of the City of Albany remit, but advocacy may shape and influence for positive outcomes and perhaps an increase in resources devoted to public safety
22 23

S A F E R A L B A N Y P L A N
What is the City of Albany’s role?
The City of Albany’s role in delivering the plan will vary depending on the objective. Where the focus of the objective is within the role of local government, the City will lead/manage the project. Where the objective falls outside of the City’s remit, the City role will be to advocate on behalf of community along with other government agencies and community.
C I T Y O F A L B A N Y R O L E C I T Y O F A L B A N Y W I L L …
L - L E A D / M A N A G E Lead/manage the action or project as the responsible agency.
P - P A R T N E R Contribute funds and/or resources towards an initiative or service that is delivered with other parties.
A - A D V O C A T E Advocate to State and Federal Government agencies on behalf of the community.
S - S U P P O R T E R / R E S O U R C E Support through provision of available resources.
F - F A C I L I T A T O R Facilitate action through contracting of services.
Safer Albany Plan
As most of these actions are ongoing, or subject to the availability of external funding this plan will be supported by an annual delivery schedule, supported by an internal working group to ensure the plan is delivered.
24 25

GOAL: Residents and visitors feel safe in their homes and when accessing our parks, playgrounds, beaches, transport routes, shopping and entertainment precincts.
C I T Y R O L E
Our Priorities We know we are succeeding when L P A S F
1.1 Safer City centre for visitors and residents.
Residents and visitors feel safe accessing our City centre during the day and evening.
x x
1.2 Use technology to create a safer community.
A range of technologies are utilised to increase community safety.
x
1.3 Create a safer environment by utilising crime prevention through environmental design principals.
New projects and redevelopments of public open space are designed to maximise public safety.
x
1.4 Maintain safe public spaces.
Public spaces are well maintained and well utilised.
x x
1.5 Create a ‘tag free’ Albany. There is a visible reduction in ‘tags’ across the City of Albany.
x x x
1.6 Create a more inclusive accessible community for vulnerable groups.
Biennial survey responses show an increase in community members feeling welcomed, valued and included.
x
1.7 Ensure safe community events.
There is a diverse range of events delivered safely each year that comply with the City’s Event Guidelines.
x
1.8 Safer roads. Reduction in the number of road users, pedestrians and cyclists injured.
x x x x
1.9 Reduce risk through bushfire risk management.
Increased community resilience and awareness on how to respond and react to bushfire emergencies.
x x x
26 27
P R I O R I T Y 1S A F E R S P A C E S & P L A C E S

GOAL: Community members have access to information to ensure they can be safe in their homes and can contribute to creating a safer community.
C I T Y R O L E
Our Priorities We know we are succeeding when L P A S F
2.1 Develop and promote safety campaigns to promote local services, and raise awareness of safety initiatives to protect vulnerable groups and those experiencing family and domestic violence.
There is an increased in awareness of local services, and reduction in fall related injuries.
x x x x x
2.2 Crime prevention education activities.
There is an increase in residents perception of safety and there is a decrease in the number of burglaries of unsecured houses/vehicles.
x x x x
2.3 Develop a sense of community and ‘connectedness’ through programs, activities and initiatives.
There is an increased sense of community reflected in the biennial community survey results.
x x x x
2.4 Increase residents and visitors perception of safety.
Perception surveys show an increase in the number of responders feeling ‘safer’ in our community.
x
2.5 Increase residents preparedness for emergencies.
Residents feel more prepared to cope with emergencies.
x x x
2.6 Increased compliance through education.
There is a reduction in the number compliance team interventions.
x
28 29
P R I O R I T Y 2C O M M U N I T Y E D U C A T I O N & A W A R E N E S S

GOAL: Increase safety through working in collaboration with key agencies and community groups
C I T Y R O L E
Our Priorities We know we are succeeding when L P A S F
3.1 Strengthen and maintain relationship with WA Police.
There is a strong sense of collaboration between City and WA Police.
x
3.2 Collaborate with government and community to deliver community safety outcomes.
There is an increase in the number of collaborative initiatives within our community.
x x
3.3 Track and share data in relation to community safety.
Data collected enables the City and partners to successfully apply for grant funding to deliver community safety initiatives.
x
GOAL: City of Albany is proactively prepared to support response to emergencies and other safety issues of concern
C I T Y R O L E
Our Priorities We know we are succeeding when L P A S F
4.1 Development of staff to respond to emergencies and recovery.
Staff report feeling sufficiently trained to respond to incidents, emergencies and recovery.
x x
4.2 Increase organisation’s preparedness to respond to community emergencies.
There is a cohesive, organised response to community emergencies.
x x
4.3 Maintain up to date knowledge on state, national and international community safety initiatives.
There is a best practice approach to all the City activities in the safety space.
x
4.4 Actively seek funding to address community safety issues.
Sufficient funding is obtained by the City of Albany to fully deliver all strategies under the plan.
x
4.5 Ensure the effective capture of data for reporting and funding purposes.
We have sufficient data to accurately measure the impact of initiatives delivered under the plan.
x x x
30 31
P R I O R I T Y 3COMMUNITY PARTNERSHIPS & COLL ABORATION
P R I O R I T Y 4BUILDING ORGANISATIONAL CAPACITY

I M P L E M E N T A T I O N , E V A L U A T I O N A N D M O N I T O R I N G
Implementation
It is proposed that this plan be implemented over a four year period commencing 2019/20 and concluding in 2022/23.
The successful completion of all actions in some cases will be dependent on attracting additional funding.
Measuring Performance
The ultimate success of a plan depends greatly on how the change is introduced and implemented rather than the merit of the plan itself.
The performance indicators for each action will be collected annually to enable the monitoring of ongoing progress and performance.
Evaluating Effectiveness
The performance indicators detailed in each key direction will form a basis for a comprehensive review of this Plan and to be conducted in during 2023/2024.
The review will incorporate but not be limited to:
• Community Safety Survey (biennial);
• Community Perception Survey;
• Community feedback;
• Relevant crime statistics and surveys; and
R E V I E W P O S I T I O N A N D D A T E
This plan was adopted on 28 July 2020. This plan is to be reviewed by the document owner on or before 30th June 2023.
32 33

3534

R E F E R E N C E S
.id Consulting Pty Ltd. (2019, June). City of Albany Community Profile. Retrieved from
.idcommunity Demographic Resources: https://profile.id.com.au/albany
.id Consulting Pty Ltd. (2019, June). City of Albany Economic Profile. Retrieved from
.idcommunity Demographic Resources: https://economy.id.com.au/albany
Australian Drug Foundation. (2014). Preventing alcohol and drug problems in your community. Melbourne: Australian Drug Foundation.
Australian Insitute of Criminology. (2011). Effective crime prevention interventions for implementation by local government. Canberra: NSW Government Attorney and General Justice.
Australian Institute of Criminology. (2012). National Crime Prevention Framework. Canberra: Australian Insitute of Criminology.
Australian Institute of Criminology. (2015). Understanding the local government role in crime prevention. Trends and issues in crime and criminal justice, 11-12.
Australian Safe Communities Foundation. (2012). Pacific/Australian Safe Community Designation: Indicators and Process Guide Book. Golden Grove: Australian Safe Communities Foundation.
Davis B, D. K. (2010). (Mis)perceptions of crime in Australia. Trends and Issues in crime and criminal justice No. 396. Canberra, ACT, Australia.
Government of Western Australia Drug and Alcohol Office. (2009). Developing an effective community safety and crime prevention plan: Alcohol and drug isssues. Perth: Government of Western Australia.
Nous Group and Municipal Association of Victoria. (2017). Evaluation of the role of local government in preventing violence against women. Melbourne: Municipal Association of Victoria.
Our Watch. (2014). Reporting on Domestic Violence. Melbourne: Our Watch.
Our Watch, Australia’s National Research Organisation for Women’s Safety (ANROWS) and VicHealth. (2015). Change the story: A shared framework for the primary prevention of violence against women and their children in Australia. Melbourne: Our Watch.
Shepherdson, P. (2014). Perceptions of Safety and Fear of Crime Research Report. Sydney: Auburn City Council.
VicHealth. (2012). Local government preventing violence against women: Networking and capacity building project. Evaluation report. Carlton: Victorian Health Promotion Foundation.
WA Police. (2019). Crime in Western Australia. Perth, Western Australia, Australia.
D E F I N I T I O N S
Assault – The use of force against another person, or the threat of the use of force where the threat has a real or perceived ability to be enacted at the time.
Burglary – The unlawful entry of building with the intent to commit an offence.
Drug offences – The possessing, selling, dealing or trafficking, importing or exporting, manufacturing or cultivating of drugs or other substances prohibited under legislation.
Graffiti – Unlawful property damaged caused by paint, marker, etching, scratching or other form of property damage.
Rate per 1000 residents – Calculated by taking the number of offences divided by the estimated resident population for that year (based on ABS estimates), multiplied by 1000.
Theft - Theft refers to shop lifting, bag theft and theft from businesses.
Vulnerable community members – Refers to members of our community who are at a higher risk of becoming a victim of crime or injury, including: elderly, homeless, young people, LGBTQI, indigenous, people with a disability and those people from culturally and linguistically diverse communities.
36 37

CITY OF ALBANY
102 NORTH ROAD YAKAMIA | PO BOX 484, ALBANY, WA 6331 | TEL: (08) 6820 3000 | FAX: (08) 9841 4099 | WWW.ALBANY.WA.GOV.AU