safer vehicle inspection: a multimodal robotic sensing platform
TRANSCRIPT

SAFER Vehicle Inspection: A Multimodal Robotic SensingPlatform
David L. Page,a Yohan Fougerolle,a,b Andreas F. Koschan,a Andrei Gribok,a Mongi A. Abidi,a
David J. Gorsich,c and Grant R. Gerhartc
aImaging, Robotics, and Intelligent Systems Laboratory, The University of Tennessee,Knoxville, TN, USA 37996-2100;
bLE2i-CNRS Universite de Bourgogne, 12 rue de la fonderie, 71200 Le Creusot, France;cU. S. Army RDECOM Tank-Automotive Research, Development and Engineering Center,
Warren, MI, USA 48397-5000
ABSTRACT
The current threats to U.S. security both military and civilian have led to an increased interest in the developmentof technologies to safeguard national facilities such as military bases, federal buildings, nuclear power plants, andnational laboratories. As a result, the Imaging, Robotics, and Intelligent Systems (IRIS) Laboratory at TheUniversity of Tennessee (UT) has established a research consortium, known as SAFER (Security Automationand Future Electromotive Robotics), to develop, test, and deploy sensing and imaging systems for unmannedground vehicles (UGV). The targeted missions for these UGV systems include—but are not limited to—undervehicle threat assessment, stand-off check-point inspections, scout surveillance, intruder detection, obstacle-breach situations, and render-safe scenarios. This paper presents a general overview of the SAFER project.Beyond this general overview, we further focus on a specific problem where we collect 3D range scans of undervehicle carriages. These scans require appropriate segmentation and representation algorithms to facilitate thevehicle inspection process. We discuss the theory for these algorithms and present results from applying themto actual vehicle scans.
Keywords: unmanned ground vehicles, vehicle inspection, computer vision, 3D segmentation, 3D representation
1. INTRODUCTION
Unmanned ground vehicles (UGV) are becoming a key element of security and surveillance in the post-9/11environment. Currently, a wide variety of mobile platforms are available to meet the UGV mobility needs ofboth military and civilian community. These platforms include Andros,1 Odis,2 and PackBot3 among others.These systems are robust and mature technologies that end-users can deploy today, but their imaging and sensingpackages are typically a single video camera. Although video is essential for operator and driver awareness, othersensor modalities offer the potential to extend these existing platforms to become more than mobile cameras.This goal is the research objective of the Security Automation and Future Electromotive Robotics (SAFER)Program. The Imaging, Robotics, and Intelligent Systems (IRIS) Laboratory at the The University of Tennessee(UT) has established SAFER to develop, test, and deploy sensing and imaging systems that enhance the missionsof current and future UGVs. In essence, SAFER seeks to deploy “sixth-sense” technologies such as nuclear,chemical, and biological (NCB) sensors, thermal imaging cameras, laser range scanners, and other advancedsensors and to incorporate autonomous intelligence into these sensors through the development of fusion andprocessing algorithms.
Further author information: (Send correspondence to D.L.P.)D.L.P.: E-mail: [email protected], Telephone: 1 865 974 8520, Fax: 1 865 974 5459
Unmanned Ground Vehicle Technology VI, edited by Grant R. Gerhart, Chuck M. Shoemaker, Douglas W. Gage,Proceedings of SPIE Vol. 5422 (SPIE, Bellingham, WA, 2004) · 0277-786X/04/$15 · doi: 10.1117/12.542808
549

������� �������� ��� ���
Figure 1. The fundamental elements of a robotics platform. The SAFER program focuses on the processing componentthrough fusion of multiple sensors.
Figure 2. The mobile robot serves as a configurable platform that allows different sensor bricks to be added or removed.Each “SFC” brick is self contained with a sensor, fusion, and communications module.
1.1. SAFER Overview
As shown in Figure 1, the three fundamental elements of a robotics platform are: sensing, processing, andmobility. The main focus of the SAFER program is the development of processing algorithms. Currently, avariety of sensors are available and a variety of mobile platforms are available. The link that requires additionalresearch is the processing to bring these elements together. Specific technologies that SAFER has targeted includeprocessing and fusion of 3D geometry data from laser scanners, 2D video from visual and thermal cameras, and1D signals from NCB detectors.
For the development of these technologies SAFER promotes the notion of “SFC bricks” to achieve an inter-changeable sensor suite. A sensing, fusion, and communications (SFC) brick is a three-module concept. Thesensor module contains one—or integrates multiple sensors—to collect data around the robot environment. Thefusion module processes this data and incorporates reasoning and analysis. Finally, the communications moduletransmits this information to appropriate end users. The SFC brick concept allows the user to easily deploy andupgrade the system as new sensor bricks become available.
Figure 2 illustrates the SFC design strategy to achieve modularity, scalability, and reconfigurability. Thisparticular example shows a wheeled platform with multiple SFC bricks that are independent, self-contained,drop-in units. Each brick “sees,” “thinks,” and “reports” such that these three actions are modules within thebrick. The sensing, fusion, and communication modules, respectively, gather and log the data for a particularsensor and transmit this information to the appropriate data collection point. This collection point may ormay not be the user controlling the mobile platform. For example, if the sensor detects nuclear contaminationthreats, then the brick may transmit directly to a group of nuclear experts, perhaps via satellite, to a remotelocation beyond the operational environment of the platform. This self-contained model means that informationflows to the most effective data collection points without passing through a potential bottleneck or overloadingunnecessarily the robot operator. Further, this design model allows distributed dissemination of information tomore than one collection point.
1.2. Targeted UGV Mission
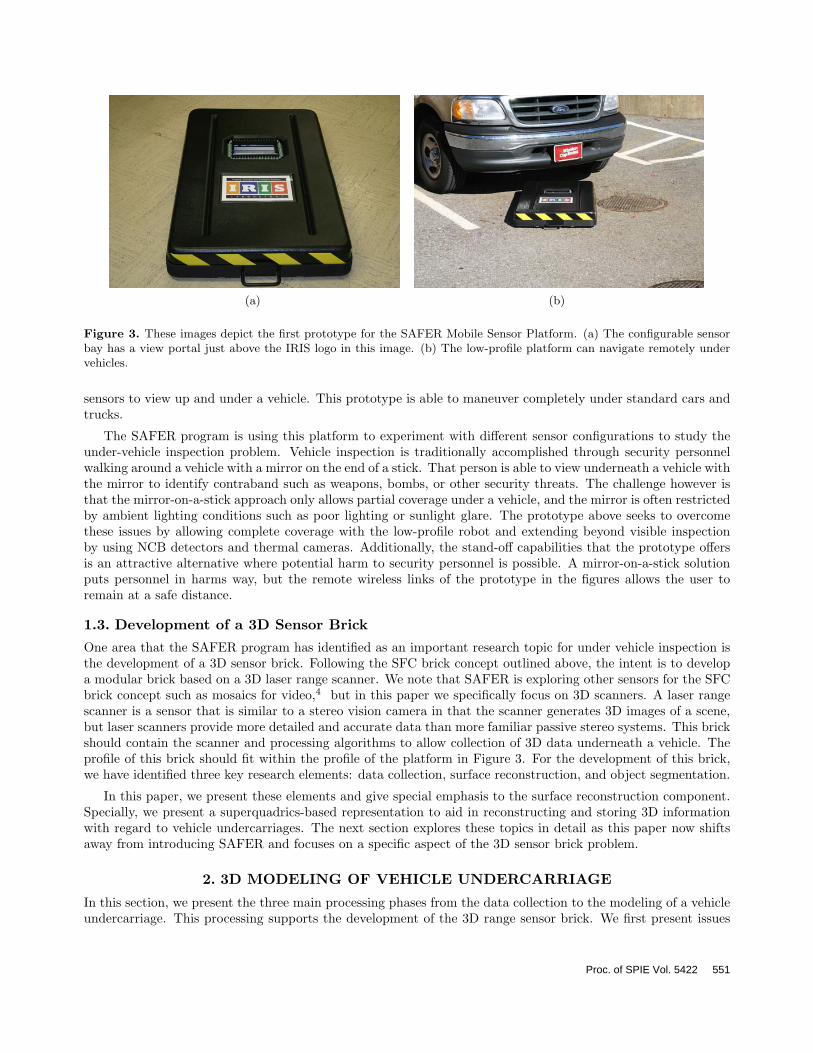
To focus research efforts, SAFER initially targets a specific UGV mission for the inspection of vehicle undercar-riages. The key design of this system is for the robot and sensors to have a low profile for navigation underneatha vehicle such as a car or truck. Figure 3 illustrates this mission. This figure shows a prototype platform thathas the flexibility to house a variety of different sensors. The platform is able to navigate under a vehicle througha remote operator interface. The opening just above the IRIS logo contains a mirror system to allow different
550 Proc. of SPIE Vol. 5422
(a) (b)
Figure 3. These images depict the first prototype for the SAFER Mobile Sensor Platform. (a) The configurable sensorbay has a view portal just above the IRIS logo in this image. (b) The low-profile platform can navigate remotely undervehicles.
sensors to view up and under a vehicle. This prototype is able to maneuver completely under standard cars andtrucks.
The SAFER program is using this platform to experiment with different sensor configurations to study theunder-vehicle inspection problem. Vehicle inspection is traditionally accomplished through security personnelwalking around a vehicle with a mirror on the end of a stick. That person is able to view underneath a vehicle withthe mirror to identify contraband such as weapons, bombs, or other security threats. The challenge however isthat the mirror-on-a-stick approach only allows partial coverage under a vehicle, and the mirror is often restrictedby ambient lighting conditions such as poor lighting or sunlight glare. The prototype above seeks to overcomethese issues by allowing complete coverage with the low-profile robot and extending beyond visible inspectionby using NCB detectors and thermal cameras. Additionally, the stand-off capabilities that the prototype offersis an attractive alternative where potential harm to security personnel is possible. A mirror-on-a-stick solutionputs personnel in harms way, but the remote wireless links of the prototype in the figures allows the user toremain at a safe distance.
1.3. Development of a 3D Sensor Brick
One area that the SAFER program has identified as an important research topic for under vehicle inspection isthe development of a 3D sensor brick. Following the SFC brick concept outlined above, the intent is to developa modular brick based on a 3D laser range scanner. We note that SAFER is exploring other sensors for the SFCbrick concept such as mosaics for video,4 but in this paper we specifically focus on 3D scanners. A laser rangescanner is a sensor that is similar to a stereo vision camera in that the scanner generates 3D images of a scene,but laser scanners provide more detailed and accurate data than more familiar passive stereo systems. This brickshould contain the scanner and processing algorithms to allow collection of 3D data underneath a vehicle. Theprofile of this brick should fit within the profile of the platform in Figure 3. For the development of this brick,we have identified three key research elements: data collection, surface reconstruction, and object segmentation.
In this paper, we present these elements and give special emphasis to the surface reconstruction component.Specially, we present a superquadrics-based representation to aid in reconstructing and storing 3D informationwith regard to vehicle undercarriages. The next section explores these topics in detail as this paper now shiftsaway from introducing SAFER and focuses on a specific aspect of the 3D sensor brick problem.
2. 3D MODELING OF VEHICLE UNDERCARRIAGE
In this section, we present the three main processing phases from the data collection to the modeling of a vehicleundercarriage. This processing supports the development of the 3D range sensor brick. We first present issues
Proc. of SPIE Vol. 5422 551
(a) (b) (c)
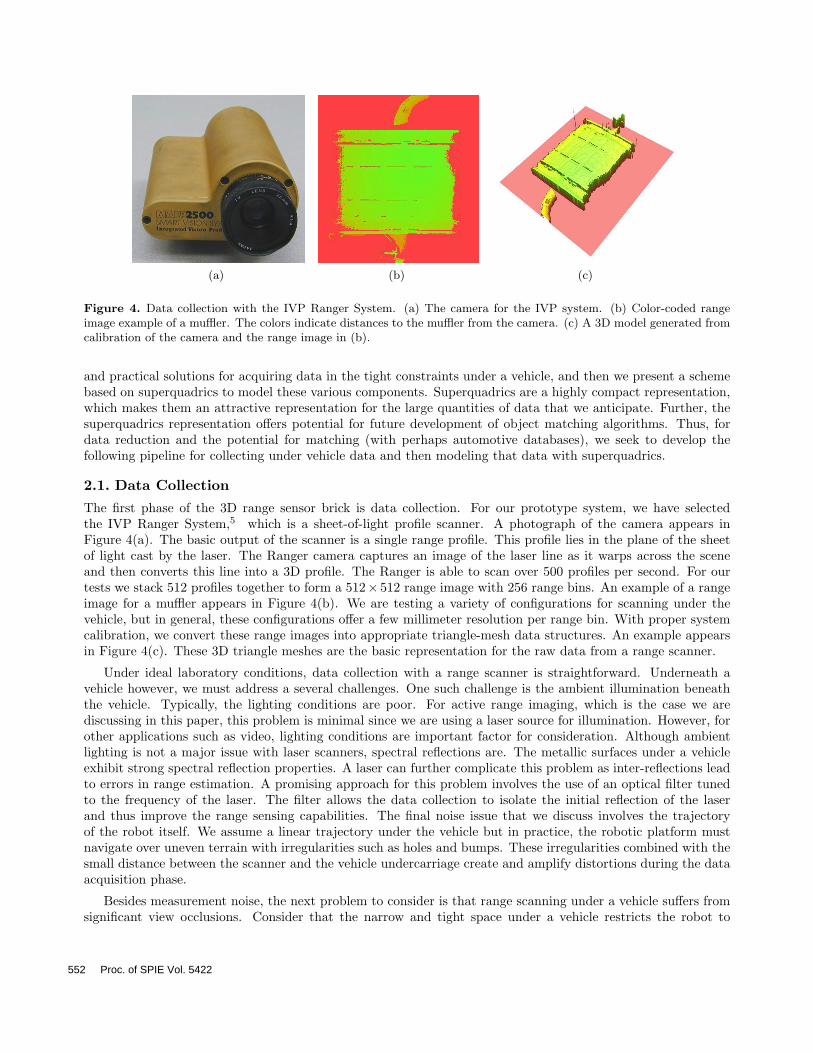
Figure 4. Data collection with the IVP Ranger System. (a) The camera for the IVP system. (b) Color-coded rangeimage example of a muffler. The colors indicate distances to the muffler from the camera. (c) A 3D model generated fromcalibration of the camera and the range image in (b).
and practical solutions for acquiring data in the tight constraints under a vehicle, and then we present a schemebased on superquadrics to model these various components. Superquadrics are a highly compact representation,which makes them an attractive representation for the large quantities of data that we anticipate. Further, thesuperquadrics representation offers potential for future development of object matching algorithms. Thus, fordata reduction and the potential for matching (with perhaps automotive databases), we seek to develop thefollowing pipeline for collecting under vehicle data and then modeling that data with superquadrics.
2.1. Data Collection
The first phase of the 3D range sensor brick is data collection. For our prototype system, we have selectedthe IVP Ranger System,5 which is a sheet-of-light profile scanner. A photograph of the camera appears inFigure 4(a). The basic output of the scanner is a single range profile. This profile lies in the plane of the sheetof light cast by the laser. The Ranger camera captures an image of the laser line as it warps across the sceneand then converts this line into a 3D profile. The Ranger is able to scan over 500 profiles per second. For ourtests we stack 512 profiles together to form a 512× 512 range image with 256 range bins. An example of a rangeimage for a muffler appears in Figure 4(b). We are testing a variety of configurations for scanning under thevehicle, but in general, these configurations offer a few millimeter resolution per range bin. With proper systemcalibration, we convert these range images into appropriate triangle-mesh data structures. An example appearsin Figure 4(c). These 3D triangle meshes are the basic representation for the raw data from a range scanner.
Under ideal laboratory conditions, data collection with a range scanner is straightforward. Underneath avehicle however, we must address a several challenges. One such challenge is the ambient illumination beneaththe vehicle. Typically, the lighting conditions are poor. For active range imaging, which is the case we arediscussing in this paper, this problem is minimal since we are using a laser source for illumination. However, forother applications such as video, lighting conditions are important factor for consideration. Although ambientlighting is not a major issue with laser scanners, spectral reflections are. The metallic surfaces under a vehicleexhibit strong spectral reflection properties. A laser can further complicate this problem as inter-reflections leadto errors in range estimation. A promising approach for this problem involves the use of an optical filter tunedto the frequency of the laser. The filter allows the data collection to isolate the initial reflection of the laserand thus improve the range sensing capabilities. The final noise issue that we discuss involves the trajectoryof the robot itself. We assume a linear trajectory under the vehicle but in practice, the robotic platform mustnavigate over uneven terrain with irregularities such as holes and bumps. These irregularities combined with thesmall distance between the scanner and the vehicle undercarriage create and amplify distortions during the dataacquisition phase.
Besides measurement noise, the next problem to consider is that range scanning under a vehicle suffers fromsignificant view occlusions. Consider that the narrow and tight space under a vehicle restricts the robot to
552 Proc. of SPIE Vol. 5422

maneuver the camera in a horizontal plane. The most obvious occlusion is that the camera can only view oneside of a component—the bottom side facing straight down towards the ground. The muffler for example inthe figure above is a one-sided view. Without dismantling the car, we can not move the range scanner to theother side of the muffler. Such an occlusion should illustrate the potential of other occlusions such as one objectpartially covering another object. The objects underneath a vehicle have various shapes and scales located atdifferent depths. For example, the presence of a transmission axle close to the scanner occludes componentsmounted closer to the vehicle body. The solution to this problem is to use multiple scans to fill as much aspossible the areas without information. This solution is only a partial one, though. The different views andscanning angles are extremely restricted by the low-profile under a vehicle. Thus an integration and fusion ofmultiple scans only partially fills the occlusion holes, but multiple scans significantly enhances the data. As aresult, we scan underneath a vehicle with multiple passes and at different angles.
The final challenge that we consider with the data collection is the data redundancy inherent to laser rangescanning. A single range image with 512 × 512 pixels yields over 250K data points. With additional scans toovercome occlusions (as noted above) and to achieve full coverage under a vehicle, this number quickly grows toseveral million data points. This large data set allows high-fidelity geometry that other 3D sensors do not offer,but the price is that of data redundancy and a potential data overload. The solution is to remove the redundancy.Superquadrics are an answer since they model complex objects and surfaces with just a few parameters. Forour 3D sensor brick research, we have chosen to explore superquadrics as a representation for under vehicle data.
2.2. Superquadric RepresentationIn this section, we discuss our scheme for representing the 3D geometry data for under vehicle inspection. Theprocessing proposed in this section aids the development of a 3D sensor brick for SAFER. We begin this sectionby first discussing a segmentation algorithm to partition the data since a single superquadric is insufficient—and somewhat counterproductive—for representing the entire undercarriage of a vehicle. Superquadrics howeverare quite suitable for representing individual components and parts such as the canister of a muffler or thepiping for the exhaust system. Segmentation is necessary to first divide the under vehicle data into individualcomponents before fitting superquadrics to those components. We then follow with subsequent sections thatformalize superquadrics and demonstrate their recovery through fitting.
2.2.1. Surface Segmentation
Several segmentation algorithms are available in the literature that are specific to the superquadric problem6, 7
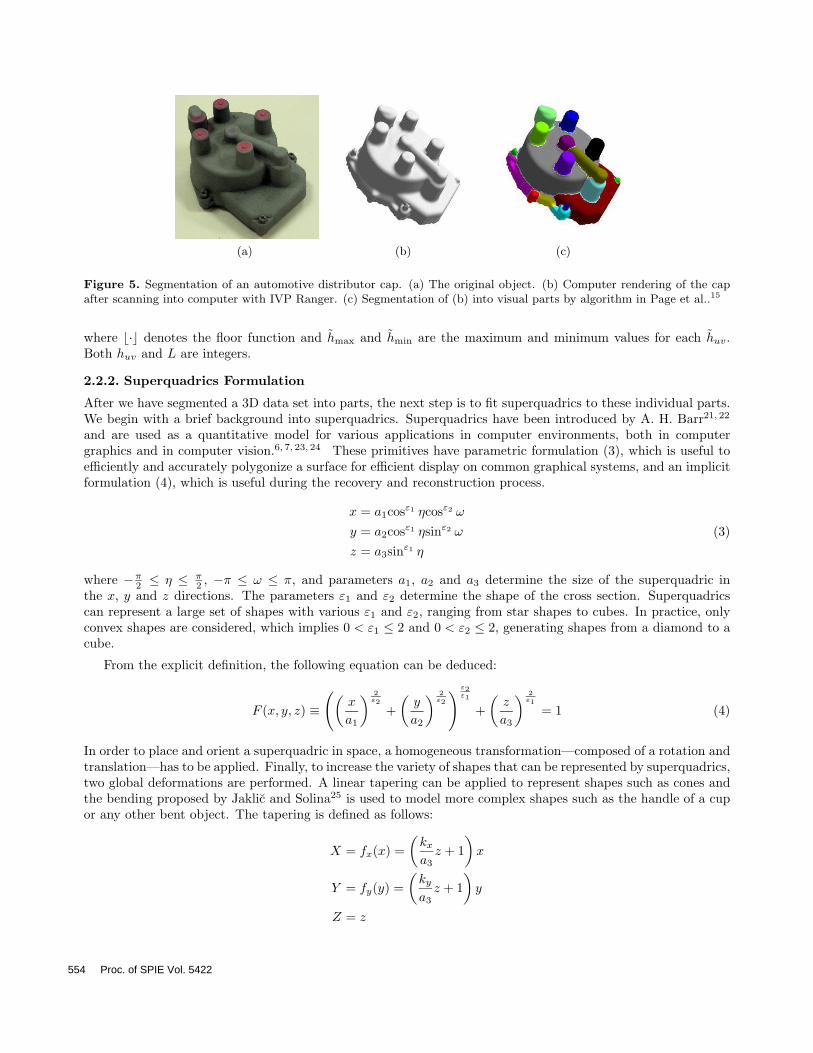
and to the more general mesh segmentation.8–14 The approach that we will take has been proposed byPage et al.15 and is known as “Fast Marching Watersheds.” This algorithm is not specific to superquadricsbut rather is a perceptually based algorithm that segments a triangle mesh into visual parts. This segmentationis based on a human vision theory known as the minima rule16 and thus yields segmentations that are simi-lar to how a human observer might segment a scene. An example segmentation with this algorithm appearsin Figure 5. Zhang et al.17 have used a similar segmentation algorithm for superquadric representation. Theunderlying principle is the watershed segmentation from image processing18 and found in mesh processing.8, 14
To improve the segmentation results, we have enhanced Page et al.15 by using discrete watershed-height levelsas opposed to the original continuous definitions. The algorithm in Page et al.15 defines a directional curvatureheight huv between two vertices (u and v) of the mesh data using Euler’s formula as follows:
huv = κ1 cos2(θuv) + κ2 sin2(θuv) (1)
where κ1 and κ2 are the maximum and minimum principal curvatures, respectively, at u as estimated by thealgorithms in Taubin19 or Page et al..20 The angle θuv is the angle between the maximum principal directionand the vector connecting u to v in the tangent plane of u. This value huv is a continuous height map across themesh.
Our proposed enhancement is to set huv to one of L discrete levels. Thus, we specify a discrete directionalheight huv as
huv =
⌊L
huv − hmin
hmax − hmin
⌋(2)
Proc. of SPIE Vol. 5422 553
(a) (b) (c)
Figure 5. Segmentation of an automotive distributor cap. (a) The original object. (b) Computer rendering of the capafter scanning into computer with IVP Ranger. (c) Segmentation of (b) into visual parts by algorithm in Page et al..15
where �·� denotes the floor function and hmax and hmin are the maximum and minimum values for each huv.Both huv and L are integers.
2.2.2. Superquadrics Formulation
After we have segmented a 3D data set into parts, the next step is to fit superquadrics to these individual parts.We begin with a brief background into superquadrics. Superquadrics have been introduced by A. H. Barr21, 22
and are used as a quantitative model for various applications in computer environments, both in computergraphics and in computer vision.6, 7, 23, 24 These primitives have parametric formulation (3), which is useful toefficiently and accurately polygonize a surface for efficient display on common graphical systems, and an implicitformulation (4), which is useful during the recovery and reconstruction process.
x = a1cosε1 ηcosε2 ω
y = a2cosε1 ηsinε2 ω
z = a3sinε1 η
(3)
where −π2 ≤ η ≤ π
2 , −π ≤ ω ≤ π, and parameters a1, a2 and a3 determine the size of the superquadric inthe x, y and z directions. The parameters ε1 and ε2 determine the shape of the cross section. Superquadricscan represent a large set of shapes with various ε1 and ε2, ranging from star shapes to cubes. In practice, onlyconvex shapes are considered, which implies 0 < ε1 ≤ 2 and 0 < ε2 ≤ 2, generating shapes from a diamond to acube.
From the explicit definition, the following equation can be deduced:
F (x, y, z) ≡((
x
a1
) 2ε2
+(
y
a2
) 2ε2
) ε2ε1
+(
z
a3
) 2ε1
= 1 (4)
In order to place and orient a superquadric in space, a homogeneous transformation—composed of a rotation andtranslation—has to be applied. Finally, to increase the variety of shapes that can be represented by superquadrics,two global deformations are performed. A linear tapering can be applied to represent shapes such as cones andthe bending proposed by Jaklic and Solina25 is used to model more complex shapes such as the handle of a cupor any other bent object. The tapering is defined as follows:
X = fx(x) =(
kx
a3z + 1
)x
Y = fy(y) =(
ky
a3z + 1
)y
Z = z
554 Proc. of SPIE Vol. 5422
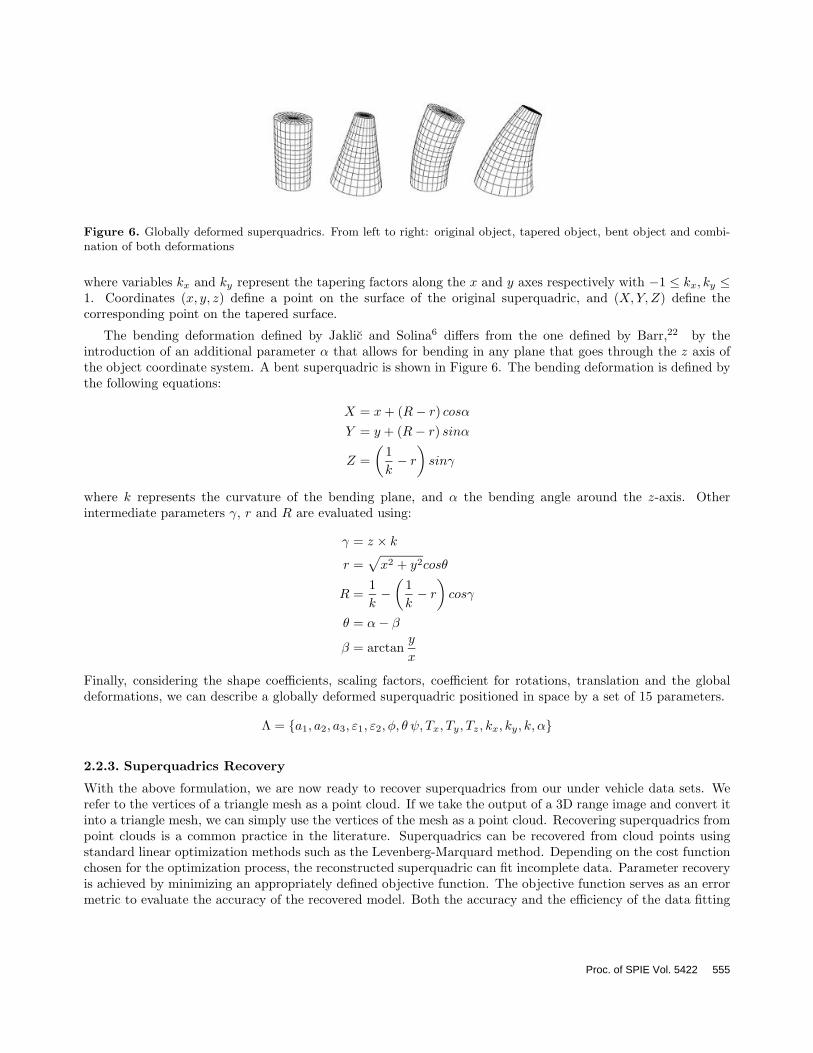
Figure 6. Globally deformed superquadrics. From left to right: original object, tapered object, bent object and combi-nation of both deformations
where variables kx and ky represent the tapering factors along the x and y axes respectively with −1 ≤ kx, ky ≤1. Coordinates (x, y, z) define a point on the surface of the original superquadric, and (X,Y,Z) define thecorresponding point on the tapered surface.
The bending deformation defined by Jaklic and Solina6 differs from the one defined by Barr,22 by theintroduction of an additional parameter α that allows for bending in any plane that goes through the z axis ofthe object coordinate system. A bent superquadric is shown in Figure 6. The bending deformation is defined bythe following equations:
X = x + (R − r) cosα
Y = y + (R − r) sinα
Z =(
1k− r
)sinγ
where k represents the curvature of the bending plane, and α the bending angle around the z-axis. Otherintermediate parameters γ, r and R are evaluated using:
γ = z × k
r =√
x2 + y2cosθ
R =1k−
(1k− r
)cosγ
θ = α − β
β = arctany
x
Finally, considering the shape coefficients, scaling factors, coefficient for rotations, translation and the globaldeformations, we can describe a globally deformed superquadric positioned in space by a set of 15 parameters.
Λ = {a1, a2, a3, ε1, ε2, φ, θ ψ, Tx, Ty, Tz, kx, ky, k, α}
2.2.3. Superquadrics Recovery
With the above formulation, we are now ready to recover superquadrics from our under vehicle data sets. Werefer to the vertices of a triangle mesh as a point cloud. If we take the output of a 3D range image and convert itinto a triangle mesh, we can simply use the vertices of the mesh as a point cloud. Recovering superquadrics frompoint clouds is a common practice in the literature. Superquadrics can be recovered from cloud points usingstandard linear optimization methods such as the Levenberg-Marquard method. Depending on the cost functionchosen for the optimization process, the reconstructed superquadric can fit incomplete data. Parameter recoveryis achieved by minimizing an appropriately defined objective function. The objective function serves as an errormetric to evaluate the accuracy of the recovered model. Both the accuracy and the efficiency of the data fitting
Proc. of SPIE Vol. 5422 555
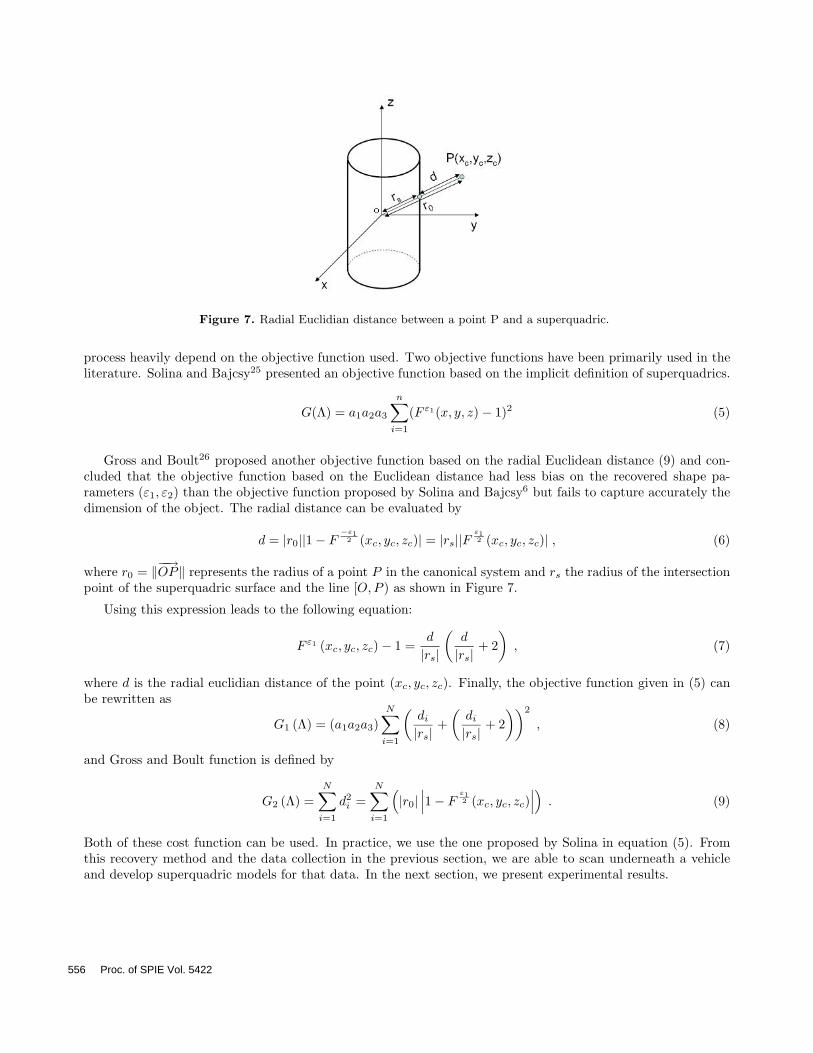
Figure 7. Radial Euclidian distance between a point P and a superquadric.
process heavily depend on the objective function used. Two objective functions have been primarily used in theliterature. Solina and Bajcsy25 presented an objective function based on the implicit definition of superquadrics.
G(Λ) = a1a2a3
n∑i=1
(F ε1(x, y, z) − 1)2 (5)
Gross and Boult26 proposed another objective function based on the radial Euclidean distance (9) and con-cluded that the objective function based on the Euclidean distance had less bias on the recovered shape pa-rameters (ε1, ε2) than the objective function proposed by Solina and Bajcsy6 but fails to capture accurately thedimension of the object. The radial distance can be evaluated by
d = |r0||1 − F−ε12 (xc, yc, zc)| = |rs||F
ε12 (xc, yc, zc)| , (6)
where r0 = ‖−−→OP‖ represents the radius of a point P in the canonical system and rs the radius of the intersectionpoint of the superquadric surface and the line [O,P ) as shown in Figure 7.
Using this expression leads to the following equation:
F ε1 (xc, yc, zc) − 1 =d
|rs|(
d
|rs| + 2)
, (7)
where d is the radial euclidian distance of the point (xc, yc, zc). Finally, the objective function given in (5) canbe rewritten as
G1 (Λ) = (a1a2a3)N∑
i=1
(di
|rs| +(
di
|rs| + 2))2
, (8)
and Gross and Boult function is defined by
G2 (Λ) =N∑
i=1
d2i =
N∑i=1
(|r0|
∣∣∣1 − Fε12 (xc, yc, zc)
∣∣∣) . (9)
Both of these cost function can be used. In practice, we use the one proposed by Solina in equation (5). Fromthis recovery method and the data collection in the previous section, we are able to scan underneath a vehicleand develop superquadric models for that data. In the next section, we present experimental results.
556 Proc. of SPIE Vol. 5422
(a) (b)
(c) (d)
(e)
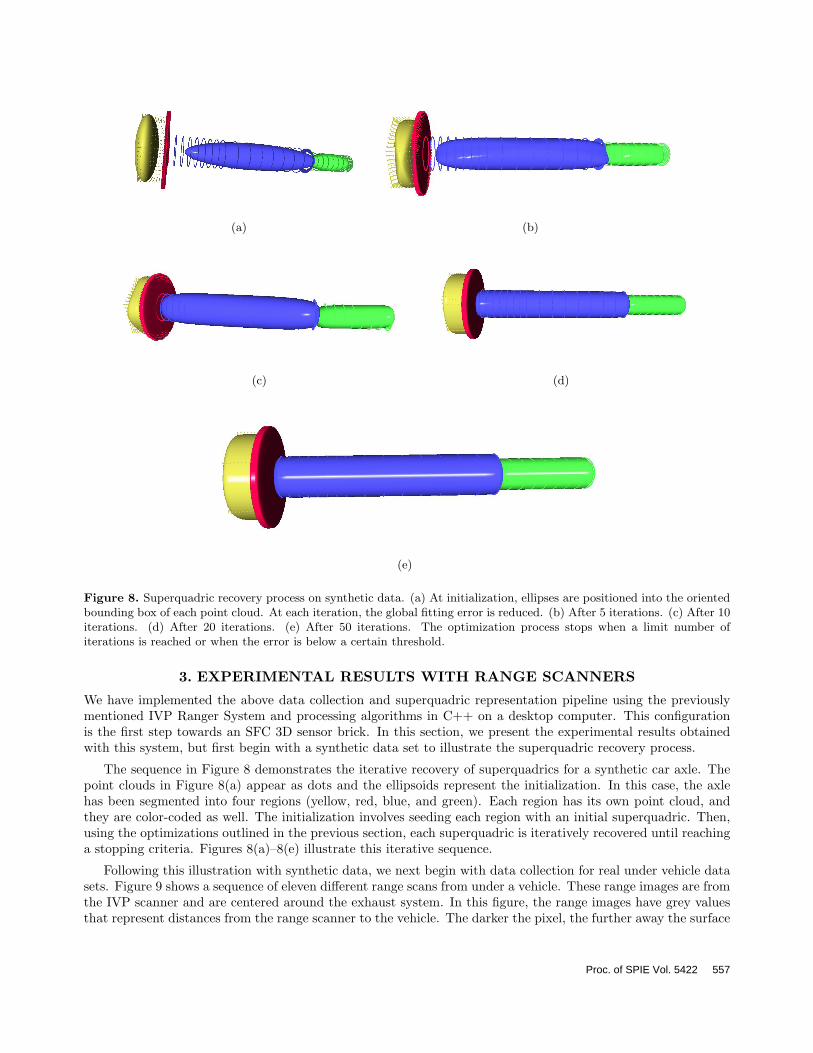
Figure 8. Superquadric recovery process on synthetic data. (a) At initialization, ellipses are positioned into the orientedbounding box of each point cloud. At each iteration, the global fitting error is reduced. (b) After 5 iterations. (c) After 10iterations. (d) After 20 iterations. (e) After 50 iterations. The optimization process stops when a limit number ofiterations is reached or when the error is below a certain threshold.
3. EXPERIMENTAL RESULTS WITH RANGE SCANNERS
We have implemented the above data collection and superquadric representation pipeline using the previouslymentioned IVP Ranger System and processing algorithms in C++ on a desktop computer. This configurationis the first step towards an SFC 3D sensor brick. In this section, we present the experimental results obtainedwith this system, but first begin with a synthetic data set to illustrate the superquadric recovery process.
The sequence in Figure 8 demonstrates the iterative recovery of superquadrics for a synthetic car axle. Thepoint clouds in Figure 8(a) appear as dots and the ellipsoids represent the initialization. In this case, the axlehas been segmented into four regions (yellow, red, blue, and green). Each region has its own point cloud, andthey are color-coded as well. The initialization involves seeding each region with an initial superquadric. Then,using the optimizations outlined in the previous section, each superquadric is iteratively recovered until reachinga stopping criteria. Figures 8(a)–8(e) illustrate this iterative sequence.
Following this illustration with synthetic data, we next begin with data collection for real under vehicle datasets. Figure 9 shows a sequence of eleven different range scans from under a vehicle. These range images are fromthe IVP scanner and are centered around the exhaust system. In this figure, the range images have grey valuesthat represent distances from the range scanner to the vehicle. The darker the pixel, the further away the surface
Proc. of SPIE Vol. 5422 557
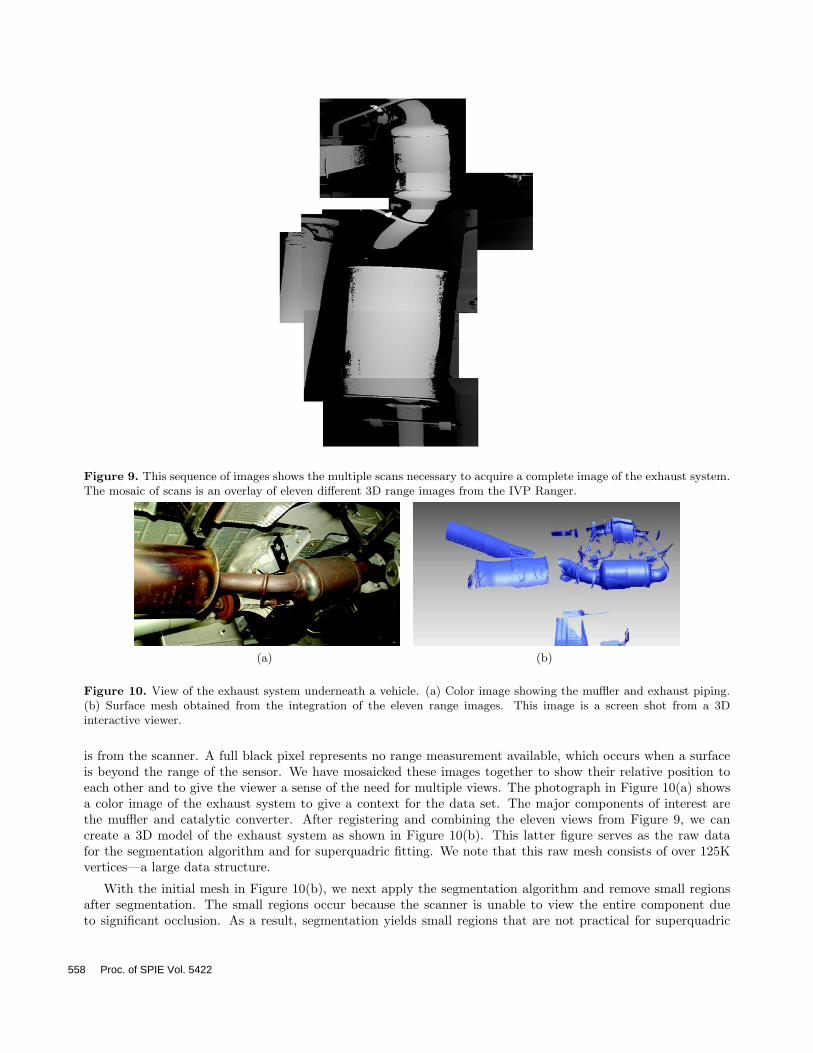
Figure 9. This sequence of images shows the multiple scans necessary to acquire a complete image of the exhaust system.The mosaic of scans is an overlay of eleven different 3D range images from the IVP Ranger.
(a) (b)
Figure 10. View of the exhaust system underneath a vehicle. (a) Color image showing the muffler and exhaust piping.(b) Surface mesh obtained from the integration of the eleven range images. This image is a screen shot from a 3Dinteractive viewer.
is from the scanner. A full black pixel represents no range measurement available, which occurs when a surfaceis beyond the range of the sensor. We have mosaicked these images together to show their relative position toeach other and to give the viewer a sense of the need for multiple views. The photograph in Figure 10(a) showsa color image of the exhaust system to give a context for the data set. The major components of interest arethe muffler and catalytic converter. After registering and combining the eleven views from Figure 9, we cancreate a 3D model of the exhaust system as shown in Figure 10(b). This latter figure serves as the raw datafor the segmentation algorithm and for superquadric fitting. We note that this raw mesh consists of over 125Kvertices—a large data structure.
With the initial mesh in Figure 10(b), we next apply the segmentation algorithm and remove small regionsafter segmentation. The small regions occur because the scanner is unable to view the entire component dueto significant occlusion. As a result, segmentation yields small regions that are not practical for superquadric
558 Proc. of SPIE Vol. 5422
(a) (b)
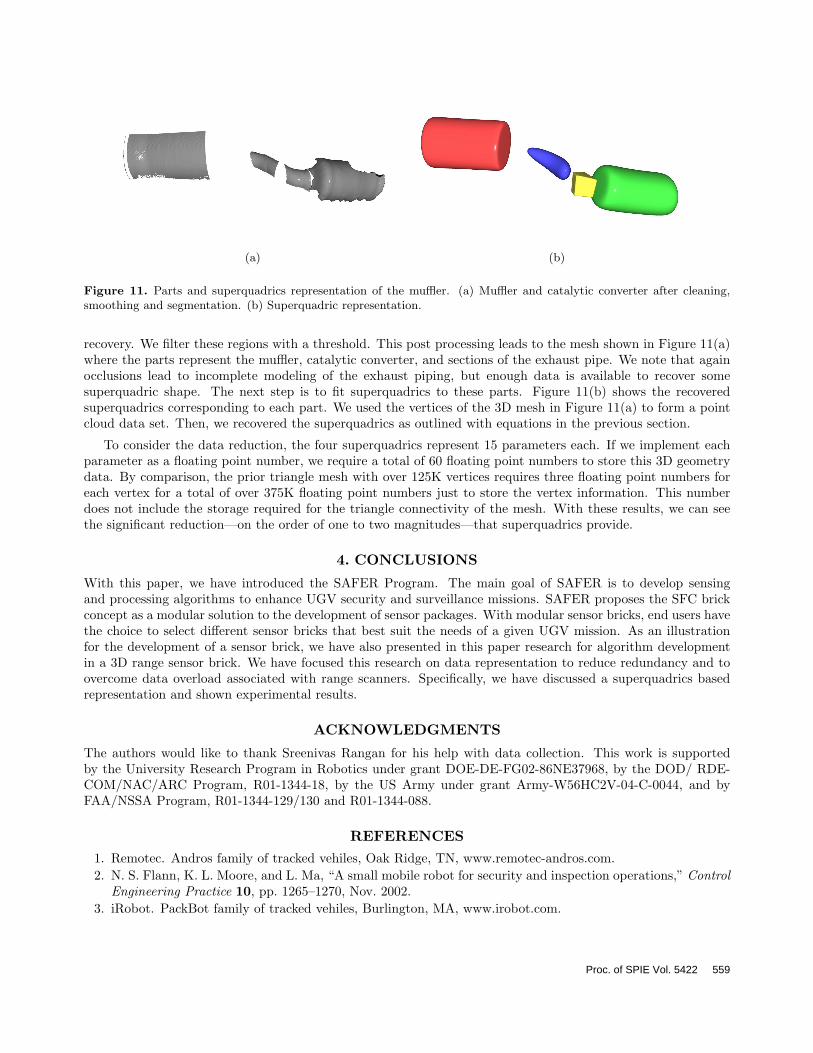
Figure 11. Parts and superquadrics representation of the muffler. (a) Muffler and catalytic converter after cleaning,smoothing and segmentation. (b) Superquadric representation.
recovery. We filter these regions with a threshold. This post processing leads to the mesh shown in Figure 11(a)where the parts represent the muffler, catalytic converter, and sections of the exhaust pipe. We note that againocclusions lead to incomplete modeling of the exhaust piping, but enough data is available to recover somesuperquadric shape. The next step is to fit superquadrics to these parts. Figure 11(b) shows the recoveredsuperquadrics corresponding to each part. We used the vertices of the 3D mesh in Figure 11(a) to form a pointcloud data set. Then, we recovered the superquadrics as outlined with equations in the previous section.
To consider the data reduction, the four superquadrics represent 15 parameters each. If we implement eachparameter as a floating point number, we require a total of 60 floating point numbers to store this 3D geometrydata. By comparison, the prior triangle mesh with over 125K vertices requires three floating point numbers foreach vertex for a total of over 375K floating point numbers just to store the vertex information. This numberdoes not include the storage required for the triangle connectivity of the mesh. With these results, we can seethe significant reduction—on the order of one to two magnitudes—that superquadrics provide.
4. CONCLUSIONS
With this paper, we have introduced the SAFER Program. The main goal of SAFER is to develop sensingand processing algorithms to enhance UGV security and surveillance missions. SAFER proposes the SFC brickconcept as a modular solution to the development of sensor packages. With modular sensor bricks, end users havethe choice to select different sensor bricks that best suit the needs of a given UGV mission. As an illustrationfor the development of a sensor brick, we have also presented in this paper research for algorithm developmentin a 3D range sensor brick. We have focused this research on data representation to reduce redundancy and toovercome data overload associated with range scanners. Specifically, we have discussed a superquadrics basedrepresentation and shown experimental results.
ACKNOWLEDGMENTS
The authors would like to thank Sreenivas Rangan for his help with data collection. This work is supportedby the University Research Program in Robotics under grant DOE-DE-FG02-86NE37968, by the DOD/ RDE-COM/NAC/ARC Program, R01-1344-18, by the US Army under grant Army-W56HC2V-04-C-0044, and byFAA/NSSA Program, R01-1344-129/130 and R01-1344-088.
REFERENCES1. Remotec. Andros family of tracked vehiles, Oak Ridge, TN, www.remotec-andros.com.2. N. S. Flann, K. L. Moore, and L. Ma, “A small mobile robot for security and inspection operations,” Control
Engineering Practice 10, pp. 1265–1270, Nov. 2002.3. iRobot. PackBot family of tracked vehiles, Burlington, MA, www.irobot.com.
Proc. of SPIE Vol. 5422 559

4. A. Koschan, J.-C. Ng, and M. Abidi, “Multiperspective mosaics for under vehicle inspection,” in Proceedingsof the SPIE Unmanned Ground Vehicle Technology, 5422, 2004.
5. Integrated Vision Products, User Documentation: MAPP Ranger System. Sweden, 2000.6. A. Jaklic, A. Leonardis, and F. Solina, Segmentation and Recovery of Superquadrics, Kluwer Academic
Publisher, Dordrecht, 2000.7. D. N. Metaxas, “Deformable models for segmentation, 3D shape and motion estimation and recognition,”
in Proceedings of the British Machine Vision Conference, 1999.8. A. P. Mangan and R. T. Whitaker, “Partitioning 3D surface meshes using watershed segmentation,” IEEE
Transactions on Visualization and Computer Graphics 5, pp. 308–321, Oct.–Dec. 1999.9. K. Wu and M. D. Levine, “3D part segmentation using simulated electrical charge distributions,” IEEE
Transactions on Pattern Analysis and Machine Intelligence 19, pp. 1223–1235, Nov. 1997.10. L. Vincent and P. Soille, “Watersheds in digital spaces: an efficient algorithm based on immersion simula-
tions,” IEEE Transactions on Pattern Analysis and Machine Intelligence 13, pp. 583–598, June 1991.11. B. Falcidieno and M. Spagnuolo, “Polyhedral surface decomposition based on curvature analysis,” in Modern
Geometric Computing for Visualization, T. L. Kunii and Y. Shinagawa, eds., pp. 57–72, Springer-Verlag,1992.
12. N. S. Sapidis and P. J. Besl, “Direct construction of polynomial surfaces from dense range images throughregion growing,” ACM Transactions on Graphics 14, pp. 171–200, Apr. 1995.
13. Y. Yu, A. Ferencz, and J. Malik, “Extracting objects from range and radiance images,” IEEE Transactionson Visualization and Computer Graphics 7, pp. 351–364, Oct.–Dec. 2001.
14. M. E. Rettmann, X. Han, and J. L. Prince, “Automated sulcal segmentation using watersheds on the corticalsurface,” NeuroImage 15, pp. 329–344, Feb. 2002.
15. D. L. Page, A. Koschan, and M. Abidi, “Perception-based 3D triangle mesh segmentation using fast marchingwatersheds,” in Proceedings of the International Conference on Computer Vision and Pattern Recognition,II, pp. 27–32, June 2003.
16. D. D. Hoffman and W. A. Richards, “Parts of recognition,” Cognition 18, pp. 65–96, 1984.17. Y. Zhang, J. K. Paik, A. Koschan, M. A. Abidi, and D. Gorsich, “A simple and efficient algorithm for part
decomposition of 3d triangulated models based on curvature analysis,,” in Proceedings of the InternationalConference on Image Processing, III, pp. 273–276, Sept. 2002.
18. R. C. Gonzalez and R. E. Woods, Digital Image Processing, Addison–Wesley Publishing Company, Reading,MA, second ed., 2002.
19. G. Taubin, “Estimating the tensor of curvature of a surface from a polyhedral approximation,” in Proceedingsof the Fifth International Conference on Computer Vision, pp. 902–907, 1995.
20. D. L. Page, Y. Sun, A. Koschan, J. Paik, and M. Abidi, “Normal vector voting: Crease detection andcurvature estimation on large, noisy meshes,” Graphical Models 64, pp. 1–31, 2003.
21. A. H. Barr, “Superquadrics and angle-preserving transformations,” IEEE Transactions on Computer Graph-ics and Applications 1, pp. 11–23, Jan. 1981.
22. A. H. Barr, “Global and local deformation of solid primitives,” Computer Graphics Proceedings 18(3),pp. 21–30, 1984.
23. M. E. Montiel, A. S. Aguado, and E. Zaluska, “Surface subdivision for generating superquadrics,” VisualComputer 14(1), pp. 1–17, 1998.
24. A. Jaklic and F. Solina, “Moments of superellipsoids and their application to range image registration,”IEEE Transactions on Systems, Man, and Cybernetics, Part B 33(4), pp. 648–657, 2003.
25. F. Solina and R. Bajcsy, “Recovery of parametric models from range images: The case for superquadrics withglobal deformations,” IEEE Transactions on Pattern Analysis and Machine Intelligence 12(2), pp. 131–147,1990.
26. A. Gross and T. Boult, “Error of fit measures for recovering parametric solids,” in Proceedings of theInternational Conference on Computer Vision, pp. 690–694, 1988. Invited paper.
560 Proc. of SPIE Vol. 5422