safeseas users guide - national weather servicemultiple phases. the application is primarily...
TRANSCRIPT
SAFESEAS
(System on AWIPS for Forecasting and Evaluation of Seas and Lakes)
Users’ Guide AWIPS OB8.3 Release
Windsor Gusti Caesar Cioppi
Decision Assistance Branch
Meteorological Development Lab Office of Science and Technology
National Weather Service
February 2008
1

Table of Contents 1 Introduction .............................................................................................................................. 3 2 What’s New in OB8.3? ............................................................................................................ 4 3 SAFESEAS Functional Overview ........................................................................................... 4
3.1 SAFESEAS Localization................................................................................................... 4 3.1.1 Reversing Swell Period Rankings............................................................................... 5
3.2 SAFESEAS Monitor Description...................................................................................... 6 3.3 SAFESEAS D-2D Plan-View Plot Description ................................................................ 9 3.4 SAFESEAS Tabular Display Description ......................................................................... 9 3.5 SAFESEAS Set-up/Configuration Application Descriptions............................................ 9
4 Operation and Configuration of SAFESEAS......................................................................... 10 4.1 The SAFESEAS Monitoring Area .................................................................................. 10 4.2 The SAFESEAS Monitor ................................................................................................ 11
4.2.1 Configuring the SAFESEAS Monitoring Area ........................................................ 12 4.2.1.1 Zone Mode ........................................................................................................ 12 4.2.1.2 Station Mode..................................................................................................... 17 4.2.1.3 Modifying the SAFESEAS Button Time Window Value ................................ 20 4.2.1.4 Modifying the Ship Distance Value.................................................................. 20 4.2.1.5 Fog Monitor Contribution to Alert Button........................................................ 20 4.2.1.6 Saving Editing Changes to the Monitoring Area.............................................. 21
4.2.2 Configuring the Monitor Thresholds ........................................................................ 22 4.3 The SAFESEAS Application........................................................................................... 25 4.4 The Zone Table................................................................................................................ 26 4.5 The Station Table............................................................................................................. 31
4.5.1 The Trend Plot .......................................................................................................... 33 4.5.2 Observation History Table........................................................................................ 35
4.6 Editing Zone/Station Table Display Thresholds ............................................................. 37 5 Getting Help ........................................................................................................................... 41
Revision History Name Date Reason For Changes Version
Cecelia Mitchell 01/29/2008 Various updates for clarification. OB8.2 Mike Churma 03/05/2008 Added sec. 3.1.1; updates of Sec. 2, 3.1.1, and 3.2 ;
removal of a text box explaining why the SAFESEAS table and D-2D display don’t match up (they now do).
OB8.3
2
1 Introduction SAFESEAS is a set of AWIPS applications that continuously monitor marine and adjacent overland conditions for specific marine weather hazards. It automatically alerts the forecasters whenever such conditions are detected. SAFESEAS provides capabilities to display observed marine threats in ways that help forecasters focus on what they consider most important. Thus SAFESEAS helps forecasters make faster, earlier, and higher quality decisions regarding marine watches and warnings. SAFESEAS capabilities are being designed, developed, and deployed in multiple phases. The application is primarily intended to support any Weather Forecast Office (WFO) with marine forecast responsibilities; however, non-marine WFOs also may find its monitoring capabilities to be of practical use. Table 1-1 defines key terms used throughout this document.
Table 1-1: Key Terms for SAFESEAS descriptions. area of responsibility
An office’s marine “area of responsibility” (AOR) includes all the marine zones for which it issues forecasts, watches, and warnings. In some contexts, the office’s area of responsibility also includes the overland “county warning area” (CWA) for which it issues non-marine forecasts, watches, and warnings.
monitoring area
An office’s “monitoring area” includes all the marine zones and land area watched by the SAFESEAS monitor. By default, the monitoring area for most WFOs includes (1) its own marine AOR and overland CWA, (2) the marine AOR and overland CWA for each adjacent office having marine responsibilities, and (3) all marine zones adjacent to (1) and (2) but not in another WFO’s area of responsibility. Different default definitions apply to WFOs whose area of responsibility borders Canada or Mexico, to WFOs not in the contiguous 48 states, and to non-WFO offices. Each office may modify its monitoring area definition; see “The Editor for the SAFESEAS Set-Up” below for details.
product A SAFESEAS “product” corresponds to a specific NWS marine watch or warning type, such as the Small Craft Advisory or the Storm Warning. Conditions defining a product may require that thresholds be independently met for possibly more than one variable. For example, for Small Craft Advisory, monitoring is for wind speed over some threshold or wind gust over some threshold or wave height over some threshold.
report A “report” is an external product which contains observed values of weather and/or marine variables for a specific time and station location. An example of a report is a METAR.
station A “station” is a location where weather and/or marine conditions are observed. A station may be either fixed-location (e.g., ASOS) or mobile (e.g., ships), and either marine (e.g., buoys) or over land.
variable A SAFESEAS “variable” corresponds to a single meteorological or marine state variable. Examples include wind speed and wave height.
3
2 What’s New in OB8.3? There are two new SAFESEAS features in OB8.3: The “anchor” icon in Guardian has been enhanced to list the worst-case values and threat levels which determine the icon’s color. This will allow users at a glance to find conditions in their area such as lowest visibility and highest wind speed. Also, the SAFESEAS localization is now configurable to allow WFO’s to choose whether to emphasize longer or shorter swell periods. See sections 3.2 and 3.1.1, respectively, for details.
3 SAFESEAS Functional Overview SAFESEAS consists of four monitoring/display components and four set-up/configuration components. The monitoring/display components are the:
a) SAFESEAS monitor, b) SAFESEAS D-2D plan-view plots, c) SAFESEAS tabular display, and the d) SAFESEAS trend plot.
The set-up/configuration components are the:
a) localization script, b) Graphical User Interface (GUI) application for editing the SAFESEAS monitoring area, c) SAFESEAS monitor thresholds GUI application, and the d) SAFESEAS tabular display thresholds GUI application.
The localization script will not be further discussed in this user’s guide.
3.1 SAFESEAS Localization SAFESEAS localization uses the following files to produce your default monitoring area:
a) US county “shape” files; b) marine zone “shape” files; c) the “maritimeStationInfo.txt” file; and d) the “metarStationInfo.txt” file.
It is the responsibility of each office to make sure that it has the current versions of these files before localization is run. In addition, for mesonet stations, SAFESEAS localization uses the following files in directory “/awips/fxa/ldad/data/”:
a) “LDADinfo.txt”; b) one location information file for each external data source. These files have names of the
form “xxxStation.txt, where “xxx” is a “data_root” value from file “LDADinfo.txt”.
4
c) one dataset information file for each external data source. These files have names of the form “yyy.desc”, where “yyy” is a “data_type” value from file “LDADinfo.txt”.
It is the responsibility of each office to make sure these files are correct and up-to-date before localization is run. See documentation in file “/awips/fxa/data/localization/scripts/SS_mesonetStationInfo.sh” for more information. SAFESEAS localization is automatically run as a part of the full AWIPS localization that is done after an AWIPS build is installed. An office should not need to run SAFESEAS localization manually unless unusual, severe problems (such as the corruption of the files produced by SAFESEAS localization) occur. In the event that running SAFESEAS localization becomes necessary, please follow these steps:
1) close all D-2D SAFESEAS displays on all lx workstations. 2) log on to the px1 system as user “fxa”. 3) change to directory “/awips/fxa/bin/”. 4) run the “stopSSprocessor” script. 5) change to directory “/awips/fxa/localization/scripts/”. 6) enter the command “mainScript.csh -safeseas”. 7) change to directory “/awips/fxa/bin/”. 8) run the “startSSprocessor” script. 9) log off.
3.1.1 Reversing Swell Period Rankings. By default, SAFESEAS emphasizes shorter swell period values instead of longer values. The SAFESEAS table (sections 4.4, 4.5) will rank the primary and secondary swell period columns with the lowest values on top, and the configuration tools (sections 4.2.2, 4.6) list shorter periods as their worst-case (“red”) threat level. This configuration is useful to many WFO’s, as short swell periods can indicate choppy seas that can be hazardous to small boats. Some WFO’s, though, are interested in monitoring longer-period swells that may indicate rip current conditions. SAFESEAS users can choose, on a WFO by WFO basis, whether they want to highlight shorter or lower swell periods in SAFESEAS, by adding a step to the localization procedures described above in section 3.1:
1) Follow steps 1-4 in the localization instructions. 2) Type in the terminal command, “setenv SAFESEAS_RANK_SWELLPD HIGH”. 3) Proceed through localization steps 5-9.
When these steps have been taken, SAFESEAS will emphasize longer (higher) swell periods – the longest periods will be ranked first, and get the “red” threat level values. Once performed, this setting will remain in place for SAFESEAS (for the entire WFO), unless it is manually re-set to lower periods. To re-set SAFESEAS back to an emphasis on lower periods, follow the three steps above as described, but modify the terminal command to: “setenv SAFESEAS_RANK_SWELLPD LOW”.
5
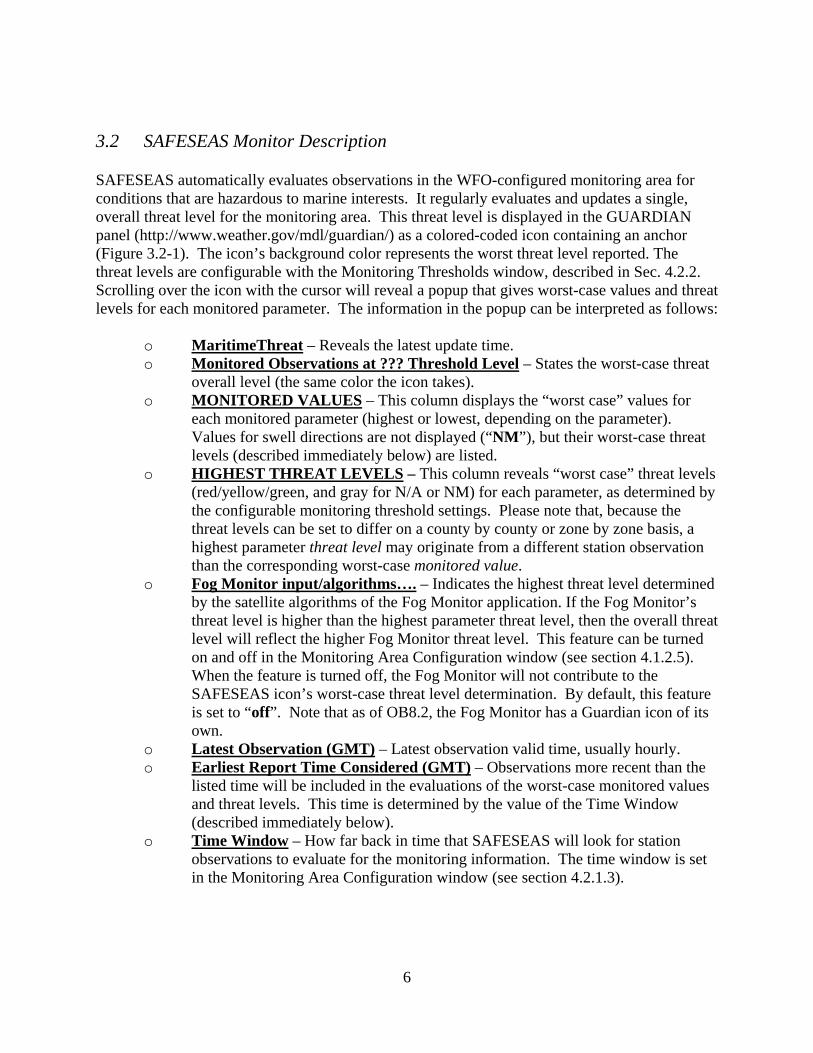
3.2 SAFESEAS Monitor Description SAFESEAS automatically evaluates observations in the WFO-configured monitoring area for conditions that are hazardous to marine interests. It regularly evaluates and updates a single, overall threat level for the monitoring area. This threat level is displayed in the GUARDIAN panel (http://www.weather.gov/mdl/guardian/) as a colored-coded icon containing an anchor (Figure 3.2-1). The icon’s background color represents the worst threat level reported. The threat levels are configurable with the Monitoring Thresholds window, described in Sec. 4.2.2. Scrolling over the icon with the cursor will reveal a popup that gives worst-case values and threat levels for each monitored parameter. The information in the popup can be interpreted as follows:
o MaritimeThreat – Reveals the latest update time. o Monitored Observations at ??? Threshold Level – States the worst-case threat
overall level (the same color the icon takes). o MONITORED VALUES – This column displays the “worst case” values for
each monitored parameter (highest or lowest, depending on the parameter). Values for swell directions are not displayed (“NM”), but their worst-case threat levels (described immediately below) are listed.
o HIGHEST THREAT LEVELS – This column reveals “worst case” threat levels (red/yellow/green, and gray for N/A or NM) for each parameter, as determined by the configurable monitoring threshold settings. Please note that, because the threat levels can be set to differ on a county by county or zone by zone basis, a highest parameter threat level may originate from a different station observation than the corresponding worst-case monitored value.
o Fog Monitor input/algorithms…. – Indicates the highest threat level determined by the satellite algorithms of the Fog Monitor application. If the Fog Monitor’s threat level is higher than the highest parameter threat level, then the overall threat level will reflect the higher Fog Monitor threat level. This feature can be turned on and off in the Monitoring Area Configuration window (see section 4.1.2.5). When the feature is turned off, the Fog Monitor will not contribute to the SAFESEAS icon’s worst-case threat level determination. By default, this feature is set to “off”. Note that as of OB8.2, the Fog Monitor has a Guardian icon of its own.
o Latest Observation (GMT) – Latest observation valid time, usually hourly. o Earliest Report Time Considered (GMT) – Observations more recent than the
listed time will be included in the evaluations of the worst-case monitored values and threat levels. This time is determined by the value of the Time Window (described immediately below).
o Time Window – How far back in time that SAFESEAS will look for station observations to evaluate for the monitoring information. The time window is set in the Monitoring Area Configuration window (see section 4.2.1.3).
6
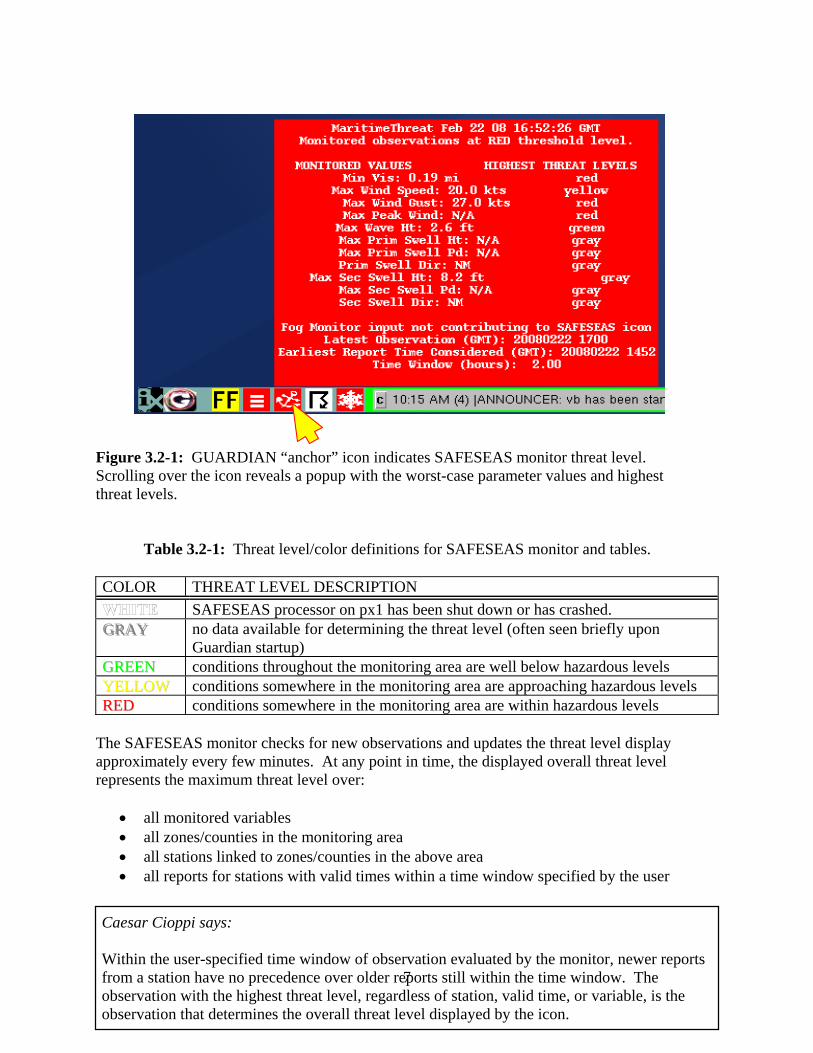
Figure 3.2-1: GUARDIAN “anchor” icon indicates SAFESEAS monitor threat level. Scrolling over the icon reveals a popup with the worst-case parameter values and highest threat levels.
Table 3.2-1: Threat level/color definitions for SAFESEAS monitor and tables.
COLOR THREAT LEVEL DESCRIPTION
SAFESEAS processor on px1 has been shut down or has crashed. GGGRRRAAAYYY no data available for determining the threat level (often seen briefly upon
Guardian startup) GGRREEEENN conditions throughout the monitoring area are well below hazardous levels YYEELLLLOOWW conditions somewhere in the monitoring area are approaching hazardous levels RREEDD conditions somewhere in the monitoring area are within hazardous levels
The SAFESEAS monitor checks for new observations and updates the threat level display approximately every few minutes. At any point in time, the displayed overall threat level represents the maximum threat level over:
• all monitored variables • all zones/counties in the monitoring area • all stations linked to zones/counties in the above area • all reports for stations with valid times within a time window specified by the user
7
Caesar Cioppi says: Within the user-specified time window of observation evaluated by the monitor, newer reports from a station have no precedence over older reports still within the time window. The observation with the highest threat level, regardless of station, valid time, or variable, is the observation that determines the overall threat level displayed by the icon.
The SAFESEAS monitor compares individual meteorological variables (sustained wind, wind gusts, wave height, visibility, primary swell period, primary swell height, primary swell direction, secondary swell period, secondary swell height, and secondary swell direction) against thresholds defining the threat levels. It does not currently monitor marine products which may involve more than one variable (e.g., Small Craft Advisory) or multiple levels of a single variable (e.g., Gale, Storm, and Hurricane Force for wind speed). This latter capability is provided by the SAFESEAS zone and station table displays (Section 2.3). A factory-default set of monitor threshold values for each threat level of each variable is provided with SAFESEAS. The SAFESEAS monitor threat-level thresholds can be modified by the user, and may be specified individually by zone/county and by variable. Instructions for modifying the SAFESEAS monitor thresholds are described in Section 4.2.2.
8

3.3 SAFESEAS D-2D Plan-View Plot Description The SAFESEAS D-2D plan-view plot (Figure 4.3-2) consists of modifications of the following five D-2D surface observation plots: (1) the METAR plot, (2) the fixed buoy plot, (3) the drifting buoy and ship report plot, (4) the mesonet plot, and (5) the MAROB plot. The SAFESEAS plots differ from their non-SAFESEAS counterparts in that the SAFESEAS plots include only those reports within the WFO-configured monitoring area. All five SAFESEAS D-2D plots are loaded together as a multi-load graphic.
3.4 SAFESEAS Tabular Display Description The SAFESEAS application has two types of tabular windows: the configurable zone/station table, and the trend plot. In both the zone and the station windows, individual columns of the table display the current threat level for each product, and both the observed value and the threat level for each variable. In the zone window (Figure 4.4-1), each row of the table shows these threat levels for a zone or county, for all zones and counties in the monitoring area. In the station window (Figure 4.5-1), each row of the table shows these threat levels for the stations within (or related to) a single user-selected zone or county. The trend plots (Figures 4.5.1-1, 4.5.1-2, 4.5.1-3) display a meteogram of a selected variable, or a composite meteogram of the values of the variables comprising a selected product, for single stations. The trend covers the most recent 24 hours.
Caesar Cioppi says: The SAFESEAS zone/station table for a given frame time (nominal hour) considers reports from 20 minutes before the hour to 40 minutes past the hour. For a given station, the threat level is determined using only the most recent report within this period. When multiple stations are associated to a zone, the zone threat level is the highest threat level from among these individual threat levels for stations in the zone, regardless of which station’s latest report is more recent. Thus, the threat level displayed by the zone/station table may differ from the threat level shown by the monitor icon, and may not correspond to the data values of the station in the plotted reports.
3.5 SAFESEAS Set-up/Configuration Application Descriptions The SAFESEAS monitoring area set-up application allows the user to configure the zones and counties included in the SAFESEAS monitoring area, and to specify the fixed-location stations associated with each zone or county.
9

The SAFESEAS monitor thresholds editing window allows the user to specify the variable thresholds used by the SAFESEAS monitor to determine the threat level for each variable. The thresholds are zone-specific, that is, they may vary from zone to zone. The monitor thresholds do not control the threat level computation for the SAFESEAS zone/station table display. The SAFESEAS zone/station display thresholds editing window allows the user to (1) enter and save new sets of display thresholds, (2) select and apply a previously-defined set of display thresholds for current use, and (3) edit a set of display thresholds. The zone/station table display thresholds are used in the zone and station tables when determining threat levels. The thresholds are zone-specific, that is, they may vary from zone to zone. The zone/station table display thresholds do not control the threat level computation for the SAFESEAS monitor.
4 Operation and Configuration of SAFESEAS
4.1 The SAFESEAS Monitoring Area To achieve “No Surprises” marine watch/warning service, a forecaster needs to know about not only the hazards that are currently present within the AOR, but also the hazards that are developing within the AOR and the hazards that are advecting toward the AOR. SAFESEAS monitors observations near as well as in the AOR, thus helping the forecaster to be aware of hazards advecting toward his AOR. Let’s examine the area (called the “monitoring area”) in which SAFESEAS monitors observations. The monitoring area is created by the SAFESEAS “localization” script. To construct the default monitoring area, localization starts with the office’s AOR. Next, the AOR for each adjacent office with marine responsibilities is added. Then localization finds all the fixed stations (METAR stations, C_MAN stations, and fixed buoys) within this monitoring area, and associates each such station with the zone/county in which it is located. All stations known to AWIPS, including mesonet stations, are considered in this step.
a note from Windsor Gusti: Fixed stations known to AWIPS are those in “$FXA_HOME/data/metarStationInfo.txt”, “$FXA_HOME/data/marineStationInfo.txt”, and “$FXA_HOME/data/localizationDataSets/$FXA_LOCAL_SITE/mesonetStationInfo.txt”.
If the office’s AOR borders Canadian or Mexican space, an additional step is taken. SAFESEAS localization defines three new “imaginary” zones. A location is in:
• the first imaginary zone if it is less than 25 statute miles from the centroid of the closest actual zone within the monitoring area as defined in the paragraph above;
• the second imaginary zone if it is between 25 and 75 statute miles from the centroid of the closest actual zone within the monitoring area as defined in the paragraph above; or
• the third imaginary zone if it is between 75 and 125 statute miles from the centroid of the closest actual zone within the monitoring area as defined in the paragraph above.
10

For each non-US fixed station known to AWIPS, localization determines its distance from the centroid of the nearest zone in the monitoring area as defined in the paragraph above. If the distance is less than 125 statute miles, then that station is considered to be in the fictitious zone corresponding to that distance. You may wonder what this zone-station association is all about. When SAFESEAS determines the threat level for a zone, it compares the observations for all the stations associated with that zone with the zone’s thresholds. The default zone-station associations produced by localization are that each station is associated only with the zone in which it is located. In other words, the only stations that localization associates with a zone are those located within that zone.
a note from Windsor Gusti: Station and zone border locations are known to AWIPS only approximately. So a few default zone-station associations may not be what you expect, especially for stations on or very close to zone boundaries. Also, in the default set-up, a station located sufficiently close to a zone boundary may be associated with more than one zone.
To improve the monitoring for hazards advecting toward a zone, you may wish to associate stations from other nearby zones with that zone. You do this by customizing the monitoring area. A set-up editor is provided for this purpose. See Section 4.2.1, “Configuring the SAFESEAS Monitoring Area”, for instructions on how to do this. SAFESEAS also monitors reports from moving platforms (ships and drifting buoys) while they are inside the monitoring area or within 200 nautical miles of the centroid of at least one zone that is inside the monitoring area. A moving platform is associated with the zone in which it is located while it is inside the monitoring area. If a moving platform is outside the monitoring area, but located within 200 nautical miles of the centroid of a monitoring area zone, then it is associated with the monitoring area zone whose centroid is closest.
4.2 The SAFESEAS Monitor The SAFESEAS monitor process runs continuously on the px1 system, and is launched automatically by AWIPS when the startIngest.px1 script is run. It requires no interactive user input. Its only output to users is the small SAFESEAS threat indicator in the GUARDIAN display. The threat indicator in GUARDIAN is a small rectangle containing an anchor icon (Figure 3.2-1). The background color corresponds to that associated with the threat level for the office’s area of responsibility (Table 3.2-1). The monitor is a clock-driven process. At regular time intervals (12-15 minutes), the monitor obtains new reports received by AWIPS in the preceding interval. The reports that are within the monitoring area and less than 32 hours old are extracted from the METAR, maritime, MAROB, and mesonet netCDF files by the monitor, and saved in hourly SAFESEAS netCDF files for access by the SAFESEAS D-2D zone table, the station table, and the trend. The monitor
11
determines an individual threat level for each newly received report within a user-defined time window and within the monitoring area. This threat level is determined by comparing the reports’ observations to the monitor thresholds for the zone(s) or county/counties to which the observation is linked. The monitoring area’s overall threat level is then computed as the highest threat level from the previously processed reports and the threat levels for the reports just processed, over those reports within the time window. At that point, the monitor updates the background color of the SAFESEAS threat indicator in the GUARDIAN display, then waits until new updates are indicated by the AWIPS notificationServer. The SAFESEAS localization process produces a first-guess zone/county/station monitoring area set up, and a default set of monitoring thresholds for these zones/counties. The first-guess monitoring area is described in section 4.1 (“The SAFESEAS Monitoring Area”) above. Editors are provided to allow the forecaster to modify: (1) the first-guess monitoring area counties, zones, and stations and their associations, and (2) the factory-default monitoring thresholds for the monitored variables for these zones/counties.
4.2.1 Configuring the SAFESEAS Monitoring Area Left-click “SAFESEAS Apps” in the AWIPS Startup Menu of the Desktop popup menu to bring up the menu of SAFESEAS applications. Click the “Configure Zone/Station Setup” entry to start the editor for the SAFESEAS monitoring area. This editor will also be referred to as the SAFESEAS Monitoring Area Setup application in this document. The main window of this application will be referred to as the Setup window. There are two editing modes. In the zone mode, you specify which zones/counties are in the monitoring area, then associate observing stations with the zones/counties. In the station mode, you specify which stations are in the monitoring area and then associate zones and counties with the stations. The edit mode is selected via the “Zone” and “Station” buttons to the right of the “Configure” label near the upper left corner of the window.
4.2.1.1 Zone Mode To enter the zone mode of the SAFESEAS Monitor Area Set Up application (Figure 4.2.1.1-1), select the “Zone” pushbutton next to the “Configure” label at the top of the window. When editing in zone mode, the upper left list (the “Monitor Area Zones” list) includes the IDs for all the zones and counties currently comprising the monitoring area, and the lower left list (the “Additional Zones” list) includes the IDs for other nearby zones/counties. The text-entry box near the upper right corner, just above the list title “Associated Stations”, indicates the name of the active zone whose associated stations list is being edited. The “Associated Stations” list shows the IDs for the fixed stations currently associated with the active zone.
12

The lower right list is configured by the “MA Stns” and “Regional Stns” pushbuttons. If “MA Stns” is selected, the IDs for all fixed stations associated with one or more zones/counties in the monitoring area are listed. In essence, “MA Stns” is the list of all fixed stations whose reports are monitored by SAFESEAS (i.e., players on the field). When “Regional Stns” is selected, the IDs for all the fixed stations within the regional area not currently associated with any zone or county in the monitoring area are shown. Fixed stations in the “Regional Stns” list are not monitored by SAFESEAS (i.e., they are players on the bench waiting for the call). To Add Zones/Counties from the Additional Zones list: In addition to generating a first-guess monitoring area, SAFESEAS localization also builds additional lists of zones/counties and stations outside the monitoring area, but still within the regional area (defined by the D-2D regional scale). Zones may be added to the monitoring area by selecting them from the “Additional Zones” list, then clicking the “Add” button above the list to move the selected zones into the “Monitor Area Zones” list. Zone selection capabilities are as follows:
Figure 4.2.1.1-1: Monitoring Area Editor, in zone mode.
• to select a zone, left-click on its ID. Multiple zones may be selected in this manner. • to select a contiguous range of zones within the list, first left-click on the zone ID on one
end of the desired range, and while holding down the mouse button, drag the cursor across the zone IDs in the desired range. Release the mouse button. The selected range of zones is added to any zones already selected.
• to de-select a zone, left click on its ID. De-selection can only be done one zone at a time. To Remove a Zone/County from the Monitoring Area: To remove a zone from the monitoring area, click on the zone’s ID in the “Monitor Area Zones” list. Then click the “Remove” button located between the “Monitor Area Zones” list and the “Additional Zones” list. This can only be done one zone at a time. When a zone or county is
13
removed from the monitoring area, the associated fixed stations are also removed from the list of monitored stations, except for those stations associated with another zone still contained in the monitoring area. To associate Fixed Stations with a Zone or County in the Monitoring Area: To edit the list of fixed stations associated with a zone, first double-left-click the zone’s ID in the “Monitor Area Zones” list. The stations currently associated with the zone will then be loaded into the “Associated Stations” list. The list may be empty, indicating no fixed stations are currently associated with the zone. This will be the case quite often because many marine zones have no fixed stations (fixed buoys, C-MANs, etc.) located within or near them. Note that a given station may be associated with zero, one, or several counties and zones. To associate additional stations to the zone, first select their IDs from the “MA Stns” list or the “Regional Stns” list (whichever is selected). This is done the same way you selected zones from the “Additional Zones” list to add to the monitoring area. When you are done selecting stations, click the “Add” button located below the “Associated Stations” list. To remove Fixed Stations associations from a Zone or County in the Monitoring Area: To remove the association of a fixed station to a given zone, first double-left-click the zone’s ID in the “Monitor Area Zones” list to load the stations currently associated with the zone into the “Associated Stations” list. To remove a station association from the zone, click on the station’s ID in the “Associated Stations” list, then click the “Remove” button located below the “Associated Stations” list. This can only be done one station at a time. To Define and Add Zones/Counties not present in the Additional Zones list: Zones not present in the “Additional Zones” list may be defined and added to the monitoring area. For example, for WFOs bordering on Canada or Mexico, there are no zone/county definitions available to AWIPS from which to build those portions of the first-guess monitoring area and the additional zones/counties list outside the U.S. borders. To define and add a zone to the monitoring area that is not contained in the “Monitoring Area” or “Additional Zones” lists, click the “Add a New Zone to Monitor Area” button located just below the “Additional Zones” list. This will bring up the “Add a New Zone” window (Figure 4.2.1.1-2).
14
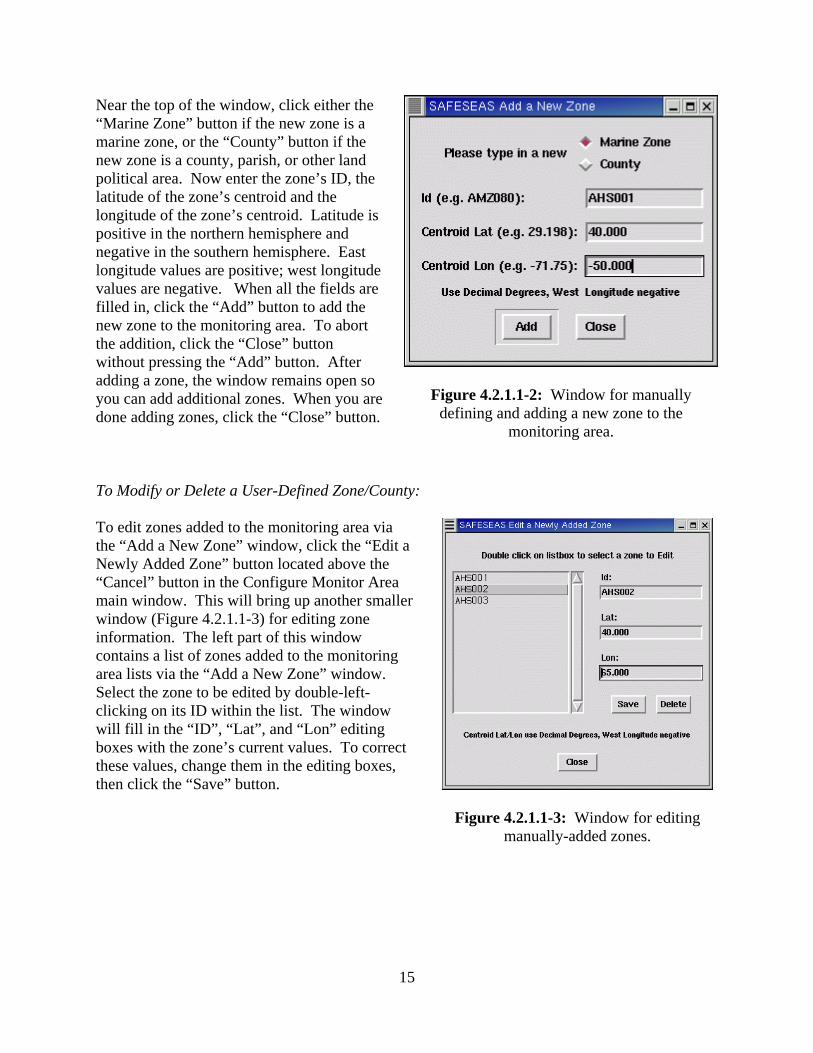
Near the top of the window, click either the “Marine Zone” button if the new zone is a marine zone, or the “County” button if the new zone is a county, parish, or other land political area. Now enter the zone’s ID, the latitude of the zone’s centroid and the longitude of the zone’s centroid. Latitude is positive in the northern hemisphere and negative in the southern hemisphere. East longitude values are positive; west longitude values are negative. When all the fields are filled in, click the “Add” button to add the new zone to the monitoring area. To abort the addition, click the “Close” button without pressing the “Add” button. After adding a zone, the window remains open so you can add additional zones. When you are done adding zones, click the “Close” button.
Figure 4.2.1.1-2: Window for manually
defining and adding a new zone to the monitoring area.
To Modify or Delete a User-Defined Zone/County: To edit zones added to the monitoring area via the “Add a New Zone” window, click the “Edit a Newly Added Zone” button located above the “Cancel” button in the Configure Monitor Area main window. This will bring up another smaller window (Figure 4.2.1.1-3) for editing zone information. The left part of this window contains a list of zones added to the monitoring area lists via the “Add a New Zone” window. Select the zone to be edited by double-left-clicking on its ID within the list. The window will fill in the “ID”, “Lat”, and “Lon” editing boxes with the zone’s current values. To correct these values, change them in the editing boxes, then click the “Save” button.
Figure 4.2.1.1-3: Window for editing
manually-added zones.
15

To delete the selected zone from both the “Monitor Area Zones” and the “Additional Zones” lists (in the parent window), click the “Delete” button. When finished deleting zones and/or editing zone information, click the “Close” button.
Caesar Cioppi says: A zone or county may be configured to be contained in the monitoring area, whether or not a fixed station is associated with the zone or county. This allows for the possibility that a mobile observation station (ship, drifting buoy) may move into the zone/county and become monitorable. A fixed station cannot be configured to be contained in the monitoring area unless it is associated to a zone or county in the area, since all monitoring thresholds are associated to zones/counties, not stations.
16

4.2.1.2 Station Mode When editing in station mode (Figure 4.2.1.2-1), the “Monitor Area Stns” list contains the IDs for all the fixed stations currently located within the monitoring area and the “Additional Stations” list includes the IDs for other fixed stations located within the regional area. The text-entry box near the upper right corner, just above the “Associated Zones” label, indicates the ID of the “active” fixed station whose associated zones list is being edited. The upper right list (the “Associated Zones” list) includes the IDs of the zones associated with the active fixed station. You have a choice as to what the lower right list is. If “MA Zones” is selected, the list includes the IDs for all the zones in the monitoring area. If “Regional Zones” is selected, the list includes the IDs for all the zones within the broader region. The contents of the lower right list are configured by the “MA Zones” and “Regional Zones” pushbuttons. If “MA Zones” is selected, the IDs for all zones/counties currently configured to be contained in the monitoring area are listed. The list of fixed stations associated with a given zone/county contained in the monitoring area may be empty. When “Regional Zones” is selected, the IDs for all the zones/counties within the regional area not currently in the monitoring area are shown. To Add Stations to the Monitoring Area: In addition to generating a first-guess monitoring area, SAFESEAS localization also builds additional lists of zones/counties and stations outside the monitoring area, but still within the regional area (defined by the D-2D regional scale). Stations may be added to the monitoring area by selecting them from the “Additional Stations” list, then clicking the “Add” button above the list to move the selected zones into
Figure 4.2.1.2-1: Monitoring Area Editor, in station
mode. 17
the “Monitor Area Stns” list. Station selection capabilities are as follows:
• to select a station, left-click on its ID. Multiple stations may be selected in this manner. • to select a contiguous range of stations within the list, first left-click on the station on one
end of the desired range, and while holding down the mouse button, drag the cursor across the stations in the desired range. Release the mouse button. The selected range of stations is added to any stations already selected.
• to de-select a station, left click on its ID. De-selection can only be done one item at a time.
To Remove a Station from the Monitoring Area: To remove a fixed station from the monitoring area, click on the station’s ID in the “Monitor Area Stns” list to select it. Then click the “Remove” button located between the “Monitor Area Stns” list and the “Additional Stations” list. This can only be done one station at a time. The removed station is disassociated from any zones in the monitoring area to which it was previously associated. To associate a Zone or County with a Fixed Station in the Monitoring Area: To edit the set of zones associated with a fixed station, first double-left-click the station’s ID in the “Monitor Area Stns” list to make the station “active”. The zones currently associated with the active station are then displayed in the “Associated Zones” list. Note the list may be empty, indicating no zones are currently associated with the station. To add zones to the set of zones associated with the station, first select from the “MA Zones” list or the “Regional Zones” list (whichever is selected) the IDs for the zones to be added. This is done the same way you selected stations from the “Additional Stations” list to add to the monitoring area. When you are done selecting zones, click the “Add” button located below the “Associated Zones” list. To remove Zone or County associations from a Station in the Monitoring Area: To remove a zone from the set of zones associated with a fixed station, click on the zone’s ID in the “Associated Zones” list. Then click the “Remove” button located below the “Associated Zones” list. This can only be done one zone at a time.
18

To Define and Add Fixed Stations not present in the Additional Stations list: To add to the monitoring area a station that is not in the “Additional Stations” list, click the “Add a New Stn to Monitor Area” button located just below the “Additional Stations” list. This will bring up an “Add a New Station” window (see figures 4.2.1.2-2 and 4.2.1.2-3). Near the top of the window, there are three buttons: a “Metar” button, a “Maritime” button, and a “Mesonet” button. Click only one of these buttons.
• Click the “Metar” button if the new station is a METAR station;
• Click the “Maritime” button if the new station is a non-mesonet buoy, C-MAN, or other stationary marine observation platform;
Figure 4.2.1.2-2: Window for adding a new
fixed station for the SAFESEAS monitoring area.
• Click the “Mesonet” button if the new station is a mesonet (land or marine) platform. Now enter the station’s ID (the ID as contained in the body of the report, e.g., KSTL, 44001, etc.). Then click the “Add” button to add the new station to the monitoring area. To abort the addition, click the “Close” button. After adding a station, the window remains open so you can add additional stations. When you are done, click the “Close” button. Note that for METAR and non-mesonet maritime stations, you should enter only the station’s ID. But for a mesonet station, you must type the station’s ID followed by the ‘#’ character and the station’s “provider” (see Figure 4.2.1.2-3). This “provider” is the name or identifier of the mesonet to which the station belongs. The “provider” must match that found for the station in file “$FXA_HOME/data/localizationDataSets/$FXA_LOCAL_SITE/mesonetStationInfo.txt”.
Figure 4.2.1.2-3: Window for adding a new fixed mesonet station for the SAFESEAS monitoring area.
19

To Delete a User-entered Station: To delete any station you added to the monitoring area via the “Add a New Station” window, click the “Delete a Newly added Station” button located above the “Cancel” button in the monitoring area editor. This will bring up a “Delete a Newly Entered Station” window (Figure 4.2.1.2-4). The left part of this window contains a list of stations added to the monitoring area via the “Add a New Station” window. To select a station to delete, click its ID in the list. To add a station to the set of stations selected for deletion, click its ID in the list. To deselect a station, click its ID in the list. To delete all selected stations, click the “Delete” button. When you are done deleting stations, click the “Close” button. A deleted station is disassociated from any zones in the monitoring area to which it was previously associated.
Figure 4.2.1.2-4: Window for deleting a newly added station.
4.2.1.3 Modifying the SAFESEAS Button Time Window Value Near the bottom of the setup window (see Fig. 4.2.1.2-1), a slider bar is located under the label “Time window (hrs). Use this slider bar to select the time widow for the monitoring button (see Fig. 3.2-1). The background color of this button will reflect the highest threat level detected within the time window.
4.2.1.4 Modifying the Ship Distance Value Near the bottom of the setup window, another slider bar located under the label “Ship Distance (Nautical Miles)”. Use this slider bar to control the distance from the nearest county/zone within which a ship report will included for monitoring. If 100 nmi is selected, for example, then ships within 100 nmi of a zone will be included among that zone’s monitored observations.
4.2.1.5 Fog Monitor Contribution to Alert Button At the bottom of the setup window, a toggle button, if selected, allows data from the Fog Monitor to influence the SAFESEAS alert button on the D-2D (the anchor button). If the Fog Monitor indicates Probable Fog, for example, the anchor will turn red. If the button is de-selected, the Fog Monitor will no longer contribute to the anchor’s color, but data will still be available in the SAFESEAS table.
20
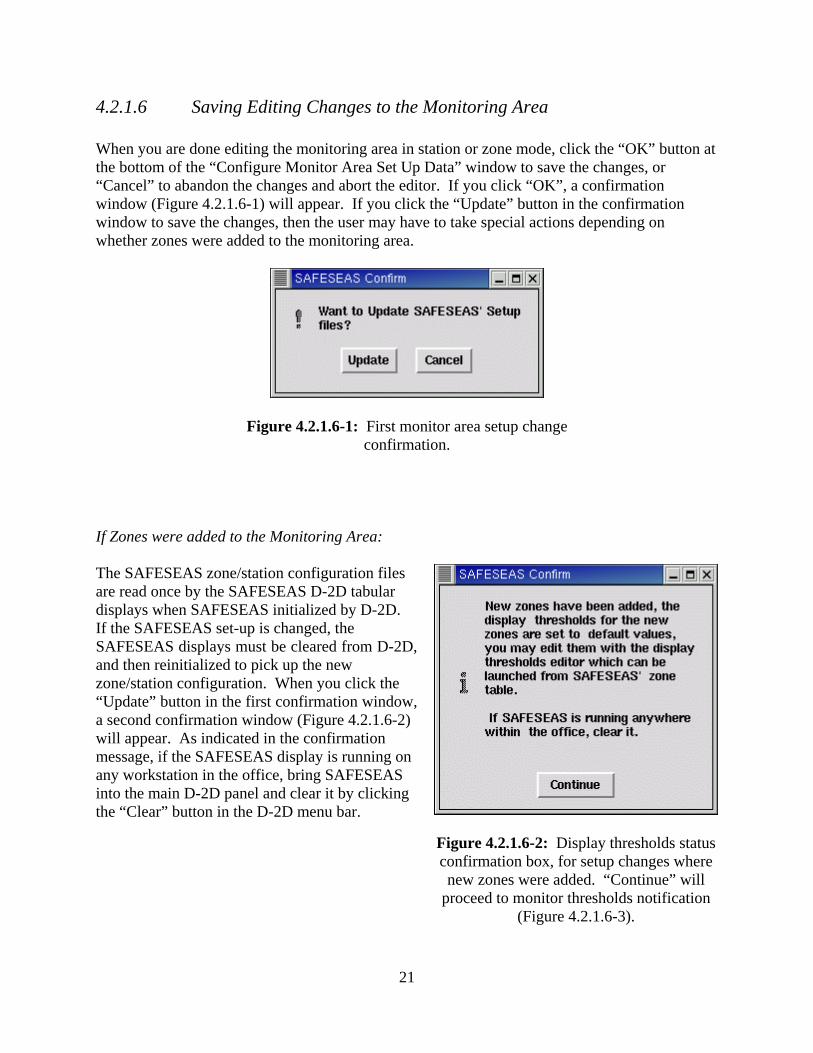
4.2.1.6 Saving Editing Changes to the Monitoring Area When you are done editing the monitoring area in station or zone mode, click the “OK” button at the bottom of the “Configure Monitor Area Set Up Data” window to save the changes, or “Cancel” to abandon the changes and abort the editor. If you click “OK”, a confirmation window (Figure 4.2.1.6-1) will appear. If you click the “Update” button in the confirmation window to save the changes, then the user may have to take special actions depending on whether zones were added to the monitoring area.
Figure 4.2.1.6-1: First monitor area setup change confirmation.
If Zones were added to the Monitoring Area: The SAFESEAS zone/station configuration files are read once by the SAFESEAS D-2D tabular displays when SAFESEAS initialized by D-2D. If the SAFESEAS set-up is changed, the SAFESEAS displays must be cleared from D-2D, and then reinitialized to pick up the new zone/station configuration. When you click the “Update” button in the first confirmation window, a second confirmation window (Figure 4.2.1.6-2) will appear. As indicated in the confirmation message, if the SAFESEAS display is running on any workstation in the office, bring SAFESEAS into the main D-2D panel and clear it by clicking the “Clear” button in the D-2D menu bar.
Figure 4.2.1.6-2: Display thresholds status confirmation box, for setup changes where new zones were added. “Continue” will
proceed to monitor thresholds notification (Figure 4.2.1.6-3).
21
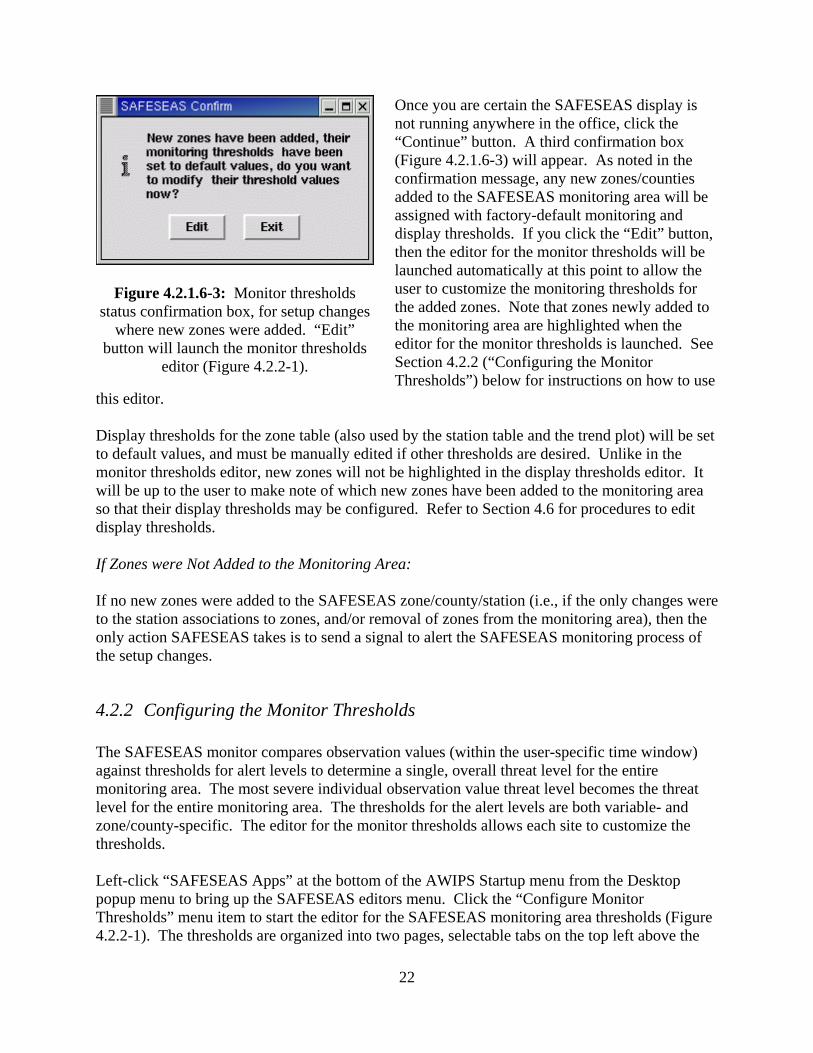
Once you are certain the SAFESEAS display is not running anywhere in the office, click the “Continue” button. A third confirmation box (Figure 4.2.1.6-3) will appear. As noted in the confirmation message, any new zones/counties added to the SAFESEAS monitoring area will be assigned with factory-default monitoring and display thresholds. If you click the “Edit” button, then the editor for the monitor thresholds will be launched automatically at this point to allow the user to customize the monitoring thresholds for the added zones. Note that zones newly added to the monitoring area are highlighted when the editor for the monitor thresholds is launched. See Section 4.2.2 (“Configuring the Monitor Thresholds”) below for instructions on how to use
this editor.
Figure 4.2.1.6-3: Monitor thresholds
status confirmation box, for setup changes where new zones were added. “Edit”
button will launch the monitor thresholds editor (Figure 4.2.2-1).
Display thresholds for the zone table (also used by the station table and the trend plot) will be set to default values, and must be manually edited if other thresholds are desired. Unlike in the monitor thresholds editor, new zones will not be highlighted in the display thresholds editor. It will be up to the user to make note of which new zones have been added to the monitoring area so that their display thresholds may be configured. Refer to Section 4.6 for procedures to edit display thresholds. If Zones were Not Added to the Monitoring Area: If no new zones were added to the SAFESEAS zone/county/station (i.e., if the only changes were to the station associations to zones, and/or removal of zones from the monitoring area), then the only action SAFESEAS takes is to send a signal to alert the SAFESEAS monitoring process of the setup changes.
4.2.2 Configuring the Monitor Thresholds The SAFESEAS monitor compares observation values (within the user-specific time window) against thresholds for alert levels to determine a single, overall threat level for the entire monitoring area. The most severe individual observation value threat level becomes the threat level for the entire monitoring area. The thresholds for the alert levels are both variable- and zone/county-specific. The editor for the monitor thresholds allows each site to customize the thresholds. Left-click “SAFESEAS Apps” at the bottom of the AWIPS Startup menu from the Desktop popup menu to bring up the SAFESEAS editors menu. Click the “Configure Monitor Thresholds” menu item to start the editor for the SAFESEAS monitoring area thresholds (Figure 4.2.2-1). The thresholds are organized into two pages, selectable tabs on the top left above the
22

table. The Meteo tab page includes wind speed, gust, peak wind, visibility, and wave height. The Swell tab page includes height, period, and direction for primary and secondary swells. Monitoring threshold levels may be set for multiple zones simultaneously, or for a single zone. Selection of zones in the monitor thresholds editor is similar to the same feature in the monitor area setup window, with additions as follows:
• to modify a meteorological threshold (such as wind speed or visibility), click on the Meteo tab at the top left of the window; to modify a swell threshold, click the “Swell” tab.
• to select a zone, left-click on its ID. Multiple zones may be selected in this manner. • to select a contiguous range of zones within the list, first left-click on the zone ID on one
end of the desired range, and while holding down the mouse button, drag the cursor across the zone IDs in the desired range. Release the mouse button. The selected range of zones is added to any zones already selected.
• to select all zones when no zones are yet selected, click the “Select All” button near the bottom of the window. This button is enabled only when no zones are currently selected.
Figure 4.2.2-1: Monitoring thresholds window.
• to de-select a zone, left click on its ID. De-selection can only be done one zone at a time. • to de-select all selected zones, click the “De-Select All” button near the bottom of the
window. This button appears only when at least one zone is already selected.
23

Once the zones have been selected, the associated thresholds may be set. Notice the one-line area that has an up and down arrow at the left end. This area shows the thresholds of the topmost zone that is selected. Click the up or down arrows to raise or lower a threshold value. Repeat this procedure for each threshold value you wish to change for the selected zones. The window will not allow a red level threshold to be set to a less hazardous value (higher or lower, depending on variable) than the yellow level threshold’s value. You also cannot set a yellow level threshold to a value more severe than the red level threshold’s value. When all the thresholds for the selected zones are set, click the “Accept” button to hold the changes until they are ready to be saved, and select the next set of zones whose thresholds are to be specified. Monitoring thresholds for primary and secondary swell directions must be handled in a special fashion. Those parameters each have “From” and “To” thresholds for red and yellow levels. Those two thresholds are used to define an arc of azimuth values which can be alerted for. There are two rules to follow when choosing these azimuthal limits:
• The “From” and “To” bearings will be assumed by SAFESEAS to be in a clockwise order. For Example: A “From” value of 359 and a “To” value of 1 will produce an arc of 2 degrees, while a “From” value of 1 and a “To” value of 359 will produce a near-circle of 358 degrees.
• The red alerting area must always be contained within the yellow alerting area. The settings will not be accepted by SAFESEAS otherwise.
Once the thresholds have been set to the desired values and accepted for all zones and variables, click the “OK” button near the bottom of the window to commit and save the editing changes. When the changes are saved by pressing OK, then:
• the old threshold values will be permanently overwritten by the new ones, • the SAFESEAS monitor will re-evaluate observations (within the user-selected time
window) using the new threshold values, update the threat level in GUARDIAN, and continue to use the new thresholds until they are changed again, and
• the threshold editor window will be closed. To abandon the changes without saving, click the “Close” button near the bottom of the window without selecting the “OK” button.
24

4.3 The SAFESEAS Application
Figure 4.3-1: D-2D Obs submenu
with SAFESEAS option.
The SAFESEAS application is launched from the “Obs” tear-away submenu (Figure 4.3-1) in the D-2D menu bar. Clicking on “SAFESEAS” at the bottom of the “Maritime” section of the “Obs” menu loads the SAFESEAS plan-view plots in the D-2D main panel, and loads the SAFESEAS zone table in its own window (Figure 4.3-2). This graphic behaves just like any other AWIPS D-2D plan-view display, such as the METAR plot. You can zoom, re-center, loop, etc. just as you can with the METAR plot. See the AWIPS User’s Manual for more information. The SAFESEAS plot consists of five AWIPS D-2D station plots packaged together, and nearly identical to their D-2D counterparts: a “METAR” plot, a “Fixed Buoys” plot, a “Moving Buoys/Ships” plot, a MAROB plot, and a “Mesonet” plot. The SAFESEAS plots differ from the D-2D plots only in that SAFESEAS plots only those reports within the office’s monitoring area, as defined by the monitoring area station setup.
A Note about METAR Specials and Corrections: Users may occasionally notice discrepancies between D-2D METAR plot data and station information in the SNOW station table. This can occur because the SNOW table will incorporate METAR special and correction reports more rapidly than will the D-2D plot.
25
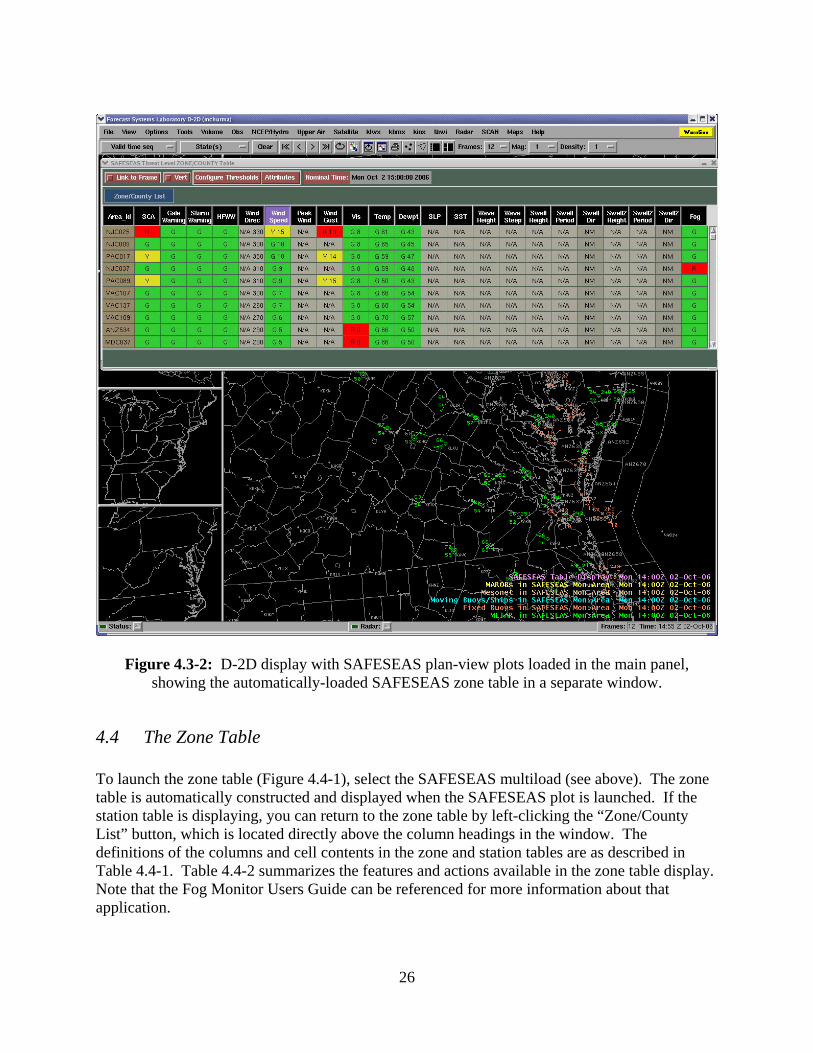
Figure 4.3-2: D-2D display with SAFESEAS plan-view plots loaded in the main panel,
showing the automatically-loaded SAFESEAS zone table in a separate window.
4.4 The Zone Table To launch the zone table (Figure 4.4-1), select the SAFESEAS multiload (see above). The zone table is automatically constructed and displayed when the SAFESEAS plot is launched. If the station table is displaying, you can return to the zone table by left-clicking the “Zone/County List” button, which is located directly above the column headings in the window. The definitions of the columns and cell contents in the zone and station tables are as described in Table 4.4-1. Table 4.4-2 summarizes the features and actions available in the zone table display. Note that the Fog Monitor Users Guide can be referenced for more information about that application.
26
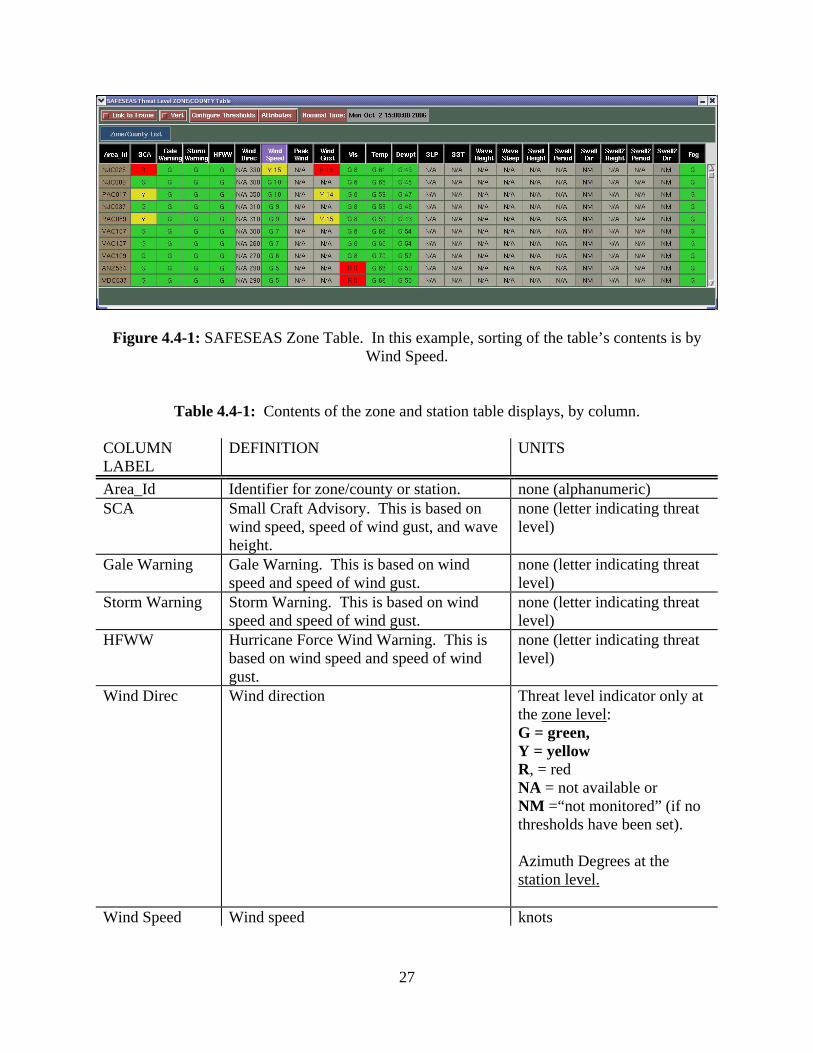
Figure 4.4-1: SAFESEAS Zone Table. In this example, sorting of the table’s contents is by
Wind Speed.
Table 4.4-1: Contents of the zone and station table displays, by column. COLUMN LABEL
DEFINITION UNITS
Area_Id Identifier for zone/county or station. none (alphanumeric) SCA Small Craft Advisory. This is based on
wind speed, speed of wind gust, and wave height.
none (letter indicating threat level)
Gale Warning Gale Warning. This is based on wind speed and speed of wind gust.
none (letter indicating threat level)
Storm Warning Storm Warning. This is based on wind speed and speed of wind gust.
none (letter indicating threat level)
HFWW Hurricane Force Wind Warning. This is based on wind speed and speed of wind gust.
none (letter indicating threat level)
Wind Direc Wind direction Threat level indicator only at the zone level: G = green, Y = yellow R, = red NA = not available or NM =“not monitored” (if no thresholds have been set). Azimuth Degrees at the station level.
Wind Speed Wind speed knots
27
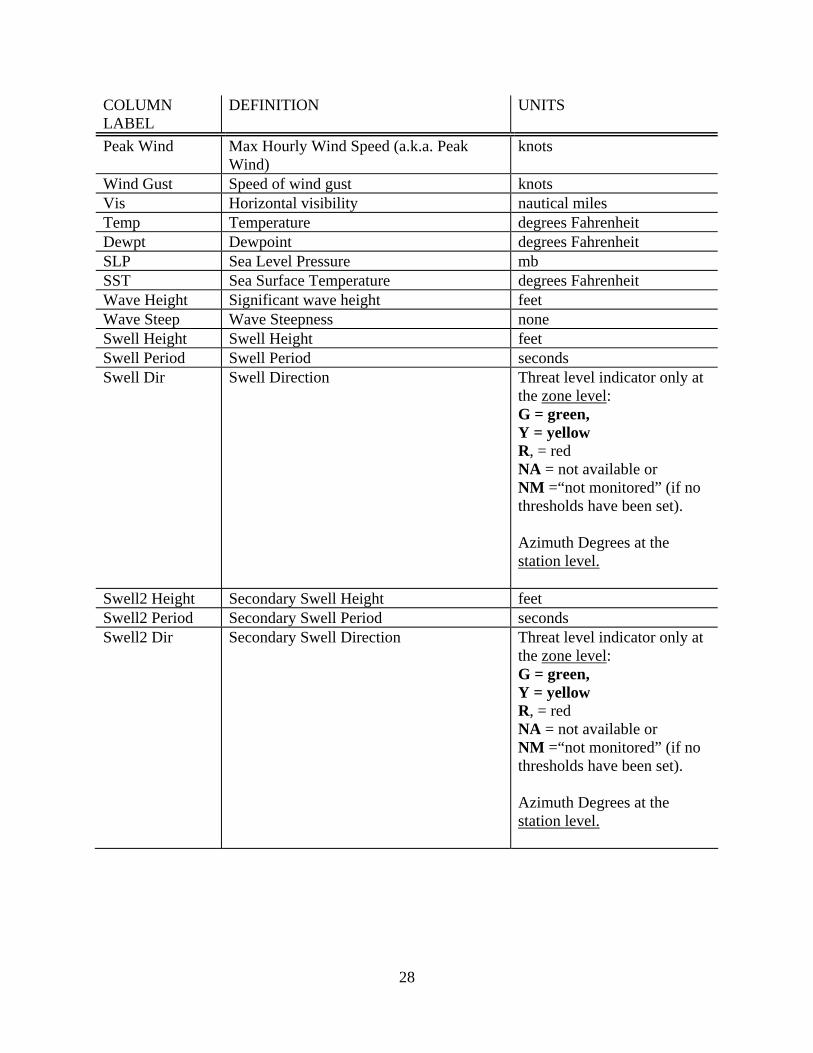
COLUMN LABEL
DEFINITION UNITS
Peak Wind Max Hourly Wind Speed (a.k.a. Peak Wind)
knots
Wind Gust Speed of wind gust knots Vis Horizontal visibility nautical miles Temp Temperature degrees Fahrenheit Dewpt Dewpoint degrees Fahrenheit SLP Sea Level Pressure mb SST Sea Surface Temperature degrees Fahrenheit Wave Height Significant wave height feet Wave Steep Wave Steepness none Swell Height Swell Height feet Swell Period Swell Period seconds Swell Dir Swell Direction Threat level indicator only at
the zone level: G = green, Y = yellow R, = red NA = not available or NM =“not monitored” (if no thresholds have been set). Azimuth Degrees at the station level.
Swell2 Height Secondary Swell Height feet Swell2 Period Secondary Swell Period seconds Swell2 Dir Secondary Swell Direction Threat level indicator only at
the zone level: G = green, Y = yellow R, = red NA = not available or NM =“not monitored” (if no thresholds have been set). Azimuth Degrees at the station level.
28

COLUMN LABEL
DEFINITION UNITS
Fog Fog Monitor worst-case zone output Threat level indicator only at the zone level: G = green, Y = yellow R, = red NA = not available or NM =“not monitored” (if no thresholds have been set). No data available (NA) at the station level.
Table 4.4-2: Features and Action options for the zone table display.
Link to Frame Clicking the “Link to Frame” button toggles link-to-frame behavior.
When link-to-frame is active, the nominal time in the zone and station tables always matches the valid time in the D-2D frame, and the data in the tables animates with the D-2D looping. Otherwise, the nominal time of the zone table remains unchanged at the last frame time in the D-2D display, until either you cause the table to be redrawn, or the D-2D frame advances to a new nominal hour valid time. No matter what the “Link to Frame” mode is, the zone table will auto-update to display new data in the current frame(s), and/or with a new frame time when the next hour’s observation data begins to become available.
Configure Thresholds Left-clicking the “Configure Thresholds” button near the top of the window brings up the editor for the display thresholds. Refer to Section 4.6.
Zone Detail Left-clicking on a zone ID (in the first (leftmost) column) causes the SAFESEAS plots to zoom in and re-center on the selected zone, and the zone table to be replaced by a station table (a table showing threat levels and variable values for the latest report for each station in the zone). Refer to Section 4.5 for the station table.
(Zoom/Recenter D-2D, and show station table)
Sort by Threat Level Left-clicking on a product or variable name causes the table to be sorted by the threat levels in that column. Zones are first sorted into decreasing order based on the selected product’s or variable’s threat level values. Zones with the same threat level for the selected column are secondarily sorted alphabetically by zone ID.
29
Vert Selecting this button will cause the Zone Table to align itself vertically, with the highest-ranking values on the left hand side. De-selecting the button will cause the table to realign itself back to its horizontal configuration. See Figure 4.4-2.
Attributes This button will allow users to enable or disable the display of individual attributes in the SAFESEAS table. Note that all the attributes appear by default when the table is first loaded (see Figure 4.4-3).
Resize Table Users can grab the bottom of the table with the mouse to resize the table to alter the number of visible row (see Figure 4.4-3). This feature, along with the Attributes button, will enable users to have greater control over the size of the SAFESEAS pane.
Cursor-Sample Area Name Scrolling the cursor over the Area ID’s will reveal popup text that
provides the name of the encoded zone/county.
30

Figure 4.4-2: SAFESEAS Zone Table, in vertical mode (Vert button active). In this example, sorting of the table’s contents is by Wind Speed, with highest values on the left.
Figure 4.4-3: SAFESEAS Zone Table. The swell attributes have been removed via the attributes menu (invoked by clicking the Attributes button). The table also has been resized in the vertical direction (showing more zones) by grabbing the bottom edge and dragging it.
4.5 The Station Table To launch the station table (Figure 4.5-1), left-click on the zone ID in the first (leftmost) column of the zone table. Only those stations associated in the monitoring area with the selected zone will be shown in the station table. Table 4.5-1 summarizes the features and actions available in the station table display.
31

Figure 4.5-1: SAFESEAS Station Table. As shown, the table is sorted by Area ID. Right-
clicking on a cell in the table will launch a 24-hour trend (meteogram) plot (see figures 4.5.1-1, 4.5.1-2, and 4.5.1-3) for the station and the product or variable corresponding to the cell.
Table 4.5-1: Features and Action options for the station table display. Link to Frame Clicking the “Link to Frame” button toggles link-to-frame behavior.
When link-to-frame is active, the nominal time in the zone and station tables always matches the valid time in the D-2D frame, and the data in the tables animates with the D-2D looping. Otherwise, the nominal time of the station table remains unchanged at the last frame time in the D-2D display, until either you cause the table to be redrawn, or the D-2D frame advances to a new nominal hour valid time.
Zoom/Recenter D-2D Left-clicking on a station ID in the “Area ID” column causes the SAFESEAS plots to zoom in and re-center on the selected station.
Configure Thresholds This feature is inactive at the station level, since the display thresholds are configured on a zone by zone or county by county basis.
Sort by Threat Level Left-clicking on a product or variable name causes the table to be sorted by the threat levels in that column. Stations are first sorted into decreasing order based on the selected product’s or variable’s threat level values. Stations with the same threat level for the selected column are secondarily sorted alphabetically by station ID.
Display Trend Right-clicking on a threat-level cell within the table produces a 24-hour trend for the station and variable/product corresponding to the cell. See Section 4.5.1.
Revert to Zone Table The “Zone/County” button immediately above the column headings in the station table indicates which zone or county’s stations are being displayed in the table. Left click on this button to return to the zone table mode.
32

Vert Selecting this button will cause the Zone Table to align itself vertically, with the highest-ranking values on the left hand side. De-selecting the button will cause the table to realign itself back to its horizontal configuration.
Attributes This button will allow users to enable or disable the display of individual attributes in the SAFESEAS table.
Resize Table Users can grab the bottom of the table with the mouse to resize the table to alter the number of visible row (see Figure 4.4-3). This feature, along with the Attributes button, will enable users to have greater control over the size of the SAFESEAS pane.
Cursor-Sample Area Name Scrolling the cursor over the Area ID’s will reveal popup text that
provides the name of the encoded zone/county.
4.5.1 The Trend Plot A trend can only be launched from the station table (Figure 4.5-1). Within the station table, right-click on the cell in the row/column corresponding to the station and variable or product of interest. The trend plot for the selected data will be displayed. When you are finished viewing the plot, click the “Close” button below the graph.
Figure 4.5.1-1: Trend plot for a variable (wind speed in the example shown).
A variable’s trend (Figure 4.5.1-1) is a plot (meteogram) of the selected variable’s values versus time for the past 24 hours. The background of the plot is colored to show where the plotted values lay within the display table’s threat levels. Dots representing individual
33
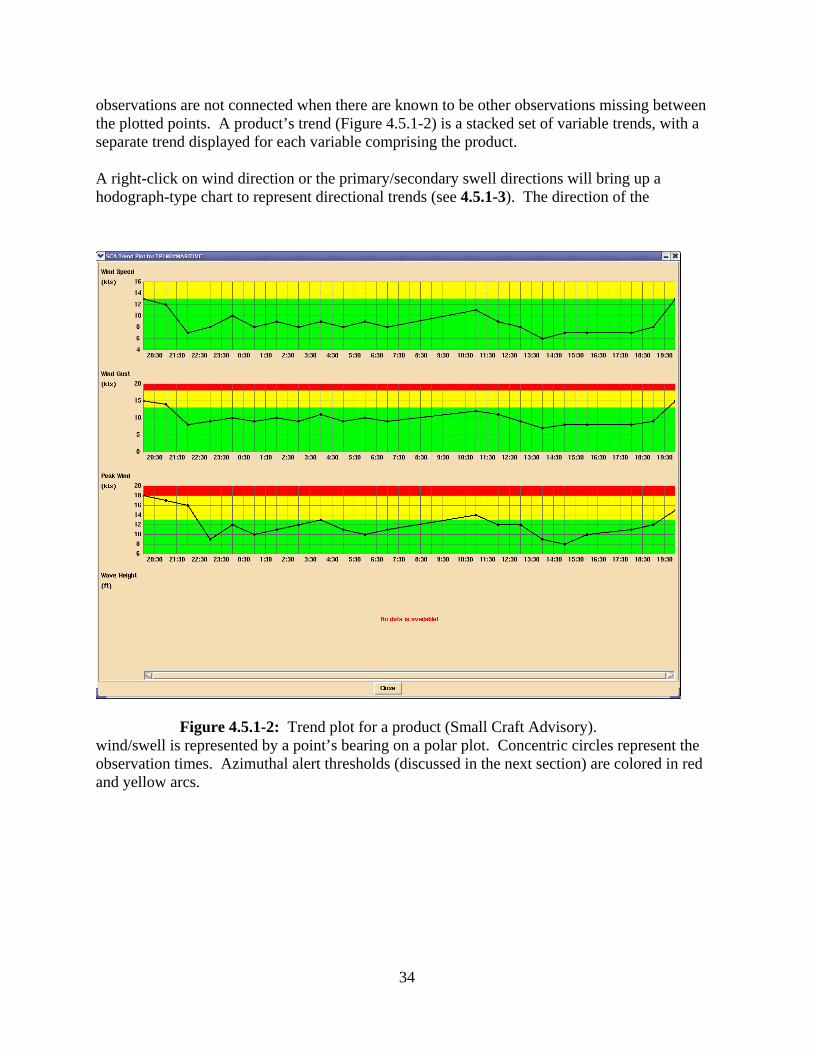
observations are not connected when there are known to be other observations missing between the plotted points. A product’s trend (Figure 4.5.1-2) is a stacked set of variable trends, with a separate trend displayed for each variable comprising the product. A right-click on wind direction or the primary/secondary swell directions will bring up a hodograph-type chart to represent directional trends (see 4.5.1-3). The direction of the
wind/swell is represented by a point’s bearing on a polar plot. Concentric circles represent the observation times. Azimuthal alert thresholds (discussed in the next section) are colored in red and yellow arcs.
Figure 4.5.1-2: Trend plot for a product (Small Craft Advisory).
34

Figure 4.5.1-3: Trend plot for a wind direction. The outermost circle represents the latest time. The points indicate that the winds have mostly been coming from the W-WNW direction. The yellow threat area ranges from about 225 to 345 degrees. The red threat area is always contained inside the yellow area.
4.5.2 Observation History Table. In the SAFESEAS stations table, right-clicking on a station ID will produce a 24 hour observation history (OH) table (see Fig 4.5.2-1). The appearance of the table will depend on the type of station being interrogated. Maritime stations, for example, will have wave information, while METARS stations will not. The user can choose the fields that will appear by clicking on
35
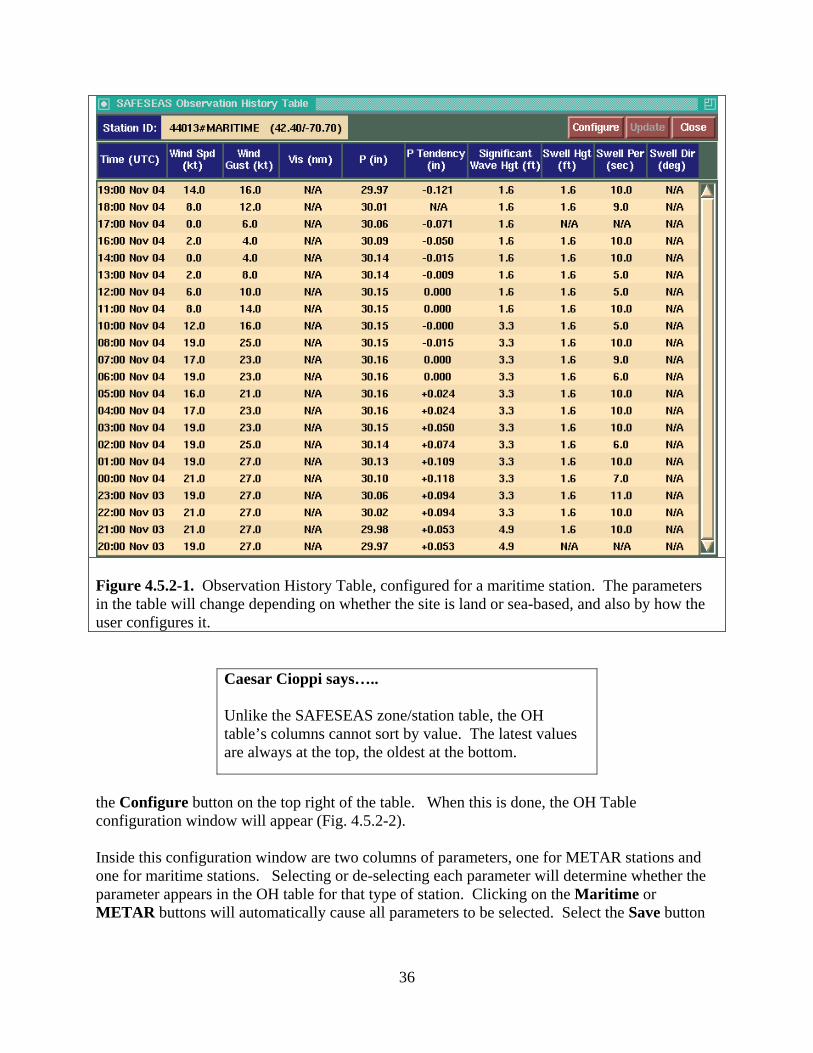
Figure 4.5.2-1. Observation History Table, configured for a maritime station. The parameters in the table will change depending on whether the site is land or sea-based, and also by how the user configures it.
Caesar Cioppi says….. Unlike the SAFESEAS zone/station table, the OH table’s columns cannot sort by value. The latest values are always at the top, the oldest at the bottom.
the Configure button on the top right of the table. When this is done, the OH Table configuration window will appear (Fig. 4.5.2-2). Inside this configuration window are two columns of parameters, one for METAR stations and one for maritime stations. Selecting or de-selecting each parameter will determine whether the parameter appears in the OH table for that type of station. Clicking on the Maritime or METAR buttons will automatically cause all parameters to be selected. Select the Save button
36
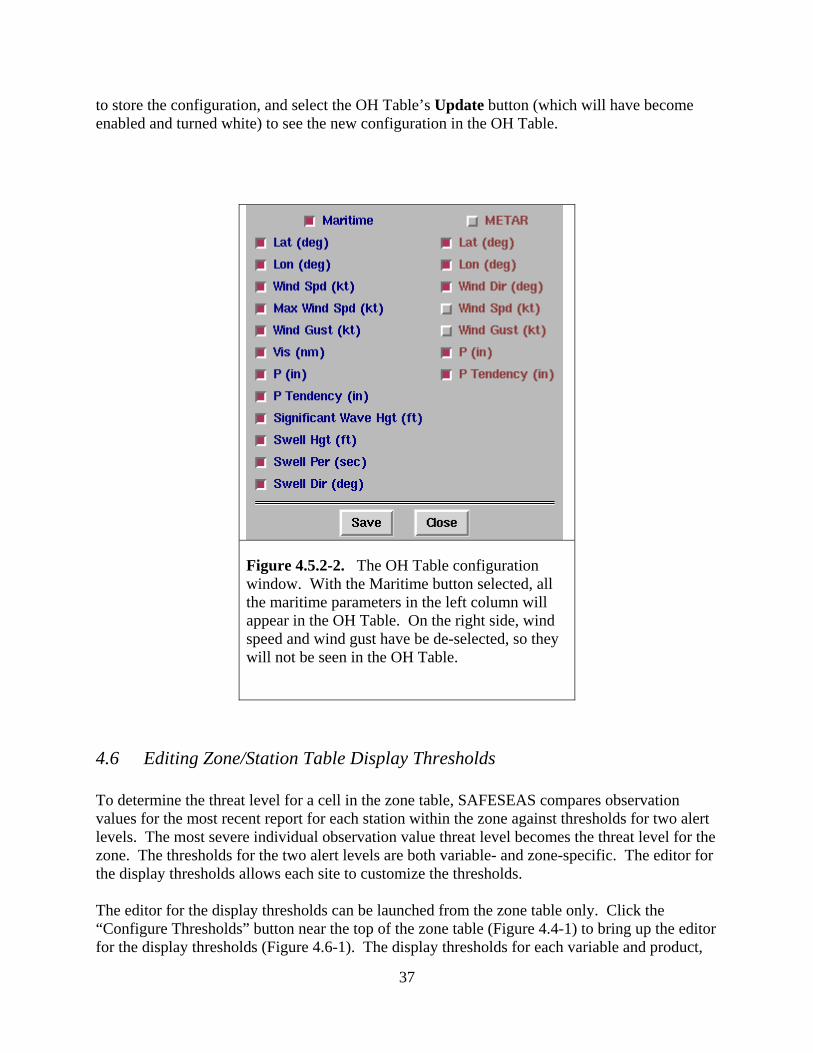
to store the configuration, and select the OH Table’s Update button (which will have become enabled and turned white) to see the new configuration in the OH Table.
Figure 4.5.2-2. The OH Table configuration window. With the Maritime button selected, all the maritime parameters in the left column will appear in the OH Table. On the right side, wind speed and wind gust have be de-selected, so they will not be seen in the OH Table.
4.6 Editing Zone/Station Table Display Thresholds To determine the threat level for a cell in the zone table, SAFESEAS compares observation values for the most recent report for each station within the zone against thresholds for two alert levels. The most severe individual observation value threat level becomes the threat level for the zone. The thresholds for the two alert levels are both variable- and zone-specific. The editor for the display thresholds allows each site to customize the thresholds. The editor for the display thresholds can be launched from the zone table only. Click the “Configure Thresholds” button near the top of the zone table (Figure 4.4-1) to bring up the editor for the display thresholds (Figure 4.6-1). The display thresholds for each variable and product,
37

for each zone in the monitoring area, are shown in the scrolling list in the center of the editor. To conserve space, the thresholds have been organized into multiple pages, with the selectable tabs for each page above the top left corner of a table:
• The Product page includes thresholds for Small Craft Advisory, Gale Warning, Storm Warning, and Hurricane Force Wind Warning products.
• The Wind page includes Wind Speed, Wind Gust, Peak Wind, and Wind Direction. • The Meteo page includes Visibility, Temperature, Dewpoint, Sea Surface Temperature,
Wave Height, and Wave Steepness. • The Swell page includes Height, Period, and Direction for Primary and Secondary swells.
To change display threshold values, first choose one of the pages above. Then select the zones to which the new threshold values will apply.
• to select a zone, left-click on its ID. Multiple zones may be selected in this manner. • to select a contiguous range of zones within the list, first left-click on the zone ID on one
end of the desired range, and while holding down the mouse button, drag the cursor across the zone IDs in the desired range. Release the mouse button. The selected range of zones is added to any zones already selected.
• to select all zones when no zones are yet selected, click the “Select All” button near the bottom of the window. This button is enabled only when no zones are currently selected.
• to de-select a zone, left click on its ID. De-selection can only be done one zone at a time. • to de-select all selected zones, click the “De-Select All” button near the bottom of the
window. This button appears only when at least one zone is already selected.
Figure 4.6-1: Threshold editor for the SAFESEAS zone/station table displays. Editor is shown
with the Product tab activated.
38

Once the desired zone(s) are selected, set their thresholds. In the row of threshold values below the zone thresholds scrolling list, click on the threshold value you wish to change. Then click the up or down arrows (on left edge of the thresholds) to change the threshold’s value. Repeat this procedure for each threshold value you wish to change for the selected zones. The editor will not allow you to set a red level threshold to a value less hazardous than the yellow level threshold’s value. You also cannot set a yellow level threshold to a value more severe than the red level threshold’s value. Setting thresholds for primary and secondary swell directions must be handled in a special fashion. Those parameters each have “From” and “To” columns for red and yellow levels. The "From/To" selections are used to define an arc of azimuth values which will be colored in red or yellow on the trend hodograph. The swell direction cells in the station table will take on the red/yellow colors if the values lay inside those arcs. As was discussed in section 4.2.2, there are two rules to follow when choosing these azimuthal limits:
• The “From” and “To” bearings will be assumed by SAFESEAS to be in a clockwise order. For Example: A “From” value of 359 and a “To” value of 1 will produce an arc of 2 degrees, while a “From” value of 1 and a “To” value of 359 will produce a near-circle of 358 degrees.
• The red alerting area must always be contained within the yellow alerting area. The settings will otherwise not be accepted by SAFESEAS.
When all the thresholds for the variables’ threat levels are as desired, click the “Accept” button to change the values for the selected zones in the scrolling zone thresholds list. Previewing Threshold Changes: To get a preview of how the new thresholds will affect the zone table, click the “Apply” button. The zone table will be redrawn with threat levels based on the new threshold values, but the editor will remain open for further editing. Clicking the “Apply & Close” button will cause the zone table to be redrawn with threat levels based on the new threshold values, and close the editor. Note that changes made to threshold values in this manner are not saved permanently. Pressing “Close” will close the editor without applying any changes that have not yet been applied.
39

Permanently Saving Display Threshold Changes: Multiple sets of customized display thresholds may be saved, recalled, and deleted. For these capabilities, use the File menu options accessed on the menu bar of the editor. The “File” menu offers the following actions: Open Open a file holding an existing set of thresholds and load the set into the
editor. Save As A list of display threshold file names is presented. Select an existing file
name from the list, or enter a new file name manually. The threshold values displayed in the editor are saved in the user-specified file.
Select As Default
A list of display threshold file names is presented. Select a file name from the list, or enter a file name manually. The threshold values stored in the selected file will be the threshold values subsequently used each time the zone table is launched. The threshold values in the selected file are not loaded into editor.
Load Default The threshold values in the display thresholds file currently specified to be the default are loaded into editor.
Delete Permanently delete a display thresholds file. Select a file name from the list, or enter the file name manually.
Exit Closes the editor without saving or applying any additional editing changes.
Caesar Cioppi says: None of the “File” menu actions affect a currently-displayed zone table until either the “Accept” button or “Accept & Close” button is clicked.
When new Zones/Counties have been added to the Monitoring Area: As noted in Section 4.2.1.6, default display thresholds for each product and variable are assigned to any new zone or county added to the monitoring area via the monitor area editor. If different display thresholds are desired, they must be manually changed by opening the file containing the display thresholds data set, editing the display thresholds for each newly-added zone and county, and then saving the file under the desired name. This process must be repeated separately for each display thresholds file when the default display thresholds are to be modified.
40

5 Getting Help To report problems or ask questions about the operation of SAFESEAS in general, please use the SAFESEAS list server. To join the SAFESEAS list server: 1. Go to “http://infolist.nws.noaa.gov/read/login/” 2. Select "all forums". 3. Scroll down to the SAFESEAS list, and click "subscribe" on the right column. 4. Enter your email address, name, and password. Your membership will be approved by the list administrator, and then once approved, you can send, view, and receive messages. Please visit the SAFESEAS homepage at: “http://www.nws.noaa.gov/mdl/safeseas” for more information, including the latest SAFESEAS news, troubleshooting tips, and version release information.
41