safety and accident reduction transparencies 2003 eu-funded urban transport research project results...
TRANSCRIPT
SAFETY AND ACCIDENT REDUCTION
SAFETY AND ACCIDENT REDUCTION
Transparencies 2003
EU-funded Urban Transport Research Project Results
www.eu-portal.net
TRANSPORT TEACHING MATERIAL
SAFETY AND ACCIDENT REDUCTION
OVERVIEW
• Introduction
• Safety and Accident Reduction
• Engineering
• Enforcement
• Education
• National differences
• Examples and study sites
SAFETY AND ACCIDENT REDUCTION
DEFINITION
What is a ‘safe trip’?
Classification of safety-measures:
• engineering
• education
• enforcement
• without any accident
• without unsafe feelings
SAFETY AND ACCIDENT REDUCTION
ROAD SAFETY AUDIT (SAFESTAR)
Procedure:
Identify potential safety problems before a new road is open to traffic
• Collection of all relevant information
• Report on the findings
• Systematic and detailed check of each element of the design
SAFETY AND ACCIDENT REDUCTION
URBAN SAFETY MANAGEMENT (Dumas)
method to reduce accident casualties in a town or city
developed for ‘scattered accidents’
an area-wide, structured safety approach that integrates different disciplines
• other policies influencing safety
• safety strategy
SAFETY AND ACCIDENT REDUCTION
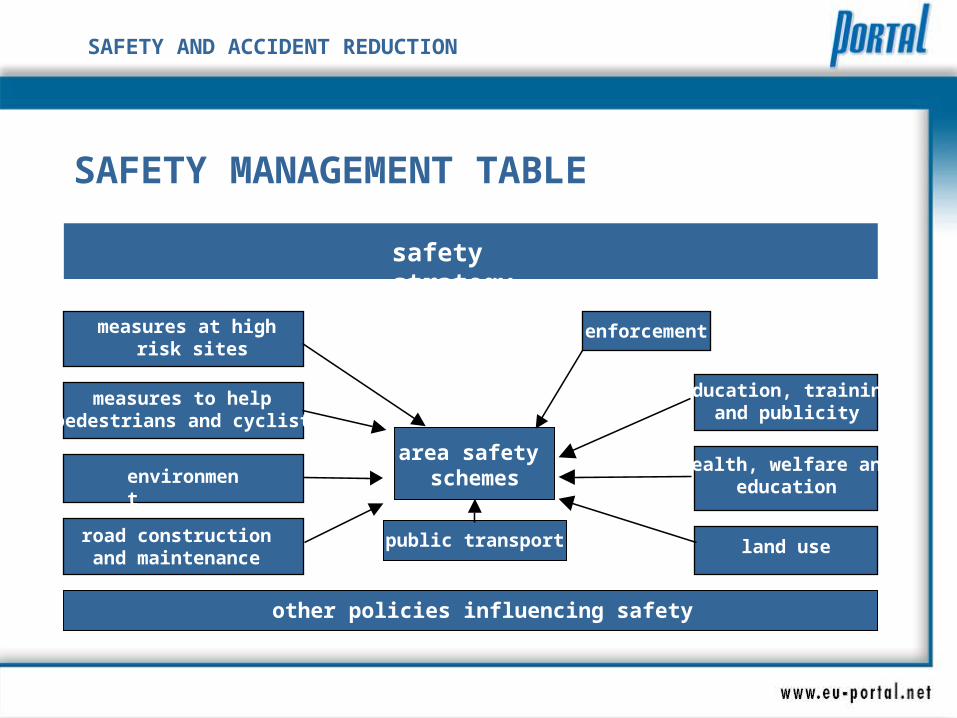
SAFETY MANAGEMENT TABLE
measures to help pedestrians and cyclists
road constructionand maintenance
other policies influencing safety
safety strategy
measures at high risk sites
enforcement
education, trainingand publicity
environmentarea safety
schemeshealth, welfare and
education
public transport land use
SAFETY AND ACCIDENT REDUCTION
MODIFICATIONS TO ROAD ENVIRONMENT
(Gadget)
Driver behaviour is governed by drivers’ expectations, based on information from the environment
Three-level hierarchy of driver behaviour:
• Macroperformance (navigation)
• Situational performance (guidance)
• Microperformance (control)
SAFETY AND ACCIDENT REDUCTION
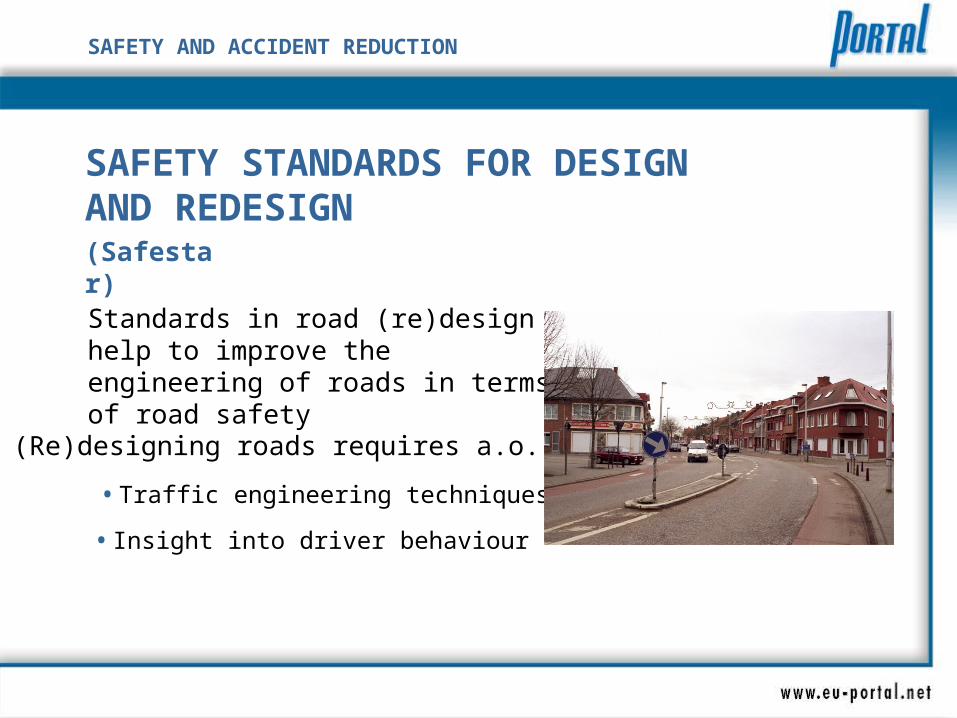
SAFETY STANDARDS FOR DESIGN AND REDESIGN (Safestar)
Standards in road (re)design help to improve the engineering of roads in terms of road safety
(Re)designing roads requires a.o.:
• Traffic engineering techniques
• Insight into driver behaviour
SAFETY AND ACCIDENT REDUCTION
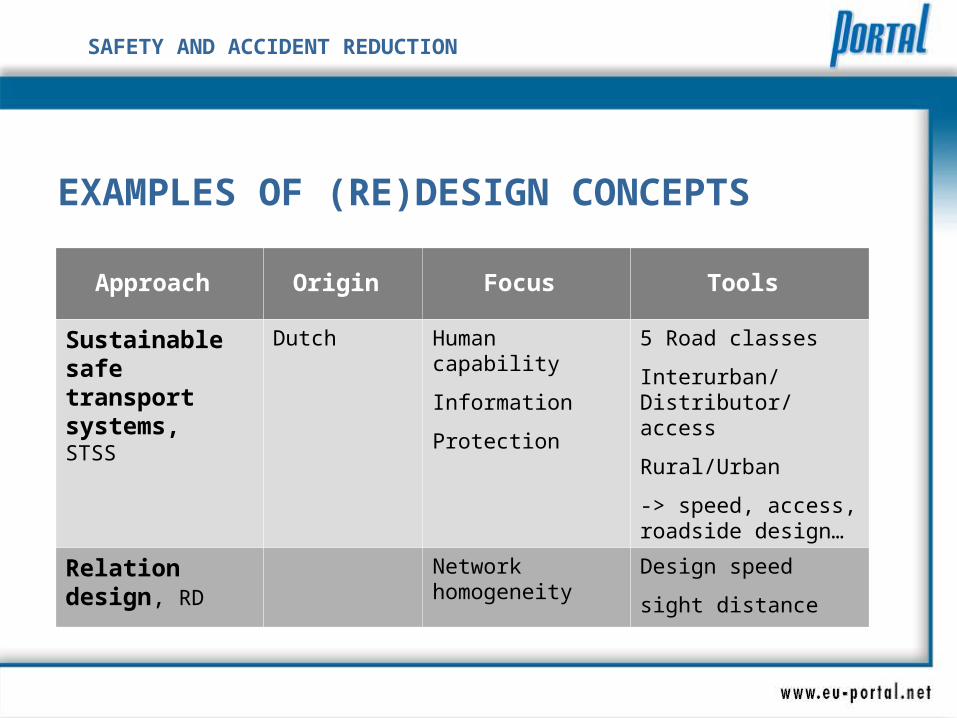
EXAMPLES OF (RE)DESIGN CONCEPTS
Approach Origin Focus Tools
Sustainable safe transport systems, STSS
Dutch Human capability
Information
Protection
5 Road classes
Interurban/Distributor/ access
Rural/Urban
-> speed, access, roadside design…
Relation design, RD
Network homogeneity
Design speed
sight distance
SAFETY AND ACCIDENT REDUCTION
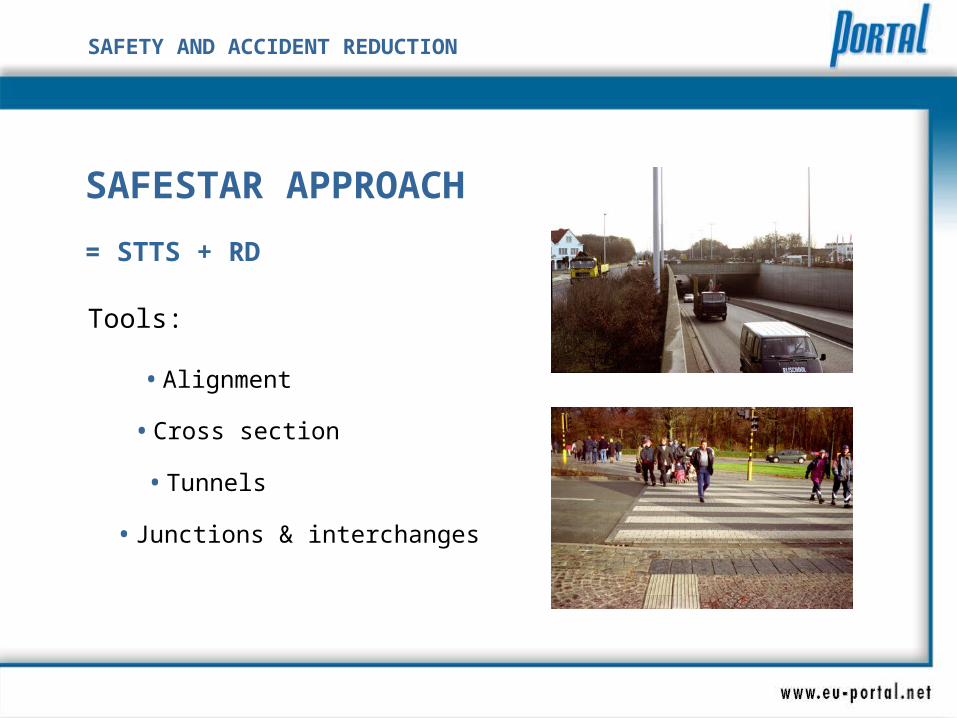
SAFESTAR APPROACH
= STTS + RD
Tools:
• Alignment
• Cross section
• Tunnels
• Junctions & interchanges
SAFETY AND ACCIDENT REDUCTION
ROAD DESIGN AND SPEED
Proper road design voluntary decrease of speed (Master, 1998 )
Self Explaining Roads (SER) (Master, 1998):
• Function and use match (also in user’s head)
SAFETY AND ACCIDENT REDUCTION
SAFETY MEASURES AND PROCEDURES FOR WORK ZONES
• Special safety consideration
• 4 main categories:
• physical design:
• traffic control
• road equipment
• other
SAFETY AND ACCIDENT REDUCTION
SAFETY MEASURES AND PROCEDURES FOR WORK ZONES
• Information near work zones
• Road work zone implementation:
• involves many actors
• 5 phases of implementation: planning, design, installation, operation, removal (Arrows 1998)
• Regulation & enforcement near work zones
• Protection
SAFETY AND ACCIDENT REDUCTION
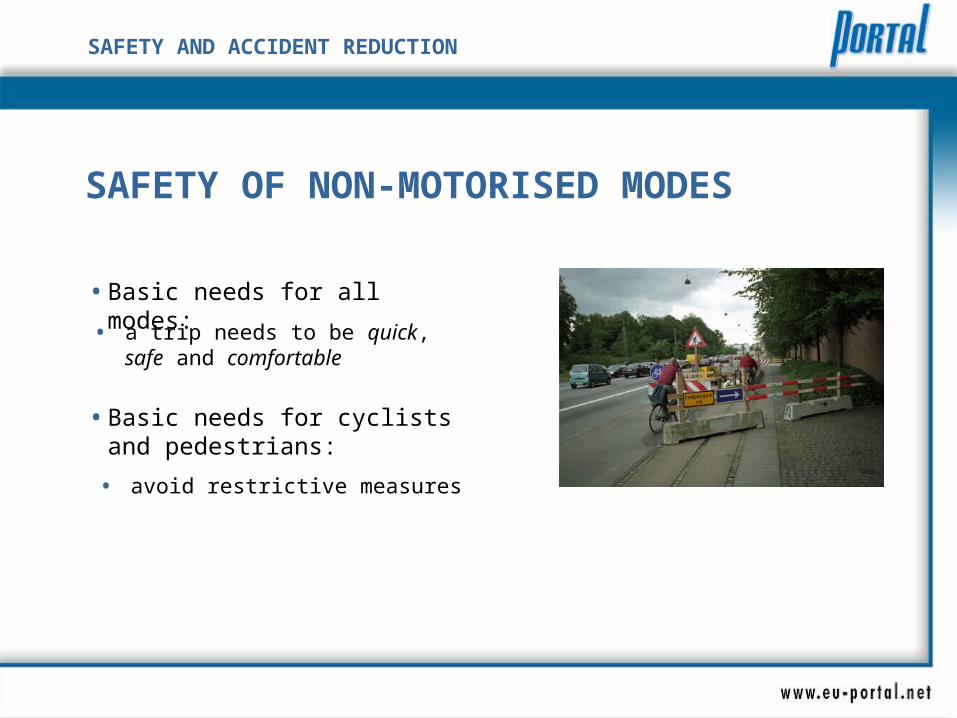
SAFETY OF NON-MOTORISED MODES
• Basic needs for cyclists and pedestrians:
• a trip needs to be quick, safe and comfortable
• Basic needs for all modes:
• avoid restrictive measures
SAFETY AND ACCIDENT REDUCTION
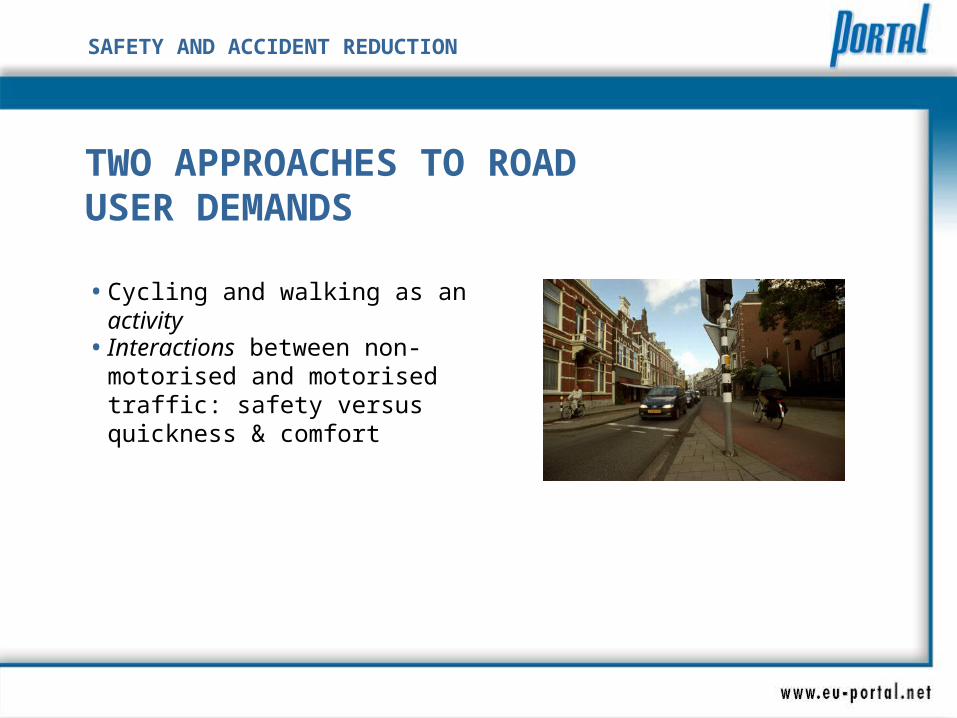
TWO APPROACHES TO ROAD USER DEMANDS
• Interactions between non-motorised and motorised traffic: safety versus quickness & comfort
• Cycling and walking as an activity
SAFETY AND ACCIDENT REDUCTION
OPTIMISING INFRASTRUCTURE
• Criteria for optimising efficient and safe cycling / walking on 4 levels of infrastructure:
• network
• routes
• road sections
• other
SAFETY AND ACCIDENT REDUCTION
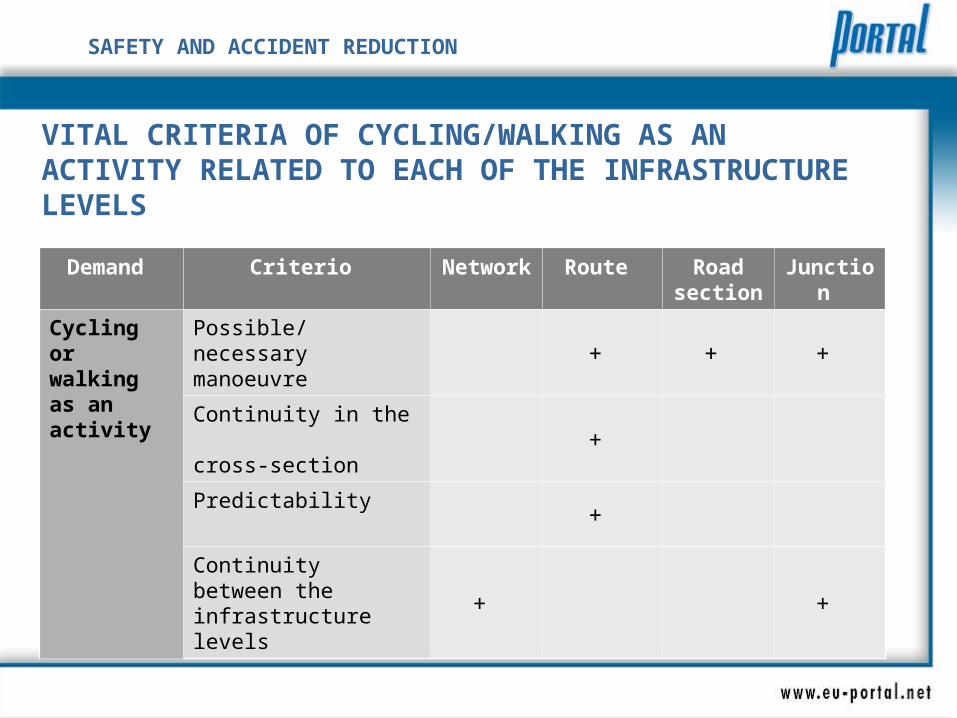
VITAL CRITERIA OF CYCLING/WALKING AS AN ACTIVITY RELATED TO EACH OF THE INFRASTRUCTURE LEVELS
Demand Criterio Network Route Road section
Junction
Cycling or walking as an activity
Possible/necessary manoeuvre + + +
Continuity in the cross-section +
Predictability +
Continuity between the infrastructure levels + +
SAFETY AND ACCIDENT REDUCTION
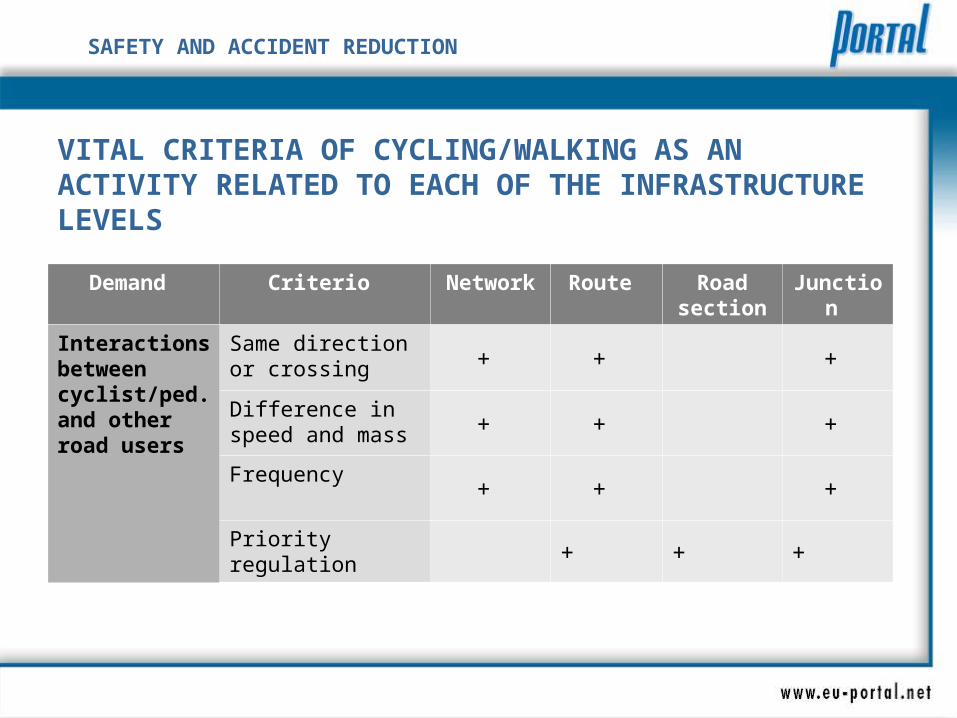
VITAL CRITERIA OF CYCLING/WALKING AS AN ACTIVITY RELATED TO EACH OF THE INFRASTRUCTURE LEVELS
Demand Criterio Network Route Road section
Junction
Interactions between cyclist/ped. and other road users
Same direction or crossing + + +
Difference in speed and mass + + +
Frequency + + +
Priority regulation + + +
SAFETY AND ACCIDENT REDUCTION
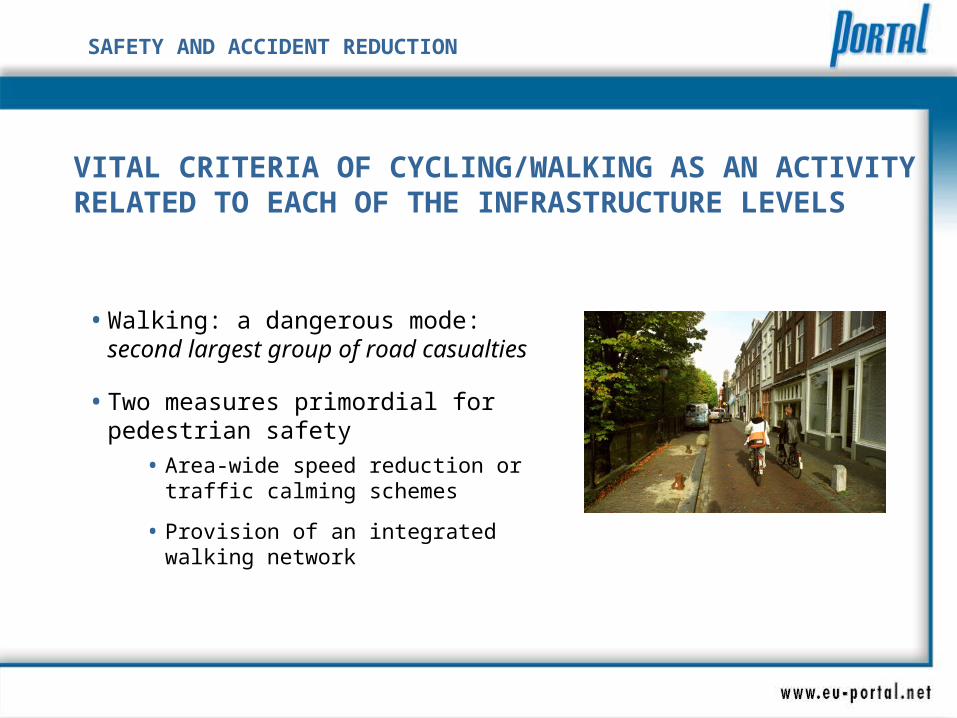
VITAL CRITERIA OF CYCLING/WALKING AS AN ACTIVITY RELATED TO EACH OF THE INFRASTRUCTURE LEVELS
• Walking: a dangerous mode: second largest group of road casualties
• Two measures primordial for pedestrian safety
• Area-wide speed reduction or traffic calming schemes
• Provision of an integrated walking network
SAFETY AND ACCIDENT REDUCTION
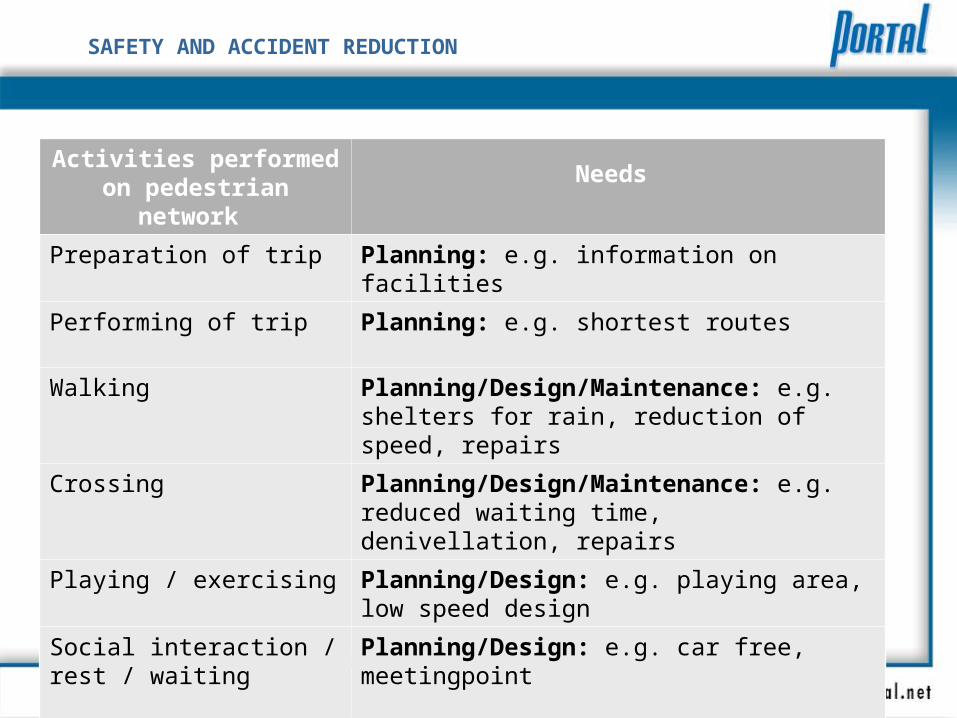
Activities performed on pedestrian network
Needs
Preparation of trip Planning: e.g. information on facilities
Performing of trip Planning: e.g. shortest routes
Walking Planning/Design/Maintenance: e.g. shelters for rain, reduction of speed, repairs
Crossing Planning/Design/Maintenance: e.g. reduced waiting time, denivellation, repairs
Playing / exercising Planning/Design: e.g. playing area, low speed design
Social interaction / rest / waiting
Planning/Design: e.g. car free, meetingpoint
SAFETY AND ACCIDENT REDUCTION
• Cycling: some general remarks
• Risk per cycled km decreases as exposure increases
• Non-fatal injuries under-reported (Promising, 2001)
SAFETY AND ACCIDENT REDUCTION
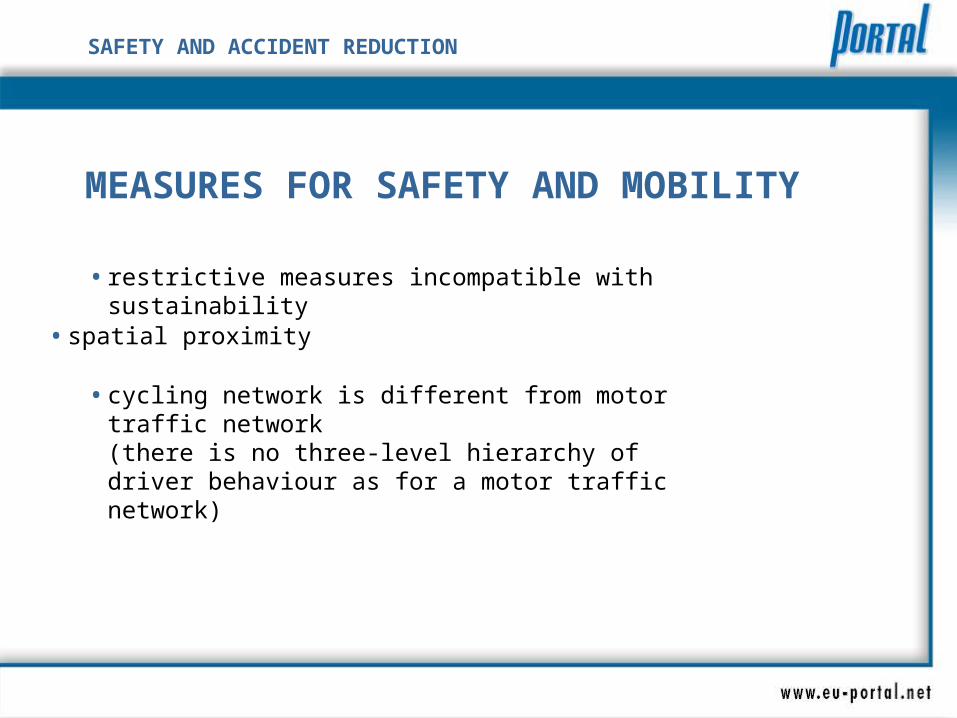
MEASURES FOR SAFETY AND MOBILITY
• restrictive measures incompatible with sustainability
• spatial proximity
• cycling network is different from motor traffic network (there is no three-level hierarchy of driver behaviour as for a motor traffic network)
SAFETY AND ACCIDENT REDUCTION
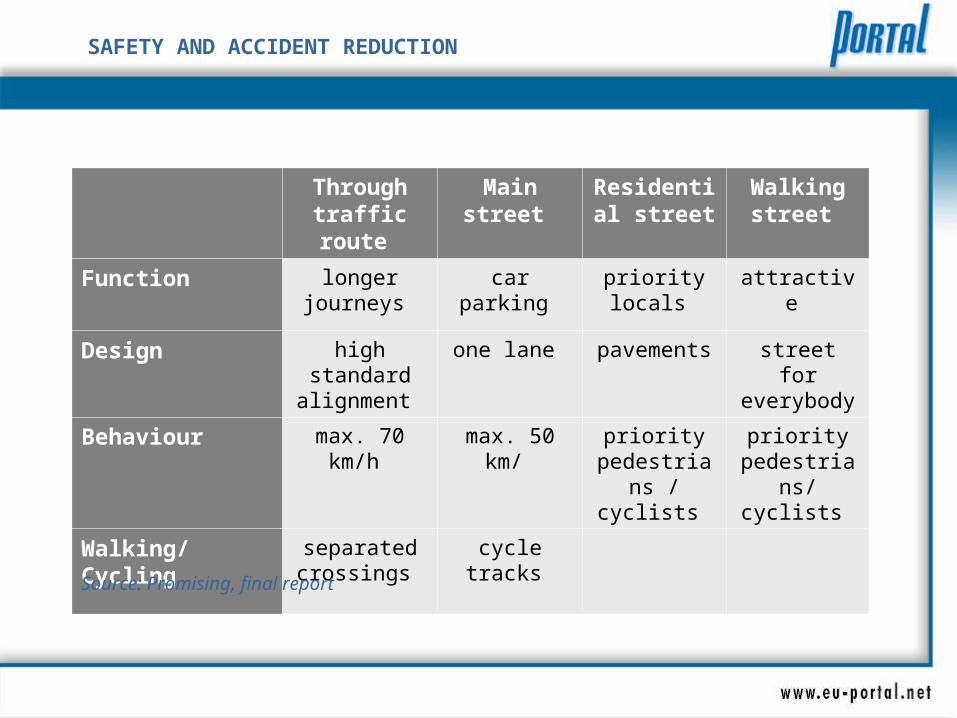
Through traffic route
Main street Residential street
Walking street
Function longer journeys
car parking priority locals attractive
Design high standard alignment
one lane pavements street for everybody
Behaviour max. 70 km/h max. 50 km/ priority pedestrians /
cyclists
priority pedestrians/
cyclists
Walking/Cycling separated crossings
cycle tracks
Source: Promising, final report
SAFETY AND ACCIDENT REDUCTION
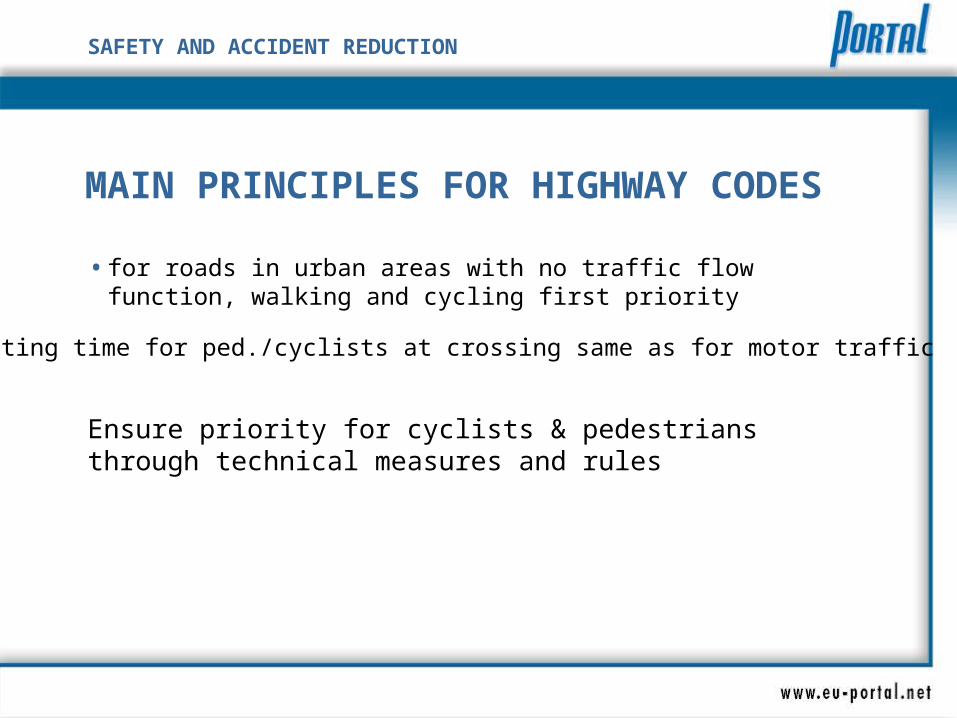
MAIN PRINCIPLES FOR HIGHWAY CODES
• for roads in urban areas with no traffic flow function, walking and cycling first priority
• waiting time for ped./cyclists at crossing same as for motor traffic
Ensure priority for cyclists & pedestrians through technical measures and rules
SAFETY AND ACCIDENT REDUCTION
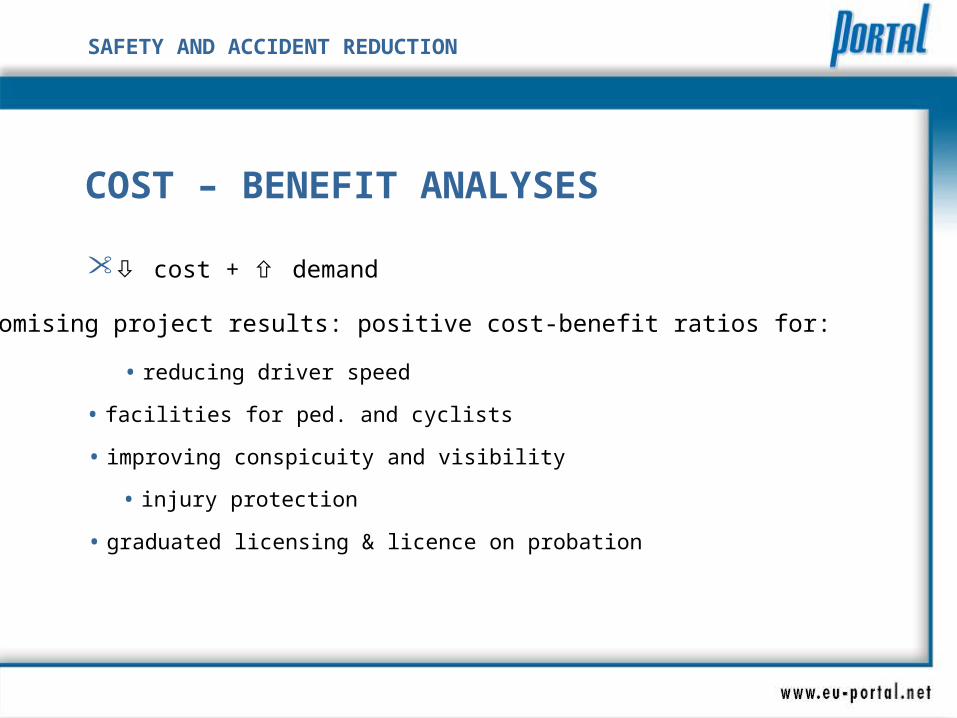
COST – BENEFIT ANALYSES
cost + demand
• Promising project results: positive cost-benefit ratios for:
• reducing driver speed
• facilities for ped. and cyclists
• improving conspicuity and visibility
• injury protection
• graduated licensing & licence on probation
SAFETY AND ACCIDENT REDUCTION
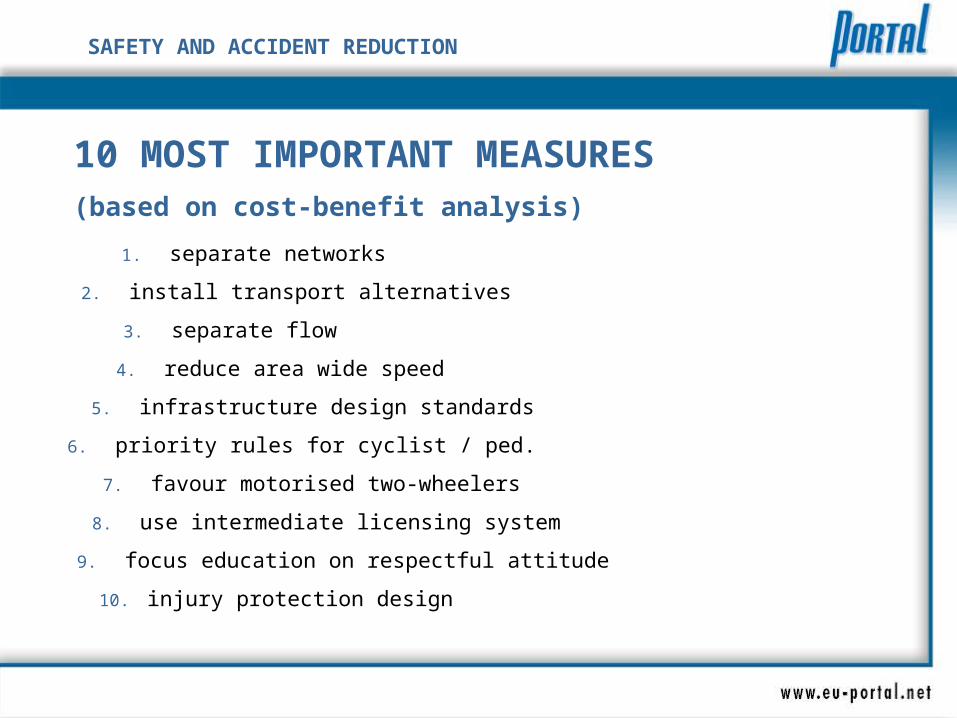
10 MOST IMPORTANT MEASURES (based on cost-benefit analysis)
3. separate flow
4. reduce area wide speed
6. priority rules for cyclist / ped.
1. separate networks
9. focus education on respectful attitude
2. install transport alternatives
5. infrastructure design standards
7. favour motorised two-wheelers
8. use intermediate licensing system
10. injury protection design
SAFETY AND ACCIDENT REDUCTION
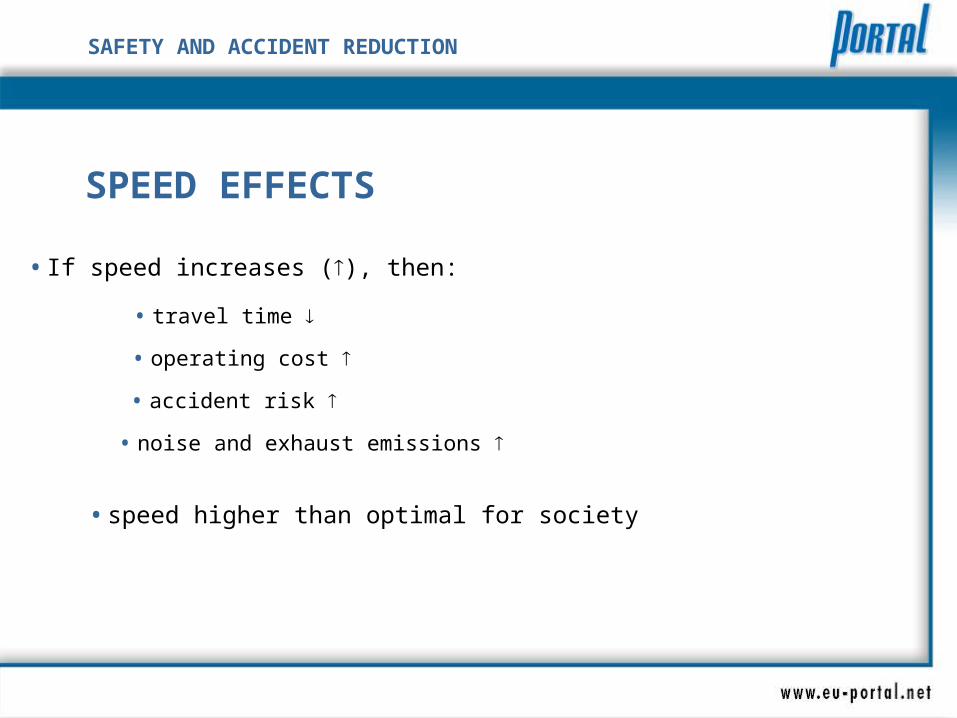
SPEED EFFECTS
• speed higher than optimal for society
• If speed increases (), then:
• travel time
• operating cost
• accident risk
• noise and exhaust emissions
SAFETY AND ACCIDENT REDUCTION
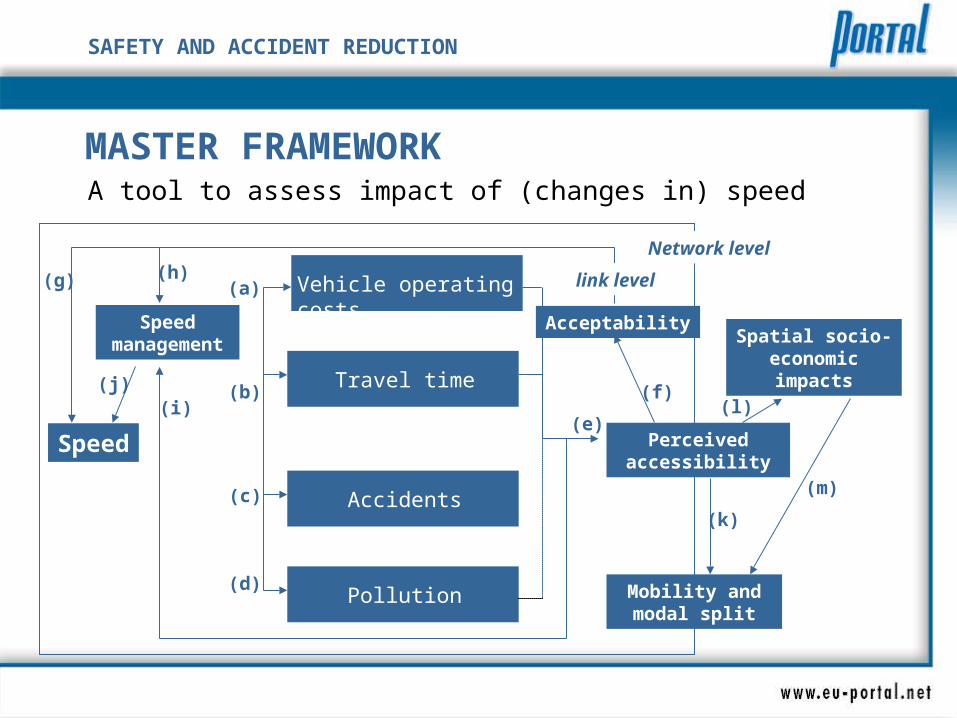
Travel time
Accidents
Pollution
MASTER FRAMEWORK A tool to assess impact of (changes in) speed
Speed management
Speed
Acceptability
Perceived accessibility
Mobility and modal split
Spatial socio-economic impacts
Vehicle operating costs
Network level
link level(a)
(b)
(c)
(d)
(i)
(g) (h)
(f)
(e)
(m)
(k)
(l)(j)
SAFETY AND ACCIDENT REDUCTION
MASTER FRAMEWORK
3 phases:
• Outlining: decide on measure to be tested; link or network level; relevant impacts for this case
• Measurement: choose models and gather data; decide which impact to monetise; make calculations; analyse extent of non-quantifiable impacts
• Assessment: summarise net impacts; analyse distributional effects; do sensitivity tests; analyse acceptability of policy; analyse overall socio-economic feasibility of the policy
SAFETY AND ACCIDENT REDUCTION
MASTER FRAMEWORK
• Limitations
• Application & output
SAFETY AND ACCIDENT REDUCTION
SPEED MANAGEMENT MEASURES AND TOOLS
Master provides an overview, listing for every measure
• description
• impact on speeds
• other significant impacts
• cost-effectiveness
• other relevant information
SAFETY AND ACCIDENT REDUCTION
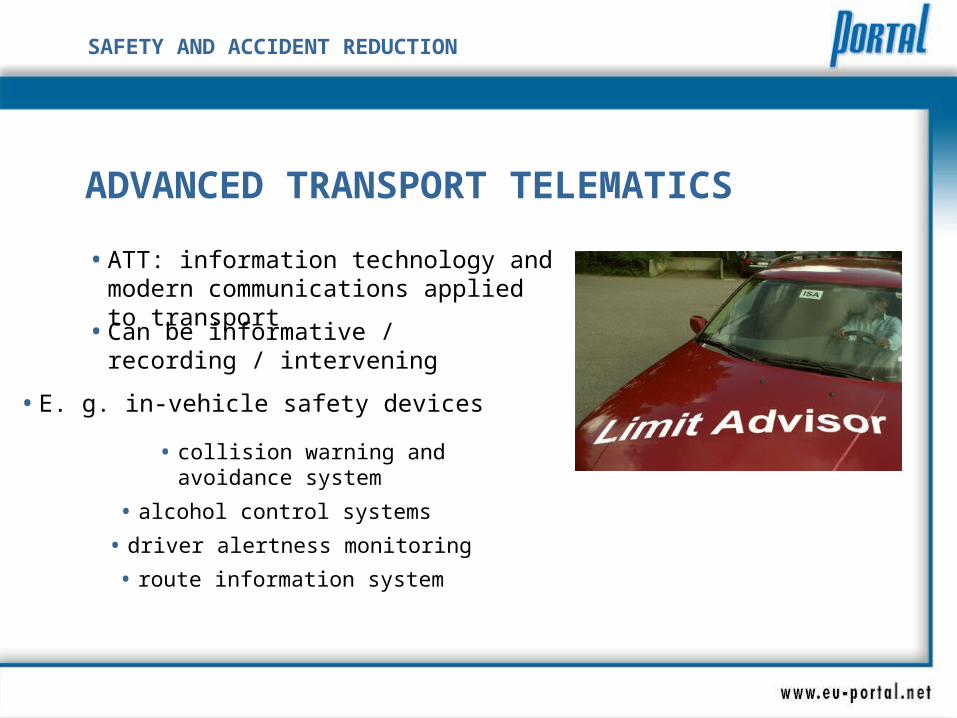
ADVANCED TRANSPORT TELEMATICS
• ATT: information technology and modern communications applied to transport
• E. g. in-vehicle safety devices
• collision warning and avoidance system
• alcohol control systems
• driver alertness monitoring
• route information system
• Can be informative / recording / intervening
SAFETY AND ACCIDENT REDUCTION
EFFECTS OF ATT
• expected to reduce stress, but sometimes negative effect
• provides objective feedback helpful with learning to drive
• if used voluntarily and successfully subjective safety & positive emotional states
(Gadget, Telematics report, 1999)
SAFETY AND ACCIDENT REDUCTION
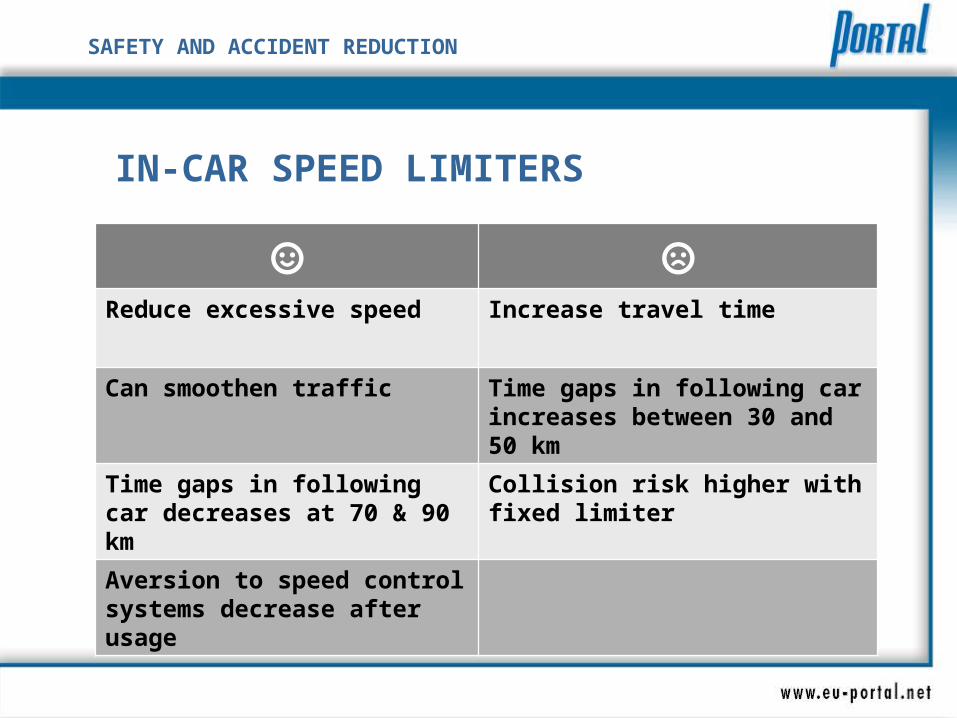
IN-CAR SPEED LIMITERS
☺ ☹
Reduce excessive speed Increase travel time
Can smoothen traffic Time gaps in following car increases between 30 and 50 km
Time gaps in following car decreases at 70 & 90 km
Collision risk higher with fixed limiter
Aversion to speed control systems decrease after usage
SAFETY AND ACCIDENT REDUCTION
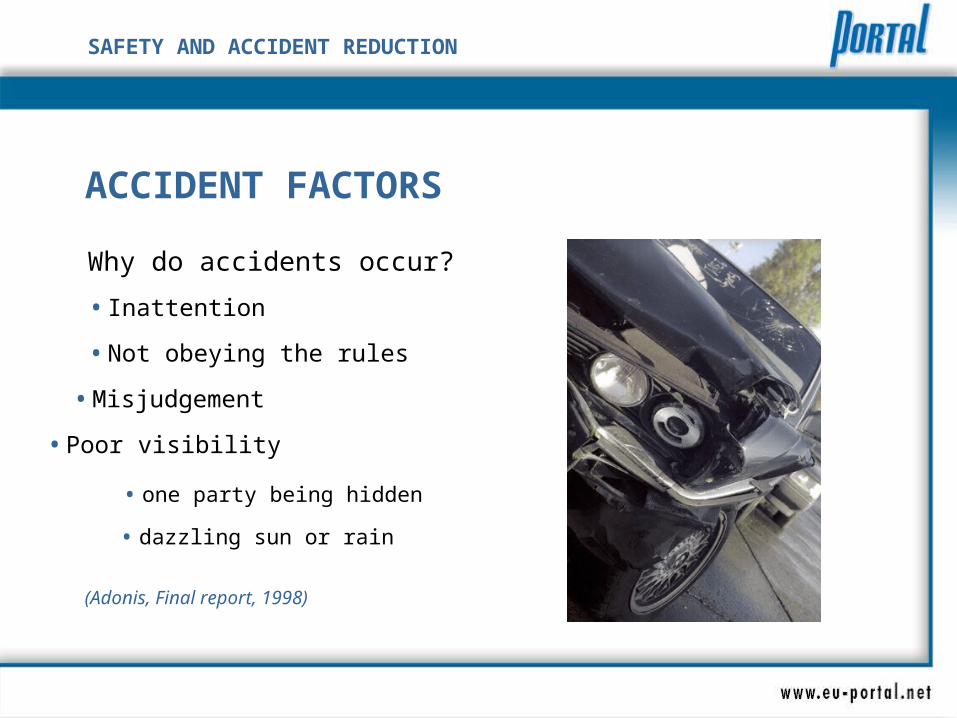
ACCIDENT FACTORS
Why do accidents occur?
• Misjudgement
• one party being hidden
• dazzling sun or rain
• Inattention
• Poor visibility
• Not obeying the rules
(Adonis, Final report, 1998)
SAFETY AND ACCIDENT REDUCTION
IMPROVE ATTITUDES TO OTHER ROAD USERS
All groups behave badly: pedestrians, cyclists, car drivers (Adonis, Final report, 1998)
• clear road design and markings
• information and education (but an accident can also help)
More than (only ?) half of ped./ cyclists change their behaviour after they had an accident
To change behaviour of ped./ cyclists requires both
SAFETY AND ACCIDENT REDUCTION
IMPROVE ATTITUDES TO OTHER ROAD USERS
Important measures to reduce law offences
Before promoting a modal shift: improve safety conditions of ped./cyclists (Adonis, Final report, 1998)
Important measures to increase awareness among road users
SAFETY AND ACCIDENT REDUCTION
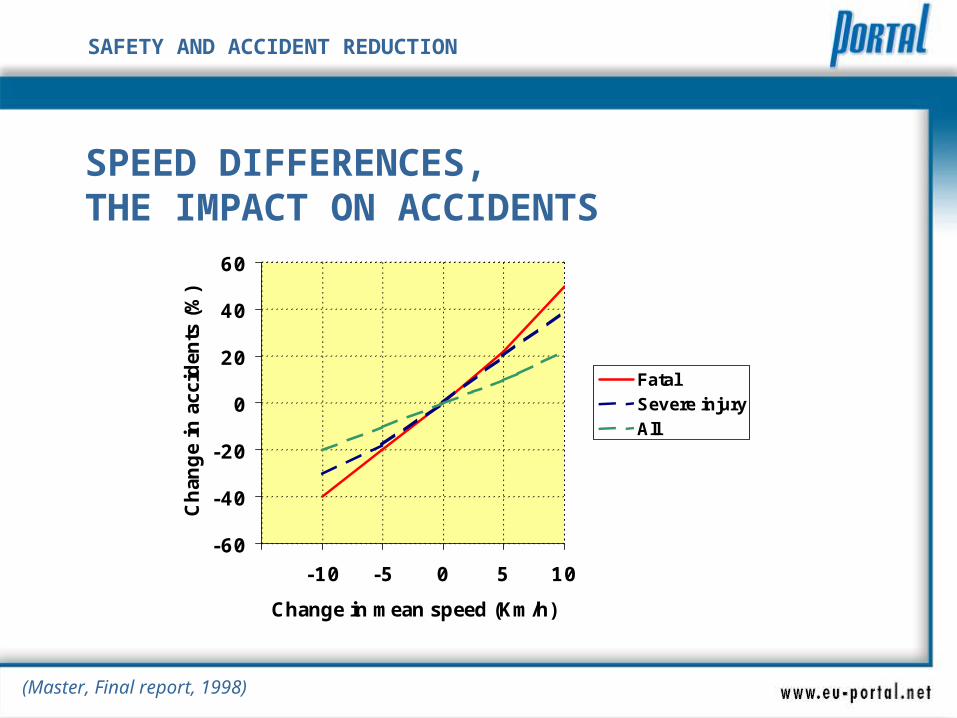
SPEED DIFFERENCES, THE IMPACT ON ACCIDENTS
(Master, Final report, 1998)
-60
-40
-20
0
20
40
60
-10 -5 0 5 10
Change in mean speed (Km/h)
Ch
ang
e in
acc
iden
ts (
%)
Fatal
Severe injury
All
SAFETY AND ACCIDENT REDUCTION
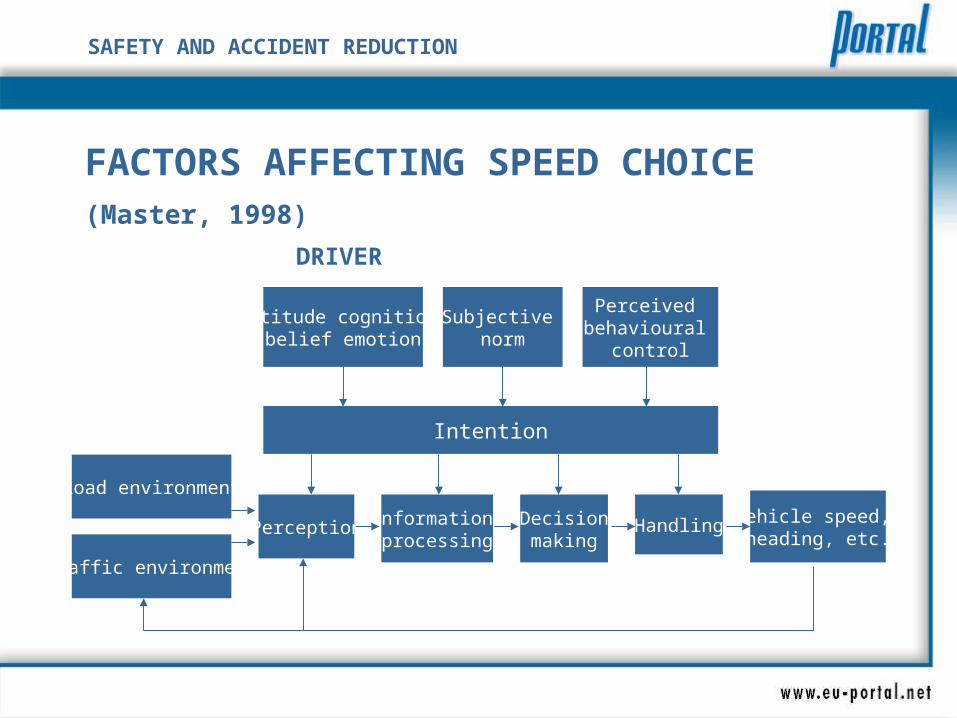
FACTORS AFFECTING SPEED CHOICE (Master, 1998)
Attitude cognition belief emotion
Subjective norm
Perceived behavioural
control
Road environment
Traffic environment
Perception Information processing
Decisionmaking
Handling Vehicle speed, heading, etc.
Intention
DRIVER
SAFETY AND ACCIDENT REDUCTION
ROAD SAFETY CAMPAIGNS
• impaired driving
• speed
Safety campaigns on:
Research on road safety campaigns required
• aggression
• mastery of traffic situations
Setting up road safety campaigns
SAFETY AND ACCIDENT REDUCTION
EFFECTS OF ROAD SAFETY CAMPAIGNS
• long-term effect
possible unfavourable side effects due to reactance, comparative optimism, illusory self assessment, …
(Gadget, Safety campaigns report, 1999) )
SAFETY AND ACCIDENT REDUCTION
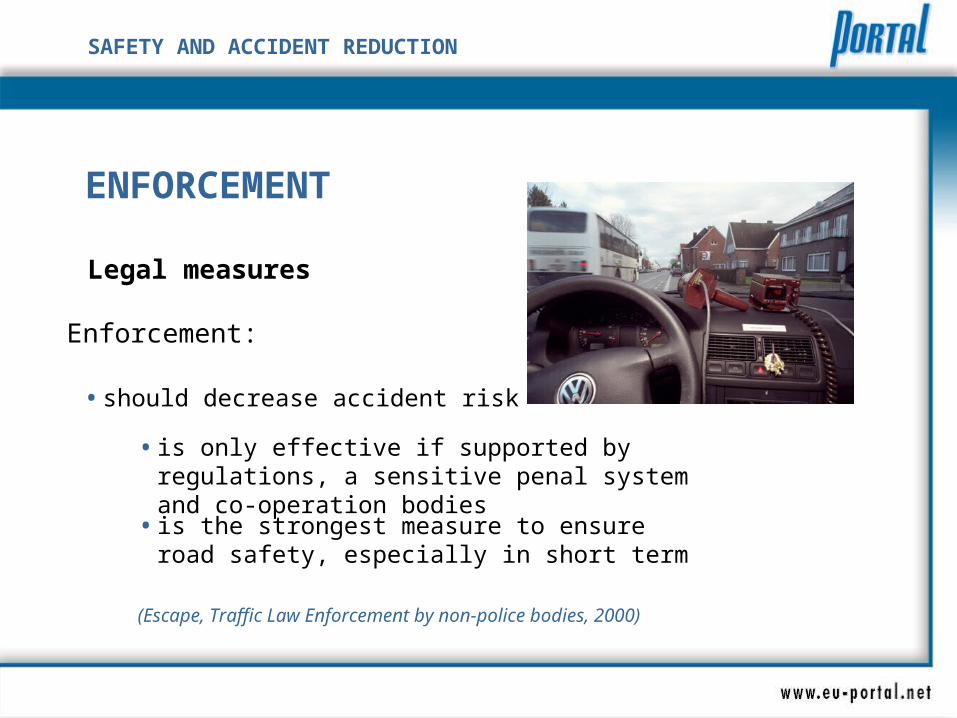
ENFORCEMENT
Legal measures
Enforcement:
• should decrease accident risk
• is only effective if supported by regulations, a sensitive penal system and co-operation bodies
• is the strongest measure to ensure road safety, especially in short term
(Escape, Traffic Law Enforcement by non-police bodies, 2000)
SAFETY AND ACCIDENT REDUCTION
ENFORCEMENT
Alternative enforcement
Continuous police surveillance is necessary for minimal safety
• Non-police enforcement
From fully government controlled, but privately performed to public-private conjunction
• Best suited for:
• standardised repetitive
• specialised tasks
SAFETY AND ACCIDENT REDUCTION
ENFORCEMENT
• Police enforcementFully government controlled
• Best suited for:
• mix of routine and specialisation
• tasks where sensitive contact is important
• Non-police enforcement bodies
SAFETY AND ACCIDENT REDUCTION
SPEED ENFORCEMENT
Impact depends on:
• subjective risk of getting caught
Advice for speed enforcement:
• penalty system
• publicity
Explicitly formulate government policy objectives; use speed cameras; Combine enforcement always with publicity, focus on target groups; etc.
SAFETY AND ACCIDENT REDUCTION
ACCIDENT AND INJURY REGISTRATION
An EU-wide crash injury registration system and database would be of exceptional benefit
• identification of any safety problem in early stage
• quick and accurate evaluation of remedial measures
(Stairs, Final Report, 1999)
SAFETY AND ACCIDENT REDUCTION
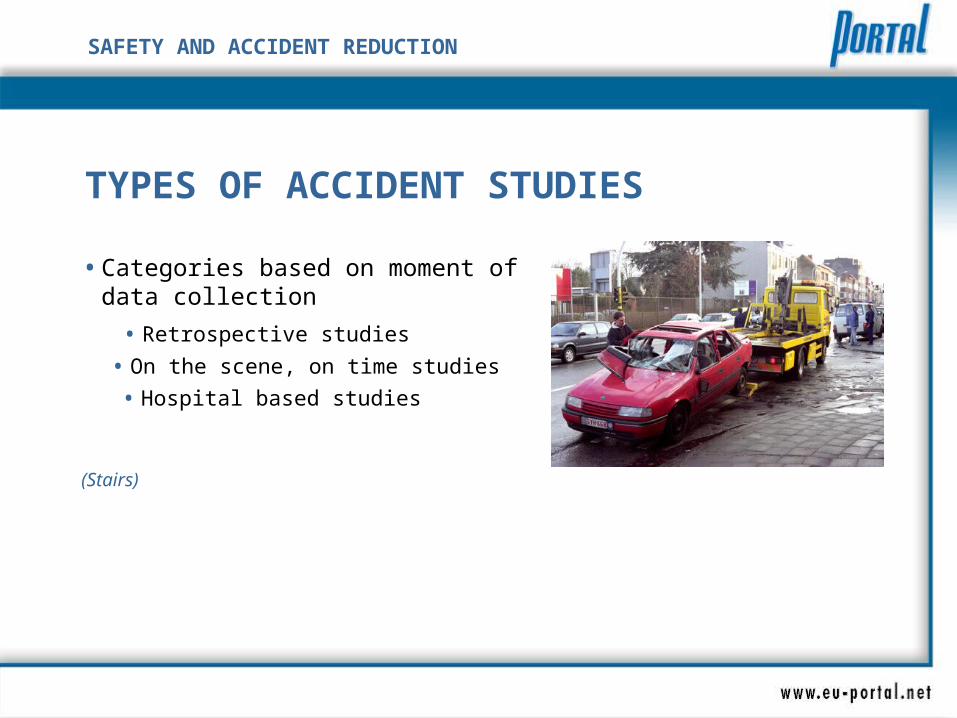
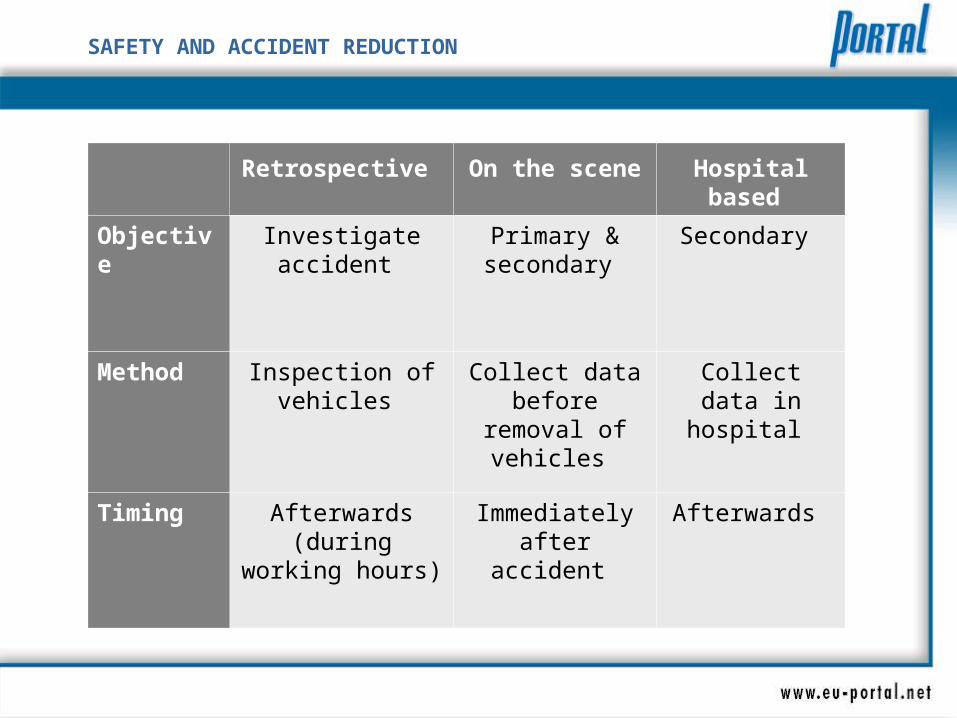
TYPES OF ACCIDENT STUDIES
• Categories based on moment of data collection
• Retrospective studies
• On the scene, on time studies
• Hospital based studies
(Stairs)
SAFETY AND ACCIDENT REDUCTION
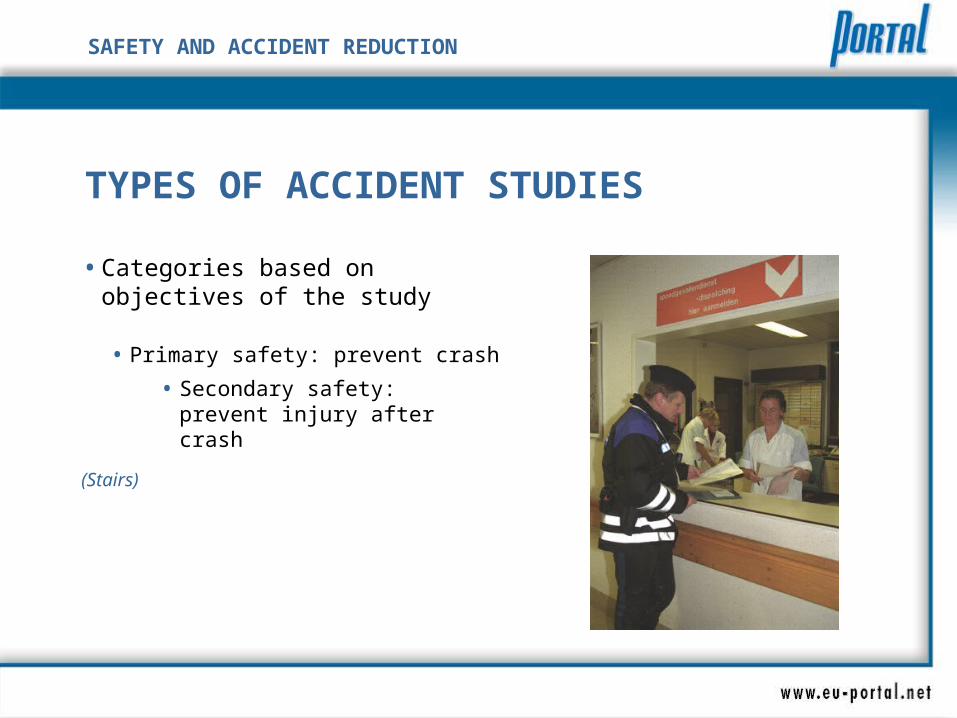
TYPES OF ACCIDENT STUDIES
• Categories based on objectives of the study
• Primary safety: prevent crash
• Secondary safety: prevent injury after crash
(Stairs)
SAFETY AND ACCIDENT REDUCTION
Retrospective On the scene Hospital based
Objective Investigate accident
Primary & secondary
Secondary
Method Inspection of vehicles
Collect data before removal
of vehicles
Collect data in hospital
Timing Afterwards (during working hours)
Immediately after accident
Afterwards
SAFETY AND ACCIDENT REDUCTION
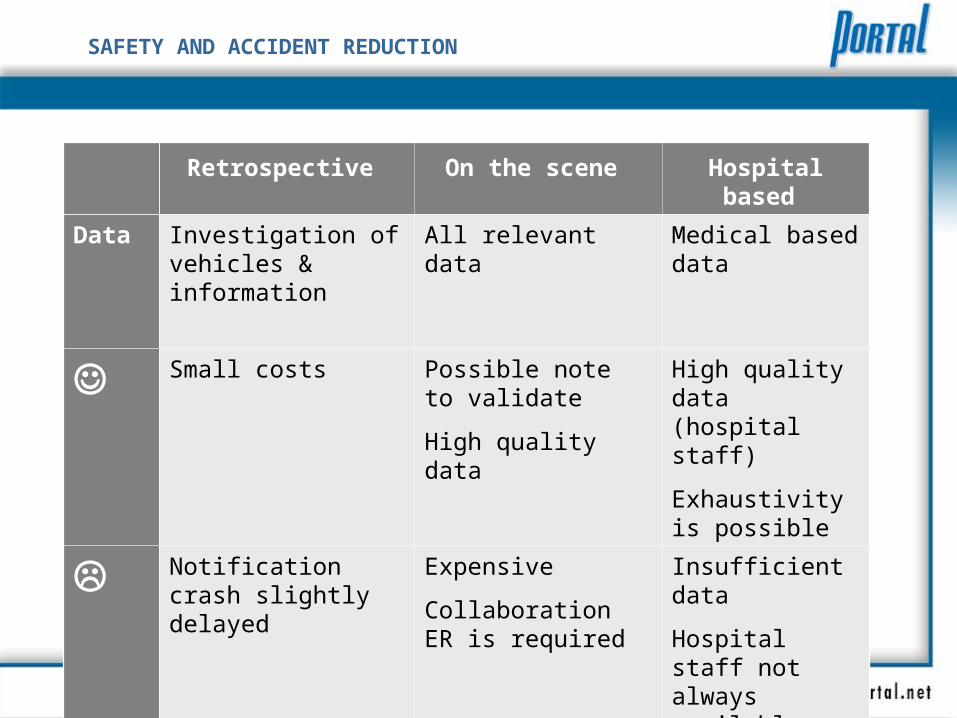
Retrospective On the scene Hospital based
Data Investigation of vehicles & information
All relevant data Medical based data
Small costs Possible note to validate
High quality data
High quality data (hospital staff)
Exhaustivity is possible
Notification crash slightly delayed
Expensive
Collaboration ER is required
Insufficient data
Hospital staff not always available
SAFETY AND ACCIDENT REDUCTION
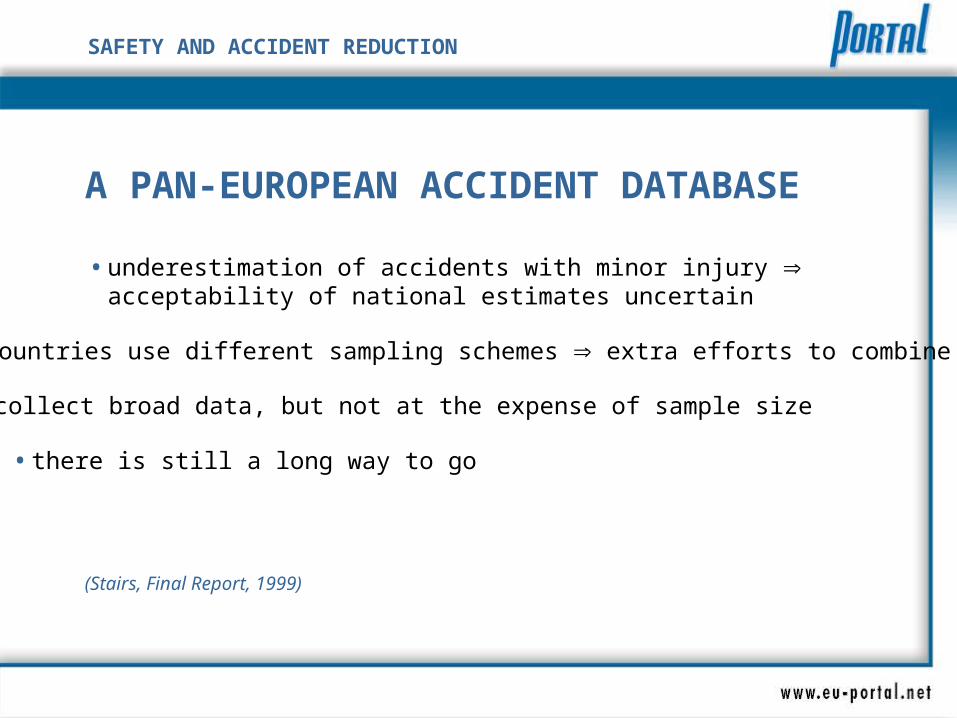
A PAN-EUROPEAN ACCIDENT DATABASE
• underestimation of accidents with minor injury acceptability of national estimates uncertain
• countries use different sampling schemes extra efforts to combine
• collect broad data, but not at the expense of sample size
• there is still a long way to go
(Stairs, Final Report, 1999)
SAFETY AND ACCIDENT REDUCTION
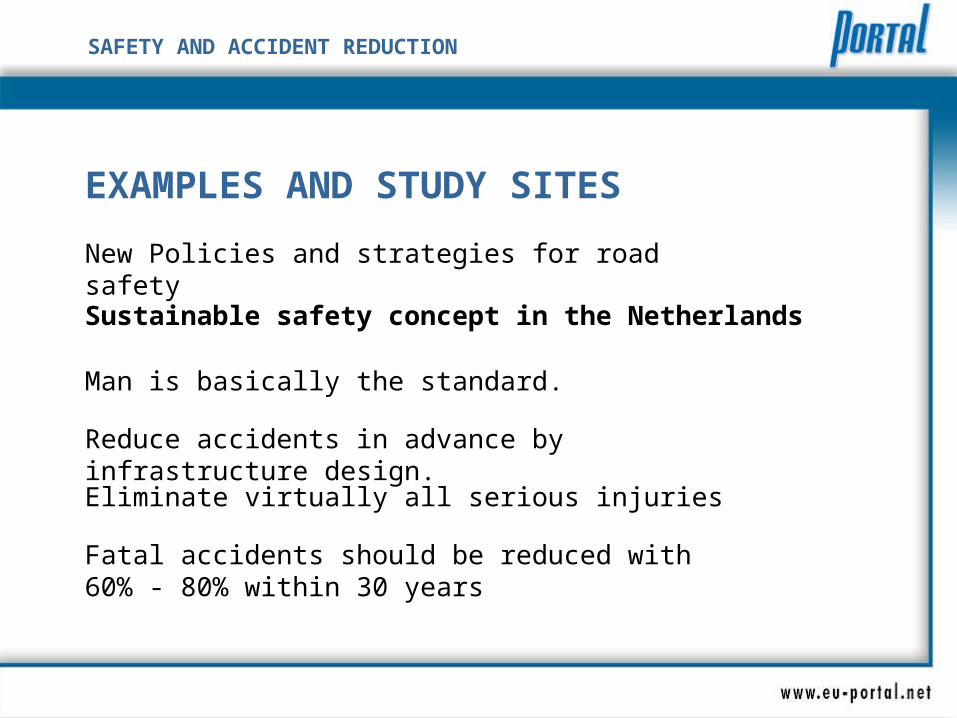
EXAMPLES AND STUDY SITES
New Policies and strategies for road safety
Sustainable safety concept in the Netherlands
Man is basically the standard.
Reduce accidents in advance by infrastructure design.
Eliminate virtually all serious injuries
Fatal accidents should be reduced with 60% - 80% within 30 years
SAFETY AND ACCIDENT REDUCTION
CONCEPT OF SUSTAINABLE SAFE TRAFFIC SYSTEM
• Structure is adapted to limitations of man through proper design
• Roads have a neatly appointed function
• Vehicles fitted with ways to simplify the driver’s task
• Vehicles constructed to protect vulnerable user
• Road user is educated, informed, where necessary guided and restricted
SAFETY AND ACCIDENT REDUCTION
PRACTICAL SAFETY PRINCIPLESSUSTAINABLE SAFE TRAFFIC SYSTEM
• prevent inappropriate use of roads
• reduce possibilities of serious conflicts
• prevent uncertainty among road users
SAFETY AND ACCIDENT REDUCTION
VISION ZERO’ IN SWEDEN
Man is basically the standard.
Create a situation to minimise exposure to violence
Loss of health should be reduced to politically pre-defined level