safety and usability of speech interfaces for in-vehicle...
TRANSCRIPT
Technical Report UMTRI-2006-5 February, 2006
Safety and Usability of Speech Interfaces for In-Vehicle Tasks while Driving:
A Brief Literature Review
Adriana Barón and Paul Green
i
REPORT DOCUMENTATION PAGE Form Approved
OMB No. 074-0188 Public reporting burden for this collection of information is estimated to average 1 hour per response, including the time for reviewing instructions, searching existing data sources, gathering and maintaining the data needed, and completing and reviewing this collection of information. Send comments regarding this burden estimate or any other aspect of this collection of information, including suggestions for reducing this burden to Washington Headquarters Services, Directorate for Information Operations and Reports, 1215 Jefferson Davis Highway, Suite 1204, Arlington, VA 22202-4302, and to the Office of Management and Budget, Paperwork Reduction Project (0704-0188), Washington, DC 20503
1. AGENCY USE ONLY (Leave blank)
2. REPORT DATE
3. REPORT TYPE AND DATES COVERED internal report,
4. TITLE AND SUBTITLE
Safety and Usability of Speech Interfaces for In-Vehicle Tasks while Driving: A Brief Literature Review
5. FUNDING NUMBERS
6. AUTHOR(S) Adriana Barón and Paul Green
7. PERFORMING ORGANIZATION NAME(S) AND ADDRESS(ES)
The University of Michigan
8. PERFORMING ORGANIZATION REPORT NUMBER
Transportation Research Institute (UMTRI) 2901 Baxter Rd, Ann Arbor, Michigan 48109-2150 USA
UMTRI-2006-5
9. SPONSORING / MONITORING AGENCY NAME(S) AND ADDRESS(ES)
10. SPONSORING / MONITORING AGENCY REPORT NUMBER
None
11. SUPPLEMENTARY NOTES 12a. DISTRIBUTION / AVAILABILITY STATEMENT
12b. DISTRIBUTION CODE
13. ABSTRACT (Maximum 200 Words)
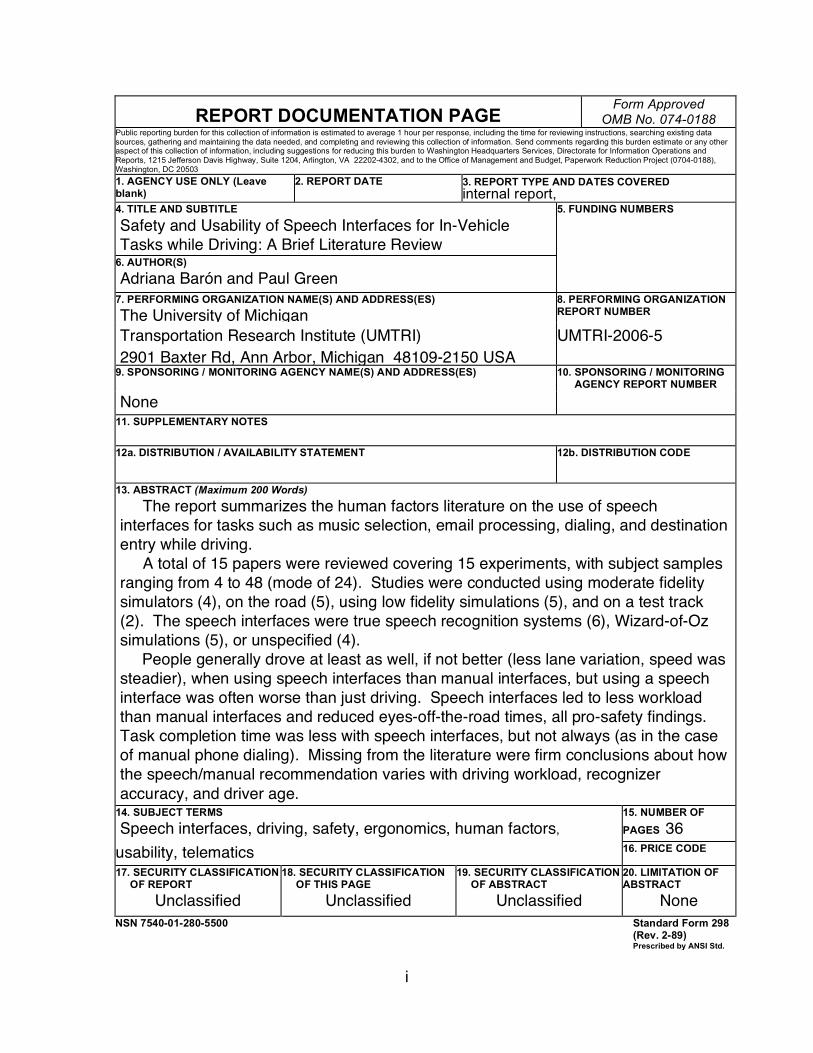
The report summarizes the human factors literature on the use of speech interfaces for tasks such as music selection, email processing, dialing, and destination entry while driving.
A total of 15 papers were reviewed covering 15 experiments, with subject samples ranging from 4 to 48 (mode of 24). Studies were conducted using moderate fidelity simulators (4), on the road (5), using low fidelity simulations (5), and on a test track (2). The speech interfaces were true speech recognition systems (6), Wizard-of-Oz simulations (5), or unspecified (4).
People generally drove at least as well, if not better (less lane variation, speed was steadier), when using speech interfaces than manual interfaces, but using a speech interface was often worse than just driving. Speech interfaces led to less workload than manual interfaces and reduced eyes-off-the-road times, all pro-safety findings. Task completion time was less with speech interfaces, but not always (as in the case of manual phone dialing). Missing from the literature were firm conclusions about how the speech/manual recommendation varies with driving workload, recognizer accuracy, and driver age.
14. SUBJECT TERMS
Speech interfaces, driving, safety, ergonomics, human factors, 15. NUMBER OF
PAGES 36 usability, telematics 16. PRICE CODE
17. SECURITY CLASSIFICATION OF REPORT
Unclassified
18. SECURITY CLASSIFICATION OF THIS PAGE
Unclassified
19. SECURITY CLASSIFICATION OF ABSTRACT
Unclassified
20. LIMITATION OF ABSTRACT
None NSN 7540-01-280-5500 Standard Form 298
(Rev. 2-89) Prescribed by ANSI Std. Z39-18 298-102

ii
iii
SAFETY AND USABILITY OF SPEECH INTERFACES FOR IN-VEHICLE TASKS WHILE DRIVING: A BRIEF LITERATURE REVIEW
UMTRI Technical Report 2006-5 University of Michigan -> A3 Graphical Summary <- Adriana Barón and Paul Green
Transportation Research Institute Ann Arbor, Michigan, USA
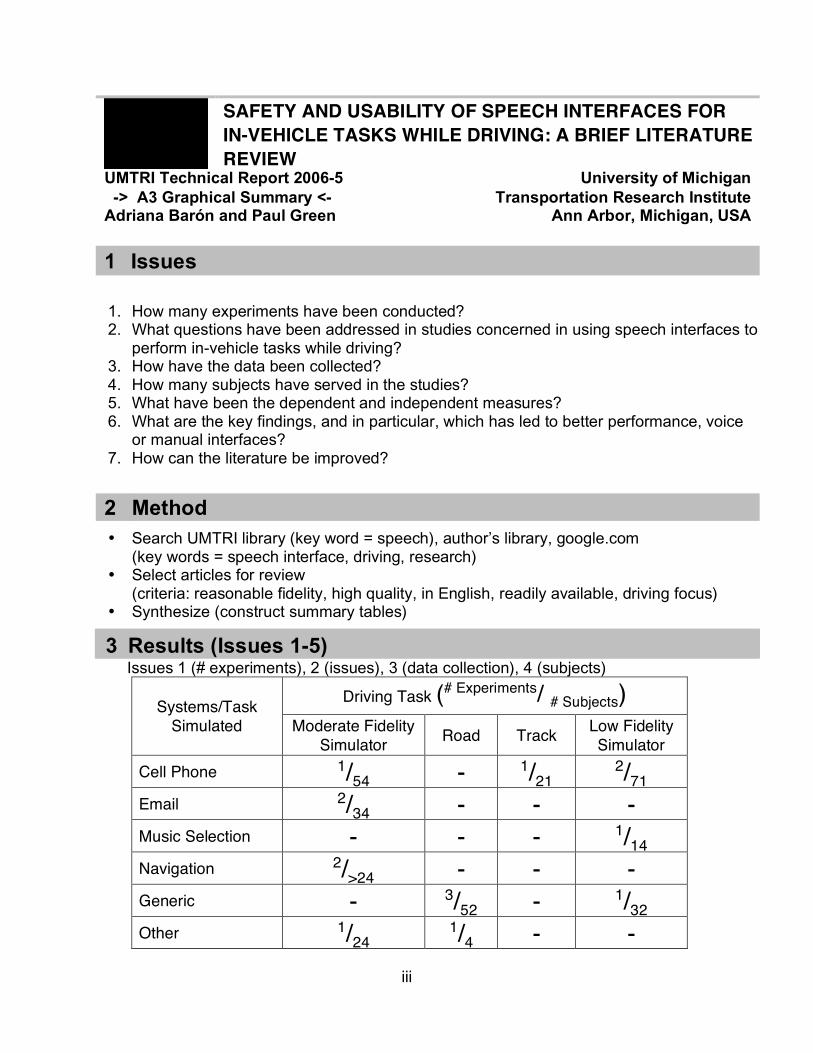
1 Issues
1. How many experiments have been conducted? 2. What questions have been addressed in studies concerned in using speech interfaces to
perform in-vehicle tasks while driving? 3. How have the data been collected? 4. How many subjects have served in the studies? 5. What have been the dependent and independent measures? 6. What are the key findings, and in particular, which has led to better performance, voice
or manual interfaces? 7. How can the literature be improved?
2 Method • Search UMTRI library (key word = speech), author’s library, google.com
(key words = speech interface, driving, research) • Select articles for review
(criteria: reasonable fidelity, high quality, in English, readily available, driving focus) • Synthesize (construct summary tables)
3 Results (Issues 1-5) Issues 1 (# experiments), 2 (issues), 3 (data collection), 4 (subjects)
Driving Task (# Experiments/ # Subjects) Systems/Task
Simulated Moderate Fidelity Simulator Road Track Low Fidelity
Simulator Cell Phone 1/54 - 1/21 2/71 Email 2/34 - - - Music Selection - - - 1/14 Navigation 2/>24 - - - Generic - 3/52 - 1/32 Other 1/24 1/4 - -
iv
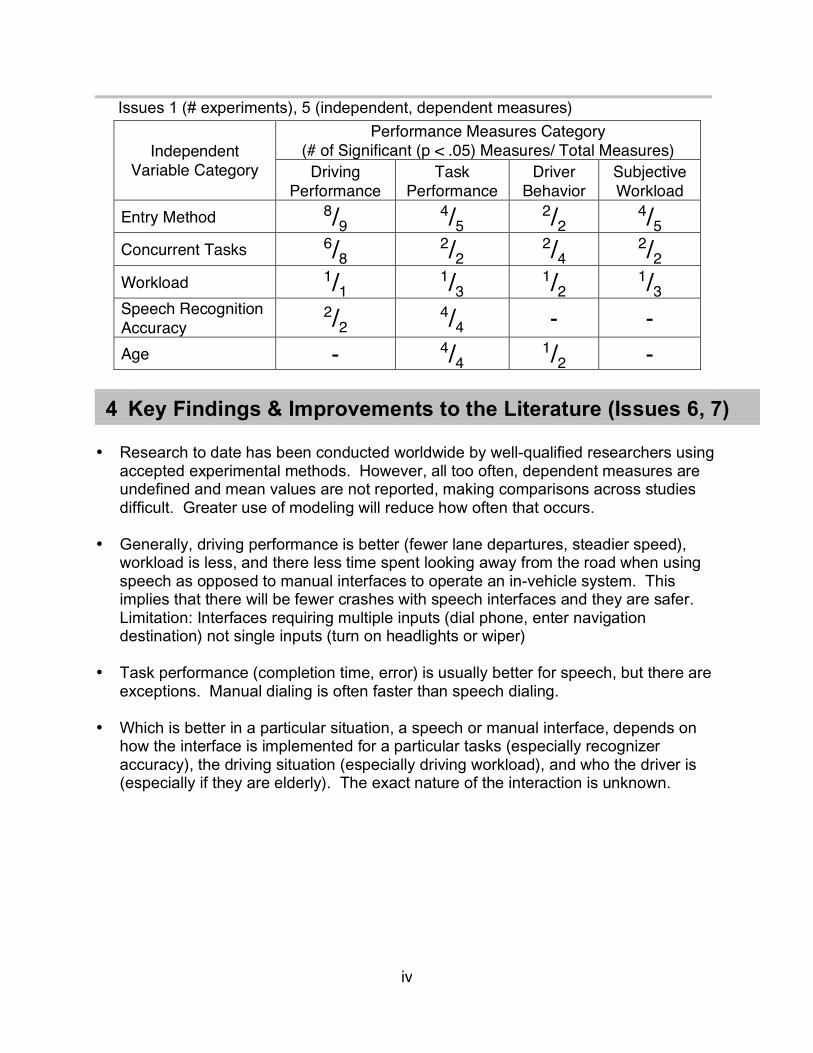
Issues 1 (# experiments), 5 (independent, dependent measures)
Performance Measures Category (# of Significant (p < .05) Measures/ Total Measures) Independent
Variable Category Driving Performance
Task Performance
Driver Behavior
Subjective Workload
Entry Method 8/9 4/5 2/2 4/5 Concurrent Tasks 6/8 2/2 2/4 2/2 Workload 1/1 1/3 1/2 1/3 Speech Recognition Accuracy
2/2 4/4 - - Age - 4/4 1/2 -
4 Key Findings & Improvements to the Literature (Issues 6, 7) • Research to date has been conducted worldwide by well-qualified researchers using
accepted experimental methods. However, all too often, dependent measures are undefined and mean values are not reported, making comparisons across studies difficult. Greater use of modeling will reduce how often that occurs.
• Generally, driving performance is better (fewer lane departures, steadier speed),
workload is less, and there less time spent looking away from the road when using speech as opposed to manual interfaces to operate an in-vehicle system. This implies that there will be fewer crashes with speech interfaces and they are safer. Limitation: Interfaces requiring multiple inputs (dial phone, enter navigation destination) not single inputs (turn on headlights or wiper)
• Task performance (completion time, error) is usually better for speech, but there are
exceptions. Manual dialing is often faster than speech dialing. • Which is better in a particular situation, a speech or manual interface, depends on
how the interface is implemented for a particular tasks (especially recognizer accuracy), the driving situation (especially driving workload), and who the driver is (especially if they are elderly). The exact nature of the interaction is unknown.
v
TABLE OF CONTENTS
INTRODUCTION .............................................................................................................1
Background....................................................................................................................1
Research Issues ............................................................................................................1
METHOD .........................................................................................................................3
Step 1..............................................................................................................................3
Step 2..............................................................................................................................3
Step 3..............................................................................................................................3
Step 4..............................................................................................................................5
RESULTS........................................................................................................................7
What questions have been addressed? ......................................................................7
How have the data been collected?.............................................................................9
What have been the dependent and independent measures, and the key findings?.......................................................................................................................10
CONCLUSIONS AND COMMENTS..............................................................................15
How many studies have been conducted and what questions did they address?.......................................................................................................................................15
How have the data been collected and how many subjects have served in the studies?........................................................................................................................15
What have been the dependent and independent measures?................................15
What are some of the key findings? ..........................................................................16
How can the literature be improved?.........................................................................16
REFERENCES ..............................................................................................................19
APPENDIX A – SUBJECTIVE WORKLOAD MEASUREMENT ...................................23
vi
NASA Task Loading Index (TLX)................................................................................23
Cooper-Harper Index of Handling Quality .................................................................23
APPENDIX B – SUMMARY TABLE OF RESULTS......................................................25
1
INTRODUCTION
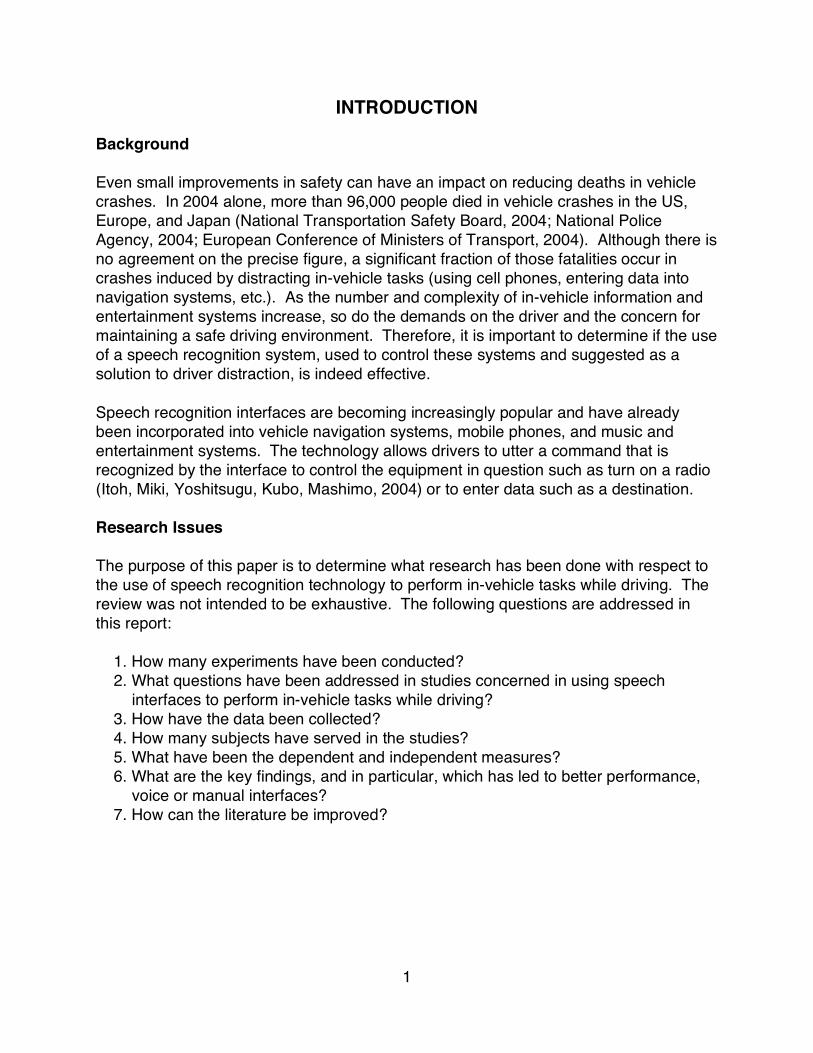
Background Even small improvements in safety can have an impact on reducing deaths in vehicle crashes. In 2004 alone, more than 96,000 people died in vehicle crashes in the US, Europe, and Japan (National Transportation Safety Board, 2004; National Police Agency, 2004; European Conference of Ministers of Transport, 2004). Although there is no agreement on the precise figure, a significant fraction of those fatalities occur in crashes induced by distracting in-vehicle tasks (using cell phones, entering data into navigation systems, etc.). As the number and complexity of in-vehicle information and entertainment systems increase, so do the demands on the driver and the concern for maintaining a safe driving environment. Therefore, it is important to determine if the use of a speech recognition system, used to control these systems and suggested as a solution to driver distraction, is indeed effective. Speech recognition interfaces are becoming increasingly popular and have already been incorporated into vehicle navigation systems, mobile phones, and music and entertainment systems. The technology allows drivers to utter a command that is recognized by the interface to control the equipment in question such as turn on a radio (Itoh, Miki, Yoshitsugu, Kubo, Mashimo, 2004) or to enter data such as a destination. Research Issues The purpose of this paper is to determine what research has been done with respect to the use of speech recognition technology to perform in-vehicle tasks while driving. The review was not intended to be exhaustive. The following questions are addressed in this report:
1. How many experiments have been conducted? 2. What questions have been addressed in studies concerned in using speech
interfaces to perform in-vehicle tasks while driving? 3. How have the data been collected? 4. How many subjects have served in the studies? 5. What have been the dependent and independent measures? 6. What are the key findings, and in particular, which has led to better performance,
voice or manual interfaces? 7. How can the literature be improved?

3
METHOD
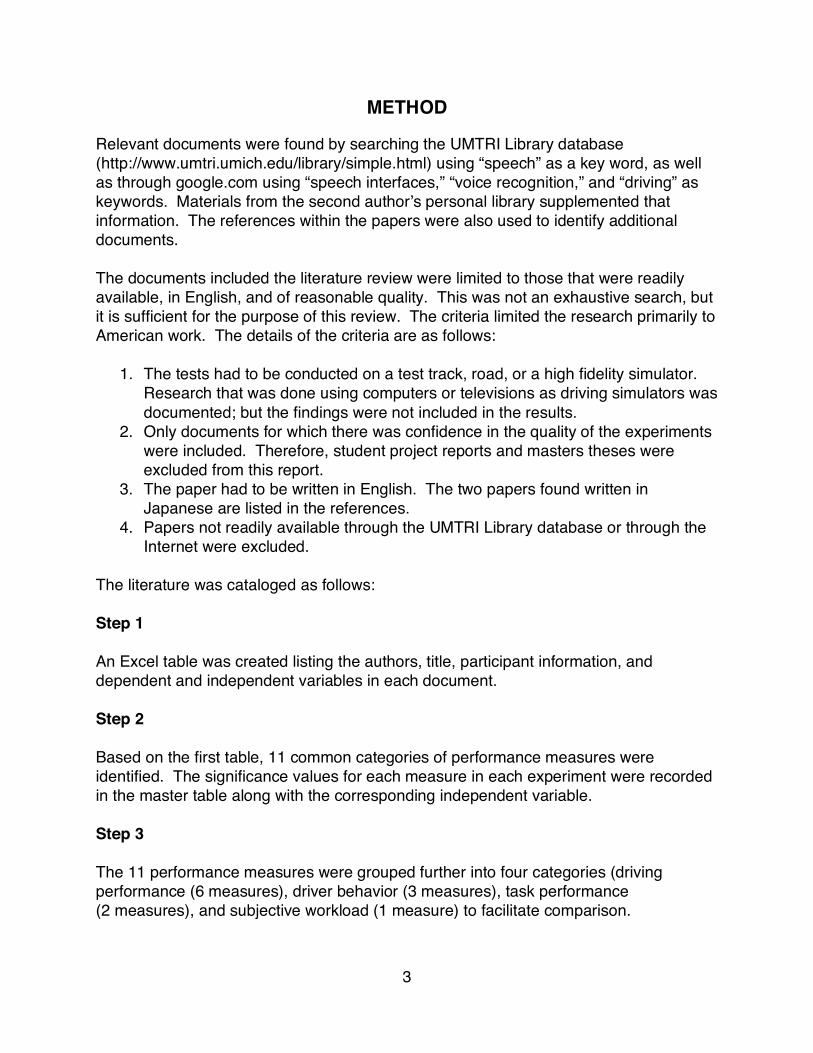
Relevant documents were found by searching the UMTRI Library database (http://www.umtri.umich.edu/library/simple.html) using “speech” as a key word, as well as through google.com using “speech interfaces,” “voice recognition,” and “driving” as keywords. Materials from the second author’s personal library supplemented that information. The references within the papers were also used to identify additional documents. The documents included the literature review were limited to those that were readily available, in English, and of reasonable quality. This was not an exhaustive search, but it is sufficient for the purpose of this review. The criteria limited the research primarily to American work. The details of the criteria are as follows:
1. The tests had to be conducted on a test track, road, or a high fidelity simulator. Research that was done using computers or televisions as driving simulators was documented; but the findings were not included in the results.
2. Only documents for which there was confidence in the quality of the experiments were included. Therefore, student project reports and masters theses were excluded from this report.
3. The paper had to be written in English. The two papers found written in Japanese are listed in the references.
4. Papers not readily available through the UMTRI Library database or through the Internet were excluded.
The literature was cataloged as follows: Step 1 An Excel table was created listing the authors, title, participant information, and dependent and independent variables in each document. Step 2 Based on the first table, 11 common categories of performance measures were identified. The significance values for each measure in each experiment were recorded in the master table along with the corresponding independent variable. Step 3 The 11 performance measures were grouped further into four categories (driving performance (6 measures), driver behavior (3 measures), task performance (2 measures), and subjective workload (1 measure) to facilitate comparison.
4
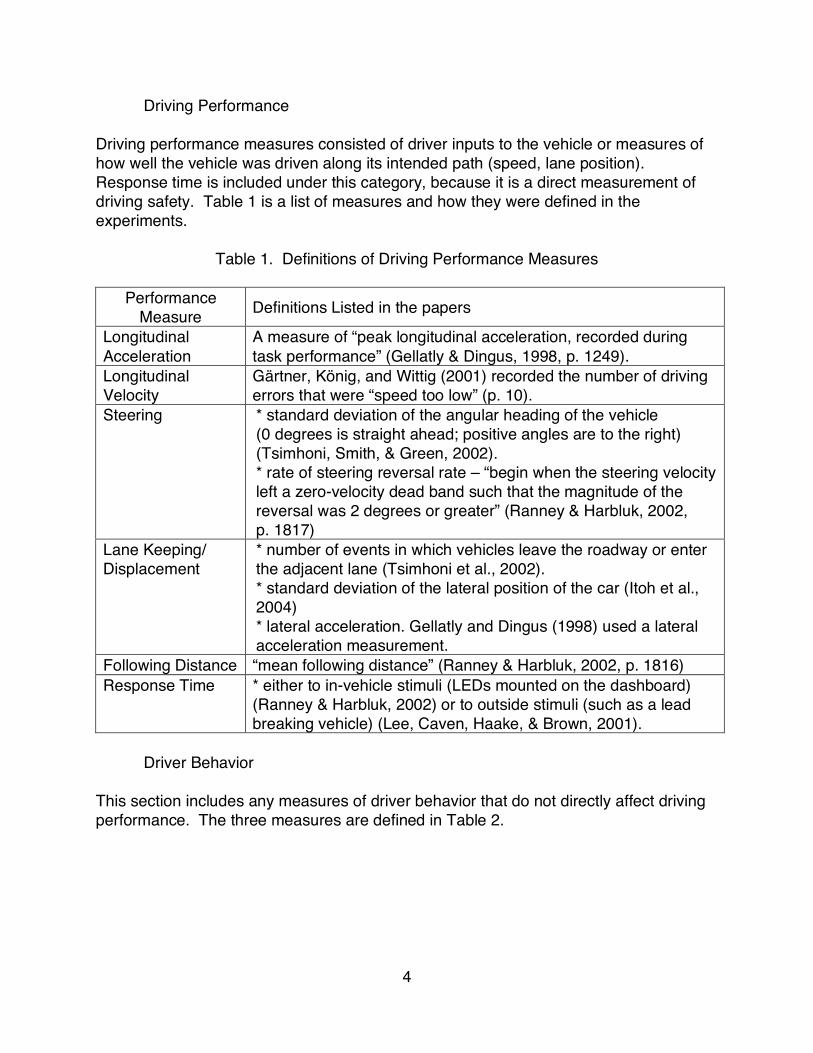
Driving Performance Driving performance measures consisted of driver inputs to the vehicle or measures of how well the vehicle was driven along its intended path (speed, lane position). Response time is included under this category, because it is a direct measurement of driving safety. Table 1 is a list of measures and how they were defined in the experiments.
Table 1. Definitions of Driving Performance Measures
Performance Measure Definitions Listed in the papers
Longitudinal Acceleration
A measure of “peak longitudinal acceleration, recorded during task performance” (Gellatly & Dingus, 1998, p. 1249).
Longitudinal Velocity
Gärtner, König, and Wittig (2001) recorded the number of driving errors that were “speed too low” (p. 10).
Steering * standard deviation of the angular heading of the vehicle (0 degrees is straight ahead; positive angles are to the right) (Tsimhoni, Smith, & Green, 2002). * rate of steering reversal rate – “begin when the steering velocity left a zero-velocity dead band such that the magnitude of the reversal was 2 degrees or greater” (Ranney & Harbluk, 2002, p. 1817)
Lane Keeping/ Displacement
* number of events in which vehicles leave the roadway or enter the adjacent lane (Tsimhoni et al., 2002). * standard deviation of the lateral position of the car (Itoh et al., 2004) * lateral acceleration. Gellatly and Dingus (1998) used a lateral acceleration measurement.
Following Distance “mean following distance” (Ranney & Harbluk, 2002, p. 1816) Response Time * either to in-vehicle stimuli (LEDs mounted on the dashboard)
(Ranney & Harbluk, 2002) or to outside stimuli (such as a lead breaking vehicle) (Lee, Caven, Haake, & Brown, 2001).
Driver Behavior
This section includes any measures of driver behavior that do not directly affect driving performance. The three measures are defined in Table 2.
5
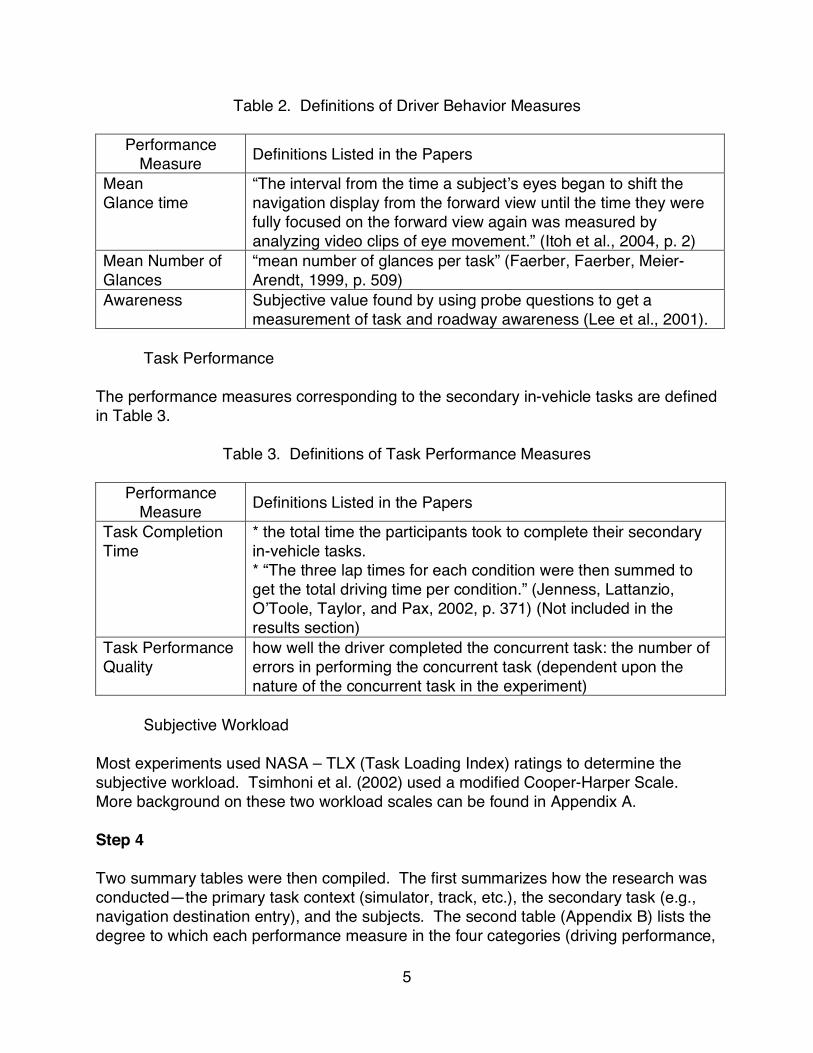
Table 2. Definitions of Driver Behavior Measures
Performance Measure Definitions Listed in the Papers
Mean Glance time
“The interval from the time a subject’s eyes began to shift the navigation display from the forward view until the time they were fully focused on the forward view again was measured by analyzing video clips of eye movement.” (Itoh et al., 2004, p. 2)
Mean Number of Glances
“mean number of glances per task” (Faerber, Faerber, Meier-Arendt, 1999, p. 509)
Awareness Subjective value found by using probe questions to get a measurement of task and roadway awareness (Lee et al., 2001).
Task Performance
The performance measures corresponding to the secondary in-vehicle tasks are defined in Table 3.
Table 3. Definitions of Task Performance Measures
Performance Measure Definitions Listed in the Papers
Task Completion Time
* the total time the participants took to complete their secondary in-vehicle tasks. * “The three lap times for each condition were then summed to get the total driving time per condition.” (Jenness, Lattanzio, O’Toole, Taylor, and Pax, 2002, p. 371) (Not included in the results section)
Task Performance Quality
how well the driver completed the concurrent task: the number of errors in performing the concurrent task (dependent upon the nature of the concurrent task in the experiment)
Subjective Workload
Most experiments used NASA – TLX (Task Loading Index) ratings to determine the subjective workload. Tsimhoni et al. (2002) used a modified Cooper-Harper Scale. More background on these two workload scales can be found in Appendix A. Step 4 Two summary tables were then compiled. The first summarizes how the research was conducted—the primary task context (simulator, track, etc.), the secondary task (e.g., navigation destination entry), and the subjects. The second table (Appendix B) lists the degree to which each performance measure in the four categories (driving performance,

6
driver behavior, concurrent task performance, and the driver’s subjective workload) was significant for each study. For those studies that did not conduct tests of statistical significance, the values of the relevant measures are reported where the original authors provided them.
7
RESULTS
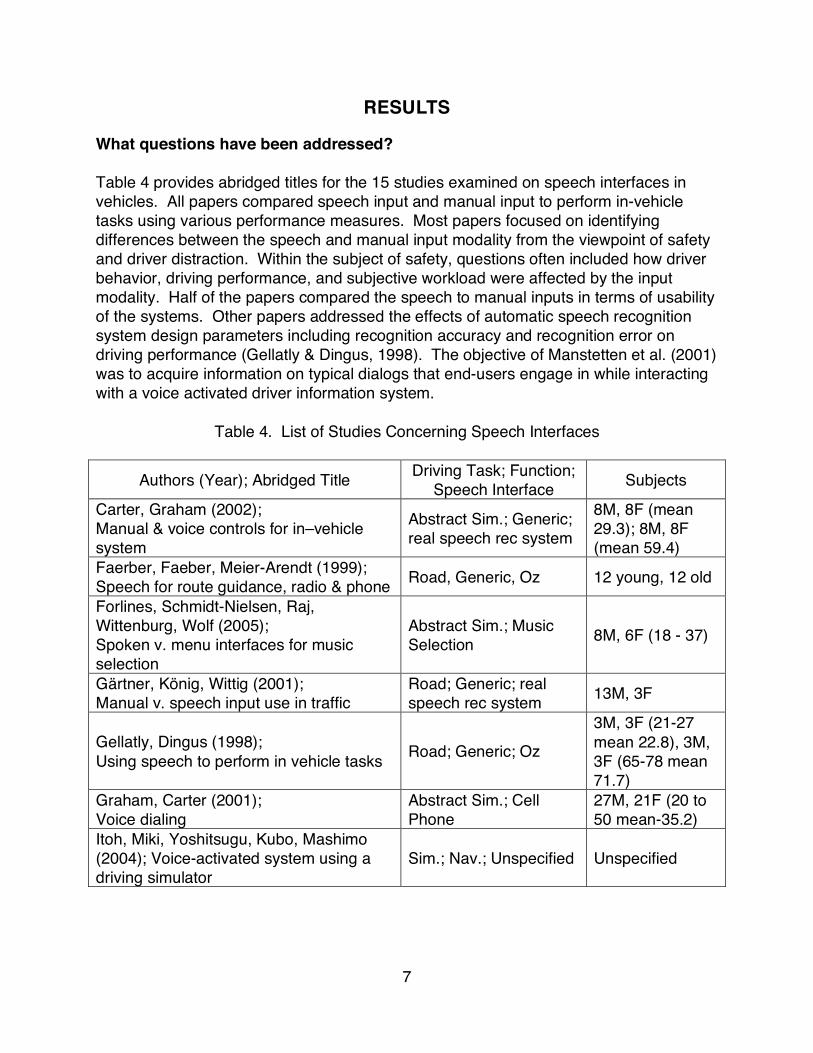
What questions have been addressed? Table 4 provides abridged titles for the 15 studies examined on speech interfaces in vehicles. All papers compared speech input and manual input to perform in-vehicle tasks using various performance measures. Most papers focused on identifying differences between the speech and manual input modality from the viewpoint of safety and driver distraction. Within the subject of safety, questions often included how driver behavior, driving performance, and subjective workload were affected by the input modality. Half of the papers compared the speech to manual inputs in terms of usability of the systems. Other papers addressed the effects of automatic speech recognition system design parameters including recognition accuracy and recognition error on driving performance (Gellatly & Dingus, 1998). The objective of Manstetten et al. (2001) was to acquire information on typical dialogs that end-users engage in while interacting with a voice activated driver information system.
Table 4. List of Studies Concerning Speech Interfaces
Authors (Year); Abridged Title Driving Task; Function; Speech Interface Subjects
Carter, Graham (2002); Manual & voice controls for in–vehicle system
Abstract Sim.; Generic; real speech rec system
8M, 8F (mean 29.3); 8M, 8F (mean 59.4)
Faerber, Faeber, Meier-Arendt (1999); Speech for route guidance, radio & phone Road, Generic, Oz 12 young, 12 old
Forlines, Schmidt-Nielsen, Raj, Wittenburg, Wolf (2005); Spoken v. menu interfaces for music selection
Abstract Sim.; Music Selection 8M, 6F (18 - 37)
Gärtner, König, Wittig (2001); Manual v. speech input use in traffic
Road; Generic; real speech rec system 13M, 3F
Gellatly, Dingus (1998); Using speech to perform in vehicle tasks Road; Generic; Oz
3M, 3F (21-27 mean 22.8), 3M, 3F (65-78 mean 71.7)
Graham, Carter (2001); Voice dialing
Abstract Sim.; Cell Phone
27M, 21F (20 to 50 mean-35.2)
Itoh, Miki, Yoshitsugu, Kubo, Mashimo (2004); Voice-activated system using a driving simulator
Sim.; Nav.; Unspecified Unspecified
8
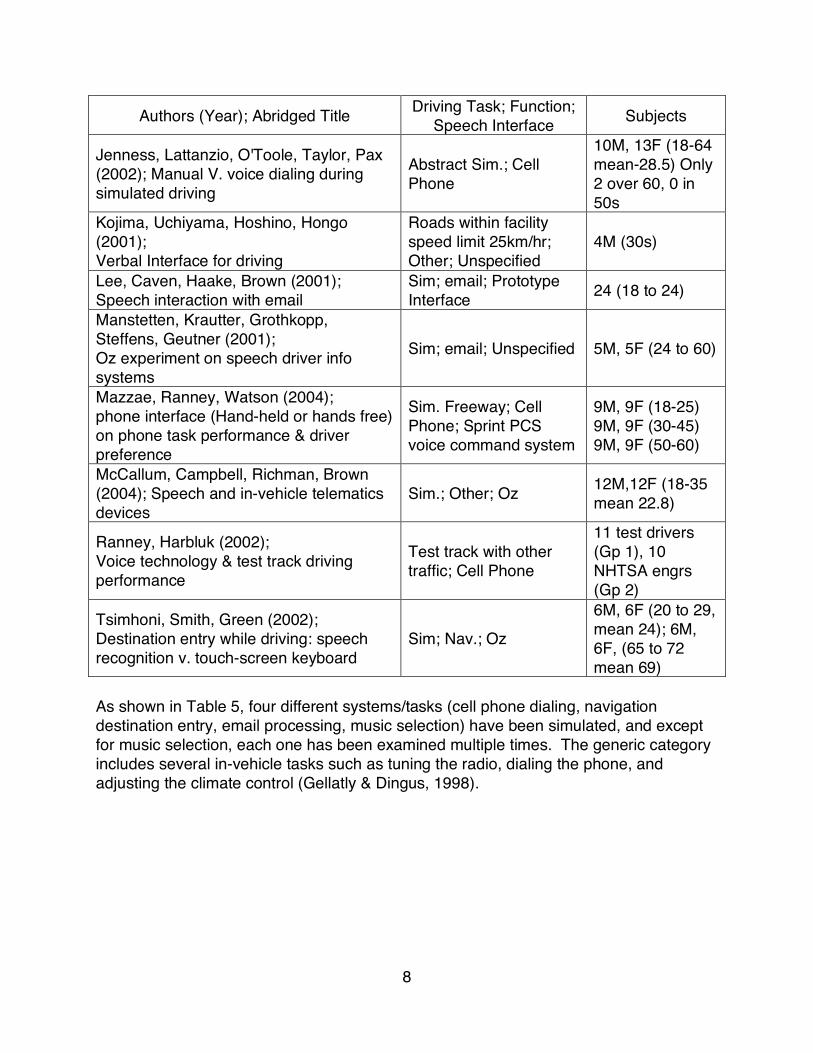
Authors (Year); Abridged Title Driving Task; Function; Speech Interface Subjects
Jenness, Lattanzio, O'Toole, Taylor, Pax (2002); Manual V. voice dialing during simulated driving
Abstract Sim.; Cell Phone
10M, 13F (18-64 mean-28.5) Only 2 over 60, 0 in 50s
Kojima, Uchiyama, Hoshino, Hongo (2001); Verbal Interface for driving
Roads within facility speed limit 25km/hr; Other; Unspecified
4M (30s)
Lee, Caven, Haake, Brown (2001); Speech interaction with email
Sim; email; Prototype Interface 24 (18 to 24)
Manstetten, Krautter, Grothkopp, Steffens, Geutner (2001); Oz experiment on speech driver info systems
Sim; email; Unspecified 5M, 5F (24 to 60)
Mazzae, Ranney, Watson (2004); phone interface (Hand-held or hands free) on phone task performance & driver preference
Sim. Freeway; Cell Phone; Sprint PCS voice command system
9M, 9F (18-25) 9M, 9F (30-45) 9M, 9F (50-60)
McCallum, Campbell, Richman, Brown (2004); Speech and in-vehicle telematics devices
Sim.; Other; Oz 12M,12F (18-35 mean 22.8)
Ranney, Harbluk (2002); Voice technology & test track driving performance
Test track with other traffic; Cell Phone
11 test drivers (Gp 1), 10 NHTSA engrs (Gp 2)
Tsimhoni, Smith, Green (2002); Destination entry while driving: speech recognition v. touch-screen keyboard
Sim; Nav.; Oz 6M, 6F (20 to 29, mean 24); 6M, 6F, (65 to 72 mean 69)
As shown in Table 5, four different systems/tasks (cell phone dialing, navigation destination entry, email processing, music selection) have been simulated, and except for music selection, each one has been examined multiple times. The generic category includes several in-vehicle tasks such as tuning the radio, dialing the phone, and adjusting the climate control (Gellatly & Dingus, 1998).
9
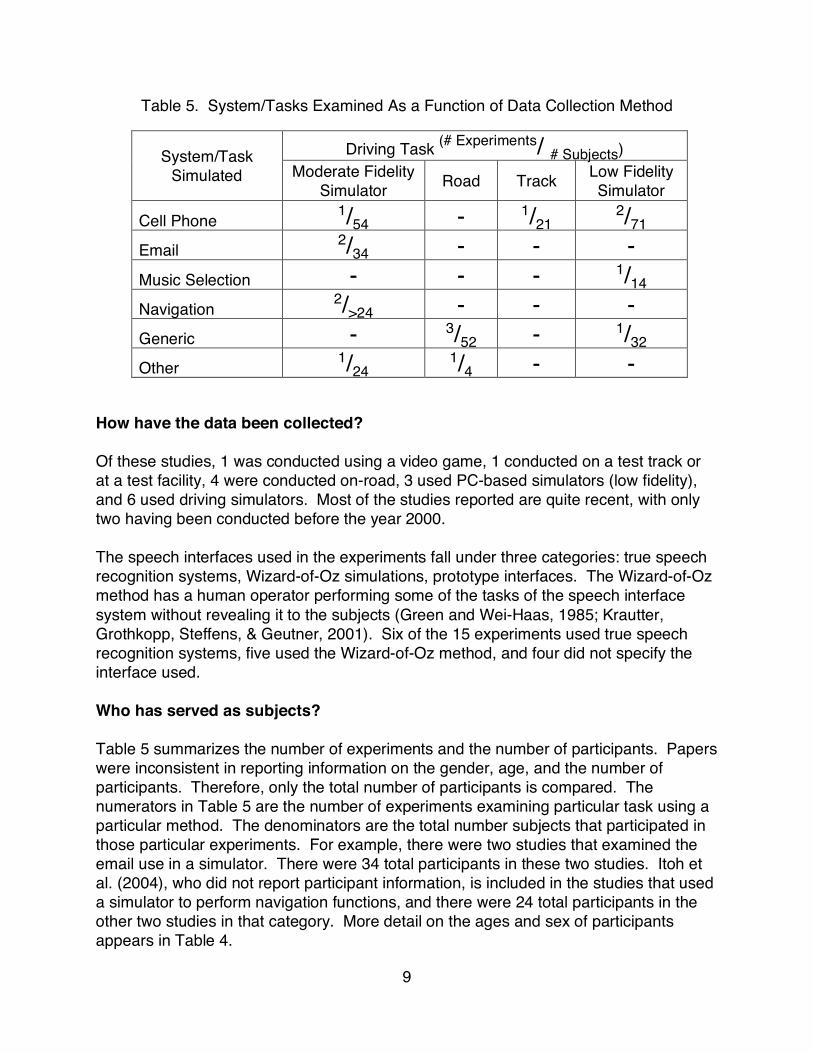
Table 5. System/Tasks Examined As a Function of Data Collection Method
Driving Task (# Experiments/ # Subjects) System/Task Simulated Moderate Fidelity
Simulator Road Track Low Fidelity Simulator
Cell Phone 1/54 - 1/21 2/71 Email 2/34 - - - Music Selection - - - 1/14 Navigation 2/>24 - - - Generic - 3/52 - 1/32 Other 1/24 1/4 - -
How have the data been collected? Of these studies, 1 was conducted using a video game, 1 conducted on a test track or at a test facility, 4 were conducted on-road, 3 used PC-based simulators (low fidelity), and 6 used driving simulators. Most of the studies reported are quite recent, with only two having been conducted before the year 2000. The speech interfaces used in the experiments fall under three categories: true speech recognition systems, Wizard-of-Oz simulations, prototype interfaces. The Wizard-of-Oz method has a human operator performing some of the tasks of the speech interface system without revealing it to the subjects (Green and Wei-Haas, 1985; Krautter, Grothkopp, Steffens, & Geutner, 2001). Six of the 15 experiments used true speech recognition systems, five used the Wizard-of-Oz method, and four did not specify the interface used. Who has served as subjects? Table 5 summarizes the number of experiments and the number of participants. Papers were inconsistent in reporting information on the gender, age, and the number of participants. Therefore, only the total number of participants is compared. The numerators in Table 5 are the number of experiments examining particular task using a particular method. The denominators are the total number subjects that participated in those particular experiments. For example, there were two studies that examined the email use in a simulator. There were 34 total participants in these two studies. Itoh et al. (2004), who did not report participant information, is included in the studies that used a simulator to perform navigation functions, and there were 24 total participants in the other two studies in that category. More detail on the ages and sex of participants appears in Table 4.
10
The number of subjects ranged from 4 to 48 with the most common total being 24 subjects (4 studies). For most studies, the gender of the subjects was given, and the number of men and women were roughly equal. Even though age is an important factor in driving and multitask performance, only two the studies had any subjects over age 65. What have been the dependent and independent measures, and the key findings? Table 6 lists the categories of independent and dependent measures examined in terms of frequency of occurrence of each category and a statistically significant outcome. (A more detailed table of the measures examined appears in Appendix B.) The findings could not be otherwise combined across studies (in terms means and standard deviations) because exact definitions of the performance measures were often not provided. The measures found to be significant are limited to what the authors of the papers explicitly reported. Table 6 excludes data only taken from experiments using abstract simulators.
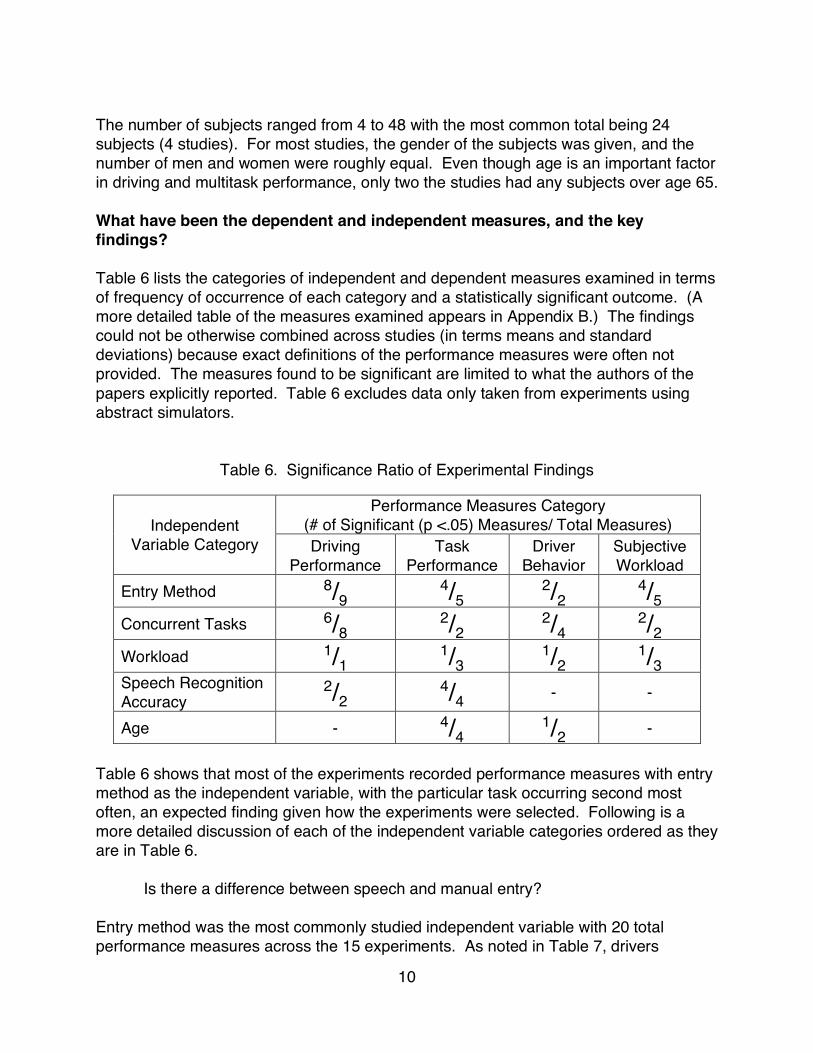
Table 6. Significance Ratio of Experimental Findings
Performance Measures Category (# of Significant (p <.05) Measures/ Total Measures) Independent
Variable Category Driving Performance
Task Performance
Driver Behavior
Subjective Workload
Entry Method 8/9 4/5 2/2 4/5 Concurrent Tasks 6/8 2/2 2/4 2/2 Workload 1/1 1/3 1/2 1/3 Speech Recognition Accuracy
2/2 4/4 - -
Age - 4/4 1/2 - Table 6 shows that most of the experiments recorded performance measures with entry method as the independent variable, with the particular task occurring second most often, an expected finding given how the experiments were selected. Following is a more detailed discussion of each of the independent variable categories ordered as they are in Table 6.
Is there a difference between speech and manual entry? Entry method was the most commonly studied independent variable with 20 total performance measures across the 15 experiments. As noted in Table 7, drivers
11
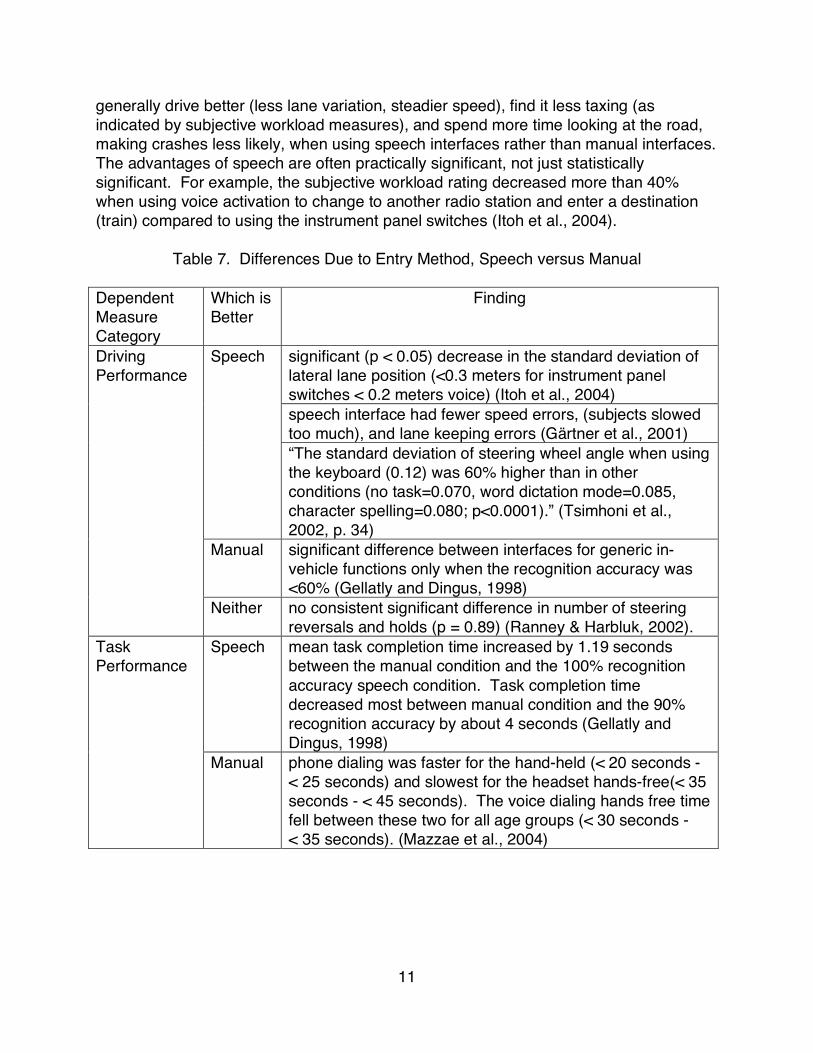
generally drive better (less lane variation, steadier speed), find it less taxing (as indicated by subjective workload measures), and spend more time looking at the road, making crashes less likely, when using speech interfaces rather than manual interfaces. The advantages of speech are often practically significant, not just statistically significant. For example, the subjective workload rating decreased more than 40% when using voice activation to change to another radio station and enter a destination (train) compared to using the instrument panel switches (Itoh et al., 2004).
Table 7. Differences Due to Entry Method, Speech versus Manual Dependent Measure Category
Which is Better
Finding
significant (p < 0.05) decrease in the standard deviation of lateral lane position (<0.3 meters for instrument panel switches < 0.2 meters voice) (Itoh et al., 2004) speech interface had fewer speed errors, (subjects slowed too much), and lane keeping errors (Gärtner et al., 2001)
Speech
“The standard deviation of steering wheel angle when using the keyboard (0.12) was 60% higher than in other conditions (no task=0.070, word dictation mode=0.085, character spelling=0.080; p<0.0001).” (Tsimhoni et al., 2002, p. 34)
Manual significant difference between interfaces for generic in-vehicle functions only when the recognition accuracy was <60% (Gellatly and Dingus, 1998)
Driving Performance
Neither no consistent significant difference in number of steering reversals and holds (p = 0.89) (Ranney & Harbluk, 2002).
Speech mean task completion time increased by 1.19 seconds between the manual condition and the 100% recognition accuracy speech condition. Task completion time decreased most between manual condition and the 90% recognition accuracy by about 4 seconds (Gellatly and Dingus, 1998)
Task Performance
Manual phone dialing was faster for the hand-held (< 20 seconds - < 25 seconds) and slowest for the headset hands-free(< 35 seconds - < 45 seconds). The voice dialing hands free time fell between these two for all age groups (< 30 seconds - < 35 seconds). (Mazzae et al., 2004)
12
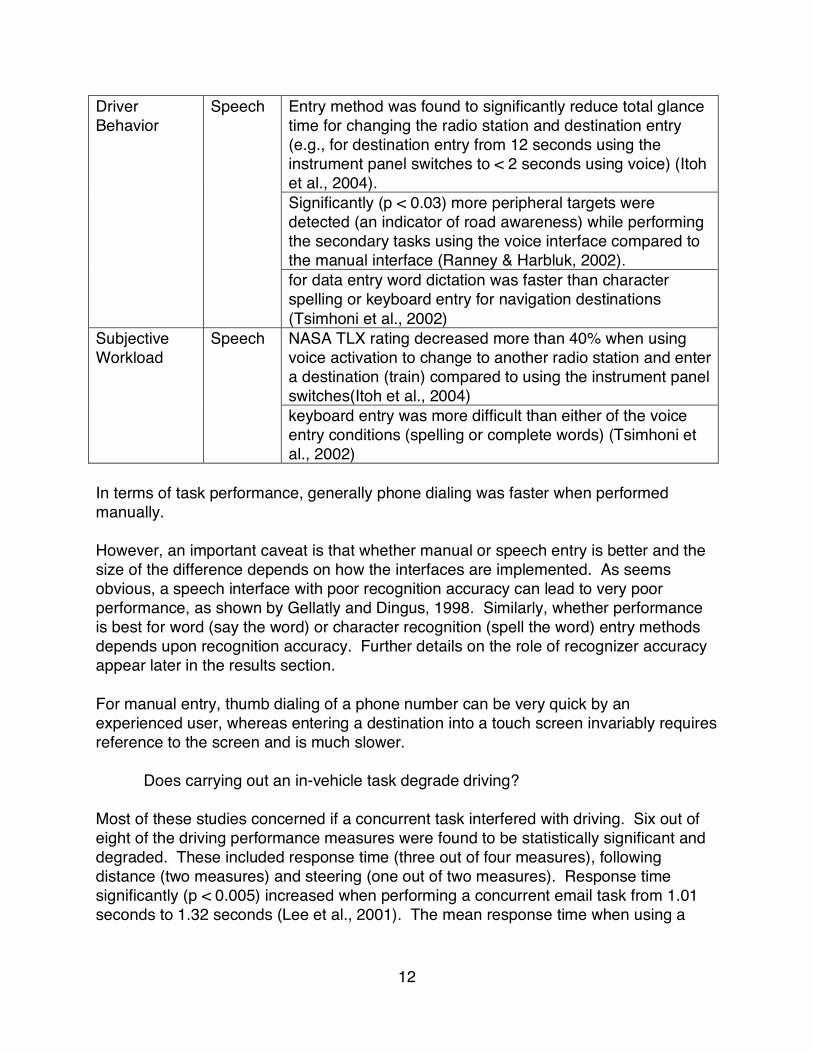
Entry method was found to significantly reduce total glance time for changing the radio station and destination entry (e.g., for destination entry from 12 seconds using the instrument panel switches to < 2 seconds using voice) (Itoh et al., 2004). Significantly (p < 0.03) more peripheral targets were detected (an indicator of road awareness) while performing the secondary tasks using the voice interface compared to the manual interface (Ranney & Harbluk, 2002).
Driver Behavior
Speech
for data entry word dictation was faster than character spelling or keyboard entry for navigation destinations (Tsimhoni et al., 2002) NASA TLX rating decreased more than 40% when using voice activation to change to another radio station and enter a destination (train) compared to using the instrument panel switches(Itoh et al., 2004)
Subjective Workload
Speech
keyboard entry was more difficult than either of the voice entry conditions (spelling or complete words) (Tsimhoni et al., 2002)
In terms of task performance, generally phone dialing was faster when performed manually. However, an important caveat is that whether manual or speech entry is better and the size of the difference depends on how the interfaces are implemented. As seems obvious, a speech interface with poor recognition accuracy can lead to very poor performance, as shown by Gellatly and Dingus, 1998. Similarly, whether performance is best for word (say the word) or character recognition (spell the word) entry methods depends upon recognition accuracy. Further details on the role of recognizer accuracy appear later in the results section. For manual entry, thumb dialing of a phone number can be very quick by an experienced user, whereas entering a destination into a touch screen invariably requires reference to the screen and is much slower.
Does carrying out an in-vehicle task degrade driving? Most of these studies concerned if a concurrent task interfered with driving. Six out of eight of the driving performance measures were found to be statistically significant and degraded. These included response time (three out of four measures), following distance (two measures) and steering (one out of two measures). Response time significantly (p < 0.005) increased when performing a concurrent email task from 1.01 seconds to 1.32 seconds (Lee et al., 2001). The mean response time when using a
13
simple system (1.23 seconds) compared to the use of a complex system (1.41 seconds) was not significant (p = 0.64) (Lee et al., 2001). The effect of a concurrent task was not significant for the two driver behavior measures of roadway awareness. When asked probe questions of their surroundings, drivers’ situational awareness was not affected by the use of an email system (p = 0.29) or its complexity (p = 0.63) (Lee et al., 2001).
How does workload affect performance? Lee et al. (2001) found a significant effect of the complexity of the driving environment on the response time and roadway awareness. Response time increased from 1.00 second to 1.32 seconds with the more “complex” driving environment. Roadway awareness in this experiment decreased slightly; drivers answered 93% of questions about their environment correctly in the “simple” driving environments and only 90% of questions correctly in the “complex” environment, a small difference. Though this implies an increase in driver distraction from a more complex driving environment, Tsimhoni et al. 2002 did not find a significant increase in the mean number of glances as a function of the curvature of the road. Thus, if there is an interaction between the difficulty of the driving situation and the relative benefits of speech versus manual interfaces, especially in terms of driving performance, it is uncertain.
How does recognizer accuracy affect performance? Only Gellatly & Dingus (1998) have specifically conducted statistical analyses on this question. Driving performance measures affected include peak lateral acceleration (p = 0.0004) and peak longitudinal acceleration (p = 0.0133). Mean peak lateral acceleration decreased by 0.0051 G between 75% recognition accuracy and 90% recognition accuracy. The mean peak longitudinal acceleration decreased by 0.0093 G between 60% and 75% recognition accuracy, but increased by 0.0016 G between 75% and 90% recognition accuracy. Significant effects were also seen on task performance for both task completion time (p = 0.0055) and task performance (p < 0.001). The mean task completion time decreased by 1.7 seconds from 25.2 seconds at 75% accuracy to 23.5 seconds for 90% accuracy.
How does driver age affect performance? Vehicles are driven by drivers of all ages and it is well known that elderly drivers have difficulty with complex, multitasking situations (Green, 2001). As was shown earlier, though several studies have examined age, only a few have included the truly elderly. Age was found to have a significant effect on glance time (one out of two measures) and task completion time (four measures). Young drivers required significantly (p = 0.0001) less glance time than older drivers, but age was not significantly affected

14
by workload (Tsimhoni et al., 2002). The task completion time also increased with age for a phone dialing task (Mazzae et al., 2004) and a destination entry task (Tsimhoni et al., 2002). The only measure reported as not being significantly different was the effect of age and workload on the number of glances (Tsimhoni et al., 2002). The interaction between age and performance with manual versus speech interfaces is less certain.
15
CONCLUSIONS AND COMMENTS
How many studies have been conducted and what questions did they address? A total of 15 papers were documented in this literature review. The most common high-level research question addressed was whether speech interfaces would increase driving safety by reducing distraction or have other consequences. Sometimes, the comparison was with no task at all. At other times, the comparison was an interface with manual controls. In vehicle tasks examined include cell phone use (4 experiments-most common), email use (2), destination entry (2), music selection (1), generic interfaces (4), and other tasks (2). How have the data been collected and how many subjects have served in the studies? Driving data have been collected using a variety of methods including moderate fidelity simulators (5 studies), low fidelity simulations (3), on the road (2), test tracks (2), and video games (1). Most often, real speech recognition systems have been used, but five of the experiments used Wizard of Oz interfaces and in four of them, the speech interface was not specified.
Aggregating over those studies where subject data was reported, there were over 306 participants in these experiments. There were anywhere from 4 to 48 subjects per experiment with 24 being most common (4 studies). The number of men and women were roughly equal. Even though age is an important factor in driving and multitask performance, only two the studies had any subjects over age 65. What have been the dependent and independent measures? Independent variables were grouped into 4 categories, (1) entry method (most often, speech versus manual entry), (2) the overall impact of concurrent tasks on performance, (3) the effect of the workload on the driving task, (4) the accuracy of the speech recognition system, and (5) driver age. Generally, the major issue is if these factors interacted with the entry method difference, speech versus manual input. That is, did a recommendation for the method depend upon the workload of driving, recognizer accuracy, or the age of the driver using the interface? The answer to these questions is inconclusive. Of these questions, studies of entry method and concurrent task predominated, in part because of how studies were selected to be included in the sample examined in this report. The effect of these factors was examined using measures of driving performance (steering wheel angle variability, lane departures, speed variability, etc.-20 instances), task performance (task completion time and errors-18 instances), driver behavior (glance duration and frequency-10 instances), and subjective workload (e.g., TLX-10 instances).
16
What are some of the key findings? Most of the time, people drove “better” (there was less lane variation, the speed was steadier) when using speech interfaces than manual interfaces, but using a speech interface was often worse than just driving. Subjects found speech interfaces to be less taxing (as indicated by subjective workload measures) than manual interfaces, and spent more time looking at the road when using speech than manual interfaces, making crashes less likely. The advantages of speech are often practically significant, not just statistically significant, though not always so, with the results varying from study to study. In contrast, the results for task performance are a bit more mixed. For example, subjects can often dial a phone number more rapidly while driving using thumb dialing of a hand-held unit than speaking the phone number. A key point is that the “best” method (manual versus speech) depends upon how well each method is implemented, and in particular, the recognition accuracy of the speech interface. Hence, changing the accuracy changes the preference. How can the literature be improved? Overall, the literature is of reasonable quality. Studies are being conducted all over the world (U.S., Europe, Japan, etc.) by well-trained investigators using reasonably good facilities. Studies are reported in the open literature in journal articles, proceedings papers, and at conferences. One would think that after 15 experiments firm conclusions about the merits of speech versus manual interfaces of operating in-vehicle systems while driving could be offered. Speech interfaces have usually led to better driving performance and often led to better task performance, but there are exceptions. Why then, are there so few firm conclusions from the literature as a whole? 1. Lack of common definitions of dependent measures – Many of the papers never defined the dependent measures examined, such as lane departures. Therefore, it is difficult to make comparisons across studies if how the measures were counted, computed, or derived is unknown (and may be different). This is not good science. 2. Unique test methods – As noted in the report, the most popular test context (moderate fidelity driving simulator) was only used by 6 of the 15 experiments, and those 6 may be different systems. The lack of common methods makes comparing studies difficult. In science, some variety of approach is useful because that variety can provide converging evidence as to a conclusion. However, in this case, the absence replication make linking studies very difficult.
17
3. The interesting conclusions are in the interactions, how the entry methods fare as a function of driver workload, driver age, and recognizer accuracy. Unfortunately, many studies provide considerable information on statistical significance, but much less on means, evidence needed to establish patterns across studies. Greater emphasis on reporting means and examining interactions is desired. One way to tie the literature together more effectively is to develop models that predict driver performance when using speech interfaces. Research for that purpose is now underway.

19
REFERENCES
Carter, C., & Graham, R. (2000). Experimental Comparison of Manual and Voice
Controls for the Operation of In-Vehicle Systems, Proceedings of the IEA 2000/HFES 2000 Congress (CD-ROM), Santa Monica, CA: Human Factors and Ergonomics Society.
European Conference of Ministers of Transport (2004). Preliminary Data on Road
Safety in Europe in 2004 (Press Release). (http://www.cemt.org/events/PressReleases/acc2005.pdf
Faerber, B., Faerber, B., & Meier-Arendt, G. (1999). Speech Control Systems for
Handling of Route Guidance, Radio and Telephone in Cars: Results of a Field Experiment, Vision in Vehicles - VII Proceedings, Amsterdam, Netherlands, 505-515, (dokumente.unibw.de/pub/bscw.cgi/d999540/faerber.pdf).
Forlines, C., Schmidt-Nielsen, B., Raj, B., Wittenburg, P., & Wolf, P. (2005). A
Comparison between Spoken Queries and Menu-based Interfaces for In-Car Digital Music Selection (TR2005-020), Cambridge, MA: Mitsubishi Electric Research Laboratories, (www.merl.com/publications/TR2005-020/).
Gärtner, U., König, W., & Wittig, T. (2001). Evaluation of Manual vs. Speech Input
When Using a Driver Information System in Real Traffic, First International Driving Symposium on Human Factors in Driver Assessment, Training and Vehicle Design, Aspen, CO, 7-13, (ppc.uiowa.edu/driving-assessment/2001/Summaries/TechSession1/techsession1sum.htm).
Gellatly, A., & Dingus, T. (1998). Speech Recognition and Automotive Applications:
Using Speech to Perform In-Vehicle Tasks, Proceedings of the Human Factors 32th Annual Meeting-1998, Santa Monica, CA: Human Factors and Ergonomics Society, 1247-1251.
Graham, R., & Carter, C. (2001). Voice Dialing Can Reduce the Interference Between
Concurrent Tasks of Driving and Phoning, International Journal of Vehicle Design, 26(1), 30-47, (www.psych.uiuc.edu/~kbock/bockpubs/Kubose%20Bock%20Dell%20Garnsey%20Kramer%20Mayhugh%20inpress.pdf).
Green, P. (2001). Variations in Task Performance Between Younger and Older Drivers:
UMTRI Research on Telematics. Paper presented at the Association for the Advancement of Automotive Medicine Conference on Aging and Driving, Southfield, MI, (http://www.umich.edu/~driving/publications.html).
20
Green, P. and Wei-Haas, L. (1985). The Rapid Development of User Interfaces: Experience with the Wizard of Oz Method. Proceedings of the Human Factors Society-29th Annual Meeting, Santa Monica, CA: Human Factors Society, 470-474, (http://www.umich.edu/~driving/publications.html).
Green, P. and Wickens, C. (eds.), (eds.) (2005). Human Factors Engineering Short
Course Notes (46th ed.), Ann Arbor, MI: The University of Michigan, Center for Professional Development.
Itoh, K., Miki, Y., Yoshitsugu, N., Kubo, N., & Mashimo, S. (2004). Evaluation of a
Voice-Activated System Using a Driving Simulator (SAE paper 2004-01-0232), Warrendale, PA: Society of Automotive Engineers.
Jenness, J., Lattanzio, R., O’Toole, M., Taylor, N., & Pax, C. (2002). Effects of Manual
Versus Voice-Activated Dialing During Simulated Driving, Perceptual and Motor Skills, 94 (2), 363-379, (www.accelerated-learning-online.com/.../effects-manual-versus-voice-activated-dialing-simulated-driving.asp).
Kojima, S., Uchiyama, Y., Hoshino, H., & Hongo, T. (2001). Evaluation Method for
Verbal Interface While Driving from the Viewpoint of Safety (SAE paper 2001-01-0356), Warrendale, PA: Society of Automotive Engineers.
Krautter, W., Grothkopp, B., Steffens, F., & Geutner, P. (2001). Design of the VICO
Spoken Dialogue System: Evaluation of User Expectations by Wizard-of-Oz Experiments, Proceedings of the 6th International Conference on Spoken Language Processing (ICSLP 2000), 378-381, Beijing, China, (gandalf.aksis.uib.no/lrec2002/pdf/74.pdf).
Lee, J.D., Caven, B., Haake, S., & Brown, T.L. (2001). Speech-Based Interaction with
In-Vehicle Computers: The Effect of Speech-Based E-mail on Drivers’ Attention to the Roadway, Human Factors, 43(4), 631-640.
Manstetten, D., Krautter, W., Grothkopp, B., Steffens, F., & Geutner, P. (2001). Using a
Driving Simulator to Perform a Wizard-of-Oz Experiment on Speech-Controlled Driver Information Systems, Human-Centered Transportation Simulation Conference, Iowa City, Iowa: Iowa University National Advanced Driving Simulator and Simulation Center, CD-ROM.
Mazzae, E.N., Ranney, T.A., Watson, G.S. (2004). Hand-Held or Hands-Free? The
Effects of Wireless Phone Interface Type on Phone Task Performance and Driver Preference, Proceedings of the Human Factors 48th Annual Meeting-2004, Santa Monica, CA: Human Factors and Ergonomics Society, 2218-2222.
21
McCallum, J., Campbell, J., Richman, J, Brown, J. (2004). Speech Recognition and In-Vehicle Telematics Devices: Potential Reductions in Driver Distraction, International Journal of Speech Technology, 7, 25-33.
National Police Agency (2004). Annual Trends in Fatalities,
(http://www.npa.go.jp/toukei/koutuu1/ann1.htm). National Transportation Safety Board (2004). Annual Report to Congress, 43.
(http://www.ntsb.gov/publictn/2005/spc0503.htm). Ranney, T.A., Harbluk, J.L (2002). The Effects of Voice Technology on Test Track
Driving Performance: Implications for Driver Distraction, Proceedings of the Human Factors 46th Annual Meeting-2002, Santa Monica, CA: Human Factors and Ergonomics Society, 1814-1818.
Tsimhoni, O., Smith, D., Green, P. (2002). Destination Entry while Driving: Speech
Recognition versus a Touch-Screen Keyboard (UMTRI Report number UMTRI-2001-24) Ann Arbor, MI: The University of Michigan, Transportation Research Institute, (http://www.umich.edu/~driving/publications.html).
Tominaga, S., Asoh, T., Hashimoto, K. (2002). Evaluation of driver's workload imposed
by using voice control car-navigation system while driving, JARI Research Journal, 24(7), 269-272. (in Japanese).
Tominaga, S., Asoh, T., Iihoshi, A. (2003). Study on Driver's Workload Caused by
Using Vocal Interface Car-Navigation System, JARI Research Journal, 25(4), 165-168. (in Japanese).

23
APPENDIX A – SUBJECTIVE WORKLOAD MEASUREMENT
NASA Task Loading Index (TLX) Wickens and Green (2005) give an overview of what the NASA TLX Index measures. Subjects are ask to respond to 20-point responses along six dimensions of demand including mental demand, physical demand, temporal demand, performance, effort, and frustration level. Most experiments cited in this literature review stated that they used a modified version of this scale, but did not explain how it was modified. Cooper-Harper Index of Handling Quality The Cooper-Harper Index of Handling Quality was also summarized by Wickens and Green (2005). It is a 10-point scale that was originally developed to measure the subjective workload of airplane pilots. The original index probes overall ease of handling of the selected task or required operation and asks more specific questions related to the aircraft characteristics, the demands on the pilot, and finally, the pilot rating. Tsimhoni et al. (2002) used a modified version of this scale to be used to measure the subjective workload of performing in-vehicle tasks.

24