safety climate and safety outcomes in aircraft maintenance
TRANSCRIPT

University of Central Florida University of Central Florida
STARS STARS
Electronic Theses and Dissertations, 2004-2019
2015
Safety Climate and Safety Outcomes in Aircraft Maintenance: A Safety Climate and Safety Outcomes in Aircraft Maintenance: A
Mediating Effect of Employee Turnover and Safety Motivation Mediating Effect of Employee Turnover and Safety Motivation
Muhanna Alnoaimi University of Central Florida
Part of the Engineering Commons
Find similar works at: https://stars.library.ucf.edu/etd
University of Central Florida Libraries http://library.ucf.edu
This Doctoral Dissertation (Open Access) is brought to you for free and open access by STARS. It has been accepted
for inclusion in Electronic Theses and Dissertations, 2004-2019 by an authorized administrator of STARS. For more
information, please contact [email protected].
STARS Citation STARS Citation Alnoaimi, Muhanna, "Safety Climate and Safety Outcomes in Aircraft Maintenance: A Mediating Effect of Employee Turnover and Safety Motivation" (2015). Electronic Theses and Dissertations, 2004-2019. 644. https://stars.library.ucf.edu/etd/644

SAFETY CLIMATE AND SAFETY OUTCOMES IN AIRCRAFT MAINTENANCE: A
MEDIATING EFFECT OF EMPLOYEE TURNOVER AND SAFETY MOTIVATION
by
MUHANNA ALNOAIMI
B.S. Aerospace Engineering, Embry Riddle Aeronautical University, 1999
M.S. Aerospace Engineering, Embry Riddle Aeronautical University, 2001
Executive MBA, University of Bahrain, 2006
A dissertation submitted in partial fulfillment of the requirements
for the degree of Doctor of Philosophy
in the Department of Industrial Engineering and Management Systems
in the College of Engineering and Computer Science
at the University of Central Florida
Orlando, Florida
Summer Term
2015
Major Professor: Waldemar Karwowski

ii
© 2015 Muhanna Alnoaimi
iii
ABSTRACT
Aircraft maintenance is viewed as a critical safety component in general and military
aviation industries, and thus it is crucial to identify the factors that may affect aircraft
maintenance. Because the safety climate is considered as a leading indicator of safety
performance and safety outcomes, this study utilized this safety climate approach to develop a
model which can explain the relationships between employee turnover, safety motivation, self-
reported unsafe acts, reporting unsafe behaviors, incidents, and injuries in the aviation
maintenance environment. This study included a sample of 283 technicians in military aircraft
maintenance units who participated in a cross-sectional random survey. Data collected were
analyzed using Exploratory Factor Analysis (EFA) and Structural Equation Modeling (SEM)
techniques. A structural model that fitted the data was developed which predicted 64% of the
variance in employee turnover, 7% of the variance in safety motivation, 20% of the variance in
unsafe acts, 41% of the variance in reporting unsafe behavior, and 21% of the variance in
workplace injuries. The results indicate employees who report a perception of high turnover
exhibit decreased safety motivation and increased unsafe acts which lead to higher levels of
workplace injuries. The perception of safety climate was identified as an antecedent to safety
performance and safety outcomes. Additionally, the effects of control variables such as age and
education were tested. The implications for safety management in aircraft maintenance were also
discussed. This study provides directions for future research on the turnover of aircraft
maintenance technicians, safety performance, and safety outcomes.

iv
This dissertation is dedicated to the loving memory of my beloved father: Salman
Alnoaimi (August 21st, 2005). I hope that this achievement of mine completes the dream he had
for me.
v
ACKNOWLEDGMENTS
First and foremost, I have to thank ALLAH almighty for his continues guidance and
mercy for all his bounties and for everything he has given me, that without them I would not
have ever completed this work.
Many thanks and appreciations go to my advisor Dr. Waldemar Karwowski for his
guidance, encouragement, assistance, and constructive feedback with this assignment, and most
importantly his steadfast integrity to both my personal and academic development. Dr.
Karwowski is such a kind and inspiring person. Without his valuable support, this assignment
would not exist. Also, I thank the members of my dissertation committee; Dr. Piotr Mikusinski,
Dr. Peter Hancock, and Dr. Petros Xanthopoulos for their input, suggestion, and guidance during
my research work journey.
I also wish to extend my sincerest gratitude to the faculty members of the industrial
engineering doctoral program at the University of Central Florida. I am particularly thankful to
Liz Stalvey, the assistant to the department chair, for all her help and support. I must
acknowledge as well my fellow doctoral candidates who advised and supported my research over
the years. I am gratefully thankful to my wonderful friend and colleague Captain Mohammad
Alsowayigh for all of his encouragement throughout my doctoral journey. I would like also to
extend my thanks to those great friends whom I met in Orlando. Life would not have been
colorful without you.
I am very grateful to my employer, the Bahrain Defense Force for sponsoring me to
pursue my higher degree. I would like to sincerely thank Maj. Gen. Abdulla Ben Hassan

vi
Alnoaimi for his care and encouragement. I must thank also the leaders and officers at the Royal
Bahraini Air Force for their support, and all of the maintenance technicians who participated in
the survey for their valuable contributions. Thanks to and all brothers and friends around the
globe for their love and care. I am particularly thankful to both my cousin Omran Alnuaimi for
all his help and support during my doctoral work and my wonderful friend Ali Aljowder for his
care and for keeping up with me all the time. Special thanks also go to my good friend and
former colleague, Mohammad Farrukh for editing and proofreading this work while he was
taking care of his three months old twins.
I thank my mom Noura Alnoaimi for her endless love, support, and continuous pray
throughout my life. To my dad Salman Alnoaimi, the love and memory of you will never pass
away. It was under their watchful eye that I grew and ditched my way toward the future. Thank
you for everything. You made me into who I am right now. My brothers, sisters, and their
families deserve my deeply thanks as well for all the great love and support they gave. I also owe
a great debt of gratitude to my wife’s family who provided me with unending encouragement
and support. This work is a proof to your faith in me, and I hope I have made you proud of me as
well.
Finally, words cannot express my appreciation and love for my wife and my children.
Thanks Lateefa for being tenderness and kindness. You have a truly compassionate soul. Thanks
Salman for being so determined and energetic that helped us go through difficult time. Thanks
Majed for being wit and comedy. You can easily brighten my day. Thanks Saqer for being the
most precious gift we have ever got through those four years. To my beloved wife, Rouza

vii
Alnoaimi, thanks for continued patience and great support, for all the late nights and early
morning, and for putting up with the stress of the doctoral program. Your love was definitely the
bedrock upon which the past thirteen years of my life have been built. Your tolerance and
understanding during the last four years is a testament in itself of your unyielding devotion, and
was in the end what made this dissertation possible. Thank you for never letting me doubt myself
and for reminding me there is always a better day. Thank you for being my muse and
proofreader. But most of all, thank you for being my best friend. I owe everything to you and I
consider myself to be fortunate indeed.

viii
TABLE OF CONTENTS
LIST OF FIGURES ..................................................................................................................... xiii
LIST OF TABLES ........................................................................................................................ xv
LIST OF ACRONYMS ............................................................................................................. xviii
CHAPTER ONE: INTRODUCTION ............................................................................................. 1
1.1 Background ........................................................................................................................... 1
1.2 Problem Statement ................................................................................................................ 2
1.3 Research Objectives .............................................................................................................. 3
1.4 Research Hypotheses ............................................................................................................ 3
CHAPTER TWO: LITERATURE REVIEW ................................................................................. 5
2.1 Aviation Maintenance and Inspection Tasks ........................................................................ 5
2.2 Human Error in Aviation Maintenance ................................................................................ 7
2.3 Human Error Models in Aviation ......................................................................................... 9
2.4 Organizational Culture and Organizational Climate .......................................................... 12
2.5 Safety Culture and Safety Climate ...................................................................................... 17
2.5.1 Safety Culture .............................................................................................................. 17
2.5.2 Safety Climate .............................................................................................................. 18
2.6 Literature Relating to Study Variables ............................................................................... 20
2.6.1 Determining Safety Climate Dimensions .................................................................... 20
ix
2.6.2 Determining of Employee Turnover Dimensions ........................................................ 25
2.6.3 Safety Motivation......................................................................................................... 29
2.6.4 Determining of Safety Performance Dimensions ........................................................ 30
2.6.5 Safety Outcomes .......................................................................................................... 34
2.7 Literature Relating to Research Hypotheses ....................................................................... 34
2.7.1 Development of a Model Addressing Safety Climate and Safety Outcomes .............. 34
CHAPTER THREE: METHODOLOGY ..................................................................................... 40
3.1 Introduction ......................................................................................................................... 40
3.2 Proposed Research Model .................................................................................................. 40
3.3 Research Survey ................................................................................................................. 41
3.4 Survey Development ........................................................................................................... 43
3.4.1 Supervision .................................................................................................................. 43
3.4.2 Safety Focus ................................................................................................................. 43
3.4.3 Safety Communication and Feedback ......................................................................... 44
3.4.4 Recognition .................................................................................................................. 45
3.4.5 Training ........................................................................................................................ 45
3.4.6 Coworker Support for Safety ....................................................................................... 46
3.4.7 Job Satisfaction ............................................................................................................ 46
3.4.8 Organizational Commitment ........................................................................................ 46

x
3.4.9 Emotional Exhaustion .................................................................................................. 47
3.4.10 Turnover Intention ..................................................................................................... 47
3.4.11 Safety Motivation....................................................................................................... 47
3.4.12 Reporting Unsafe Behaviors ...................................................................................... 48
3.4.13 Errors.......................................................................................................................... 48
3.4.14 Violations ................................................................................................................... 48
3.4.15 Incidents and Injuries ................................................................................................. 49
3.4.16 Control Variables ....................................................................................................... 49
3.5 Survey Administration ........................................................................................................ 51
3.5.1 Human Subjects ........................................................................................................... 51
3.5.2 Pilot Study .................................................................................................................... 51
3.5.3 Participants ................................................................................................................... 52
3.5.4 Procedure ..................................................................................................................... 52
3.6 Sample Size ......................................................................................................................... 53
3.7 Data Analysis ...................................................................................................................... 53
3.7.1 Exploratory Factor Analysis ........................................................................................ 54
3.7.2 Confirmatory Factor Analysis...................................................................................... 59
3.7.3 Structural Equation Modeling ...................................................................................... 62
CHAPTER FOUR: RESULTS ..................................................................................................... 66
xi
4.1 Descriptive Statistics ........................................................................................................... 66
4.2 Data Screening .................................................................................................................... 69
4.2.1 Missing Data ................................................................................................................ 70
4.2.2 Outliers ......................................................................................................................... 70
4.2.3 Normality, Linearity, and Homoscedasticity Tests...................................................... 71
4.2.4 Multicollinearity .......................................................................................................... 74
4.3 Exploratory Factor Analysis ............................................................................................... 75
4.3.1 EFA of Safety Climate ................................................................................................. 76
4.3.2 EFA of Mediators Variables ........................................................................................ 79
4.3.3 EFA for Safety Performance ........................................................................................ 82
4.4 Confirmatory Factor Analysis ............................................................................................ 91
4.4.1 CFA of Safety Climate................................................................................................. 92
4.4.2 CFA of Employee Turnover ...................................................................................... 100
4.4.3 CFA of Safety Motivation ......................................................................................... 107
4.4.4 CFA of Safety Performance ....................................................................................... 109
4.5 General Model Validation ................................................................................................ 115
4.5.1 Hypothesized CFA Model ......................................................................................... 115
4.5.2. Model Reliability and Validity ................................................................................. 121
4.6 Structural Equation Modeling ........................................................................................... 125

xii
4.6.1 Testing for the Validity of the Causal Structure ........................................................ 127
4.7 Hypotheses Testing ........................................................................................................... 131
4.8 Final Research Model ....................................................................................................... 136
CHAPTER FIVE: DISCUSSION, CONCLUSION, STUDY SIGNIFICANCE,
IMPLICATIONS, LIMITATIONS, AND SUGGESTIONS FOR FUTURE RESEARCH ...... 139
5.1 Discussion ......................................................................................................................... 139
5.2 Conclusion ........................................................................................................................ 144
5.3 Study Significance ............................................................................................................ 145
5.4 Limitations ........................................................................................................................ 146
5.5 Implications ...................................................................................................................... 146
5.6 Suggestions for Future Research ...................................................................................... 147
APPENDIX A: SURVEY QUESTIONNAIRES ....................................................................... 148
APPENDIX B: LETTER OF IRB APPROVAL ........................................................................ 165
APPENDIX C: CORRELATIONS AMONG ALL INDICATORS ......................................... 167
APPENDIX D: EFA RESULTS ................................................................................................. 176
APPENDIX E: CFA RESULTS ................................................................................................. 182
APPENDIX F: ASSESSMENT OF NORMALITY ................................................................... 186
LIST OF REFERENCES ............................................................................................................ 190
LIST OF FIGURES
Figure 1: Multi-level model of organizational culture and climate .............................................. 15
Figure 2 Proposed Research Model Linking Safety Climate, Safety Motivation, Employee
Turnover, Self-Reported Unsafe Acts, Reporting Unsafe Behaviors, and Self-Reported Incidents
and Injuries.................................................................................................................................... 41
Figure 3 Participation Frequencies among RBAF Units .............................................................. 67
Figure 4 Education level Frequency among Participants ............................................................. 68
Figure 5 SPSS Boxplots for Age .................................................................................................. 70
Figure 6 SPSS Boxplots for Education ......................................................................................... 71
Figure 7 Plot of predicted values of the IV against residuals: showing failure of normality ....... 72
Figure 8 Plot of predicted values of the IV against residuals, showing nonlinearity ................... 73
Figure 9 Plot of predicted values of the IV against residuals, showing heteroscedasticity .......... 73
Figure 10 Standardized Output of Safety Climate CFA Model (Latent Variables Correlations) . 93
Figure 11 Standardized Output of the Initial Safety Climate CFA Model ................................... 94
Figure 12 Standardized Output of the Final Safety Climate CFA Model ..................................... 99
Figure 13 Latent Variables Correlations Output of Employee Turnover CFA Model ............... 101
Figure 14 Standardized Output of Initial Employee Turnover CFA Model ............................... 102
Figure 15 Standardized Output of the Final Employee Turnover CFA Model .......................... 106
Figure 16 Standardized Output of the Initial Safety Motivation CFA Model ............................ 108
Figure 17 Revised Safety Motivation CFA Model Standardized Output ................................... 109
Figure 18 Standardized Output of Initial Safety Performance CFA Model ............................... 110
Figure 19 Standardized Output of the Final Safety Performance CFA Model ........................... 114

xiv
Figure 20 Hypothesized CFA Model for the First Run (Standardized Estimates) ..................... 116
Figure 21 Final Hypothesized CFA Model (Standardized Estimates) ........................................ 120
Figure 22 Hypothesized Structural Model (Hyper Model) ......................................................... 126
Figure 23 Generic Structural Model ........................................................................................... 128
Figure 24 Revised Structural Model ........................................................................................... 129
Figure 25 Final Structure Model ................................................................................................. 137
Figure 26 Final Structure Model as Human Factor Model ......................................................... 138

xv
LIST OF TABLES
Table 1 Definitions of safety climate ............................................................................................ 19
Table 2 Study Variables ................................................................................................................ 50
Table 3 Guidelines for Identifying Significant Factor Loadings Based on Sample Size ............. 56
Table 4 Differences between orthogonal and oblique rotated solutions in SPSS ......................... 58
Table 5 Factor Loading Scale ....................................................................................................... 61
Table 6 Descriptive Statistics........................................................................................................ 66
Table 7 Statistics of Number of Participants in Each Unit ........................................................... 67
Table 8 Statistics of Education Scale ............................................................................................ 68
Table 9 Variables Abbreviations for Research Measures ............................................................. 69
Table 10 Independent variables (IV) that violate multivariate normality assumption ................. 74
Table 11 Independent variables with insignificant correlation ..................................................... 75
Table 12 Initial EFA for safety climate ........................................................................................ 77
Table 13 Revised EFA for Safety Climate ................................................................................... 78
Table 14 Correlation Matrix for Safety Climate Factors .............................................................. 79
Table 15 Initial EFA for Mediators Variables .............................................................................. 80
Table 16 Revised EFA for Mediators ........................................................................................... 81
Table 17 Correlation Matrix for Mediators Factors ...................................................................... 82
Table 18 Initial EFA for Safety Performance ............................................................................... 83
Table 19 Revised EFA for Safety Performance ............................................................................ 84
Table 20 Correlation Matrix for Safety Performance ................................................................... 84
Table 21 SPSS results for each EFA............................................................................................. 85

xvi
Table 22 Initial EFA after adding all revised parts ....................................................................... 86
Table 23 Final EFA for the research model .................................................................................. 88
Table 24 Correlation Matrix for final EFA model ........................................................................ 89
Table 25 SPSS Results for the Developed EFA Model ................................................................ 90
Table 26 Factors Internal Consistency (Reliability) of the EFA Model ....................................... 90
Table 27 Modification Indices Output for Safety Climate CFA Model ....................................... 95
Table 28 Selected Output Standardized Residuals for Safety Climate CFA Model ..................... 97
Table 29 Modification Indices Output for Safety Climate CFA Model: after modifications ....... 98
Table 30 Comparison among Fit Indices of Safety Climate CFA Models ................................. 100
Table 31 Modification Indices Output for Employee Turnover CFA Model ............................. 104
Table 32 Modification Indices Output for Employee Turnover CFA Model: after modifications
..................................................................................................................................................... 105
Table 33 Comparison among Fit Indices of Employee Turnover CFA Models ......................... 106
Table 34 Modification Indices Output for Safety Motivation CFA Model ................................ 107
Table 35 AMOS Notes adding Covariance between SM1 and SM5 .......................................... 108
Table 36 Comparison among Fit Indices for Models of Safety Motivation ............................... 109
Table 37 Modification Indices Output Safety Performance CFA Model ................................... 111
Table 38 Modification Indices Output of the Safety Performance CFA Model: after
Modifications (Threshold = 8) .................................................................................................... 112
Table 39 Comparison among Fit Indices for Models of Unsafe Acts and Reporting Behavior . 113
Table 40 Selected Standardized Output for Hypothesized CFA Model: Latent Variable
Correlations ................................................................................................................................. 117
xvii
Table 41 Modification Indices of Hypothesized CFA Model .................................................... 118
Table 42 Comparison between Hypothesized CFA models ....................................................... 119
Table 43 Selected AMOS Output for Correlations among Final CFA Model’s Constructs ...... 121
Table 44 Descriptive Statistics, Cronbach’s α Values, and Correlations among Latent Constructs
..................................................................................................................................................... 123
Table 45 Convergent Validity ..................................................................................................... 124
Table 46 Discriminant Validity .................................................................................................. 125
Table 47 Selected Output for Hypothesized Model: Variable Summary ................................... 127
Table 48 Goodness-of-fit summary for the models .................................................................... 130
Table 49 Unstandardized Estimates Regression Weights for Modified Model: Structural Path 131
Table 50 Standardized Direct, Indirect, and Total Effects .......................................................... 133
Table 51 Mediated Effect: Standardized Path Coefficients (β) using AMOS Bootstrapping .... 134
Table 52 Tests of Hypotheses ..................................................................................................... 135
Table 53 Age and Education Effects .......................................................................................... 136
Table 54 Goodness-of-Fit Indices for Final Model .................................................................... 136
xviii
LIST OF ACRONYMS
AMT: Aircraft Maintenance Technician
AVE: Average Variance Extracted
CFA: Confirmatory Factor Analysis
CR: Construct Reliability
EFA: Exploratory Factor Analysis
HFACS: Human Factors Analysis and Classification System
HRO: High Reliability Organization
MES: Maintenance Environment Survey
ML: Maximum Likelihood
NTSB: National Transportation Safety Board
PAF: Principle Axis Factor
RBAF: Royal Bahraini Air Force
SEM: Structural Equation Modeling
SMS: Safety Management System
SPSS: Statistical Package for the Social Sciences

1
CHAPTER ONE: INTRODUCTION
1.1 Background
Ensuring high levels of safety remain a top issue to aviation. According to Shappell and
Wiegmann (2000), 80% of all civil and military aviation accidents have been linked to human
error. Specifically, 20% of all these accidents have been attributed to maintenance and inspection
errors (Drury, 2001). Thus, aircraft maintenance plays an important role and is considered as a
critical safety component in aviation industries. Research has also shown that aircraft
maintenance-related accidents are approximately 6.5 times more likely to result in fatal events
than aircraft accidents in general (Marais & Robichaud, 2012). Extensive analysis of these
accidents has shown that they are deeply rooted in organizational factors. Therefore, it is crucial
to identify which of these factors link together to influence safety outcomes.
Research, over the thirty years, has led to a consensus that safety climate has become an
important foundation for organizational health and safety. Safety climate is considered to be a
leading indicator of safety outcomes (Zohar, 2010). Studies on safety climate have utilized the
importance of organizational factors as antecedents of error (e.g., Wiegmann, von Thaden,
Mitchell, Sharma, & Zhang, 2003). The human error accident investigation schemes within the
aviation take into account not only the role of organizational variables but also the individual
variables (Shappell & Wiegmann, 1997). Furthermore, identifying errors causation has led
researchers to examine the links among safety climate, individual variables and unsafe behaviors
such as violations and errors in aircraft maintenance environment (Fogarty, 2004; 2005; Fogarty
& Buikstra, 2008; Fogarty & Shaw, 2010; Park, Kang, & Son, 2012).

2
While accident investigations can provide a wealth of information to improve safety,
accidents are fortunately rare. Incidents should be investigated in more depth (Marais &
Robichaud, 2012). Ostroff, Kinicki, and Tamkins (2003) recommended that research of culture
and climate on studying organizational and individual behavior should be continued to contribute
more knowledge to the field of industrial and organizational psychology.
1.2 Problem Statement
There is an extensive literature to support a relationship between safety climate and
safety outcomes in aircraft maintenance (Fogarty, 2004; 2005; Fogarty & Buikstra, 2008;
Fogarty & Shaw, 2010; Park et al., 2012). However, there is limited investigation of the effect of
safety motivation and employee turnover on this relationship.
Safety motivation is considered as a determinant of safety performance (Campbell, 1990)
and its influence has been used only in non-related aircraft maintenance studies (e.g., Chen &
Chen, 2014; Neal & Griffin, 2006; Neal, Griffin, & Hart, 2000). On the other hand, studies of the
effect of employee turnover have mainly focused on employee replacement cost, lower
productivity, and other organizational performance (Allen, Bryant, & Vardaman, 2010; Dess &
Shaw, 2001; Hancock, Allen, Bosco, McDaniel, & Pierce, 2013). Therefore, an empirical
research is needed to address this important gap by examining the mediating effect of safety
motivation and employee turnover on the relationship between safety climate and safety
outcomes in an aircraft maintenance environment.

3
1.3 Research Objectives
The main objective of this study is to develop a model which can explain the
relationships between safety climate, employee turnover, safety motivation, self-reported unsafe
acts, reporting unsafe behaviors, and self-reported workplace incidents and injuries in the
aviation maintenance environment. The model also tests the mediating roles of employee
turnover and safety motivation on perceived safety climate and safety outcomes. Another study
objective is to gain a better understanding of the maintenance technician’s perception on safety
within Royal Bahraini Air Force (RBAF). This study also examines the effects of age and
education level on the research model constructs.
1.4 Research Hypotheses
In this research, the following hypotheses were proposed to test the structural
relationships among the model constructs: A full details of the predication of these hypotheses
are discussed in Chapter Two.
H1: Perceived safety climate has a direct effect on self-reported incidents and injuries.
H2: A self-reported unsafe act has a direct effect on self-reported incidents and injuries.
H3: A self-reported unsafe act has a direct effect on reporting unsafe behaviors.
H4: Perceived safety climate has a direct effect on reporting unsafe behaviors.
H5: Perceived safety climate has a direct effect on employee turnover.
H6: Employee turnover has a direct effect on safety motivation.

4
H7: Employee turnover has a direct effect on self-reported unsafe acts.
H8: Employee turnover will mediate the relationship between safety climate and self-
reported unsafe acts.
H9: Perceived safety climate has a direct effect on safety motivation.
H10: Safety motivation has a direct effect on self-reported unsafe acts.
H11: Safety motivation has a direct effect on reporting unsafe behaviors.
H12: Safety motivation will mediate the relationship between safety climate and self-
reported unsafe acts.
The next chapter provides a literature review of aviation maintenance and inspection
tasks, human error in aviation maintenance, and human error models. Additionally, the concept
of organizational culture and organizational climate, and the safety climate concept and its
empirical development have been discussed. Research methodology is discussed in Chapter
Three. Research findings are covered in Chapter Four, followed by discussion, conclusion, study
significance, implications, limitations, and suggestions for future research in Chapter Five.
Finally, appendices that provide supplemental information are also added to this study.
5
CHAPTER TWO: LITERATURE REVIEW
An in-depth literature review is conducted during the preparation of this work. At the
beginning, the aviation maintenance and inspection tasks are presented. Next, an overview of
human error in aviation maintenance is covered. In addition, human error causation models are
further discussed. The chapter finishes by discussing the concept of organizational culture and
organizational climate, the safety climate concept and its empirical development, and literature
relating to the study variables and research hypotheses.
2.1 Aviation Maintenance and Inspection Tasks
Maintenance in general can be defined as a set of activities to repair and maintain
equipment to a specified operating condition and consistent with cost effective, conform to
safety, and environmental regulations (Pintelon & Gelders, 1992). The quality of maintenance
tasks can be significantly affected by organizational cultural conceptions such as the better
culture is, the lower chance of violations (Aju kumar & Gandhi, 2011). These conceptions made
industries to realize the importance of maintenance and human error reduction (Reason, 1990;
Shenoy & Bhadury, 1998) and especially after major accidents occurred. For example, some of
the worst accidents in industrial history are the 1984 Bhopal Disaster of leakage of Methyl
Isocyanite (MIC) in Bhopal in India and the 1986 Chernobyl Disaster in Ukraine. They were
both caused by poor maintenance of the safety systems.
Safety is defined as “ management of risk within a value that is acceptable to the society”
(Patankar & Taylor, 2004). Patankar and Taylor (2004) define a maintenance action to be safe by
aircraft maintenance technician (AMT) when:

6
1. AMT is qualified to perform the job.
2. AMT uses approved and appropriate data, tools, and procedures.
3. AMT does not exceed his physical capacity while performing the job.
4. AMT never signs off a job that he does not perform.
5. AMT never leaves any job with incomplete documentation.
Safety of aviation maintenance and inspection tasks depends on minimizing error in all
facets of the system. This system is a complex one with many interrelated human and machine
components, in which individuals perform varied tasks in an environment with time pressures,
stress, fatigue, and sometimes difficult ambient conditions such as temperature and humidity.
Chang and Wang (2010) explain AMTs work settings such as core capacity of the AMTs
themselves, interactions with other technicians, and working on software and hardware
technologies. In addition, AMTs perform many different maintenance tasks on different types of
aircraft during working hours that can be either late at night or early morning.
The model system of aviation maintenance and inspection developed by Latorella and
Drury (1992) contains four components: personnel, equipment, documentation, and task
requirements. These components are subject to constraints of physical and the social
environment or organizational environment. The interaction of the task with the human and the
environment are the basis of most human errors.

7
2.2 Human Error in Aviation Maintenance
The typical definition of human error in maintenance and inspection refers to the
activities of the inspector or repair person. Human error is the failure to achieve an intended
outcome beyond the influence of random occurrence (Reason, 1990). Reason divided errors into
three types; slips and lapses are failures of intended actions, while mistakes are failures of these
intended actions to achieve the desired consequences. Reason distinguished between error and
violation, while errors are related to the individual’s cognitive process, violations are related to a
social environment in which behavior is governed by operating procedures, recommended
practice, rules, or standards. Hobbs and Williamson (2003) determined the contributing factors
that associated with the types of errors in aircraft maintenance. For example, they found links
between rule violations and time pressure and between memory lapses and fatigue.
An Australian aircraft maintenance study shows that 30.1% of errors that led to aircraft
incidents were memory lapses and these errors had threatened the aircrafts safety. On the other
hand, slips were the most common error that injured maintenance technicians. In addition, 19.3%
of aircraft incidents and 25.7% of worker safety incidents were caused by violations (Reason &
Hobbs, 2003).
Many aviation accidents were caused by maintenance errors which involved human
factors. Therefore, these factors must be detected earlier to minimize accidents or workplace
injuries. Additionally, general organizational characteristics influence performance at the
individual level. Maintenance technicians’ errors result from a series of contributing factors and

8
these factors are under management control and, therefore, can be managed (Rankin, Hibit,
Allen, & Sargent, 2000).
The concurrent trends of increased maintenance and inspection workload, and diminished
maintenance personnel with generic human erring tendencies seem to forecast increasing safety
issues associated with human errors in maintenance and inspection (Latorella & Prabhu, 2000).
These maintenance-related errors can be described as immediate observable effect on aircraft
equipment, ultimate effects on flight missions (incidents/accidents), and secondary effects on the
organization productivity (Latorella & Prabhu, 2000). For example, 33% of all military aviation
equipment malfunctions found to be resulted from poor prior maintenance or improperly applied
maintenance procedures (Ruffner, 1990).
Another example failure of maintenance that provided cases of catastrophic is Alaska
Airlines Flight 261 accident that occurred on January 31st, 2000. This flight suffered “a loss of
airplane pitch control resulting from failure of the horizontal stabilizer trim system jackscrew
assembly’s acme nut threads” (Aviation Safety Network, 2002). According to the National
Transportation Safety Board (NTSB), the thread failure was due to excessive wear which
resulted from a missed or inadequately performance of lubrication since the last time that the
task had been done. All of the 88 people onboard were lost as the plane crashed into the deep
water. Later, NTSB revealed that this failure was compounded by poor maintenance from
mechanics and neglecting from airlines managers, inspectors, and supervisors of keeping track of
this procedure. This accident illuminates a poor safety climate which leads to the unsafe acts and
conditions.
9
According to Reason (1990), the above maintenance error was considered to be as a
latent error whose presence provoked the active failure from the pilot which led directly to the
accident. Latorella and Prabhu (2000) have reviewed both reactive and proactive methods of
error detection, and methods for controlling human errors in aviation maintenance. Wenner and
Drury (2000) have studied the relationships between the hazard patterns and latent failures. They
developed strategies by identifying the latent failures that common to different hazard patterns in
order to prevent any upcoming damages.
2.3 Human Error Models in Aviation
Over the past decades, research of human factors has been increasingly concerned with
developing tools for managing workforce unsafe acts. High reliability organizations (HRO) offer
important models that constitute a resilient system. Such a system has safe practices which it
enables the organization to withstand its operational dangers and to achieve its objectives
(Reason, 2000). Previous investigation analysis have revealed that accidents are frequently
repeating in the same sequence of events that played out many times before (Shappell &
Wiegmann, 2009). Reason and Hobbs (2003) have also argued that earlier when they explained
the error-inducing situations. They mentioned that “the maintenance error problem can be
managed in the same way that any well-defined business risk can be managed”. What remains to
be addressed are those accidents attributable to human error that jeopardize the aviation safety.
The current aviation accident records reveal that 70% to 80% of all aviation accidents are at least
partially attributable to human error (Shappell & Wiegmann, 2009).
10
The SHEL model that developed by Edwards (1988) provides an overview of the aviation
ergonomics or systems perspective. SHEL describes four basic components of the interaction
between human and machine to improve the system performance. These components are
Software, Hardware, Environment, and Liveware. This model was recommended by the
International Civil Aviation Organization (ICAO) in 1993 to be used as a framework in the
investigation of aviation accidents (Wiegmann & Shappell, 2003).
Another model is the four P’s of flight deck operations that developed by Degani and
Wiener (1994). This model is focused on the interaction of philosophy of management, policies,
procedures, and practices of aircrew for operations on the flight deck. All of these factors act
together to enhance flight safety. In addition, the Reason’s Swiss cheese model of accidents
causation (1990) provides a comprehensive theory of human error. This model has four
components: organizational influences, unsafe supervision, precondition for unsafe acts, and
unsafe acts. According to Reason, if there are breakdowns in the interactions among these
components, accidents might occur. On other way, these failures transfer through the holes
within the layers of the system.
The Human Factors Analysis and Classification System (HFACS) model was developed
by Wiegmann and Shappell (2001a) to understand the underlying causal factors that led to
aviation accidents in the United States Navy. The HFACS framework was based on Reason’s
(1990) Swiss cheese model. The development of HFACS was driven by the increasing problems
of human performance. The Federal Aviation Administration (FAA) has employed HFACS to
identify human factors in commercial and general aviation (Wiegmann & Shappell, 2001a).
11
Accident investigators have used HFACS framework as a guide to identify failures within the
organization and to identify where hazards have arisen historically within the entire system in
order to prevent them from reoccurring.
Wiegmann and Shappell (2001b) claim that the HFACS framework links the gap between
theory and practice by providing safety professionals with a theoretically based tool for
identifying and classifying the human errors in aviation mishaps. The framework of the HFACS
model has been used intensively in investigating aviation accidents (Dambier & Hinkelbein,
2006; Gaur, 2005; Shappell et al., 2007). Li and Harris (2006) suggest that active failures are
supported by latent conditions in the organization and the HFACS framework was proven to be a
useful tool for guiding accident investigations and developing accident prevention plans.
Krulak (2004) has proposed the HFACS Maintenance Extension (ME) which was
adapted for maintenance-related mishaps. This taxonomy which was discussed by a number of
studies (Krulak, 2004; Rashid, Place, & Braithwaite, 2010) was derived from the operational
HFACS program for flight crews. HFACS-ME is an accident analysis system that is designed to
deeply analyze human factors’ influence on aviation maintenance. It describes the present errors
and the latent supervisory, maintainer, and working conditions that cause unsafe maintainer acts.
Krulak (2004) examined 1016 aircraft mishaps between 1996 and 2000 using information from
the Maintenance Error Information Management System (MEIMS) web-based database. These
mishaps were categorized using HFACS-ME. The third level factors of inadequate supervision,
attention/memory errors, and judgment/decision errors were, respectively, involved in 80%,
51%, and 52% of the whole population of mishaps studied.
12
Rashid et al. (2010) introduced an organized list of specific failures resembling each of
the HFACS-ME taxonomy third order categories. They concluded that a large proportion of
accidents and incidents were caused by factors that were deeply rooted within organizational and
managerial levels. Moreover, individual maintainer erroneous acts gained major scores of such
causal factors. In addition, Rashid, Place, and Braithwaite (2013) were able to predict and
provide guidance for future intervention of maintenance errors. They show that the scenarios for
aviation maintenance errors initiation, occurrence, and further propagation are infinite. Thus,
they concluded that only eliminating the basic root causes of errors will lead the way for a
successful error-free performance.
2.4 Organizational Culture and Organizational Climate
Organizational culture and climate are each about understanding psychological
phenomena in organizations despite the fact that they have been studied in different disciplines
(Ostroff et al., 2003). Schneider, Ehrhart, and Macey (2013) have observed that organizational
climate and organizational culture are two alternative constructs for conceptualizing the
description and experience of people in their workplace.
The construct of organizational climate preceded the construct of organizational culture.
The former was introduced in the 1960s and dominated early research on human organizational
environments and then, the latter became a popular issue for study during the 1980s (Ostroff et
al., 2003; Schneider et al., 2013). Culture and climate are both used in organizations to identify
the environment that affects the behavior of people. Reichers and Schneider (1990) believe that
13
both climate and culture are important concepts for organizations because in combination they
identify and may prospectively predict human behavior. Ostroff et al. (2003, p 579) argue that,
“The social and symbolic processes associated with the emergence of organizational
culture and climate influence both individual and group behaviors, including turnover,
job satisfaction, job performance, safety, and service quality”.
The climate construct has been focused on measuring individuals’ perceptions about their
organizations’ practices and procedures, rather than beliefs, values, or norms that shared by
groups of people (Schneider, 1975; Trice & Beyer, 1993). Typically, organizational climate
describes aspects of an organization’s current state and thus it is regarded as a narrower concept
than organizational culture (Glendon & Stanton, 2000) or it refers to psychological environments
in which individuals’ behaviors occurred (Trice & Beyer, 1993). Climate is also shared
perceptions of organizational policies, practices, and procedures (Reichers & Schneider, 1990).
On the other hand, organizational culture includes shared meanings, assumptions, and underlying
values (Schein, 2004). Schein (2004) also defined organizational culture as a way of perceiving
and thinking, and learned responses to the group’s problems. Schneider (1990) has concluded
that climate should be studied as a construct that includes the strategic focus of the
organization’s goals. This strategic focus needs to be the target of climate assessment for the
management.
After reviewing articles in three of the top empirical journals in industrial/organizational
psychology from 2000 to 2012, Schneider et al. (2013) concluded that the focus in the
14
industrial/organizational psychology research literature has been shifted toward organizational
climate rather than organizational culture.
Research on organizational culture uses qualitative approaches that conduct on
participants’ observation and through interviews. In their review on the content of organizational
culture, Ostroff and colleagues (2003) have summarized that most researchers either use
quantitative surveys to evaluate espoused values and beliefs or conduct qualitative analysis to
evaluate the deeper layers of organizational culture. Furthermore, they conclude that researchers
should use multiple methods to assess organizational culture. The increased use of qualitative
methods in the study of organizational climate may result in richer and more useful descriptions
of organizations (Reichers & Schneider 1990).
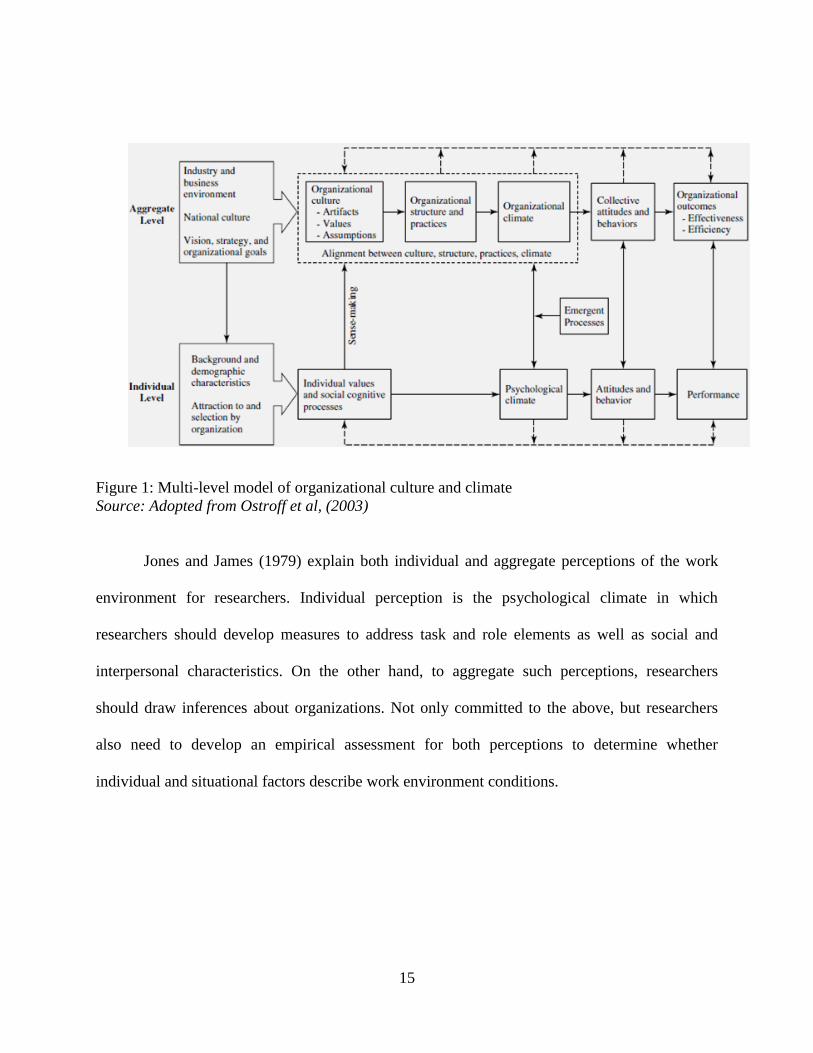
Figure 1 represents a heuristic model for providing a conceptual framework of culture
and climate. It shows that organizational culture can affect organizational structure and practices
which in turn provide the context for climate perceptions. In addition, psychological climate can
be influenced by individuals’ values and social cognitive processes. Therefore, an organizational
climate is likely to emerge when these climate perceptions are shared across an organization’s
employees.
15
Figure 1: Multi-level model of organizational culture and climate
Source: Adopted from Ostroff et al, (2003)
Jones and James (1979) explain both individual and aggregate perceptions of the work
environment for researchers. Individual perception is the psychological climate in which
researchers should develop measures to address task and role elements as well as social and
interpersonal characteristics. On the other hand, to aggregate such perceptions, researchers
should draw inferences about organizations. Not only committed to the above, but researchers
also need to develop an empirical assessment for both perceptions to determine whether
individual and situational factors describe work environment conditions.
16
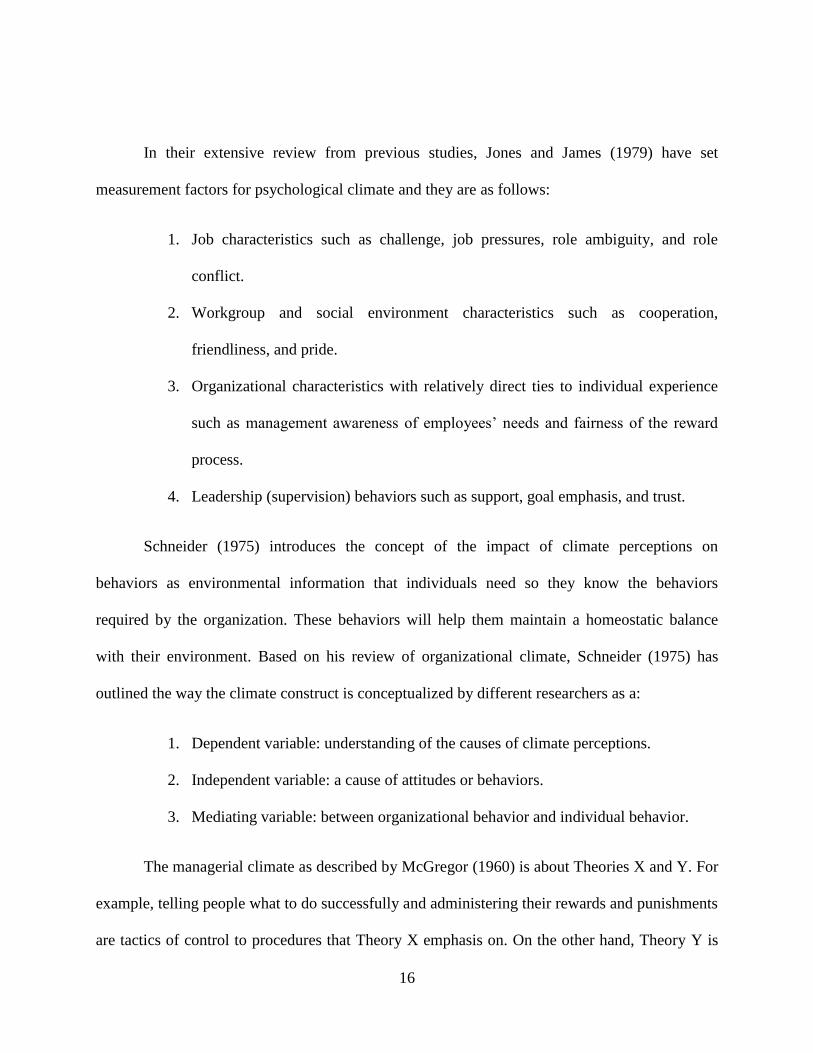
In their extensive review from previous studies, Jones and James (1979) have set
measurement factors for psychological climate and they are as follows:
1. Job characteristics such as challenge, job pressures, role ambiguity, and role
conflict.
2. Workgroup and social environment characteristics such as cooperation,
friendliness, and pride.
3. Organizational characteristics with relatively direct ties to individual experience
such as management awareness of employees’ needs and fairness of the reward
process.
4. Leadership (supervision) behaviors such as support, goal emphasis, and trust.
Schneider (1975) introduces the concept of the impact of climate perceptions on
behaviors as environmental information that individuals need so they know the behaviors
required by the organization. These behaviors will help them maintain a homeostatic balance
with their environment. Based on his review of organizational climate, Schneider (1975) has
outlined the way the climate construct is conceptualized by different researchers as a:
1. Dependent variable: understanding of the causes of climate perceptions.
2. Independent variable: a cause of attitudes or behaviors.
3. Mediating variable: between organizational behavior and individual behavior.
The managerial climate as described by McGregor (1960) is about Theories X and Y. For
example, telling people what to do successfully and administering their rewards and punishments
are tactics of control to procedures that Theory X emphasis on. On the other hand, Theory Y is

17
about the nature of relationships with the surrounding environment that encourages commitment
to organizational objectives. For example, if employees are lazy, unwilling to take
responsibilities, intransigent, and uncooperative, Theory Y implies that the causes lie in
management’s methods of control.
2.5 Safety Culture and Safety Climate
In recent years, many safety studies have emphasized on the effect of organizational
factors on safety climate. The terms safety culture and safety climate are defined below:
2.5.1 Safety Culture
Beliefs and values of health and safety in organization culture emerged the safety culture
subset (Clarke, 1999). In the development of a positive safety culture study, Clarke (1999)
suggests that different shared perceptions of safety among managers, supervisors, and employees
will negatively influence staff-management communications, confidence in management and
commitment to safety. The safety culture influences the employees’ behavior on perceiving what
is expected from them such as norms regarding acceptable behaviors (Clarke, 1996).
Safety culture operates at different levels and through various mechanisms. It can be
noticeable at such levels of behaviorally, psychologically, and socially, and through mechanisms
such as values, attitudes, beliefs, and normative behaviors. For example, the impact of the safety
management system (SMS) on safety outcomes in aircraft maintenance organization is likely to
be mediated by safety culture (McDonald, Corrigan, Daly, & Cromie, 2000).

18
2.5.2 Safety Climate
It appears to be increasing consensus about the nature of safety climate concept (Table 1),
even though researchers have not provided one definitive description (Wills, Watson, & Biggs,
2006). However, the definition of safety climate has been generally accepted as a snapshot of
workforce perceptions of safety (Flin, Mearns, O’Connor, & Bryden, 2000).
The study’s of Zohar (1980) has been the origin of safety climate studies. Zohar (1980)
constructed a 40-item questionnaire to measure safety climate in industrial organizations. This
safety climate has served as a useful tool in understanding the effect of employees’ perception of
workplace safety on their occupational behavior. Then, safety climate has been studied through
different industries such as chemical (Bosak, Coetsee, & Cullinane, 2013), automobile (Clarke,
2006), aviation maintenance (Fogarty & Shaw, 2010), and grain (Seo, 2005).
Safety climate has been used as an antecedent of safety performance, accidents, and
injuries at workplace in many studies. Research has supported the role of safety climate as an
alternative safety performance indicator (Guldenmund, 2000; Neal, Griffin, & Hart, 2000) and
unsafe work behavior predictor (Seo, 2005). Neal et al. (2000) suggest that a specific climate for
safety is more strongly related to safety performance than organizational climate. Varonen and
Mattila (2000) have reported that safety climate is correlated with the accident rate such as the
better it is, the lower the accident rate for the organization. In addition, researchers used
empirical and cross-level studies that have shown relationships between safety climate and job
satisfaction (Johnson & McIntye, 1998), and safety climate and emotional exhaustion in term of
stress symptoms and fatigue (Feldt, Kinnunen, & Mauno, 2000).

19
Psychological safety climate has been used to help in explaining workers’ safety
behaviors (Bosak et al., 2013; Larsson, Pousette, & Törner, 2008; Morrow et al., 2010).
Organization-level and group-level climates are globally aligned, and subunits (groups) safety
climate mediates the effect of organizational safety climate on employee safety behavior (Zohar
& Luria, 2005). However, Baba and his colleagues (Baba, Tourigny, Wang, & Liu, 2009) have
showed that perceived safety climate and individual performance did not correlate significantly.
They mentioned that the impact of safety climate on individual performance is moderated by
personal characteristics and psychological factors.
Table 1 Definitions of safety climate
Reference Safety Climate
Zohar (1980) “A summary of molar perceptions that employees share
about their work environments”.
Brown & Holmes (1986) “A set of perceptions or beliefs held by an individual
and/or group about a particular entity”.
Dedobbeleer & Béland (1991) “Molar perceptions people have of their work settings”.
Niskanen (1994) “A set of attributes that can be perceived about particular
work organizations and which may be induced by the
policies and practices that those organizations impose
upon their workers and supervisors”.
Williamson, Feyer, Cairns, &
Biancotti (1997)
“Safety climate is a summary concept describing the
safety ethic in an organization or workplace which is
reflected in employees' beliefs about safety”.
Neal et al. (2000) “A specific form of organizational climate which
describes individual perceptions of the value of safety in
the work environment”.
Wills et al. (2006) “Represents employees’ perceptions about organizational
support, especially toward safety”.
Source: modified from Guldenmund (2000)
20
2.6 Literature Relating to Study Variables
The study variables were classified into four groups as follows: latent variables of safety
climate, mediator variables of employee turnover and safety motivation, dimensions of safety
performance, and dimensions of safety outcomes.
2.6.1 Determining Safety Climate Dimensions
Employees can experience safety climate in their workplaces. Their perceptions reflect
the level to which they consider that safety is valued within the organization. On other word, the
patterns of behavior that support safety should form climate for safety (Patterson et al., 2005).
What to study in climate research depends upon the objectives of the study. Safety climate can
be made up by a large range of factors (Guldenmund, 2007). The researcher decides about which
variables to be included based on selection research-type considerations. Schneider (1975)
reveals in his literature review that many climate researchers have evaluated the specific climate
in which they were interested rather than attempting to develop some omnibus measure. It is
possible that the safety climate dimensions within one industry may not work well in another
industry (Vinodkumar & Bhasi, 2009).
According to Griffin and Neal (2000), the safety climate can be identified as a higher
order factor by using specific first-order dimensions which reflect employee perceptions of
safety-related factors (e.g. policies, procedures, and rewards) in the work environment.
Moreover, the above authors suggest using this higher order factor for the purpose of
determining the effect of safety climate on safety outcomes and using the first-order factors for
other purposes. Therefore, several safety climate studies were reviewed to determine those first-

21
order factors that constitute safety climate that are applicable for an aircraft maintenance
environment.
Flin et al. (2000) have reviewed 18 published reports of safety climate surveys and
examined 18 dimensions that were used to assess safety climate. They have found that the most
three typically assessed dimensions were related to management/supervision, safety system, and
risk. According to O’Connor, O’Dea, Kennedy, & Buttrey (2011), management/supervision
factor was in all of the aviation safety climate questionnaires. Fogarty (2004) used five variables
to measure safety climate in aircraft maintenance facility; supervision, safety focus, recognition,
feedback, and training. Park et al. (2012) used the same variables as Fogarty (2004) in
determining safety climate in aircraft maintenance unit. However, they replaced both recognition
and feedback with communication and coworker support. Their decision was based on that the
former variables have negative effects on other employees who have not been rewarded
especially in military organization. In addition, Zohar and Luria (2005) used 16 items to measure
the group-level safety climate. These items cover three content themes: Active Practices
(Monitoring, Controlling), Proactive Practices (Instructing, Guiding), and Declarative Practices
(Declaring, Informing). The contents of these items are mostly similar to those in Fogarty (2004)
and Park et al. (2012).
As a result, a combination of all safety climate first-order factors from Fogarty (2004)
and Park et al. (2012) studies was used in this research except that communication and feedback
were combined under one factor similar to that study of Vinodkumar and Bhasi (2010). Thus,
this study adopted the safety climate as the measured construct with a proposed set of first-order

22
factors contained supervision, safety focus, safety communication and feedback, recognition,
coworker support for safety, and training. These factor are discussed as follow:
2.6.1.1 Supervision
Management/supervision is a measurement of an organization's safety climate that relates
to perceptions of management attitudes and behaviors with respect to safety. Generally, it is
measured by respondents' satisfaction with supervision in relation to safety or through how
employees experience support and understanding from their supervisors. This recognizes the key
role of the perception of the first-line supervisor to safety. Subordinates with high-quality
supervisor relations had more positive climate perceptions than those with low-quality relations
(Kozlowski & Doherty, 1989). Management support for safety can take the form of managers
and supervisors (Thompson, Hilton, & Witt, 1998). Managers have to lead and create a climate
for attitude and culture change. They have to adopt a coaching stance and offer a role model
(Ball & Procter, 1994). Perceptions of managers’ safety commitment by workers would have a
significant effect on their safety behavior in which they are more likely to report any incidents
(Clarke, 1996). Furthermore, management commitment to safety was found to be negatively
related to employee’s risk behavior (Bosak et al., 2013).
In a superior-subordinate relationship, behavior and attitude of the superior correlate both
with high productivity and with the morale of subordinates (McGregor, 1960). Supervisors
demonstrate safety concerns to the shop floor more directly than managers (Kozlowski &
Doherty, 1989). Supervisors appear to influence safety by influencing the fairness through the

23
interaction with employees, thus leading to employee impressions of supervisors’ safety
concerns (Thompson et al., 1998).
In their recent research on safety climate, Zohar and Luria (2005) revealed meaningful
sub-units (groups) variation in a single organization, attributable to supervisory discretion in
implementing formal procedures regarding safety versus workload. They judged that top
managers are concerned with establishing procedures (tactical guidelines) to implement the
organization’s policy (strategic goals) whereas supervisors’ practices are to execute and direct
these procedures. The intensity with which supervisors respond to safety issues establishes the
expectancy valence associated with safe or unsafe behaviors. As a result, the relationship
between group-level climate and safe behaviors should be positive within the subunits (Zohar,
2000). In addition, hierarchical level of the leaders has a different effect on the relationships
between leaderships and safety and this is due to the increased distance between leaders and
shop-floor employees (Zohar, 2002).
2.6.1.2 Safety Focus
Safety focus is an organization commitment to safety. More specifically, it is about
aspects of the organization’s safety management system such as safety policies and safety
equipment. However, in this study, it has been used as employees’ satisfaction and attitudes
toward workplace safety. For example, if safety issues are repeatedly ignored or made contingent
on maintenance workload, maintenance technicians will infer low safety priority, leading them to
assess that shortcut procedure is more likely to be supported than safe behavior.
24
2.6.1.3 Safety Communication and Feedback
Communication is about sharing of information throughout the organization. In aviation
maintenance, a good communication may be considered as a foundation for organization
successful (Taylor, 2000). According to Endsley and Robertson (2000), management needs to
provide maintenance technicians not only with knowledge, but also with the skills and abilities to
effectively communicate their knowledge in order to complete their tasks efficiently. In many
cases, communication and coordination break down when maintenance technicians make
unspoken assumptions and poor communication to confirm the situation (Reason & Hobbs,
2003).
It has been empirically shown that communication is an important factor of safety climate
(DeJoy, Schaffer, Wilson, Vandenberg, & Butts, 2004). O’connr et al. (2011) indentified safety
communication to be a factor of safety climate that is particularly relevant to aviation. In addition
to the importance of communication, safety communication may be considered as a challenge in
the aviation industry than other industries and this due to the less ability of engagement in direct
communication among air traffic control, maintenance, pilots, and other parties. Johnson and
McIntye (1998) have found that communication was strongly associated with scores on job
satisfaction. Their data were collected from 8,126 employees in a large government service
agency.
2.6.1.4 Recognition
The process of employee recognition can promote safe behaviors and reduce unsafe
behaviors at work. Employees feel that their work is valued when their good work is recognized.

25
Thus, they will have a positive organizational climate and will be more satisfied and motivated to
improve their safety at workplace. Therefore, organizations should work on recognizing their
employees to increase their sense of achievement for their work well done. In addition, this
recognition is meant to encourage more of their actions and to reinforce their positive behavior
that need to be repeated.
2.6.1.5 Coworker Support for Safety
Pettersen and Aase (2008) shows that the support a technician gets from colleagues is
important for safe work practices in aviation line maintenance. Coworker can influence safety-
related communication (Tucker, Chmiel, Turner, Hershcovis, & Stride, 2008), safety regulations
(Laurence, 2005), and risk-taking behavior at work (Westaby & Lowe, 2005).
2.6.1.6 Training
Training refers to the adequacy of training for the job and the extent to which
management concerns with developing employees’ technical skills, knowledge, and
qualifications. Cooper and Phillips (2004) demonstrated that employee perception toward the
importance of safety training when measuring safety climate factor was highly predictive of
actual safety behaviors.
2.6.2 Determining of Employee Turnover Dimensions
There are two types of employee turnover, voluntary and involuntary. However, the focus
of this research is on the voluntary one. Voluntary turnover is “an employee’s decision to
terminate the employment relationship” (Dess & Shaw, 2001). According to Sheehan (1993), if

26
an employee is dissatisfied and leaves the job for a better position elsewhere, this may reflect
negatively on the remaining employees. More specifically, employee turnover may influence the
remaining employees’ attitudes and behaviors toward their jobs and thus, affect their
productivity.
The three best predictors of employee turnover are job satisfaction, organizational
commitment, and turnover intention (Allen et al., 2010, Griffeth, Hom, & Gaertner, 2000;
Maertz & Campion, 1998). In addition, according to Mor Barak (2001), the best predictors of
intention to leave are job satisfaction, organizational commitment, and burnout (emotional
exhaustion). However, on the other side, the pay level was found to be a weak predictor of
individual turnover decisions (Allen et al., 2010; Griffeth et al., 2000).
Many studies have used turnover intention instead of actual turnover as an outcome
variable. On the other hand, Vandenberg and Nelson (1999) suggest that other measures besides
turnover intention should be included in the process of predicting turnover. Therefore, job
satisfaction, organizational commitment, turnover intention, and emotional exhaustion have been
used as predictors of employee turnover in this study.
2.6.2.1 Job Satisfaction
Job satisfaction research focuses on the individual’s evaluation of organizational
practices and procedures or the outcomes attained from organizational participation (Schneider,
1975). Employees who report high scores on job satisfaction tend to report that they receive fair
recognition for job performance and valuable job-related feedback (Johnson & McIntye, 1998).
For example, research has shown that employee perceptions of co-worker involvement and

27
supervisory support can reduce stress and increase job satisfaction (Babin & Boles, 1996;
Hombrados-Mendieta & Cosano-Rivas, 2013).
It has been proposed that organizational productivity was achieved by employees’
satisfaction through attaining their physical and emotional needs (Ostroff et al., 2003). The
negative performance-turnover relationship is stronger in organizations when reward
contingency exists (Griffeth et al., 2000; Williams & Livingstone, 1994). This could be
explained by that reward contingency influences turnover through employee satisfaction (Wells
& Muchinsky, 1985). A positive safety climate is likely to increase employees’ satisfaction and
commitment toward their jobs (Clarke, 2010; Fogarty, 2004; Park et al., 2012) which in turn
reduces turnover (Fogarty, 2004). In other words, if there are more job satisfaction and
organizational commitment, there will be a less likelihood of employee turnover. In addition,
Wright and Bonett (2007) have found that there is a strong negative relationship between job
satisfaction and employee turnover
2.6.2.2 Organizational Commitment
Organizational commitment is often used to describe employee-organization linkages as
individuals actually experience this relationship (Reichers, 1985). Mathieu and Zajac (1990)
have found that there is a negative relationship between organization commitment and employee
turnover. So when employees are dissatisfied with their jobs or not feeling that they belong to the
organization, they most likely quit. However, Sjöberg and Sverke (2000) have found that
turnover intention mediates the effect of organizational commitment on employee turnover.

28
2.6.2.3 Turnover Intention
Turnover intention refers to the probability that individuals will quit their jobs in the near
future (Vandenberg & Nelson, 1999). Van Breukelen, Van der Vlist, and Steensma (2004)
concluded that turnover intention is by far the best predictor of actual turnover and their result
supports other results from two previous studies (George & Jones, 1996; Mor Barak, Nissly, &
Levin, 2001). Turnover intention would be high if there are alternative employment
opportunities. However, Vandenberg and Nelson (1999) argued that it should not be assumed
that this intention cannot be lowered.
2.6.2.4 Emotional Exhaustion
Emotional exhaustion, depersonalization, and lowered personal accomplishment are
generally accepted as the core meaning of burnout (Maslach & Jackson, 1981). However,
emotional exhaustion constitutes the primary factor (Gaines & Jermier, 1983). Emotional
exhaustion is characterized by a lack of energy and it is a chronic state of physical and emotional
resources depletion (Cordes & Dougherty, 1993). Workers realize they cannot continue to give
more or to be as responsible as they have been in the past. Wright and Cropanzano (1998) argued
that emotional exhaustion is associated with both job performance and subsequent employee
turnover, and unrelated to job satisfaction. However, Firth and Britton (1989) found no
significant relationship between employee turnover and emotional exhaustion.
Other researchers have suggested that burnout can influence individual attitude, which in
turn affects turnover (Jackson, Schwab, & Schuler, 1986; Wright & Cropanzano, 1998). Cordes
and Dougherty (1993) summarized that burnout represents a particular type of job stress, in
29
which a pattern of its three core components that described as strains results from a variety of
work demands that describe as stressors, especially those of an interpersonal nature. Burnout and
job satisfaction have a significant positive correlation (Wolpin, Burke, & Greenglass, 1991). In
their study about job burnout among airline employees, Tourigny and his colleagues (Tourigny,
Baba, & Lituchy, 2005) found that the relationship between emotional exhaustion and
diminished personal accomplishment is moderated by absence.
Organizational characteristics such as contingency of rewards and punishments are
considered as antecedents of burnout (Cordes & Dougherty, 1993). Emotional exhaustion and
perceived safety climate can affect individual work performance independently and jointly in
aviation industry (Baba et al., 2009). Managers need to be aware of the climate of the
supervision, such as supervision meetings that reinforce the worker’s value in the organization.
Supervisors support can reduce the feeling toward burnout (Collings & Murray, 1996;
Hombrados-Mendieta & Cosano-Rivas, 2013).
2.6.3 Safety Motivation
Safety motivation refers to “an individual’s willingness to exert effort to enact safety
behaviors and the valence associated with those behaviors” (Neal & Griffin, 2006). Safety
climate is an antecedent of safety motivation (Barbaranelli, Petitta, & Probst, 2015; Griffin and
Neal, 2000). Griffin and Neal (2000) argued that safety performance must be determined by the
individuals’ motivation to perform the behaviors. Studies have shown that perceived
organizational concern for employee safety can influence safety climate and thus, motivates
employees to perform safely (Christian et al., 2009; Clarke, 2006; Griffin & Neal, 2000).

30
2.6.4 Determining of Safety Performance Dimensions
“ Safety performance is viewed as reflecting behaviors, rather than outcomes” (Sackett,
2002). For example, violation of safety procedures is a behavior which might put individual,
others, and organization at risk. Safety performance may be used to refer to “a metric for safety-
related behavior of individuals” (Christian et al., 2009).
Understanding the importance of safety performance is critical for guiding management
efforts toward the enhancement of safe work behavior. Burke, Sarpy, Tesluk, and Smith-Crowe
(2002) defined general safety performance as individuals’ behaviors that exhibit to encourage the
health and safety of workers and environment. They developed a 4-factor model of general
safety performance with performance factors labeled; using personal protective equipment,
engaging in work practices to reduce risk, communicating health and safety information, and
exercising employee rights and responsibilities.
Safety knowledge and safety motivation are most strongly related to safety performance
behaviors while group safety climate has a strong relationship with accidents and injuries
(Christian et al., 2009). Using safety performance as individual behaviors provides researchers
with a measurable criterion, which is more proximally related to psychological factors than
incidents, accidents, or injuries (Christian et al., 2009). Fogarty and Buikstra (2008) have used
self-reported errors and violations behaviors to measure safety performance in aviation
maintenance. Griffin and Neal (2000) have used safety compliance and safety participation to
represent safety behavior in a way of mitigation violations and maintenance errors occurrences.
Therefore, in this study, unsafe acts and reporting unsafe behaviors were used to represent safety
performance in aircraft maintenance.
31
2.6.4.1 Unsafe Acts
In general, the unsafe acts of maintenance technicians can be classified into two
categories: errors and violations (Reason, 1990). Reason acknowledged the importance of
intentional violations in his unsafe acts model. Additionally, Lawton and Parker (1998) suggest
that errors and violations should be considered as unsafe act routes to accidents at work.
2.6.4.1.1 Errors
Errors in the aircraft inspection and maintenance environment arise from situational and
system characteristics, human erring tendencies, and interactions between them (Latorella &
Prabhu, 2000). These errors take the form of unintentional deviations from operating procedures,
practices, and rules (Reason, 1990). Errors also arise when “the mental processes necessary for
correct performance are incompletely specified” (Reason, 2008, p. 46). Examples of these under-
specifications are inattention, forgetting, and incomplete knowledge.
Fogarty (2004) used a safety climate approach to develop a model to explain the
relationships between employee morale, psychological health, turnover intentions, and errors at
work by using data that were collected from an Australian aircraft maintenance fleet. In addition,
Fogarty (2005) tested the mediating effect of psychological strain on the relationship between
safety climate and maintenance errors. Fogarty found that the effect of safety climate on errors is
partially mediated by the strain factors. Park and his colleagues (Park et al., 2012) replicated the
study of Fogarty (2004) by using data from Korean aircraft maintenance unit. Their results show
that a high performance and fewer maintenance errors occur when technicians experience less
fatigue and stress.
32
2.6.4.1.2 Violations
The root causes of most accidents have been traced to latent organizational factors (
Reason, 1995). These latent failures create the local conditions that help in rising errors and
violations. Reason (1995) defines violations as “the deliberate deviation of actions from safe
operating procedures” and thus, they bring performers into areas of greater risk. Hobbs and
Kanki (2008) relate aviation maintenance violations mostly to the weakness of management and
less supervision within the organization. They also argue that the most reason behind a work not
being performed by maintenance personnel is his violations in act of deliberate decisions. They
also conclude that local workplace factors can be antecedents of violations errors and thus, they
can lead to negative maintenance outcomes.
Research has demonstrated that the link between violations and errors shows that
procedural violations are the best predictors of incident involvement (Hofmann & Stetzer, 1996;
Mearns, Whitaker, & Flin, 2001). Fogarty and Shaw (2010) employed the Theory of Planned
Behavior to understanding violation behaviors in aircraft maintenance. They highlighted the
importance of management attitudes and found that the employees’ perceptions of group safety
norms (e.g., other people in my workplace violate procedures) has a strong influence on
violations.
2.6.4.2 Reporting Behaviors
For self-report unsafe behaviors, managers should encourage employees to report near-
misses without fear of disciplinary action and blame, so they can look at potential failures or
hazards which could lead to future accidents (Ball & Procter, 1994). Maintenance technicians

33
may hesitate to report their own errors and violations for fear of reprisal from management.
Therefore, any maintenance-error reporting system will likely require some level of immunity to
disciplinary action to be successful (Goldman, Fiedler, & King, 2002).
Most of error reports are used for administrative purposes such as documenting error
situations rather than understanding the causal factors that led to those errors (Latorella & Drury,
1992). Some punitive safety systems emphasize on reporting safety outcomes more than safety
behaviors such as reporting safety concerns and thus they may discourage individuals to further
report these kinds of concerns (Probst & Estrada, 2010). Finally, reporting behavior is most
influenced by managers’ reactions to reports (Clarke, 1998).
To overcome the barriers of filing safety reports, Reason and Hobbs (2003) emphasized
on creating a reporting culture. They developed some characteristics to have a successful
reporting system and they are as follow:
De-identification: anonymity or confidentiality of the reports.
Protection: some guarantees for reports of honest errors.
Separation of functions: separate the department of collecting the reports from
that with disciplinary authority.
Feedback: feedback to the reporting individual or agency is very important.
Ease of making the report: report with open and less constrained format.
34
2.6.5 Safety Outcomes
According to Christian et al. (2009), safety performance and safety outcomes are
different. Safety outcomes are physical events such as incidents, accidents, or injuries.
Unfortunately, incidents can happen and employees may be injured at the workplace. For
example, not complying with the organizational safety policies can have a high potential of
workplace incidents and injuries (Probst & Brubaker, 2001). Reason (2008) defines incidents as
events of sufficient severity that need to be investigated.
2.7 Literature Relating to Research Hypotheses
2.7.1 Development of a Model Addressing Safety Climate and Safety Outcomes
The following sections explain the development of a model that demonstrates the
possible relationships between safety climate, employee turnover, safety motivation, unsafe acts,
reporting unsafe behaviors, and workplace incidents and injuries.
2.7.1.1 Safety Climate, Safety Performance, and Safety Outcomes
The relationship between perceived safety climate and safety outcomes can be mediated
by individual variables. The link of this relationship has been examined through safety climate
studies, such as compliance with safe working procedures, accidents or injuries. For example,
employees’ perceptions of the safety climate affect their behavior which in turn affects the
probability of workplace incidents and injuries (Griffin & Neal, 2000; Neal & Griffin, 2006).
Pousette, Larsson, and Törner (2008) have also found a significant causal relationship between
safety climate and employees’ behaviors toward safety. According to Hofmann and Stetzer

35
(1996), the effect of safety climate on both unsafe behaviors and accidents in the workplace is
negative. Additionally, Wallace, Popp, and Mondore (2006) supported this result on accidents.
Theory such as reasoned action (Fishbein & Ajzen, 1975) suggests that safety outcomes
are best predicted by individual behaviors or by other factors that are not controlled by that
individual. Indeed, a number of studies has found that the relationship between safety climate
and safety outcomes is mediated by safety behavior either by fully mediation (Christian et al.,
2009; Zohar, Huang, Lee, & Robertson, 2015), or partially mediation (Clarke, 2010). Therefore,
a good safety climate will lead to a better safety performance, which results in better safety
outcomes. Thus, it is expected the following hypotheses to be:
Hypothesis 1: Perceived safety climate has a direct effect on self-reported incidents and injuries.
Hypothesis 2: A self-reported unsafe act has a direct effect on self-reported incidents and
injuries.
Reporting system must be supported by the management. For instance, if managers are
concerned about safety incidents, the employees are more likely to report these incidents (Clarke,
1998). Furthermore, reporting behaviors of safety concern, accidents and injuries were lower in
working environment with poorer safety climate or where supervisor enforcement of safety
policies and practices was weak (Probst & Estrada, 2010). However, unsafe acts should occur
first and then can someone report them. Accordingly, it can be predicted from safety climate that
employees who perceived a more positive safety climate will engage in more reporting of safety
concerns. Neal et al. (2000) found a significant direct path from safety climate to safety
participation such as putting effort into improving safety in the workplace. Therefore, direct

36
effects of safety climate and unsafe acts on reporting unsafe behaviors are expected.
Accordingly, the following hypotheses are proposed:
Hypothesis 3: A self-reported unsafe act has a direct effect on reporting unsafe behaviors.
Hypothesis 4: Perceived safety climate has a direct effect on reporting unsafe behaviors.
2.7.1.2 Employee Turnover as a Mediator between Safety Climate and Safety Performance
Research of employee turnover has examined workforce-related performance based on
social capital theory (Dess & Shaw, 2001; Shaw, Gupta, & Delery, 2005). For example, it is
expected from employees who receive a preferential treatment from the organization to increase
their productivity as well as adhering to safety policies and procedures. Williams and
Livingstone (1994) have suggested that when employers reward good performance, employees
are more likely to stay. A number of research has cited that the support factor at workplace has a
negative direct effect on employee turnover (Kim & Stoner, 2008; Mor Barak et al., 2001;
Nissly, Barak, & Levin, 2005). The sources of this support are from supervisors and top
managers through an emotional and informational ways.
In this study, employee turnover was measured by the employees’ perceptions of their job
satisfaction, organizational commitment, emotional exhaustion, and intention to quit and not by
actual turnover. However, understanding the impact of the actual turnover on organizational and
individual levels can provide important information. According to Shaw (2011), there is a
negative relationship between employee turnover rates and safety performance. However, other
study has shown that the correlation of turnover rates-performance was very weak when
37
performance was measured as safety-related performance such as accident rates or service
violations (Park & Shaw, 2013). Moreover, a direct negative relationship between employee
turnover rates and safety outcomes such as accident rate was found by Hancock et al. (2013).
Additionally, Shaw et al. (2005) have found that workforce performance is high when employee
turnover is low but gets lower as turnover increases which in turn leads to increase accident rate.
However, since safety motivation factor has been included in the study, it was expected
that employee turnover will affect this motivation according to the two-factor theory (Herzberg,
Mausner, & Snyderman, 1959). This theory suggests that creating a positive culture in the
workplace (i.e., good supervision and employee-employer relationship) can increase employees’
pride of what they are doing and increase interest of the job too. Therefore, they will have a
feeling of job achievement which will boost their motivation to improve safety at workplace. In
addition job satisfaction motivates individual to perform safely again and again (Petersen, 1978).
The Swiss cheese model of human error causation that developed by Reason (1990)
describes four human failures before an accident or incident could happen. The first two failures
are organizational influences (e.g., training) and unsafe supervision which are similar to the
safety climate construct. The third failure is precondition for unsafe acts like personnel factors
and conditions of employees, which it is like the employee turnover conditions (e.g., emotional
exhaustion from stress and fatigue). The last failure of Reason’s model is unsafe acts construct
which has been used in this study. Accordingly, on the basis of the above theories, the following
hypotheses are proposed:
Hypothesis 5: Perceived safety climate has a direct effect on employee turnover.

38
Hypothesis 6: Employee turnover has a direct effect on safety motivation.
Hypothesis 7: Employee turnover has a direct effect on self-reported unsafe acts.
Hypothesis 8: Employee turnover will mediate the relationship between safety climate and self-
reported unsafe acts.
2.7.1.3 Safety Motivation as a Mediator between Safety Climate and Safety Performance
Safety motivation is described as “attitudes and perception relating to the influences
motivating safe and unsafe behaviors” (Williamson et al., 1997, p. 17). Theory of individual
performance suggests that skill, knowledge, and motivation are the determinants of performance
(Campbell, 1990). Campbell argued that safety performance must be determined by the
motivation of individuals to perform the behaviors. In addition, Petersen (1978) developed the
motivation-reward-satisfaction model that describes skill and motivation as antecedents of work
performance. Research demonstrates that safety motivation to be a significant factor in
predicting safety behaviors (Chen & Chen, 2014; Neal et al., 2000). For example, safety
motivation mediates the link between safety climate and safety performance (Griffin & Neal,
2000).
Expectancy Theory has been responsible of linking safety climate with safety motivation
(Vroom, 1964). This theory predicts that employees will be motivated to perform safely in
favorable of the desirable outcomes. Chen and Chen (2014) have stated that pilots’ positive
perceptions of the airline’s safety management system (SMS) practices have positive effects on
their safety motivation. Therefore, the following hypotheses are proposed:
Hypothesis 9: Perceived safety climate has a direct effect on safety motivation.

39
Hypothesis 10: Safety motivation has a direct effect on self-reported unsafe acts.
Hypothesis 11: Safety motivation has a direct effect on reporting unsafe behaviors.
Hypothesis 12: Safety motivation will mediate the relationship between safety climate and self-
reported unsafe acts.

40
CHAPTER THREE: METHODOLOGY
3.1 Introduction
The increased number of aviation maintenance errors has increased the awareness of
research on human factors. Moreover, to grant the aircrews and the public the confidence of a
safe and a reliable air transportation system, enhancing the factors that affect aircraft
maintenance safety must be continued. Therefore, the purpose of this research was to determine
the relationships between employee turnover, safety motivation, and safety outcomes in an
aircraft maintenance environment.
3.2 Proposed Research Model
The proposed research model in Figure 2 was developed based on the proposed research
hypotheses. This model shows that safety climate, employee turnovers, and unsafe acts are
higher order factors consisted of specific first-order factors. Safety motivation and employee
turnover are mediating the relationship between safety climate and safety performance. In
addition, the unsafe acts construct is mediating the relationships between employee turnover,
safety motivation, and safety outcomes.

41
Figure 2 Proposed Research Model Linking Safety Climate, Safety Motivation, Employee
Turnover, Self-Reported Unsafe Acts, Reporting Unsafe Behaviors, and Self-Reported Incidents
and Injuries.
3.3 Research Survey
Quantitative methods, such as cross-sectional questionnaires, have commonly been used
to assess the perceptions of safety climate in many industries (Denison, 1996). This method
collects data from asking large numbers of people about certain questions in a practical way in
terms of time and cost effective manner.
42
This study is a non-experimental research in the form of survey where many aircraft
maintenance technicians (AMTs) have been surveyed to produce a large number of variables.
Most of safety climate, employee turnover, and safety performance scales in this study were
adapted from scales in validated surveys developed by Fogarty (2004; 2005) named as
Maintenance Environment Survey (MES). Then, they were further modified and extended to
reflect the purpose of this study by utilizing other important scales and items from previous
published studies. Furthermore, some items were reverse-scored in order to encourage
participants to read each question carefully.
Fogarty constructed some dimensions that are beneficial to research on maintenance
errors and violations. He used the principle of triangulation to separate the constructs that only
relevant to a maintenance environment. He used three main safety climate studies in aviation
maintenance as guidance. The first one is called the Maintenance Resource
Management/Technical Operations Questionnaire (MRM/TCQ) developed by Taylor & Thomas
(2003), the second is Organizational Safety Culture Questionnaire developed by Patankar (2003),
and third is Commercial Aviation Safety Survey (CASS) developed by Wiegmann, von Thaden,
Mitchell, Sharma, and Zhang (2003). Then, he analyzed both maintenance incident database and
associated incident investigation reports and found that inadequate training and poor supervision
were contributed the most to those incidents. Finally, he implemented a series of focus group
interviews which highlighted some factors that affected the maintenance tasks.

43
3.4 Survey Development
The current study survey was designed to measure safety climate, employee turnover,
safety motivation, self-reported unsafe acts, reporting unsafe behaviors, and self-reported
workplace incidents and injuries. The study survey was divided into two parts; part one was
related to descriptive statistics and part two was related to study’s variables. The survey
questions were translated carefully into Arabic language. Two experienced aircraft maintenance
leaders were asked to check the appropriateness of the translation. The measures of the study are
discussed below and are also summarized in Table 2.
3.4.1 Supervision
Participants responded to nine survey items that measured their perceptions toward their
supervisors at workplace. Seven items were adopted from the supervision scale of second version
of Maintenance Environment Survey (MES) that developed by Fogarty (2005). In addition, two
items were also added to this scale. The first one “My immediate supervisor helps me with my
personal concerns and difficulties” was selected from the first version of MES developed by
Fogarty (2004) and the second one “My supervisor always tries to enforce safe working
procedure” was selected from the scale of safety rules and procedures developed by Vinodkumar
& Bhasi (2010). These items were rated with a 5-point Likert Scale format ranging from 1
(strongly disagree) to 5 (strongly agree). A higher score indicates a higher level of supervision.
3.4.2 Safety Focus
Six items were used to measure the extent to which management identified safety as a
core value and individual’s concern toward safety. Five items were adopted from the safety

44
concern scale of the second version of MES developed by Fogarty (2005). Another item “The
safety procedures and practices in this organization are useful and effective” from safety rules
and procedures scale developed by Vinodkumar and Bhasi (2010) was selected too. These items
were rated with a 5-point Likert Scale format ranging from 1 (strongly disagree) to 5 (strongly
agree). A higher score on this scale indicates a positive perception of safety.
3.4.3 Safety Communication and Feedback
Fogarty did not use the communication as safety climate construct in his early versions of
MES and used the factor feedback instead. However, he added communication in the third
version of MES with three items focusing only on communicating issues from management to
tradesmen and their supervisors (Fogarty & Buikstra, 2008).
Eight items were used to measure the degree to which respondents evaluated information
exchange within the unit. One item “My supervisor keeps me regularly informed of my
progress” was from feedback scale (Fogarty, 2005). Three items were selected from
communication scale developed by Cheyne, Cox, Oliver, and Tomás (1998). Two items
“Management operates an open policy on safety issues” and “There is sufficient opportunity to
discuss and deal with safety issues in meetings” from safety communication and feedback scale
of Vinodkumar and Bhasi (2010) were also added. Finally, the remaining two items were taken
from response and feedback scale (Gibbons, von Thaden, & Wiegmann, 2005). All items were
rated with a 5-point Likert Scale format ranging from 1 (strongly disagree) to 5 (strongly agree).
So, a higher score reflects greater communication and feedback processes.

45
3.4.4 Recognition
Five items were used to measure the extent to which the respondent thought about
rewards and recognition system. Three items were from recognition scale (Fogarty, 2004; 2005)
and the other two were from safety promotion policies scale (Vinodkumar & Bhasi, 2010). There
were two items from Fogarty’s MES that not added to this scale. The first one “There is not
enough reward and recognition for doing good work” was similar to other selected item and the
second one “In our promotion system, the best people generally rise to the top” was not
applicable to current research workplace. These items were rated with a 5-point Likert Scale
format ranging from 1 (strongly disagree) to 5 (strongly agree). A higher score on this scale
indicates a higher level of rewards and recognition system.
3.4.5 Training
Seven items were used to measure the degree to which the management provides
adequacy of training and encouragement to continue further training. Two items from the
training scale (Fogarty, 2004) and three items from the same scale (Fogarty & Buikstra, 2008)
were used. In addition, one item “Safety issues are given high priority in training programs”
(Vinodkumar & Bhasi, 2010) and another item “I have been given enough training to perform
my work safely” (Gibbons et al., 2005) from the safety training scale were selected too. These
items were rated with a 5-point Likert Scale format ranging from 1 (strongly disagree) to 5
(strongly agree). A higher score indicates a higher level of training.
46
3.4.6 Coworker Support for Safety
Three items were used to measure the coworkers concern for the safety of others and for
hazard. These items were adopted from the perceived coworker support for safety scale
developed by Tucker et al. (2008). These items were rated with a 5-point Likert Scale format
ranging from 1 (strongly disagree) to 5 (strongly agree). A higher score reflects greater
coworker support.
3.4.7 Job Satisfaction
Seven items were used to measure the individuals’ feeling toward their jobs. All of the
items were adopted from job satisfaction scale developed by Fogarty (2004). These items were
rated with a 5-point Likert Scale format ranging from 1 (strongly disagree) to 5 (strongly agree).
This scale was reverse-scored so a lower score indicates a more positive job satisfaction.
Because a common factor exerts a linear effect on measured variables (Fabrigar & Wegener,
2012), both job satisfaction and organizational commitment were changed to have reverse-scored
questions so that all of the four measuring factors have similar influence on employee turnover.
3.4.8 Organizational Commitment
Seven items were used to measure the degree to which individuals desired to maintain
organizational membership. All of the items were adopted from commitment scale developed by
Fogarty (2004). Aircraft maintenance technicians (AMTs) responded using a 5-point Likert Scale
format that ranged from 1 (strongly disagree) to 5 (strongly agree). This scale was reverse-scored
so a lower score reflects greater organizational commitment.

47
3.4.9 Emotional Exhaustion
Seven items were used to measure the extent to which individuals felt of being
emotionally overextended and exhausted by their work. All of the items were adopted from
emotional exhaustion scale developed by Maslach and Jackson (1981). However, two items were
not selected because they were unrelated to subject of the study (e.g. “Working with people
directly puts too much stress on me”). Maslach and Jackson (1981) used a range of intensity
from 1 (very mild, barely noticeable) to 7 (major, very strong) to measure this scale. On the other
hand, in this study, these items were rated with a 5-point Likert Scale format ranging from 1
(strongly disagree) to 5 (strongly agree). A higher score indicates a higher level of emotional
exhaustion.
3.4.10 Turnover Intention
This scale was measured by four items concerning plans to quit the job or remain within
the unit. These four items were adopted from turnover intention scale developed by Abrams,
Ando, and Hinkle (1998). These items were rated with a 5-point Likert Scale format ranging
from 1 (strongly disagree) to 5 (strongly agree). So a higher score reflects greater intention to
quit.
3.4.11 Safety Motivation
Participants were asked to rate their safety motivation using six items that measure the
extent to which they had the willingness to perform safely. Five items were adopted from the
safety motivation scale developed by Vinodkumar and Bhasi (2010). One item “I feel that it is
worthwhile to put in effort to maintain or improve my personal safety” was selected from the

48
scale developed by Neal and Griffin (2006). These items were rated with a 5-point Likert Scale
format ranging from 1 (strongly disagree) to 5 (strongly agree). A higher score on this scale
indicates a more positive motivation toward safety.
3.4.12 Reporting Unsafe Behaviors
Seven items were used to measure the degree to which participants were welling to report
an incidents, near miss, and unsafe acts. These items were adopted from reporting system scale
of the maintenance survey developed by Gibbons et al. (2005). However, some of the items
might only serve as predictors of reporting unsafe behaviors. These items were rated with a 5-
point Likert Scale format ranging from 1 (strongly disagree) to 5 (strongly agree). A higher
score reflects greater willingness to report unsafe behaviors.
3.4.13 Errors
Ten items were used to measure the unintentional deviations from standard operating
procedures that done by AMTs. These items were adopted from the error type scale developed
by Fogarty and Buikstra (2008) and were rated with a 5-point Likert Scale format ranging from 1
(never) to 5 (very frequently). So a higher score indicates a higher rate of maintenance errors.
3.4.14 Violations
AMTs were asked to rate their violations on twelve items. Six items were adopted from
violations and intention to violate scales developed by Fogarty and Shaw (2010) with words
changed to ensure violations had been committed. One item “In this unit, supervisors have
signed off a maintenance task without performing the required supervision or inspection” was
49
used from scale developed by Fogarty and Buikstra (2008). In addition, five items were selected
from violation scale of the Maintenance Behavior Questionnaire (MBQ) developed by Hobbs
and Williamson (2002). These items were rated with a 5-point Likert Scale format ranging from
1 (never) to 5 (very frequently). A higher score on this scale indicates more violations.
3.4.15 Incidents and Injuries
Incidents and injuries were assessed by using two questions. Participants were asked to
rate any work injuries they had sustained and any aircraft incidents that they had been involved
in the last twelve months (Hobbs & Williamson, 2002). The twelve months period was also
accordingly to previous studies (e.g., Probst & Estrada, 2010). Injuries were as sprains, burns,
eyes injuries, and others while incidents were as damage to an aircraft or ground support
equipment. These questions were rated with a 5-point Likert Scale format ranging from 1 (never)
to 5 (very frequently).
3.4.16 Control Variables
The questionnaire included questions about participants’ age and education level. For
example, organizational characteristic such as workforce characteristics can be included as
antecedents to individual safety performance (Griffin & Neal, 2000). Education level was
measured by using scale format ranging from 1 (high school degree) to 5 (above Master degree).

50
Table 2 Study Variables
Measures Items Source Scale
Supervision 9 (Fogarty, 2004; 2005)-
(Vinodkumar & Bhasi, 2010)
1 (SD) to 5 (SA)
Safety Focus 6 (Fogarty, 2005)- (Vinodkumar
& Bhasi, 2010)
1 (SD) to 5 (SA)
Safety Communication and
Feedback
8 (Fogarty, 2005)- (Cheyne et.
al., 1998)- (Gibbons at al.,
2005)- (Vinodkumar & Bhasi,
2010)
1 (SD) to 5 (SA)
Recognition 5 (Fogarty, 2004; 2005)-
(Vinodkumar & Bhasi, 2010)
1 (SD) to 5 (SA)
Coworker Support for Safety 3 (Tucker et al., 2008) 1 (SD) to 5 (SA)
Training 7 (Fogarty, 2004)- (Fogarty &
Buikstra, 2008) - (Gibbons at
al., 2005)- (Vinodkumar &
Bhasi, 2010)
1 (SD) to 5 (SA)
Safety Motivation 6 (Neal & Griffin, 2006)-
(Vinodkumar & Bhasi, 2010)
1 (SD) to 5 (SA)
Job Satisfaction ® 7 (Fogarty, 2004) 1 (SD) to 5 (SA)
Organizational Commitment ® 7* (Fogarty, 2004) 1 (SD) to 5 (SA)
Emotional Exhaustion 7 (Maslach & Jackson, 1981) 1 (SD) to 5 (SA)
Turnover Intention 4 (Abrams et al., 1998) 1 (SD) to 5 (SA)
Reporting Unsafe Behaviors 7 (Gibbons at al., 2005) 1 (SD) to 5 (SA)
Errors 10* (Fogarty & Buikstra, 2008) 1 (never) to 5 (very frequently)
Violations 12 (Fogarty & Shaw, 2010)-
(Fogarty & Buikstra, 2008)-
(Hobbs & Williamson, 2002)
1 (never) to 5 (very frequently)
Incidents and Injuries 2 (Hobbs & Williamson, 2002) 1 (never) to 5 (very frequently)
Education 1 (high school degree) to 5
(above Master degree)
*One item has been removed from each after the piloting; SD: Strongly Disagree & SA: Strongly
Agree. ® Job Satisfaction & Organizational Commitment are reverse-scored questions.

51
3.5 Survey Administration
Getting the RBAF approval to conduct this research at its facilities was the first step
before distributing the questionnaires. RBAF management encouraged the units’ leaders to
support and encourage their employees to take part in this study.
3.5.1 Human Subjects
The University of Central Florida Institutional Review Board (IRB) had approved the
survey (see Appendix B). The IRB ensured that there was no physical or psychological harm on
participants. Participant consent was written at the first page of the survey explaining the purpose
of the questionnaire. In addition, there was no personal information collected except those
related to demographical variables which were for the purpose of data analysis.
3.5.2 Pilot Study
There were between 3-12 items that were generated into each of the 14 measures of the
proposed model. A panel of 15 experience aircraft maintenance technicians from different
specialized area was asked to modify the items during the piloting. The panel found two
ambiguous or confusing items, and therefore, they were removed. The first item was “I feel very
little loyalty to my unit” from organizational commitment scale and the second one was “I have
lost a component part-way through a job” from errors scale. As a result, 98 items remained and
have been used in the distributed survey as it is presented in Appendix A.

52
3.5.3 Participants
This study has been conducted only on male Air Force maintenance personnel with an
average age of 40 years. Most participants have been trained during their first two recruitment
years and on-the-job (OJT) training after they had been transferred to their current positions.
3.5.4 Procedure
The study data were collected via paper-and-pen questionnaires completed by
maintenance technicians from five different aircraft maintenance units. Participation was
voluntary and the maintenance technicians were assured of confidentiality. They were allowed to
participate in work time. They had received the questionnaires from their respective unit leader.
The survey was anonymous in nature and contained a letter confirming management support for
their participation. One month was the period for collecting the questionnaires back and also,
there were weekly reminders via the available communication channels to encourage the
participants. In addition, some questionnaires were administered by researcher on site. To
maintain participant confidentiality, surveys were returned directly to the researcher in sealed
envelopes.
A total of 620 questionnaires were distributed. Overall, questionnaires were received
from 314 participants with a response rate of 50.6%. However, 31 questionnaires were removed
due to missing data where many questions were left unanswered. As a result, a total of 283
usable samples were used in the data analysis.
53
3.6 Sample Size
When conducting research analysis, obtaining a large sample size that is more
representative of the population can limit the influence of outliers and plays a significant role in
making inferences about this population. In fact, the sample size depends more on the stability of
a correlation coefficient and not on number of variables (Gorsuch, 1997). The study sample size
(N = 283) was sufficient to perform the data analysis for the exploratory factor analysis.
According to Fabrigar and Wegener (2012), a sample of minimum 200 or more is accepted when
there are good conditions such as communalities values of 0.40 to 0.70 and 3 to 5 measured
variables loading on each factor.
If the measurement is strong with 3 or 4 indicators per factor, good reliabilities, and not a
complex structural path model, then samples of size 50 or 100 can be plenty to use it in structural
equation modeling (Iacobucci, 2010). In addition, Bollen (1990) suggests that if the indicators
are reliable and the effects are strong and the model not complex, smaller samples will be
sufficient. Kline (1998) suggests sample size of greater than 200 can be considered as large and
is acceptable for most models. Therefore, the current sample size (N = 283) was sufficient to
perform the data analysis.
3.7 Data Analysis
The collected data were analyzed first by using an exploratory factor analysis. Then, a
confirmatory factor analysis was implemented to develop the measurement model. Finally, a
structure equation modeling was used to test the structural paths among the model’s constructs.

54
3.7.1 Exploratory Factor Analysis
As the sets of items have been developed to represent the area of interest, exploratory
factor analysis (EFA) has been used as an adjacent to confirmatory factor analysis (CFA)
through the process of SEM. Researchers use EFA to explore for the smaller set of k latent
constructs or factors to represent the larger set of j variables (Henson & Roberts, 2006). EFA can
also be used to assess the impact of all the constructs on each item. EFA is appropriate for scale
development and it is used before applying CFA in regard to have a solid priori theory (Hurley et
al., 1997). Moreover, it is better to rely on an empirical statistical method than on theory for
specification of constructs in the model (Fabrigar & Wegener, 2012). Gorsuch (1997) suggests
that EFA is needed when there is no clear predictions for CFA such as number of factors
existing, relationship of factors with both variables and with other factors. In additions, EFA is
recommended to be used first whenever there are a large number of models that need to be
compared.
Cronbach’s alpha has been derived to ascertain the internal consistency of items. There
are no universally established standards as to what minimally acceptable indicator reliability
should be. As a result, the classic reliability standard of .70 or greater (Bagozzi & Yi, 2012) has
been used in this study. To have a better homogenous scale, researchers must not only depend on
the result of the internal consistency (e.g., Cronbach’s alpha) but also on the outcomes of other
measurements (e.g., factor analysis) to determine the set of items for a particular factor (Cortina,
1993; Gorsuch, 1997; John & Benet-Martínez, 2000).
55
Lastly, a matrix of association describes the relationships between the model measured
variables. Correlation matrix (R) is most commonly used in EFA (Henson & Roberts, 2006;
Thompson, 2004) and covariance matrix is the most common choice in CFA (Thompson, 2004).
There are four major decisions to model specification and method of analysis when applying
EFA and they are as follows;
3.7.1.1 Method of Factor Extraction
There are multiple methods that can be used to calculate factor coefficients. The most
common methods used are Principle Component (PC), Principle Axes factor (PAF), and
Maximum Likelihood (ML). However, it is good idea to use more than one method to confirm a
replication of results (Fabrigar & Wegener, 2012). Thompson (2004) suggests using more than
one set of analytical choices in EFA. Fabrigar, Wegener, MacCallum, and Strahan (1999) argued
to use maximum likelihood method if the assumption of multivariate normal distribution of the
variables is met and to use PC or PFA method if not met.
ML and PAF are the most used methods (Brown, 2006). However, the results of EFA
model using ML can be misrepresented when data normality not attained. One of the
disadvantages of ML method is that it may produce an improper solution that contains an
indicator with communality above 1.0 (Brown, 2006), while PAF can overcome this issue
(Fabrigar et al., 1999). Fabrigar et al. (1999) suggest that the outcomes of selecting too many
factors are less severe than those of selecting too few factors.

56
3.7.1.2 Communality
The communality of a variable measures the percent of variance in that variable with all
other remaining variables in the analysis. If there are low communalities, variables explain little
variance and thus should be avoided. Low and high communalities can be considered around
0.40 and above 0.70 (Stevens, 1986). According to Fabrigar et al. (1999) , low communalities
occur when there are variables with low reliability and these variables are unrelated to the
domain of interest. Stevens (1986) suggests retaining factors that will account for at least 70% of
the total variance and using a loading (coefficient) of about 0.40 or greater between the variable
and the factor. However, Rencher and Christensen (2012) suggest factor loadings of 0.30 and
greater to meet the minimal requirement; a value of 0.40 to be important; and loadings of 0.50
and above to be significant. Table 3 shows the values of the significant factor loading for each
sample size.
Table 3 Guidelines for Identifying Significant Factor Loadings Based on Sample Size
Factor Loading Sample Size
0.30 350
0.35 250
0.40 200
0.45 150
0.50 120
0.55 100
0.60 85
0.65 70
0.70 60
0.75 50
Source: Rencher and Christensen (2012)

57
3.7.1.3 Factor Retention Rule
There are numerous rules which can be used to determine the number of factors to retain
(Henson & Roberts, 2006). According to Thompson and Daniel (1996), one of the most
frequently used methods is the number of eigenvalues-greater-than-one rule (EV > 1; Kaiser,
1960). This method retains only those factors whose eigenvalues are greater than 1. Most
statistical packages (e.g., SPSS, SAS) use this rule as the default option in EFA. However, this
rule has a drawback, it will accept a factor with an EV of 1.01 and not with an EV of .99
(Fabrigar & Wegener, 2012). The second method that is mostly used to determine the number of
factors is the Scree Plot (Fabrigar & Wegener, 2012). Analyst will retain the number of
eigenvalues in the steep descent before they tend to level off and this number corresponds to the
number of factors that will be used. The EV or Scree rules will retain an accurate number of
factors when the sample size (N) > 250 and the mean communality is ≥ 0.60 (Stevens, 1986). In
addition, the scree plot may give good results when the sample size is large (Brown, 2006).
3.7.1.4 Method of Factor Rotation
The idea of rotation is to simplify the data structure. The mechanism of factor rotation is
to maximize factor loadings close to 1.0 and minimize those close to 0.0 to produce a solution
only and without changing the fit of the data (Brown, 2006). There are two analytic rotations,
orthogonal and oblique. In orthogonal, varimax rotation is probably the most common used
method (Fabrigar & Wegener, 2012; Fabrigar et al., 1999). Varimax rotation looks for the best
solution that has factor loadings with maximum variability across the retained factors.
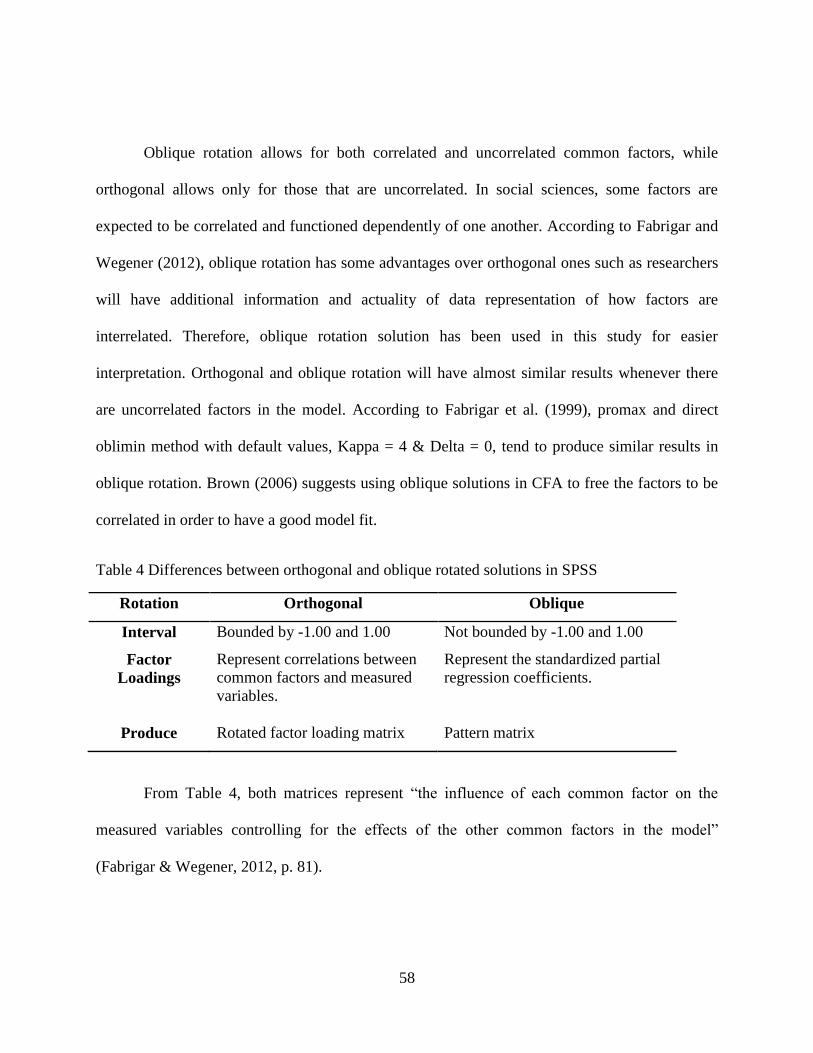
58
Oblique rotation allows for both correlated and uncorrelated common factors, while
orthogonal allows only for those that are uncorrelated. In social sciences, some factors are
expected to be correlated and functioned dependently of one another. According to Fabrigar and
Wegener (2012), oblique rotation has some advantages over orthogonal ones such as researchers
will have additional information and actuality of data representation of how factors are
interrelated. Therefore, oblique rotation solution has been used in this study for easier
interpretation. Orthogonal and oblique rotation will have almost similar results whenever there
are uncorrelated factors in the model. According to Fabrigar et al. (1999), promax and direct
oblimin method with default values, Kappa = 4 & Delta = 0, tend to produce similar results in
oblique rotation. Brown (2006) suggests using oblique solutions in CFA to free the factors to be
correlated in order to have a good model fit.
Table 4 Differences between orthogonal and oblique rotated solutions in SPSS
Rotation Orthogonal Oblique
Interval Bounded by -1.00 and 1.00 Not bounded by -1.00 and 1.00
Factor
Loadings
Represent correlations between
common factors and measured
variables.
Represent the standardized partial
regression coefficients.
Produce Rotated factor loading matrix Pattern matrix
From Table 4, both matrices represent “the influence of each common factor on the
measured variables controlling for the effects of the other common factors in the model”
(Fabrigar & Wegener, 2012, p. 81).
59
In software packages, the outputs of analytical methods for oblique rotations are a pattern
matrix, a structure matrix, and a matrix of factor correlations. However, the pattern matrix is by
far the most used in research (Brown, 2006; Fabrigar & Wegener, 2012). In SPSS, if the rotation
is oblique, the pattern matrix is used to be the main basis of interpretation the rotated factor
loading matrix. For example, any measure variable variance that is explained by more than one
factor is eliminated from the loading in the pattern matrix.
3.7.2 Confirmatory Factor Analysis
Confirmatory factor analysis (CFA) is considered as an extension of factor analysis that
examines the relationship of a set of indicators to a common construct (Schumacker & Lomax,
2010). CFA has been used directly when there is more theoretical basis for specifying
hypothesized patterns of loadings (Hurley et al., 1997). In another way, CFA is generally used
when the researcher knows the study factors of interest and the variables that characterize each
factor (Henson & Roberts, 2006). Moreover, CFA allows the estimation of correlated factors and
thus can be considered as a subset of structural equation modeling but without allowing factors
to have structural relationships (Rencher & Christensen, 2012). One of the advantages of CFA is
that it can be used to test the common method effects that result from the measurement approach
(Harrington, 2009).
EFA and CFA are often conducted together, such as EFA is used to refine the factor
structure and then using CFA for further scale development and construct validity. In fact, the
number of latent factors is not determined at the start up of EFA while this number can be
hypothesized in CFA (Rencher & Christensen, 2012).

60
AMOS 22 software has been used to perform CFA. AMOS 22 (Analysis of Moment
Structures) is an easy-to-use program for visual SEM (Arbuckle, 2011). This software can help
the users to create their models by using the graphics interference and then conducting their
analysis. Furthermore, AMOS is a model-fitting program that can analyze the full range of
standard SEM (Kline, 1998).
3.7.2.1 CFA Model Parameters
Observed variables can be considered as responses to questions and are represented by
rectangles, while latent variables (factors) are the unobserved construct of interest and are
represented by ovals in CFA models. Latent variables can be divided into exogenous and
endogenous variables. Exogenous variables are like to the independent variables that are not
caused by other variables, while endogenous ones (dependent variables) are affected by other
variables in the model.
In CFA models, an arrow from latent variable to observed variable can represent the
relationship between them and has a value (factor loading) of predicting this observed variable (
item or indicator) from the latent factor. The higher the factor loading is the better relationship.
Table 5 shows the suggestion of Tabachnick and Fidell (2007) about the factor loading scales. A
variance accounted for the correlation between the observed variable and the corresponded factor
is determined by squaring the factor loading. If the observed variable is not accounted by the
factor, a unique variance (measurement error) will present.
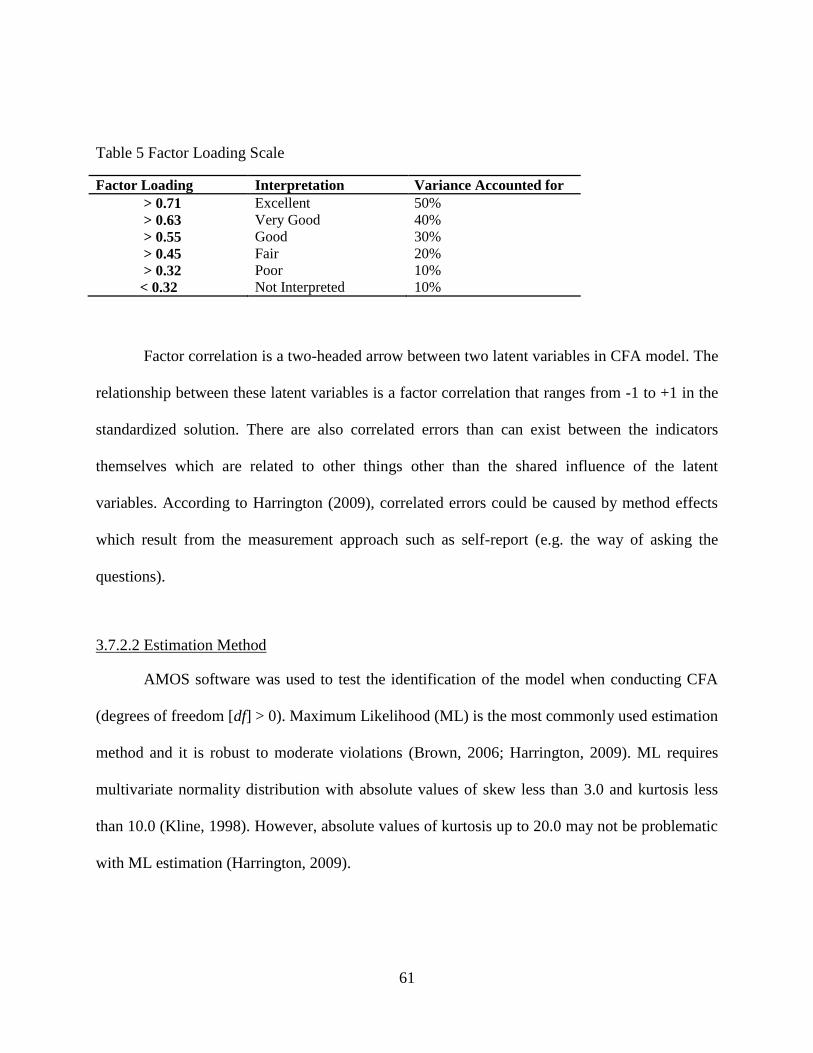
61
Table 5 Factor Loading Scale
Factor Loading Interpretation Variance Accounted for
> 0.71 Excellent 50%
> 0.63 Very Good 40%
> 0.55 Good 30%
> 0.45 Fair 20%
> 0.32 Poor 10%
< 0.32 Not Interpreted 10%
Factor correlation is a two-headed arrow between two latent variables in CFA model. The
relationship between these latent variables is a factor correlation that ranges from -1 to +1 in the
standardized solution. There are also correlated errors than can exist between the indicators
themselves which are related to other things other than the shared influence of the latent
variables. According to Harrington (2009), correlated errors could be caused by method effects
which result from the measurement approach such as self-report (e.g. the way of asking the
questions).
3.7.2.2 Estimation Method
AMOS software was used to test the identification of the model when conducting CFA
(degrees of freedom [df] > 0). Maximum Likelihood (ML) is the most commonly used estimation
method and it is robust to moderate violations (Brown, 2006; Harrington, 2009). ML requires
multivariate normality distribution with absolute values of skew less than 3.0 and kurtosis less
than 10.0 (Kline, 1998). However, absolute values of kurtosis up to 20.0 may not be problematic
with ML estimation (Harrington, 2009).
62
The methods of testing the CFA model goodness-of-fit were discussed in details in
structural equation modeling section. These goodness-of-fit indices are used to determine how
well the model fit the collected data.
3.7.3 Structural Equation Modeling
Structural equation modeling (SEM) is a statistical methodology that takes testing
measurement, predictive, and causal hypotheses approaches to the analysis of a structural theory
(Bagozzi & Yi, 2012; Byrne, 2006). SEM is considered as a part of the existing family of
multivariate statistical techniques such as factor analysis, multiple regression, and analysis of
variance (Bagozzi & Yi, 2012). SEM provides an alternative and complementary methodology to
examining plausibility of hypothesized models through empirical examination (Maruyama,
1998). SEM helps researchers to articulate their thoughts about relationships of one latent
variable with another in the model. The relations between these variables are defined by a series
of equations that illustrates hypothesized structures of relationships. Moreover, using SEM helps
in assessing in whether the model can be considered as a reasonable fit to the data.
The difference between a CFA and a SEM model is that CFA focuses on the relationships
between the latent variables and their observed measures, whereas, SEM includes causal paths
among the latent variables themselves (Harrington, 2009). In this study, SEM was performed
using AMOS 22.

63
3.7.3.1 SEM Characteristics
1. SEM is a priori which means that researchers are required to think in terms of models
and provide a lot of information about variables. These priori specifications make up
the conceptual model to be evaluated in the analysis (Kline, 1998). SEM allows both
confirmatory and exploratory modeling. The model can be accepted, rejected, or
modified by the researcher.
2. SEM allows differentiating between observed and latent variables so that researchers
can test a wide variety of hypotheses. SEM allows the structural relations between
latent variables to be accurately estimated (Kline, 1998). Moreover, it is possible in
SEM to evaluate models that contain only observed variables.
3. The basic statistic in SEM is the covariance which it helps to understand the
correlations patterns among a set of variables, and to explain as much of their
variance as possible with the specified model (Kline, 1998).
4. SEM can be applied to non-experimental data, experimental data, and a mix of the
two data.
5. SEM is a large-sample technique but it is difficult to give a simple answer to the
question of how large a sample is large enough. It varies between complex and
simpler models.
6. SEM is useful in survey research, cross-sectional or longitudinal studies (Kline,
1998).
64
3.7.3.2 SEM Variables
1. Observed or (manifest variables): variables that are measured by the researcher and
are represented by rectangles in the SEM diagram. They serve as indicators of the
underlying construct that they are presume to represent.
2. Latent or (factors): they are unobserved and hypothetical constructs, and are
represented by ellipses in the SEM diagram. They cannot be measured directly and
thus, the researcher must define them in terms of behavior believed to represent them
(Byrne, 2006). There are two types of latent variables. The first one is exogenous
variables (independent variables) which are not caused by other variables and the
second one is endogenous variables (dependent variables) that are caused by other
variables in the model (Harrington, 2009).
3.7.3.3 Assessment of Testing the Hypothesized Model
Breckler (1990) advises practitioners to examine the goodness of fit by multiple criteria
rather than to rely on a single statistic. Model fit in CFA and SEM has been assessed by using
goodness-of-fit tests such as Chi-square (χ2) statistic, root mean square error of approximation
(RMSEA), Tucker and Lewis index (TLI), and comparative fit index (CFI) as were
recommended in the literature (Byrne, 2006; Meade, Johnson, & Braddy, 2008). Chi-square (χ2)
tests whether the model fits exactly in the population while RMSEA tests the extent to which this
model fits reasonably (Harrington, 2009). Both CFI and TLI are used to evaluate the fit of a
model relative to a null model.
65
These indices are measures of the scale reduction of lack of fit when testing the
hypothesized model. Hu and Bentler (1999; 1998) recommended the following standards for
assessing models: RMSEA ≤ 0.06, TLI ≥ 0.95, CFI ≥ 0.95, and χ2 is nonsignificant at (p-values
≥ .05). However, CFI and TLI values of 0.90-0.95 indicating acceptable fit, and RMSEA value
of 0.05-0.08 is also acceptable (Bentler, 1990; Kline, 1998). In addition, the Akaike information
criterion (AIC) and the expected cross-validation index (ECVI) were used too. Smaller AIC and
ECVI suggests the model fits better when comparing two or more models on the same data set
(Harrington, 2009).
RMSEA, TLI, and CFI indices have been found to perform well in detecting models with
misspecified factor loadings (Hu & Bentler, 1998). Chi-square goodness-of-fit-test has limitation
of increasing the probability of rejecting the hypothesized model as either the sample size gets
larger or there are non-normality issues such as high kurtosis (Rencher & Christensen, 2012).
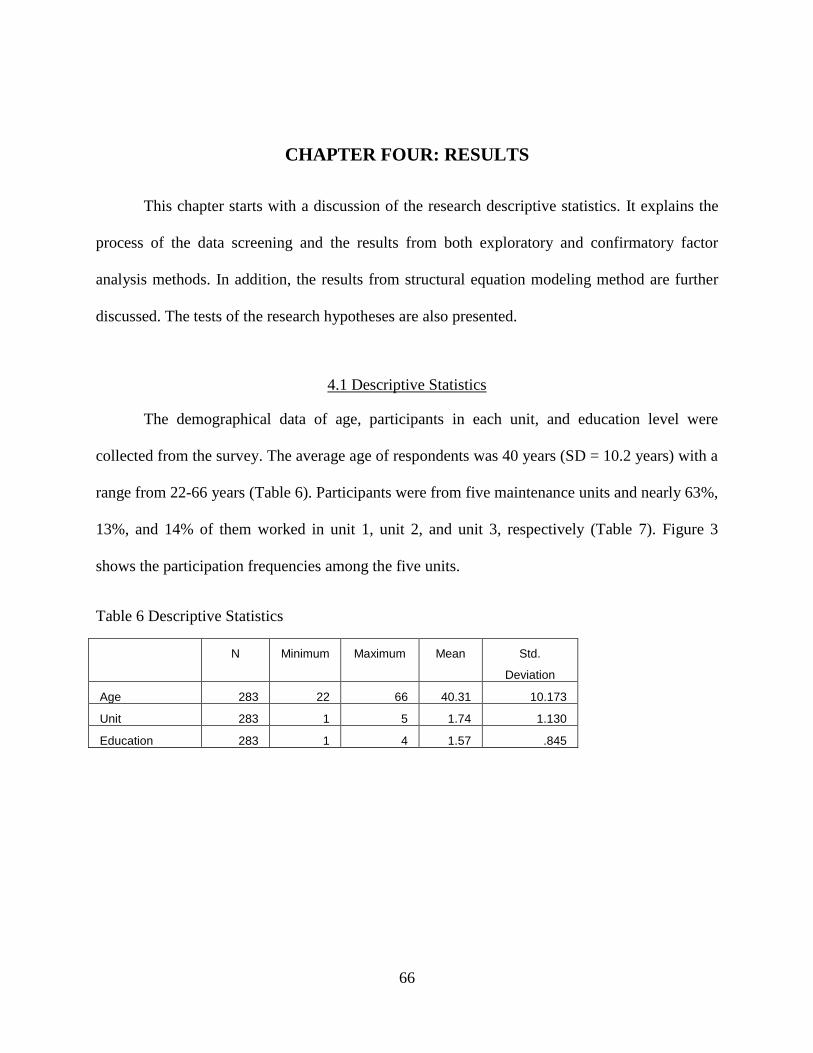
66
CHAPTER FOUR: RESULTS
This chapter starts with a discussion of the research descriptive statistics. It explains the
process of the data screening and the results from both exploratory and confirmatory factor
analysis methods. In addition, the results from structural equation modeling method are further
discussed. The tests of the research hypotheses are also presented.
4.1 Descriptive Statistics
The demographical data of age, participants in each unit, and education level were
collected from the survey. The average age of respondents was 40 years (SD = 10.2 years) with a
range from 22-66 years (Table 6). Participants were from five maintenance units and nearly 63%,
13%, and 14% of them worked in unit 1, unit 2, and unit 3, respectively (Table 7). Figure 3
shows the participation frequencies among the five units.
Table 6 Descriptive Statistics
N Minimum Maximum Mean Std.
Deviation
Age 283 22 66 40.31 10.173
Unit 283 1 5 1.74 1.130
Education 283 1 4 1.57 .845
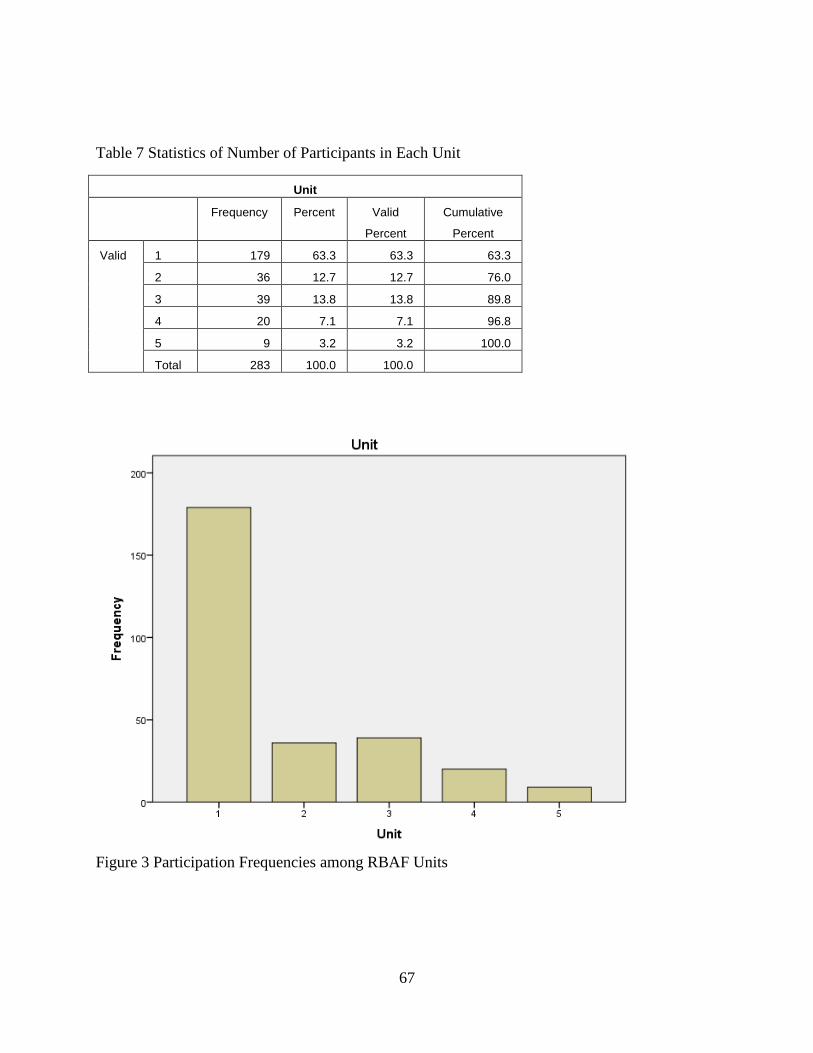
67
Table 7 Statistics of Number of Participants in Each Unit
Unit
Frequency Percent Valid
Percent
Cumulative
Percent
Valid 1 179 63.3 63.3 63.3
2 36 12.7 12.7 76.0
3 39 13.8 13.8 89.8
4 20 7.1 7.1 96.8
5 9 3.2 3.2 100.0
Total 283 100.0 100.0
Figure 3 Participation Frequencies among RBAF Units
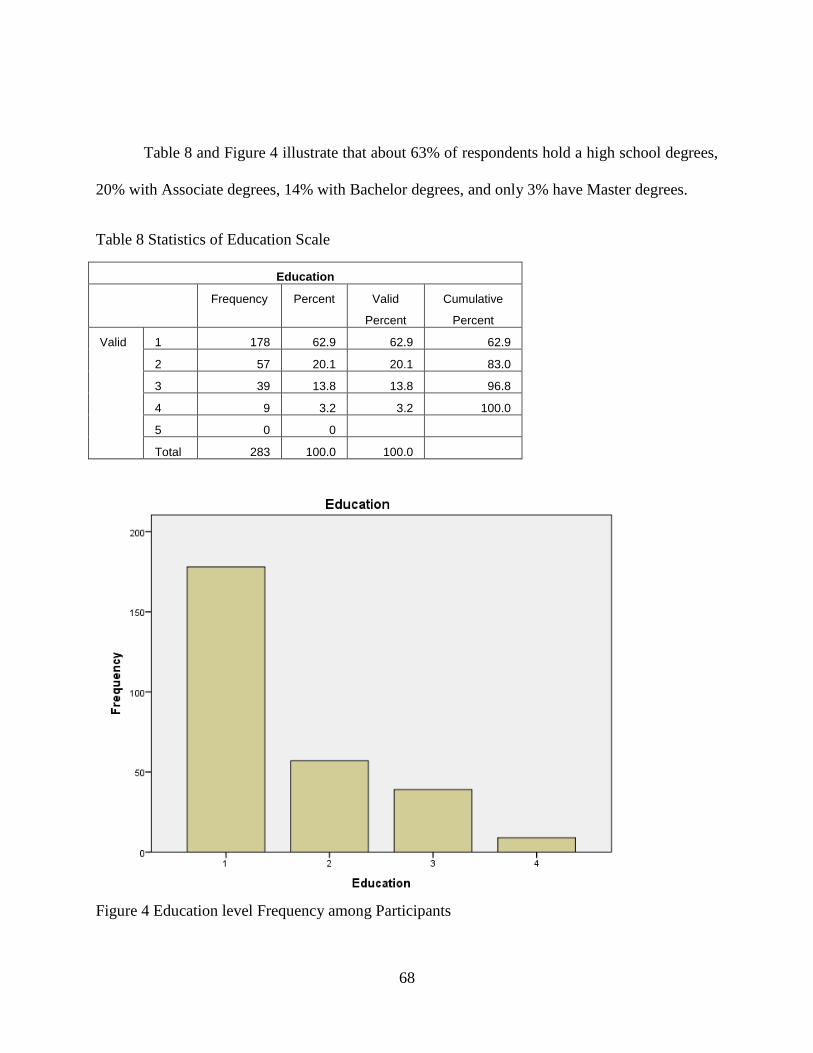
68
Table 8 and Figure 4 illustrate that about 63% of respondents hold a high school degrees,
20% with Associate degrees, 14% with Bachelor degrees, and only 3% have Master degrees.
Table 8 Statistics of Education Scale
Education
Frequency Percent Valid
Percent
Cumulative
Percent
Valid 1 178 62.9 62.9 62.9
2 57 20.1 20.1 83.0
3 39 13.8 13.8 96.8
4 9 3.2 3.2 100.0
5 0 0
Total 283 100.0 100.0
Figure 4 Education level Frequency among Participants

69
The statistical data of involvement in safety occurrences indicated that 186 (65.7%)
respondents reported that they had not been injured at work during the last 12 months. However,
12.4% of them reported rarely, 12.4% for sometimes, 6.0% for frequently, and 3.5% for very
frequently. In addition, the majority (95.4%) of the respondents reported that they had not been
involved in damaging the aircraft or equipment. However, just over 2.5%, 1.8%, and 0.4% were
reported for rarely, sometimes, and frequently, respectively.
4.2 Data Screening
Data screening emphasizes preparation for modeling. It ensures that the data is reliable,
and valid for testing the type of the interested causal theory. Table 9 shows the factors
abbreviations that have been used for the research measures (see Appendix C for more details).
Table 9 Variables Abbreviations for Research Measures
Factor Name 1 Supervision Sup 2 Safety Focus SF 3 Safety Communication and Feedback Com 4 Recognition Rec 5 Coworker Support for Safety Co 6 Training Tra 7 Job Satisfaction JS 8 Organizational Commitment OC 9 Emotional Exhaustion EX
10 Turnover Intention TI 11 Safety Motivation SM 12 Reporting Unsafe Behavior SRU 13 Errors ME 14 Violations Vio

70
4.2.1 Missing Data
Thirty one questionnaires were excluded due to either missing a lot of data of particular
factors or inconsistency of answers (when reverse-scored questions are exists). However, 23
single missing values that were scattered through the cases were estimated by using a prior
knowledge technique (e.g., demographical data) or by inserting median values (Tabachnick &
Fidell, 1996).
4.2.2 Outliers
All data outliers were checked and corrected by producing a Boxplots in SPSS (e.g.,
Figure 5 & Figure 6). The presence of those outliers was caused by an incorrect data entry into
Microsoft Excel program.
Figure 5 SPSS Boxplots for Age
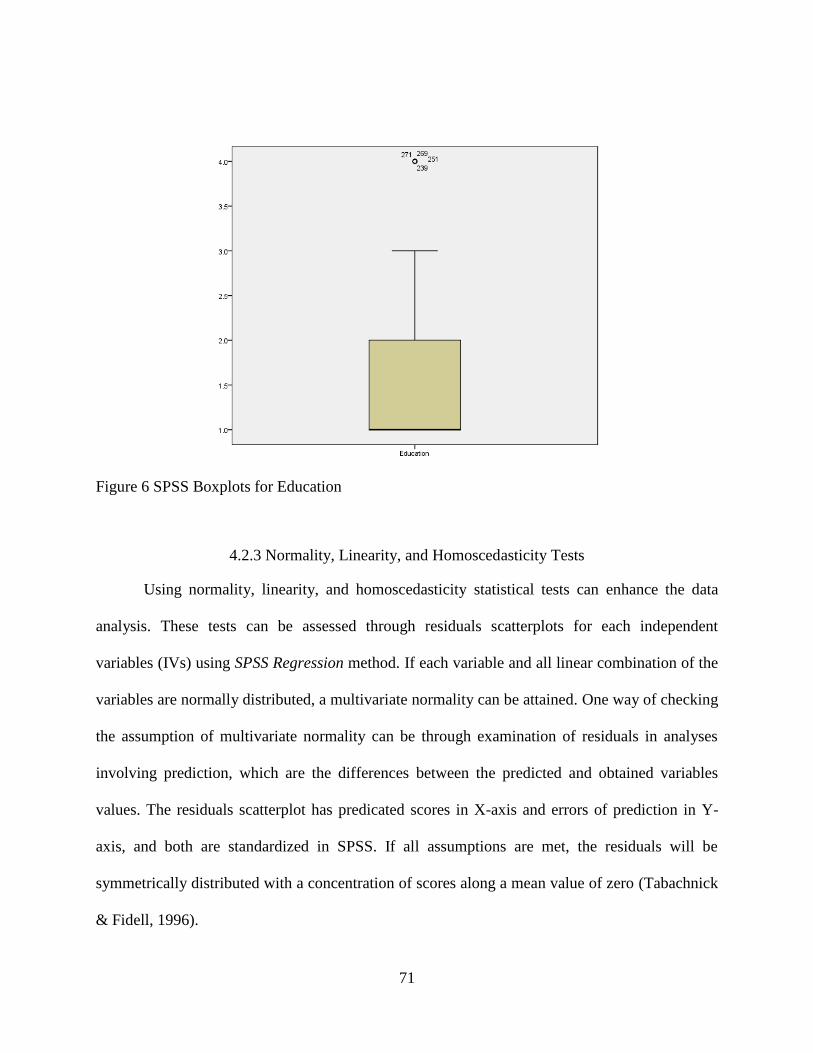
71
Figure 6 SPSS Boxplots for Education
4.2.3 Normality, Linearity, and Homoscedasticity Tests
Using normality, linearity, and homoscedasticity statistical tests can enhance the data
analysis. These tests can be assessed through residuals scatterplots for each independent
variables (IVs) using SPSS Regression method. If each variable and all linear combination of the
variables are normally distributed, a multivariate normality can be attained. One way of checking
the assumption of multivariate normality can be through examination of residuals in analyses
involving prediction, which are the differences between the predicted and obtained variables
values. The residuals scatterplot has predicated scores in X-axis and errors of prediction in Y-
axis, and both are standardized in SPSS. If all assumptions are met, the residuals will be
symmetrically distributed with a concentration of scores along a mean value of zero (Tabachnick
& Fidell, 1996).
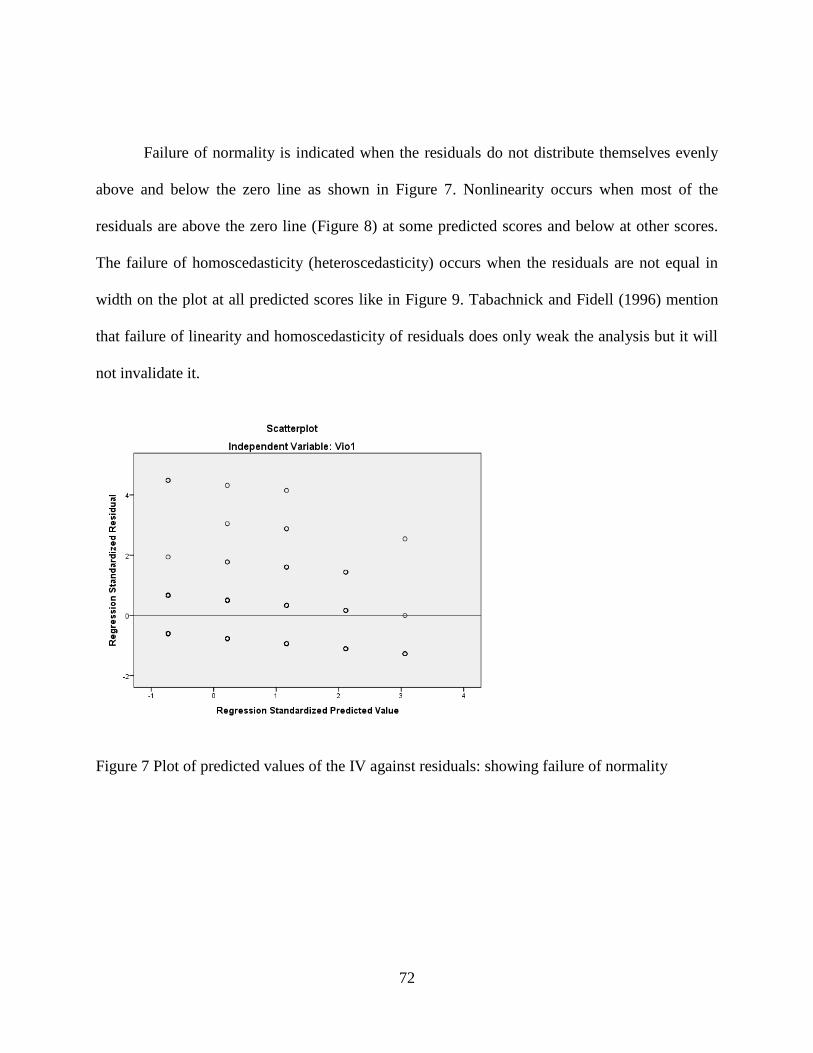
72
Failure of normality is indicated when the residuals do not distribute themselves evenly
above and below the zero line as shown in Figure 7. Nonlinearity occurs when most of the
residuals are above the zero line (Figure 8) at some predicted scores and below at other scores.
The failure of homoscedasticity (heteroscedasticity) occurs when the residuals are not equal in
width on the plot at all predicted scores like in Figure 9. Tabachnick and Fidell (1996) mention
that failure of linearity and homoscedasticity of residuals does only weak the analysis but it will
not invalidate it.
Figure 7 Plot of predicted values of the IV against residuals: showing failure of normality
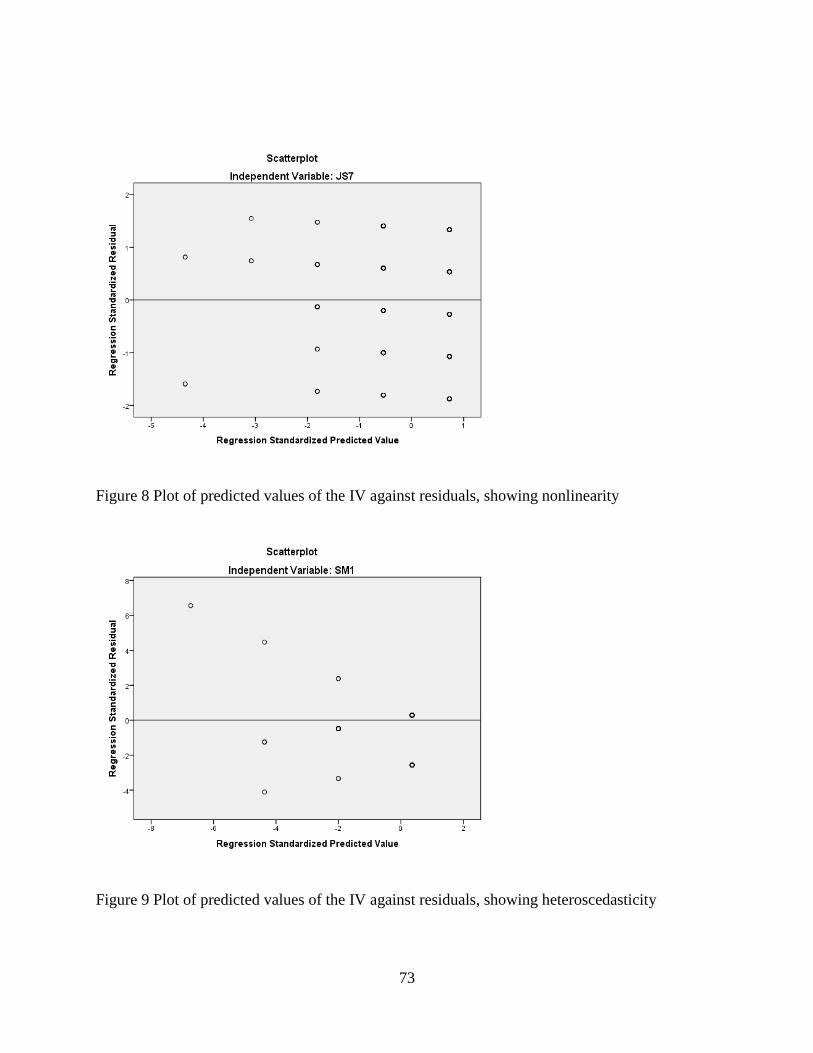
73
Figure 8 Plot of predicted values of the IV against residuals, showing nonlinearity
Figure 9 Plot of predicted values of the IV against residuals, showing heteroscedasticity
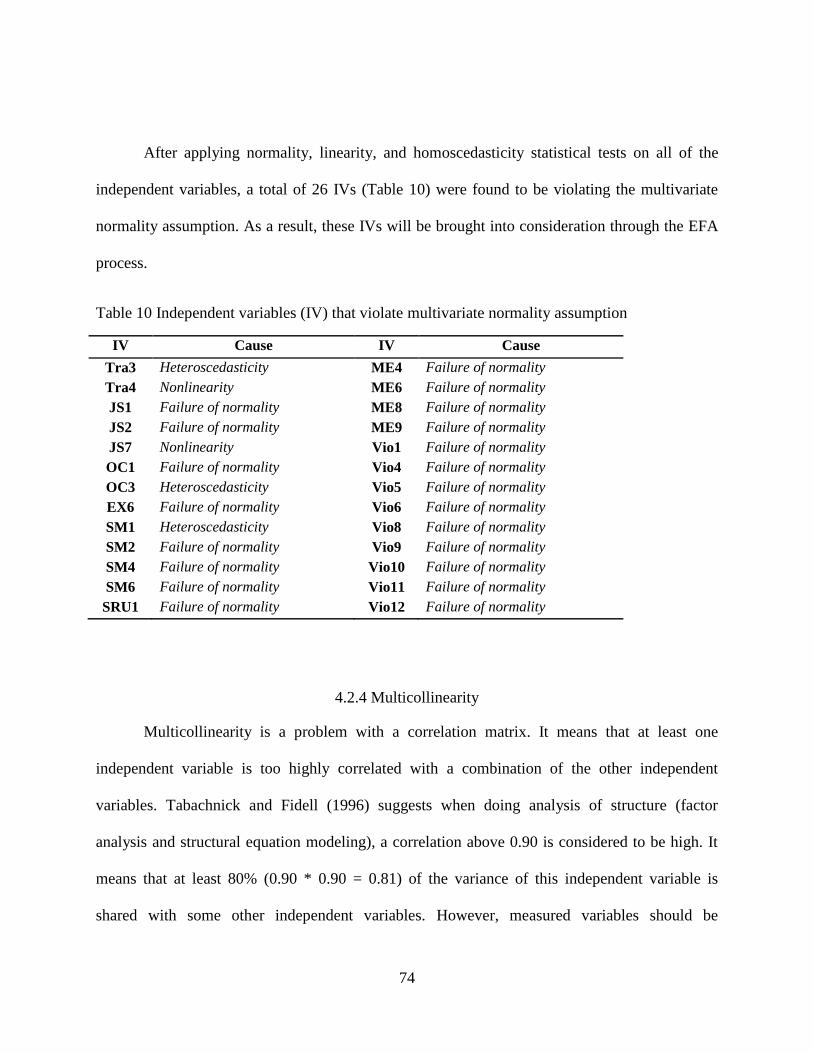
74
After applying normality, linearity, and homoscedasticity statistical tests on all of the
independent variables, a total of 26 IVs (Table 10) were found to be violating the multivariate
normality assumption. As a result, these IVs will be brought into consideration through the EFA
process.
Table 10 Independent variables (IV) that violate multivariate normality assumption
IV Cause IV Cause
Tra3 Heteroscedasticity ME4 Failure of normality
Tra4 Nonlinearity ME6 Failure of normality
JS1 Failure of normality ME8 Failure of normality
JS2 Failure of normality ME9 Failure of normality
JS7 Nonlinearity Vio1 Failure of normality
OC1 Failure of normality Vio4 Failure of normality
OC3 Heteroscedasticity Vio5 Failure of normality
EX6 Failure of normality Vio6 Failure of normality
SM1 Heteroscedasticity Vio8 Failure of normality
SM2 Failure of normality Vio9 Failure of normality
SM4 Failure of normality Vio10 Failure of normality
SM6 Failure of normality Vio11 Failure of normality
SRU1 Failure of normality Vio12 Failure of normality
4.2.4 Multicollinearity
Multicollinearity is a problem with a correlation matrix. It means that at least one
independent variable is too highly correlated with a combination of the other independent
variables. Tabachnick and Fidell (1996) suggests when doing analysis of structure (factor
analysis and structural equation modeling), a correlation above 0.90 is considered to be high. It
means that at least 80% (0.90 * 0.90 = 0.81) of the variance of this independent variable is
shared with some other independent variables. However, measured variables should be

75
correlated with one another under the same factor and thus, they would be expected to have a
strong internal consistency (e.g., Cronbach’s alpha). The test for multicollinearity was produced
in SPSS Correlate method as shown in Appendix C which turned that no multicollinearity was
evident. The highest two correlations were in safety motivation factor with values of 0.773 &
0.785 between (SM5-SM3) and (SM6-SM5), respectively.
In addition to the multicollinearity check, Table 11 shows the independents variables (IV)
that have insignificant correlation among other variables in the same construct at two-tailed test
of significance. Again, these specific IVs will be brought under attention during EFA process.
Table 11 Independent variables with insignificant correlation
Factor Correlation Contributed IVs
Safety Focus (SF1-SF3), (SF1-SF5), & (SF2-SF5) SF1 & SF2 or SF5
Job Satisfaction JS7 With (JS1, JS2, JS4, JS5,& JS6) JS7
Emotional Exhaustion (EX6-EX4), (EX6-EX5), & (EX7-EX6) EX6
Self-Report Unsafe Behavior (SRU2-SRU1) & (SRU7-SRU1) SRU1
Maintenance Error (ME7-ME2) & (ME6-ME2) ME2
Violation (Vio4-Vio1), (Vio8-Vio1), & (Vio11-Vio1) Vio1
4.3 Exploratory Factor Analysis
Exploratory Factor Analysis (EFA) was applied by examining the factor loadings of the
pattern matrix. Most studies report the outcomes of this matrix. However, it is difficult to apply
EFA on the whole model at once especially, if there are many variables and factors. Therefore,
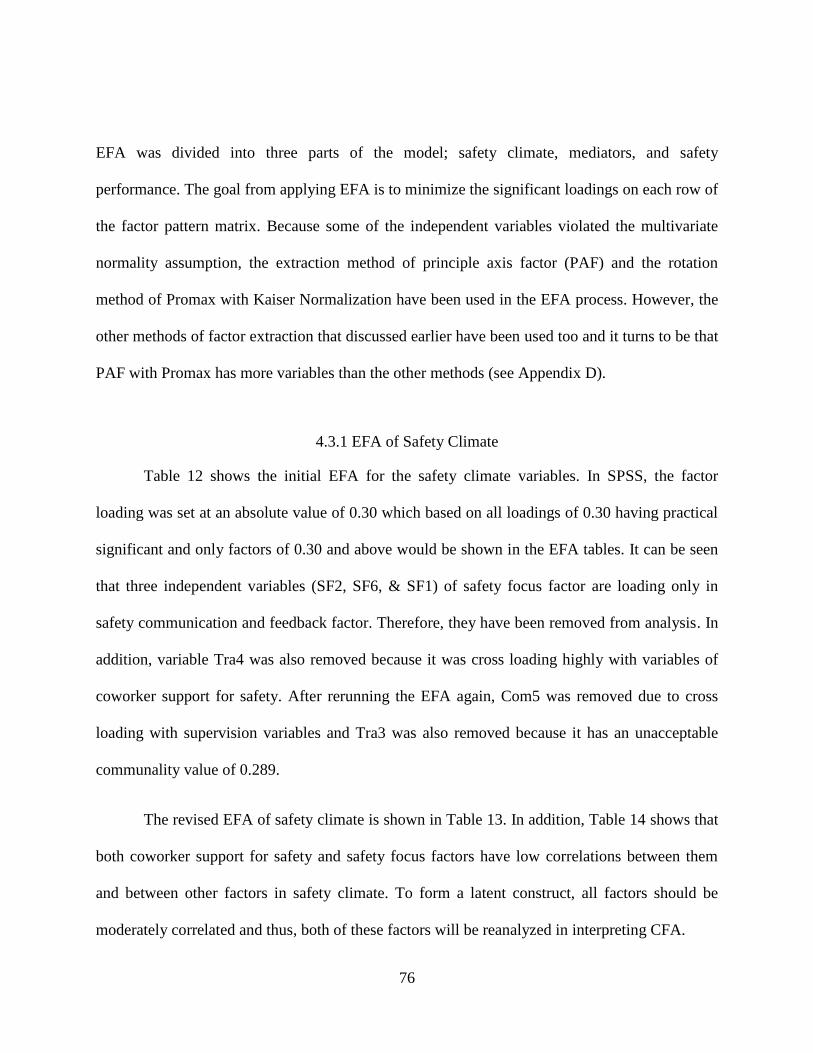
76
EFA was divided into three parts of the model; safety climate, mediators, and safety
performance. The goal from applying EFA is to minimize the significant loadings on each row of
the factor pattern matrix. Because some of the independent variables violated the multivariate
normality assumption, the extraction method of principle axis factor (PAF) and the rotation
method of Promax with Kaiser Normalization have been used in the EFA process. However, the
other methods of factor extraction that discussed earlier have been used too and it turns to be that
PAF with Promax has more variables than the other methods (see Appendix D).
4.3.1 EFA of Safety Climate
Table 12 shows the initial EFA for the safety climate variables. In SPSS, the factor
loading was set at an absolute value of 0.30 which based on all loadings of 0.30 having practical
significant and only factors of 0.30 and above would be shown in the EFA tables. It can be seen
that three independent variables (SF2, SF6, & SF1) of safety focus factor are loading only in
safety communication and feedback factor. Therefore, they have been removed from analysis. In
addition, variable Tra4 was also removed because it was cross loading highly with variables of
coworker support for safety. After rerunning the EFA again, Com5 was removed due to cross
loading with supervision variables and Tra3 was also removed because it has an unacceptable
communality value of 0.289.
The revised EFA of safety climate is shown in Table 13. In addition, Table 14 shows that
both coworker support for safety and safety focus factors have low correlations between them
and between other factors in safety climate. To form a latent construct, all factors should be
moderately correlated and thus, both of these factors will be reanalyzed in interpreting CFA.

77
Table 12 Initial EFA for safety climate
Pattern Matrixa
Factor 1 2 3 4 5 6
SF2 0.916 Com4 0.822 Com2 0.806 Com3 0.797 Com6 0.764 Com7 0.746 Com1 0.708 Com5 0.638 0.31 SF6 0.613 Com8 0.584 SF1 0.522 Sup2 0.822 Sup1 0.807 Sup3 0.756 Sup5 0.705 Sup6 0.7 Sup4 0.627 Sup7 0.611 Sup9 0.606 Sup8 0.557 Rec2 0.907 Rec5 0.762 Rec3 0.703 Rec1 0.622 Rec4 0.618 Tra5 0.73 Tra1 0.727 Tra7 0.705 Tra3 0.643 Tra2 0.487 Tra6 0.327 0.463 Co1 0.856 Co2 0.815 Co3 0.635 Tra4 0.339 0.348 SF5 0.773 SF4 0.647 SF3 0.549
Extraction Method: Principal Axis Factoring. Rotation Method: Promax with Kaiser Normalization. a. Rotation converged in 6 iterations.

78
Table 13 Revised EFA for Safety Climate
Pattern Matrixa
Factor
1 2 3 4 5 6
Sup2 .830 Sup1 .828 Sup3 .760 Sup6 .704 Sup5 .699 Sup4 .629 Sup9 .615 Sup7 .599 Sup8 .535 Com2 .908 Com3 .886 Com4 .732 Com7 .722 Com6 .702 Com1 .643 Com8 .579 Rec2 .905 Rec5 .758 Rec3 .733 Rec4 .647 Rec1 .626 Tra5 .783 Tra7 .741 Tra1 .740 Tra6 .543 Tra2 .437 Co1 .863 Co2 .822 Co3 .649 SF5 .780 SF4 .659 SF3 .582
Extraction Method: Principal Axis Factoring. Rotation Method: Promax with Kaiser Normalization. a. Rotation converged in 6 iterations.

79
Table 14 Correlation Matrix for Safety Climate Factors
Factor Correlation Matrix
Factor 1 2 3 4 5 6 1. Sup 1.000
2. Com .603 1.000
3. Rec .568 .695 1.000
4. Tra .625 .730 .640 1.000
5. Co .233 .288 .148 .228 1.000
6. SF .230 .347 .262 .414 .031 1.000 Extraction Method: Principal Axis Factoring. Rotation Method: Promax with Kaiser Normalization.
4.3.2 EFA of Mediators Variables
From Table 15, SM4 was deleted because it is cross loading negatively with job
satisfaction variables. EX6 and EX7 were removed too because they have low communalities
values of 0.162 and 0.255, respectively. In addition, EX6 has a negative loading with emotional
exhaustion variables and EX7 is loading only with the variables of turnover intention. It seems
the question of EX6 “I feel I am working too hard on my job” has confused the respondents. JS7
was also deleted because it has a communality value of 0.127 and is not loading on any factor as
well. Generally, variables with low communalities could be either from the wording of the item
that it is ambiguous or could be that the associated variable does not belong to the domain of
interest as other variables in the analysis. Furthermore, OC1 is loading only on job satisfaction
factor and therefore was eliminated from the model. Finally, both TI4 and OC6 were removed
after running the model one more time because they both are cross loading between factors of
turnover intention and organizational commitment with minimal values.

80
Table 15 Initial EFA for Mediators Variables
Pattern Matrixa
Factor
1 2 3 4 5 6
SM5 .896 SM3 .847 SM6 .819 SM2 .789 SM1 .727 SM4 .382 -.302 TI1 .922 TI2 .918 TI3 .684 TI4 .411 .307 EX7 .411 OC4 .893 OC5 .691 OC2 .642 .349 OC3 .498 .316 OC6 .350 .373 JS4 .658 JS5 .645 JS6 .577 OC1 .541 EX1 .785 EX2 .780 EX4 .646 EX3 .640 EX5 .421 EX6 -.395 JS7 JS2 .896 JS3 .708 JS1 .692
Extraction Method: Principal Axis Factoring. Rotation Method: Promax with Kaiser Normalization. a. Rotation converged in 43 iterations.
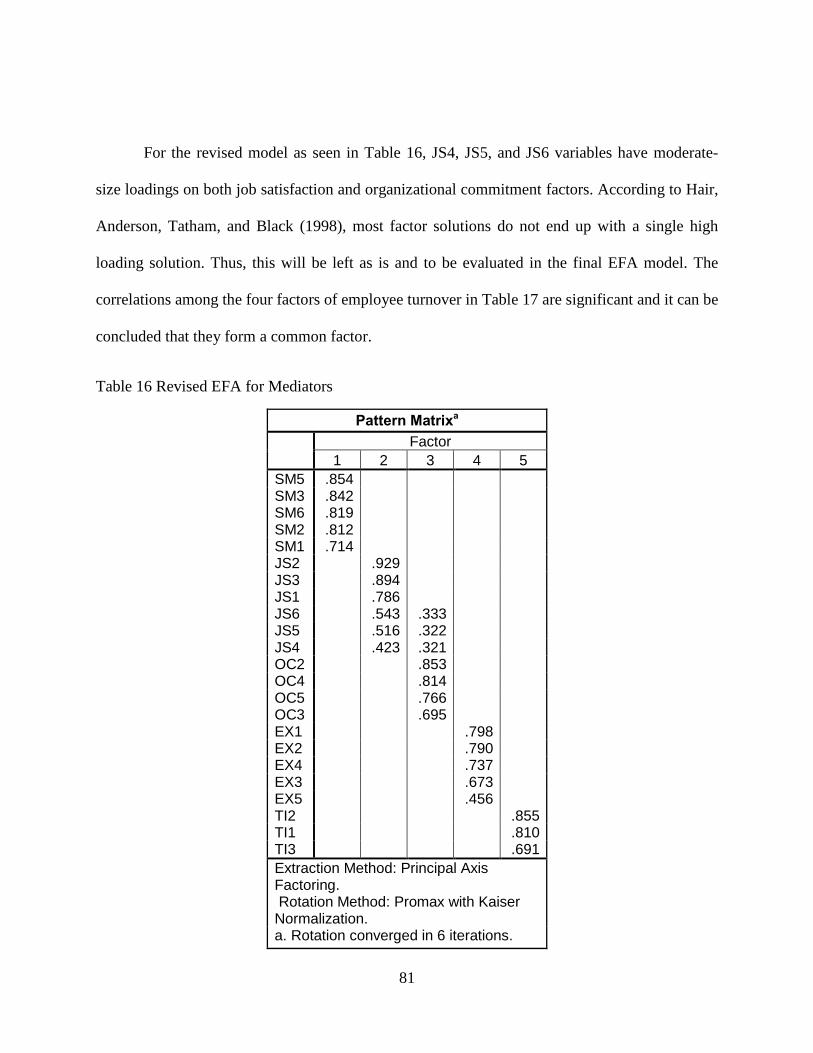
81
For the revised model as seen in Table 16, JS4, JS5, and JS6 variables have moderate-
size loadings on both job satisfaction and organizational commitment factors. According to Hair,
Anderson, Tatham, and Black (1998), most factor solutions do not end up with a single high
loading solution. Thus, this will be left as is and to be evaluated in the final EFA model. The
correlations among the four factors of employee turnover in Table 17 are significant and it can be
concluded that they form a common factor.
Table 16 Revised EFA for Mediators
Pattern Matrixa
Factor
1 2 3 4 5 SM5 .854 SM3 .842 SM6 .819 SM2 .812 SM1 .714 JS2 .929 JS3 .894 JS1 .786 JS6 .543 .333 JS5 .516 .322 JS4 .423 .321 OC2 .853 OC4 .814 OC5 .766 OC3 .695 EX1 .798 EX2 .790 EX4 .737 EX3 .673 EX5 .456 TI2 .855 TI1 .810 TI3 .691
Extraction Method: Principal Axis Factoring. Rotation Method: Promax with Kaiser Normalization. a. Rotation converged in 6 iterations.
82
Table 17 Correlation Matrix for Mediators Factors
Factor Correlation Matrix
Factor 1 2 3 4 5 1. SM 1.000
2. JS* -.325 1.000
3. OC* -.172 .659 1.000
4. EX -.083 .434 .510 1.000
5. TI -.152 .489 .601 .554 1.000
Extraction Method: Principal Axis Factoring. Rotation Method: Promax with Kaiser Normalization. *JS & OC are reverse-coded factors.
4.3.3 EFA for Safety Performance
From Table 18, Vio1 was removed due to unacceptable communality of 0.097 and in the
same time, it was not loading on any factor. Similarly, ME9 was not loading in any factor too
and was dropped out. Moreover, SRU1 was removed because it was loading by itself only in one
factor. ME8 had low communality of 0.283 and was loading only with violations variables and
thus was removed. SRU6 was also removed from the analysis due to a low communality value
(0.252).
Finally after simplifying the model, it turned to be that both SRU2 and SRU7 were
constructing a factor by themselves. As a result, both were removed since it has been
recommended as discussed earlier to have at least three variables to measure a factor when the
sample size is not large. Moreover, Vio11 and Vio12 were removed due to their high loading
with errors variables.
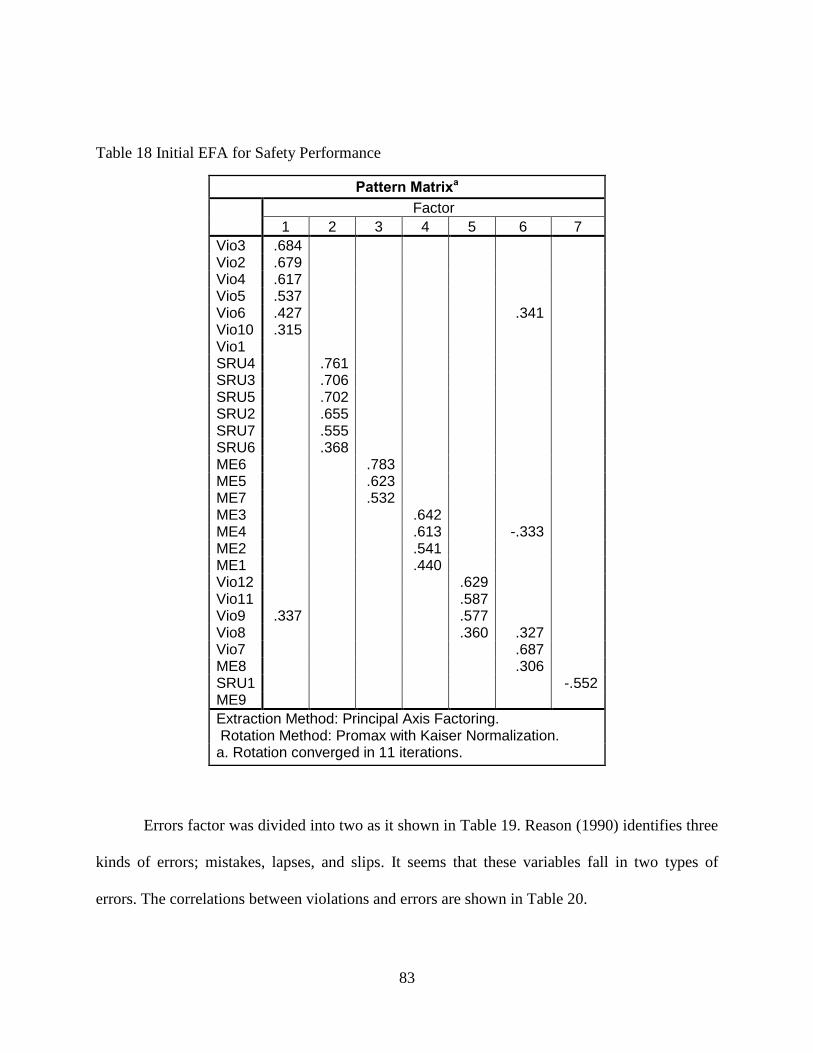
83
Table 18 Initial EFA for Safety Performance
Pattern Matrixa
Factor
1 2 3 4 5 6 7
Vio3 .684 Vio2 .679 Vio4 .617 Vio5 .537 Vio6 .427 .341 Vio10 .315 Vio1 SRU4 .761 SRU3 .706 SRU5 .702 SRU2 .655 SRU7 .555 SRU6 .368 ME6 .783 ME5 .623 ME7 .532 ME3 .642 ME4 .613 -.333 ME2 .541 ME1 .440 Vio12 .629 Vio11 .587 Vio9 .337 .577 Vio8 .360 .327 Vio7 .687 ME8 .306 SRU1 -.552 ME9
Extraction Method: Principal Axis Factoring. Rotation Method: Promax with Kaiser Normalization. a. Rotation converged in 11 iterations.
Errors factor was divided into two as it shown in Table 19. Reason (1990) identifies three
kinds of errors; mistakes, lapses, and slips. It seems that these variables fall in two types of
errors. The correlations between violations and errors are shown in Table 20.

84
Table 19 Revised EFA for Safety Performance
Pattern Matrixa
Factor
1 2 3 4
Vio5 .784 Vio8 .730 Vio7 .716 Vio6 .690 Vio4 .670 Vio9 .576 Vio3 .560 Vio2 .546 Vio10 .475 ME6 .798 ME5 .642 ME7 .626 SRU4 .865 SRU5 .734 SRU3 .659 ME2 .644 ME3 .637 ME1 .514 ME4 .494 Extraction Method: Principal Axis Factoring. Rotation Method: Promax with Kaiser Normalization. a. Rotation converged in 6 iterations.
Table 20 Correlation Matrix for Safety Performance
Factor Correlation Matrix
Factor 1 2 3 4 1. Vio 1.000
2. ME(1) .516 1.000
3. SRU -.371 -.131 1.000
4. ME(2) .438 .461 -.361 1.000
Extraction Method: Principal Axis Factoring. Rotation Method: Promax with Kaiser Normalization.
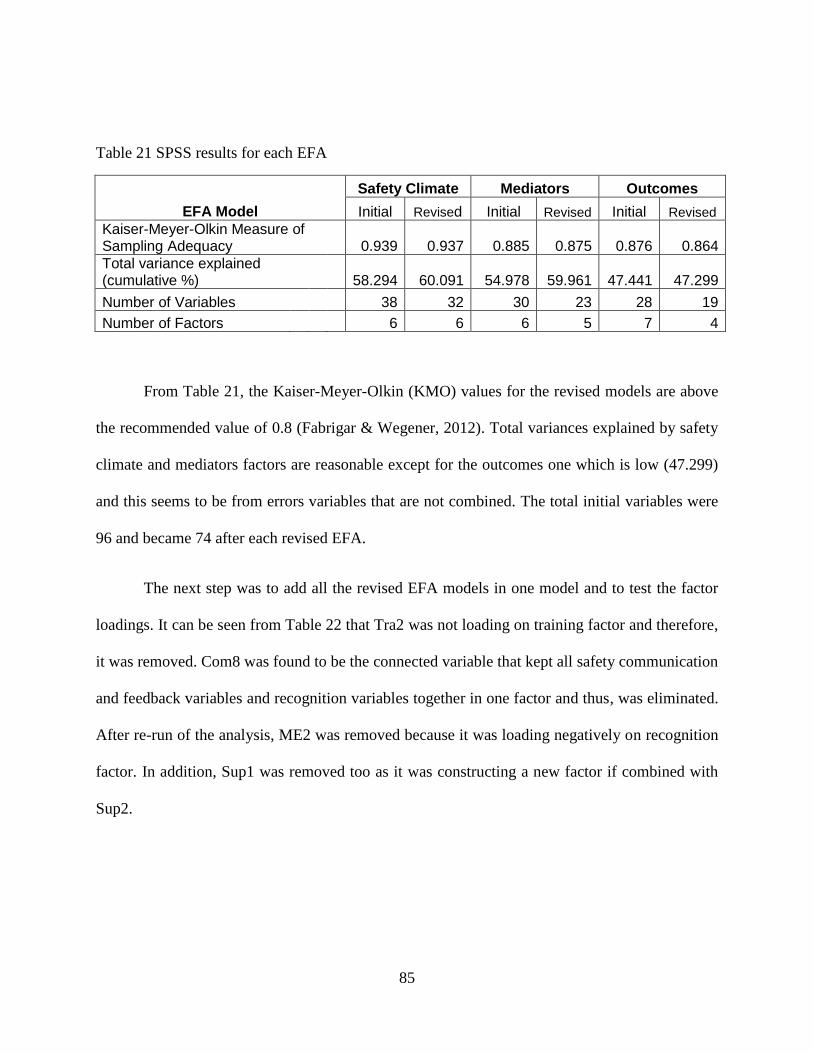
85
Table 21 SPSS results for each EFA
EFA Model
Safety Climate Mediators Outcomes
Initial Revised Initial Revised Initial Revised
Kaiser-Meyer-Olkin Measure of Sampling Adequacy 0.939 0.937 0.885 0.875 0.876 0.864 Total variance explained (cumulative %) 58.294 60.091 54.978 59.961 47.441 47.299
Number of Variables 38 32 30 23 28 19
Number of Factors 6 6 6 5 7 4
From Table 21, the Kaiser-Meyer-Olkin (KMO) values for the revised models are above
the recommended value of 0.8 (Fabrigar & Wegener, 2012). Total variances explained by safety
climate and mediators factors are reasonable except for the outcomes one which is low (47.299)
and this seems to be from errors variables that are not combined. The total initial variables were
96 and became 74 after each revised EFA.
The next step was to add all the revised EFA models in one model and to test the factor
loadings. It can be seen from Table 22 that Tra2 was not loading on training factor and therefore,
it was removed. Com8 was found to be the connected variable that kept all safety communication
and feedback variables and recognition variables together in one factor and thus, was eliminated.
After re-run of the analysis, ME2 was removed because it was loading negatively on recognition
factor. In addition, Sup1 was removed too as it was constructing a new factor if combined with
Sup2.

86
Table 22 Initial EFA after adding all revised parts
Pattern Matrixa
Factor
1 2 3 4 5 6 7 8 9 10 11 12 13 14 15
Com2 .935 Com3 .842 Com7 .778 Com1 .720 Com6 .705 Com4 .680 Com8 .663 Rec5 .551 .376 Rec2 .533 .461 Tra2 .522 Rec4 .522 .453 Rec3 .511 .360 Rec1 .473 Tra6 .421 .406 Sup2 .839 .665 Sup1 .819 .602 Sup3 .763 Sup6 .759 Sup5 .730 Sup9 .663 Sup4 .649 Sup7 .640 Sup8 .608 Vio5 .759 Vio8 .708 Vio4 .694 Vio9 .650 Vio6 .617 Vio2 .578 Vio7 .562 Vio3 .544 Vio10 .529 JS3 .831 JS2 .808 JS1 .760 JS5 .690 JS6 .677 JS4 .607 SM3 .845 SM5 .844 SM6 .824 SM2 .820 SM1 .706 EX2 .808 EX1 .732 EX4 .664 EX3 .635 EX5 .441 TI2 .840 TI1 .773 TI3 .680 Co1 .869 Co2 .819 Co3 .616 ME5 .758 ME6 .723 ME7 .580 SRU4 .842 SRU3 .703

87
Pattern Matrixa
SRU5 .669 SF5 .756 SF3 .671 SF4 .621 ME3 .332 -.534 ME4 .375 -.532 ME2 -.497 ME1 -.366 Tra5 .617 Tra7 .592 Tra1 .422 OC4 -.328 .550 OC5 .509 OC2 .454 OC3 .420
Extraction Method: Principal Axis Factoring. Rotation Method: Promax with Kaiser Normalization. a. Rotation converged in 38 iterations.
The final EFA model is presented in Table 23 which shows 70 items that divided into 14
factors and this model has been used in CFA process. In this developed model, all the variables
have moderate to high loadings except ME1 which has a value of 0.34. However, this value can
be considered as practically significant. The EFA model’s communalities are presented in
Appendix D. In this appendix, the second column is the initial communalities which they are the
squared multiple correlations. The third column is the extraction communalities which are the
variance in variables accounted for by the extracted factors. As they have been shown, all
communalities are good except for ME3, with low communality value of 0.326 but acceptable
based on the sample size. The total amount of variance accounted for by the 14 factors is 59.847.
Finally, both job satisfaction and organizational commitment are not cross loading
anymore as were shown earlier in Table 16. Moreover, the errors variables are loading only on
one factor and not on two as they were previously shown in Table 19.
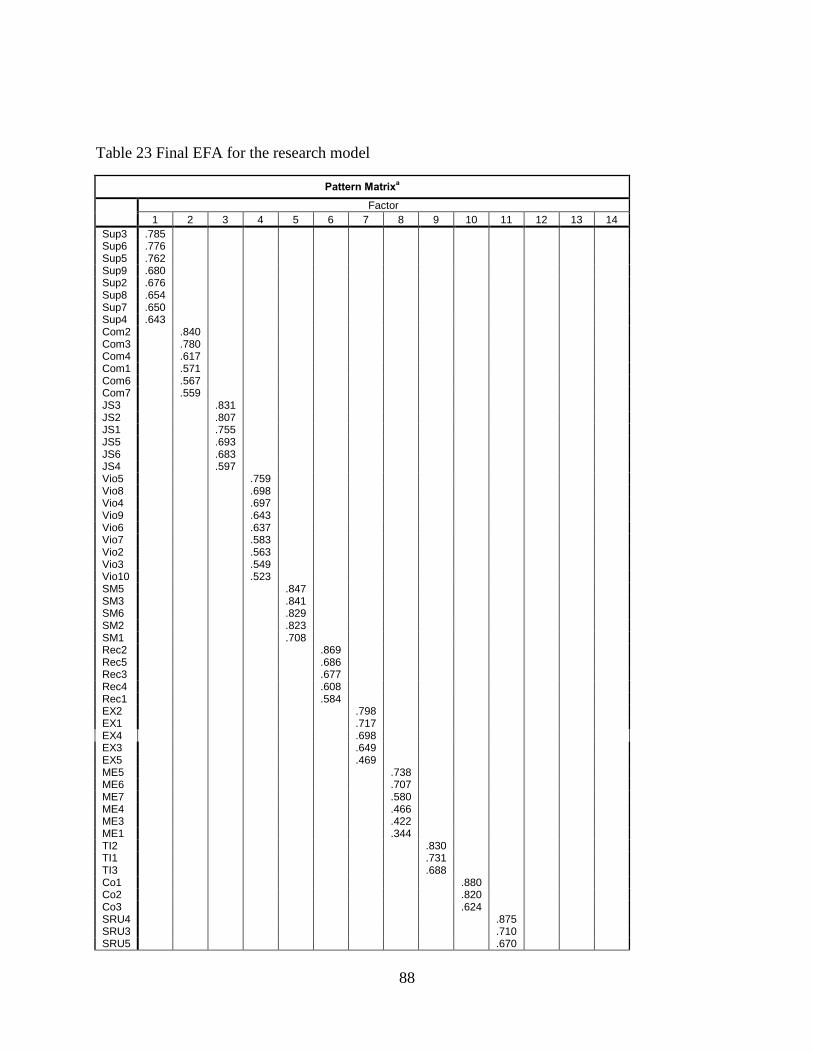
88
Table 23 Final EFA for the research model
Pattern Matrixa
Factor
1 2 3 4 5 6 7 8 9 10 11 12 13 14
Sup3 .785 Sup6 .776 Sup5 .762 Sup9 .680 Sup2 .676 Sup8 .654 Sup7 .650 Sup4 .643 Com2 .840 Com3 .780 Com4 .617 Com1 .571 Com6 .567 Com7 .559 JS3 .831 JS2 .807 JS1 .755 JS5 .693 JS6 .683 JS4 .597 Vio5 .759 Vio8 .698 Vio4 .697 Vio9 .643 Vio6 .637 Vio7 .583 Vio2 .563 Vio3 .549 Vio10 .523 SM5 .847 SM3 .841 SM6 .829 SM2 .823 SM1 .708 Rec2 .869 Rec5 .686 Rec3 .677 Rec4 .608 Rec1 .584 EX2 .798 EX1 .717 EX4 .698 EX3 .649 EX5 .469 ME5 .738 ME6 .707 ME7 .580 ME4 .466 ME3 .422 ME1 .344 TI2 .830 TI1 .731 TI3 .688 Co1 .880 Co2 .820 Co3 .624 SRU4 .875 SRU3 .710 SRU5 .670
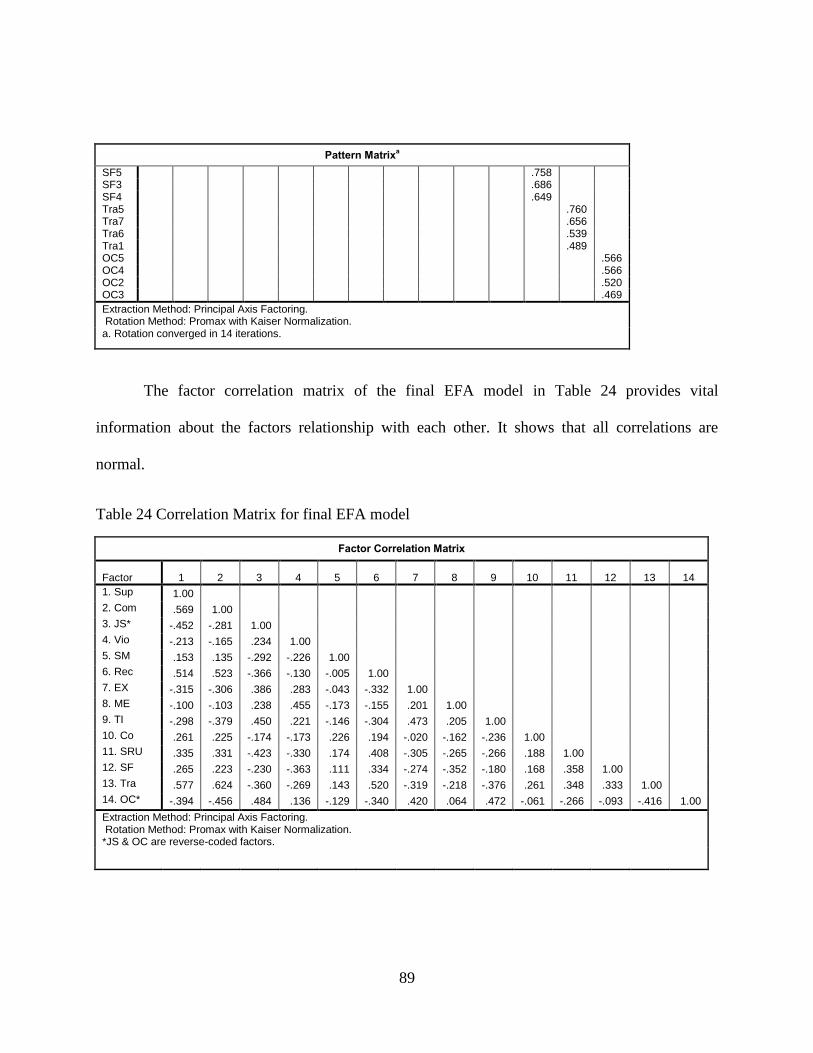
89
Pattern Matrixa
SF5 .758 SF3 .686 SF4 .649 Tra5 .760 Tra7 .656 Tra6 .539 Tra1 .489 OC5 .566 OC4 .566 OC2 .520 OC3 .469
Extraction Method: Principal Axis Factoring. Rotation Method: Promax with Kaiser Normalization. a. Rotation converged in 14 iterations.
The factor correlation matrix of the final EFA model in Table 24 provides vital
information about the factors relationship with each other. It shows that all correlations are
normal.
Table 24 Correlation Matrix for final EFA model
Factor Correlation Matrix
Factor 1 2 3 4 5 6 7 8 9 10 11 12 13 14
1. Sup 1.00
2. Com .569 1.00
3. JS* -.452 -.281 1.00
4. Vio -.213 -.165 .234 1.00
5. SM .153 .135 -.292 -.226 1.00
6. Rec .514 .523 -.366 -.130 -.005 1.00
7. EX -.315 -.306 .386 .283 -.043 -.332 1.00
8. ME -.100 -.103 .238 .455 -.173 -.155 .201 1.00
9. TI -.298 -.379 .450 .221 -.146 -.304 .473 .205 1.00
10. Co .261 .225 -.174 -.173 .226 .194 -.020 -.162 -.236 1.00
11. SRU .335 .331 -.423 -.330 .174 .408 -.305 -.265 -.266 .188 1.00
12. SF .265 .223 -.230 -.363 .111 .334 -.274 -.352 -.180 .168 .358 1.00
13. Tra .577 .624 -.360 -.269 .143 .520 -.319 -.218 -.376 .261 .348 .333 1.00
14. OC* -.394 -.456 .484 .136 -.129 -.340 .420 .064 .472 -.061 -.266 -.093 -.416 1.00
Extraction Method: Principal Axis Factoring. Rotation Method: Promax with Kaiser Normalization. *JS & OC are reverse-coded factors.

90
The comparison among the EFA models is presented in Table 25. There were 96 items
which formed 22 factors and were reduced to 74 items within 15 factors after analyzing each part
of the model separately.
Table 25 SPSS Results for the Developed EFA Model
EFA Model Initial Revised Final Kaiser-Meyer-Olkin Measure of Sampling Adequacy 0.886 0.89 0.885 Total variance explained (cumulative %) 61.964 60.417 59.847 Number of Variables 96 74 70 Number of Factors 22 15 14
Table 26 Factors Internal Consistency (Reliability) of the EFA Model
# Factor
Initial Data After EFA
Number of Cronbach’s Number of Cronbach’s
Items Alpha Items Alpha
1 Sup 9 0.915 8 0.909
2 SF 6 0.712 3 0.715
3 Com 8 0.921 6 0.903
4 Rec 5 0.892 5 0.892
5 Co 3 0.826 3 0.826
6 Tra 7 0.868 4 0.854
7 JS 7 0.762 6 0.874
8 OC 6 0.842 4 0.838
9 EX 7 0.723 5 0.829
10 TI 4 0.793 3 0.801
11 SM 6 0.87 5 0.904
12 SRU 7 0.768 3 0.791
13 ME 9 0.77 6 0.756
14 Vio 12 0.862 9 0.86
96 70
Finally, EFA results were checked by discriminant validity. Brown (2006) argued that
poor discriminant validity exists when factor correlations are above 0.80. From Table 24, it can
be seen that the all correlations were less than 0.80 and thus, discriminant validity was
confirmed. In addition, all factors had a value of Cronbach’s alpha greater than the recommended
value of 0.7 (Table 26). Therefore, the reliability of the EFA model was confirmed.
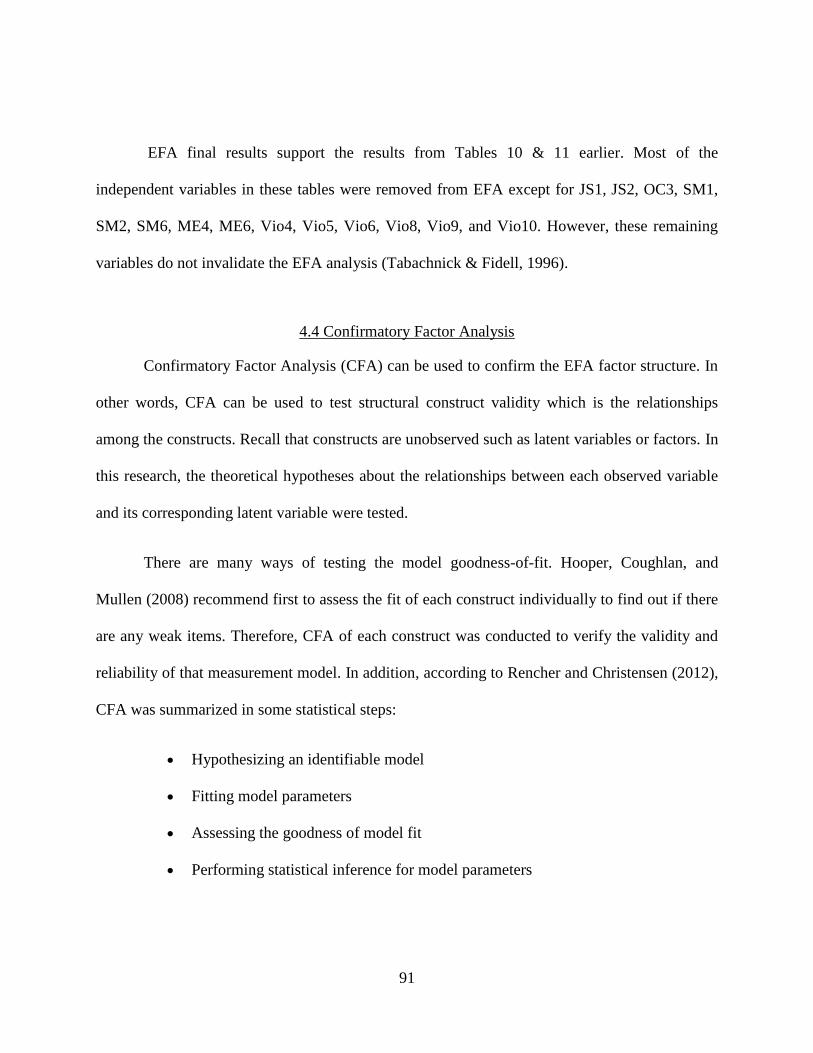
91
EFA final results support the results from Tables 10 & 11 earlier. Most of the
independent variables in these tables were removed from EFA except for JS1, JS2, OC3, SM1,
SM2, SM6, ME4, ME6, Vio4, Vio5, Vio6, Vio8, Vio9, and Vio10. However, these remaining
variables do not invalidate the EFA analysis (Tabachnick & Fidell, 1996).
4.4 Confirmatory Factor Analysis
Confirmatory Factor Analysis (CFA) can be used to confirm the EFA factor structure. In
other words, CFA can be used to test structural construct validity which is the relationships
among the constructs. Recall that constructs are unobserved such as latent variables or factors. In
this research, the theoretical hypotheses about the relationships between each observed variable
and its corresponding latent variable were tested.
There are many ways of testing the model goodness-of-fit. Hooper, Coughlan, and
Mullen (2008) recommend first to assess the fit of each construct individually to find out if there
are any weak items. Therefore, CFA of each construct was conducted to verify the validity and
reliability of that measurement model. In addition, according to Rencher and Christensen (2012),
CFA was summarized in some statistical steps:
Hypothesizing an identifiable model
Fitting model parameters
Assessing the goodness of model fit
Performing statistical inference for model parameters

92
CFA of safety climate, employee turnover, and unsafe acts were tested as second order
factors while safety motivation and reporting unsafe behaviors were tested as first order factors.
The maximum likelihood estimation method was used to measure validity and reliability of each
measurement model since the absolute values of the kurtosis of the variables were below 20.0
(Harrington, 2009) as shown in Appendix F.
4.4.1 CFA of Safety Climate
Safety climate was the exogenous (independent) variable that was measured by six
factors. The standardized estimates output is shown in Figure 10. Using the factor loading scale
in Table 5, all factor loadings from latent to observed variables were acceptable where the
highest value was 0.85 (Recognition-Rec2) and lowest value was 0.61 (SafetyFocus-SF3).
Moreover, all observed variables were significantly (р < 0.001) loading on the expected latent
variable as it shown in Table E1 in Appendix E. All the latent variables were significantly
correlated as expected except for the correlation between CoworkerSupport and SafetyFocus
(r=0.04; р=0.582). The covariance between them was not significantly different from zero at the
0.05 level (two-tailed). These correlations were high only between Supervision, Communication,
Recognition, and Training which means that they were measuring the same construct. Moreover,
these four factors did not have high correlations with SafetyFocus.
Using the earlier recommendations for the acceptable model fit, the initial second order
safety climate CFA model did fit kindly well with RMSEA = 0.054, CFI = 0.936, and TLI =
0.929. However, there were some modifications needed to be applied to get a better fit and they
were based on modification indices (MI) and examination of residuals.
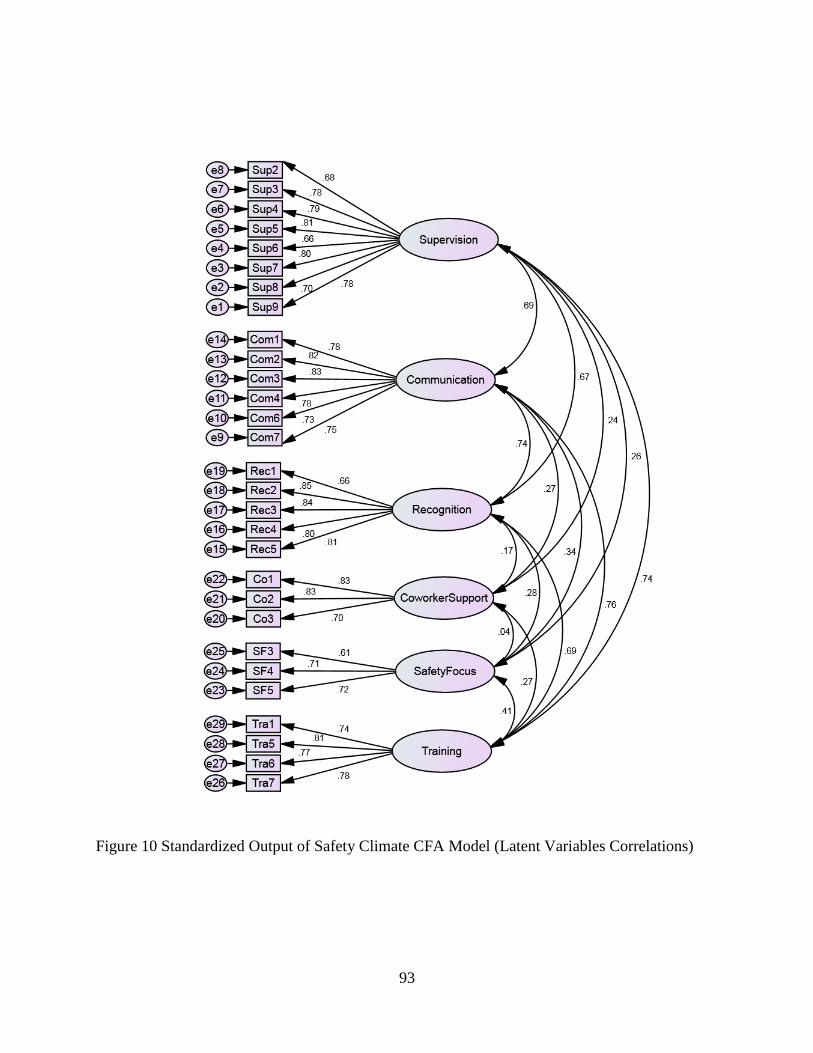
93
Figure 10 Standardized Output of Safety Climate CFA Model (Latent Variables Correlations)

94
Figure 11 Standardized Output of the Initial Safety Climate CFA Model
The standardized output of the initial CFA of safety climate is presented in Figure 11.
The relation between SafetyFocus and SafetyClimate was not strong since loading of SafetyFocus
(0.38) was low. This could be from that the remaining three items of SafetyFocus after EFA were

95
related more to a safety attitude (e.g. “Lack of proper equipment sometimes forces us to cut
corners in our work”). The loading of CoworkerSupport on SafetyClimate was 0.28 and was not
interpreted according to Table 5. Therefore, it had been eliminated from the revised model.
Table 27 Modification Indices Output for Safety Climate CFA Model
Covariances: (Group number 1 - Default model)
M.I. Par Change e20 <--> SafetyClimate 22.748 0.178 e11 <--> e29 10.194 0.121 e9 <--> e17 10.088 0.132 e4 <--> e5 12.539 0.169 e2 <--> e8 11.635 -0.138 e1 <--> e6 18.2 -0.139
Regression Weights: (Group number 1 - Default model)
M.I. Par Change Co1 <--- SafetyFocus 14.296 -0.155 Co1 <--- SF3 14.003 -0.092 Co3 <--- SafetyClimate 22.748 0.204 Co3 <--- Training 20.09 0.168 Co3 <--- Recognition 22.89 0.167 Co3 <--- Communication 17.8 0.186 Co3 <--- Supervision 17.382 0.191 Co3 <--- Tra6 21.405 0.158 Co3 <--- Tra7 10.064 0.087 Co3 <--- Rec2 20.106 0.121 Co3 <--- Rec3 18.287 0.116 Co3 <--- Rec4 19.474 0.115 Co3 <--- Com1 16.864 0.123 Co3 <--- Com4 13.12 0.118 Co3 <--- Com6 18.566 0.132 Co3 <--- Sup2 12.252 0.133 Co3 <--- Sup6 11.86 0.103 Co3 <--- Sup8 12.226 0.107 Co3 <--- Sup9 21.16 0.158 Com4 <--- SF3 10.575 0.107

96
Furthermore, to support this action, modification indices were analyzed. For simplicity of
reading tables, the threshold of MI was set to be 10 instead of the default value of 4. The largest
MI (22.748) suggest adding a covariance between the SafetyClimate and error for Co3 (e20) as it
shown in Table 27. In addition, the MI suggest adding paths from SafetyClimate, Training,
Recognition, Communication, and Supervision to Co3 (MI of 22.748, 20.09, 22.89, 17.8, and
17.382, respectively) and other paths from Co3 to other variables. There were also other paths
from SafetyFocus and SF3 to Co1 and from SF3 to Com4 according to the MI output.
According to Harrington (2009), any standardized residuals greater than 1.96 (for р <
0.05) may indicate areas of strain and affect the model’s fit. Generally, in sufficiently large
samples, standardized residual covariances have a standard normal distribution if the model is
correct and most of them should be less than 2.58 in absolute value (Schumacker & Lomax,
2010). Examining the localized area of strain in Table 28, all indicator variables were below 2.58
except for some variables of CoworkerSupport and SafetyFocus. For instance, the residual
covariance between Com4 and SF3 was 2.838 which is greater than the recommended value of
2.58.

97
Table 28 Selected Output Standardized Residuals for Safety Climate CFA Model
Standardized Residual Covariances (Group number 1 - Default model)
Tra1 Tra5 Tra6 Tra7 SF3 SF4 SF5 Co1 Co3 Co1
-2.025
-2.694 0
Co3 2.27 2.09 3.98
0 Rec2
2.305
Rec3
2.422 Rec4
2.347
Com1
2.214 Com2
2.107
Com4
2.838
2.306 Com6
3.15
Com7
2.664 Sup2
2.833
Sup6
-2.575 -2.441
Sup7
2.156
Sup8
2.292 Sup9 3.48
Finally, in order to have a better fit, both SafetyFocus and CoworkerSupport factors were
dropped from the model as they have low factor loading and some complex items. In addition, a
single higher-order factor (safety climate) may relate to the interrelated factors that have nearly
the same magnitude. As a result, the new indices showed some improvement in model fit (CFI =
0.946, TLI = 0.940 and RMSEA = 0.060). However, after examining the MI for this modified
model (Table 29), there were still some modifications that need to be made.
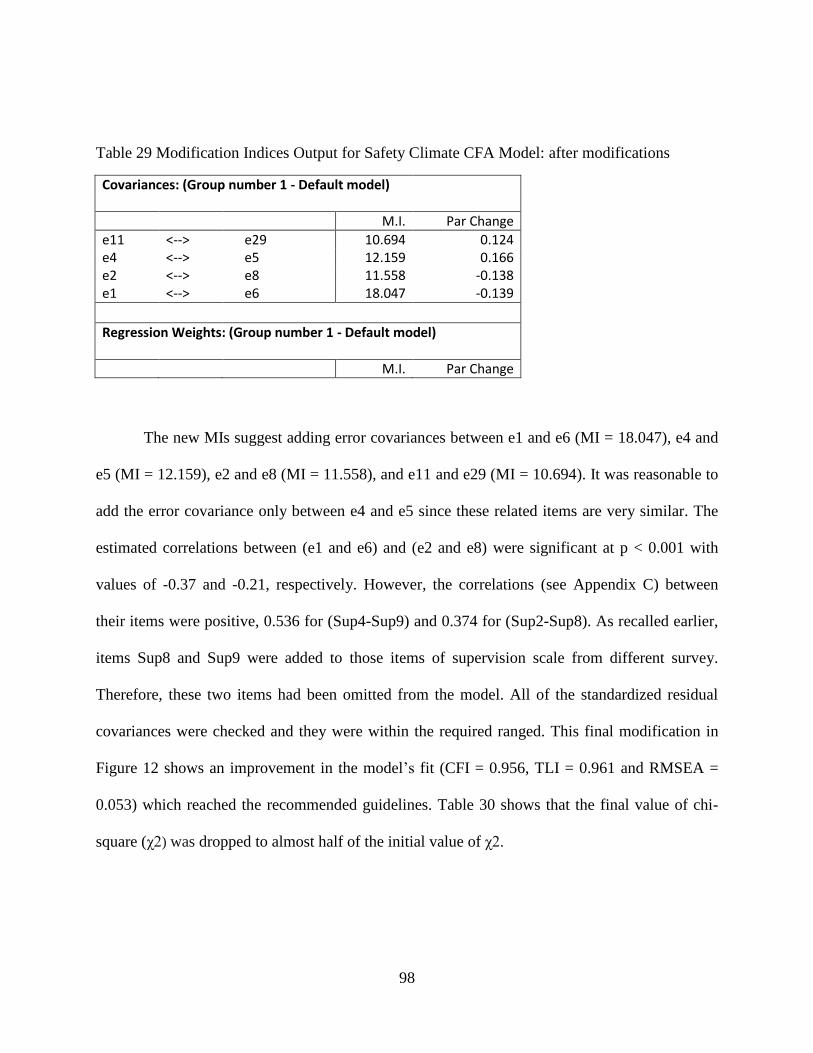
98
Table 29 Modification Indices Output for Safety Climate CFA Model: after modifications
Covariances: (Group number 1 - Default model)
M.I. Par Change e11 <--> e29 10.694 0.124 e4 <--> e5 12.159 0.166 e2 <--> e8 11.558 -0.138 e1 <--> e6 18.047 -0.139
Regression Weights: (Group number 1 - Default model)
M.I. Par Change
The new MIs suggest adding error covariances between e1 and e6 (MI = 18.047), e4 and
e5 (MI = 12.159), e2 and e8 (MI = 11.558), and e11 and e29 (MI = 10.694). It was reasonable to
add the error covariance only between e4 and e5 since these related items are very similar. The
estimated correlations between (e1 and e6) and (e2 and e8) were significant at p < 0.001 with
values of -0.37 and -0.21, respectively. However, the correlations (see Appendix C) between
their items were positive, 0.536 for (Sup4-Sup9) and 0.374 for (Sup2-Sup8). As recalled earlier,
items Sup8 and Sup9 were added to those items of supervision scale from different survey.
Therefore, these two items had been omitted from the model. All of the standardized residual
covariances were checked and they were within the required ranged. This final modification in
Figure 12 shows an improvement in the model’s fit (CFI = 0.956, TLI = 0.961 and RMSEA =
0.053) which reached the recommended guidelines. Table 30 shows that the final value of chi-
square (χ2) was dropped to almost half of the initial value of χ2.

99
Figure 12 Standardized Output of the Final Safety Climate CFA Model

100
Table 30 Comparison among Fit Indices of Safety Climate CFA Models
Model χ2 DF P χ2/DF CFI TLI RMSEA PCLOSE AIC ECVI
Initial 681.126 371 0.000 1.836 0.936 0.929 0.054 0.127 809.126 2.869
Modified 452.188 226 0.000 2.001 0.946 0.940 0.060 0.025 552.188 1.958
Final 328.767 184 0.000 1.787 0.956 0.961 0.053 0.299 422.767 1.499
4.4.2 CFA of Employee Turnover
Employee turnover was an endogenous variable that was measured by four factors as
shown in Figure 13. The standardized estimates output is also shown in Figure 13. Recall earlier,
the curved lines represent the correlations among the latent variables. All the latent variables
were significantly (р < 0.001) correlated as hypothesized previously where the highest
correlation was between JobSat and OrgComt (0.73) and the lowest one was between JobSat and
TurnInt (0.52). Thus, it can be concluded that these latent variables were all measuring employee
turnover.
Table E2 in Appendix E shows the significant of all loadings and correlations. All
observed variables significantly (р < 0.001) loaded on the expected factor and had values of 0.54
and above that were considered good to excellent. The loadings of the six indicators on JobSat
ranged from 0.67 (JS4) to 0.78 (JS5 and JS6). The loadings of the four indicators on OrgComt
ranged from 0.61 (OC4) to 0.81 (OC2). The loadings of the three indicators on TurnInt ranged
from 0.72 (TI2) to 0.82 (TI1), and the loadings of the five indicators on EmoEx ranged from 0.54
(EX1) to 0.81 (EX4).
101
Figure 13 Latent Variables Correlations Output of Employee Turnover CFA Model
From Figure 14, the loadings of JobSat, OrgComt, TurnInt, and EmoEx on Employee
Turnover were 0.80, 0.86, 0.71, and 0.68, respectively. These loadings were significant (р <
0.001) and considered to be very good to excellent. However, the initial Employee Turnover
CFA model did not fit well, with RMSEA = 0.094, CFI = 0.875, and TLI = 0.855. These fit
indices suggest that the model required some modifications.
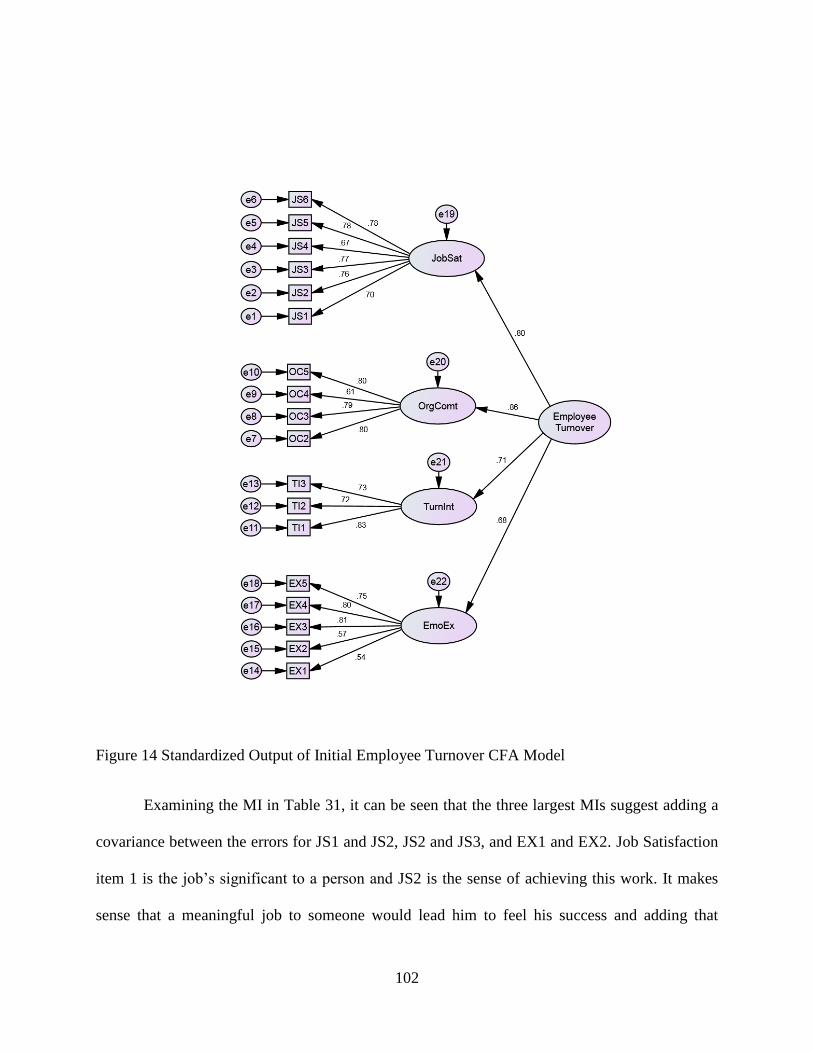
102
Figure 14 Standardized Output of Initial Employee Turnover CFA Model
Examining the MI in Table 31, it can be seen that the three largest MIs suggest adding a
covariance between the errors for JS1 and JS2, JS2 and JS3, and EX1 and EX2. Job Satisfaction
item 1 is the job’s significant to a person and JS2 is the sense of achieving this work. It makes
sense that a meaningful job to someone would lead him to feel his success and adding that

103
covariance would be reasonable. It was the same for JS2 and JS3 where are both considered to
have a sense of a job well done. Moreover, it was logically adding the last covariance where the
participants thought that both items 1 and 2 of Emotional Exhaustion are somewhat related in the
feeling of emotionally drained at work would affect the performance at the end of the day.
Another thing that needed to be looked on are several of MIs involve EX5 item. This
item seems to be related directly to the common factor (Employee Turnover) either by adding a
covariance or a path. MIs also suggest adding paths between TurnInt and OrgComt to EX5 (MI
of 12.603 and 17.035, respectively). Finally, MIs suggest adding covariances between the error
for EX5 and the errors of EmoEx, OrgComt, and OC5 and adding paths between EX5 and three
other variables (OC2, OC4, and OC5). EX5 is being frustrated at the workplace and it was
reasonable to be related with other latent variables and other items and thus, removing it from the
model.
After adding the recommended covariances above and removing EX5, the impact of the
new modification showed improvement in the model’s fit (RMSEA = 0.059, CFI = 0.954, and
TLI = 0.944). However, the model was still in need of some improvements according to the MIs
in Table 32. The largest MIs suggest adding a covariance between the errors for JS1 and JS3 (e1
and e3) in which it is reasonable when a job is important to someone, he/she would be most
likely to be proud of his/her well done tasks.

104
Table 31 Modification Indices Output for Employee Turnover CFA Model
Covariances: (Group number 1 - Default model)
M.I. Par Change e18 <--> Employee_Turnover 12.244 0.085 e18 <--> e22 12.232 -0.099 e18 <--> e20 12.407 0.132 e14 <--> e15 47.443 0.405 e10 <--> e18 12.719 0.143 e7 <--> e17 12.19 -0.123 e5 <--> e6 24.04 0.153 e4 <--> e5 14.221 0.137 e3 <--> e5 11.734 -0.081 e2 <--> e6 19.021 -0.101 e2 <--> e5 16.428 -0.099 e2 <--> e3 47.262 0.121 e1 <--> e5 11.11 -0.087 e1 <--> e2 49.707 0.137 Regression Weights: (Group number 1 - Default model)
M.I. Par Change EX5 <--- Employee_Turnover 12.244 0.489 EX5 <--- TurnInt 12.603 0.2 EX5 <--- OrgComt 17.035 0.261 EX5 <--- OC5 24.788 0.236 EX5 <--- OC4 22.582 0.226 EX5 <--- OC2 10.11 0.15 EX4 <--- OC2 10.637 -0.136 EX2 <--- EX1 32.035 0.294 EX2 <--- JS2 10.471 -0.243 EX1 <--- EX2 30.188 0.277 OC2 <--- EX4 10.583 -0.129 JS3 <--- JS2 17.674 0.17 JS2 <--- JS3 17.007 0.176 JS2 <--- JS1 23.088 0.202 JS1 <--- JS2 18.403 0.19
In addition, MIs suggest adding a covariance between the errors for OC2 and EX4 (MI =
10.965 with negative correlation). Logically, to relate these two errors, the Organizational

105
Commitment item 2 is speaking positively about the workplace and the Emotional Exhaustion
item 4 is being burnout. People with job burnout are more often to speak negatively to their
friends about workplace. Moreover, from SPSS results, CO2 and EX4 had a significant negative
correlation at (r = -0.220; p < 0.01).
Table 32 Modification Indices Output for Employee Turnover CFA Model: after modifications
Covariances: (Group number 1 - Default model)
M.I. Par Change e7 <--> e17 10.965 -0.121 e1 <--> e3 15.415 0.066
Regression Weights: (Group number 1 - Default model)
M.I. Par Change OC2 <--- EX4 10.33 -0.127 JS3 <--- JS1 11.912 0.134 JS1 <--- JS3 10.058 0.137
After adding the covariance from e1 to e3 and e7 to e17, the new model fit became better
than the earlier two models with RMSEA = 0.048, CFI = 0.970, and TLI = 0.963. However, after
examining the residual covariances, all came out within the required range except for that
between CO4 and EX2 with a value of -2.763 (> 2.58). Finally, it was determined that if CO4
was removed, CFI would become better with a value of 0.975 instead of 0.974 when removing
EX2. TLI and RMSEA had the same results for both cases. The final model is shown in Figure
15 and fit indices are shown in Table 33.

106
Table 33 Comparison among Fit Indices of Employee Turnover CFA Models
Model χ2 DF P χ2/DF CFI TLI RMSEA PCLOSE AIC ECVI
Initial 455.84 131 0.000 3.480 0.875 0.855 0.094 0.000 535.84 1.900 Modified1 222.09 112 0.000 1.983 0.954 0.944 0.059 0.094 304.09 1.078 Modified2 181.23 110 0.000 1.648 0.970 0.963 0.048 0.595 267.23 0.948
Final 151.91 95 0.000 1.599 0.975 0.968 0.046 0.670 233.91 0.829
Figure 15 Standardized Output of the Final Employee Turnover CFA Model

107
4.4.3 CFA of Safety Motivation
The standardized estimates output is shown in Figure 16. All factor loadings from
SafetyMotivation to observed variables were acceptable where the highest value was 0.89 (SM5)
and lowest one was 0.71 (SM1) and they were all significant at (р < 0.001). The initial model did
not fit well; with RMSEA = 0.230, CFI = 0.922, and TLI = 0.843. Therefore, the model required
to be modified using the MI suggestion in Table 34.
Table 34 Modification Indices Output for Safety Motivation CFA Model
Covariances: (Group number 1 - Default model)
M.I. Par Change e4 <--> e5 10.093 0.01 e3 <--> e5 13.383 -0.014 e2 <--> e4 30.574 -0.021 e1 <--> e2 24.215 0.029
Regression Weights: (Group number 1 - Default model)
M.I. Par Change SM5 <--- SM2 11.817 -0.11 SM2 <--- SM1 11.19 0.124
It can be seen from Table 34 that there were two largest MI, the first one was between e2
and e4 and the second one was between e1 and e2. However, adding a covariance between the
errors for SM2 and SM5 was not reasonable with estimated correlation of -1.121. These two
variables should have positive correlation since believing of the importance of safety at
workplace will help employee to encourage others to follow safety procedures. In addition,
AMOS provided a solution that was not admissible (Table 35). If the solution is inadmissible, it
indicates that some exogenous variables have an estimated covariance matrix that is not positive

108
definite due to either that the model is wrong or that the sample is too small (Arbuckle, 2011). As
result, a solution to admissible parameter values required to be made.
Table 35 AMOS Notes adding Covariance between SM1 and SM5
The following covariance matrix is not positive
definite (Group number 1 - Default model)
e4 e2 e4 0.019
e2 -0.034 0.049 Correlations: (Group number 1 - Default model)
Estimate e2 <--> e4 -1.121
Figure 16 Standardized Output of the Initial Safety Motivation CFA Model
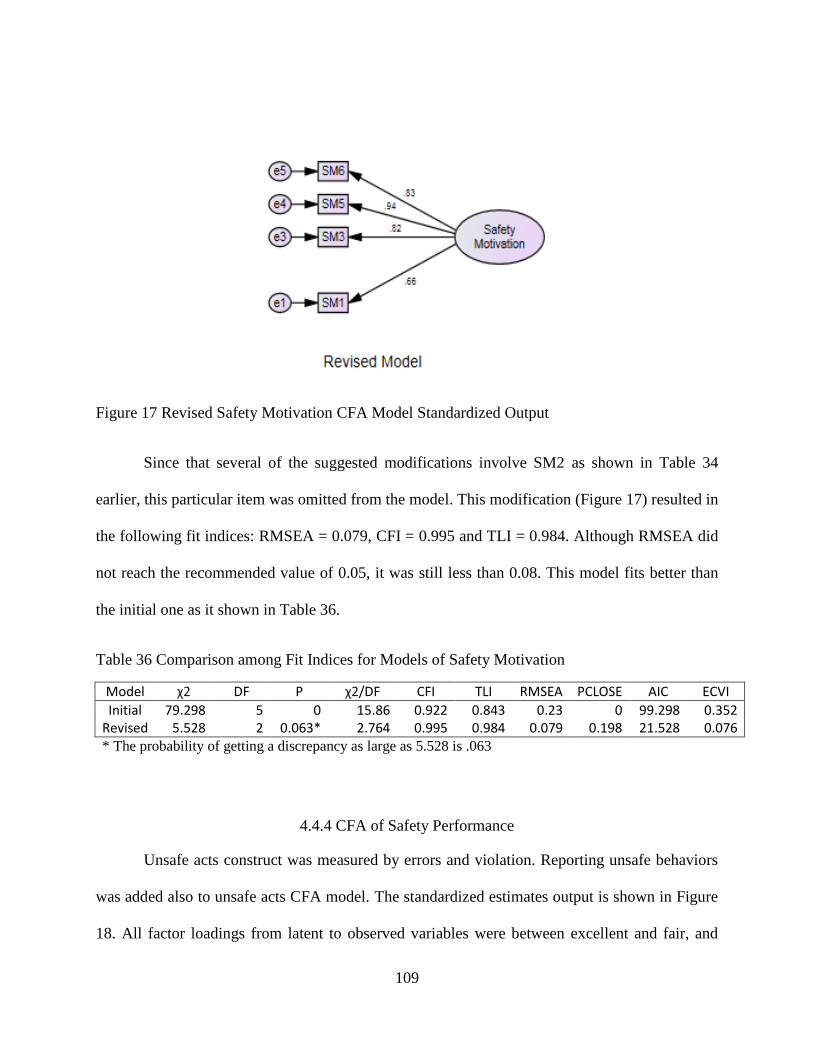
109
Figure 17 Revised Safety Motivation CFA Model Standardized Output
Since that several of the suggested modifications involve SM2 as shown in Table 34
earlier, this particular item was omitted from the model. This modification (Figure 17) resulted in
the following fit indices: RMSEA = 0.079, CFI = 0.995 and TLI = 0.984. Although RMSEA did
not reach the recommended value of 0.05, it was still less than 0.08. This model fits better than
the initial one as it shown in Table 36.
Table 36 Comparison among Fit Indices for Models of Safety Motivation
Model χ2 DF P χ2/DF CFI TLI RMSEA PCLOSE AIC ECVI Initial 79.298 5 0 15.86 0.922 0.843 0.23 0 99.298 0.352
Revised 5.528 2 0.063* 2.764 0.995 0.984 0.079 0.198 21.528 0.076 * The probability of getting a discrepancy as large as 5.528 is .063
4.4.4 CFA of Safety Performance
Unsafe acts construct was measured by errors and violation. Reporting unsafe behaviors
was added also to unsafe acts CFA model. The standardized estimates output is shown in Figure
18. All factor loadings from latent to observed variables were between excellent and fair, and
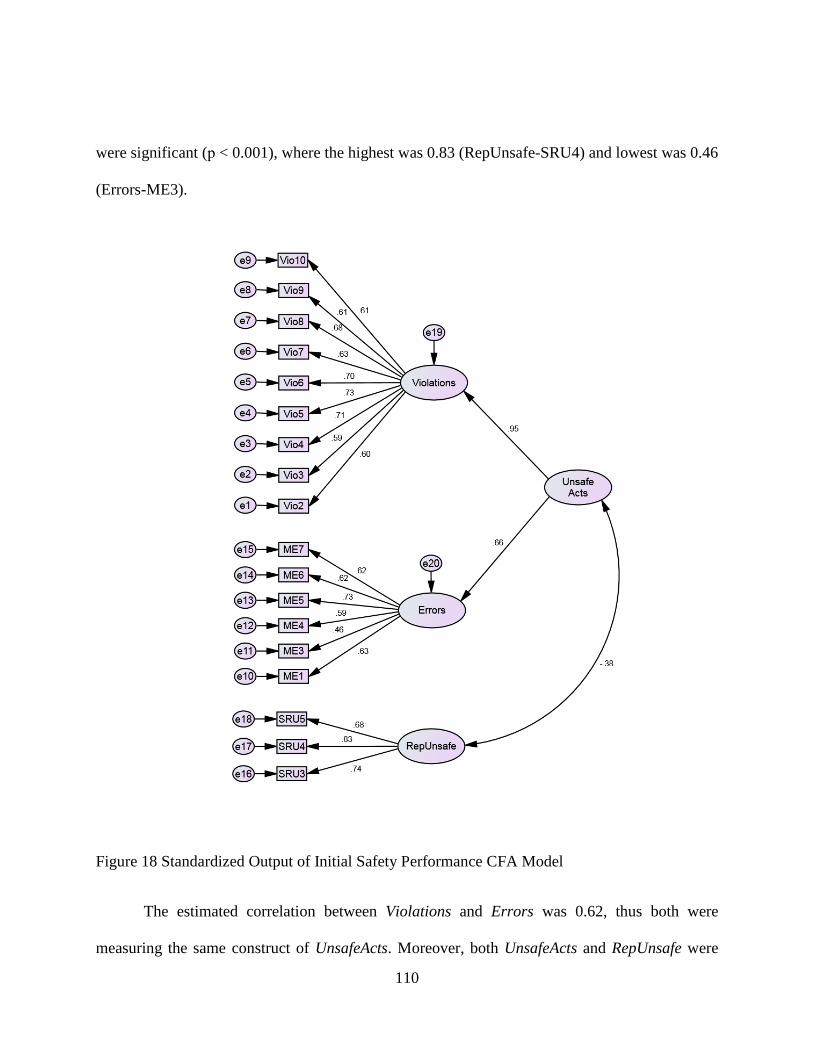
110
were significant (р < 0.001), where the highest was 0.83 (RepUnsafe-SRU4) and lowest was 0.46
(Errors-ME3).
Figure 18 Standardized Output of Initial Safety Performance CFA Model
The estimated correlation between Violations and Errors was 0.62, thus both were
measuring the same construct of UnsafeActs. Moreover, both UnsafeActs and RepUnsafe were

111
significantly correlated (-0.38). Table E3 in Appendix E shows the significant of all loadings and
correlations. The loadings of Violations and Errors on UnsafeActs were 0.95 and 0.66,
respectively. This model did not fit well; with RMSEA = 0.077, CFI = 0.878, and TLI = 0.859.
These fit indices suggest that the model was required some modifications according to Table 37.
Table 37 Modification Indices Output Safety Performance CFA Model
Covariances: (Group number 1 - Default model)
M.I. Par Change e14 <--> e15 13.847 0.036 e12 <--> e15 11.979 -0.057 e11 <--> e12 23.317 0.162 e7 <--> e11 11.13 0.1 e7 <--> e8 12.868 0.072 e6 <--> e12 11.635 -0.117 e6 <--> e7 11.956 0.106 e5 <--> e13 15.601 0.069 e1 <--> e2 16.908 0.197 Regression Weights: (Group number 1 - Default model)
M.I. Par Change ME4 <--- ME3 17.469 0.189 ME3 <--- ME4 13.668 0.223 ME1 <--- Vio7 11.258 0.16 ME1 <--- Vio3 12.082 0.154 Vio3 <--- Vio2 10.073 0.166 Vio2 <--- Vio3 10.412 0.151
Accordingly, the largest MIs suggest adding a covariance between the errors for ME3 and
ME4. In addition, paths between ME3 and ME4 (MI = 17.469) or between ME4 and ME3 (MI =
13.668) were suggested to be added. In addition, MIs suggest adding another covariance between
e1-e2 and between e5-e13 (MI of 16.908 and 15.601, respectively). It was reasonable to relate e1

112
and e2 since both items were about not following the correct procedures. On the other hand, it
was not reasonable to relate e5 and e13 because the first one is about forgetting to sign off a task
and the second is signing a task that was performed by other person. All other error covariances
in Table 37 were not added because there was no logic behind that. It was also apparent from the
MIs (threshold = 4) that Vio7 and Vio8 had relations with several items. Furthermore, MIs
suggest adding a path from Vio7 to ME1 (MI = 11.258). As a result, Vio7 had been omitted. By
doing so, this resulted in a better model with RMSEA = 0.064, CFI = 0.920, and TLI = 0.905;
however, the model was still in need of an improvement as it shown in Table 38.
Table 38 Modification Indices Output of the Safety Performance CFA Model: after
Modifications (Threshold = 8)

113
The largest Par Change (0.129) suggests adding error covariance between e2 and e10. It
was reasonable to do that since Vio3 is not following procedures in order to complete a task and
ME1 is missing out steps in performing the tasks. In addition, another new error covariance
between e1 and e10 was suggested to be added (Par Change = 0.131). It was also reasonable to
add this covariance. Finally, Vio10 was removed from the model because it was loading on
Errors which means it had a relationship with both Violations and Errors. The residual
covariances were checked and they were within the required range. This final model resulted in
the following fit indices: RMSEA = 0.058, CFI = 0.939, and TLI = 0.925 as they are shown in
Table 39. The standardized output for the final modified model is shown in Figure 19.
Table 39 Comparison among Fit Indices for Models of Unsafe Acts and Reporting Behavior
Model χ2 DF P χ2/DF CFI TLI RMSEA PCLOSE AIC ECVI
Initial 349.909 132 0.000 2.651 0.878 0.859 0.077 0.000 427.909 1.517
Modified1 244.048 114 0.000 2.141 0.920 0.905 0.064 0.022 322.048 1.142
Final 187.894 97 0.000 1.937 0.939 0.925 0.058 0.149 265.894 0.943

114
Figure 19 Standardized Output of the Final Safety Performance CFA Model
115
4.5 General Model Validation
All previous revised CFA models were brought together to form the general structural
equation model. These CFA models were reliable in which the measurements were regressed on
their latent variables (significant regression weights). Thus, these steps would reduce any
complication on the hypothesized structure model.
Therefore, two steps have been applied to the analysis of the model. First, analyzing the
model as CFA model and second analyzing the full structure model. In CFA, the significant of
hypothesized factor model is being statistically examined to determine whether the sample date
confirm that model (Schumacker & Lomax, 2010).
4.5.1 Hypothesized CFA Model
The hypothesized model included all variables in the study except for incidents and
injuries variables because they were observed variables (with rectangular shape) that measured
by a single item. However, they would be included in the final CFA model for testing its
validation.
A confirmatory factor analysis was conducted to validate the hypothesized research
model. The correlations among the latent variables are shown in Table 40. All correlations were
significant with critical ratios greater than 1.96 at p < 0.05, where the highest correlation was -
0.73 between SafetyClimate and EmployeeTurnover. The lowest one was between SafetyClimate
and SafetyMotivation with a value of 0.16 and this weak relationship suggests that safety
motivation is affected more by individual attitude rather than organizational factors especially in
a high risk industry like aviation.

116
Figure 20 Hypothesized CFA Model for the First Run (Standardized Estimates)

117
Table 40 Selected Standardized Output for Hypothesized CFA Model: Latent Variable
Correlations
It can be seen from Figure 20 that all factor loadings were significant at p < 0.001 where
the highest value was 0.96 between EmployeeTurnover and OrgComt and the lowest value was
0.40 between Errors to ME3. The fit indices for this initial model did not fit well; RMSEA =
0.048, CFI = 0.893, and TLI = 0.887.
The first modification for the hypothesized CFA model was removing ME3 because it
had a low factor loading with value of 0.40. Therefore, the new fit indices became better with
values of RMSEA = 0.047, CFI = 0.898, and TLI = 0.893. Then, a second modification was
performed to improve the model’s fit through examining MIs as shown in Table 41. For the
interest of space, the threshold for MIs was set at 15.
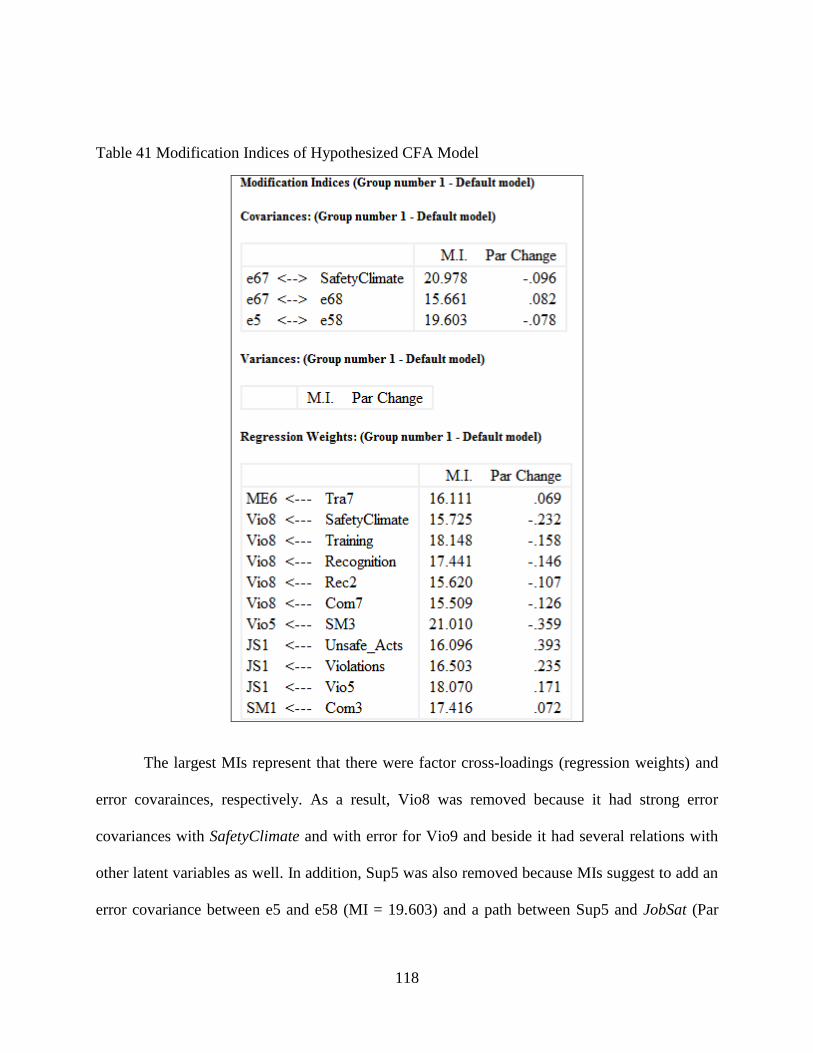
118
Table 41 Modification Indices of Hypothesized CFA Model
The largest MIs represent that there were factor cross-loadings (regression weights) and
error covarainces, respectively. As a result, Vio8 was removed because it had strong error
covariances with SafetyClimate and with error for Vio9 and beside it had several relations with
other latent variables as well. In addition, Sup5 was also removed because MIs suggest to add an
error covariance between e5 and e58 (MI = 19.603) and a path between Sup5 and JobSat (Par

119
Change = -0.280). The model fit of this second modification was better than those of previous
models; CFI=0.909, TLI=0.903, and RMSEA=0.045 (see Table 42).
The final modification of the hypothesized CFA model was investigating new MIs. After
setting the threshold for MIs at 10, new MIs (not shown in the interest of space) had been
utilized and this led to removing Com7. MIs suggest to add an error covariance between e9 and
e54 (MI = 14.283) and a path between OC5 and Com7 (MI = 14.867). Moreover, covariances
were added between error for ME1 and error for ME4 and between error for TurnInt and error
for EmoEx. As a result from Figure 21, the final model’s fit became much better with CFI =
0.912, TLI = 0.907, and RMSEA = 0.044. It is noteworthy to mention that JS1 involved with
other items and removing it did not change the model fit indices. Although, many new
suggestions would come up by lowering the threshold For MIs, there seems to be no reason to do
that which might eventually result in over-fitting model.
Table 42 shows the fit indices for the initial and final research measurement model. The
difference between χ2 was 466.88 which led to an improvement in the model fit. All other
indices were within the acceptable fit criteria.
Table 42 Comparison between Hypothesized CFA models
Model χ2 DF P χ2/DF CFI TLI RMSEA PCLOSE AIC ECVI
Initial 2482.34 1509 0.000 1.645 0.893 0.887 0.048 0.856 2770.34 9.82
Modified1 2364.39 1455 0.000 1.625 0.898 0.893 0.047 0.919 2646.39 9.38
Modified2 2120.00 1349 0.000 1.572 0.909 0.903 0.045 0.989 2392.00 8.48
Final 2015.46 1295 0.000 1.556 0.912 0.907 0.044 0.994 2287.46 8.12

120
Figure 21 Final Hypothesized CFA Model (Standardized Estimates)

121
4.5.2. Model Reliability and Validity
Incidents and injuries variables were added in the final CFA model for model reliability
and validity among all constructs. After adding these two variables, the model fit was still
acceptable with CFI = 0.908, TLI = 0.901, and RMSEA = 0.044, and there was no need for
further modification.
Table 43 Selected AMOS Output for Correlations among Final CFA Model’s Constructs
Where II1: Injuries and II2: Incidents
122
Table 43 shows that all constructs’ correlation were statistically significant at 0.05 level
except for those related with Incidents (II2) and correlation between Injuries (II1) and
SafetyMotivation (r = -0.090, p > 0.05). Descriptive statistics, Cronbach’s alpha and correlations
among the model’s constructs are also presented in Table 44. All significant correlations were
ranged between 0.157 and -0.729. All scales demonstrated good reliability through Cronbach’s
alpha values that were above the criterion value of 0.70 (Bagozzi & Yi, 2012). There were no
Cronbach’s alpha values for incidents and injuries because each was measured by one item only.
The probable cause for the incidents variable to not have any correlations with others is
due to the high percentage (95.4%) of respondents selected the Never point on the scale. The
reason would either be no reported damages to the aircrafts/equipment during the twelve months
period or they were afraid to report that they had a role in these actions (Weddle, 1996). As a
result, incidents variable was removed from the model due to non-relation and an extreme
kurtosis value of 32.05 would violate the assumption of normality when using the maximum
likelihood method (Kline, 1998).
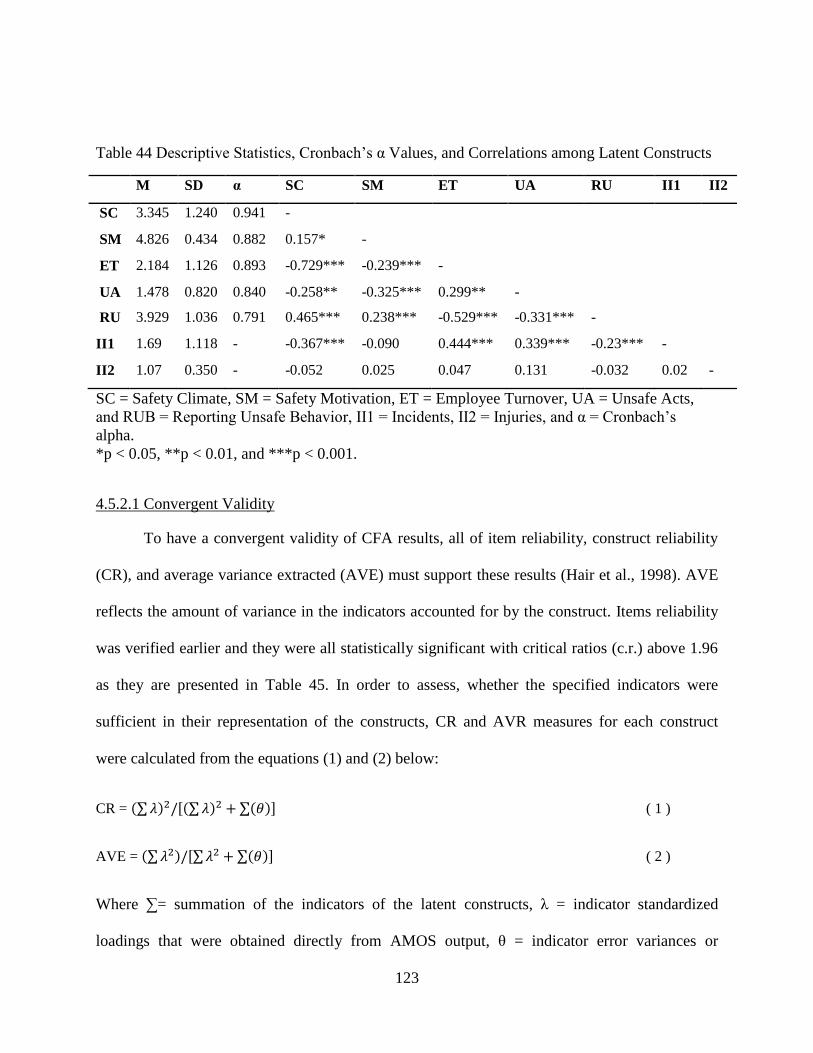
123
Table 44 Descriptive Statistics, Cronbach’s α Values, and Correlations among Latent Constructs
M SD α SC SM ET UA RU II1 II2
SC 3.345 1.240 0.941 -
SM 4.826 0.434 0.882 0.157* -
ET 2.184 1.126 0.893 -0.729*** -0.239*** -
UA 1.478 0.820 0.840 -0.258** -0.325*** 0.299** -
RU 3.929 1.036 0.791 0.465*** 0.238*** -0.529*** -0.331*** -
II1 1.69 1.118 - -0.367*** -0.090 0.444*** 0.339*** -0.23*** -
II2 1.07 0.350 - -0.052 0.025 0.047 0.131 -0.032 0.02 -
SC = Safety Climate, SM = Safety Motivation, ET = Employee Turnover, UA = Unsafe Acts,
and RUB = Reporting Unsafe Behavior, II1 = Incidents, II2 = Injuries, and α = Cronbach’s
alpha.
*p < 0.05, **p < 0.01, and ***p < 0.001.
4.5.2.1 Convergent Validity
To have a convergent validity of CFA results, all of item reliability, construct reliability
(CR), and average variance extracted (AVE) must support these results (Hair et al., 1998). AVE
reflects the amount of variance in the indicators accounted for by the construct. Items reliability
was verified earlier and they were all statistically significant with critical ratios (c.r.) above 1.96
as they are presented in Table 45. In order to assess, whether the specified indicators were
sufficient in their representation of the constructs, CR and AVR measures for each construct
were calculated from the equations (1) and (2) below:
CR = ( 1 )
AVE = ( 2 )
Where ∑= summation of the indicators of the latent constructs, λ = indicator standardized
loadings that were obtained directly from AMOS output, θ = indicator error variances or
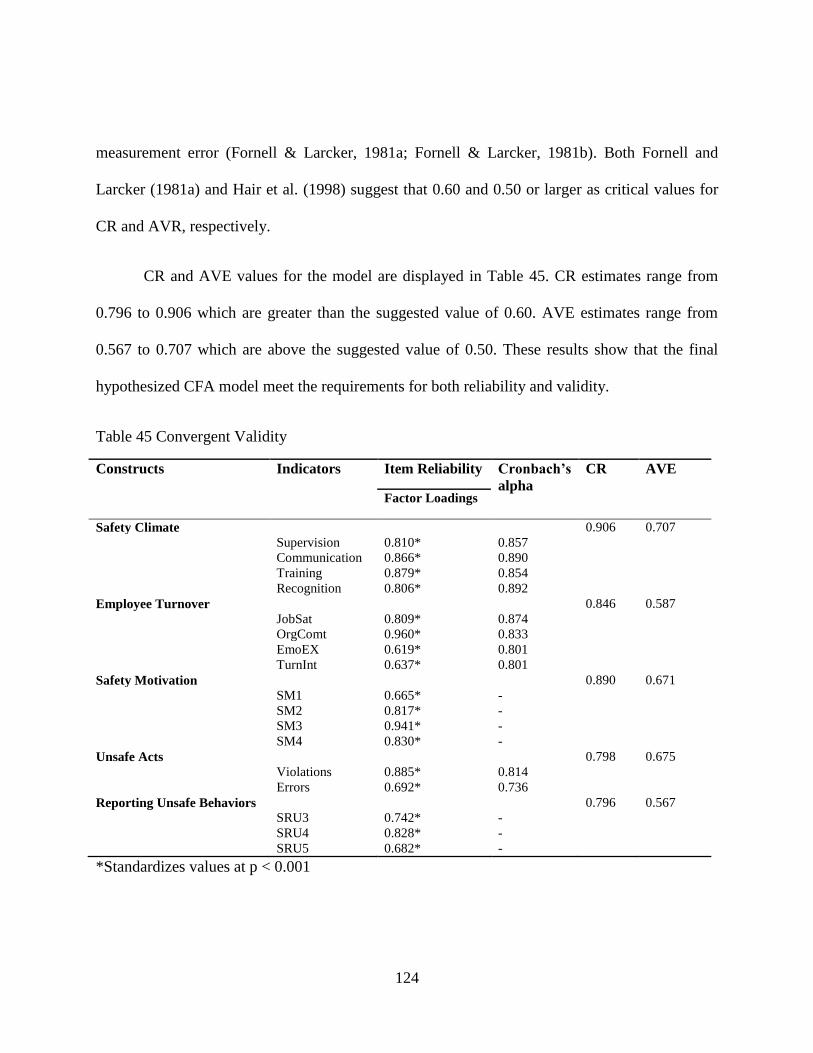
124
measurement error (Fornell & Larcker, 1981a; Fornell & Larcker, 1981b). Both Fornell and
Larcker (1981a) and Hair et al. (1998) suggest that 0.60 and 0.50 or larger as critical values for
CR and AVR, respectively.
CR and AVE values for the model are displayed in Table 45. CR estimates range from
0.796 to 0.906 which are greater than the suggested value of 0.60. AVE estimates range from
0.567 to 0.707 which are above the suggested value of 0.50. These results show that the final
hypothesized CFA model meet the requirements for both reliability and validity.
Table 45 Convergent Validity
Constructs Indicators Item Reliability Cronbach’s
alpha
CR AVE
Factor Loadings
Safety Climate 0.906 0.707
Supervision 0.810* 0.857
Communication 0.866* 0.890
Training 0.879* 0.854
Recognition 0.806* 0.892
Employee Turnover 0.846 0.587
JobSat 0.809* 0.874
OrgComt 0.960* 0.833
EmoEX 0.619* 0.801
TurnInt 0.637* 0.801
Safety Motivation 0.890 0.671
SM1 0.665* -
SM2 0.817* -
SM3 0.941* -
SM4 0.830* -
Unsafe Acts 0.798 0.675
Violations 0.885* 0.814
Errors 0.692* 0.736
Reporting Unsafe Behaviors 0.796 0.567
SRU3 0.742* -
SRU4 0.828* -
SRU5 0.682* -
*Standardizes values at p < 0.001

125
4.5.2.2 Discriminant Validity
Discriminant validity of the model was tested by comparing the construct correlations
with the square root of AVE. Discriminant validity was confirmed since the value of the square
root of AVE (Table 46) for each construct was larger than values of correlations involving the
construct).
Table 46 Discriminant Validity
Constructs 1 2 3 4 5
1.Safety Motivation 0.819
2.Safety Climate 0.156 0.841
3.Employee Turnover -0.237 -0.727 0.766
4.Reporting Unsafe Behaviors 0.238 0.465 -0.528 0.753
5.Unsfe Acts -0.304 -0.239 0.271 -0.335 0.821
Factor correlation matrix with square root of the AVE on the diagonal
4.6 Structural Equation Modeling
Structural Equation Modeling (SEM) was used to examine the structural model of the
relationships among latent variables. The generic structural model was built based on the
theoretical framework that was discussed earlier in Chapter Two. The research hypotheses were
tested by the SEM path analysis by using AMOS 22. Blunch (2013) argues that any
modifications to the new structural model should not significantly change the regression weights
from the previous measurement model (CFA model). The whole hypothesized structure model is
shown in Figure 22.
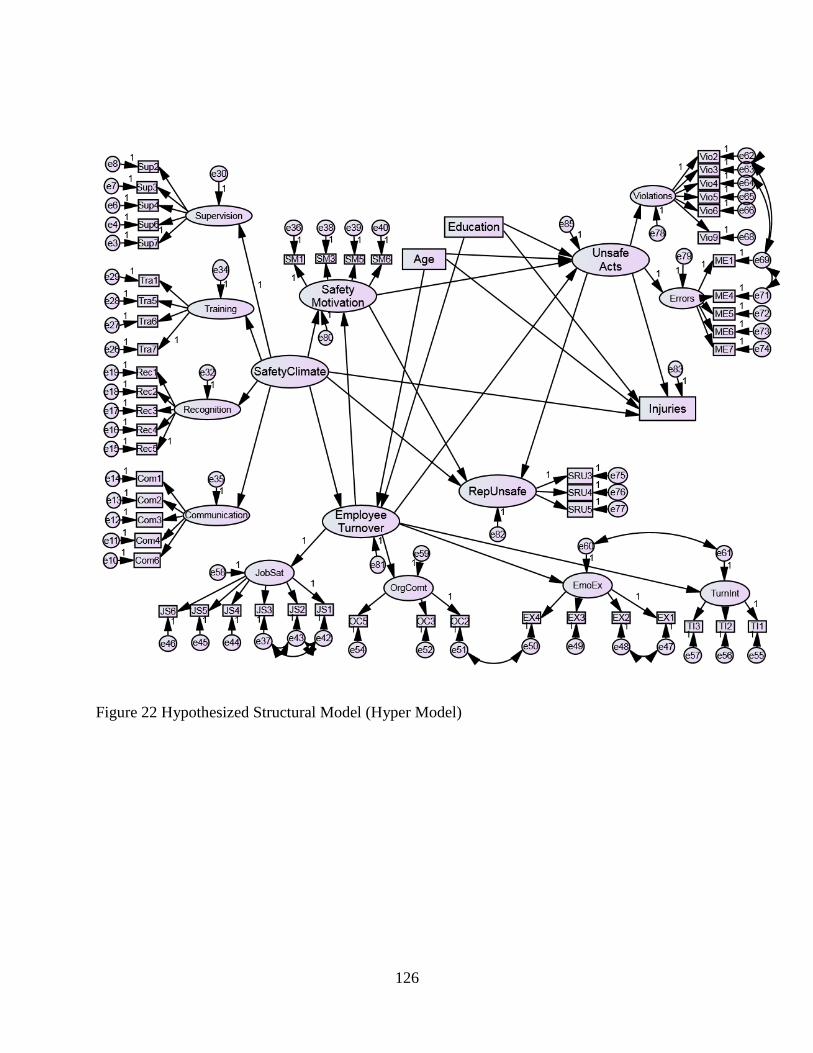
126
Figure 22 Hypothesized Structural Model (Hyper Model)
127
Table 47 Selected Output for Hypothesized Model: Variable Summary
Variable Summary
Observed, endogenous variables
Injuries
Incidents
Observed, exogenous variables
Age
Education
Unobserved, endogenous variables
Safety Motivation
Employee Turnover
Rep Unsafe
Unsafe Acts
Unobserved, exogenous variables
Safety Climate
4.6.1 Testing for the Validity of the Causal Structure
After validating the measurement model, the hypothesized research model was tested to
determine the validity of causal linkages among all constructs. Additionally, age and education
level were included in the hypothesized structural model to provide more insight to the study.
Using AMOS 22, a composite model was built by imputing all observed variables to develop a
scale score for each construct. Composite model in SEM is simpler to use than hyper model
(whole model) and provides better model fit (Landis, Beal, & Tesluk, 2000). This model
included all endogenous and exogenous variables as they are displayed in Table 47. The
standardized path coefficients for the generic structural model for the effect of safety climate on
safety outcomes are shown in Figure 23.

128
Figure 23 Generic Structural Model
4.6.1.1 Assessment of the Hypothesized SEM Model
After testing the generic structural model, the fit indices were summarized as follow: CFI
= 0.796, TLI = 0.523, RMSEA = 0.206. The model was not well fitting. Therefore, modification
indices (MIs) were reviewed and suggestion were made by adding covariances between Age and
Education (MI = 55.236), Age and SafetyClimate (MI = 47.514), and Education and
SafetyClimate (MI = 11.859). It is reasonable to relate them since previous study has found
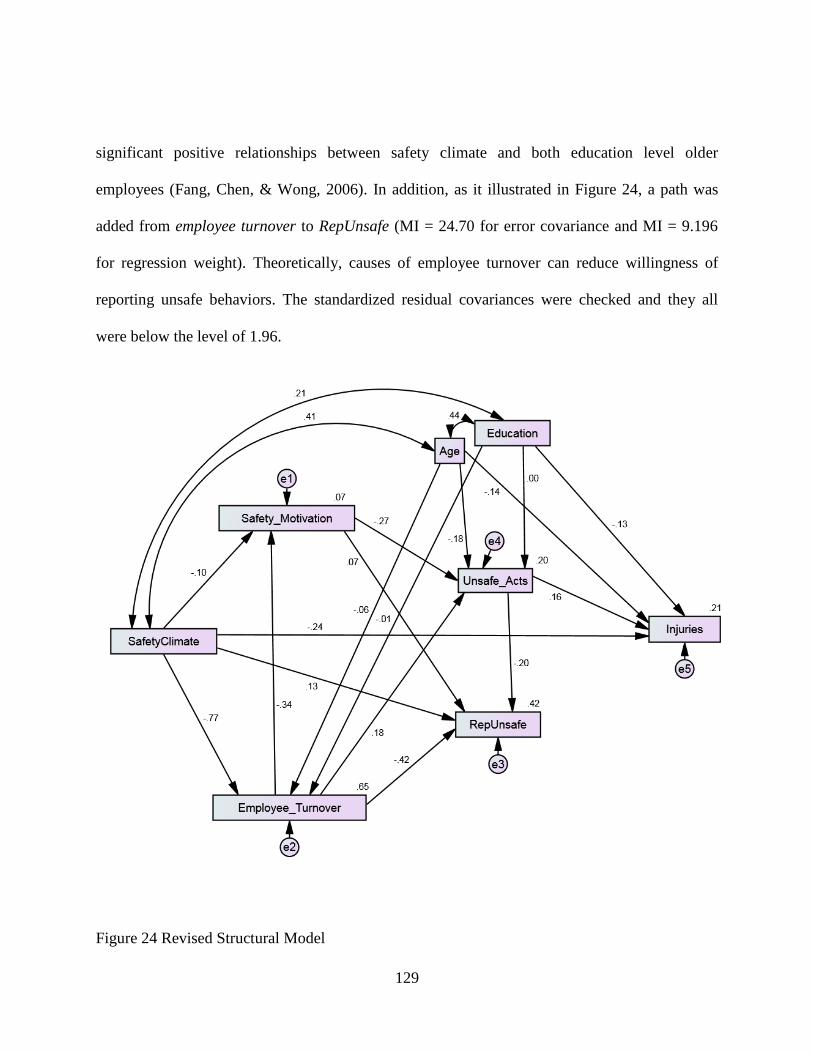
129
significant positive relationships between safety climate and both education level older
employees (Fang, Chen, & Wong, 2006). In addition, as it illustrated in Figure 24, a path was
added from employee turnover to RepUnsafe (MI = 24.70 for error covariance and MI = 9.196
for regression weight). Theoretically, causes of employee turnover can reduce willingness of
reporting unsafe behaviors. The standardized residual covariances were checked and they all
were below the level of 1.96.
Figure 24 Revised Structural Model
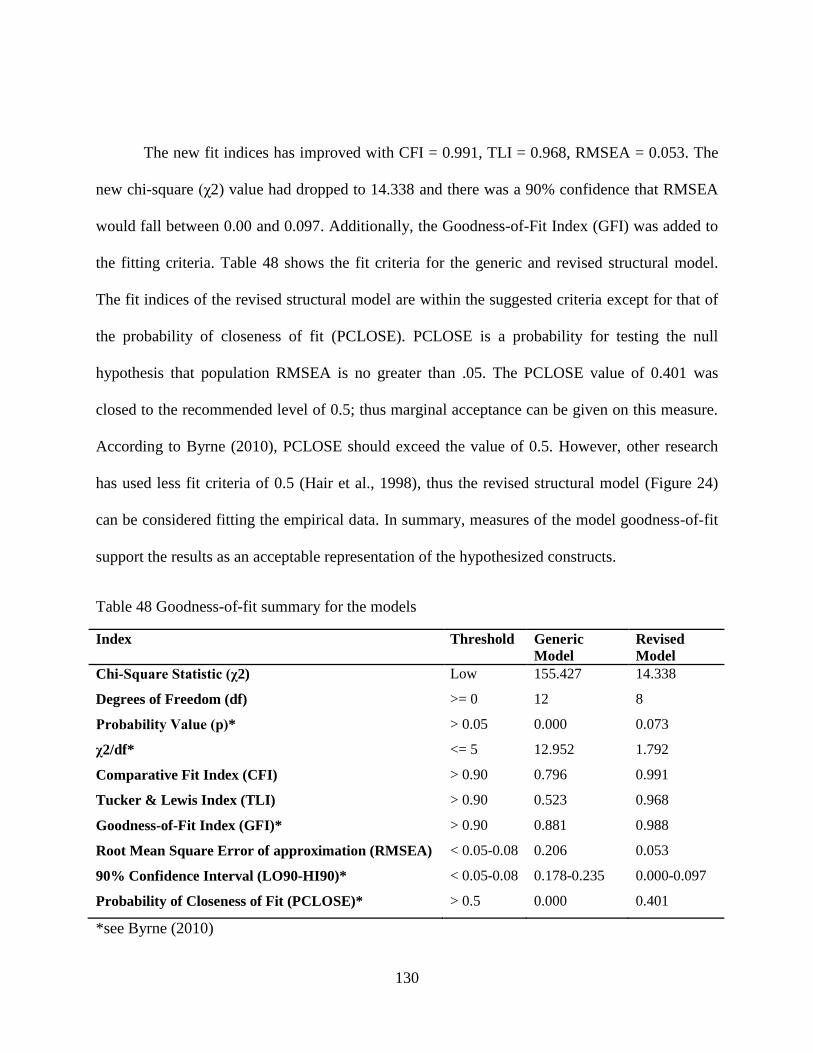
130
The new fit indices has improved with CFI = 0.991, TLI = 0.968, RMSEA = 0.053. The
new chi-square (χ2) value had dropped to 14.338 and there was a 90% confidence that RMSEA
would fall between 0.00 and 0.097. Additionally, the Goodness-of-Fit Index (GFI) was added to
the fitting criteria. Table 48 shows the fit criteria for the generic and revised structural model.
The fit indices of the revised structural model are within the suggested criteria except for that of
the probability of closeness of fit (PCLOSE). PCLOSE is a probability for testing the null
hypothesis that population RMSEA is no greater than .05. The PCLOSE value of 0.401 was
closed to the recommended level of 0.5; thus marginal acceptance can be given on this measure.
According to Byrne (2010), PCLOSE should exceed the value of 0.5. However, other research
has used less fit criteria of 0.5 (Hair et al., 1998), thus the revised structural model (Figure 24)
can be considered fitting the empirical data. In summary, measures of the model goodness-of-fit
support the results as an acceptable representation of the hypothesized constructs.
Table 48 Goodness-of-fit summary for the models
Index Threshold Generic
Model
Revised
Model
Chi-Square Statistic (χ2) Low 155.427 14.338
Degrees of Freedom (df) >= 0 12 8
Probability Value (р)* > 0.05 0.000 0.073
χ2/df* <= 5 12.952 1.792
Comparative Fit Index (CFI) > 0.90 0.796 0.991
Tucker & Lewis Index (TLI) > 0.90 0.523 0.968
Goodness-of-Fit Index (GFI)* > 0.90 0.881 0.988
Root Mean Square Error of approximation (RMSEA) < 0.05-0.08 0.206 0.053
90% Confidence Interval (LO90-HI90)* < 0.05-0.08 0.178-0.235 0.000-0.097
Probability of Closeness of Fit (PCLOSE)* > 0.5 0.000 0.401
*see Byrne (2010)

131
The modified model regression weights are presented in Table 49. The significance (p >
0.05) of standardized path coefficients (β) in the revised structural model was used to test the
research hypotheses.
Table 49 Unstandardized Estimates Regression Weights for Modified Model: Structural Path
Estimate S.E. C.R. P Label
Employee_Turnover <--- SafetyClimate -.418 .021 -19.945 ***
Employee_Turnover <--- Age -.002 .001 -1.459 .145
Employee_Turnover <--- Education -.003 .016 -.163 .871
Safety_Motivation <--- SafetyClimate -.047 .045 -1.051 .293
Safety_Motivation <--- Employee_Turnover -.294 .083 -3.553 ***
Unsafe_Acts <--- Safety_Motivation -.284 .057 -4.956 ***
Unsafe_Acts <--- Employee_Turnover .160 .053 2.996 .003
Unsafe_Acts <--- Education -.001 .022 -.068 .946
Unsafe_Acts <--- Age -.005 .002 -2.830 .005
II1* <--- Unsafe_Acts .570 .201 2.837 .005
RepUnsafe <--- Unsafe_Acts -.494 .121 -4.098 ***
RepUnsafe <--- SafetyClimate .157 .089 1.767 .077
II1 <--- SafetyClimate -.423 .102 -4.140 ***
II1 <--- Education -.166 .078 -2.137 .033
II1 <--- Age -.015 .007 -2.167 .030
RepUnsafe <--- Safety_Motivation .171 .123 1.387 .165
RepUnsafe <--- Employee_Turnover -.904 .169 -5.343 ***
*II1: Injuries
4.7 Hypotheses Testing
The revised structural model in Figure 24 shows that the effect of unsafe acts on
workplace injuries is significantly positive (β = 0.16, р < 0.01), indicating that the less
employees’ unsafe acts are, the less likely they will injured themselves. H1 is thus confirmed. In
addition, safety climate has a significant negative effect on workplace injuries (β = -0.24, р <
0.001), indicating that the more positive perceived safety climate is, the less workplace injuries

132
among the employees. Therefore, H2 is confirmed. H3 is also supported since the effect of
unsafe acts on reporting unsafe behaviors is significantly negative (β = -0.20, р < 0.001),
indicating that the more employees’ unsafe acts are, the poorer they are of reporting these acts.
However, the direct effect of safety climate on reporting unsafe behaviors (β = 0.13) is
not significant (p = 0.077) which is just slightly above the recommended level; thus H4 is not
confirmed. This means that safety climate has a significant indirect effect on reporting unsafe
behaviors through employee turnover (β = 0.36, р < 0.001; see Table 51). In addition, the total
effect of safety climate on reporting unsafe behaviors is 0.505 which includes the direct effect of
safety climate and indirect effects of employee turnover, safety motivation, and unsafe acts
(Table 50). Moreover, safety climate has a significant negative effect on employee turnover (β =
-0.77, р < 0.001), indicating that the more positive perceived safety climate is, the less likely that
employee will leave the organization. Therefore, H5 is supported.
The effect of the structural path which was added from employee turnover to reporting
unsafe behavior in the revised structural model is significantly negative (β = -0.42, р < 0.001).
This finding implies that the more high perception of employee turnover, the less willingness to
report any safety concerns. Regarding the direct effects of perception of employee turnover on
safety motivation and on unsafe acts, all paths show a significant direct influence (e.g., β = -0.34,
р < 0.001 and β = 0.18, р < 0.01, respectively), thus indicating H5 and H6 are supported. These
findings imply that the higher the perception of employee turnover, the decreased safety
motivation and the increased unsafe acts. In addition, the statistical data reveals that the
relationship between safety climate and unsafe acts is fully mediated by employee turnover.

133
According to Table 51, this indirect effect is significant (β = -0.14, р < 0.05) and thus H8 is
confirmed. Safety climate has also an indirect effect (β = -0.183) on unsafe acts through
combination of employee turnover and safety motivation as it shown in Table 50.
Table 50 Standardized Direct, Indirect, and Total Effects
Model Direct Effect Indirect Effect Total Effect
Unsafe Acts
Safety Climate - -0.183 -0.183
Employee Turnover 0.178 0.093 0.272
Safety Motivation -0.274 - -0.274
Age -0.179 -0.017 -0.196
Education -0.004 -0.002 -0.006
Reporting Unsafe Behaviors
Safety Climate 0.134 0.371 0.505
Employee Turnover -0.417 -0.078 -0.495
Safety Motivation 0.068 0.056 0.124
Unsafe Acts -0.204 - -0.204
Age - 0.067 0.067
Education - 0.004 0.004
Injuries
Safety Climate -0.244 -0.029 -0.273
Employee Turnover - 0.043 0.043
Safety Motivation - -0.043 -0.043
Unsafe Acts 0.158 - 0.158
Age -0.139 -0.031 -0.170
Education -0.126 -0.001 -0.127
Safety Motivation
Safety Climate -0.101 0.264 0.163
Employee Turnover -0.341 - -0.0341
Age - 0.021 0.021
Education - 0.002 0.002
Employee Turnover
Safety Climate -0.775 - -0.775
Age 0.062 - -0.062
Education -0.006 - -0.006
The effect of safety climate on safety motivation is not significant (β = -0.10, р > 0.05).
Therefore, there is no direct effect and thus, H9 is not supported.

134
Even though it is insignificant, the negative coefficient (-0.10) does not make sense which
indicates as climate improves, motivation decreases. However, the correlation between safety
climate and safety motivation is positive (r = 0.16, see Table 46). According to Fogarty (2004),
“reversals of sign in path coefficients can occur when predictors of a dependent variable are
themselves correlated”. In the current case, both employee turnover and safety climate are used
to predict safety motivation and they are highly correlated. Accordingly, H12 is rejected because
there is no mediating effect of safety motivation on the relationship between safety climate and
unsafe acts. As result, it can be concluded that the relationship between safety climate and safety
motivation is fully mediated by employee turnover and this indirect effect is significant (β =
0.26, р < 0.00; see Table 51).
Table 51 Mediated Effect: Standardized Path Coefficients (β) using AMOS Bootstrapping
Path Direct without Mediator Direct with Mediator Indirect (Mediated)
SC ET RUB 0.46 (p < 0.001) 0.14 (p > 0.05) 0.36 (p < 0.001)
SC ET UA -0.19 (p < 0.01) -0.05 (p > 0.05) -0.14 (p < 0.05)
SC ET SM 0.17 (p < 0.01) -0.10 (p > 0.05) 0.26 (p < 0.001)
SC: Safety Climate, ET: Employee Turnover, RUB: Reporting Unsafe Behaviors, UA: Unsafe
Acts, & SM: Safety Motivation
The result also reveals a significant direct effect of safety motivation on unsafe acts (β = -
0.27, р < 0.001), which supports H10. In addition, safety motivation does not have direct effect
on reporting unsafe behaviors (β = 0.07, р > 0.05). Therefore, H11 is rejected. Furthermore, the
estimated results of all the hypothesized paths are summarized in Table 52.

135
Table 52 Tests of Hypotheses
Hypothesis β t Supported?
H1: Unsafe Acts Injuries 0.16 2.827** Yes
H2: Safety Climate Injuries -0.24 -4.140* Yes
H3: Unsafe Acts Reporting Unsafe Behaviors -0.20 -4.098** Yes
H4: Safety Climate Reporting Unsafe Behaviors 0.13 1.767 No
H5: Safety Climate Employee Turnover -0.77 -19.945** Yes
H6: Employee Turnover Safety Motivation -0.34 -3.553** Yes
H7: Employee Turnover Unsafe Acts 0.18 2.996* Yes
H8: Safety Climate Employee Turnover Unsafe Acts Partially Mediated
H9: Safety Climate Safety Motivation -0.10 -1.051 No
H10: Safety Motivation Unsafe Acts -0.27 -4.956** Yes
H11: Safety Motivation Reporting Unsafe Behaviors 0.07 1.387 No
H12: Safety Climate Safety Motivation Unsafe Acts No Mediation
New line: Employee Turnover Reporting Unsafe Behaviors -0.42 -5.343** Yes
β = standardized path coefficient, t = critical ratio, *p < 0.001, **p < 0.01
Turning to the control variables effects, the insignificant coefficients found between age
and employee turnover (β = -0.06, p > 0.05), and between education and employee turnover (β =
-0.01, p > 0.05) identified that both have no effects on employee turnover. In addition, only age
has a significant effect on unsafe acts (β = -0.18, p < 0.01), indicating that younger maintenance
technicians are more like to commit these unsafe acts. Both of age and education have a
significant effect on workplace injuries (e.g., β = -0.14 & β = -0.13, p < 0.05). These statistical
data reveal that younger technicians are more likely to injured themselves as well as technicians
with a low level of education. A summary of the estimated results of the control variables paths
in the revised model is also presented in Table 53.
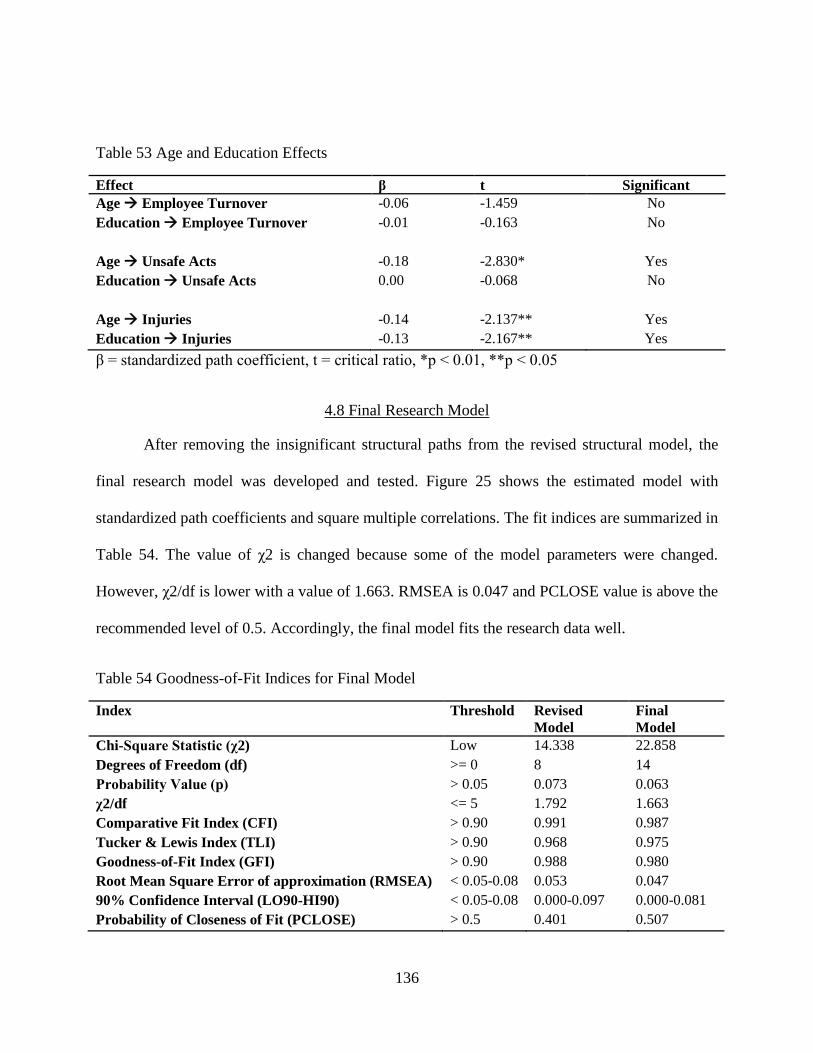
136
Table 53 Age and Education Effects
Effect β t Significant
Age Employee Turnover -0.06 -1.459 No
Education Employee Turnover -0.01 -0.163 No
Age Unsafe Acts -0.18 -2.830* Yes
Education Unsafe Acts 0.00 -0.068 No
Age Injuries -0.14 -2.137** Yes
Education Injuries -0.13 -2.167** Yes
β = standardized path coefficient, t = critical ratio, *p < 0.01, **p < 0.05
4.8 Final Research Model
After removing the insignificant structural paths from the revised structural model, the
final research model was developed and tested. Figure 25 shows the estimated model with
standardized path coefficients and square multiple correlations. The fit indices are summarized in
Table 54. The value of χ2 is changed because some of the model parameters were changed.
However, χ2/df is lower with a value of 1.663. RMSEA is 0.047 and PCLOSE value is above the
recommended level of 0.5. Accordingly, the final model fits the research data well.
Table 54 Goodness-of-Fit Indices for Final Model
Index Threshold Revised
Model
Final
Model
Chi-Square Statistic (χ2) Low 14.338 22.858
Degrees of Freedom (df) >= 0 8 14
Probability Value (р) > 0.05 0.073 0.063
χ2/df <= 5 1.792 1.663
Comparative Fit Index (CFI) > 0.90 0.991 0.987
Tucker & Lewis Index (TLI) > 0.90 0.968 0.975
Goodness-of-Fit Index (GFI) > 0.90 0.988 0.980
Root Mean Square Error of approximation (RMSEA) < 0.05-0.08 0.053 0.047
90% Confidence Interval (LO90-HI90) < 0.05-0.08 0.000-0.097 0.000-0.081
Probability of Closeness of Fit (PCLOSE) > 0.5 0.401 0.507
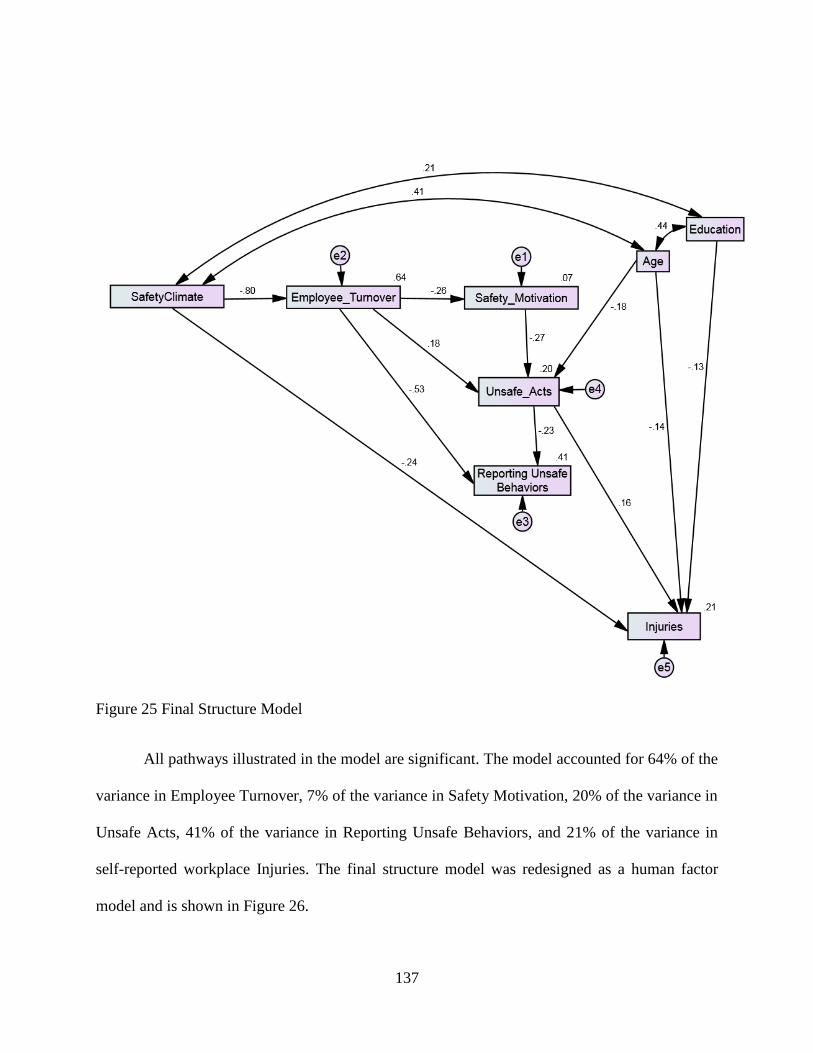
137
Figure 25 Final Structure Model
All pathways illustrated in the model are significant. The model accounted for 64% of the
variance in Employee Turnover, 7% of the variance in Safety Motivation, 20% of the variance in
Unsafe Acts, 41% of the variance in Reporting Unsafe Behaviors, and 21% of the variance in
self-reported workplace Injuries. The final structure model was redesigned as a human factor
model and is shown in Figure 26.
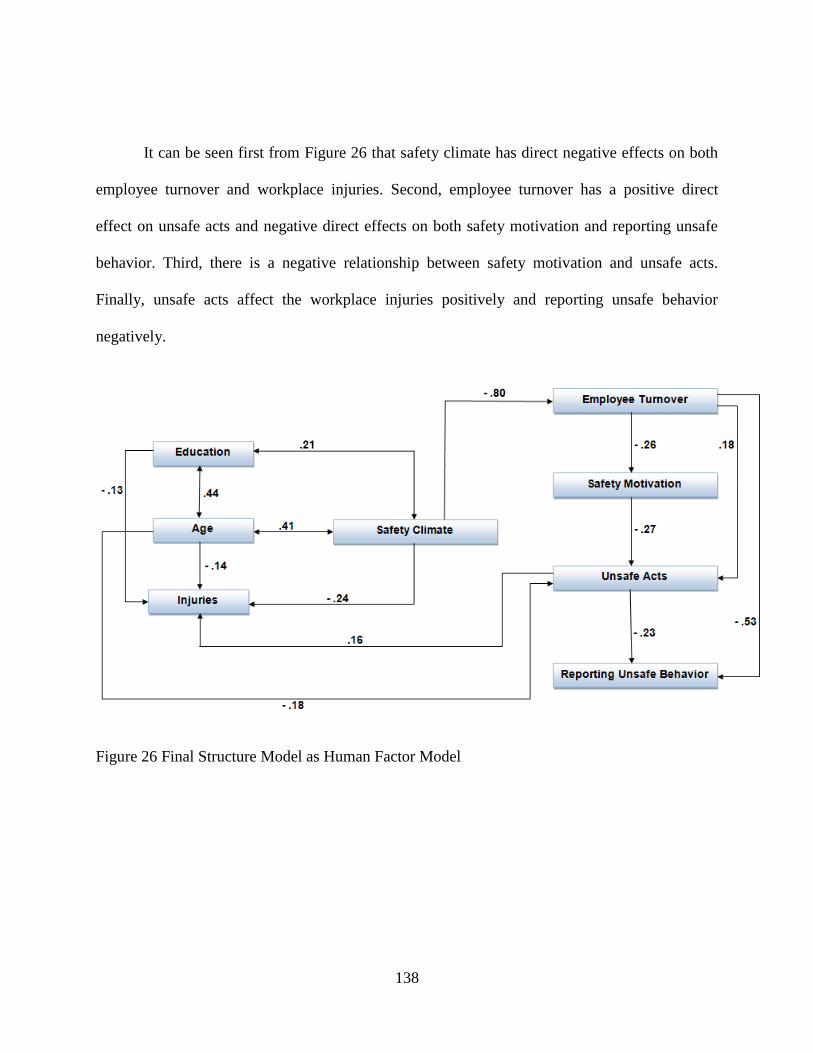
138
It can be seen first from Figure 26 that safety climate has direct negative effects on both
employee turnover and workplace injuries. Second, employee turnover has a positive direct
effect on unsafe acts and negative direct effects on both safety motivation and reporting unsafe
behavior. Third, there is a negative relationship between safety motivation and unsafe acts.
Finally, unsafe acts affect the workplace injuries positively and reporting unsafe behavior
negatively.
Figure 26 Final Structure Model as Human Factor Model
139
CHAPTER FIVE: DISCUSSION, CONCLUSION, STUDY SIGNIFICANCE,
IMPLICATIONS, LIMITATIONS, AND SUGGESTIONS FOR FUTURE
RESEARCH
The main purpose of this study is to develop a model that explains the relationships
between safety climate, employee turnover, safety motivation, self-reported unsafe acts,
reporting unsafe behavior, incidents, and injuries in the aviation maintenance environment.
Another aim is to investigate the mediating effects, if any, of employee turnover and safety
motivation on the relationship between safety climate and safety outcomes. This chapter
discusses the research results, followed by conclusion, study significance, implications,
limitations, and suggestions for future research.
5.1 Discussion
The study survey provided descriptive data and data relevant to relations among variables
that important to aircraft maintenance. The study considered six factors (i.e., supervision, safety
focus, safety communication and feedback, recognition, coworker support for safety, and
training) to measure safety climate. The results demonstrated that safety climate had poor factor
loadings on safety focus and coworker support for safety. This could be due to the questions that
were used to measure each factor. Most probably, the three questions of safety focus were related
to individual safety attitudes, while the other three questions of the factor of coworker support
for safety were related to group safety attitudes.
The influence of aircraft maintenance technicians’ unsafe acts on workplace injuries was
analyzed in the first hypothesis. The results showed that the unsafe acts had a significant effect
140
on injuries indicating that the more deviation from following safety rules, the more likely a
technician will get injured. This result is consistent with Probst and Brubaker (2001) who found
that safety compliance is negatively related to workplace injuries. The second hypothesis links
safety climate to workplace injuries. Perceived safety climate has a significant direct effect on
injuries, indicating that the stronger climate is, the fewer workplace injuries. The study of Clarke
(2010) supports this result. The effect of unsafe acts on reporting unsafe behaviors (hypothesis 3)
is significant and consistent with the result of Fogarty (2003). In the fourth hypothesis, the p-
value of the path coefficient (0.077) from safety climate to reporting unsafe behaviors is just
slightly above the 0.05 significant level. It was expected that safety climate (e.g., reporting
channels and opened communication) will help maintenance technicians to report their safety
concerns better according to Fogarty (2003). Research also revealed that safety climate and
safety performance are positively related to one another (Wallace & Chen, 2006). However, a
significant indirect effect of safety climate on reporting behaviors exists through the mediating
effect of employee turnover since safety climate has a significant effect on employee turnover
(hypothesis 5) and employee turnover has a significant effect on reporting behaviors.
Fogarty (2004) has found that the role of turnover intention has a positive relationship
with safety climate which does not make sense from theoretical viewpoint. However, in his
study, the correlations between the individual climate measures and turnover were negative
which indicate higher job turnover when the climate is poor. It is noteworthy to mention, that
Fogarty used only one question to measure turnover intention scale in his model. Research
suggests that the effects of safety climate on individual safety behaviors are mediated by job
attitudes. For example, Clarke (2010) has found that work-related attitudes such as job

141
satisfaction and organizational commitment is partially mediated the relationship between safety
climate and safety behaviors. Additionally, Park et al., (2012) argued that individual emotional
response to one’s job and organization mediates the relationship between safety climate and
organization performance level and not with individual level such as errors. However, the
finding from the seventh hypothesis shows that there is a direct significant effect of perceived
individual turnover on unsafe acts such as violations and errors. This finding does not support the
result of Fogarty (2004) since he argued that turnover intention has no influence on maintenance
errors.
The sixth hypothesis of the research examined the effect of perceived employee turnover
on safety motivation. Findings show that perceived turnover has a significant direct effect on
safety motivation, indicating as maintenance technicians have high perception of turnover, their
motivation toward safety decreases. Because employee turnover affects safety motivation,
variables such jobs satisfaction, organizational commitment, or burnout are more distally related
to safety motivation (Zohar et al., 2015). The ninth and tenth hypotheses examined the effect of
safety climate on unsafe acts through safety motivation. Findings show that safety climate has
insignificant effect on safety motivation and this motivation has significant influence on unsafe
acts. Accordingly, these results do not support (hypothesis 12), indicating that safety motivation
does not mediate the relationship between safety climate and unsafe acts. These results do not
support other results in which safety motivation was found to be positively related to safety
climate (Griffin & Neal, 2000; Neal et al., 2000; Neal & Griffin, 2006). This is, as mentioned
earlier, due to the existence of employee turnover influence on the relationship between safety
climate and safety motivation. In addition, this influence mediates the relationship between
142
safety climate and unsafe acts (Hypothesis 8). It is also concluded from Figure 25 that the
relationship between perceived individual turnover and unsafe acts is partially mediated by
safety motivation. Finally, the eleventh hypothesis which examined the direct effect of safety
motivation on reporting behaviors was not confirmed because there was only a significant
indirect effect through unsafe acts.
The statistical data from the control variables reveals that both age and education have
insignificant effect on the perceived individual turnover. The path coefficient from age to
employee turnover is negative with a p-value of 0.145 which is above the 0.05 significant level,
while the effect of education on employee turnover has a p-value of 0.871. However, when all
insignificant paths were removed one at a time in Figure 25, the p-value of the path coefficient of
age dropped from 0.145 to 0.07 which is just above 0.05. AMOS output from Figure 22 showed
that age has a high negative direct effect on emotional exhaustion factor only and this might
cause the affect of age on employee turnover to be less significant. Research has shown that age
is negatively related to turnover such as younger employees are the most likely to quit (Cotton &
Tuttle, 1986). In addition, age as being young is statistically significant predictor for turnover
(Mor Barak et al., 2001). This might relate to the notion that younger employees have more job
opportunities and older employees are less attractive to new jobs (Mor Barak et al., 2001).
Cotton and Tuttle (1986) also found that education has a positive correlation with turnover.
However, one study has found that education is relatively a weak predictor of turnover (Allen et
al., 2010).

143
Turning to the effect of control variables on unsafe acts, the significant coefficient was
found only between age and unsafe acts, but not between education and unsafe acts. The finding
of the effect of age is consistent with result of the study of Hobbs and Williamson (2002).
According to Hobbs and Williamson (2002), unsafe behaviors are related significantly with age
such as younger employees report a higher level of aircraft maintenance violations. However, the
insignificant effect of education on unsafe acts was not expected. Education can enhance
employee knowledge and can help in reducing violations and errors at workplace. This
insignificant relationship could be due to the on-job-training works in reducing the unsafe
behaviors regardless of the employee educational level.
Finally, the results indicate that the effects of both age and education on workplace
injuries are negatively significant where around 34.3% of respondents reported that they had
been injured at work during the previous 12 months. As a whole, these findings are consistent
with previous studies that have found that age-related injury ratios were lower for older workers
than those for younger workers (Breslin & Smith, 2005; Knapik, Ang, Reynolds, & Jones, 1993;
Laflamme, 1997). The reason behind that could be from that older employees work as
supervisors and have less level of physical activities that required in the job. It could also be
from the lack of relevant experience of younger employees since it plays an important role in
raising the risk of injuries. In addition, Siu, Phillips, and Leung (2003) have found that positive
attitudes toward safety were correlated with older workers and they have argued that older
workers are more experienced and therefore, they have decreased the injury risk at work.
Moreover, Weddle (1996) has found that older workers with an average age of 41 years did not
report injuries compare to those that were younger.

144
These findings are also supportive of earlier studies that shown higher-educated workers
(e.g., university degrees) have lowest accident involvement rate or risk exposure (e.g., less
injuries) than those having a basic education (Gyekye & Salminen, 2009). Education level can
enhance the workers’ cognitive abilities which lead them to perform their job in a right way and
to have also an accurate work hazard perception. Generally, these cognitive abilities can affect
employees’ knowledge, strategies, and decisions making when performing certain tasks (Hunter,
1986; Layer, Karwowski, & Furr, 2009).
5.2 Conclusion
Aircraft maintenance is a complex organization in which individuals perform varied tasks
in an environment with time pressures, minimal feedback, and sometimes difficult ambient
conditions. Organizational factors have been identified as contributor factors that lead to unsafe
acts like maintenance errors. Safety climate can reflect the correctness of safety-related
behaviors as it is considered a predictor of unsafe work behavior. Safety climate also provides a
framework for the analysis of organizational events. Therefore, it is crucial to identify the factors
that may enhance the safety performance of aircraft maintenance technicians.
This study utilized the safety climate approach to develop a model that examines the
relationships between perceived individual turnover, safety motivation, self-reported unsafe acts,
reporting unsafe behaviors, and self-reported workplace injuries. The two measures of unsafe
acts were violations and maintenance errors. The results show that perceptions of organizational
safety climate play an essential role in enhancing the causes of employee turnover which in turn
increase the safety motivation and decrease the technicians’ unsafe acts that eventually will lead

145
to fewer injuries at workplace. The results also show there was no direct effect of safety climate
on safety motivation. However, safety motivation was found to partially mediate the relationship
between perceived individual turnover and technicians’ unsafe acts. Furthermore, the developed
model predicted 64% of the variance in employee turnover, 7% of the variance in safety
motivation, 20% of the variance in unsafe acts, 41% of the variance in reporting unsafe behavior,
and 21% of the variance in workplace injuries.
Finally, the significant direct effects that perceived individual turnover and safety
motivation have on the unsafe acts of the maintenance technicians have not been reported in
previous studies. In addition, the study results emphasize the role of organizational factors on
employees’ attitudes. Therefore, the management must enforce positive safety climate to
minimize turnover and maximize safety motivation, which in turn leads to safe performance and
fewer injuries.
5.3 Study Significance
The developed model can provide a basis for predicting unsafe acts and implementing
ways to improve safety and productivity in the aviation maintenance operations. The results of
this study can be used to improve the ability of executives and safety managers to take
preventive measures to enhance the organizational safety processes and individual safety
behaviors. In addition, these results have potential of making a significant contribution to safe
practices in high-risk industries, especially in handling complex systems like aviation
maintenance. Organizations may also benefit from the presented results by enhancing knowledge
of the working environment by creating a strong safety climate and a good safety reporting
146
system. The present study also adds an important contribution to the employee turnover research.
Finally, this study may help in bridging the gap in the literature by providing a validated model
that captures some of the factors influencing the aircraft maintenance tasks.
5.4 Limitations
While the current hypotheses are generally supported, there are a number of limitations
that must be acknowledged. One limitation is the issue of a problem of common method variance
by implementing a cross-sectional self-report measurement which is using a single-source self-
reported data. However, according to Christian et al. (2009), it is possible not to find common
method variance issue for correlations between self-reported climate and self-reported safety
performance in relation to those correlations between self-reported climate and archival data that
based on incidents, injuries, and safety violations. Therefore, Christian et al. (2009) concluded
that common bias may not be a major concern in the field of safety. Another study limitation is
the issue from the nature of military work. Maintenance technicians have the military duties
aside from their works on the aircrafts and this issue may affect their responses.
5.5 Implications
Despite these limitations, the present study adds an important contribution to turnover
research in general, and aircraft maintenance in specifically. Utilizing this information could help
in investigating the reasons of why employees leave the organization. Managers should deal with
the source of individual disaffection in order to reduce the intention to leave (Vandenberg &
Nelson, 1999).
147
In addition, management can enhance the organizational safety climate for the sake of
improving safety performance and reducing safety outcomes and employees turnover. While the
study results are related to Air Force bases, they have some implications on enhancing
performance and reducing workplace injuries in other organizations. Furthermore, organizations
should benefit from creating positive safety climate and an accurate reporting environment for
the safety of their employees and equipment. Managers should also examine employees’ reasons
for not reporting safety concerns issues. Finally, this study provides empirical evidence
supporting safety climate as a predictor of safety outcomes.
5.6 Suggestions for Future Research
Future research should continue to investigate the impact of employee turnover on safety
performance in aircraft maintenance environment using longitudinal studies. Additionally, using
supervisor reports of employee safety performance, incidents and injuries data, or observations
can aid in avoiding problems of the shared-method variance (Koeske, 1994).
Future research could also investigate errors and violations deeply. The maintenance
errors can be classified into basic errors type such as lapses, slips, and mistakes. They also can be
classified into skilled based errors, decision errors, and perceptual errors. In addition, violations
can be classified into routine and exceptional violations (Hobbs & Williamson, 2002).
The insignificant relationships that found between self-reported incidents and other
constructs require further investigation. Finally, other demographical variables (e.g. marital
status and family with children) could be included in the survey in order to provide more insight
about employee characteristics.

148
APPENDIX A:
SURVEY QUESTIONNAIRES

149
SURVEY QUESTIONNAIRES
This research is conducted as part of my Ph.D. degree requirement. The main purpose is to
develop a model of the relationships between safety climate, employee turnover, safety
motivation, and safety performance in aircraft maintenance. You are invited to participate in a 98
questions survey. The survey is designed on a 5-point Likert Scale. All data and measurements
obtained from this study will be completely anonymous, only researcher will have access to view
any data collected. You are expected to complete the survey in 20-30 minutes. Your participation
is voluntary and if there are any questions you feel you cannot answer please let me know. You
must be 18 years of age or older to take part in this research study.
Your opinion is very important.
Background Information:
DATE
: ____________________________________________________
JOB TITLE
: ____________________________________________________
WING
: _____________________________________________________
RANK
: _____________________________________________________
AGE
: _____________________________________________________
EDUCATIONAL DEGREE
: _____________________________________________________
WHERE DO YOU WORK? (CIRCLE ONE)
: 1ST LINE 2ND LINE QUALITY SHOP OTHERS _____
YEARS OF SERVICE AT MAINTENANCE : _____________________________________________________

150
Please Take some time and answer the following questions
A. Safety Climate
1 Strongly Disagree 2 Disagree 3 Neutral 4 Agree 5 Strongly Agree
Using the above scale, please circle the number that best describes your opinion.
1. Supervision
1 2 3 4 5 1. My immediate supervisor has had many years experience in aviation maintenance.
1 2 3 4 5 2. My supervisor really understands the maintenance task.
1 2 3 4 5 3. I trust my supervisor.
1 2 3 4 5 4. My supervisor sets clear goals and objectives for the team.
1 2 3 4 5 5. My supervisor actively encourages team members to lift their level of performance.
1 2 3 4 5 6. When I make an error, my supervisor will support me.
1 2 3 4 5 7. My immediate supervisor checks my work very carefully.
1 2 3 4 5 8. My immediate supervisor helps me with my personal concerns and difficulties.
1 2 3 4 5 9. My supervisor always tries to enforce safe working procedure.
2. Safety Focus
1 2 3 4 5 10. Personnel are well trained in the consequences of unsafe acts.
1 2 3 4 5 11. This unit regards safety as a major factor in achieving its goals.
1 2 3 4 5 12. Lack of proper equipment sometimes forces us to cut corners in our work ®.
1 2 3 4 5 13. There is not always time to follow safe procedures ®.
1 2 3 4 5 14. In high workload conditions, I am prepared to take a few shortcuts to get jobs done on
time ®.
1 2 3 4 5 15. The safety procedures and practices in this unit are useful and effective.
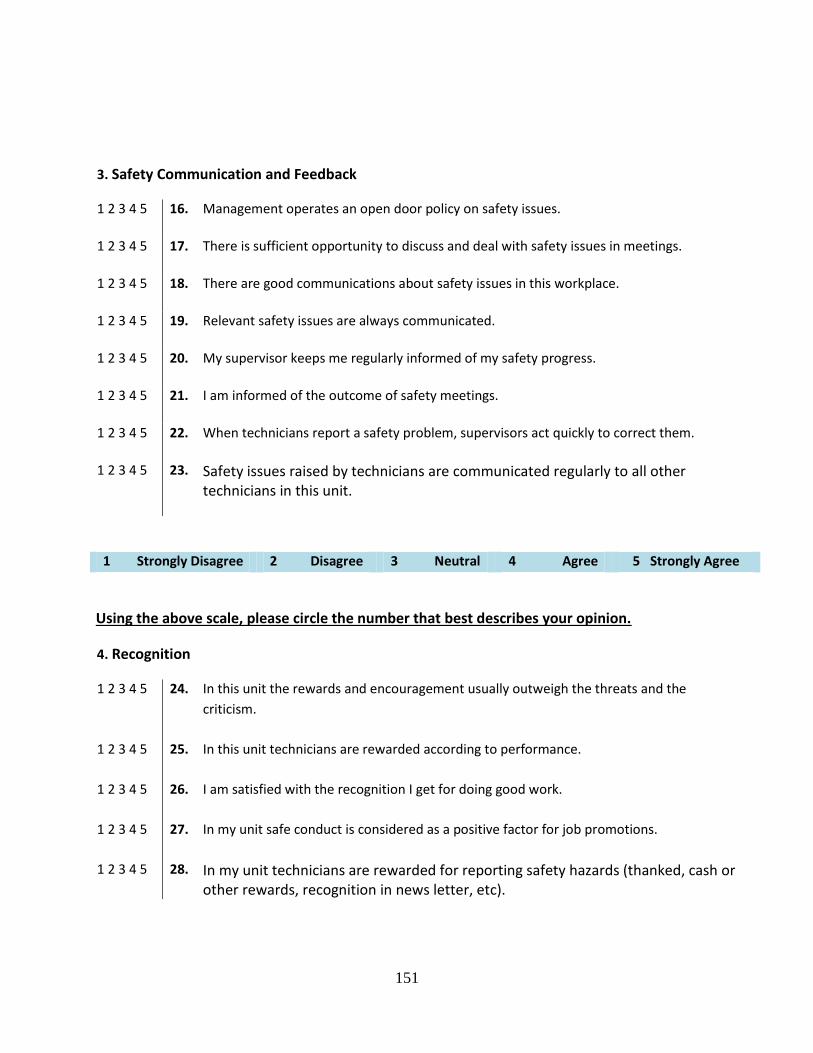
151
3. Safety Communication and Feedback
1 2 3 4 5 16. Management operates an open door policy on safety issues.
1 2 3 4 5 17. There is sufficient opportunity to discuss and deal with safety issues in meetings.
1 2 3 4 5 18. There are good communications about safety issues in this workplace.
1 2 3 4 5 19. Relevant safety issues are always communicated.
1 2 3 4 5 20. My supervisor keeps me regularly informed of my safety progress.
1 2 3 4 5 21. I am informed of the outcome of safety meetings.
1 2 3 4 5 22. When technicians report a safety problem, supervisors act quickly to correct them.
1 2 3 4 5 23. Safety issues raised by technicians are communicated regularly to all other
technicians in this unit.
1 Strongly Disagree 2 Disagree 3 Neutral 4 Agree 5 Strongly Agree
Using the above scale, please circle the number that best describes your opinion.
4. Recognition
1 2 3 4 5 24. In this unit the rewards and encouragement usually outweigh the threats and the
criticism.
1 2 3 4 5 25. In this unit technicians are rewarded according to performance.
1 2 3 4 5 26. I am satisfied with the recognition I get for doing good work.
1 2 3 4 5 27. In my unit safe conduct is considered as a positive factor for job promotions.
1 2 3 4 5 28. In my unit technicians are rewarded for reporting safety hazards (thanked, cash or
other rewards, recognition in news letter, etc).

152
5. Coworker Support for Safety
1 2 3 4 5 29. My coworkers are ready to talk to fellow employees who fail to use safety
equipment/procedures.
1 2 3 4 5 30. My coworkers are prepared to stop others from working dangerous
1 2 3 4 5 31. My coworkers encourage each other to work safely.
6. Training
1 2 3 4 5 32. My training has prepared me well for duties in my current job.
1 2 3 4 5 33. On-the-job training is a high priority in my unit.
1 2 3 4 5 34. I have a good “system knowledge” of the equipment that I work on.
1 2 3 4 5 35. My coworkers have a good “system knowledge” of the equipment that they work o
1 2 3 4 5 36. I have been given enough training to perform my work safely.
1 2 3 4 5 37. Safety issues are given high priority in training programs.
1 2 3 4 5 38. I have been encouraged to improve myself through continued training.
B. Employee Turnover
1 Strongly Disagree 2 Disagree 3 Neutral 4 Agree 5 Strongly Agree
Using the above scale, please circle the number that best describes your opinion.
1. Job Satisfaction
1 2 3 4 5 39. The work I do is very meaningful to me ®.
1 2 3 4 5 40. My work gives me a sense of achievement ®.
1 2 3 4 5 41. I like to look back on a day's work with a sense of a job well done ®.

153
1 2 3 4 5 42. I enjoy my work more than my leisure time ®.
1 2 3 4 5 43. I feel that I am happier in my work than most people ®.
1 2 3 4 5 44. Most days I am enthusiastic about my work ®.
1 2 3 4 5 45. There is not enough variety in my job.
2. Organizational Commitment
1 2 3 4 5 46. I am willing to put in a great deal of effort beyond that normally expected in order to help my unit ®.
1 2 3 4 5 47. I speak highly of this unit to my friends as a great place to work ®.
1 2 3 4 5 48. I would accept almost any type of job assignment in order to keep working for this unit ®.
1 2 3 4 5 49. I find that my values and the unit's values are very similar ®.
1 2 3 4 5 50. I am proud to tell others that I am part of this unit ®.
1 2 3 4 5 51. Deciding to work for this unit was a definite mistake on my part.
3. Emotional Exhaustion
1 2 3 4 5 52. I feel emotionally drained from my work.
1 2 3 4 5 53. I feel used up at the end of the workday.
1 2 3 4 5 54. I feel fatigued when I get up in the morning and have to face another day on the job.
1 2 3 4 5 55. I feel burned out from my work.
1 2 3 4 5 56. I feel frustrated by my job.
1 2 3 4 5 57. I feel I am working too hard on my job ®.
1 2 3 4 5 58. I feel like I am at the end of my rope.

154
1 Strongly Disagree 2 Disagree 3 Neutral 4 Agree 5 Strongly Agree
Using the above scale, please circle the number that best describes your opinion.
4.Turnover Intention
1 2 3 4 5 59. In the next few months I intend to leave this organization.
1 2 3 4 5 60. In the next few years I intend to leave this organization.
1 2 3 4 5 61. I occasionally think about leaving this organization.
1 2 3 4 5 62. I’d like to work in this organization until I reach retirement age ®.
C. Safety Motivation
1 2 3 4 5 63. I feel that it is important to maintain safety at all times.
1 2 3 4 5 64. I believe that safety at workplace is a very important issue.
1 2 3 4 5 65. I feel that it is necessary to put efforts to reduce accidents and incidents at workplace.
1 2 3 4 5 66. I feel that it is worthwhile to put in effort to maintain or improve my personal safety.
1 2 3 4 5 67. I feel that it is important to encourage others to use safe practices.
1 2 3 4 5 68. I feel that it is important to promote safety programs.
D. Safety Performance
1. Reporting Unsafe Behaviors
1 2 3 4 5 69. I don’t bother reporting mishaps or close calls since these events don’t cause any real
damage ®.
1 2 3 4 5 70. The safety reporting system is convenient and easy to use.
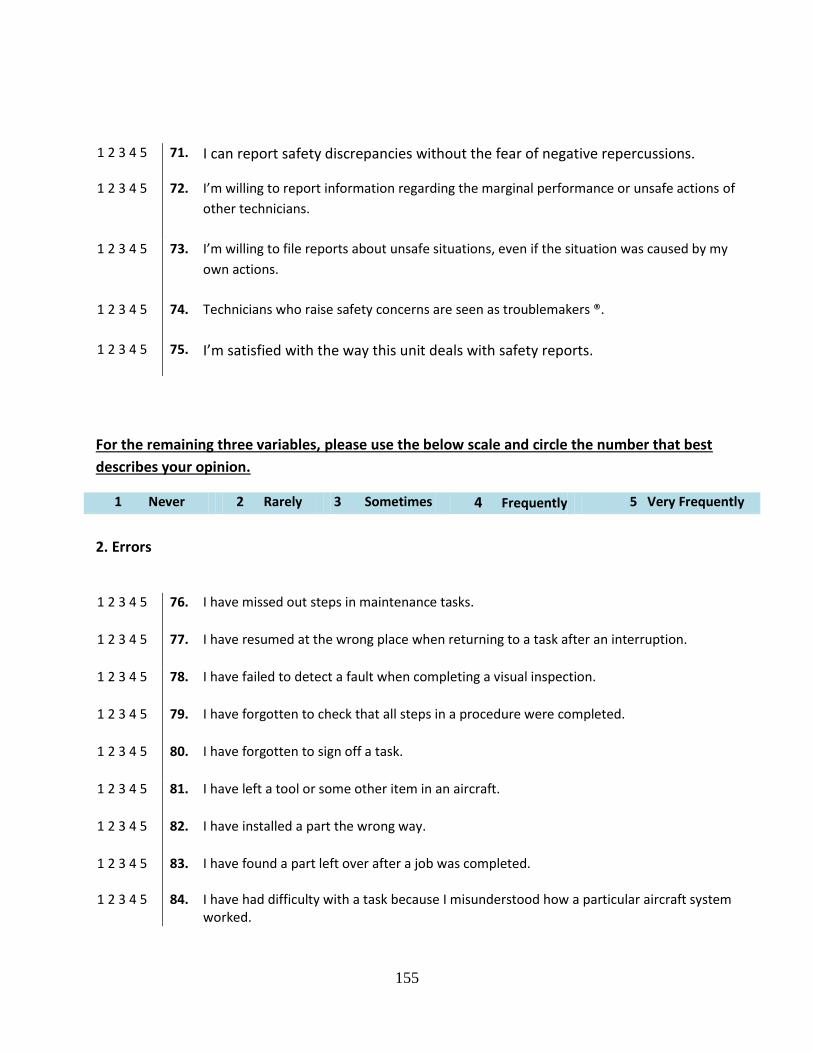
155
1 2 3 4 5 71. I can report safety discrepancies without the fear of negative repercussions.
1 2 3 4 5 72. I’m willing to report information regarding the marginal performance or unsafe actions of
other technicians.
1 2 3 4 5 73. I’m willing to file reports about unsafe situations, even if the situation was caused by my
own actions.
1 2 3 4 5 74. Technicians who raise safety concerns are seen as troublemakers ®.
1 2 3 4 5 75. I’m satisfied with the way this unit deals with safety reports.
For the remaining three variables, please use the below scale and circle the number that best
describes your opinion.
1 Never 2 Rarely 3 Sometimes 4 Frequently 5 Very Frequently
2. Errors
1 2 3 4 5 76. I have missed out steps in maintenance tasks.
1 2 3 4 5 77. I have resumed at the wrong place when returning to a task after an interruption.
1 2 3 4 5 78. I have failed to detect a fault when completing a visual inspection.
1 2 3 4 5 79. I have forgotten to check that all steps in a procedure were completed.
1 2 3 4 5 80. I have forgotten to sign off a task.
1 2 3 4 5 81. I have left a tool or some other item in an aircraft.
1 2 3 4 5 82. I have installed a part the wrong way.
1 2 3 4 5 83. I have found a part left over after a job was completed.
1 2 3 4 5 84. I have had difficulty with a task because I misunderstood how a particular aircraft system
worked.
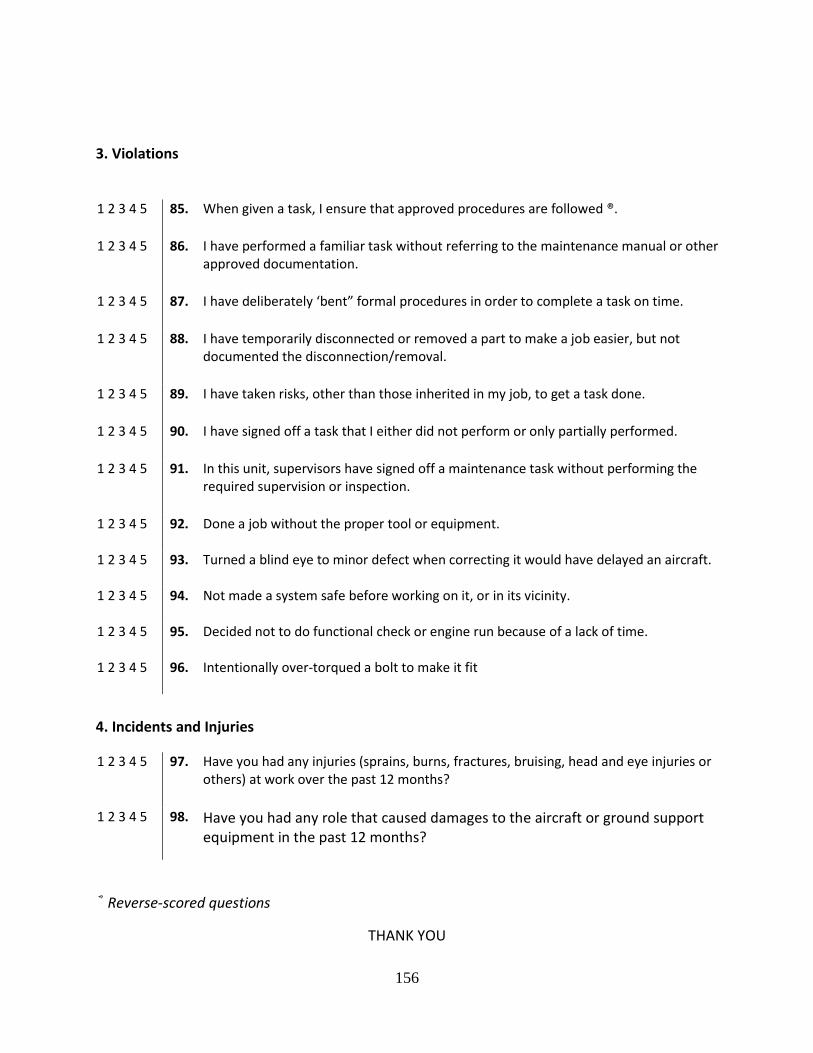
156
3. Violations
1 2 3 4 5 85. When given a task, I ensure that approved procedures are followed ®.
1 2 3 4 5 86. I have performed a familiar task without referring to the maintenance manual or other
approved documentation.
1 2 3 4 5 87. I have deliberately ‘bent” formal procedures in order to complete a task on time.
1 2 3 4 5 88. I have temporarily disconnected or removed a part to make a job easier, but not
documented the disconnection/removal.
1 2 3 4 5 89. I have taken risks, other than those inherited in my job, to get a task done.
1 2 3 4 5 90. I have signed off a task that I either did not perform or only partially performed.
1 2 3 4 5 91. In this unit, supervisors have signed off a maintenance task without performing the
required supervision or inspection.
1 2 3 4 5 92. Done a job without the proper tool or equipment.
1 2 3 4 5 93. Turned a blind eye to minor defect when correcting it would have delayed an aircraft.
1 2 3 4 5 94. Not made a system safe before working on it, or in its vicinity.
1 2 3 4 5 95. Decided not to do functional check or engine run because of a lack of time.
1 2 3 4 5 96. Intentionally over-torqued a bolt to make it fit
4. Incidents and Injuries
1 2 3 4 5 97. Have you had any injuries (sprains, burns, fractures, bruising, head and eye injuries or others) at work over the past 12 months?
1 2 3 4 5 98. Have you had any role that caused damages to the aircraft or ground support
equipment in the past 12 months?
® Reverse-scored questions
THANK YOU

157
استبانة بحث
: المقدمه
ة الدكتوراه في الهندسة البحثية للحصول علي درج ةانه كجزء من متطلبات الدراسعداد هذه الاستبإلقد تم
انة صي في أجنحة ةلسلامبيئة ا"البحثية هو دراسة و تحليل ةراسالهدف الرئيسي من هذه الدو الصناعية
".لسلاح الجو الملكي البحريني ةالطائرات التابع
الباحث ىتكون سرية و مجهولة المصدرالا علجميع البيانات و القياسات المأخوذة من هذه الاستبانه سوف
. الذي سوف يتمتع بكامل الصلاحية للاطلاع عليها
ذا كان إ هن مشاركتكم تطوعية و عليإحيث دقيقة 02الى 02نهاء هذه الاستبانه هو من لإلمفترض ن الوقت اإ
.سنة 81يجب ان يكون عمر المشارك فوق .رجو منكم الرجوع للباحثأو استفسارات أسئلة أية ألديكم
.ةدرجة الدكتورا للحصول على ةالبحثي ةءات الدراساجرإة كبيرة و داعم للباحث لاستكمال هميأيكم ذو أر
.هذا مالزم و لكم جزيل الشكر
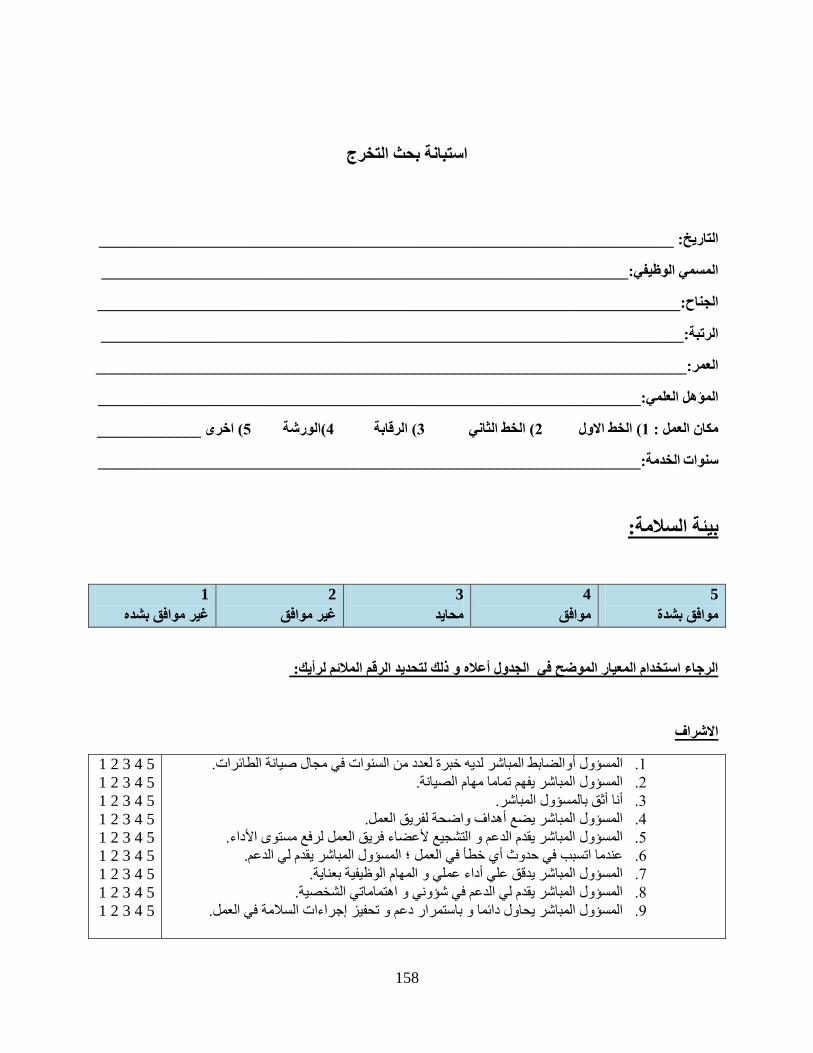
158
استبانة بحث التخرج
________________________________________________________________________: التاريخ
__________________________________________________________________:المسمي الوظيفي
_________________________________________________________________________:الجناح
_________________________________________________________________________:الرتبة
__________________________________________________________________________:العمر
____________________________________________________________________:ؤهل العلميمال
_____________اخرى ( 5الورشة (4الرقابة ( 3الخط الثاني ( 2الخط الاول ( 1: مكان العمل
____________________________________________________________________:سنوات الخدمة
بيئة السلامة:
1
غير موافق بشده
2
غير موافق
3
محايد
4
موافق
5
موافق بشدة
الرجاء استخدام المعيار الموضح في الجدول أعلاه و ذلك لتحديد الرقم الملائم لرأيك:
الاشراف
1 2 3 4 5
1 2 3 4 5
1 2 3 4 5
1 2 3 4 5
1 2 3 4 5
1 2 3 4 5
1 2 3 4 5
1 2 3 4 5
1 2 3 4 5
.الضابط المباشر لديه خبرة لعدد من السنوات في مجال صيانة الطائراتسؤول أوالم .8
.المباشر يفهم تماما مهام الصيانة المسؤول .0
.المباشر المسؤولثق بأنا أ .0
.هداف واضحة لفريق العملأالمباشر يضع المسؤول .4
.ءدالرفع مستوى الأالمباشر يقدم الدعم و التشجيع لأعضاء فريق العمل المسؤول .5
.المباشر يقدم لي الدعم المسؤولي خطأ في العمل ؛ أفي حدوث عندما اتسبب .6
. داء عملي و المهام الوظيفية بعنايةأق علي المباشر يدق المسؤول .7
.المباشر يقدم لي الدعم في شؤوني و اهتماماتي الشخصية المسؤول .1
.لامة في العملجراءات السإل دائما و باستمرار دعم و تحفيز المباشر يحاو المسؤول .9
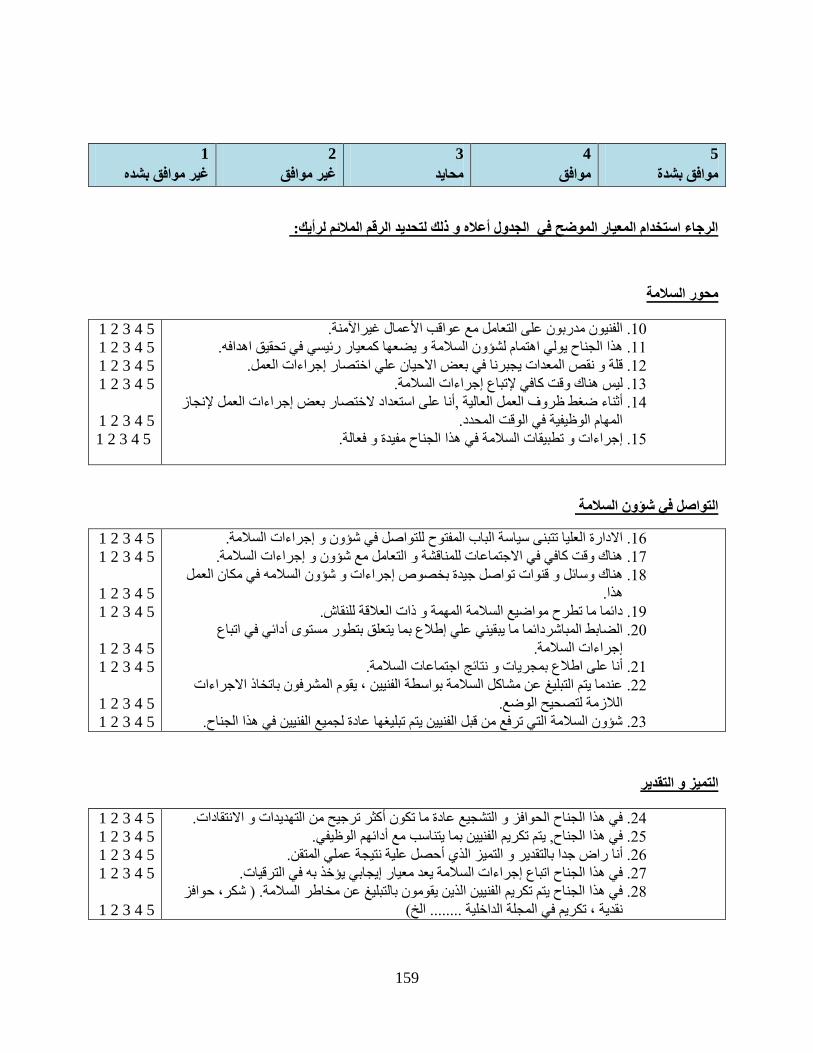
159
1
غير موافق بشده
2
غير موافق
3
محايد
4
موافق
5
موافق بشدة
الرجاء استخدام المعيار الموضح في الجدول أعلاه و ذلك لتحديد الرقم الملائم لرأيك:
محور السلامة
1 2 3 4 5
1 2 3 4 5
1 2 3 4 5
1 2 3 4 5
1 2 3 4 5
1 2 3 4 5
.منةالآغيرعمال لتعامل مع عواقب الأالفنيون مدربون على ا .82
.هدافهاعها كمعيار رئيسي في تحقيق هذا الجناح يولي اهتمام لشؤون السلامة و يض .88
.جراءات العملإبعض الاحيان علي اختصار قلة و نقص المعدات يجبرنا في .80
.جراءات السلامةإ ليس هناك وقت كافي لإتباع .80
نجاز جراءات العمل لإإلاختصار بعض داستعدانا على أ,ثناء ضغط ظروف العمل العالية أ .84
.المهام الوظيفية في الوقت المحدد
.جراءات و تطبيقات السلامة في هذا الجناح مفيدة و فعالةإ .85
التواصل في شؤون السلامة
1 2 3 4 5
1 2 3 4 5
1 2 3 4 5
1 2 3 4 5
1 2 3 4 5
1 2 3 4 5
1 2 3 4 5
1 2 3 4 5
.جراءات السلامةإتواصل في شؤون و تتبنى سياسة الباب المفتوح للالادارة العليا .86
.جراءات السلامةإشؤون و هناك وقت كافي في الاجتماعات للمناقشة و التعامل مع .87
جراءات و شؤون السلامه في مكان العمل إوسائل و قنوات تواصل جيدة بخصوص هناك .81
.هذا
.لعلاقة للنقاشدائما ما تطرح مواضيع السلامة المهمة و ذات ا .89
دائي في اتباع أطلاع بما يتعلق بتطور مستوى إدائما ما يبقيني علي الضابط المباشر .02
.جراءات السلامةإ
.ةبمجريات و نتائج اجتماعات السلامنا على اطلاع أ .08
عندما يتم التبليغ عن مشاكل السلامة بواسطة الفنيين ، يقوم المشرفون باتخاذ الاجراءات .00
.لوضعاللازمة لتصحيح ا
. شؤون السلامة التي ترفع من قبل الفنيين يتم تبليغها عادة لجميع الفنيين في هذا الجناح .00
التميز و التقدير
1 2 3 4 5
1 2 3 4 5
1 2 3 4 5
1 2 3 4 5
1 2 3 4 5
.كثر ترجيح من التهديدات و الانتقاداتأعادة ما تكون في هذا الجناح الحوافز و التشجيع .04
.دائهم الوظيفيأنيين بما يتناسب مع يتم تكريم الف, الجناحفي هذا .05
.حصل علية نتيجة عملي المتقنأراض جدا بالتقدير و التميز الذي نا أ .06
.يجابي يؤخذ به في الترقياتإعد معيار جراءات السلامة يإاتباع الجناح افي هذ .07
شكر، حوافز . ) السلامة الجناح يتم تكريم الفنيين الذين يقومون بالتبليغ عن مخاطر افي هذ .01
(الخ........ نقدية ، تكريم في المجلة الداخلية
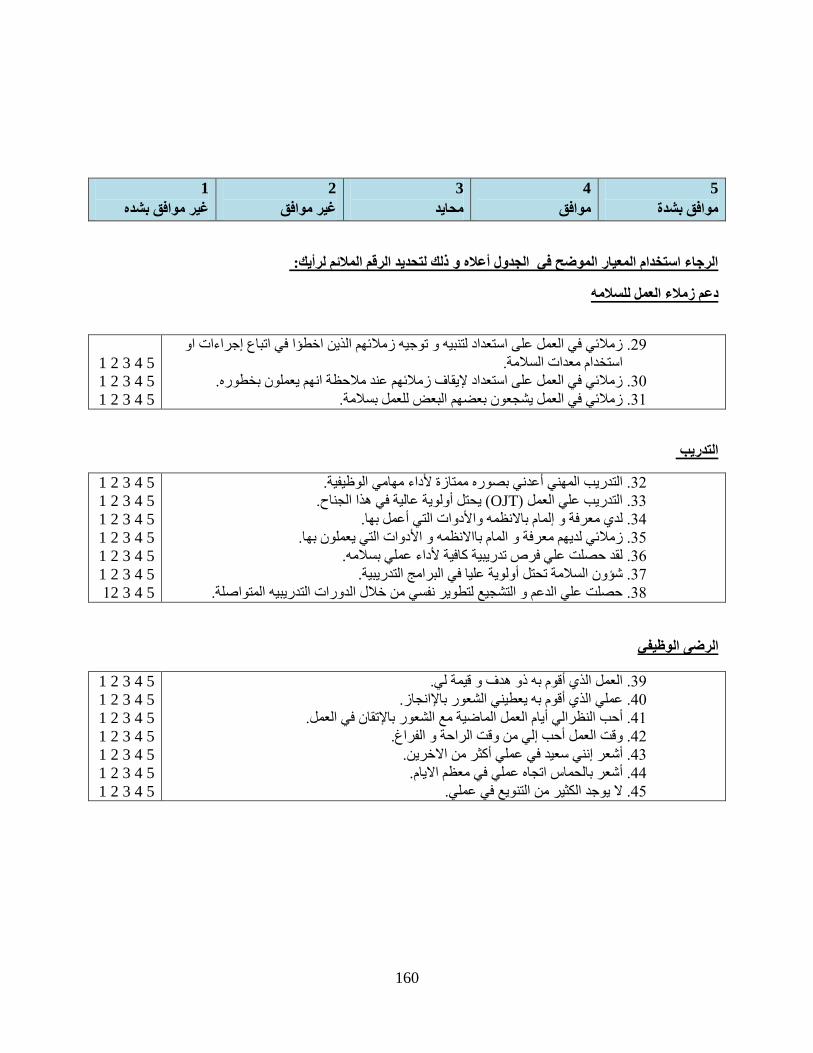
160
1
غير موافق بشده
2
غير موافق
3
محايد
4
موافق
5
موافق بشدة
الرجاء استخدام المعيار الموضح في الجدول أعلاه و ذلك لتحديد الرقم الملائم لرأيك:
دعم زملاء العمل للسلامه
1 2 3 4 5
1 2 3 4 5
1 2 3 4 5
جراءات او إتباع افي ؤا اخط نزملائي في العمل على استعداد لتنبيه و توجيه زملائهم الذي .09
.استخدام معدات السلامة
.زملائي في العمل على استعداد لإيقاف زملائهم عند ملاحظة انهم يعملون بخطوره .02
.زملائي في العمل يشجعون بعضهم البعض للعمل بسلامة .08
التدريب
1 2 3 4 5
1 2 3 4 5
1 2 3 4 5
1 2 3 4 5
1 2 3 4 5
1 2 3 4 5
8 2 3 4 5
.عدني بصوره ممتازة لأداء مهامي الوظيفيةأ التدريب المهني .00
.ولوية عالية في هذا الجناحأيحتل ( OJT)التدريب علي العمل .00
.عمل بهاأالتي لمام بالانظمه والأدواتإلدي معرفة و .04
.المام باالانظمه و الأدوات التي يعملون بهازملائي لديهم معرفة و .05
.هعملي بسلام لقد حصلت علي فرص تدريبية كافية لأداء .06
.ولوية عليا في البرامج التدريبيةأشؤون السلامة تحتل .07
.حصلت علي الدعم و التشجيع لتطوير نفسي من خلال الدورات التدريبيه المتواصلة .01
الرضى الوظيفي
1 2 3 4 5
1 2 3 4 5
1 2 3 4 5
1 2 3 4 5
1 2 3 4 5
1 2 3 4 5
1 2 3 4 5
.قوم به ذو هدف و قيمة ليأالعمل الذي .09
.انجازلإقوم به يعطيني الشعور باأعملي الذي .42
.يام العمل الماضية مع الشعور بالإتقان في العملأالي حب النظرأ .48
.لي من وقت الراحة و الفراغإحب أوقت العمل .40
.كثر من الاخرينأنني سعيد في عملي إشعر أ .40
.شعر بالحماس اتجاه عملي في معظم الايامأ .44
. لا يوجد الكثير من التنويع في عملي .45
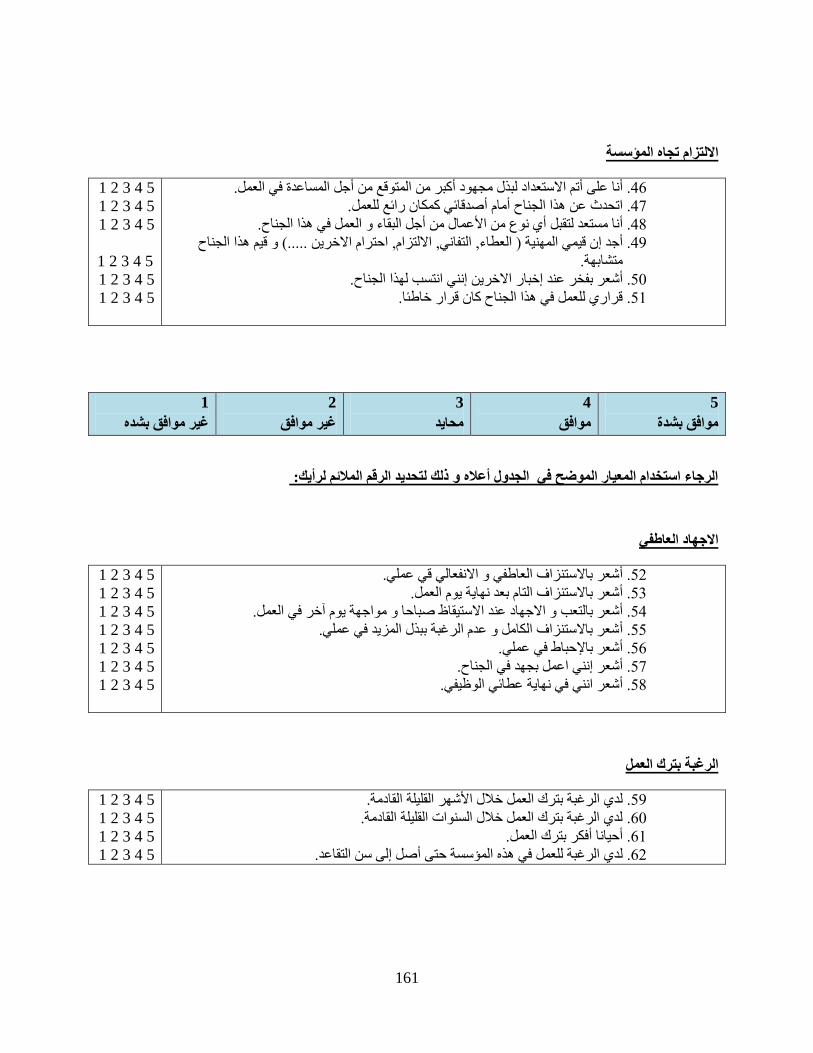
161
الالتزام تجاه المؤسسة
1 2 3 4 5
1 2 3 4 5
1 2 3 4 5
1 2 3 4 5
1 2 3 4 5
1 2 3 4 5
.ملجل المساعدة في العأمتوقع من كبر من الأتم الاستعداد لبذل مجهود ألى نا عأ .46
.صدقائي كمكان رائع للعملأمام أ تحدث عن هذا الجناحا .47
.جل البقاء و العمل في هذا الجناحأعمال من الأنا مستعد لتقبل أي نوع من أ .41
و قيم هذا الجناح .....( احترام الاخرين , الالتزام, التفاني, العطاء) ن قيمي المهنية إجد أ .49
.متشابهة
.انتسب لهذا الجناحنني إر الاخرين خباإبفخر عند شعر أ .52
. اقراري للعمل في هذا الجناح كان قرار خاطئ .58
1
غير موافق بشده
2
غير موافق
3
محايد
4
موافق
5
موافق بشدة
الرجاء استخدام المعيار الموضح في الجدول أعلاه و ذلك لتحديد الرقم الملائم لرأيك:
الاجهاد العاطفي
1 2 3 4 5
1 2 3 4 5
1 2 3 4 5
1 2 3 4 5
1 2 3 4 5
1 2 3 4 5
1 2 3 4 5
.شعر بالاستنزاف العاطفي و الانفعالي قي عمليأ .50
.شعر بالاستنزاف التام بعد نهاية يوم العملأ .50
.خر في العملآد الاستيقاظ صباحا و مواجهة يوم شعر بالتعب و الاجهاد عنأ .54
.شعر بالاستنزاف الكامل و عدم الرغبة ببذل المزيد في عمليأ .55
.شعر بالإحباط في عمليأ .56
.في الجناح نني اعمل بجهدإ شعرأ .57
. شعر انني في نهاية عطائي الوظيفيأ .51
الرغبة بترك العمل
1 2 3 4 5
1 2 3 4 5
1 2 3 4 5
1 2 3 4 5
.شهر القليلة القادمةرغبة بترك العمل خلال الألدي ال .59
.لدي الرغبة بترك العمل خلال السنوات القليلة القادمة .62
.فكر بترك العملأ اناحيأ .68
. لى سن التقاعدإصل أ حتى ةالرغبة للعمل في هذه المؤسسلدي .60
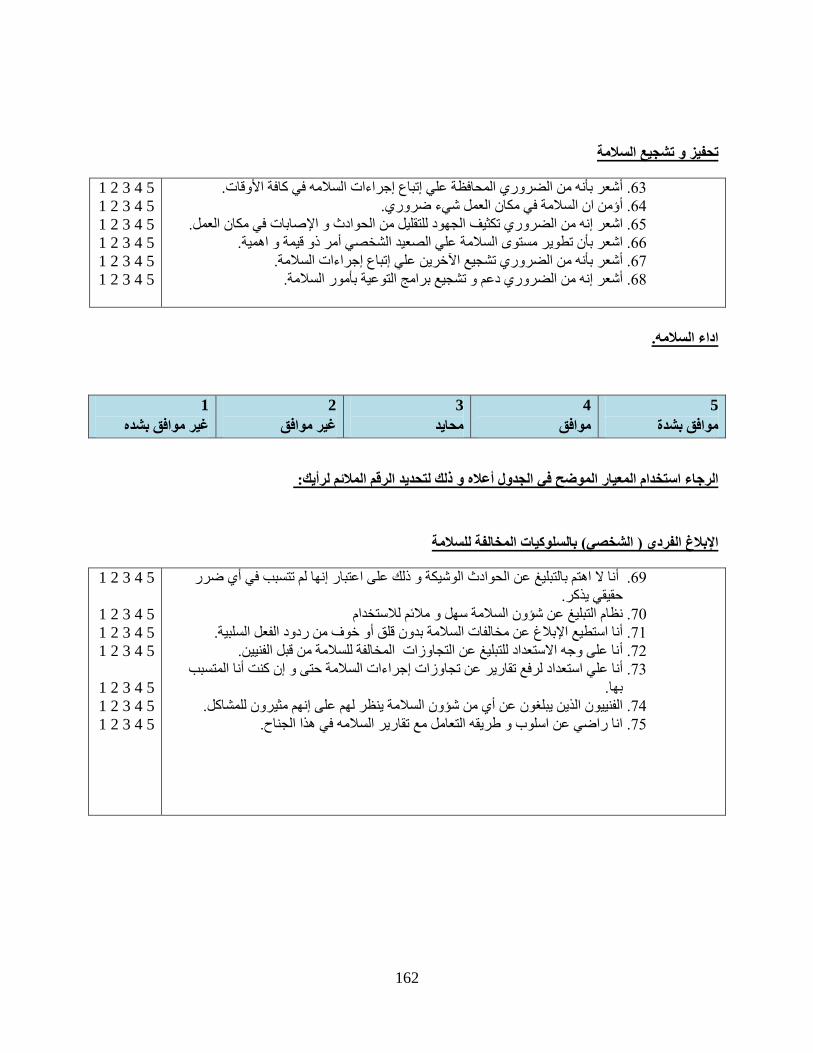
162
تحفيز و تشجيع السلامة
1 2 3 4 5
1 2 3 4 5
1 2 3 4 5
1 2 3 4 5
1 2 3 4 5
1 2 3 4 5
.وقاتلسلامه في كافة الأجراءات اإتباع إشعر بأنه من الضروري المحافظة علي أ .60
.ي مكان العمل شيء ضروريؤمن ان السلامة فأ .64
.صابات في مكان العملالجهود للتقليل من الحوادث و الإ نه من الضروري تكثيفإشعر ا .65
.مر ذو قيمة و اهميةأالشخصي علي الصعيد ةتطوير مستوى السلام نأشعر با .66
.ةءات السلامجراإتباع إخرين علي من الضروري تشجيع الآ شعر بأنهأ .67
.و تشجيع برامج التوعية بأمور السلامةنه من الضروري دعم إشعر أ .61
اداء السلامه.
1
غير موافق بشده
2
غير موافق
3
محايد
4
موافق
5
موافق بشدة
الرجاء استخدام المعيار الموضح في الجدول أعلاه و ذلك لتحديد الرقم الملائم لرأيك:
الإبلاغ الفردي ) الشخصي( بالسلوكيات المخالفة للسلامة
1 2 3 4 5
1 2 3 4 5
1 2 3 4 5
1 2 3 4 5
1 2 3 4 5
1 2 3 4 5
1 2 3 4 5
ي ضرر أنها لم تتسبب في إيكة و ذلك على اعتبار نا لا اهتم بالتبليغ عن الحوادث الوشأ .69
. حقيقي يذكر
سهل و ملائم للاستخدام ةسلامنظام التبليغ عن شؤون ال .72
.خوف من ردود الفعل السلبيةو أقلق ونبلاغ عن مخالفات السلامة بدنا استطيع الإأ .78
.نا على وجه الاستعداد للتبليغ عن التجاوزات المخالفة للسلامة من قبل الفنيينأ .70
نا المتسبب أن كنت إجراءات السلامة حتى و إاستعداد لرفع تقارير عن تجاوزات نا علي أ .70
.بها
.ن للمشاكلوهم مثيرنإن الذين يبلغون عن أي من شؤون السلامة ينظر لهم على والفنيي .74
.انا راضي عن اسلوب و طريقه التعامل مع تقارير السلامه في هذا الجناح .75

163
للأسئلة المتبقية ارجو استخدام المعيار الموضح ادناه لاختيار الرقم الانسب لإيضاح رأيك
1
ابدا
2
نادرا
3
احيانا
4
متكرر
5
متكرر كثيرا
اخطاء الصيانة
1 2 3 4 5
1 2 3 4 5
1 2 3 4 5
1 2 3 4 5
1 2 3 4 5
1 2 3 4 5
1 2 3 4 5
1 2 3 4 5
1 2 3 4 5
.داء مهام الصيانةأ ثناءأبعض الخطوات عديت من دون قصدلقد ت .76
.ء من خطوة خاطئة بعد تعرضي لتشتيت الانتباهلمواصله العمل بد دتع .77
.يتمام عملية التفتيش النظرإد فشلت في تحديد مكان الخلل بعد لق .71
.جراءات الصيانه بعد الانتهاء من العملإلجميع خطوات قوم بعملية التاكدأن أبلقد نسيت .79
.بعد اتمام عملية الصيانه وقعأن ألقد نسيت .12
.داخل الطائرةباو قطع اخرى من أدوات الصيانةداة ألقد قمت بترك .18
.بطريقة خاطئة قمت بتركيب قطعةلقد .10
.نسيت متروكة بعد الانتهاء من العمل وات الصيانةمن أد ةداأو ألقد وجدت قطعة غيار .10
.في نظام الطائره ةبجزئية معينلمامي إنتيجة عدم فهمي و لقد وجدت صعوبة في اداء العمل .14
التجاوزات و الانتهاكات
1 2 3 4 5
1 2 3 4 5
1 2 3 4 5
1 2 3 4 5
1 2 3 4 5
1 2 3 4 5
1 2 3 4 5
1 2 3 4 5
1 2 3 4 5
1 2 3 4 5
1 2 3 4 5
1 2 3 4 5
.بها يالموص ةجراءات السلامإتباع إحرص علي أسناد مهمة وظيفية لي إعندما يتم .15
في النشرات ةو دليل العمل المتبعأجراءات إلى إلقد قمت بأداء وظائفي المعتادة دون الرجوع .16
.الفنيه
.م المهمة الوظيفية في الوقت المحددختصار اجراءات العمل لإتماإلقد تعمدت ب .17
.هذه الخطوة او كتابة توثيق لتسهيل العمل دون زالة قطعهإو أ لقد قمت بفك .11
.العمل لقد قمت بمخاطر و تجاوزات غير معهودة في محيط العمل و ذلك لإتمام .19
.كنت مسؤول جزئيا عنها أوقم بها ألم علي مهمة وظيفية لقد قمت بالتوقيع .92
دون تطبيق أي من ن عمليات الصيانهتمام عدد مإن وقعوا علي وشرفالم، احفي هذه الجن .98
.فعليا منها جراءات التدقيق و التأكدإ
. دوات غير ملائمهأو أمت بانجاز العمل باستخدام معدات ق .90
.ةخر جاهزية الطائريؤن تصليحه قد إو صرف النظر عن خلل بسيط حيث أقمت بالتقاضي .90
.ةو محيط العمل قبل البدأ بالصيانأ المعدةلامة قم بتجهيز مسبق لسألم .94
.بعد تصليحه نتيجة ضيق الوقت لجهازالتاكد من عمل اب القيام رت عدمقر .95
. دون الرجوع الى دليل النشرات الفنية ةقوة مفرطه لتركيب قطعتعمدت لاستخدام .96

164
الحوداث و الإصابات
1 2 3 4 5
1 2 3 4 5
, قوحر, جروح, وركس, اتلتواءإ)صابات التالية ي نوع من الإلأ أثناء العمل هل تعرضت .97
.ةالماضي 80شهر الأخلال ......( و اخرىألرأس ا أو صابات في العين إ
شهر الأخلال ة لية المساندالآو المعدات أضرار لجسم الطائره أهل كان لك دور في التسبب بأية .91
.ةالماضي 80
وشكرا

165
APPENDIX B:
LETTER OF IRB APPROVAL

166

167
APPENDIX C:
CORRELATIONS AMONG ALL INDICATORS
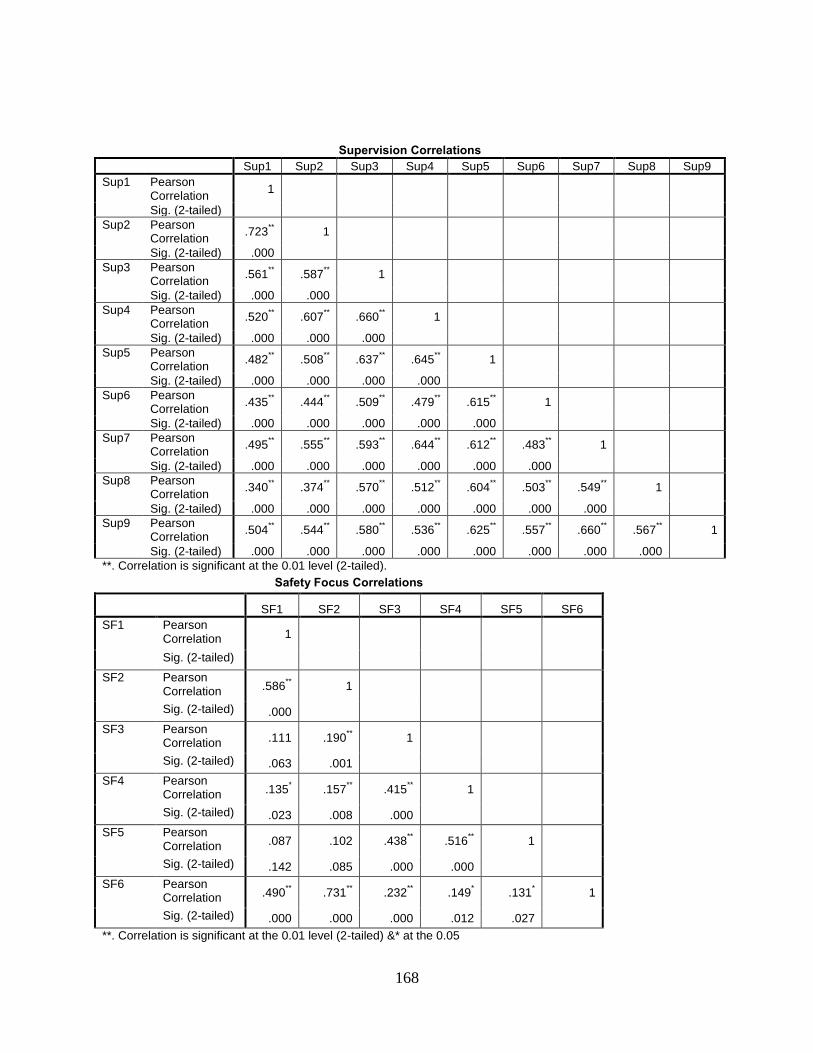
168
Supervision Correlations
Sup1 Sup2 Sup3 Sup4 Sup5 Sup6 Sup7 Sup8 Sup9
Sup1 Pearson Correlation
1
Sig. (2-tailed)
Sup2 Pearson Correlation
.723** 1
Sig. (2-tailed) .000
Sup3 Pearson Correlation
.561** .587
** 1
Sig. (2-tailed) .000 .000
Sup4 Pearson Correlation
.520** .607
** .660
** 1
Sig. (2-tailed) .000 .000 .000
Sup5 Pearson Correlation
.482** .508
** .637
** .645
** 1
Sig. (2-tailed) .000 .000 .000 .000
Sup6 Pearson Correlation
.435** .444
** .509
** .479
** .615
** 1
Sig. (2-tailed) .000 .000 .000 .000 .000
Sup7 Pearson Correlation
.495** .555
** .593
** .644
** .612
** .483
** 1
Sig. (2-tailed) .000 .000 .000 .000 .000 .000
Sup8 Pearson Correlation
.340** .374
** .570
** .512
** .604
** .503
** .549
** 1
Sig. (2-tailed) .000 .000 .000 .000 .000 .000 .000
Sup9 Pearson Correlation
.504** .544
** .580
** .536
** .625
** .557
** .660
** .567
** 1
Sig. (2-tailed) .000 .000 .000 .000 .000 .000 .000 .000
**. Correlation is significant at the 0.01 level (2-tailed).
Safety Focus Correlations
SF1 SF2 SF3 SF4 SF5 SF6
SF1 Pearson Correlation 1
Sig. (2-tailed)
SF2 Pearson Correlation .586
** 1
Sig. (2-tailed) .000
SF3 Pearson Correlation .111 .190
** 1
Sig. (2-tailed) .063 .001
SF4 Pearson Correlation .135
* .157
** .415
** 1
Sig. (2-tailed) .023 .008 .000
SF5 Pearson Correlation .087 .102 .438
** .516
** 1
Sig. (2-tailed) .142 .085 .000 .000
SF6 Pearson Correlation .490
** .731
** .232
** .149
* .131
* 1
Sig. (2-tailed) .000 .000 .000 .012 .027
**. Correlation is significant at the 0.01 level (2-tailed) &* at the 0.05
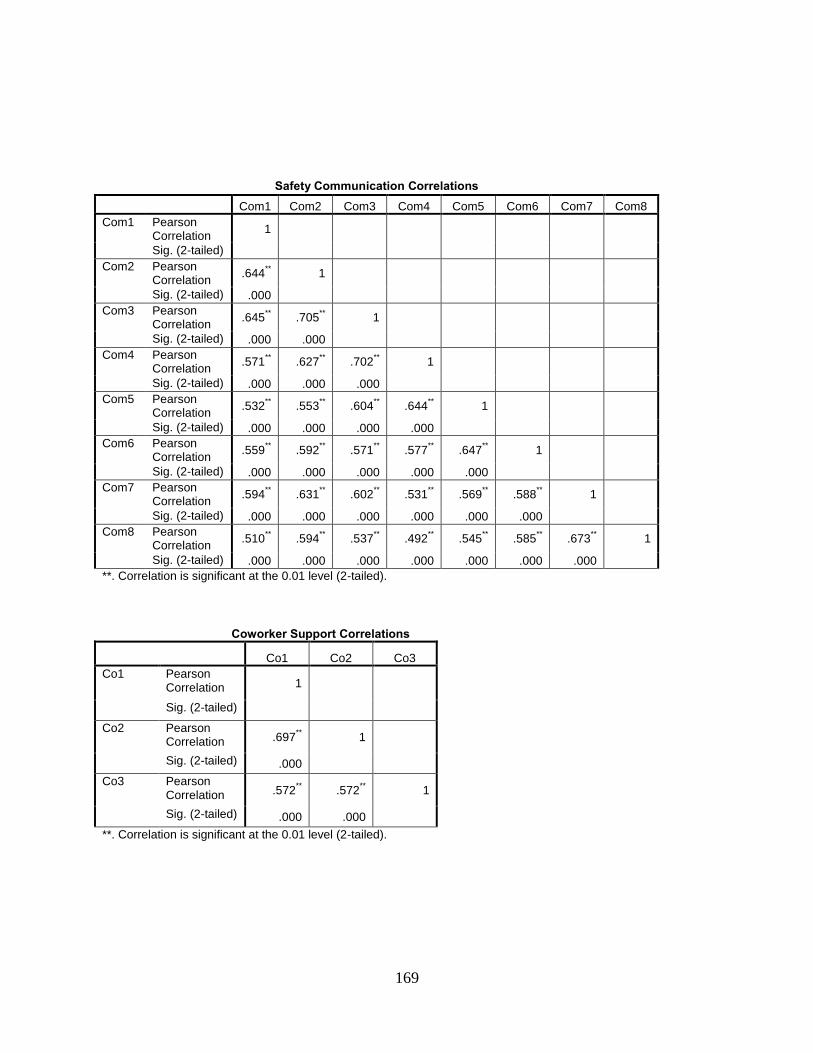
169
Safety Communication Correlations
Com1 Com2 Com3 Com4 Com5 Com6 Com7 Com8
Com1 Pearson Correlation
1
Sig. (2-tailed)
Com2 Pearson Correlation
.644** 1
Sig. (2-tailed) .000
Com3 Pearson Correlation
.645** .705
** 1
Sig. (2-tailed) .000 .000
Com4 Pearson Correlation
.571** .627
** .702
** 1
Sig. (2-tailed) .000 .000 .000
Com5 Pearson Correlation
.532** .553
** .604
** .644
** 1
Sig. (2-tailed) .000 .000 .000 .000
Com6 Pearson Correlation
.559** .592
** .571
** .577
** .647
** 1
Sig. (2-tailed) .000 .000 .000 .000 .000
Com7 Pearson Correlation
.594** .631
** .602
** .531
** .569
** .588
** 1
Sig. (2-tailed) .000 .000 .000 .000 .000 .000
Com8 Pearson Correlation
.510** .594
** .537
** .492
** .545
** .585
** .673
** 1
Sig. (2-tailed) .000 .000 .000 .000 .000 .000 .000
**. Correlation is significant at the 0.01 level (2-tailed).
Coworker Support Correlations
Co1 Co2 Co3
Co1 Pearson Correlation 1
Sig. (2-tailed)
Co2 Pearson Correlation .697
** 1
Sig. (2-tailed) .000
Co3 Pearson Correlation .572
** .572
** 1
Sig. (2-tailed) .000 .000
**. Correlation is significant at the 0.01 level (2-tailed).

170
Recognition Correlations
Rec1 Rec2 Rec3 Rec4 Rec5
Rec1 Pearson Correlation 1
Sig. (2-tailed)
Rec2 Pearson Correlation
.611** 1
Sig. (2-tailed) .000
Rec3 Pearson Correlation
.509** .731
** 1
Sig. (2-tailed) .000 .000
Rec4 Pearson Correlation
.548** .639
** .652
** 1
Sig. (2-tailed) .000 .000 .000
Rec5 Pearson Correlation
.503** .698
** .668
** .667
** 1
Sig. (2-tailed) .000 .000 .000 .000
**. Correlation is significant at the 0.01 level (2-tailed).
Training Correlations
Tra1 Tra2 Tra3 Tra4 Tra5 Tra6 Tra7
Tra1 Pearson Correlation 1
Sig. (2-tailed)
Tra2 Pearson Correlation
.619** 1
Sig. (2-tailed) .000
Tra3 Pearson Correlation
.457** .360
** 1
Sig. (2-tailed) .000 .000
Tra4 Pearson Correlation
.281** .510
** .417
** 1
Sig. (2-tailed) .000 .000 .000
Tra5 Pearson Correlation
.596** .538
** .381
** .413
** 1
Sig. (2-tailed) .000 .000 .000 .000
Tra6 Pearson Correlation
.568** .544
** .362
** .372
** .628
** 1
Sig. (2-tailed) .000 .000 .000 .000 .000
Tra7 Pearson Correlation
.578** .582
** .382
** .345
** .666
** .546
** 1
Sig. (2-tailed) .000 .000 .000 .000 .000 .000
**. Correlation is significant at the 0.01 level (2-tailed).

171
Job Satisfaction Correlations
JS1 JS2 JS3 JS4 JS5 JS6 JS7
JS1 Pearson Correlation
1
Sig. (2-tailed)
JS2 Pearson Correlation
.706** 1
Sig. (2-tailed) .000
JS3 Pearson Correlation
.589** .731
** 1
Sig. (2-tailed) .000 .000
JS4 Pearson Correlation
.455** .446
** .444
** 1
Sig. (2-tailed) .000 .000 .000
JS5 Pearson Correlation
.471** .509
** .530
** .616
** 1
Sig. (2-tailed) .000 .000 .000 .000
JS6 Pearson Correlation
.474** .501
** .595
** .516
** .706
** 1
Sig. (2-tailed) .000 .000 .000 .000 .000
JS7 Pearson Correlation
-.055 -.090 -.153* -.083 -.067 -.109 1
Sig. (2-tailed) .352 .129 .010 .162 .262 .068
**. Correlation is significant at the 0.01 level (2-tailed).
*. Correlation is significant at the 0.05 level (2-tailed).
Organization Commitment Correlations
OC1 OC2 OC3 OC4 OC5 OC6
OC1 Pearson Correlation 1
Sig. (2-tailed)
OC2 Pearson Correlation .401
** 1
Sig. (2-tailed) .000
OC3 Pearson Correlation .431
** .631
** 1
Sig. (2-tailed) .000 .000
OC4 Pearson Correlation .240
** .518
** .477
** 1
Sig. (2-tailed) .000 .000 .000
OC5 Pearson Correlation .336
** .636
** .608
** .515
** 1
Sig. (2-tailed) .000 .000 .000 .000
OC6 Pearson Correlation .271
** .479
** .460
** .396
** .579
** 1
Sig. (2-tailed) .000 .000 .000 .000 .000
**. Correlation is significant at the 0.01 level (2-tailed).

172
Emotional Exhaustion Correlations
EX1 EX2 EX3 EX4 EX5 EX6 EX7
EX1 Pearson Correlation
1
Sig. (2-tailed)
EX2 Pearson Correlation
.574** 1
Sig. (2-tailed) .000
EX3 Pearson Correlation
.405** .474
** 1
Sig. (2-tailed) .000 .000
EX4 Pearson Correlation
.451** .443
** .664
** 1
Sig. (2-tailed) .000 .000 .000
EX5 Pearson Correlation
.361** .364
** .580
** .602
** 1
Sig. (2-tailed) .000 .000 .000 .000
EX6 Pearson Correlation
-.234** -.236
** -.163
** -.043 -.097 1
Sig. (2-tailed) .000 .000 .006 .470 .105
EX7 Pearson Correlation
.203** .228
** .301
** .305
** .304
** -.039 1
Sig. (2-tailed) .001 .000 .000 .000 .000 .517
**. Correlation is significant at the 0.01 level (2-tailed).
Turnover Intention Correlations
TI1 TI2 TI3 TI4
TI1 Pearson Correlation 1
Sig. (2-tailed)
TI2 Pearson Correlation .614
** 1
Sig. (2-tailed) .000
TI3 Pearson Correlation .576
** .543
** 1
Sig. (2-tailed) .000 .000
TI4 Pearson Correlation .449
** .392
** .389
** 1
Sig. (2-tailed) .000 .000 .000
**. Correlation is significant at the 0.01 level (2-tailed).

173
Safety Motivation Correlations
SM1 SM2 SM3 SM4 SM5 SM6
SM1 Pearson Correlation 1
Sig. (2-tailed)
SM2 Pearson Correlation .663
** 1
Sig. (2-tailed) .000
SM3 Pearson Correlation .561
** .695
** 1
Sig. (2-tailed) .000 .000
SM4 Pearson Correlation .316
** .266
** .349
** 1
Sig. (2-tailed) .000 .000 .000
SM5 Pearson Correlation .610
** .606
** .773
** .446
** 1
Sig. (2-tailed) .000 .000 .000 .000
SM6 Pearson Correlation .584
** .650
** .653
** .344
** .785
** 1
Sig. (2-tailed) .000 .000 .000 .000 .000
**. Correlation is significant at the 0.01 level (2-tailed).
Self-Report Unsafe behavior Correlations
SRU1 SRU2 SRU3 SRU4 SRU5 SRU6 SRU7
SRU1 Pearson Correlation 1
Sig. (2-tailed)
SRU2 Pearson Correlation
.059 1
Sig. (2-tailed) .322
SRU3 Pearson Correlation
.229** .511
** 1
Sig. (2-tailed) .000 .000
SRU4 Pearson Correlation
.276** .433
** .610
** 1
Sig. (2-tailed) .000 .000 .000
SRU5 Pearson Correlation
.143* .324
** .494
** .577
** 1
Sig. (2-tailed) .016 .000 .000 .000
SRU6 Pearson Correlation
.234** .267
** .295
** .244
** .281
** 1
Sig. (2-tailed) .000 .000 .000 .000 .000
SRU7 Pearson Correlation
.082 .553** .401
** .353
** .273
** .280
** 1
Sig. (2-tailed) .169 .000 .000 .000 .000 .000
**. Correlation is significant at the 0.01 level (2-tailed).
*. Correlation is significant at the 0.05 level (2-tailed).
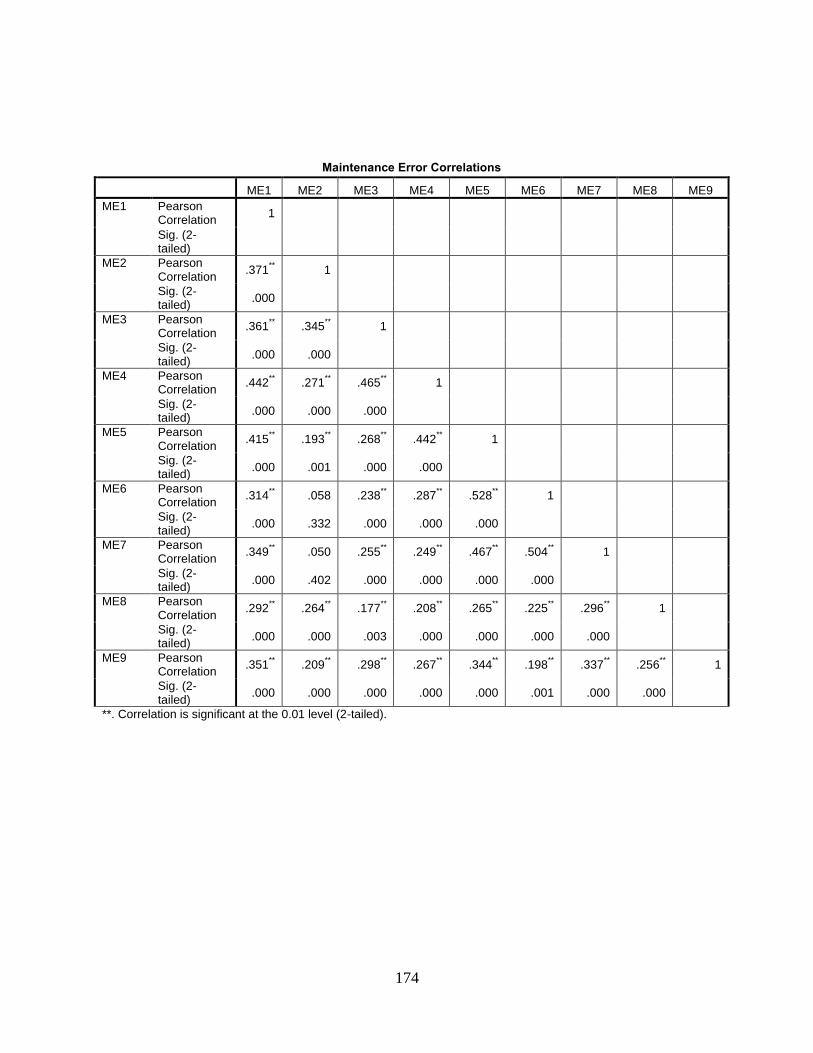
174
Maintenance Error Correlations
ME1 ME2 ME3 ME4 ME5 ME6 ME7 ME8 ME9
ME1 Pearson Correlation
1
Sig. (2-tailed)
ME2 Pearson Correlation
.371** 1
Sig. (2-tailed)
.000
ME3 Pearson Correlation
.361** .345
** 1
Sig. (2-tailed)
.000 .000
ME4 Pearson Correlation
.442** .271
** .465
** 1
Sig. (2-tailed)
.000 .000 .000
ME5 Pearson Correlation
.415** .193
** .268
** .442
** 1
Sig. (2-tailed)
.000 .001 .000 .000
ME6 Pearson Correlation
.314** .058 .238
** .287
** .528
** 1
Sig. (2-tailed)
.000 .332 .000 .000 .000
ME7 Pearson Correlation
.349** .050 .255
** .249
** .467
** .504
** 1
Sig. (2-tailed)
.000 .402 .000 .000 .000 .000
ME8 Pearson Correlation
.292** .264
** .177
** .208
** .265
** .225
** .296
** 1
Sig. (2-tailed)
.000 .000 .003 .000 .000 .000 .000
ME9 Pearson Correlation
.351** .209
** .298
** .267
** .344
** .198
** .337
** .256
** 1
Sig. (2-tailed)
.000 .000 .000 .000 .000 .001 .000 .000
**. Correlation is significant at the 0.01 level (2-tailed).

175
Violation Correlations
Vio1 Vio2 Vio3 Vio4 Vio5 Vio6 Vio7 Vio8 Vio9 Vio10 Vio11 Vio12
Vio1 Pearson Correlation
1
Sig. (2-tailed)
Vio2 Pearson Correlation
.175** 1
Sig. (2-tailed)
.003
Vio3 Pearson Correlation
.211** .503
** 1
Sig. (2-tailed)
.000 .000
Vio4 Pearson Correlation
.113 .455** .445
** 1
Sig. (2-tailed)
.057 .000 .000
Vio5 Pearson Correlation
.213** .445
** .396
** .525
** 1
Sig. (2-tailed)
.000 .000 .000 .000
Vio6 Pearson Correlation
.151* .338
** .364
** .573
** .552
** 1
Sig. (2-tailed)
.011 .000 .000 .000 .000
Vio7 Pearson Correlation
.149* .324
** .351
** .363
** .502
** .503
** 1
Sig. (2-tailed)
.012 .000 .000 .000 .000 .000
Vio8 Pearson Correlation
.115 .400** .362
** .467
** .475
** .435
** .532
** 1
Sig. (2-tailed)
.053 .000 .000 .000 .000 .000 .000
Vio9 Pearson Correlation
.140* .361
** .401
** .411
** .393
** .373
** .326
** .526
** 1
Sig. (2-tailed)
.018 .000 .000 .000 .000 .000 .000 .000
Vio10 Pearson Correlation
.153** .347
** .297
** .385
** .518
** .419
** .357
** .359
** .416
** 1
Sig. (2-tailed)
.010 .000 .000 .000 .000 .000 .000 .000 .000
Vio11 Pearson Correlation
.088 .230** .260
** .360
** .379
** .431
** .274
** .410
** .426
** .357
** 1
Sig. (2-tailed)
.140 .000 .000 .000 .000 .000 .000 .000 .000 .000
Vio12 Pearson Correlation
.155** .297
** .279
** .393
** .414
** .343
** .250
** .339
** .432
** .435
** .578
** 1
Sig. (2-tailed)
.009 .000 .000 .000 .000 .000 .000 .000 .000 .000 .000
**. Correlation is significant at the 0.01 level (2-tailed). *. Correlation is significant at the 0.05 level (2-tailed).

176
APPENDIX D: EFA RESULTS
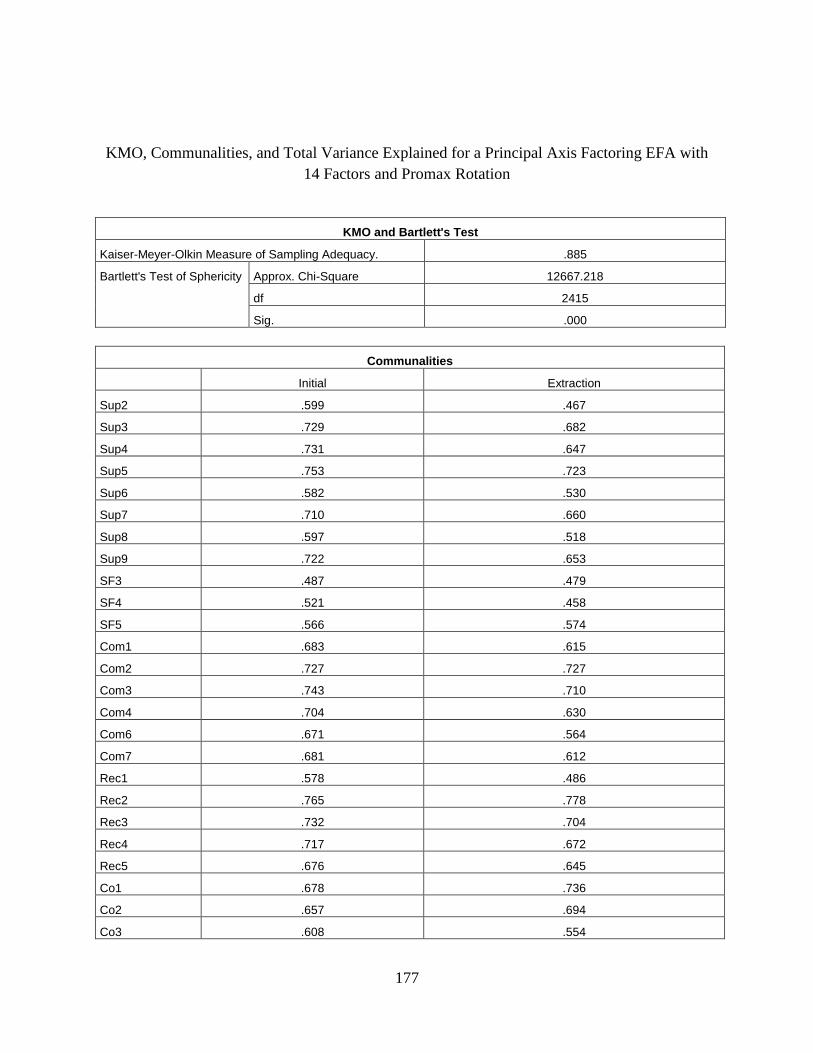
177
KMO, Communalities, and Total Variance Explained for a Principal Axis Factoring EFA with
14 Factors and Promax Rotation
KMO and Bartlett's Test
Kaiser-Meyer-Olkin Measure of Sampling Adequacy. .885
Bartlett's Test of Sphericity Approx. Chi-Square 12667.218
df 2415
Sig. .000
Communalities
Initial Extraction
Sup2 .599 .467
Sup3 .729 .682
Sup4 .731 .647
Sup5 .753 .723
Sup6 .582 .530
Sup7 .710 .660
Sup8 .597 .518
Sup9 .722 .653
SF3 .487 .479
SF4 .521 .458
SF5 .566 .574
Com1 .683 .615
Com2 .727 .727
Com3 .743 .710
Com4 .704 .630
Com6 .671 .564
Com7 .681 .612
Rec1 .578 .486
Rec2 .765 .778
Rec3 .732 .704
Rec4 .717 .672
Rec5 .676 .645
Co1 .678 .736
Co2 .657 .694
Co3 .608 .554

178
Tra1 .646 .550
Tra5 .699 .701
Tra6 .699 .645
Tra7 .721 .675
JS1 .682 .609
JS2 .764 .680
JS3 .723 .683
JS4 .598 .543
JS5 .736 .655
JS6 .695 .641
OC2 .723 .656
OC3 .698 .610
OC4 .649 .520
OC5 .739 .665
EX1 .561 .481
EX2 .610 .568
EX3 .650 .618
EX4 .685 .643
EX5 .660 .630
TI1 .690 .651
TI2 .639 .634
TI3 .581 .586
SM1 .653 .566
SM2 .720 .678
SM3 .796 .746
SM5 .822 .768
SM6 .745 .688
SRU3 .580 .575
SRU4 .661 .719
SRU5 .555 .461
ME1 .596 .503
ME3 .514 .326
ME4 .579 .516
ME5 .614 .606
ME6 .537 .500
ME7 .525 .420
Vio2 .544 .435

179
Vio3 .574 .525
Vio4 .581 .530
Vio5 .667 .611
Vio6 .632 .564
Vio7 .638 .535
Vio8 .695 .597
Vio9 .583 .431
Vio10 .480 .432
Extraction Method: Principal Axis Factoring.
Total Variance Explained
Factor
Initial Eigenvalues Extraction Sums of Squared Loadings
Rotation Sums
of Squared
Loadingsa
Total % of Variance Cumulative % Total % of Variance Cumulative % Total
1 17.357 24.796 24.796 16.981 24.259 24.259 11.292
2 5.695 8.136 32.932 5.270 7.528 31.787 10.567
3 3.894 5.563 38.495 3.524 5.035 36.822 9.221
4 3.474 4.963 43.459 3.107 4.438 41.260 6.671
5 2.328 3.326 46.785 1.948 2.783 44.043 4.790
6 2.228 3.183 49.968 1.868 2.669 46.712 9.322
7 2.082 2.975 52.943 1.629 2.327 49.039 6.720
8 1.955 2.792 55.735 1.549 2.213 51.251 4.593
9 1.844 2.635 58.370 1.434 2.049 53.300 6.868
10 1.615 2.307 60.677 1.217 1.739 55.039 3.724
11 1.518 2.169 62.846 1.072 1.531 56.570 6.731
12 1.253 1.790 64.636 .864 1.234 57.805 4.978
13 1.119 1.598 66.234 .754 1.077 58.882 10.277
14 1.097 1.568 67.801 .676 .965 59.847 7.679
15 .985 1.407 69.209
16 .888 1.269 70.478
17 .881 1.259 71.737
18 .841 1.202 72.938
19 .819 1.170 74.108
20 .803 1.148 75.256
21 .734 1.048 76.304
22 .680 .971 77.275
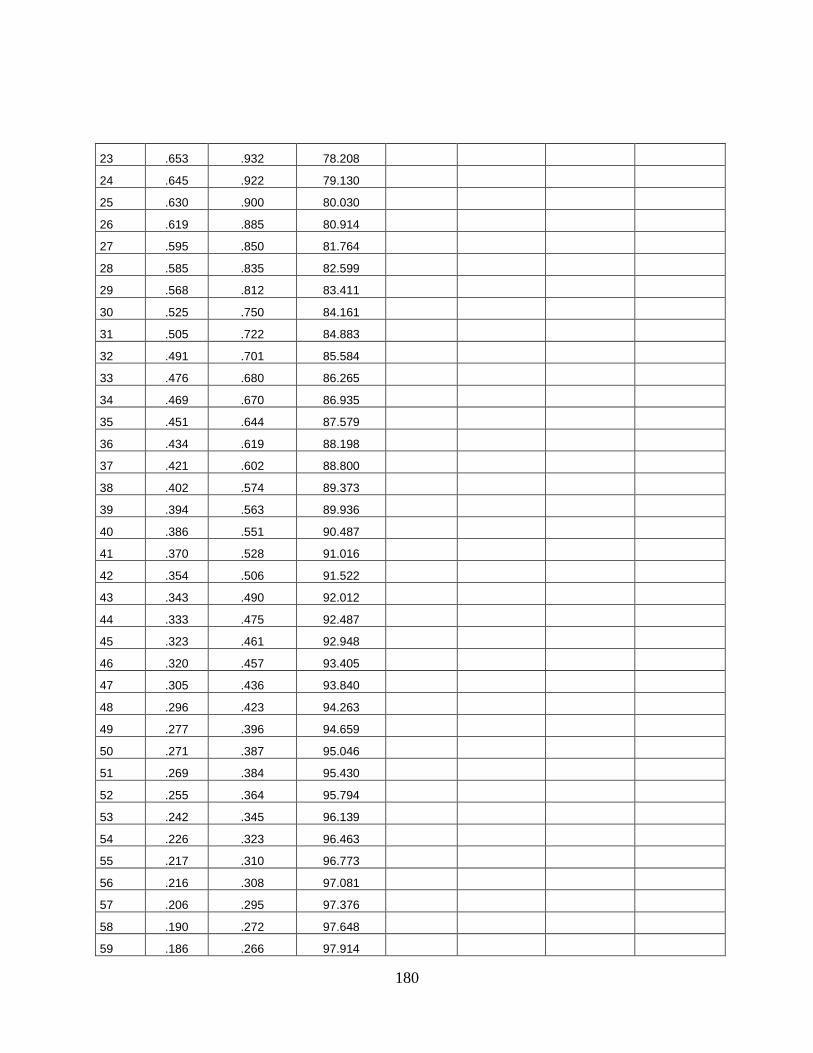
180
23 .653 .932 78.208
24 .645 .922 79.130
25 .630 .900 80.030
26 .619 .885 80.914
27 .595 .850 81.764
28 .585 .835 82.599
29 .568 .812 83.411
30 .525 .750 84.161
31 .505 .722 84.883
32 .491 .701 85.584
33 .476 .680 86.265
34 .469 .670 86.935
35 .451 .644 87.579
36 .434 .619 88.198
37 .421 .602 88.800
38 .402 .574 89.373
39 .394 .563 89.936
40 .386 .551 90.487
41 .370 .528 91.016
42 .354 .506 91.522
43 .343 .490 92.012
44 .333 .475 92.487
45 .323 .461 92.948
46 .320 .457 93.405
47 .305 .436 93.840
48 .296 .423 94.263
49 .277 .396 94.659
50 .271 .387 95.046
51 .269 .384 95.430
52 .255 .364 95.794
53 .242 .345 96.139
54 .226 .323 96.463
55 .217 .310 96.773
56 .216 .308 97.081
57 .206 .295 97.376
58 .190 .272 97.648
59 .186 .266 97.914

181
60 .179 .256 98.170
61 .169 .242 98.412
62 .153 .219 98.631
63 .149 .213 98.844
64 .140 .200 99.044
65 .133 .190 99.234
66 .124 .177 99.411
67 .117 .167 99.578
68 .113 .162 99.740
69 .103 .147 99.887
70 .079 .113 100.000
Extraction Method: Principal Axis Factoring.
a. When factors are correlated, sums of squared loadings cannot be added to obtain a total variance.
Methods of Factor Extraction
ML (Promax)
ML (Varimax)
PC (Promax)
PC (Varimax)
PAF (Promax)
PAF (Varimax)
Kaiser-Meyer-Olkin Measure of Sampling Adequacy
0.887 0.875 0.881 0.874 0.885 0.878
All communalities are above 0.35 0.35 0.35 0.35 0.35 0.35
Total variance explained cumulative % 60.813 59.645 68.669 68.115 59.847 59.672
Number of Factors 14 12 13 12 14 12
Nonredundant residuals with absolute values > 0.05
3.00% 3.00% 8.00% 9.00% 3.00% 3.00%
Number of Variables 69 61 66 62 70 63

182
APPENDIX E: CFA RESULTS
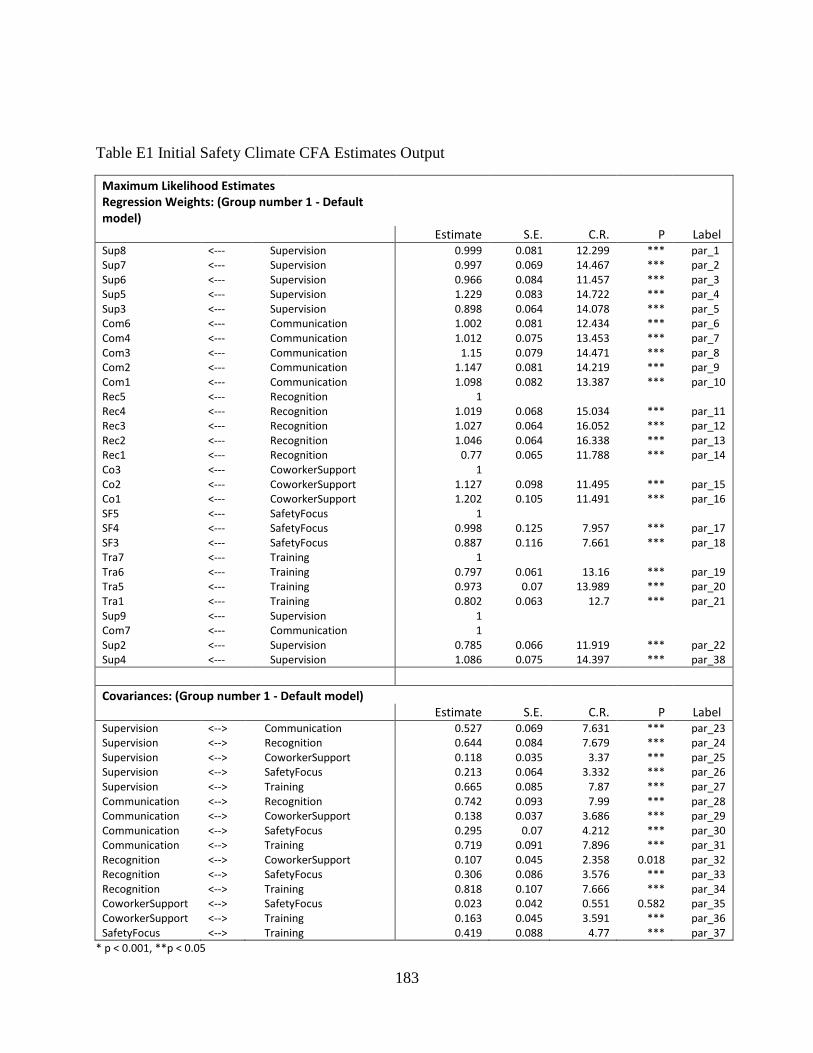
183
Table E1 Initial Safety Climate CFA Estimates Output
Maximum Likelihood Estimates Regression Weights: (Group number 1 - Default model)
Estimate S.E. C.R. P Label Sup8 <--- Supervision 0.999 0.081 12.299 *** par_1 Sup7 <--- Supervision 0.997 0.069 14.467 *** par_2 Sup6 <--- Supervision 0.966 0.084 11.457 *** par_3 Sup5 <--- Supervision 1.229 0.083 14.722 *** par_4 Sup3 <--- Supervision 0.898 0.064 14.078 *** par_5 Com6 <--- Communication 1.002 0.081 12.434 *** par_6 Com4 <--- Communication 1.012 0.075 13.453 *** par_7 Com3 <--- Communication 1.15 0.079 14.471 *** par_8 Com2 <--- Communication 1.147 0.081 14.219 *** par_9 Com1 <--- Communication 1.098 0.082 13.387 *** par_10 Rec5 <--- Recognition 1
Rec4 <--- Recognition 1.019 0.068 15.034 *** par_11 Rec3 <--- Recognition 1.027 0.064 16.052 *** par_12 Rec2 <--- Recognition 1.046 0.064 16.338 *** par_13 Rec1 <--- Recognition 0.77 0.065 11.788 *** par_14 Co3 <--- CoworkerSupport 1
Co2 <--- CoworkerSupport 1.127 0.098 11.495 *** par_15 Co1 <--- CoworkerSupport 1.202 0.105 11.491 *** par_16 SF5 <--- SafetyFocus 1
SF4 <--- SafetyFocus 0.998 0.125 7.957 *** par_17 SF3 <--- SafetyFocus 0.887 0.116 7.661 *** par_18 Tra7 <--- Training 1
Tra6 <--- Training 0.797 0.061 13.16 *** par_19 Tra5 <--- Training 0.973 0.07 13.989 *** par_20 Tra1 <--- Training 0.802 0.063 12.7 *** par_21 Sup9 <--- Supervision 1
Com7 <--- Communication 1
Sup2 <--- Supervision 0.785 0.066 11.919 *** par_22 Sup4 <--- Supervision 1.086 0.075 14.397 *** par_38
Covariances: (Group number 1 - Default model)
Estimate S.E. C.R. P Label Supervision <--> Communication 0.527 0.069 7.631 *** par_23 Supervision <--> Recognition 0.644 0.084 7.679 *** par_24 Supervision <--> CoworkerSupport 0.118 0.035 3.37 *** par_25 Supervision <--> SafetyFocus 0.213 0.064 3.332 *** par_26 Supervision <--> Training 0.665 0.085 7.87 *** par_27 Communication <--> Recognition 0.742 0.093 7.99 *** par_28 Communication <--> CoworkerSupport 0.138 0.037 3.686 *** par_29 Communication <--> SafetyFocus 0.295 0.07 4.212 *** par_30 Communication <--> Training 0.719 0.091 7.896 *** par_31 Recognition <--> CoworkerSupport 0.107 0.045 2.358 0.018 par_32 Recognition <--> SafetyFocus 0.306 0.086 3.576 *** par_33 Recognition <--> Training 0.818 0.107 7.666 *** par_34 CoworkerSupport <--> SafetyFocus 0.023 0.042 0.551 0.582 par_35 CoworkerSupport <--> Training 0.163 0.045 3.591 *** par_36 SafetyFocus <--> Training 0.419 0.088 4.77 *** par_37
* р < 0.001, **р < 0.05
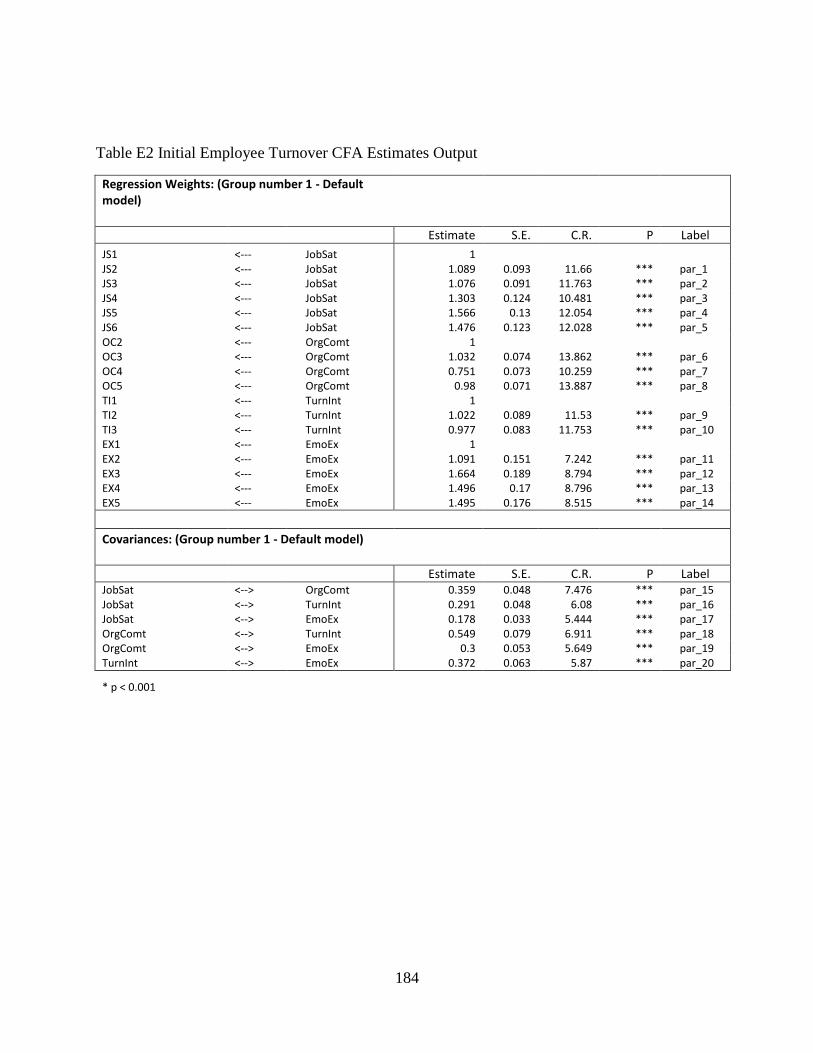
184
Table E2 Initial Employee Turnover CFA Estimates Output
Regression Weights: (Group number 1 - Default model)
Estimate S.E. C.R. P Label
JS1 <--- JobSat 1
JS2 <--- JobSat 1.089 0.093 11.66 *** par_1 JS3 <--- JobSat 1.076 0.091 11.763 *** par_2 JS4 <--- JobSat 1.303 0.124 10.481 *** par_3 JS5 <--- JobSat 1.566 0.13 12.054 *** par_4 JS6 <--- JobSat 1.476 0.123 12.028 *** par_5 OC2 <--- OrgComt 1
OC3 <--- OrgComt 1.032 0.074 13.862 *** par_6 OC4 <--- OrgComt 0.751 0.073 10.259 *** par_7 OC5 <--- OrgComt 0.98 0.071 13.887 *** par_8 TI1 <--- TurnInt 1
TI2 <--- TurnInt 1.022 0.089 11.53 *** par_9 TI3 <--- TurnInt 0.977 0.083 11.753 *** par_10 EX1 <--- EmoEx 1
EX2 <--- EmoEx 1.091 0.151 7.242 *** par_11 EX3 <--- EmoEx 1.664 0.189 8.794 *** par_12 EX4 <--- EmoEx 1.496 0.17 8.796 *** par_13 EX5 <--- EmoEx 1.495 0.176 8.515 *** par_14
Covariances: (Group number 1 - Default model)
Estimate S.E. C.R. P Label JobSat <--> OrgComt 0.359 0.048 7.476 *** par_15 JobSat <--> TurnInt 0.291 0.048 6.08 *** par_16 JobSat <--> EmoEx 0.178 0.033 5.444 *** par_17 OrgComt <--> TurnInt 0.549 0.079 6.911 *** par_18 OrgComt <--> EmoEx 0.3 0.053 5.649 *** par_19 TurnInt <--> EmoEx 0.372 0.063 5.87 *** par_20
* р < 0.001
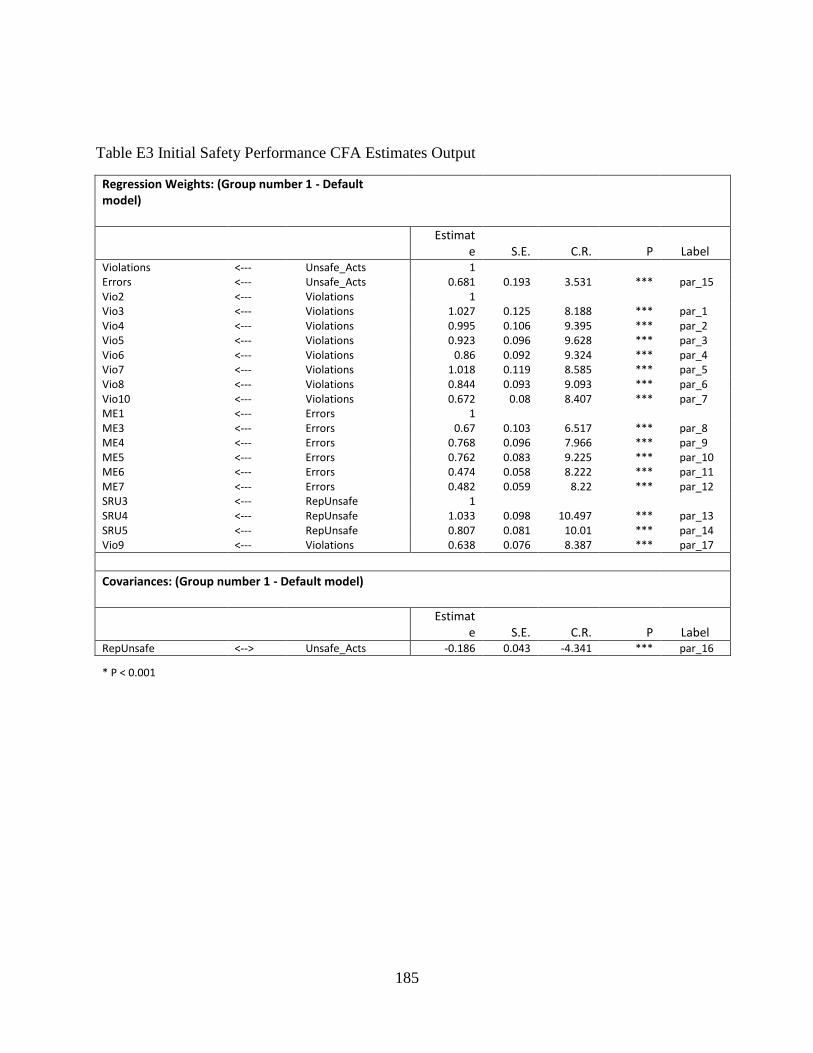
185
Table E3 Initial Safety Performance CFA Estimates Output
Regression Weights: (Group number 1 - Default model)
Estimat
e S.E. C.R. P Label Violations <--- Unsafe_Acts 1
Errors <--- Unsafe_Acts 0.681 0.193 3.531 *** par_15 Vio2 <--- Violations 1
Vio3 <--- Violations 1.027 0.125 8.188 *** par_1 Vio4 <--- Violations 0.995 0.106 9.395 *** par_2 Vio5 <--- Violations 0.923 0.096 9.628 *** par_3 Vio6 <--- Violations 0.86 0.092 9.324 *** par_4 Vio7 <--- Violations 1.018 0.119 8.585 *** par_5 Vio8 <--- Violations 0.844 0.093 9.093 *** par_6 Vio10 <--- Violations 0.672 0.08 8.407 *** par_7 ME1 <--- Errors 1
ME3 <--- Errors 0.67 0.103 6.517 *** par_8 ME4 <--- Errors 0.768 0.096 7.966 *** par_9 ME5 <--- Errors 0.762 0.083 9.225 *** par_10 ME6 <--- Errors 0.474 0.058 8.222 *** par_11 ME7 <--- Errors 0.482 0.059 8.22 *** par_12 SRU3 <--- RepUnsafe 1
SRU4 <--- RepUnsafe 1.033 0.098 10.497 *** par_13 SRU5 <--- RepUnsafe 0.807 0.081 10.01 *** par_14 Vio9 <--- Violations 0.638 0.076 8.387 *** par_17
Covariances: (Group number 1 - Default model)
Estimat
e S.E. C.R. P Label RepUnsafe <--> Unsafe_Acts -0.186 0.043 -4.341 *** par_16
* P < 0.001

186
APPENDIX F: ASSESSMENT OF NORMALITY

187
Table F1 Output Assessment of Normality for Safety Climate CFA Model
c.r. = critical ratio
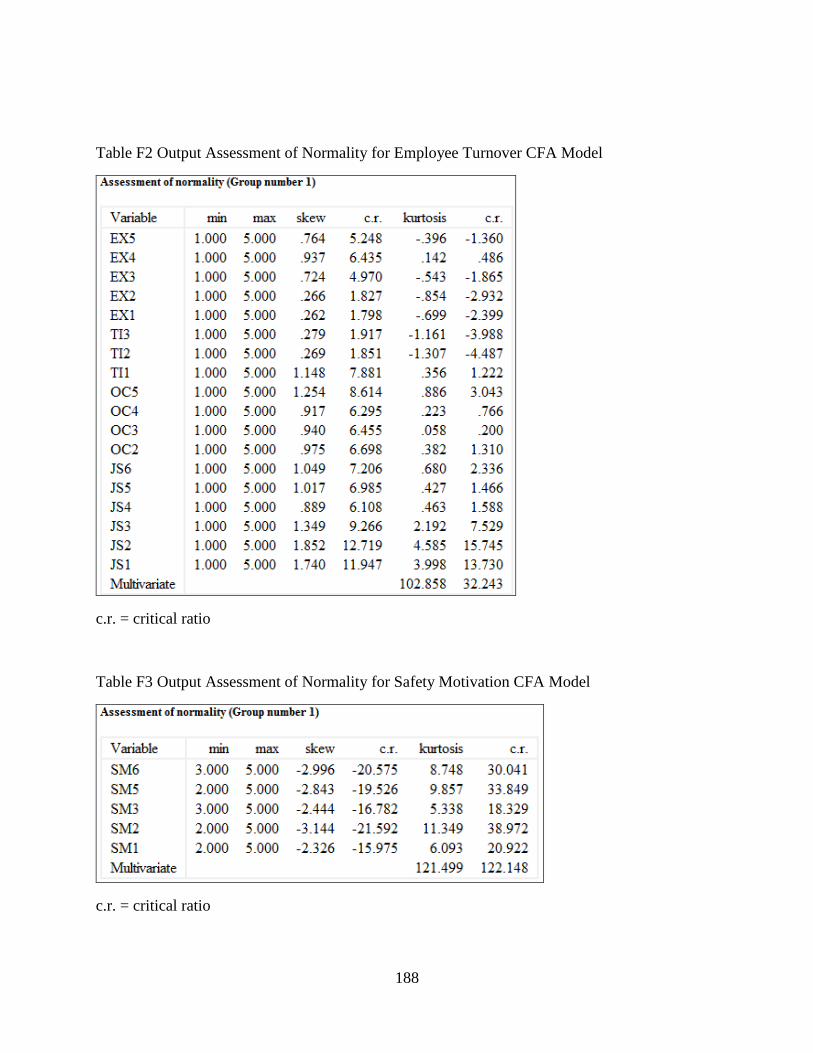
188
Table F2 Output Assessment of Normality for Employee Turnover CFA Model
c.r. = critical ratio
Table F3 Output Assessment of Normality for Safety Motivation CFA Model
c.r. = critical ratio

189
Table F4 Output Assessment of Normality for Safety Performance CFA Model
c.r. = critical ratio

190
LIST OF REFERENCES
Abrams, D., Ando, K., & Hinkle, S. (1998). Psychological Attachment to the Group: Cross-
Cultural Differences in Organizational Identification and Subjective Norms as Predictors
of Workers’ Turnover Intentions. Personality and Social Psychology Bulletin, 24(10),
1027–1039.
Aju kumar V. N., & Gandhi, O. P. (2011). Quantification of human error in maintenance using
graph theory and matrix approach. Quality and Reliability Engineering International,
27(8), 1145–1172.
Allen, D. G., Bryant, P. C., & Vardaman, J. M. (2010). Retaining Talent: Replacing
Misconceptions With Evidence-Based Strategies. Academy of Management Perspectives,
24(2), 48–64.
Arbuckle, J. L. (2011). IBM SPSS Amos 20 user’s guide. Retrieved from Amos Development
Corporation, SPSS Inc.
Aviation Safety Network. (2002). Aircraft accident McDonnell Douglas MD-83 N963AS
Anacapa Island, CA. Retrieved April 1, 2013, from aviation safety network database:
<http://aviation-safety.net/database/record.php?id=20000131-0>.
Baba, V. V., Tourigny, L., Wang, X., & Liu, W. (2009). Proactive personality and work
performance in China: The moderating effects of emotional exhaustion and perceived
safety climate. Canadian Journal of Administrative Sciences / Revue Canadienne Des
Sciences de l’Administration, 26(1), 23–37.

191
Babin, B. J., & Boles, J. S. (1996). The effects of perceived co-worker involvement and
supervisor support on service provider role stress, performance and job satisfaction.
Journal of Retailing, 72(1), 57–75.
Bagozzi, R. P., & Yi, Y. (2012). Specification, evaluation, and interpretation of structural
equation models. Journal of the Academy of Marketing Science, 40(1), 8–34.
Barbaranelli, C., Petitta, L., & Probst, T. M. (2015). Does safety climate predict safety
performance in Italy and the USA? Cross-cultural validation of a theoretical model of
safety climate. Accident Analysis and Prevention, 77, 35–44.
Bentler, P. M. (1990). Comparative fit indexes in structural models. Psychological Bulletin,
107(2), 238–246.
Blunch, N. J. (2013). Introduction to structural equation modeling using IBM SPSS statistics and
AMOS (2d ed.). London: SAGE Publications Ltd.
Bollen, K. A. (1990). Overall fit in covariance structure models: Two types of sample size
effects. Psychological Bulletin, 107(2), 256–259.
Bosak, J., Coetsee, W. J., & Cullinane, S.-J. (2013). Safety Climate Dimensions as Predictors for
Risk Behavior. Accident Analysis & Prevention.
Breckler, S. J. (1990). Applications of covariance structure modeling in psychology: Cause for
concern? Psychological Bulletin, 107(2), 260–273.
Breslin, F. C., & Smith, P. (2005). Age-related differences in work injuries: A multivariate,
population-based study. American Journal of Industrial Medicine, 48(1), 50–56.

192
Brown, R. L., & Holmes, H. (1986). The Use of a Factor-Analytic Procedure for Assessing the
Validity of an Employee Safety Climate Model. Accident Analysis and Prevention, 18(6),
455–470.
Brown, T. A. (2006). Confirmatory factor analysis for applied research. New York: Guilford
Press.
Burke, M. J., Sarpy, S. A., Tesluk, P. E., & Smith-Crowe, K. (2002). General Safety
Performance: A Test of a Grounded Theoretical Model. Personnel Psychology, 55(2),
429–457.
Byrne, B. M. (2006). Structural equation modeling with EQS: basic concepts, applications, and
programming (2nd ed). Mahwah, N.J: Lawrence Erlbaum Associates.
Byrne, B. M. (2010). Structural Equation Modeling with AMOS : Basic Concepts, Applications,
and Programming. Mahwah, N.J.: Lawrence Erlbaum Associates.
Campbell, J. P. (1990). Modeling the performance prediction problem in industrial and
organizational psychology. In M. D. Dunnette & L. M. Hough, Handbook of industrial
and organizational psychology (2nd ed., Vol. 1, pp. 687–732). Palo Alto, CA: Consulting
Psychologists Press.
Chang, Y.-H., & Wang, Y.-C. (2010). Significant human risk factors in aircraft maintenance
technicians. Safety Science, 48(1), 54–62.
Chen, C.-F., & Chen, S.-C. (2014). Measuring the effects of Safety Management System
practices, morality leadership and self-efficacy on pilots’ safety behaviors: Safety
motivation as a mediator. Safety Science, 62, 376–385.

193
Cheyne, A., Cox, S., Oliver, A., & Tomás, J. M. (1998). Modelling safety climate in the
prediction of levels of safety activity. Work & Stress, 12(3), 255–271.
Christian, M. S., Bradley, J. C., Wallace, J. C., & Burke, M. J. (2009). Workplace safety: A
meta-analysis of the roles of person and situation factors. Journal of Applied Psychology,
94(5), 1103–1127.
Clarke, S. (1996). The effect of habit as a behavioural response in risk reduction programmes.
Safety Science, 22(1–3), 163–175.
Clarke, S. (1998). Organizational factors affecting the incident reporting of train drivers. Work
and Stress, 12(1), 6–16.
Clarke, S. (1999). Perceptions of organizational safety: implications for the development of
safety culture. Journal of Organizational Behavior, 20(2), 185–198.
Clarke, S. (2006). Safety climate in an automobile manufacturing plant: The effects of work
environment, job communication and safety attitudes on accidents and unsafe behaviour.
Personnel Review, 35(4), 413–430.
Clarke, S. (2010). An integrative model of safety climate: Linking psychological climate and
work attitudes to individual safety outcomes using meta-analysis. Journal of
Occupational and Organizational Psychology, 83(3), 553–578.
Collings, J. A., & Murray, P. J. (1996). Predictors of Stress Amongst Social Workers: An
Empirical Study. British Journal of Social Work, 26(3), 375–387.
Cordes, C. L., & Dougherty, T. W. (1993). A Review and an Integration of Research on Job
Burnout. The Academy of Management Review, 18(4), 621–656.

194
Cortina, J. M. (1993). What is coefficient alpha? An examination of theory and applications.
Journal of Applied Psychology, 78(1), 98–104.
Cotton, J. L., & Tuttle, J. M. (1986). Employee Turnover: A Meta-Analysis and Review with
Implications for Research. Academy of Management Review, 11(1), 55–70.
Dambier, M., & Hinkelbein, J. (2006). Analysis of 2004 German general aviation aircraft
accidents according to the HFACS model. Air Medical Journal, 25(6), 265–269.
Dedobbeleer, N., & Béland, F. (1991). Reprint of “a safety climate measure for construction
sites.” Journal of Safety Research, 22, 97–103.
Degani, A., & Wiener, E. L. (1994). Philosophy, Policies, Procedures and Practices: The Four
“P”s of Flight Deck Operations. In Aviation Psychology in Practice. Brookfield, VT:
Ashgate.
DeJoy, D. M., Schaffer, B. S., Wilson, M. G., Vandenberg, R. J., & Butts, M. M. (2004).
Creating safer workplaces: assessing the determinants and role of safety climate. Journal
of Safety Research, 35(1), 81–90.
Denison, D. R. (1996). What Is the Difference Between Organizational Culture and
Organizational Climate? A Native’s Point of View on a Decade of Paradigm Wars.
Academy of Management Review, 21(3), 619–654.
Dess, G. G., & Shaw, J. D. (2001). Voluntary Turnover, Social Capital, and Organizational
Performance. Academy of Management Review, 26(3), 446–456.
Drury, C. G. (2001). Human Factors in Aircraft Maintenance. State university of New York at
Buffalo department of industrial engineering.

195
Edwards, E. (1988). Introductory Overview. In E. Wiener & D. Nagel, Human Factors in
Aviation (pp. 3–25). San Diego, CA: Academic Press.
Endsley, M. R., & Robertson, M. M. (2000). Situation awareness in aircraft maintenance teams.
International Journal of Industrial Ergonomics, 26, 301–325.
Fabrigar, L. R., & Wegener, D. T. (2012). Exploratory factor analysis. Oxford ; New York:
Oxford University Press.
Fabrigar, L. R., Wegener, D. T., MacCallum, R. C., & Strahan, E. J. (1999). Evaluating the use
of exploratory factor analysis in psychological research. Psychological Methods, 4(3),
272–299.
Fang, D., Chen, Y., & Wong, L. (2006). Safety Climate in Construction Industry: A Case Study
in Hong Kong. Journal of Construction Engineering & Management, 132(6), 573–584.
Feldt, T., Kinnunen, U., & Mauno, S. (2000). A mediational model of sense of coherence in the
work context: a one-year follow-up study. Journal of Organizational Behavior, 21(4),
461–476.
Firth, H., & Britton, P. (1989). “Burnout”, absence and turnover amongst British nursing staff.
Journal of Occupational Psychology, 62(1), 55–59.
Fishbein, M., & Ajzen, I. (1975). Belief, attitude, intention, and behavior: an introduction to
theory and research. Reading, MA: Addison-Wesley.
Flin, R., Mearns, K., O’Connor, P., & Bryden, R. (2000). Measuring safety climate: identifying
the common features. Safety Science, 34(1–3), 177–192.

196
Fogarty, G. J. (2003). Errors, Violations, and Reporting Behaviour in Aviation Maintenance.
Proceedings of the 12th International Symposium on Aviation Psychology, April 14-17,
Dayton, Ohio, USA.
Fogarty, G. J. (2004). The role of organizational and individual variables in aircraft maintenance
performance. International Journal of Applied Aviation Studies, 4(1), 73–90.
Fogarty, G. J. (2005). Psychological strain mediates the impact of safety climate on maintenance
errors. International Journal of Applied Aviation Studies, 5(1), 53–64.
Fogarty, G. J., & Buikstra, E. (2008). A test of direct and indirect pathways linking safety
climate, psychological health, and unsafe behaviours. International Journal of Applied
Aviation Studies, 8(2), 199–210.
Fogarty, G. J., & Shaw, A. (2010). Safety climate and the Theory of Planned Behavior: Towards
the prediction of unsafe behavior. Accident Analysis & Prevention, 42(5), 1455–1459.
Fornell, C., & Larcker, D. F. (1981a). Evaluating Structural Equation Models with Unobservable
Variables and Measurement Error. Journal of Marketing Research, 18(1), 39–50.
Fornell, C., & Larcker, D. F. (1981b). Structural Equation Models With Unobservable Variables
and Measurement Error: Algebra and Statistics. Journal of Marketing Research, 18(3),
382–388.
Gaines, J., & Jermier, J. M. (1983). Emotional Exhaustion in a High Stress Organization. The
Academy of Management Journal, 26(4), 567–586.
Gaur, D. (2005). Human factors analysis and classification system applied to civil aircraft
accidents in India. Aviation Space and Environmental Medicine, 76(5), 501–505.

197
George, J. M., & Jones, G. R. (1996). The Experience of Work and Turnover Intentions:
Interactive Effects of Value Attainment, Job Satisfaction, and Positive Mood. Journal of
Applied Psychology, 81(3), 318–325.
Gibbons, A. M., von Thaden, T. L., & Wiegmann, D. A. (2005). Development of a Commercial
Aviation Safety Culture Survey for Maintenance Operations (No. Tech. Report AHFD-
05-06/FAA-05-02). Federal Aviation Administration, Atlantic City International Airport,
NJ.
Glendon, A. I., & Stanton, N. A. (2000). Perspectives on safety culture. Safety Science, 34(1–3),
193–214.
Goldman, S. M., Fiedler, E. R., & King, R. E. (2002). General Aviation Maintenance-Related
Accidents: A Review of Ten Years of NTSB Data.
Gorsuch, R. L. (1997). Exploratory Factor Analysis: Its Role in Item Analysis. Journal of
Personality Assessment, 68(3), 532–560.
Griffeth, R. W., Hom, P. W., & Gaertner, S. (2000, June). A Meta-Analysis of Antecedents and
Correlates of Employee Turnover: Update, Moderator Tests, and Research Implications
for the Next Millennium. Journal of Management, 26(3), 463.
Griffin, M. A., & Neal, A. (2000). Perceptions of safety at work: A framework for linking safety
climate to safety performance, knowledge, and motivation. Journal of Occupational
Health Psychology, 5(3), 347–358.
Guldenmund, F. (2000). The nature of safety culture: a review of theory and research. Safety
Science, 34(1–3), 215–257.

198
Guldenmund, F. W. (2007). The use of questionnaires in safety culture research – an evaluation.
Safety Science, 45(6), 723–743.
Gyekye, S., & Salminen, S. (2009). Educational status and organizational safety climate: Does
educational attainment influence workers’ perceptions of workplace safety? Safety
Science, 47(1), 20–28.
Hair, J. F., Anderson, R. E., Tatham, R. L., & Black, W. (1998). Multivariate data analysis (5th
ed.). Upper Saddle River, N.J.: Prentice Hall.
Hancock, J. I., Allen, D. G., Bosco, F. A., McDaniel, K. R., & Pierce, C. A. (2013). Meta-
analytic review of employee turnover as a predictor of firm performance. Journal of
Management, (3), 573.
Harrington, D. (2009). Confirmatory factor analysis. Oxford; New York: Oxford University
Press.
Henson, R. K., & Roberts, J. K. (2006). Use of Exploratory Factor Analysis in Published
Research Common Errors and Some Comment on Improved Practice. Educational and
Psychological Measurement, 66(3), 393–416.
Herzberg, F., Mausner, B., & Snyderman, B. B. (1959). The motivation to work (2d ed). New
York: Wiley.
Hobbs, A., & Kanki, B. G. (2008). Patterns of Error in Confidential Maintenance Incident
Reports. International Journal of Aviation Psychology, 18(1), 5–16.
Hobbs, A., & Williamson, A. (2002). Unsafe acts and unsafe outcomes in aircraft maintenance.
Ergonomics, 45(12), 866–882.

199
Hobbs, A., & Williamson, A. (2003). Associations between Errors and Contributing Factors in
Aircraft Maintenance. Human Factors: The Journal of the Human Factors and
Ergonomics Society, 45(2), 186–201.
Hofmann, D. A., & Stetzer, A. (1996a). A Cross-Level Investigation of Factors Influencing
Unsafe Behaviors and Accidents. Personnel Psychology, 49(2), 307–339.
Hofmann, D. A., & Stetzer, A. (1996b). A Cross-Level Investigation of Factors Influencing
Unsafe Behaviors and Accidents. Personnel Psychology, 49(2), 307–339.
Hombrados-Mendieta, I., & Cosano-Rivas, F. (2013). Burnout, workplace support, job
satisfaction and life satisfaction among social workers in Spain: A structural equation
model. International Social Work, 56(2), 228–246.
Hooper, D., Coughlan, J., & Mullen, M. R. (2008). Structural Equation Modelling: Guidelines
for Determining Model Fit. Electronic Journal of Business Research Methods, 6(1), 53–
59.
Hu, L., & Bentler, P. M. (1998). Fit indices in covariance structure modeling: Sensitivity to
underparameterized model misspecification. Psychological Methods, 3(4), 424–453.
Hu, L., & Bentler, P. M. (1999). Cutoff criteria for fit indexes in covariance structure analysis:
Conventional criteria versus new alternatives. Structural Equation Modeling: A
Multidisciplinary Journal, 6(1), 1–55.
Hunter, J. E. (1986). Major contribution: Cognitive ability, cognitive aptitudes, job knowledge,
and job performance. Journal of Vocational Behavior, 29(3), 340–362.
200
Hurley, A. E., Scandura, T. A., Schriesheim, C. A., Brannick, M. T., Seers, A., Vandenberg, R.
J., & Williams, L. J. (1997). Exploratory and confirmatory factor analysis: guidelines,
issues, and alternatives. Journal of Organizational Behavior, 18(6), 667–683.
Iacobucci, D. (2010). Structural equations modeling: Fit Indices, sample size, and advanced
topics. Journal of Consumer Psychology, 20(1), 90–98.
IBM SPSS Amos documentation - United States. (2011, August 16).
[CT701,CT709,CT711,CT712,CT713,CT807,CT708]. Retrieved March 20, 2013, from
http://www-01.ibm.com/support/docview.wss?uid=swg27022011
Jackson, S. E., Schwab, R. L., & Schuler, R. S. (1986). Toward an understanding of the burnout
phenomenon. Journal of Applied Psychology, 71(4), 630–640.
John, O. P., & Benet-Martínez, V. (2000). Measurement: Reliability, construct validation, and
scale construction. In H. T. Reis & C. M. Judd (Eds.), Handbook of research methods in
social and personality psychology (pp. 339–369). New York, NY, US: Cambridge
University Press.
Johnson, J. J., & McIntye, C. L. (1998). Organizational culture and climate correlates of job
satisfaction. Psychological Reports, 82(3), 843–850.
Jones, A. P., & James, L. R. (1979). Psychological climate: Dimensions and relationships of
individual and aggregated work environment perceptions. Organizational Behavior and
Human Performance, 23(2), 201–250.
Kaiser, H. F. (1960). The Application of Electronic Computers to Factor Analysis. Educational
and Psychological Measurement, 20(1), 141–151.

201
Kim, H., & Stoner, M. (2008). Burnout and turnover intention among social workers: effects of
role stress, job autonomy and social support. Administration in Social Work, 32(3), 5–25.
Kline, R. B. (1998). Principles and practice of structural equation modeling. New York:
Guilford Press.
Knapik, J., Ang, P., Reynolds, K., & Jones, B. (1993). Physical fitness, age, and injury incidence
in infantry soldiers. Journal of Occupational Medicine, 35(6), 598.
Koeske, G. f. (1994). Some recommendations for improving measurement validation in social
work research. Journal of Social Service Research, 18(3/4), 43–73.
Kozlowski, S. W., & Doherty, M. L. (1989). Integration of climate and leadership: Examination
of a neglected issue. Journal of Applied Psychology, 74(4), 546–553.
Krulak, D. C. (2004). Human Factors in Maintenance: Impact on Aircraft Mishap Frequency and
Severity. Aviation, Space, and Environmental Medicine, 75(5), 429–432.
Laflamme, L. (1997). Age-Related Injuries among Male and Female Assembly Workers: A
Study in the Swedish Automobile Industry. Relations Industrielles / Industrial Relations,
52(3), 608–619.
Landis, R. S., Beal, D. J., & Tesluk, P. E. (2000). A comparison of approaches to forming
composite measures in structural equation models. Organizational Research Methods,
3(2), 186–207.
Larsson, S., Pousette, A., & Törner, M. (2008). Psychological climate and safety in the
construction industry-mediated influence on safety behaviour. Safety Science, 46(3), 405–
412.

202
Latorella, K. A., & Drury, C. G. (1992). A framwork for human reliability in aircraft inspection.
Presented at the Seventh Federal Aviation Administration Meeting on Human Factors
Issues in Aircraft Maintenance and Inspection, Atlanta, GA.
Latorella, K. A., & Prabhu, P. V. (2000). A review of human error in aviation maintenance and
inspection. International Journal of Industrial Ergonomics, 26(2), 133–161.
Laurence, D. (2005). Safety rules and regulations on mine sites – The problem and a solution.
Journal of Safety Research, 36(1), 39–50.
Lawton, R., & Parker, D. (1998). Individual differences in accident liability: A review and
integrative approach. Human Factors, 40(4), 655–671.
Layer, J. K., Karwowski, W., & Furr, A. (2009). The effect of cognitive demands and perceived
quality of work life on human performance in manufacturing environments. International
Journal of Industrial Ergonomics, 39(2), 413–421.
Li, W., & Harris, D. (2006). Pilot error and its relationship with higher organizational levels:
HFACS analysis of 523 accidents. Aviation Space and Environmental Medicine, 77(10),
1056–1061.
Maertz, C. P., & Campion, M. A. (1998). 25 Years of Voluntary Turnover Research: A Review
and Critique. In C. L. Cooper & I. T. Robertson (Eds.), International review of industrial
and organizational psychology, Vol. 13 (pp. 49–81). New York: Wiley.
Marais, K. B., & Robichaud, M. R. (2012). Analysis of trends in aviation maintenance risk: An
empirical approach. Reliability Engineering & System Safety, 106, 104–118.
Maruyama, G. (1998). Basics of structural equation modeling. Thousand Oaks, Calif: Sage
Publications.
203
Maslach, C., & Jackson, S. E. (1981). The Measurement of Experienced Burnout. Journal of
Occupational Behaviour, 2(2), 99–113.
Mathieu, J. E., & Zajac, D. M. (1990). A review and meta-analysis of the antecedents, correlates,
and consequences of organizational commitment. Psychological Bulletin, 108(2), 171–
194.
McDonald, N., Corrigan, S., Daly, C., & Cromie, S. (2000). Safety management systems and
safety culture in aircraft maintenance organisations. Safety Science, 34(1), 151–176.
McGregor, D. (1960). The human side of enterprise. New York: McGraw-Hill.
Meade, A. W., Johnson, E. C., & Braddy, P. W. (2008). Power and sensitivity of alternative fit
indices in tests of measurement invariance. Journal of Applied Psychology, 93(3), 568–
592.
Mearns, K., Whitaker, S. M., & Flin, R. (2001). Benchmarking Safety Climate in Hazardous
Environments: A Longitudinal, Interorganizational Approach. Risk Analysis, 21(4), 771–
786.
Mor Barak, M. E., Nissly, J. A., & Levin, A. (2001). Antecedents to Retention and Turnover
among Child Welfare, Social Work, and Other Human Service Employees: What Can We
Learn from Past Research? A Review and Metanalysis. Social Service Review, 75(4),
625–661.
Morrow, S. L., McGonagle, A. K., Dove-Steinkamp, M. L., Walker Jr., C. T., Marmet, M., &
Barnes-Farrell, J. L. (2010). Relationships between psychological safety climate facets
and safety behavior in the rail industry: A dominance analysis. Accident Analysis &
Prevention, 42(5), 1460–1467.
204
Neal, A., & Griffin, M. A. (2006). A study of the lagged relationships among safety climate,
safety motivation, safety behavior, and accidents at the individual and group levels.
Journal of Applied Psychology, 91(4), 946–953.
Neal, A., Griffin, M. A., & Hart, P. M. (2000). The impact of organizational climate on safety
climate and individual behavior. Safety Science, 34(1–3), 99–109.
Niskanen, T. (1994). Safety Climate in the Road Administration. Safety Science, 17(4), 237–255.
Nissly, J. A., Barak, M. E. M., & Levin, A. (2005). Stress, social support, and workers’
intentions to leave their jobs in public child welfare. Administration in Social Work,
29(1), 79–100.
O’Connor, P., O’Dea, A., Kennedy, Q., & Buttrey, S. E. (2011). Review: Measuring safety
climate in aviation: A review and recommendations for the future. Safety Science, 49(2),
128–138.
Ostroff, C., Kinicki, A. J., & Tamkins, M. M. (2003a). Organizational culture and climate. In W.
C. Borman, D. R. Ilgen, & R. J. Klimoski (Eds.), Handbook of psychology: Industrial
and organizational psychology, Vol. 12. (pp. 565–593). Hoboken, NJ US: John Wiley &
Sons Inc.
Ostroff, C., Kinicki, A. J., & Tamkins, M. M. (2003b). Organizational culture and climate. In W.
C. Borman, D. R. Ilgen, & R. J. Klimoski (Eds.), Handbook of psychology: Industrial
and organizational psychology, Vol. 12. (pp. 565–593). Hoboken, NJ US: John Wiley &
Sons Inc.

205
Park, H., Kang, M. J., & Son, S. (2012). Factors affecting quality and performance – a case study
of Korean aircraft maintenance unit. Total Quality Management & Business Excellence,
23(2), 197–219.
Park, T.-Y., & Shaw, J. D. (2013). Turnover Rates and Organizational Performance: A Meta-
Analysis. Journal of Applied Psychology, 98(2), 268–309.
Patankar, M. S. (2003). A Study of Safety Culture at an Aviation Organization. International
Journal of Applied Aviation Studies, 3(2), 243–258.
Patankar, M. S., & Taylor, J. C. (2004). Risk Management and Error Reduction in Aviation
Maintenance. Ashgate Publishing, Aldershot, Hampshire, 214pp.
Patterson, M. G., West, M. A., Shackleton, V. J., Dawson, J. F., Lawthom, R., Maitlis, S., …
Wallace, A. M. (2005). Validating the Organizational Climate Measure: Links to
Managerial Practices, Productivity and Innovation. Journal of Organizational Behavior,
(4), 379–408.
Petersen, D. (1978). Techniques of safety management (2d ed.). New York: McGraw-Hill.
Pettersen, K. A., & Aase, K. (2008). Explaining safe work practices in aviation line maintenance.
Safety Science, 46(3), 510–519.
Pintelon, L. M., & Gelders, L. F. (1992). Maintenance management decision making. European
Journal of Operational Research, 58(3), 301–317.
Pousette, A., Larsson, S., & Törner, M. (2008). Safety climate cross-validation, strength and
prediction of safety behaviour. Safety Science, 46(3), 398–404.
206
Probst, T. M., & Estrada, A. X. (2010). Accident under-reporting among employees: Testing the
moderating influence of psychological safety climate and supervisor enforcement of
safety practices. Accident Analysis and Prevention, 42(5), 1438–1444.
Rankin, W., Hibit, R., Allen, J., & Sargent, R. (2000). Development and evaluation of the
Maintenance Error Decision Aid (MEDA) process. International Journal of Industrial
Ergonomics, 26(2), 261–276.
Rashid, H. S. J., Place, C. S., & Braithwaite, G. R. (2010). Helicopter maintenance error
analysis: Beyond the third order of the HFACS-ME. International Journal of Industrial
Ergonomics, 40(6), 636–647.
Rashid, H. S. J., Place, C. S., & Braithwaite, G. R. (2013). Investigating the investigations: a
retrospective study in the aviation maintenance error causation. Cognition, Technology &
Work, 15(2), 171–188.
Reason, J. (1995). A systems approach to organizational error. Ergonomics, 38(8), 1708–1721.
Reason, J. (2000). Human error: models and management. BMJ : British Medical Journal,
320(7237), 768–770.
Reason, J. T. (1990). Human error. Cambridge University Press, New York.
Reason, J. T. (2008). The human contribution : unsafe acts, accidents and heroic recoveries.
Burlington, VT: Ashgate.
Reason, J. T., & Hobbs, A. (2003). Managing maintenance error : a practical guide. Burlington,
VT: Ashgate.
Reichers, A. E. (1985). A Review and Reconceptualization of Organizational Commitment.
Academy of Management Review, 10(3), 465–476.

207
Reichers, A. E., & Schneider, B. (1990). Climate and culture: An evolution of constructs. In B.
Schneider (Ed.), Organizational climate and culture (pp. 5–39). San Francisco: Jossey-
Bass.
Rencher, A. C., & Christensen, W. F. (2012). Methods of multivariate analysis (Third edition).
Hoboken, New Jersey: Wiley.
Ruffner, J. W. (1990). A Survey of Human Factors Methodologies and Models for Improving the
Maintainability Design of Emerging Army Aviation Systems. ANACAPA SCIENCES
INC. FORT RUCKER, AL.
Sackett, P. R. (2002). The Structure of Counterproductive Work Behaviors: Dimensionality and
Relationships with Facets of Job Performance. International Journal of Selection &
Assessment, 10(1/2), 5–11.
Schein, E. H. (2004). Organizational Culture and Leadership. San Francisco: Jossey-Bass.
Schneider, B. (1975). Organizational Climates: An Essay1. Personnel Psychology, 28(4), 447–
479.
Schneider, B., Ehrhart, M., & Macey, W. (2013). Organizational Climate and Culture. Annual
Review of Psychology, 64(1), 361–388.
Schumacker, R. E., & Lomax, R. G. (2010). A beginner’s guide to structural equation modeling
(3rd ed.). New York, NY: Taylor & Francis Group (Routledge).
Seo, D.-C. (2005). An explicative model of unsafe work behavior. Safety Science, 43(3), 187–
211.
208
Shappell, S. A., & Wiegmann, D. A. (1997). A Human Error Approach to Accident
Investigation: The Taxonomy of Unsafe Operations. International Journal of Aviation
Psychology, 7(4), 269–291.
Shappell, S. A., & Wiegmann, D. A. (2000). The human factors analysis and classification
system-HFACS (No. DOT/FAA/AM-00/7). Federal Aviation Administration, Office of
Aviation Medicine ; Springfield, VA.
Shappell, S., Detwiler, C., Holcomb, K., Hackworth, C., Boquet, A., & Wiegmann, D. A. (2007).
Human error and commercial aviation accidents: an analysis using the human factors
analysis and classification system. Human Factors, 49(2), 227–242.
Shappell, S., & Wiegmann, D. (2009). A Methodology for Assessing Safety Programs Targeting
Human Error in Aviation. The International Journal of Aviation Psychology, 19(3), 252–
269.
Shaw, J. (2011). Turnover rates and organizational performance: Review, critique, and research
agenda. Organizational Psychology Review, 1(3), 187–213.
Shaw, J. D., Gupta, N., & Delery, J. E. (2005). Alternative Conceptualizations of the
Relationship Between Voluntary Turnover and Organizational Performance. Academy of
Management Journal, 48(1), 50–68.
Sheehan, E. P. (1993). The Effects of Turnover on the Productivity of Those Who Stay. Journal
of Social Psychology, 133(5), 699–706.
Shenoy, D., & Bhadury, B. (1998). Maintenance resources management: adapting MRP.
London ; Bristol, PA: Taylor & Francis.
209
Siu, O., Phillips, D. R., & Leung, T. (2003). Age differences in safety attitudes and safety
performance in Hong Kong construction workers. Journal of Safety Research, 34(2),
199–205.
Sjöberg, A., & Sverke, M. (2000). The interactive effect of job involvement and organizational
commitment on job turnover revisited: A note on the mediating role of turnover intention.
Scandinavian Journal of Psychology, 41(3), 247–252.
Stevens, J. (1986). Applied multivariate statistics for the social sciences. Hillsdale, N.J: L.
Erlbaum Associates.
Tabachnick, B. G., & Fidell, L. S. (1996). Using multivariate statistics (3rd ed). New York, NY:
HarperCollins College Publishers.
Tabachnick, B. G., & Fidell, L. S. (2007). Using multivariate statistics (5th ed.). Boston: Allyn
and Bacon.
Taylor, J. C. (2000). The evolution and effectiveness of Maintenance Resource Management
(MRM). International Journal of Industrial Ergonomics, 26(2), 201–215.
Taylor, J. C., & Thomas, R. L. (2003). Toward Measuring Safety Culture in Aviation
Maintenance: The Structure of Trust and Professionalism. International Journal of
Aviation Psychology, 13(4), 321–343.
Thompson, B. (2004). Exploratory and confirmatory factor analysis: understanding concepts
and applications (1st ed). Washington, DC: American Psychological Association.
Thompson, B., & Daniel, L. G. (1996). Factor Analytic Evidence for the Construct Validity of
Scores: A Historical Overview and Some Guidelines. Educational and Psychological
Measurement, 56(2), 197–208.

210
Thompson, R. C., Hilton, T. F., & Witt, L. A. (1998). Where the Safety Rubber Meets the Shop
Floor: A Confirmatory Model of Management Influence on Workplace Safety. Journal of
Safety Research, 29(1), 15–24.
Tourigny, L., Baba, V. V., & Lituchy, T. R. (2005). Job Burnout among Airline Employees in
Japan: A Study of the Buffering Effects of Absence and Supervisory Support.
International Journal of Cross Cultural Management : CCM, 5(1), 67–85.
Trice, H. M., & Beyer, J. M. (1993). The cultures of work organizations. Englewood Cliffs, NJ:
Prentice Hall.
Tucker, S., Chmiel, N., Turner, N., Hershcovis, M. S., & Stride, C. B. (2008). Perceived
organizational support for safety and employee safety voice: The mediating role of
coworker support for safety. Journal of Occupational Health Psychology, 13(4), 319–
330.
Van Breukelen, W., Van der Vlist, R., & Steensma, H. (2004). Voluntary Employee Turnover:
Combining Variables from the “Traditional” Turnover Literature with the Theory of
Planned Behavior. Journal of Organizational Behavior, 25(7), 893–914.
Vandenberg, R. J., & Nelson, J. B. (1999). Disaggregating the motives underlying turnover
intentions : When do intentions predict turnover behavior? Human Relations, 52(10),
1313–1336.
Varonen, U., & Mattila, M. (2000). The safety climate and its relationship to safety practices,
safety of the work environment and occupational accidents in eight wood-processing
companies. Accident Analysis & Prevention, 32(6), 761–769.

211
Vinodkumar, M. N., & Bhasi, M. (2009). Safety climate factors and its relationship with
accidents and personal attributes in the chemical industry. Safety Science, 47(5), 659–
667.
Vinodkumar, M. N., & Bhasi, M. (2010). Safety management practices and safety behaviour:
Assessing the mediating role of safety knowledge and motivation. Accident Analysis and
Prevention, 42(6), 2082–2093.
Vroom, V. H. (1964). Work and motivation. New York, NY: Wiley.
Wallace, C., & Chen, G. (2006). A Multilevel Integration of Personality, Climate, Self-
Regulation, and Performance. Personnel Psychology, 59(3), 529–557.
Wallace, J. C., Popp, E., & Mondore, S. (2006). Safety Climate as a Mediator Between
Foundation Climates and Occupational Accidents: A Group-Level Investigation. Journal
of Applied Psychology, 91(3), 681–688.
Weddle, M. G. (1996). Reporting occupational injuries: The first step. Journal of Safety
Research, 27(4), 217–223.
Wells, D. L., & Muchinsky, P. M. (1985). Performance antecedents of voluntary and involuntary
managerial turnover. Journal of Applied Psychology, 70(2), 329–336.
Wenner, C. A., & Drury, C. G. (2000). Analyzing human error in aircraft ground damage
incidents. International Journal of Industrial Ergonomics, 26(2), 177–199.
Westaby, J. D., & Lowe, J. K. (2005). Risk-taking orientation and injury among youth workers :
Examining the social influence of supervisors, coworkers, and parents. Journal of
Applied Psychology, 90(5), 1027–1035.

212
Wiegmann, D. A., & Shappell, S. A. (2001a). Human error analysis of commercial aviation
accidents: Application of the Human Factors Analysis and Classification System
(HFACS). Aviation Space and Environmental Medicine, 72(11), 1006–1016.
Wiegmann, D. A., & Shappell, S. A. (2001b). Human Error Perspectives in Aviation.
International Journal of Aviation Psychology, 11(4), 341–357.
Wiegmann, D. A., & Shappell, S. A. (2003). A human error approach to aviation accident
analysis : the human factors analysis and classification system. Burlington, VT: Ashgate.
Wiegmann, D. A., von Thaden, T. L., Mitchell, A. A., Sharma, G., & Zhang, H. (2003).
Development and Initial Validation of a Safety Culture Survey for Commercial Aviation
(No. Tech. Report AHFD-03-3/FAA-03-1). Federal Aviation Administration, Atlantic
City International Airport, NJ.
Williams, C. R., & Livingstone, L. P. (1994). Another Look at the Relationship between
Performance and Voluntary Turnover. The Academy of Management Journal, 37(2),
269–298.
Williamson, A. M., Feyer, A.-M., Cairns, D., & Biancotti, D. (1997). The development of a
measure of safety climate: The role of safety perceptions and attitudes. Safety Science,
25(1-3), 15–27.
Wills, A. R., Watson, B., & Biggs, H. C. (2006). Comparing safety climate factors as predictors
of work-related driving behavior. Journal of Safety Research, 37(4), 375–383.
Wolpin, J., Burke, R. J., & Greenglass, E. R. (1991). Is Job Satisfaction an Antecedent or a
Consequence of Psychological Burnout? Human Relations, 44(2), 193–209.
213
Wright, T. A., & Bonett, D. G. (2007). Job Satisfaction and Psychological Well-Being as
Nonadditive Predictors of Workplace Turnover. Journal of Management, 33(2), 141–160.
Wright, T. A., & Cropanzano, R. (1998). Emotional exhaustion as a predictor of job performance
and voluntary turnover. Journal of Applied Psychology, 83(3), 486–493.
Zohar, D. (1980). Safety Climate in Industrial Organizations: Theoretical and Applied
Implications. Journal of Applied Psychology, 65(1), 96–102.
Zohar, D. (2000). A group-level model of safety climate: Testing the effect of group climate on
microaccidents in manufacturing jobs. Journal of Applied Psychology, 85(4), 587–596.
Zohar, D. (2002). The Effects of Leadership Dimensions, Safety Climate, and Assigned
Priorities on Minor Injuries in Work Groups. Journal of Organizational Behavior, 23(1),
75–92.
Zohar, D. (2010). Thirty years of safety climate research: Reflections and future directions.
Accident Analysis & Prevention, 42(5), 1517–1522.
Zohar, D., Huang, Y., Lee, J., & Robertson, M. M. (2015). Testing extrinsic and intrinsic
motivation as explanatory variables for the safety climate–safety performance
relationship among long-haul truck drivers. Transportation Research Part F: Psychology
and Behaviour, 30, 84–96.
Zohar, D., & Luria, G. (2005). A Multilevel Model of Safety Climate: Cross-Level Relationships
Between Organization and Group-Level Climates. Journal of Applied Psychology, 90(4),
616–628.