safety culture: an assessment of a collegiate aviation …
TRANSCRIPT

University of North DakotaUND Scholarly Commons
Theses and Dissertations Theses, Dissertations, and Senior Projects
8-1-2013
Safety Culture: An Assessment of a CollegiateAviation ProgramDaniel Kwasi Adjekum
Follow this and additional works at: https://commons.und.edu/theses
This Thesis is brought to you for free and open access by the Theses, Dissertations, and Senior Projects at UND Scholarly Commons. It has beenaccepted for inclusion in Theses and Dissertations by an authorized administrator of UND Scholarly Commons. For more information, please [email protected].
Recommended CitationAdjekum, Daniel Kwasi, "Safety Culture: An Assessment of a Collegiate Aviation Program" (2013). Theses and Dissertations. 380.https://commons.und.edu/theses/380

SAFETY CULTURE: AN ASSESSMENT OF A COLLEGIATE AVIATION PROGRAM
by
Daniel Kwasi Adjekum Bachelor of Science, Kwame Nkrumah University of Science and Technology 1997
A Thesis
Submitted to the Graduate Faculty
of the
University of North Dakota
in partial fulfillment of the requirements
for the degree of
Master of Science
Grand Forks, North Dakota August 2013

ii
Copyright 2013 Daniel Kwasi Adjekum

iii
APPROVAL PAGE HERE

iv
PERMISSION
Title: Safety Culture: An Assessment of a Collegiate Aviation Program Department: Aviation Degree : Master of Science In presenting this thesis in partial fulfillment of the requirements for a graduate degree from the University of North Dakota, I agree that the library of this University shall make it freely available for inspection. I further agree that permission for extensive copying for scholarly purposes may be granted by the professor who supervised my thesis work or, in his absence, by the chairperson of the department or the dean of the Graduate School. It is understood that any copying or publication or other use of this thesis or part thereof for financial gain shall not be allowed without my written permission. It is also understood that due recognition shall be given to me and to the University of North Dakota in any scholarly use which may be made of any material in my thesis.
Daniel Kwasi.Adjekum June 20, 2013

v
TABLE OF CONTENTS LIST OF FIGURES ............................................................................................................................................... ix
LIST OF TABLES ........................................................................................................... xiii
ACKNOWLEDGMENTS .................................................................................................xv
ABSTRACT..................................................................................................................... xvi
CHAPTER
I. INTRODUCTION ..........................................................................................1
Statement of the Problem .......................................................................5 Purpose of Study ....................................................................................5 Research Questions ................................................................................6 Literature Review...................................................................................7
Defining and Building up a Safety Culture................................8 Summary of Safety Culture Studies in Commercial Aviation Operations ...................................................................8 SMS and Safety Culture in Collegiate Aviation in the United States .................................................................10 Management of Organizational Safety Culture in Aviation ....11
Components of a Positive Safety Culture ...........................................13
Informed Culture ......................................................................14 Reporting Culture.....................................................................14 Just Culture ..............................................................................15

vi
Learning Culture ......................................................................16 Flexible Culture .......................................................................16 Management Commitment.......................................................17
Commercial Aviation Safety Survey (CASS)......................................17 Dimensions of Safety Culture Model of CASS ...................................18
Organizational Commitment ....................................................18 Operations Interaction ..............................................................19 Formal Safety ...........................................................................19 Informal Safety ........................................................................19
II. METHODOLOGY .......................................................................................22
Validity ................................................................................................22
Reliability .............................................................................................22
Population ............................................................................................23 Sample..................................................................................................24 Study Design ........................................................................................24
Students Participation ............................................................25 Online Survey Tool ................................................................25
Response Period .....................................................................25
Method and Data Collection ..................................................26
Protection of Human Subjects ...............................................27
III. RESULTS AND DATA ANALYSIS ..........................................................28
Data Analysis .......................................................................................28
Content Validity ...................................................................................28

vii
Reliability .............................................................................................29
Demographic Information ....................................................................29
Years in Flight Program ...........................................................30
Gender ......................................................................................31
International Contract Students................................................32
Age Group ................................................................................33
Airman Certification and Ratings ............................................35
Safety Reporting ......................................................................36
Summary of the Survey Results ...........................................................37
Formal Safety Scale Indicators ................................................38
Reporting System .........................................................38
Response and Feedback ...............................................41
Safety Personnel...........................................................43
Informal Safety Scale Indicators ..............................................46
Accountability/Just Culture .........................................46
Pilot Authority .............................................................47
Professionalism ............................................................50
Operations Interaction Scale Indicator.....................................53
Supervisor of flight/Chief CFI/Lead CFI .....................53
Dispatch .......................................................................55
Instructor/Trainers........................................................58
Ramp Operations .........................................................60
Organizational Commitment Scale Indicator...........................62
viii
Safety Values ...............................................................62
Safety Fundamentals ....................................................65
Going Beyond Compliance ..........................................69
University Safety Record .........................................................71
Research Results ..................................................................................74
Question One ...........................................................................74
Question Two ...........................................................................75
Question Three .........................................................................81
Question Four...........................................................................83
Question Five ..........................................................................91
IV. DISCUSSION ...............................................................................................94
Perception of Safety Culture among Respondents...............................94
Perception of International Students and US Students on Safety Culture in the program .........................................................................98 Perception on Relationship between Informal Safety and Operations Interaction ..........................................................................................105 Perception on Relationship between Formal Safety and Safety Behavior (Personal Risk ....................................................................106 Perception on Relationship between Organizational Commitment and Safety Behavior (Personal Risk) .......................................................108 Limitations .........................................................................................108
Future Studies ....................................................................................109
Conclusion .........................................................................................111
APPENDICES .................................................................................................................115
REFERENCES ................................................................................................................140

ix
LIST OF FIGURES
Figure Page
1. The Three Part Model of Safety Culture ..............................................................13
2. Safety Culture Components (FAA ........................................................................13
3. Four Factor Model of Safety Culture in the CASS ...............................................21
4. Category of Respondents (years spent in the flight program) ..............................31
5. Gender of Respondents ........................................................................................32
6. International Student’s Status ...............................................................................33
7. Age Distribution ...................................................................................................34
8. Airman Certificate and Ratings ............................................................................36
9. Reporting of Safety Problems ...............................................................................37
10. Histogram of ‘Safety system convenient to use’ ..................................................39
11. Box plot of ‘Safety system convenient to use’ .....................................................39
12. Histogram of ‘Pilots do not bother reporting near misses or close calls’ .............40
13. Box plot of ‘Pilots do not bother reporting near misses or close calls’ ................40
14. Histogram of ‘My University keeps confidential database’ .................................41
15. Box plot of ‘My University keeps confidential database’ ....................................42
16. Histogram of ‘My University keeps track of major safety problems and overlooks routine ones’ .................................................................................42 17. Box plot of ‘My University keeps track of major safety problems and overlook routine ones’ ...................................................................................43

x
18. Histogram of ‘Personnel responsible for safety have a clear understanding of risk in flight training’ ...............................................................44 19. Box plot of ‘Personnel responsible for safety have a clear understanding of risk in flight training’ ...............................................................44 20. Histogram of ‘Safety personnel have little or no authority compared to operational personnel’ ..........................................................................................45 21. Box plot of ‘Safety personnel have little or no authority compared to operational personnel’ ..........................................................................................45 22. Histogram of ‘Standards of accountability are consistently applied to all pilots’ ...........................................................................................................46 23. Box plot of ‘Standards of accountability are consistently applied to all pilots’ ...........................................................................................................47 24. Histogram of ‘Pilots have little real authority to make decisions that affect the safety of flight’ ..............................................................................47 25. Box plot of ‘Pilots have little real authority to make decisions that affect the safety of flight’ ..............................................................................48 26. Histogram of ‘Pilots are seldom asked for input, when university aviation procedures are developed’ ......................................................................49 27. Box plot of ‘Pilots are seldom asked for input, when university aviation procedures are developed’ ......................................................................49 28. Histogram of ‘Pilots who do not fly safely quickly develop a negative reputation among other pilots’ ...............................................................50 29. Box plot of ‘Pilots who do not fly safely quickly develop a negative reputation among other pilots’ ...............................................................51 30. Histogram of ‘Pilots never cut corners or compromise safety regardless of pressure to do so’ ............................................................................52 31. Box plot of ‘Pilots never cut corners or compromise safety regardless of pressure to do so’ ............................................................................52 32. Histogram of ‘Chief/Lead CFI/SoF have a clear understanding of the risk associated with flight’ .........................................................................53
xi
33. Box plot of ‘Chief/Lead CFI/SoF have a clear understanding of the risk associated with flight’ .........................................................................54 34. Histogram of ‘Pilots report their safety concerns to their Chief/Lead CFI/SoF than the safety department’ .................................................54 35. Box plot of ‘Pilots report their safety concerns to their Chief/Lead CFI/SoF than the safety department’ .................................................55 36. Histogram of ‘Dispatch is responsive to pilots concerns about safety of operations’ .............................................................................................55 37. Box plot of ‘Dispatch is responsive to pilots concerns about safety of operations’ ............................................................................................................56 38. Histogram of ‘Dispatch would rather take chance with safety than cancel a flight’ ......................................................................................................57 39. Box plot of ‘Dispatch would rather take chance with safety than cancel a flight’ ......................................................................................................57 40. Histogram of ‘Safety is consistently emphasized during training at my university’ .......................................................................................................58 41. Box plot of ‘Safety is consistently emphasized during training at my university’ .............................................................................................................58 42. Histogram of ‘Instructors/trainers teach shortcuts and ways to get around safety requirements’ .................................................................................59 43. Box plot of ‘Instructors/trainers teach shortcuts and ways to get around safety requirements’ .................................................................................59 44. Histogram of ‘Ramp personnel are careful about position of equipment’............60
45. Box plot of ‘Ramp personnel are careful about position of equipment’...............61
46. Histogram of ‘The Lack of communication between ramp personnel and pilots contribute to incidents’ ........................................................................61 47. Box plot of ‘The Lack of concerns between ramp personnel and pilots contribute to incidents’ ...............................................................................62 48. Histogram of ‘Safety is a core value in my university’ ........................................63
49. Box plot of ‘Safety is a core value in my university’ ...........................................63

xii
50. Histogram of ‘Management expect pilot to push for on-time performance’ ........64
51. Box plot of ‘Management expect pilot to push for on-time performance’ ...........65
52. Histogram of ‘My University ensures that the maintenance on aircraft is adequately performed’ ..........................................................................................66 53. Box plot of ‘My University ensures that the maintenance on aircraft is adequately performed ...........................................................................................67 54. Histogram of ‘Checklist and procedures are easy to understand’ .........................68
55. Box plot of ‘Checklist and procedures are easy to understand’............................68
56. Histogram of ‘Management views violations very seriously, even when they don’t result in any serious damage’ ....................................................69 57. Box plot of ‘Management views regulation violations very seriously, even when they don’t result in any serious damage’ ............................................69 58. Histogram of ‘Management schedule CFI’s as much as legally possible’ ...........70 59. Box plot of ‘Management schedule CFI’s as much as legally possible’ ..............71 60. Histogram of ‘Likelihood of an accident in flight program’ ................................72
61. Histogram of ‘Likelihood of incident in flight program’......................................73
62. Histogram of ‘Likelihood of FAA citation’ ..........................................................73
63. Simple bar graph of ‘Mean perception of safety culture’ .....................................75

xiii
LIST OF TABLES
Table Page 1. Scale Inventory for the CAPSCUS as modified from the CASS .........................23
2. Crombach’s alpha for CAPSCUS .......................................................................29
3. Category of Respondents ......................................................................................30
4. Gender distribution of Respondents .....................................................................31
5. International Students Status ...............................................................................32
6. Age Group of Respondents ..................................................................................34
7. Airmen Certificates and Ratings ..........................................................................35
8. Reporting of Safety Problems ..............................................................................36
9. University Safety Records ................................................................................... 72
10. Pearson’s Correlation between Informal Safety and Operation Interaction .............................................................................................................84 11. Model Summary of ‘Reported for Duty when ill, fatigue or under unusual stress’ ......................................................................................................86 12. Coefficients of ‘Reported for Duty when ill, fatigue or under unusual stress’ ....................................................................................................................87 13. Model Summary of ‘been pressured to fly a university aircraft, you believe was not in safe condition’ ........................................................................87 14. Coefficients of ‘been pressured to fly a university aircraft, you believe was not in safe condition’ .....................................................................................88 15. Model Summary of ‘Failed to challenge a superior on a safety issue for fear of ruining a cordial relationship.’ ............................................................88

xiv
16. Coefficients of ‘Failed to challenge a superior on a safety issue for fear of ruining a cordial relationship’ ...................................................................89 17. Model Summary of ‘Allowed instructor or senior pilot’s mistake to go unchallenged’ ...................................................................................................... 89 18. Coefficients of ‘Allowed instructor or senior pilot’s mistake to go unchallenged’ .......................................................................................................90 19. Model Summary of ‘Ever been put on flight hold for alcohol or drugs violations’ ...................................................................................................90 20. Coefficients of ‘Ever been put on flight hold for alcohol or drugs violations’ ...................................................................................................91 21. Model Summary of ‘been pressured to fly university aircraft, you believe was not in safe condition’ .....................................................................................92 22. Coefficients of ‘been pressured to fly a university aircraft, you believe was not in safe condition’ .....................................................................................92 23. Model Summary of ‘Failed to challenge a superior on a safety issue for fear of ruining a good relationship.’ ...............................................................93 24. Coefficients of ‘Failed to challenge a superior on a safety issue for fear of ruining a good relationship’ ......................................................................93

xv
ACKNOWLEDGMENTS
I wish to thank my Lord and Savior Jesus Christ for the strength and wisdom to
undertake this research work. I want to thank my faculty advisory committee members,
William Watson, J.D, Warren Jenson, M.D and Gary Ullrich, M.S for their patience,
insightful guidance and diligence provided during my studies at the University of North
Dakota. God richly bless you. I also want to thank all faculty members at the Aviation
department for the support and encouragement to undertake this research. I wish to thank
all the students and flight instructors who took part in the research. Without your
assistance this study could not have been completed. I also want to acknowledge Dr Terry
von Thaden for graciously giving me permission to modify the CASS questionnaire into
the CAPSCUS for this research. I thank my wife Yaa Asantewa and daughters Nana and
Maame for bearing with me through all those long nights at the study

To Yaa Asantewa, Nana and Maame

xvi
ABSTRACT
An assessment of the safety culture at an accredited four year collegiate aviation program
was conducted. The Collegiate Aviation Program Safety Culture Assessment Survey
(CAPSCAS) was used. Participants were drawn from flight students and instructors in the
program. The survey captured the perceptions of participants on the status of the safety
culture in the program. Generally the participants had a good perception of the safety
culture in the program. There were significant variances in the perception of respondents
on the safety culture by year groups and it was observed that respondents, who had spent
more years in the program, had a better perception, on the safety culture. There were also
significant differences in the perceptions of US resident students and international
contract students, with the latter having a less favorable perception of the safety culture in
the program. The results show that differences in national culture can have an effect on
perceptions on safety culture. Risky personal attitudes of respondents that could
influences safety behaviors were correlated with their perception on the safety culture and
a safety risk prediction model was proposed.

1
CHAPTER I
INTRODUCTION
Modern aviation operations are growing ever more complex in times of increased
demand for services with decreased resources (Wensveen, 2010). Organizational factors
like safety culture and regulatory oversight play significant roles in the foundation of
safety in high-risk systems (von Thaden, 2008). Several high profile accidents in the late
twentieth century brought considerable attention to the role of organizational safety
culture and regulatory oversight in accident causation (von Thaden, 2006) (Wiegmann,
2004). Accordingly, the Federal Aviation Administration (FAA) has established a
comprehensive and integrated procedure to encompass a national standard of system
safety, with the introduction of Safety Management System in aviation operations (FAA,
2008).
Safety Management Systems (SMS) is a top-down and businesslike approach to
safety, that emphasize proactive and data driven management of safety, distinct from
the traditional reactionary approach (FAA, 2008). SMS has become the next generation
safety initiative and a new rule on SMS, as set forth in 14 CFR Part 121 operations, was
supposed to come into effect on 04 September 2012 (FAA, 2010). The new rule would
have made it mandatory for aviation service operators in the United States (US) to
implement SMS in their operations. As at now the rule has since not come into effect.
2
The responsibility for operational safety lies with the aviation organizations, but
the FAA will ensure that the organizations comply with their safety responsibilities
(FAA, 2008). A good indicator for organizational safety culture requires the
identification, analysis, and prioritization of information to mitigate hazards and risks.
SMS will provide an organized approach to safety procedures/processes and
performance management (von Thaden, 2008).
As aviation organizations strive to maintain economic viability in a varied global
environment they must continually modify their business processes and even their
workforce to provide services in times of accelerated aviation activity paired with
diminishing resources (Wensveen, 2010). While it may be strategically advantageous to
reengineer business processes from time to time in order to remain f unctional, ongoing
and updated safety efforts must not be overlooked (von Thaden, 2008). As the
aviation industry continues to evolve, safety efforts must also remain a business
priority (FlightSafety Foundation, 2011). For example, high fuel costs can dramatically
increased a collegiate flight program’s operational budget, which can negatively affect
financial resources allocated for safety programs.
In order to control costs, many airlines have had to schedule fewer flights; as a
result this has also sacrificed revenue (Trejos, 2012). In fact, the ten largest airlines in
the US posted a combined loss of $1.07 billion as at the first half of the 2012 fiscal year
(June, 2012), due largely to high fuel prices (Zacks , 2012) . While there are a number
of economic concerns that may influence an airline’s prioritization of safety, a
difficult economic situation may lead an airline to redirect resources away from

3
functions that are essential to safe operations (Stolzer, 2011) thus pushing the limits of
the current state of safety.
Managing safety has become increasingly more important as aviation
organizations diversify (Patankar, 2003). Thus aviation has adopted Safety Management
Systems (SMS) to espouse a quality management approach to complex aviation safety and
business relationships (FAA, 2008; ICAO, 2009). SMS provides an organizational
framework to effectively manage safety and serves as the very structure that
generates a positive safety culture (von Thaden , 2008). SMS frameworks have shown
effectiveness when not only adopted as part of a business, but when adopted as part of
regulatory oversight operations (FAA, 2008).
The Federal Aviation Administration (FAA) issued AC 120-92A to introduce the
concept of Safety Management System (SMS) to aviation service providers like collegiate
aviation organization (Part 141) under FAA SMS Guidance; Order 8000.369 and Aviation
Safety (AVS) Requirements Document; Order VS 8000.367. The Airline Safety and
Federal Aviation Extension Act of 2010 (Pub. L. 111-216) directed the FAA to issue a
final rule on SMS by July 30, 2012. The FAA is systematically working on establishing
requirements for US aviation certificate holders to implement SMS.
The implementation of SMS and the sustenance of a positive safety culture in a
collegiate aviation program can generate both economic and operational benefits. Moncton
Flight College (MFC) in New Brunswick implemented SMS and realized a $25,000
annual savings with a 22% reduction in insurance premiums along with a significant
reduction in regulatory audit findings (Moncton Flight College, 2009). “SMS has been a
critical factor in the success of MFC and had a significant influence on the number and

4
size of the training contracts signed” according to Michael Doiron, Principal and CEO of
Moncton Flight College (Lu , 2011).
Continued research into proactive organizational safety culture provides a better
understanding of organizational performance, accountabilities, policies and procedures
surrounding safety (von Thaden, 2008). The aim of this new oversight relationship
between aviation organizations and regulatory authorities is to shift away from a
prescriptive era to one of proactive and systematic business oriented safety management
(Stolzer, 2011). The aviation organizations must consider the nature and amount
of information required to allow the FAA minimal policing yet optimal influence over
organizational safety.
Adding to the well-known collection of voluntary self-assessment tools
advocated by the FAA as complementary to traditional regulatory requirements (e.g.,
Advanced Qualification Programs (AQP), Aviation Safety Analysis Programs (ASAP),
Flight Operations Quality Assurance programs (FOQA), and Line Operations Safety
Audit (LOSA) etc.), the Commercial Aviation Safety Survey (CASS) has been
developed by researchers at the University of Illinois Urbana –Champagne to serve as
an aviation self-assessment instrument designed to aid operators in measuring
indicators of their organization’s safety culture. The instrument targets areas that work
particularly well and areas in need of improvement (von Thaden, 2008).
The CASS has been validated and improved over many years (Gibbons, 2006;
von Thaden, 2008). The CASS enables collection of data and analysis of safety culture
information, which allows aviation organizations to evaluate and strategize about the
findings which would help to implement best practices for operation, and ultimately
5
yield the highest probable safety outcome (von Thaden , 2008). The CASS has four
major scales, namely formal safety (reporting systems, response/feedback and safety
personnel), informal safety (accountability, pilot authority and professionalism),
Operations interactions (working relationship between pilots and supervisors/middle
management) and organizational commitment (safety values, safety fundamentals and
going beyond compliance).
Statement of the Problem
The successful implementation of an SMS initiative in a collegiate aviation
program is strongly influenced by the safety culture status of front- line personnel like
CFI’s and flight students. The norms, perceptions, values and attitude toward safety of
these groups of people will have an impact on the safety culture of the organization
(Cooper, 2000). The problem that affects the continuous improvement of the SMS is how
to assess the perception, attitude and behavior of students and flight instructors, in
relation to safety after the implementation of a formal process of an SMS program , and
to determine whether they have identified with objectives of the program.
Purpose of the Study
The International Civil Aviation Organization (ICAO) has identified a number of
areas in which certain elements of aviation safety programs may be further supported and
enhanced, through Safety Management Systems (ICAO, 2009). One important
component for the successful implementation of an SMS program in any aviation
organization is the positive status of the organizational safety culture. The purpose of
this study is to use the Collegiate Aviation Program Safety Culture Survey (CAPSCUS),
which is a modified form of the CASS, specifically for collegiate aviation program, to
6
assess the safety culture perception of commercial aviation students and certified flight
instructors (CFI’s). The study would be done at an accredited four year Part 141
collegiate aviation program in the North-Western part of the United States of America
(USA).
The CAPSCAS will provide a baseline measure of the collegiate program’s safety
culture, thus obtaining a benchmark to judge critical movement and change in the
aviation program’s safety culture. The study will also use a consistent framework to find
the strength of relationship between perceived state of safety culture and safety behavior
among the commercial aviation students and CFI’s.The study will also attempt to
establish a safety culture assessment methodology, which could be replicated in other
similar collegiate aviation programs for comparison of results and ultimately the
continuous improvement of collegiate aviation safety.
Research Questions
1. What are the differences in perception among respondents [commercial flight
students and certified flight instructors (CFIs)] on the status of the safety culture at an
accredited four year collegiate aviation program?
2. What are the differences between the perception of international contract
students and indigenous US students on the status of the safety culture at an accredited
four year collegiate aviation program?
3. What is relationship between the perception of respondents (flight students and
certified flight instructors) regarding the informal safety and operation interaction at an
accredited four year collegiate aviation program?

7
4. What is the relationship between the perception of respondents (students and
certified flight instructors) on the formal safety program and their safety behavior at an
accredited four year collegiate aviation’s program?
5. What is the relationship between the perception of respondents (students and
certified flight instructors) on organizational commitment to safety and perceived
attitudes that affects safety behavior at an accredited four year collegiate aviation
program?
Literature Review
Positive organizational safety culture creates empowerment which gives
responsibility and authority to all and to provide a horizontal safety hierarchy so as to
treat every input equal to others (Bos, 2007). Wood (2003) commented that the feeling of
involvement would motivate users of the SMS to contribute insights to safety
performance. Effective safety management in the twenty-first century involves paying
attention to human factors (PerezGonzalez, 2009). System components have as much
potential to cause, or save, dangerous system states as technical components (Yule,
2008).
Lu (2005) states that by paying attention to human factors, aviation organizations
can identify and capture potential hazards before they manifest as accidents. One method
of achieving this is by measuring the state of safety through so-called ‘leading’ indicators
such as safety culture or safety climate (Yule, 2008). These are seen as distinct from
‘lagging’ indicators of safety such as accidents as they offer insight into the state of
safety without the need for retrospective analyses of negative safety outcomes (von
Thaden , 2006).
8
Defining and Building up a Safety Culture
There is no single, universally-accepted definition of safety culture (Piers, 2009).
Several academic articles have proposed definitions of safety culture, and there is a lively
debate in professional circles regarding the distinction between safety culture and safety
climate (Patankar, 2003). The term safety culture gained its first official use in an initial
report into the Chernobyl accident (IAEA, 1986). This report introduced the concept to
explain the organizational errors and operator violations that laid the conditions for
disaster. For the purposes of this study, safety culture will be defined as “The set of
enduring values and attitudes regarding safety issues, shared by every member of every
level of an organization” (Piers, 2009). Safety Culture also “refers to the personal
dedication and accountability of individuals engaged in any activity that has a bearing on
the safe provision” (FAA, 2008). Without a doubt, the core accomplishment of SMS is
to create a positive safety culture to maintain and further improve the entire system’s
safety (IATA, 2011).
Summary of Safety Culture Studies in Commercial Aviation Operations
Wiegmann (2004) reported that ‘few formally documented efforts have been
made to assess safety culture within the aviation industry, with the notable exception of
military aviation’’ Three studies reported a safety assessment using commercial aviation
pilots. The Australian Transportation Safety Board (2004) and Evans (2007) reported on
the development of a safety culture questionnaire, designed to gain insight into pilots’
perceptions of workplace safety (N= 1308). The questionnaire consisted of six safety
factors, each with five items. These factors were based upon previous safety culture
research and input from aviation safety experts. Data from half of the sample were used
9
in an exploratory factor analysis (EFA) that resulted in a three factor model of:
management commitment and communication, safety training and equipment, and
maintenance. A confirmatory factor analysis (CFA) on the remaining half of the sample
showed the three factor model to be an adequate fit to the data.
Finally, the responses from different types of pilots (regular public transport,
charter, or aerial work such as emergency medical services or agriculture) were compared
on each of the four identified safety culture factors. No significant differences between
the groups were found. The Australian Transportation Safety Board (2004) concluded
that this was due to a single professional safety climate for pilots as a group, regardless of
the organization for whom they worked.
Gibbons (2006) developed a questionnaire designed to assess safety culture within
the context of airline flight operations. Gibbons’ survey consisted of 84 items, grouped
into five themes. The survey was designed by examining the content of safety culture
questionnaires that have been used in other High Risk Organizations (HRO). A total of
503 responses were received from a single company. After discarding 29 items and using
CFA, the analysis eventually resulted in a structure of four broad factors (organizational
commitment, operations personnel, informal safety system, and formal safety system),
with three sub factors in each.
Block (2007) reanalyzed the responses obtained from the 281 pilots from the
Patankar (2003) previous Study. The purpose was to examine whether the data supported
what Block, described as the purpose-alignment-control (PAC) model. A pair of experts
recoded the Patankar (2003) survey items in accordance with the PAC model. The
proposed factors were tested using a structural equation modeling methodology. The

10
main drivers of safety outcomes were organizational affiliation (similar to ‘pride in
company’ from Patankar, 2003) and proactive management (partially derived from the
‘safety opinion’ factor from Patankar, 2003). Organizational affiliation was directly
influenced by communication, and proactive management was influenced by training
effectiveness and relational supervision.
The research and studies have all been done in the airline and maintenance
organization (Patankar, 2003) (von Thaden, 2008) environment as well as in the Air
traffic Control organization (Gordon, 2004) (Piers, 2009),but not much has been done in
assessing the safety culture in flight training organizations,especially among flight
students and flight instructors. This study intends to build up on the strong foundations
built by parallel studies in other aviation organizations ,to assess the safety culture among
this particular subset of aviation operations.
SMS and Safety Culture in Collegiate Aviation in the United States
Even though presently SMS and safety culture assessment are not regulatory
requirements in the United States for aviation training organizations like collegiate and
university aviation programs (FAA, 2010), a number of SMS pilot programs are being
run by some proactive university aviation departments due to the immense positive
benefits that they stand to derive (Ullrich, 2012). SMS and a positive safety culture
would be advantageous to collegiate aviation because they perform standardized
activities towards established goals (FAA , 2012).
Collegiate aviation has areas of particular risk because students may have little or
no prior experience, and because malfunctions and unusual situations have to be
simulated in order to expose these students to the variety of elements, as part of their
11
routine flying activity (FAA , 2012). In other words, in flying training, pilots may
perform maneuvers that should not be accomplished as part of normal flight with the
added risk that this entails. Collegiate aviation has had its fair share of tragic accidents
and incidents (Bird Strike Control, 2009).
There is an imperative need for controlling risk through an assessment of the
prevalent safety culture inherent in the program (Patankar, 2003). There is no type
specific framework for the assessment of safety culture in collegiate aviation and some of
the few studies done have used modified survey tools more suited for airlines and airports
(Bjerke, 2011). The safety culture assessment will provide the needed data and feedback
to make changes that will continuously improve safety and ensure an integrated system
wide safety net for training organizations (Mc Cune, 2012).
Management of Organizational Safety Culture in Aviation
In 2010, the Office of the Auditor of the City and County of Denver, Colorado
conducted an audit on safety culture across different working units under the Department
of Aviation ( Audit Services Division, City and County of Denver, 2010). The itemized
audit was based on SMS criterions and had revealed that safety culture is a positive
element at Denver International Airport (DIA). DIA is responsible for the design of
safety policy, implementation of safety training, job hazard analysis and creation of
airport safety committee to identify, analyze and mitigate potential hazards (Audit
Services Division, City and County of Denver, 2010).
The audit at DIA made recommendations for changes, such as ascertaining
management commitment, improving employee collaboration, elevating the recognition
of safety programs, building a no-fault near-miss reporting system, and identifying a
12
better way to collect and disseminate safety information (Audit Services Division City
and County of Denver, 2010). A key indicator of management’s commitment to safety is
the adequacy of resources, including financial support and empowerment from the top
management (Simon, 2009). A bottom-up support and participation from operational level
personnel is equally critical (Schiff, 2006).
A ‘visible’ safety program helps to set the stage for improved employee
attitude (Transport Canada, 2008). Periodic safety related training and inspections by top
management help to convince employees that the program is not merely administrative
program of the month, but is an item of real concern (IATA , 2011). The employee gets
involved. Once that occurs, employees participate, supervisors usually take the initiative,
and the program evolves into an active force in the organization (Patankar, 2003). At this
stage, employees subconsciously develop the habit of planning ahead and examining the
safety, production, quality, and cost aspects of the task before them (Roughton, 2002).
Although the physical safe-guarding of the workplace is a real factor in safety, the mental
attitude of the employee is the ultimate key to avoiding incidents (Roughton, 2002).
Establishing a management structure, assigning responsibility and accountability,
and allocating appropriate resources must be consistent with the organization’s stated
safety objectives (FAA , 2010) . Discussing safety must begin with the analysis and
understanding of an existing culture (Gibbons, 2006). Safety is the status of a hazard-free
condition (ICAO, 2009). Culture is a behavioral norm consisting of beliefs, attitudes, and
common values of an organization (Cooper, 2000; Lu , 2005) and Figure 1 shows
the three part model. The culture in an organization normally embraces the structures,
practices, controls, and policies that an organization possesses and employs (Reason,

13
2003).
Figure 1.The Three Part Model of Safety Culture (Cooper, 2000)
Component of a Positive Safety Culture
A positive safety culture is the engine that drives the organization towards the
goal of maximum attainable operational safety regardless of any formats of resistances,
obstacles and pressures (ICAO, 2009). A positive safety culture promotes mutual respect
among the employees and managers of the organization (Simon, 2009). A positive
safety culture ensures that operational hazards and errors are anticipated (Stolzer, 2011).
There are five components of a positive safety culture, namely informed, reporting, just
cultures, learning and flexible cultures as outlined in figure 2.
Figure 2. Safety Culture Components ( FAA)

14
Informed Culture
In an organization with an informed culture, administration, management,
and front-line employees are aware of the current status of operation (ICAO,
2009). An informed culture is a known process in which people are familiar with
the elements of a company setting such as plans, policies, procedures, guidelines,
programs, personnel, possible hazards, and, of course, safety expectations
(Roughton, 2002). This informed culture also recursively measures the
performance of the safety practice (Reason, 1997; Reason, 2003).
Reporting Culture
A positive safety culture of an organization is also a reporting culture that
can only be achieved by creating an atmosphere of trust in which people are
willing to divulge their errors as well as near misses (Simon, 2009). Utilizing the
analogy of an iceberg, it has been determined that top management is aware of
only about 4% of the significant safety problems, with line managers aware of
only 9% and supervisors aware of about 74% (ICAO, 2006; Gordon, 2004).
Thus, identifying untold safety deficiencies is essential to having an accurate
view of the safety system of an organization (Gardiner, 2000).
It is by collecting, analyzing, and disseminating information about past
events and close calls, can the organization locate where boundaries between safe
and unsafe acts originate (Reason, 2003; L u , 2 0 0 7 ) . In a reporting culture,
management needs to implement protection for employees (Flightsafety
Foundation, 2005). The process of data collection and analysis, feedback,
appreciation, and ease of making a valid report are critical (Reason, 1997; Reason,
15
2003; Wood, 2003; Dekker, 2007). The drawback in a reporting culture is that
sometimes, personnel turn in overly aggressive reports associated with adverse
conditions, and these reports are not given adequate attention and response by
management (IATA , 2011).
Just Culture
A culture is just, when there is a clear difference between unintentional
and intentional acts (Flightsafety Foundation, 2005). Procedural non-compliance
warrants a punishment approach (Frankel, 2006), while procedural unintentional
errors require a non-punitive resolution (Dekker, 2007). The positive recognition
in addition to punitive measures should be clearly established to facilitate the
growth of a reporting culture and a firm belief of fairness (IATA, 2011).
Creating a trustworthy and just environment will promote safety performance and
efficacy and should be one of the organization’s goals and objectives (Lu,
2006; Reason, 1997; Reason , 2003; Dekker, 2007).
Even with a just culture, there are many barriers to overcome before a
reporting culture can be fully shaped (Flightsafety Foundation, 2005). The first
barrier is the natural attitude of ridicule (Dekker, 2007). The second barrier is
the suspicion that the report may go on record and act as a form of potential
backlash (Flightsafety Foundation, 2005). The third is skepticism of the data
application (Galloti, 2006). If one makes an observation on a weakness, people
want to know that management will respond to the submission (Ullrich, 2012).
The fourth barrier is resignation, which is a feeling of lack of empowerment or
16
contribution (Dekker, 2007). With this in mind, effective feedback loop and
process integrity must be in place (Stolzer, 2011).
Learning Culture
A culture is a learning (adaptive) culture when both reactive and proactive
measures are used to guide continuous education and wide-reaching system
improvements rather than mere local fixes (ICAO, 2009). A learning culture is
ineffective without reporting, informed, and just cultures so as to acquire current data
and monitor past trends that may recur (Stolzer, 2008). A learning culture is always aware
of the potential risks and is aware of the past risks associated with any given procedure
(Reason, 1997).
Flexible Culture
A Flexible culture means an organization has the capacity to reconfigure itself to
continue running safely, even in times of stress or high tempo operations (United States
Airforce, 2004). A flexible sometimes requires changes in an organizational
transformation of a company’s beliefs (Wald, 2010;IATA , 2011). It involves the
changing of values and norms among employees in order to improve productivity (Simon,
2009). A safety policy should first be adopted to provide a fundamental guideline and
blueprint that will be embraced within an organization (Walton, 1985;Manuele, 2001).
A safety policy further defines the organization’s commitment to safety and overall
safety vision (ICAO, 2006; FAA, 2010).
ICAO further requires the identification of an accountable executive from the
top executives (an identifiable person having the responsibility for the effective and
efficient performance of the organization) (Transport Canada, 2005). This person has

17
the authority to assign resources to fulfill the obligations of the Safety Management
System with resources for this SMS leadership position (ICAO, 2009). Implementing a
culture change is introspective, so imposing a cultural change in an organization may
meet with substantial resistance (In Wells, 2003).
Management Commitment
It is also essential to commit resources for the long term and to clearly identify a
phased implementation approach of a positive safety culture (Ullrich, 2012). Using
existing forms, structures, manpower and active roles from the bottom-up within the
organization could ease some of the resistance (Bos, 2007; Lu, 2008 ; Wood, 2003).
Meanwhile, management must continue showing strong support for SMS which
reinforces safety behaviors to be fully embraced as a norm (Piers, 2009). Due to
Hawthorne Effect (Landsberger, 1958) there could be temporarily increased safety
awareness and safety climate simply because the employees are aware of the ongoing
supervisor’s involvement (Lu, 2008).
von Thaden (2008) stated that culture cannot be created overnight; thus changing
the mindset and behavioral norm would take some time and needs continuous
communication between management personnel and employees. Hudson ( 2001) also
believed that what the eyes and ears observe, the mind and heart will gradually follow to
get the momentum developed to initiate the cultural change.
Commercial Aviation Safety Survey (CASS)
Researchers at The University of Illinois at Urbana-Champaign (UIUC)
developed a measure associated with safety culture in high reliability organizations
(Gibbons, 2006). Since 2000 the Commercial Aviation Safety Survey (CASS) has been

18
distributed globally in the aviation industry to large and small airlines and repair
stations alike (von Thaden , 2006). The instrument has been refined to a four-factor
model reflecting Organizational Commitment, Formal Safety programs, Operations
Interactions, and Informal Safety programs (Figure 3) (Weigmann, 2004; Gibbons, von
Thaden & Wiegmann, 2006; von Thaden, Gibbons & Li, 2007, von Thaden, 2008). The
CASS identifies the respondents’ perception of the current state, as well as the strengths
and weaknesses, of the safety culture in an organization.
Dimensions of Safety Culture Model of CASS
There are some dimensions which define the indicators of a safety culture in any
aviation organization and they are scaled in the four factor model of safety culture (von
Thaden, 2008).These indicator scales are organizational commitment (OC), Operation
interaction (OI), Formal safety indicators (FS) and Informal safety indicators (IS). The
four scales are correlated with Safety Behavior (SB) which includes the perception of
the organization’s risk (OR) and individual personal risk (PR) (von Thaden , 2008).
Organizational Commitment (OC)
Organizational commitment is reflected in three major areas: Safety Values
(SV) the attitudes and values regarding safety expressed, in words and actions, by
leadership; Safety Fundamentals (SF) the compliance with regulated aspects of
safety such as training requirements, manuals, etc.; and Going Beyond
Compliance (GBC) wherein priority is given to safety in the allocation of
company resources (e.g., equipment, personnel time) even though they are not
required by regulations.

19
Operations Interactions (OI)
Operations Interaction is reflected in the working relationships between pilots and
middle management, supervisors, and other distributed operations personnel (e.g. chief
pilots, instructors/trainers, ground personnel, maintenance, dispatch, etc.) It takes into
account involvement in and concern for safety on their part. This entails the priority
given to safety by operations personnel and their regard for the actual risks and issues
associated with flying the line.
Formal Safety (FS)
Formal safety indicators are reflected in three areas: Reporting System (RS)
which refers to the accessibility, familiarity, and actual use of the aviation operator’s
formal safety reporting program; Response and Feedback (RF) which entails the
timeliness and appropriateness of management responses to reported safety information
and dissemination of safety information to employees; and Safety Personnel (SP) the
perceived effectiveness of and respect for persons in formal safety roles (e.g., Flight
Safety Officer, Director of Safety).
Informal Safety (IS)
Informal safety indicators are reflected in Accountability (ACC) the consistency
and appropriateness with which individuals are held accountable for unsafe behavior;
Authority (AU) which entails employee involvement and empowerment in safety
decision making and Professionalism (PRO) reflected in areas such as peer culture for
safety, pilot professionalism.
Safety Behavior (SB) has subscales of personal risk (PR) and organizational risk
(OR) and shows the perceived personal risk of personnel and the overall organizational

20
risk and how they are interrelated. The perceptions of personnel on their risky attitudes
and at risk attitudes of others in the organization can have an effect on the safety behavior
in the organization (Cooper, 2000). A graphical representation of the CASS is showing
the organizational indicators of safety culture, can be seen in Figure 3.

21
Figure 3 . Four factor model of safety culture in the CASS (vonThaden, 2008.)

22
CHAPTER II
METHODOLOGY
This chapter discusses the study population, sample, and design in detail. The
Collegiate Aviation Program Safety Culture Survey (CAPSCUS) was developed by
adapting the CASS and modifying it to specifically assess the safety culture in the flight
operations of an accredited collegiate aviation program (Creswell, 2009). A screen shot
of the survey is attached as Appendix A. The adaptation and modification was done
with permission (von Thaden, 2012;Creswell, 2009).
Validity
A factor analysis in the form of Principal Component Analysis ( PCA) was
conducted on the modified questionnaires in the survey to check the content validity.
Content validity assesses the degree to which individual items represent the construct
being measured (Field, 2009). PCA is normally used to develop questionnaires and is
concerned with only establishing which linear components exist within the data,and how
a particular variable might contribute to that component (Tabachnick, 2007).
Reliability
Relaibility check for all scales were run using the Cronbach alpha coefficient.
This is a common measure of reliability of scales and is based on the correlation between
items that can be found on a scale and the length of the scale ( Field,2009). The value of
alpha can range from zero to one,but standards regarding it’s size depends on a factor.

23
Table 1. Scales Inventory for the CAPSCUS as Modified From the CASS.
Population
The CAPSCUS was used to survey the perceptions of collegiate flight students
and certified flight instructors of the safety culture at an accredited CFR Part 141
flight training and four year degree awarding collegiate aviation department of a
university in the North Western region of the United States of America (N= 945). The
anonymous voluntary survey was delivered online in the English language. Participants
were assured of the confidentiality of their responses (Appendix B). The population
for the study included all four (4) year groups of commercial aviation students,
international contract flight students and certified flight instructors at the university.
CAPSCUS Major factor Scales Sub-factor Scales
Formal Safety Program Reporting System Response and feedback Safety Personnel Informal Safety Program Accountability Pilot Authority Professionalism Operations Interaction Supervisor of Flight/Lead Flight /Chief Flight Instructor Dispatch/Ground and Ramp Personnel Organizational Commitment Safety Values Safety Fundamentals Going Beyond Compliance
24
The researcher sent a cover email invitation letter to all the participants’
mailboxes with the internet web link of the survey. The participants had access to the
site and web link through a user name and password. Once securely logged in,
participants responded to items in the survey instrument using a five (5) point Lickert
scale (strongly disagree, disagree, neither disagree nor agree, agree, strongly agree) and
a non-applicable option (Creswell, 2009). There was also an allotted space for
respondents to include any additional comments. The data were collected and stored on
a secure server of the University.
Sample
Sample participants were drawn from commercial aviation students, international
contract flight students and certified flight instructors (CFIs) who are engaged in flight
training at the aviation department. Air Traffic Control (ATC) students, Aviation
Management students, Unmanned Aerial Systems (UAS) students and Graduate students
at the aviation department were excluded from the study because the focus was on flight
personnel (Pilots).This was done to avoid any confounds (Creswell, 2009).
Study Design
Sample participants were recruited in several ways. First, an e-mail (Appendix
C) was sent to a mailing list of all commercial aviation students in the aviation
department through the assistance and permission of the chair and the various aviation
students’ association leadership. An online advertisement was placed on the aviation
department and students’ association website. Paper flyers were placed on notice boards
in the Aviation Department on campus and the airport. The researcher sought permission
from faculty to personally conduct class by class awareness drive for the survey.

25
Students Participation
The assistance of the various aviation student associations was requested to
publicize, the survey at meetings and through their website. This personal outreach was
to further provide guidelines to any problem that will be encountered in trying to access
the website and links. It also afforded the researcher an opportunity to clarify any issue
on the survey. All the methods included a description of the study and the Internet
hyperlink.
On line Survey Tool
The survey was administered through an online survey tool called Qualtrics®.
The survey was administered online to allow for simplicity of delivery and anonymity
for the participants. In addition, this online method of delivery allowed participants to
complete the survey at their own leisure. Once the participant loaded the survey, the first
page included a description of the research and instructions on how to complete the
survey.
Response Period
The survey was available from any computer with internet and link to the
aviation department’s secure website. The survey allowed participants to have plenty of
opportunity to provide more information if they wished to do so and some open ended
questions were asked to specifically explore the nature of these activities. There were
thirty questions broken into the following sections: Formal safety, Informal safety,
Operational interactions, Organizational commitment, Safety behavior and lastly
demographics.

26
The survey was active from the winter operational period of early February till
the first week of March. After the response period was over, the submitted responses
were downloaded from the secure site for analysis. Some of the submitted responses
from the survey were excluded, from the total responses during analysis by the SPSS ®
software due to missing data. These comprised of the responses from participants, who
failed to answer any question beyond the consent page or did not answer any of the
survey questions for that section.
Methods and Data Collection
The aim of this study was to use both quantitative and qualitative data of the
perception of flight students and flight instructors to assess the safety culture in a
collegiate aviation program. These are the questions that the data and analysis will seek
to answer:
1. What are the differences in perception among commercial flight students and certified
flight instructors (CFIs) on the status of the safety culture at an accredited four year
collegiate aviation program?
2. What are the differences between the perception of international contract students and
indigenous US students on the status of the safety culture at an accredited four year
collegiate aviation program?
3. What is relationship between the perception of respondents (flight students and
certified flight instructors) regarding the informal safety and operation interaction at an
accredited four year collegiate aviation program?

27
4. What is the relationship between the perception of respondents (students and certified
flight instructors) on the formal safety program and their safety behavior at an accredited
four year collegiate aviation’s program?
5. What is the relationship between the perception of respondents (students and certified
flight instructors) on organizational commitment to safety and perceived attitudes that
affects safety behavior at an accredited four year collegiate aviation program?
Participant’s responses were received via the online survey tool and saved when
the participants completed the survey. When the survey collection period ended, the
responses were exported into Statistics Program for Social Sciences (SPSS) ® and
securely given to the researcher for analysis.
Protection of Human Subjects
Participants volunteered their time and responses for this survey on their own
free will and there was no form of coercion. Every effort was made to protect
participants from harm. The survey received approval from the Institutional Review
Board of the University of North Dakota. All subjects were informed that participation
was voluntary and that they need only answer the questions they felt comfortable
answering. Any response received in the essay format questions that could identify any
specific person was de-identified by the researcher. The online survey tool collected no
data that could link any specific survey to a participant.
28
CHAPTER III
RESULTS AND DATA ANALYSIS
Data Analysis
Quantitative data was imported into the SPSS ® software and analyzed. All the
additional comments and responses were coded manually by the researcher for themes
and analyzed using SPSS. Significant values were set at the 0.05 alpha levels (2-
tailed).The survey was tested for content validity and reliability of scale. The major
scales of the CAPSCUS were Formal Safety Program, Informal Safety Program,
Operations Interactions and Organizational Commitment. There was also an aspect of
Safety Behavior and responses were then correlated with components of the major
scales.
Content Validity
A Principal Component Analysis ( PCA) was conducted on the 61 items with
orthogonal rotation ( varimax). The Kaiser-Meyer- Olkin ( KMO) measure verified the
sampling adequacy for the analysis, KMO = .84 and all KMO values for individual
items was > .85,which is well above the acceptable limit of .5 (Field, 2009). Bartlett’s
test of sphericity χ²(1891) = 6304,p<.001,indicating that correlation between items were
sufficiently large for PCA. Thirteen components were extracted and had Eigen values
greater than Kaiser’s criterion of 1 and in combination explained 73.90% of the
variance.

29
Reliability
All the four major scales of the CAPSCUS (Formal Safety, Informal Safety,
Operations Interaction and Organizational Commitment) showed high reliabilities. Test
reliability refers to the consistency or reliability of a questionnaire items (Stevens, 2002).
A reliable scale is one that will yield the same score for two different individuals with
the same true level of the trait or attitude being measured, or for one individual tested
twice (assuming that no changes have occurred between tests) ( Cronbach,1951;Cortina,
1993) . Within a scale, items that assess the same underlying dimension are related or
correlated with one another (Fields, 2009; Creswell, 2009). The values for reliability are
outlined in Table 2 and show the Cronbach’s alpha values for all major scales.
Table 2. Cronbach’s alpha for CAPSCUS.
Major Scale Number of Items in scale (N) Cronbach’s α
Formal Safety Program 15 .90
Informal Safety Program 14 .85
Operations Interaction 19 .87
Organizational Commitment 14 .86
Total for CAPSCUS 62 .96
Demographic Information
At the end of the response period, (N= 234) responses were obtained from the
survey and comprised of fully (N= 142) completed responses representing 61% return
rate. About 51.7% of the respondents provided comments in the text boxes provided for
extra comments. There were some missing data in the responses and could not be used

30
for analysis due to the fact that the respondents decided not to answer those questions.
The SPSS software was used to sort out the data with missing components and it was
reported in the analysis. The breakdowns of the various responses are outlined under the
major scales.
Years in Flight Program
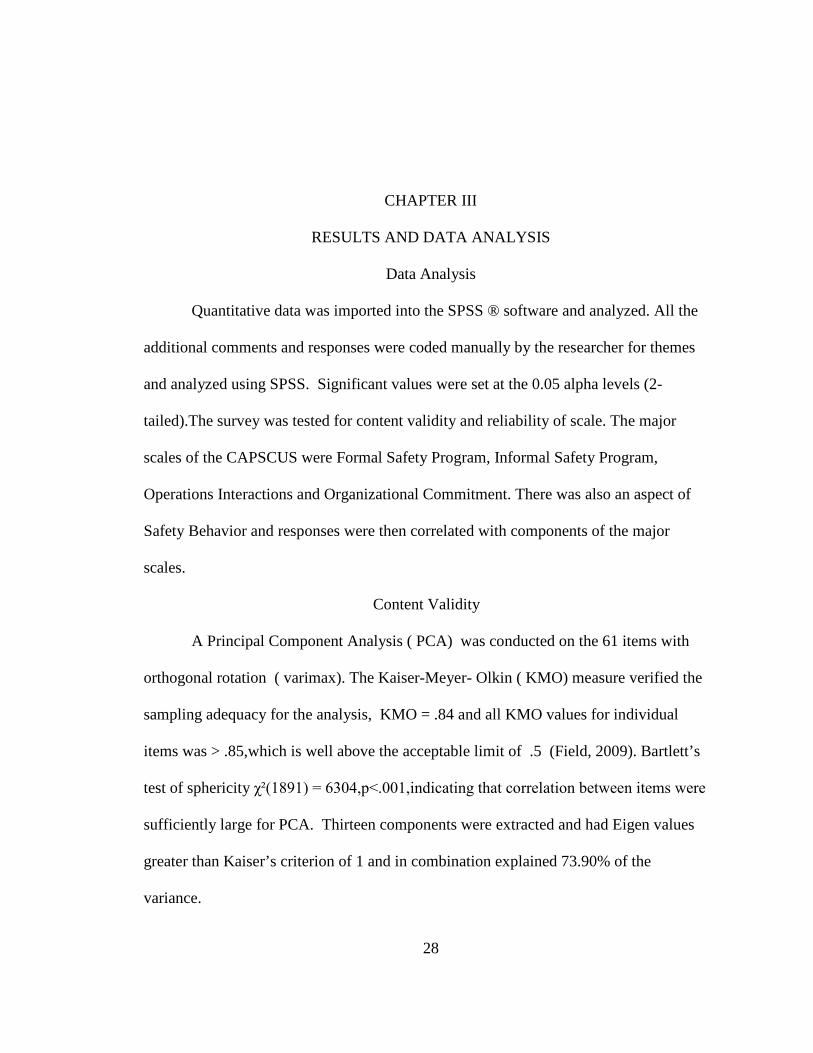
34% of respondents identified themselves as freshmen, 5% were sophomore,
juniors were 17%, seniors were 22% and CFI/others were 21%. This number represents
respondents who answered the demographic question about their status in terms of years
spent in the flight program as students and CFI at the university. Those respondents
who did not answer this question were removed by the SPSS® program. The total is
found in Table 3 and figure 4.
Table 3. Category of Respondents
Category Number (N) Percentage (%)
Freshmen 46 34
Sophomore 7 5
Junior 23 17
Senior 30 22
CFI/Others 28 21
Total 134 100
31
Figure 4. Category of respondent (years spent in the flight program).
Gender
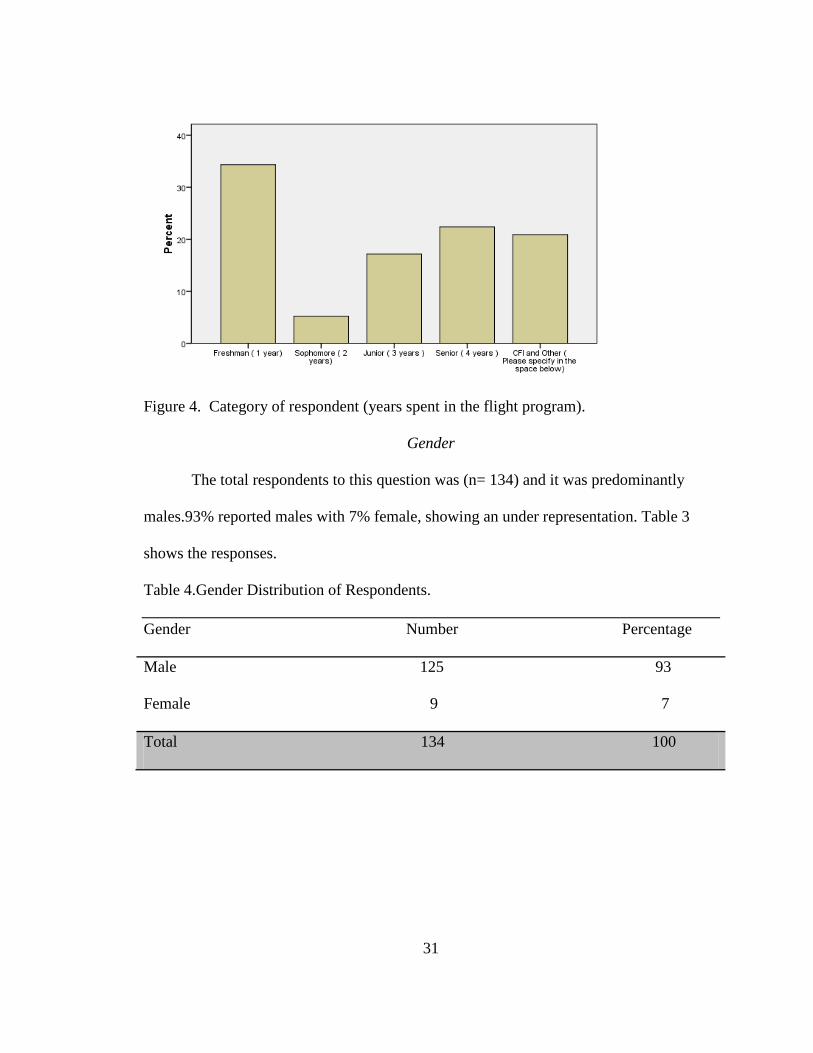
The total respondents to this question was (n= 134) and it was predominantly
males.93% reported males with 7% female, showing an under representation. Table 3
shows the responses.
Table 4.Gender Distribution of Respondents. Gender Number Percentage
Male 125 93
Female 9 7
Total 134 100
32
Figure 5. Gender of Respondents
International Contract Students
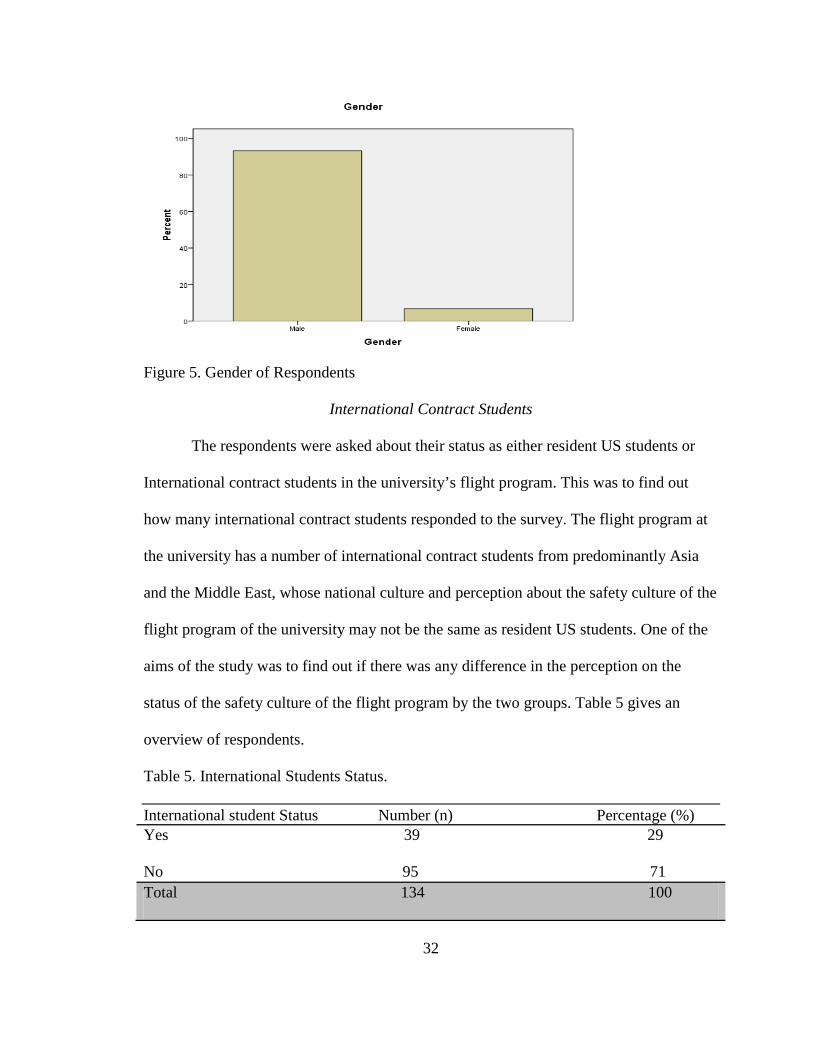
The respondents were asked about their status as either resident US students or
International contract students in the university’s flight program. This was to find out
how many international contract students responded to the survey. The flight program at
the university has a number of international contract students from predominantly Asia
and the Middle East, whose national culture and perception about the safety culture of the
flight program of the university may not be the same as resident US students. One of the
aims of the study was to find out if there was any difference in the perception on the
status of the safety culture of the flight program by the two groups. Table 5 gives an
overview of respondents.
Table 5. International Students Status. International student Status Number (n) Percentage (%) Yes 39 29
No 95 71 Total 134 100

33
Figure 6. International Student Status.
Age Group
Respondents were asked to give their age range. 12% reported that they were
below 20 years,79% between 20-30 years,4% were 31-40 year group,1% was 41-50 year
group,4% was 51-60 year group and 1% reported over 60 years. The year group summary
is given below in table 6 and figure 8. It shows that the group with the greatest number
was the 20-30 year group, which is normal, since the sample consisted mostly of flight
students.

34
Table 6. Age Group of Respondents.
Age Group Number (N) Percentage (%) Below 20 16 12
20-30 106 79
31-40 6 4
41-50 1 1
51-60 4 3
60+ 1 1
Total 134 100
Figure 7 shows the graphical summary of the age distribution of respondents.
Figure 7. Age Distribution.

35
Airman Certificates and Ratings of Respondents
Respondents were asked to provide the highest airman certification (FAA) and
ratings acquired. 13% were student pilots, 39% private, 5% commercial–single engine,
15% commercial-multiengine, 3% CFI, 11% CFII, 6% MEI, 7%ATP, 5% mixed
certificates. Most of the mixed certificates were those who chose to include their
commercial and air transport pilot certificates to their flight instructor certificates. Table
7, highlights the certificates and ratings.
Table 7. Airman Certifications and Ratings. Airman Certificates/Ratings Number (N) Percentage (%)
Student 18 13
Private 52 39
Commercial Single-Engine 7 5
Commercial Multi-Engine 20 15
CFI 4 3
CFI (Instrument) 15 11
Multi-Engine Instructor (MEI) 8 6
Air Transport Pilot (ATP) 3 7
Others/Mixed Certificate 7 5
Total 134 100

36
Figure 8. Airman Certification and Ratings .
Safety Reporting
Respondents were asked whether they have ever reported any safety problems or
occurrence in the flight program at the university. This was to get an idea of how their
perceptions correlated with their safety reporting behavior. 38% of the respondents said
Yes and 62% replied No. The summary of the responses are outlined in the table 8 and
figure 9.
Table 8. Reporting of Safety Problems .
Reporting Safety Problems Number (N) Percentage (%) Yes 50 38
No 83 62
Total 133 100

37
Figure 9. Reporting of Safety Problems.
Summary of the Survey Results
A Five (5) point Likert Scale gave respondents, the choice to select their response
as either strongly disagree,disagree,neither agree/disagree,agree,strongly agree and non-
applicable/no response. Values (1, 2, 3, 4 and 5) were assigned to responses in that order.
The value (0) was assigned to non-response and (6) assigned to non-applicable. The scale
mid-point was neither agree/disagree (3) and negatively worded items were reverse coded
using SPSS, to obtain a standardized and comparable reading for the data. The scale
reflected, that higher measurement values, represented higher quality of safety culture.

38
Formal Safety Scale Indicator
Out of the total responses submitted (N= 234) at the end of the survey period,
(N=71) responses were excluded, by the SPSS program, because either there was no
response or the non-applicable option was selected by respondents for that section. The
usable responses were (N= 163). The mean (M= 3.65), and Standard Deviation (SD =
0.53) perception of respondent on the Formal Safety program of the university was above
the neutral point value of 3 (Neither agree nor disagree) on the 5 point Likert scale. This
shows that on the average respondents had a good perception of the program as reflected
on the indicator scale. The sub scales for Formal Safety were Reporting Systems,
Response and Feedback and Safety Personnel.
Reporting Systems
The Reporting system sub scale (N= 123) had five items. The highest mean (M=
4.16, SD = 0.97) perception was for the question ‘The safety reporting system of the
university is convenient and easy to use’. A simple bar graph and box plot was used to
for analysis of the result. Box plots are able to visually show different types of
populations, without any assumptions about the statistical distribution (Field, 2009).
The spacing between the different parts of the box helps to indicate variance and skew
and to identify outliers.
The box itself contains the middle 50% of the data. The upper edge (hinge) of
the box indicates the 75th percentile of the data set, and the lower hinge of the box
indicates the 25th percentile. The line in the box indicates the median value of the data.
If the median line within the box is not equidistant from the hinges, then the data is
skewed. The ends of the vertical lines or "whiskers" indicate the minimum and

39
maximum data values, unless outliers are present in which case the whiskers extend to a
maximum of 1.5 times the inter-quartile range. The points outside the ends of the
whiskers are outliers or suspected outliers.
Figure 10. Histogram showing responses for ‘Safety system is convenient to use’.
Figure 11 . Box plot of responses for ‘safety reporting system is convenient to use’. The figure shows that almost 75 % of respondents had a highly favorable
perception about the convenience and ease of use of the university safety reporting

40
system that was above the mean perception (4.16). The lowest mean perception for
responses to a question in this sub-scale was (M= 3.14, SD= 1.83) ‘Pilots do not bother
reporting near misses or close calls, since this event does not cause real damage’. Note
this mean perception is still above the neutral point of the scale.
Figure 12. Histogram of responses for ‘Pilots do not bother reporting near misses or close calls’.
Figure 13. Box –plot of responses to ‘pilots do not bother reporting near misses or close
calls’.
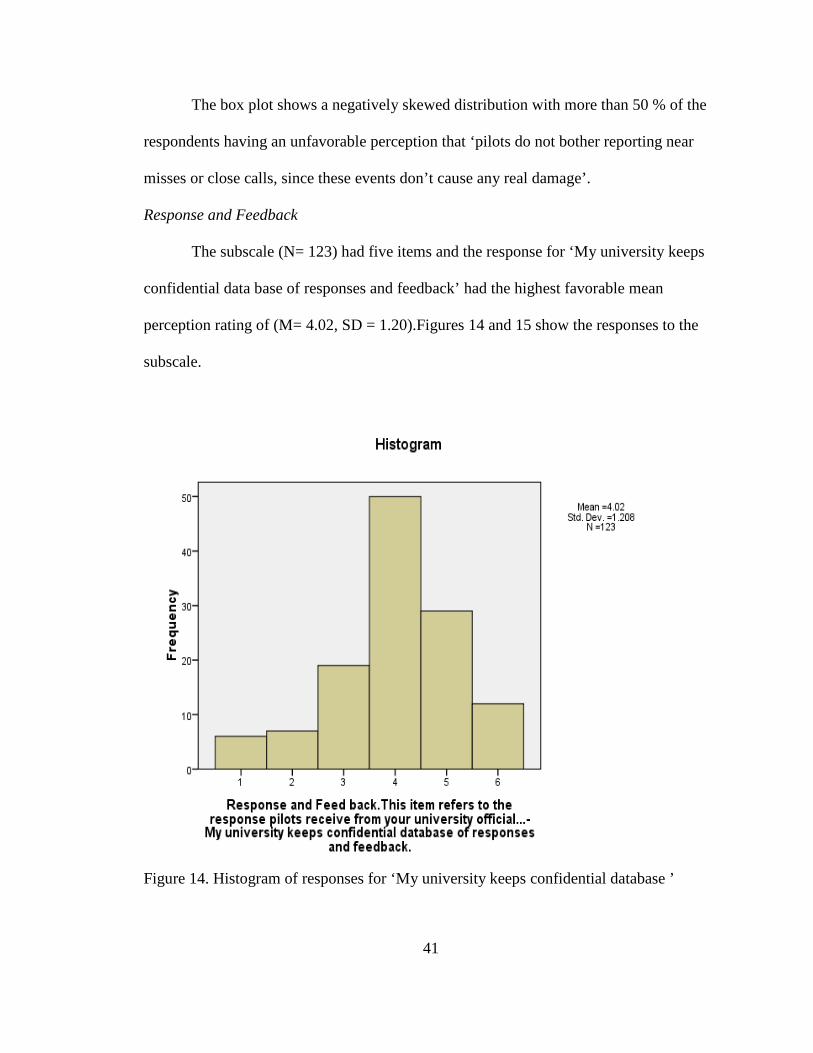
41
The box plot shows a negatively skewed distribution with more than 50 % of the
respondents having an unfavorable perception that ‘pilots do not bother reporting near
misses or close calls, since these events don’t cause any real damage’.
Response and Feedback
The subscale (N= 123) had five items and the response for ‘My university keeps
confidential data base of responses and feedback’ had the highest favorable mean
perception rating of (M= 4.02, SD = 1.20).Figures 14 and 15 show the responses to the
subscale.
Figure 14. Histogram of responses for ‘My university keeps confidential database ’

42
Figure 15. Box Plot of Responses to ‘My University keeps confidential database ’. For this subscale, the least favorable mean perception was on the response for
‘My University only keeps track of major safety problems and overlooks routine ones’.
The mean perception was (M= 3.52, SD= 1.72). Figures (16, 17) show the histogram and
box plot of responses respectively.
Figure 16. Histogram of responses for ‘My University only keeps track of major safety problems and overlook routine ones…. ’.

43
Figure 17. Box plot of responses to ‘My University only keeps track of major safety problems and overlook routine ones ’ Safety Personnel
There are five items in this subscale (N= 123). The response with the highest
mean was ‘Personnel responsible for safety have a clear understanding of the risk
involved in flight training’. The responses showed that most respondents perceived that
safety personnel had a clear understanding of the risk involved in flight training. The
mean value of this perception was (M= 4.21, SD= 1.72).Figure 18 and 19 shows the
histogram and box plot of the responses.
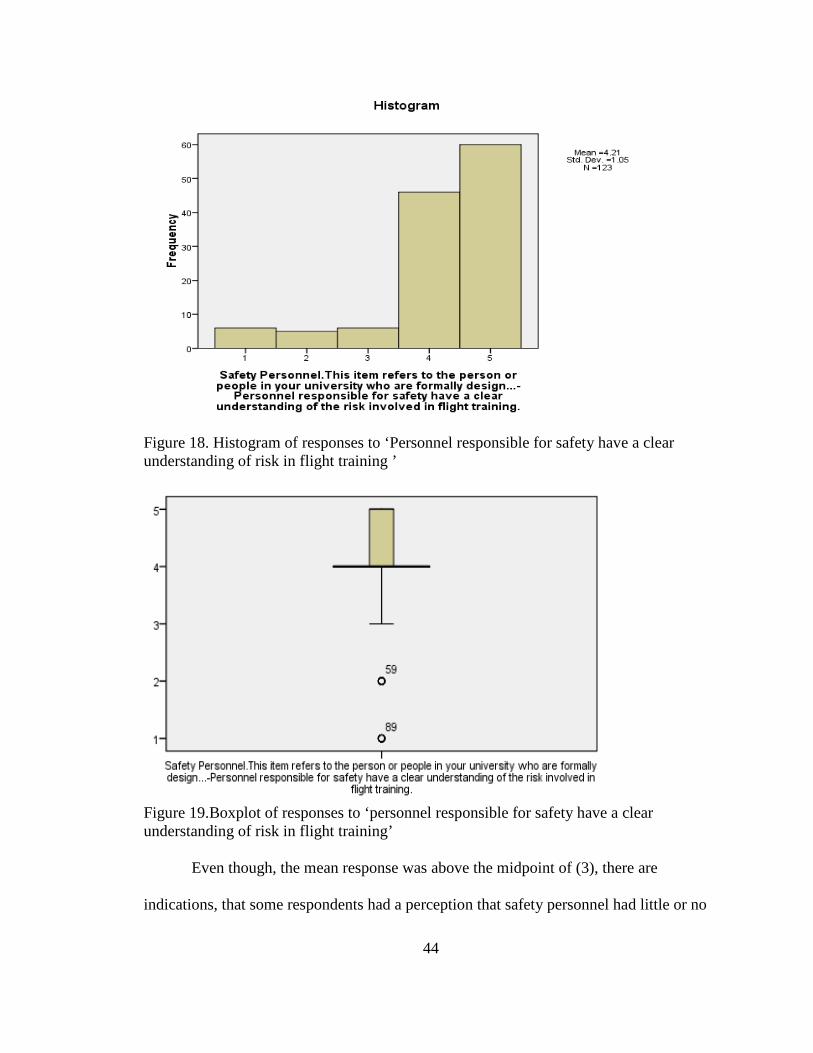
44
Figure 18. Histogram of responses to ‘Personnel responsible for safety have a clear understanding of risk in flight training ’
Figure 19.Boxplot of responses to ‘personnel responsible for safety have a clear understanding of risk in flight training’ Even though, the mean response was above the midpoint of (3), there are
indications, that some respondents had a perception that safety personnel had little or no

45
authority compared to operational personnel. The response for this statement yielded the
least mean (M= 3.75, SD= 1.72).Figures 20 and 21 shows the histogram and box plot of
the responses respectively.
Figure 20. Histogram of responses to ‘Safety personnel have little or no authority compared to operational personnel.’
Figure 21. Box plot of responses to ‘Safety personnel have little or no authority compared
to operational personnel.’

46
Informal Safety Scale Indicator
Ninety three (93) responses were excluded by the SPSS software, representing
39.7% of submitted responses and the useable responses (N= 135) was 60.3 %. The mean
(M= 3.30, SD = 0.36) was also above the neutral point of 3 on the 5 point Likert scale.
This showed a favorable perception of respondents to the informal safety program of the
university. The Informal Safety (IS) had three sub-scales namely Accountability/Just
Culture, Pilot Authority and Professionalism.
Accountability/Just Culture
The sub-scale had five items and the highest mean perception of respondents was
on the item ‘Standards of accountability are consistently applied to all pilots in the
university’ (M=3.78, SD=1.82).This shows that respondents generally had a good
perception on the item. The respondents however had a rather poor perception about the
item ‘University management shows favoritism to certain pilots’ (M= 2.87, SD=
1.82).This shows a lingering perception that some level of favoritism occurs. Figures (22,
23) show the Histogram and Box plot of the item respectively.
Figure 22. Histogram of ‘Standards of accountability are consistently applied to all pilots’.

47
Figure 23. Box-Plot of ‘Standards of accountability are consistently applied to all pilots’. Pilot Authority
The sub-scale (N= 123) had five items and the item with the highest mean was
‘Pilots have little real authority to make decision that affect safety of normal flight
operations’ (M= 3.50, SD= 1.87) .This shows that generally there was a perception that
respondents had real authority to make decisions that affect safety of normal flight.
Figures (24, 25) show the histogram and box-plot of the responses in this sub-scale.
Figure 24. Histogram of ‘pilots have little real authority to make decisions that affect the safety of flight’.

48
Figure 25. Box-plot of ‘pilots have little real authority to make decisions that affect the
safety of flight’. Respondents were however strong in their perception that ‘Pilots are seldom
asked for input, when university aviation procedures are developed or changed’ (M=
2.61, SD= 1.76) by agreeing to the item. This shows how they perceive their role in
review and change of operations procedures. This was the lowest mean in this sub-scale.
Figures (26, 27) show the histogram and box-plot of the item.

49
Figure 26. Histogram of ‘Pilots are seldom asked for input, when university aviation
procedures are developed’.
Figure 27.Box-plot of ‘Pilots are seldom asked for input, when university aviation
procedures are developed’.

50
Professionalism
The sub-scale of Professionalism had five items and the item ‘pilots who do not
fly safely quickly develop a negative reputation among other pilots’ had the highest mean
(M= 3.71, SD= 1.04).This consolidates the perception that respondents don’t compromise
unsafe acts and actions detrimental to safety of flight. Figures (28, 29) show the
histogram and box plot of the responses to the item. This is one item that shows the level
of peer to peer influence over the safety behavior and personal risk assessment of
individual pilots. It consolidates the organizational safety culture and how far it has been
imbibed by personnel.
Figure 28. Histogram of ‘Pilots who don’t fly safely quickly develop a negative reputation among other pilots’.

51
Figure 29. Box-Plot of ‘Pilots who don’t fly safely quickly develop a negative reputation
among other pilots’.
The item ‘Pilots never cut corners or compromise safety regardless of the
operational pressure to do so’ had the lowest mean (M=2.77, SD= 1.17). There was
however a strong perception that pilots will cut corners and compromise safety when
under operational pressure to do so. Figure 30 and 31 shows the histogram and box-plot
of the items.

52
Figure 30. Histogram of ‘Pilots never cut corners or compromise safety regardless of pressure to do so’
Figure 31. Box-Plot of ‘Pilots never cut corners or compromise safety regardless of pressure to do so’

53
Operations Interaction Scale Indicator
The total responses for this section was (N=135) representing 57.7 % of useable
responses.93 responses representing 42.3% were excluded by the SPSS software due to
missing data components. The mean value for the perception of respondents was
(M=3.30, SD =0 .71).This mean was above the neutral point of 3 on the 5 point Likert
scale used. The result shows a fairly good perception of the operational interaction scale
indicator of the university’s flight program. The scale had four sub-scales namely,
Supervisor of flight/Chief CFI/Lead CFI, Dispatch, Instructor/Trainers and Ramp
Operations.
Supervisor of flight/Chief CFI/Lead CFI
This sub-scale (N=123) had five items and respondents had high perception that
‘SoF/Chief CFI/Lead CFI has a clear understanding of the risk associated with flight
operations’. The item had the highest mean (M=4.13, SD= 0.96).Figures 32 and 33 shows
the responses for this item.
Figure 32.Histogram of ‘Chief/Lead CFI/SoF have a clear understanding of the risk associated with flight’

54
Figure 33. Box-Plot of ‘Chief/Lead CFI/SoF have a clear understanding of the risk associated with flight’ There was a high perception that pilots reported their safety concerns to their CFI
and Lead CFI rather than the safety department. This was evident in the evident in the
low mean for this item (M= 2.17, SD= 1.53). This was one of the items that were reverse
coded. Figures34 and 35 shows the histogram and box-plot of this item.
Figure 34. Histogram of ‘Pilots often report safety concerns to their Chief/lead CFI/SoF than the safety department’.

55
Figure 35. Box-plot of ‘Pilots often report safety concerns to their Chief/lead CFI/SoF than the safety department’. Dispatch
The sub-scale had four items and gave the perception of respondents to the
activities of flight dispatch. The highest mean was for the item ‘Dispatch is responsive to
pilots concern about safety’ (M= 3.90, SD= 1.13).The item shows a positive perception
of the operations of dispatch. Figures (36, 37) show the histogram and box-plot of the
item.
Figure 36. Histogram of ‘Dispatch is responsive to pilots concern about safety of operations’.

56
Figure 37.Box-Plot of ‘Dispatch is responsive to pilots’ concern about safety of
operations’.
The lowest mean for this sub-scale (N= 128) also showed a good perception of
dispatch procedures. The item ‘Dispatch would rather take a chance with safety than
cancel a flight’ (M= 3.62, SD= 1.81) showed that respondents generally had a perceived
confidence in the dispatch procedures, since this was one of the reverse coded items.
Figures (39, 40) show the histogram and box-plot of the item respectively.

57
Figure 38. Histogram of ‘Dispatch would rather take a chance with safety than cancel a flight’
Figure 39. Box-Plot of ‘Dispatch would rather take a chance with safety than cancel a flight’

58
Instructor/Trainers
The sub-scale (N= 128) had four items and all items were above the neutral point
(3) on the 5 point Likert scale used. The sub-scale was an overview of the perception of
respondents on the trainers and instructors in the flight program of the university. There
was a very good perception that these trainers and instructors consistently emphasized
safety during training at the university. ‘Safety is consistently emphasized during training
at my university’ (M = 4.23, SD= 0.87). Figures (40, 41) show the histogram and box-
plot of the item respectively.
Figure 40. Histogram of ‘Safety is consistently emphasized during training at my university’.
Figure 41. Box-Plot of ‘Safety is consistently emphasized during training at my university’

59
The least value for this sub-scale was ‘Instructors and trainers teach shortcut and
ways to get around safety requirements’ (M= 3.66, SD= 1.75), which was a good
perception. Figures (42, 43) show the histogram and box-plot respectively of the item.
Figure 42. Histogram of ‘Instructors/trainers teach shortcuts and ways to get around safety requirement’
Figure 43. Box-Plot of ‘Instructors/trainers teach shortcuts and ways to get around safety requirement’
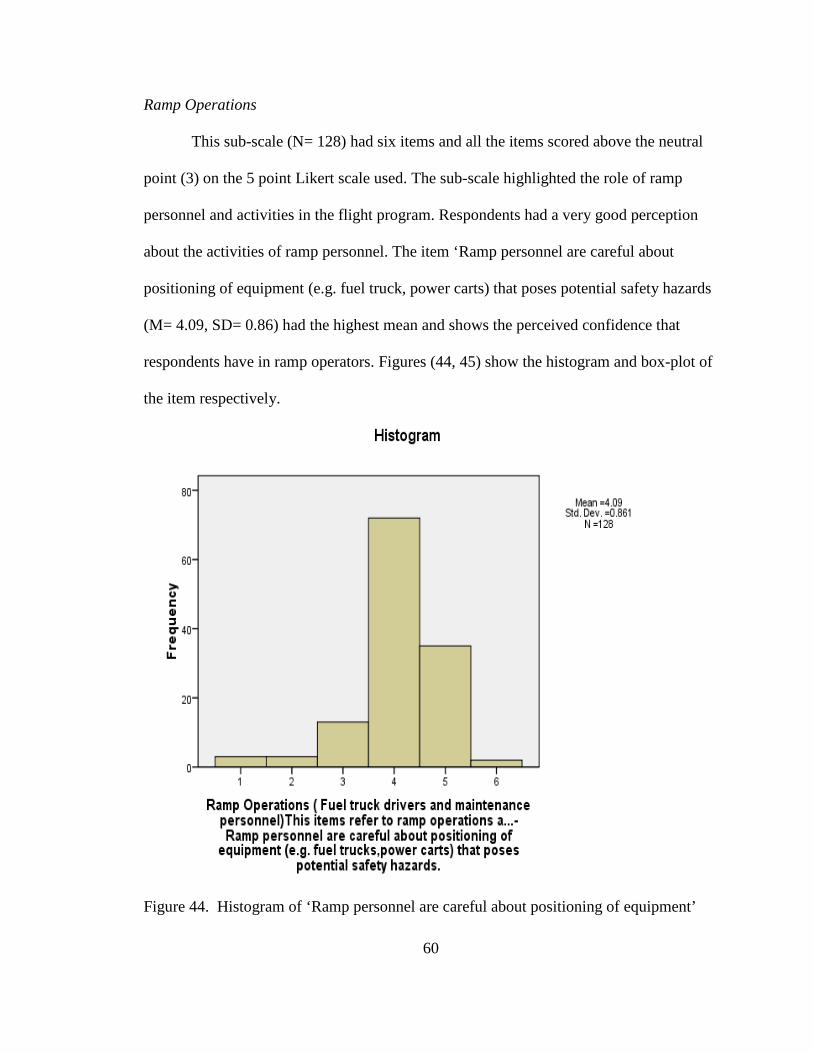
60
Ramp Operations
This sub-scale (N= 128) had six items and all the items scored above the neutral
point (3) on the 5 point Likert scale used. The sub-scale highlighted the role of ramp
personnel and activities in the flight program. Respondents had a very good perception
about the activities of ramp personnel. The item ‘Ramp personnel are careful about
positioning of equipment (e.g. fuel truck, power carts) that poses potential safety hazards
(M= 4.09, SD= 0.86) had the highest mean and shows the perceived confidence that
respondents have in ramp operators. Figures (44, 45) show the histogram and box-plot of
the item respectively.
Figure 44. Histogram of ‘Ramp personnel are careful about positioning of equipment’
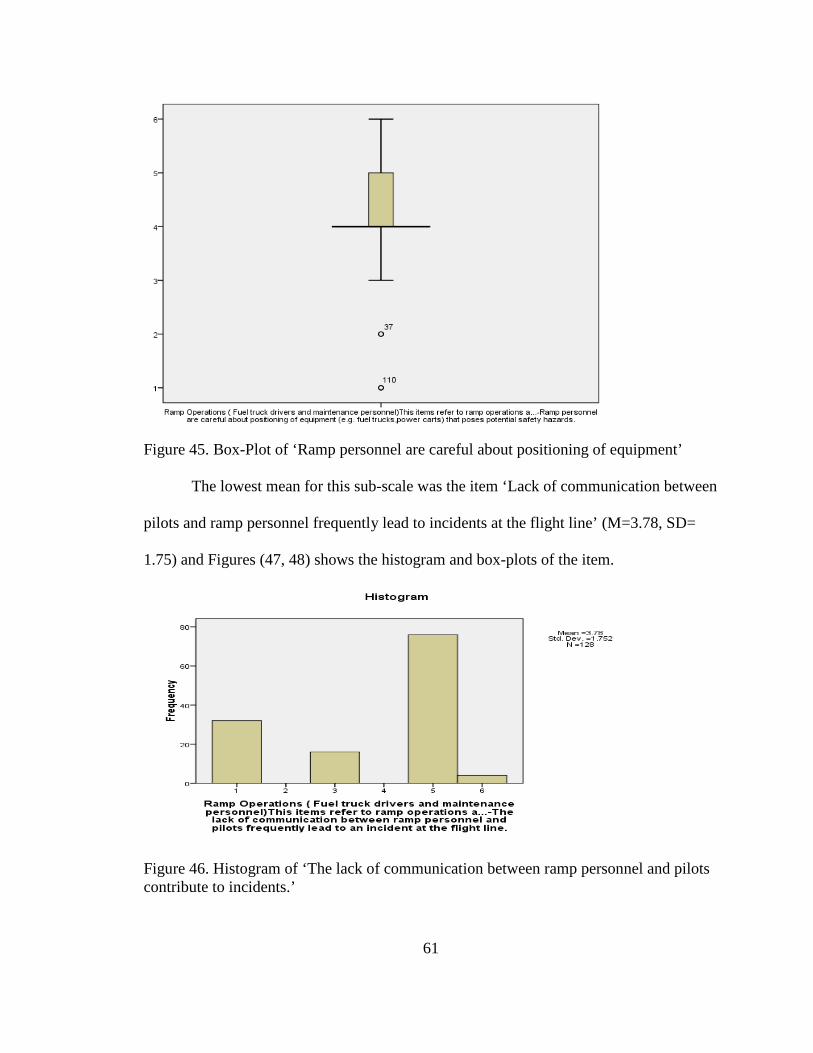
61
Figure 45. Box-Plot of ‘Ramp personnel are careful about positioning of equipment’ The lowest mean for this sub-scale was the item ‘Lack of communication between
pilots and ramp personnel frequently lead to incidents at the flight line’ (M=3.78, SD=
1.75) and Figures (47, 48) shows the histogram and box-plots of the item.
Figure 46. Histogram of ‘The lack of communication between ramp personnel and pilots contribute to incidents.’

62
Figure 47. Box-Plot of ‘The lack of communication between ramp personnel and pilots contribute to incidents.’
Organizational Commitment Scale Indicator
A total of 133 responses were useable and 101 responses were excluded by the
SPSS software from this scale. The mean value (M = 3.60, SD= 0.73) was also above the
neutral point on the 5 point Likert scale used. This scale had five sub-scales namely
safety values, safety fundamentals and Going beyond compliance.
Safety Values
The sub-scale Safety Values looked at the core values of safety in the university
flight program. There were five items and the perception of respondents on item ‘Safety
is a core value in my university’s scored the highest mean (M= 4.46, SD = 0.87).This
shows a high level of perceived confidence in the university’s safety values by
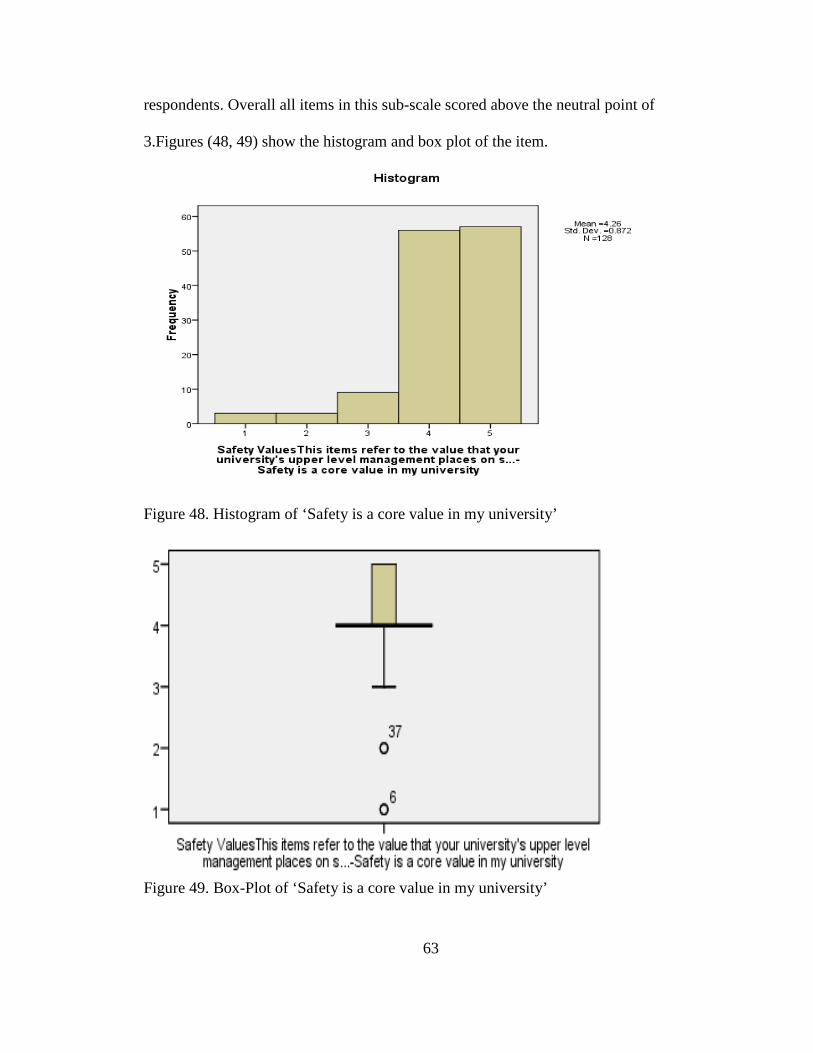
63
respondents. Overall all items in this sub-scale scored above the neutral point of
3.Figures (48, 49) show the histogram and box plot of the item.
Figure 48. Histogram of ‘Safety is a core value in my university’
Figure 49. Box-Plot of ‘Safety is a core value in my university’

64
The lowest mean was on the item ‘Management expects pilots to push for on time
performance, even if it means compromising safety’ (M= 3.34, SD = 1.76).Since the
mean response is closer to the neutral point, there are indication that some respondents
perceive that there are times when management push pilots for on time performance,
even if it will affect safety. Figures (50, 52) show the histogram and box-plot of the item.
Figure 50. Histogram of ‘Management expects pilots to push for on time performance’

65
Figure 51. Box-Plot of ‘Management expects pilots to push for on time performance’ Safety Fundamentals
The sub-scale (N= 128) had five items and all of them scored above the neutral
point of 3.The highest mean of the items was the perception about ‘My university ensures
that maintenance on aircraft are adequately performed and the aircraft is safe to operate’
(M = 4.42, SD = 0.84).This shows a very good perception about the maintenance and
safety of university aircraft for flight operations. Figures (52, 53) outline the histogram
and box-plot of the item.

66
Figure 52. Histogram of ‘My University ensures that maintenance on aircraft is adequately performed’
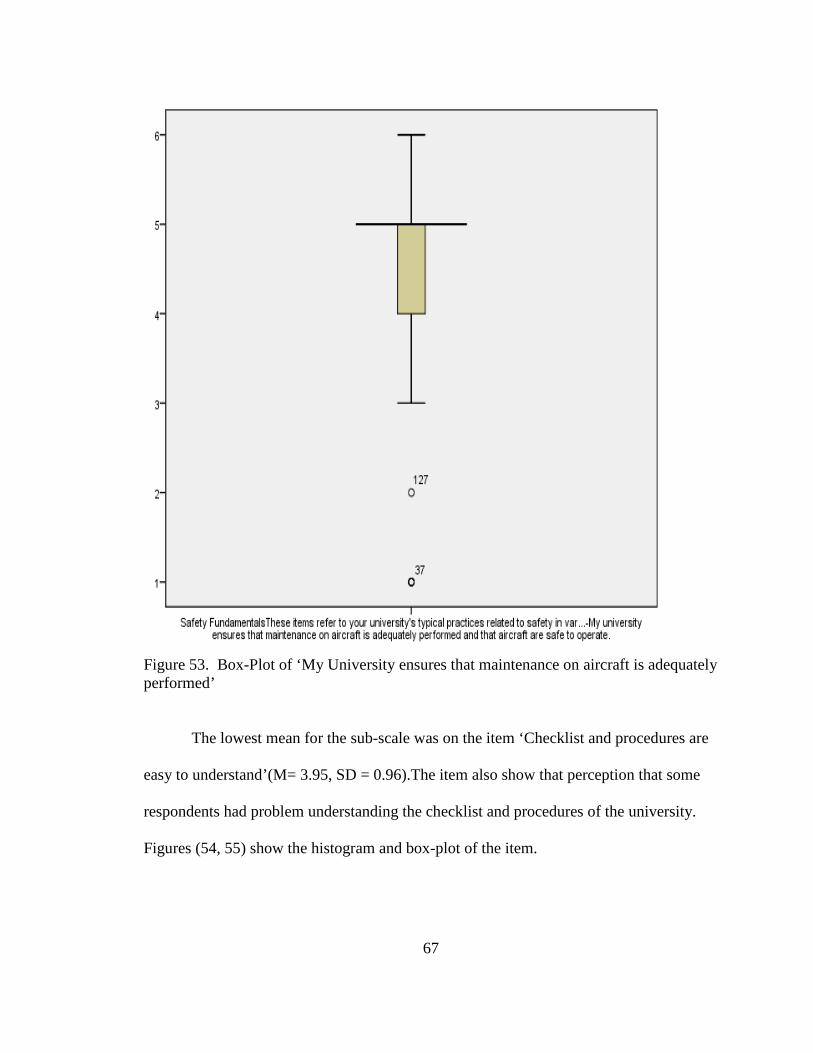
67
Figure 53. Box-Plot of ‘My University ensures that maintenance on aircraft is adequately performed’
The lowest mean for the sub-scale was on the item ‘Checklist and procedures are
easy to understand’(M= 3.95, SD = 0.96).The item also show that perception that some
respondents had problem understanding the checklist and procedures of the university.
Figures (54, 55) show the histogram and box-plot of the item.

68
Figure 54. Histogram of ‘Checklist and procedures are easy to understand’
Figure 55. Box-Plot of ‘Checklist and procedures are easy to understand’
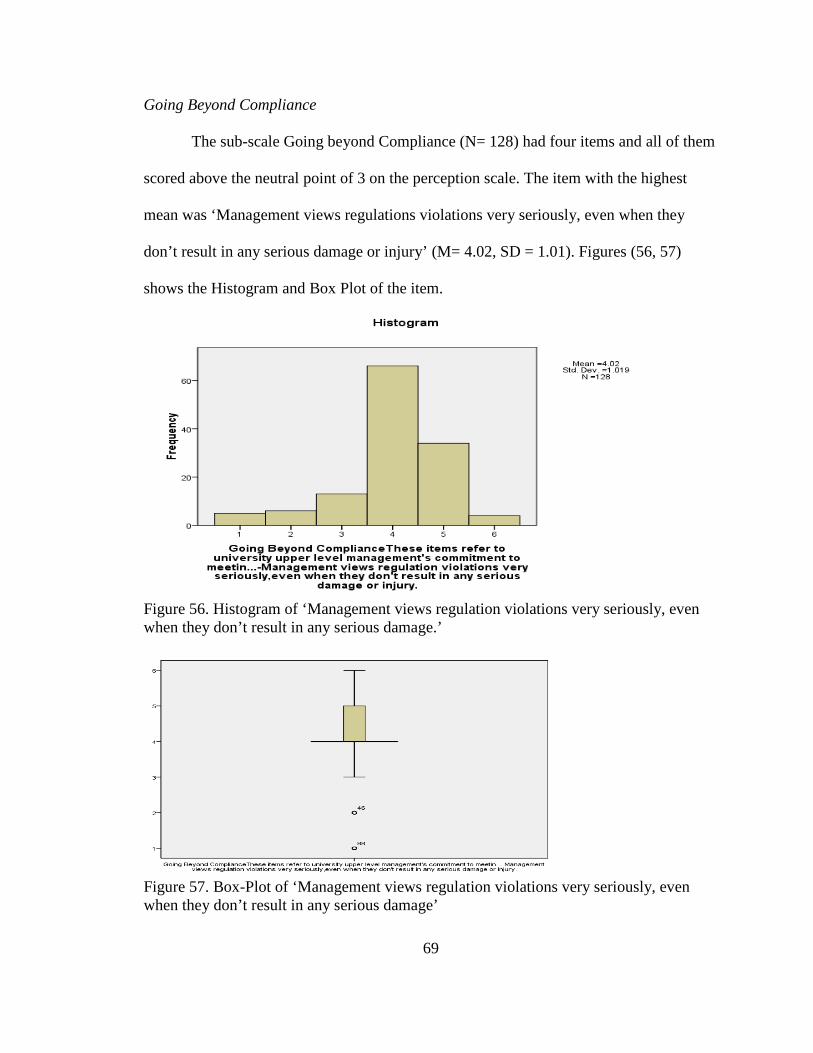
69
Going Beyond Compliance
The sub-scale Going beyond Compliance (N= 128) had four items and all of them
scored above the neutral point of 3 on the perception scale. The item with the highest
mean was ‘Management views regulations violations very seriously, even when they
don’t result in any serious damage or injury’ (M= 4.02, SD = 1.01). Figures (56, 57)
shows the Histogram and Box Plot of the item.
Figure 56. Histogram of ‘Management views regulation violations very seriously, even when they don’t result in any serious damage.’
Figure 57. Box-Plot of ‘Management views regulation violations very seriously, even when they don’t result in any serious damage’

70
The item with the lowest mean was the perception of respondents on
‘Management schedule CFI’s as much as legally possible, with little concern for their
sleep schedule or fatigue’ (M= 3.23, SD= 1.80). This was interesting as it showed
perception among some of the respondents that sleep schedule and fatigue to CFI’s was
compromised and a potential safety issue. Figures (58, 59) show the histogram and box-
plot of the item.
Figure 58. Histogram of ‘Management schedule CFI’s as much as legally possible ’

71
Figure 59. Box-Plot of ‘Management schedule CFI’s as much as legally possible’
University Safety Record
Respondents were asked about their general perception and forecast for the safety
of flight operations at the university and figures 61, 62 and 63 shows their predictive
perception on the safety of flight operations at the university. The results shows that
generally there was a perception that within the next 12 months of flight operations at the
university, there is a chance of an accident occurring and Table 9 and figures 60, 61 and
62 outlines the results of their perception. The perceptions on the likelihood of an
accident (M=2.89, SD=1.23) was below the neutral point of 3 and indicates a negative
perception.
The perception of respondents on the likelihood of an incident (M=2.42,
SD=1.13) shows that there was a negative perception, that a major incident was likely to
occur in the next twelve months. The perception that the flight program of the university
would be cited for violations by the FAA (M=3.73, SD=1.20) showed that most
respondents disagreed and perceived otherwise.

72
Table 9. University Safety Records.
Figure 60. Histogram of ‘ likelihood of an accident in the flight program’.

73
Figure 61. Histogram of ‘ likelihood of an incident in flight program’
Figure 62. Histogram of ‘likelihood of FAA citation’.

74
Research Results
Question One
What are the differences in perception among respondents [commercial flight
students and certified flight instructors (CFIs)] on the status of the safety culture in an
accredited four year collegiate aviation program?
An analysis of variance (ANOVA) was used to find if there were any significant
differences in the mean responses of the participants on the safety culture of the flight
program. A one way independent ANOVA and post –hoc (Games-Howell) analysis was
used to find out which groups differ in their mean responses, since no specific hypothesis
was generated before the research (Field, 2009). There was a significant difference in the
mean responses of perception on the item ‘I feel like I am gambling with the safety of my
aircraft every time, I go on a training activity’, F(4,128) =2.83, p < .05 ( 2- tailed) which
falls under the sub-scale of Ramp Operations and major scale of Operations Interaction.
A post –hoc analysis (Games-Howell) revealed that there were significant differences
between the mean responses of juniors and freshmen, p< .05 (2- tail).
The item ‘My university is committed to equipping aircraft with up to date
technology’ under the sub-scale of Safety Fundamentals and scale of Organizational
Commitment showed a significant differences in the mean responses of respondents,
F(4,126) = 3.02, p<.05. A post –hoc analysis revealed significant differences in the mean
responses between the juniors and freshmen, p<.05. The other item that showed
significant differences in mean responses was ‘Management tries to get around safety
requirements, whenever they get the chance’. The results was F (4,125) = 3.22,
p<.05.Further post hoc analysis revealed that there was a significant differences in the

75
mean responses of juniors and freshmen, p<.05. Figure 61 shows simple bar graph with
error bars highlighting the significant mean differences in mean of responses to their
perception of the safety culture.
Figure 63. Simple bar graph of ‘Mean perception of safety culture’.
Question Two
What are the differences between the perception of international contract students
and indigenous US students on the status of the safety culture at an accredited four year
collegiate aviation program?
An independent t-test was used to determine if there existed any significant
differences in the mean perception of the two groups on the safety culture of the
university’s flight program. The variances in the samples were assumed roughly equal

76
and scores were independent. The mean perception on the status of the safety reporting
system of the collegiate aviation program of resident US students (M=4.27, SE = 0.23)
was better than the international contract students (M= 3.77, SE =0.23), when asked ‘The
safety reporting system is convenient and easy to use’. The responses were all above the
neutral point of 3.The differences in the mean response was also significant t(132) = -
2.59, p< .05.
Pilots do not bother reporting near misses or close calls, since this event does not
cause any real damage’. The resident US students had a mean response of (M=3.40,
SE=0.18) as compared to the international students who had (M=2.49, SE= 0.27).The
difference was significant, t(132) = 2.68,p<.05. This shows that the contract students in
their perception agreed with the item. The responses for the item ‘Pilots are satisfied with
the way, the university deals with safety reports’ showed that the contract students (M=
3.92, SE= 0.23) had a more positive perception than the US students (M= 3.37, SE=
0.11), even though all of the mean responses were above the neutral point of 3.
The differences in their responses was significant, t(132) = 2.35, p< .05.However
when the mean responses of their perception on the item ‘University only keeps track of
major safety problems and overlook routine ones’ were compared, the resident US
students (M=3.92, SE=0.16) disagreed with the item as against the international students
(M= 2.44,SE= 0.27) who agreed with the item. The differences in their responses was
significant, t(132) = -4.78, p< .05.
Generally there was a good perception on the item ‘Personnel responsible for
safety hold high status in the university’. The mean responses for the US students
(M=4.13, SE= 0.07) was higher than the international students (M=3.72, SE= 0.21). The
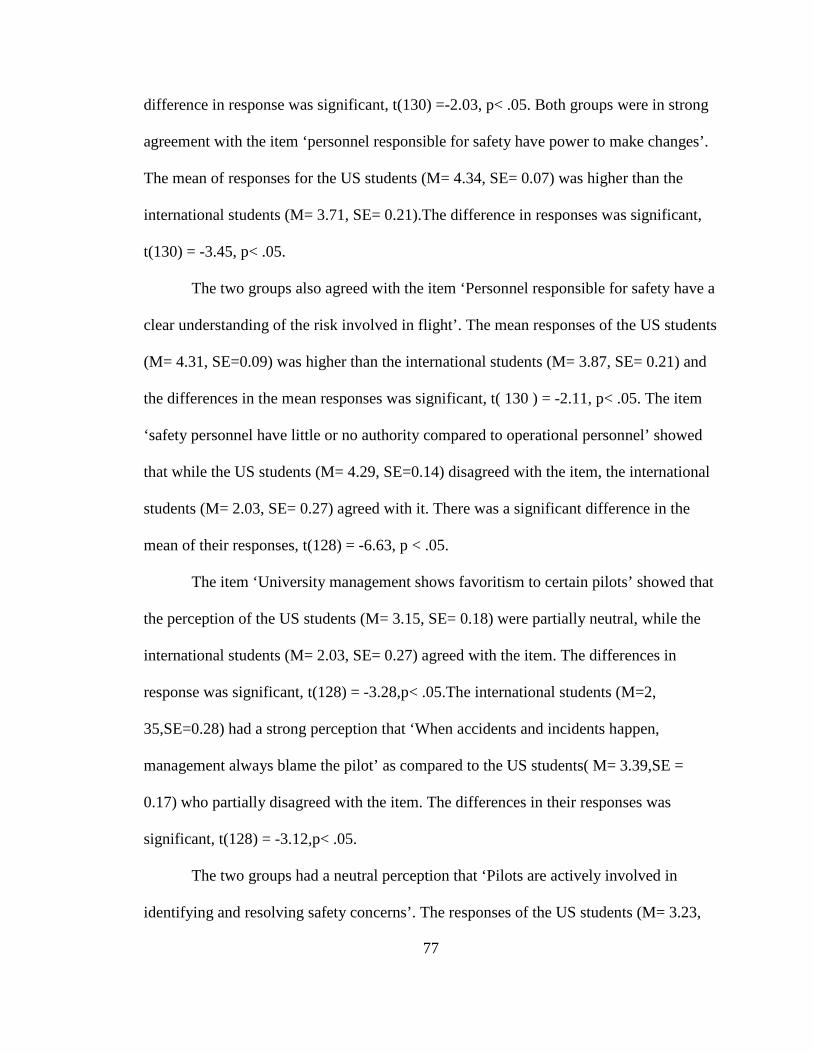
77
difference in response was significant, t(130) =-2.03, p< .05. Both groups were in strong
agreement with the item ‘personnel responsible for safety have power to make changes’.
The mean of responses for the US students (M= 4.34, SE= 0.07) was higher than the
international students (M= 3.71, SE= 0.21).The difference in responses was significant,
t(130) = -3.45, p< .05.
The two groups also agreed with the item ‘Personnel responsible for safety have a
clear understanding of the risk involved in flight’. The mean responses of the US students
(M= 4.31, SE=0.09) was higher than the international students (M= 3.87, SE= 0.21) and
the differences in the mean responses was significant, t( 130 ) = -2.11, p< .05. The item
‘safety personnel have little or no authority compared to operational personnel’ showed
that while the US students (M= 4.29, SE=0.14) disagreed with the item, the international
students (M= 2.03, SE= 0.27) agreed with it. There was a significant difference in the
mean of their responses, t(128) = -6.63, p < .05.
The item ‘University management shows favoritism to certain pilots’ showed that
the perception of the US students (M= 3.15, SE= 0.18) were partially neutral, while the
international students (M= 2.03, SE= 0.27) agreed with the item. The differences in
response was significant, t(128) = -3.28,p< .05.The international students (M=2,
35,SE=0.28) had a strong perception that ‘When accidents and incidents happen,
management always blame the pilot’ as compared to the US students( M= 3.39,SE =
0.17) who partially disagreed with the item. The differences in their responses was
significant, t(128) = -3.12,p< .05.
The two groups had a neutral perception that ‘Pilots are actively involved in
identifying and resolving safety concerns’. The responses of the US students (M= 3.23,

78
SE= 0.11) had a lower mean as compared to the international students (M=3.82, SE=
0.19).The differences in the mean responses for both groups was significant, t(130) =
2.67,p< .05. The international students (M= 2.26, SE = 0.28) had a strong perception that
‘Pilots who call in sick or fatigue are scrutinized by the Supervisor of Flight or other
flight management personnel’, while the US students (M= 3.69, SE=0.18) disagreed with
the item. The differences in their responses was significant, t(130) = -4.25,p< .05. The
international students (M=2.53, SE=0.29) also had a strong perception that ‘Pilots have
little or no authority to make decisions, that affect the safety of normal flight operations’.
The US students (M=3.45, SE=0.13) however disagreed with the item. The differences in
their responses was significant t(130) = -3.86, p< .05.
The US students ( M=2.88,SE= 0.12) disagreed with the item ‘Pilots who are new
and less senior are willing to speak up regarding flight safety issues’, while the
international students ( M= 3.55,SE= 0.21) agreed. There was a significant difference in
their responses t(130) = 2.80,p< .05.The US students (M=2.47,SE=0.09) however
disagreed that ‘Pilots, never cut corners or compromise safety, regardless of the
operational pressures to do so’ while the international students ( M=3.55,SE= 0.21)
agreed. The was a significant differences in their responses, t(130) = 4.79,p< .05.
The international students (M=2.59, SE=0.33) agreed with the item ‘Chief/Lead
CFI’s and SoF are unavailable when pilots need help’ while the US students (M=4.19,
SE= 0.16) disagreed. The differences between their response was significant, t(127)= -
4.19,p< .05.The international students(M=2.88,SE=0.32) had a perception that ‘As long
as there are no accidents or incidents, Chief/Lead CFI’s and SoF don’t care how flight
79
operations are performed’ while the US students(M=4.91,SE=0.16) disagreed. The
differences in their responses was significant, t(127)= -3.92,p< .05.
The international students (M=2.79, SE =0.34) agreed with the item ‘Dispatch
inappropriately uses MEL, when it is better to fix equipment. The US students (M=4.48,
SE=0.12) strongly disagreed. The differences in response was significant, t(126) =-5.80,p
<.05.The US students (M=4.27,SE=0.14) disagreed with the item ‘ Dispatch would rather
take a chance with safety, than cancel a flight’. The international students (M= 2.06, SE=
0.29) strongly agreed. The differences in their responses was significant, t (127) = -
7.35,p< .05.
Both US student ( M= 4.28,SE=0.05) and international students ( M=3.91,SE=
0.18) agreed with the item ‘Instructors/trainers have a clear understanding of the risk
associated with operations’ .The differences in their responses was significant, t(126)= -
2.49,p< .05.The two groups US students (M= 4.31,SE=0.13) and international students (
M=3.91,SE=0.18) all agreed to the item ‘Safety is consistently emphasized during
training at my university’. There was a significant difference in their responses, t (126) =-
2.33, p < .05. The international students (M= 2.21, SE= 0.31) had a perception that
‘Instructors/trainers teach shortcuts and ways to get around safety requirements’ while
the US students (M= 4.24, SE=0.13) disagreed. The differences in their responses was
significant, t(126) = -6.89,p < .05.
US students (M= 4.17, SE= 0.07) and International students (M=3.76, SE= 0.18)
agreed to the item ‘Ramp personnel are careful about position of equipment (fuel trucks,
power carts, etc)’. There was significance in the differences in their response, t(131)= -
2.41,p<.05. The international students (M=2.63,SE=0.31) had a perception that ‘Ramp
80
personnel are careless about removing debris ( e.g. cups,rags,tools,clothing etc) near the
aircraft, which may pose FOD hazards’. The US students (M=4.28, SE=0.14) did not
agree with the item. The differences in their responses was significant, t(130)= -
5.49,p<.05. International students (M=2.47, SE=0.31) agreed with the item ‘I feel like I
am gambling with the safety of my aircraft every time, I go on a training activity’ while
the US students (M=4.65, SE = 0.10) disagreed. The differences in their response was
significant, t(131)= -8.54,p< .05.
US students (M=3.76, SE=0.16) disagreed with the item ‘Management is more
concerned with making money than being safe’ while the international students (M=2.58,
SE=0.31) agreed. The differences in their responses was significant, t(128)= -3.57,p< .05.
International students (M=2.84, SE = 0.31) agreed to the item ‘Management does not
show much concern for safety, until there is an accident or incident’ while the US
students (M=4.14, SE= 0.15) disagreed. Both US Students (M=4.34, SE=0.06) and
international students (M=3.97, SE=0.18) agreed to the item ‘My university flight manual
is carefully kept up to date’. The differences in their responses was significant, t(129)= -
2.18,p <.05.
US students (M=4.16, SE=0.08) and international students (M=3.79, SE=0.18)
both agreed to the item ‘My University is willing to invest money, resources, and effort
to improve safety’. The differences between the responses was significant, t(129)= -
2.18,p< .05. The international students (M=3.87,SE=0.18) and US Students
(M=4.55,SE=0.05) both agreed to the item ‘My university is committed to equip aircraft
with up to date technology’. The differences is responses was significant, t(129)= -
4.62,p< .05. The item ‘My University ensures that maintenance on aircraft is adequately

81
performed and aircraft safe to operate’ was agreed to by the US students (M=4.58,
SE=0.06) and international students (M=3.92, SE=0.19). The differences in their
response was significant, t(129)= -4.07,p< .05.
The US students (M=4.11, SE=0.09) and international students (M=3.55,
SE=0.20) agreed to the item ‘Management goes above and beyond regulatory minimums,
when it comes to issues of flight safety’. The differences in their response was
significant, t(128)= -2.79,p< .05.The international students( M=2.21,SE=0.28) agreed
that ‘Management schedules CFI’s as much as legally possible, with little concern for
their sleep schedule or fatigue’. The US students (M=3.67, SE=0.17) however disagreed.
The differences in the response was significant, t(128)= -4.48,p< .05.
The US students (M=4.61, SE=0.11) disagreed that ‘Management tries to get
around safety requirements, whenever they get the chance’. The international students
(M=2.32, SE= 0.28) agreed to the item and the differences in the responses was
significant, t (128) = -9.10,p< .05. Finally both US students (M=4.09, SE=0.10) and
international students (M=3.68, SE=0.20) agreed that ‘Management views violation very
seriously, when they don’t result in any serious damage or injury’. The differences of
their responses was significant, t(128) = -2.00,p < .05.
Question Three
What is relationship between the perception of respondents (flight students and
certified flight instructors) regarding the informal safety and operation interaction at an
accredited four year collegiate aviation program?
In order to establish any relationship between the major scales, Pearson’s
correlation coefficient was determined for some items in both scales to find the extent of
82
significant correlations among items. In general there were numerous significant
correlations of items in Informal Safety and Operations Interaction. The responses to the
item ‘Dispatch consistently emphasize information or details’ significantly correlated
with the item ‘pilots are actively involved in identifying and resolving safety concerns’, r
= .28, p< .01.
The responses to the item ‘dispatch inappropriately uses the Minimum Equipment
List (MEL), when it would be better to fix equipment significantly correlated with the
item ‘Pilots are seldom asked for input when university aviation procedures are
developed or changes’, r = .31, p< .01 and significantly (negative) correlated to ‘Pilots
are actively involved in identifying and resolving safety concerns’, r = -.27, p< .01. The
item ‘pilots who call in sick or fatigued are scrutinized by the supervisor of flying or
other flight management personnel’ significantly correlated responses to the items
‘Dispatch would rather take a chance with safety than cancel a flight’, r = .47, p<.01 and
‘Dispatch inappropriately uses the Minimum Equipment List (MEL) when it would be
better to fix the equipment’, r =.48,p<.01.
The responses to items ‘Pilots have little or real authority to make decisions that
affect safety of normal flight operations’ strongly correlated with the item ‘Dispatch
inappropriately uses MEL, when it is better to fix equipment’ and was significant, r =
.54,p< .01. The item ‘management rarely questions a pilot’s decision to delay or request
for cancellation of a flight for a safety issue’ negatively correlated with the item
‘Dispatch inappropriately uses MEL when it would be better to fix equipment’ r= -.20,p<
.01,but positively correlated to the item ‘ Dispatch is responsive to pilots concerns about
safety of flight operations’ r = .39, p< .01 and they were all significant. Tables 10 and

83
10cont, show the correlation tables for items in Informal Safety Scale correlated with
Operations Interaction Scale.
Question Four
What is the relationship between the perception of respondents (students and
certified flight instructors) on the formal safety program and their safety behavior at an
accredited four year collegiate aviation’s program?
The question sought to find out if there was any form of relationship between
perception and safety behavior. Multiple Regressions was used to establish a relationship
between the perception of respondents on the FS program and their safety behavior. An
exploratory analysis was developed to use the relationship to establish a predictive model
for safety behavior, from perception of respondents on the Formal Safety program.
Perception and attitude have been known to have an influence on behavior (American
Psychological Association, 2012) and they can be used as leading indicators in SMS to
predict safety behavior and personal risk. The aim of SMS is to use this safety leading
indicators to pro actively predict lagging indicators (outcomes) like incidents and
accidents (ICAO, 2009)
A forced method was used and the model summary with the values of R
(Coefficient of Determination), R² and the adjusted R² were determined. R² gives an idea
of the proportion of variance, explained by model. The adjusted R² gives an idea how the
model generalize and ideally when the value is close to R, it indicates that the cross-
validity of the model is good (Field, 2009). The beta-values (B) were also recorded and

84
Table 10. Pearson’s Correlation between Items of Informal Safety and Operation Interaction

85
Table 10 cont. Pearson’s Correlation between Items of Informal Safety and Operation Interaction
shows the how much of the variance in safety behavior can be explained by each of the
significant predictors (perceptions).

86
The first item ‘Self-Reported for duty when fatigued, ill, or under unusual stress
because you had no other choice’ was the outcome variable and Items in FS were used as
independent variables. The Tables 9 and 10 shows the model summary and coefficients
of ‘Self-Reported for duty when fatigued, ill or under unusual stress because you had no
other choice’
Table 11. Model Summary of ‘Reported for duty when ill, fatigued, or under unusual stress’.
Note p< .01

87
Table 12. Coefficients of ‘Reported for duty when fatigued, ill or under unusual stress’.
Note ∗p< .01,∗∗p<.05
Table 13. Model Summary of ‘been pressured to fly a university aircraft you believe was not in safe condition’.
Note:∗ p< .05

88
Table 14. Coefficients of ‘Been pressured to fly a university aircraft you believe was not in safe condition’.
Note:∗ p< .01
Table 15. Model Summary of ‘Failed to challenge a superior on a safety issue for fear of ruining a cordial relationship’.

89
Table 16. Coefficients of ‘Failed to challenge a superior on a safety issue for fear of ruining a cordial relationship with the superior’
Note ∗p< .05(model summary), ∗∗p<.01(coefficients)
Table 17. Model Summary of ‘Allowed an instructor or senior pilot’s mistake to go unchallenged’

90
Table 18. Coefficients of ‘Allowed an instructor or senior pilot’s mistake to go unchallenged’
Note∗ p< .05(model),∗∗ p<.01(Coefficients)
Table 19.Model Summary of ‘Ever been put on flight hold for alcohol or drug violations’

91
Table 20.Coefficents of ‘Ever been put on flight hold for alcohol or drug violations’
Note∗ p<.05(Model),∗∗ p<.01(Coefficients)
Question Five
What is the relationship between the perception of respondents (students and
certified flight instructors) on organizational commitment to safety and perceived
attitudes that affects safety behavior at an accredited four year collegiate aviation
program?
The question sought to find out if there was any form of relationship between the
perception of respondents about organizational commitment in the flight program of the
university and their safety behavior. Multiple Regressions was used to establish a
relationship between the perception of respondents on the organizational commitment
and their safety behavior. An exploratory analysis was developed to use the relationship
to establish a predictive model for safety behavior, from perception of respondents on the
organizational commitment and their safety behavior. The models that has been proposed
are for exploratory purposes and can be used as a pro active leading indicator as part of
trend monitoring in the implementation and management of the SMS. The significant
results from the research are outlined.

92
Table 21. Model Summary of ‘been pressured to fly a university aircraft you believe was not in safe condition’.
Table 22. Coefficients of ‘been pressured to fly a university aircraft you believe was not in safe condition’
Note∗∗ p<.01 (Model),∗p<.05 ( Coefficients)

93
Table 23. Model Summary of ‘Failed to challenge a superior for fear of ruining a cordial relationship’.
Table 24. Coefficients of ‘Failed to challenge a superior for fear of ruining a cordial relationship’
Note: ∗∗p<.01 (Model Summary),∗ p<.05 (Coefficients)

94
CHAPTER IV
DISCUSSION
Perception of Safety Culture among Respondents
The results showed that respondents had a good perception and favorable outlook
of the safety culture at the university’s flight program. There were however some areas
that need improvement and the discussion will focus more on the areas for improvement
of the safety program and how the Safety Management System, can consolidate a more
proactive and positive safety culture. Generally all the four major CAPCUS factor scales
had mean values (M) above the midpoint of 3.This means that cumulatively, the
perception of the respondents on the flight operations of the university was good. The
Formal Safety Program (M= 3.65), Informal Safety Program (M= 3.34), Operational
Interaction (M = 3.32) and Organizational Commitment (M = 3.32) was compared to
previous study by vonThaden (2008) on a flight operations department of a major
European carrier and the results were similar and consistent.
The results show that the university formal safety program was perceived as the
best and the duo of operational interaction and organizational commitment had the least
score and may indicate that some adverse perception by respondents about these major
scales. The first research question was to find out the level of variability in the
perception of flight students and flight instructors on the safety culture in the university’s
flight program. A good measure of consistency in the safety culture of an organization is

95
to focus on the variance in survey responses (von Thaden , 2008). When a population
demonstrates considerable variance, the coherent structure for an underlying culture of
safety is for all intents and purposes, nonexistent and shows that there are gaps in the
purpose, alignment and control of the safety management (Patankar, 2003).
There was a significant difference in the mean responses of perception on the
item ‘I feel like I am gambling with the safety of my aircraft every time, I go on a
training activity’, under the major scale of Operations Interaction. The significant
differences were between the responses of juniors and freshmen. The results showed that
while the juniors had a more favorable perception on most items under operations
interaction, the freshmen had poor perception on these items. Since the university has a
standard operational procedure and curricula for all flight operations, it was expected
that there would be very minimal variability of responses among the year groups.
However variability in perception can be a function of training environment, operational
interaction, experience level, prior training, fleet assignment, and operational safety
records (von Thaden, 2008).
A significant variation in responses can also be as a result of the risk perception
among the year groups (Block, 2007). A more risk loving attitude and behavior can
result in significant safety breaches in the wall of the most formidable safety
management system (Reason, 2003;Patankar, 2003). Some relevant additional
comments provided by respondents can be found in the quote below:
“Once after getting an aircraft refueled by a fuel truck, the fuel truck driver forgot
to unclip the ground wire from the exhaust pipe of the aircraft. He drove away
and the ground wire snapped back towards the truck when he drove far enough

96
away. There was no apparent damage to the aircraft but the fuel truck driver
said, "Please don't file a safety report on me." I feel like this was the wrong
attitude by the fuel truck driver towards safety. He should be more willing to
own up to his mistakes’’.
“I had a fuel personnel knock a static wick off my horizontal stabilizer and not
tell me (the PIC) about it”.
“There is not much standard procedure of the travel of line vehicles on the ramp.
Sometimes they make erratic movements and I don't believe they monitor ground
frequency, so they are unaware of where aircraft are travelling to. Also the pilots
are unaware of where line vehicles are travelling”.
“The training for student line personnel seems weak in the finer details of fuelling
aircraft. For example some student and fuel truck operators display ignorance in
the perils of hitting the bottom of a fuel tank, or side loading the filler neck with a
fuel nozzle. I must applaud ramp personnel for having good situational awareness
in moving aircraft with tugs. Though they move quickly are very much aware of
their surroundings”.
Concurrence is a critical feature of a healthy safety culture (von Thaden
,2008; IATA, 2011), as it reflects the degree to which both juniors and freshmen
share a common perception of the safety culture. It is therefore important for more
attention to be focused on freshmen by reinforcing safety education especially on
operations interaction.
The item ‘My University is committed to equipping aircraft with up to date
technology’ under the sub-scale of Safety Fundamentals and scale of Organizational

97
Commitment showed a significant differences in the mean responses of juniors and
freshmen. There were some relevant comments from respondents in the quote below:
“As per technology in the aircraft, just look at our fleet. Most of the fixed-wing
astounding. Most of the helicopters are laughable. I feel that there is not equal
representation among fixed-wing and rotorcraft in terms of technology. This
obviously plays a role in safety”
The quote underscores the perception that updating aircraft with new technology is
skewed towards fixed wing operation and that management should make a conscious
effort to create equity in allocation of resources. It can create a perception of management
not committed to enhancing safety in some fleet of the program.
The other item that showed significant differences in mean responses was
‘Management tries to get around safety requirements, whenever they get the chance’. The
significant differences in responses were between the juniors and the freshmen. From the
results, the freshmen seem to have a rather poor perception about the commitment of
management to safety, while the juniors had a rather good perception. Some notable
quotes from respondents are highlighted below:
“The university has a very strong commitment to safety from all departments.
There are bi-annual safety seminars held for students, staff, and community
members, the university has a maintenance program that is impeccable, and
positions such as the Supervisor of Flight and Manager on Duty that help the
flight operations operate safely and even having a separate safety department
shows that it is committed to upholding safety”

98
“Especially when dealing with contract students there is a major push to get it
done regardless of the weather and to push the safety envelope, And when
someone gets praised for going out and getting time in even though they got ice
and got stuck in Fargo is extremely unsafe in my eyes.”
“Management has done absolutely nothing when it has come to the recent icing
incidents. They are essentially covered up and almost nothing is ever said”
The diametrical responses and measure of the perception of the commitment of
management to safety potentially indicates a gap in the safety management of the flight
program.
Perception of International students and US students on the Safety Culture in the Program
The perceptions of the two groups were analyzed on the basis of the impact of
national culture on their perception on the safety culture (Hofstede , 2005). Fanjoy (2011)
in his study on the learning style of chinese collegiate aviation students, observed that
chinese culture is significantly different from that of the US in terms of power
distance,individualism and long term orientation. (Joy, 2009) stated that national culture
has an inpact on individual learning and cognitive style preferences. Hofstede (2005)
suggested that when students from a different cultural background are educated in a
different cultural context, the impact of the cultural differences should be considered to
identify any potential negative influence.
‘Pilots do not bother reporting near misses or close calls, since this event does not
cause any real damage’.
This item on the reporting system of the flight program showed that, the resident
US students disagreed with the item, while the contract students in their perception

99
agreed with the item. The significant differences in the responses could be as a result of
the level of risk perception as compared to a similar study on general aviation pilots by
Hunter(2006). The differences in national culture and language could also affect the
perception and behavior of these two groups as outlined in the research of
Helmreich(1999) on crew management resources among multi-cultural crew.
However when the mean responses of their perception on the item ‘University
only keeps track of major safety problems and overlook routine ones’ were compared, the
resident US students disagreed with the item as against the international students who
agreed with the item. The differences in their responses were significant. The results
shows similarities with the study of Dillman( 2009),which showed that flight students
sometimes simply don’t report safety occurrences because the time,energy and effort
required to complete documents is not significantly related to the event. There is also the
issue of effective feedback from mangement for the effort at reporting safety
occurrences. Some relevant responses are outlined below:
“Our safety program does not incorporate a way of tracking safe actions. Safety
reports are typically generated when someone exhibits a violation of Safety Policy
and Procedure or any unsafe action. There is no real system of maintaining
actions of safety which I believe they should be able to give recognition to those
who uphold a safety culture. We implemented a safety recognition program that
awards those which certain hour milestones flown without accidents, but does not
specifically note the events”.
Some further quotes are outlined below to show a more comprehensive outlook at the
perceptions of the respondents.

100
“I have used the program and found it to be slow to act and the safety personnel
have to defer things to the operation side. They do not seem to have the authority
to change things. There is no feedback when you turn in a safety form. I had a
problem with something in an aircraft and had to go through two other
departments and prove to them that it was a problem with the aircraft and not with
me as they were suggesting”.
"Pilots can report safety discrepancies without fear of negative repercussions"
Unfortunately this is not the case, as I have knowledge of cases of CFI's being
issued performance cards after self-reporting a safety incident to their lead.
"Pilots do not bother reporting near misses or close calls, since these events don't
cause any real damage." The safety reporting system is turning into a punitive
system, and pilots are becoming afraid to 'throw their peers under the bus' so to
speak.
"When a pilot reports a safety problem, it is corrected in a timely manner - I have
reported an issue with institutional aircraft placards non-compliance a year ago,
the problem has not been corrected’’.
"Pilots are satisfied with the way the university deals with safety reports - Safety
reporting has turned into a tattle tale system’’.
"Personnel responsible for safety have a clear understanding of the risk involved
in flight training - It seems like personnel responsible for safety feel like flight
training should have no risk, which is not possible’’.
The US students disagreed with the item ‘safety personnel have little or no
authority compared to operational personnel’ but the international students strongly

101
agreed with it. There was a significant difference in the mean of their responses. This can
be an indication of the perceived marginal input of safety personnel in the administration
and operation of contract flight programs. The international students’ perception is
probably influenced by their interaction, more with the operational personnel than the
safety personnel.
The item ‘University management shows favoritism to certain pilots’ showed that
the perception of the US students were almost neutral, while the international students
agreed with the item. The differences in response was significant and this was correlated
to the response to the item ‘When accidents and incidents happen, management always
blame the pilot’ where the international students strongly agreed, while the US students
partially disagreed. This result is similar to research findings of von Thaden (2008) which
suggested that a primary challenge regarding accountability concerns perceptions of
favoritism. It appears that pilots are not blamed unfairly for their errors, but favored
pilots may receive more beneficial outcomes than non-favored pilots (Dekker, 2007).
“I feel that SOF's know the leads well and a lot of them are shown favoritism.
There has been times when I have seen SOF's breaking SOP's and then when
asked just giving an excuse. I have witnessed an off-duty SOF try to fly when it
was clearly no fly and just told the SOF to just sign it and pretend he didn't see the
conditions change. I believe that the SOF's at the university need to be held to a
higher standard as they are in an authority role. I also am concerned about how
management tries to push us to fly when it’s marginal weather in the winter with
icing around. I understand summer because you can pick up IFR no problem but
102
with icing it scares me. With that said I do feel that upper management really will
support the pilot decision and is protective of who may be involved’’
The international students had a strong perception that ‘Pilots who call in sick or
fatigue are scrutinized by the Supervisor of Flight or other flight management personnel’,
while the US students disagreed with the item The international students also had a strong
perception that ‘Pilots have little or no authority to make decisions, that affect the safety
of normal flight operations’. The US students however disagreed with the item. The two
items rather send a worrying signal about the perception of the international students on
their input, when it comes to making decisions that can affect the safety of flight. Studies
by Gordon( 2004) and Dillman (2006) highlights the importance of personnel input in
order to achieve an effective SMS.
‘’I put that pilots have very little authority to make safety decisions, because all
the decisions are already made for us’’
‘’Pilot reputation is definitely at stake if you don't follow proper procedures.
There are a lot of peer and staff pressures to do the job as safely as possible. I
think it would be a great idea for CFIs to reiterate that a new pilot can question
them at anytime without penalty about operational conduct”
“Lead flight instructors push too hard to increase productivity. They challenge a
line instructor’s ability to say no because of weather. The same ones allow SOF's
to do things they will not allow line instructors to do. I fear a serious incident will
occur before the top level realizes the pressure and questions lead instructors are
placing on fatigues line instructors. It needs to stop’’

103
‘’Pilots are almost always scrutinized when cancelling flights. Superiors tend to
ignore suggestions of new pilots and encourage students to cut corners and go
outside their safety window to make them fly’’
The US students disagreed with the item ‘Pilots who are new and less senior are
willing to speak up regarding flight safety issues’, while the international students agreed.
This was quite a unusual since Hofstede (1980), Helmreich (1999) and Hofstede ( 2005)
suggested that national cultures with Low Power Distance like the US,has a tendency to
be more assertive and bold,when in a group as compared to the international
students,who mostly have a culture that is more of a High Power Distance,which makes
them less willing to challenge authority. The US students however disagreed that ‘Pilots,
never cut corners or compromise safety, regardless of the operational pressures to do so’
while the international students agreed. National cultural values like Uncertainty
Avoidance (rules and order) (Hofstede, 1980) (Hofstede , 2005) could largely influence
this perception. Respondents provided comments to reinforce their perceptions and are
quoted below:
“I think in general most pilots treat safety with respect and are professional about
safety, but there are some who are much more willing to cut corners or ignore
safety policies and procedures than others’’.
“Students are negatively impacted by not meeting flight templates which
promotes them to cut corners and fly when they should not’’
“Many of the safety violation I have read about that could have easily been
prevented seem to stem from the feeling pressure to finish on time. The
university could not do a worse job in planning courses so the weather or other
104
variables are accounted for. This makes it very difficult for a pilot under heavy
financial and other external pressures to make a good unbiased decision. Getting
done at the cost of a few minor safety infractions can seems more then fair when
facing astronomical flight costs. Especially when the policies seem to be written
by higher ups who are far removed from the flight line”.
The international students agreed with the item ‘Dispatch inappropriately uses
MEL, when it is better to fix equipment. The US students) strongly disagreed. The US
students disagreed with the item ‘Dispatch would rather take a chance with safety, than
cancel a flight’. The international students strongly agreed. This was another worrying
trend in flight operations interaction of the university. It could be as a result of the
operational tempo of the contract training, which sometimes require that, international
student fly under some pressure to meet company deadlines.
US students disagreed with the item ‘Management is more concerned with
making money than being safe’ while the international students agreed. The International
students agreed to the item ‘Management does not show much concern for safety, until
there is an accident or incident’ while the US student’s .The international students agreed
that ‘Management schedules CFI’s as much as legally possible, with little concern for
their sleep schedule or fatigue’ the US students however disagreed. The US students
disagreed that ‘Management tries to get around safety requirements, whenever they get
the chance’. The international students agreed to the item. The perception of the
international students was consistent in their mean responses and reflected a rather poor
outlook and raises a gap in alignment of safety education coverage in their contact
training.

105
“The organization as a whole is more concerned with making money then the
safety or concern of the students. Everyone from CFI's to lead flight instructors
are more concerned about draining the student's money then helping the student
succeed”
“With the amount of contract training we are doing and the pressure we are under
to get them done on time I would say that is a recipe for an accident/incident”.
“Student's are always pressured to fly even if they themselves don't feel like they
could safely due to illness or other reasons”.
Perception on Relationship between the Informal Safety and Operational Interaction
Pearson’s correlation was determined for some items in both scales to find the
extent of significant correlations among items. The results show significant correlations
of items in Informal Safety and Operations Interaction. This was compared to similar
study by vonThaden (2008) and showed that, a high correlation of items in the two major
scales could indicate, more lateral safety management approach that is peer-driven. A
look at the results showed that there was a level of consistency in the perception of
respondents on the items under both major scales. The consistency also helped to cross-
validate the responses and give a better understanding of the safety culture in the
university.
The responses to items ‘Pilots have little or real authority to make decisions that
affect safety of normal flight operations’ strongly correlated with the item ‘Dispatch
inappropriately uses MEL, when it is better to fix equipment’ and was significant. The
results show that as perception of respondents on an item could influence their perception

106
on another item in another scale of the survey and show that perception is susceptible to
changes in event and information flow.
The item ‘management rarely questions a pilot’s decision to delay or request for
cancellation of a flight for a safety issue’ negatively correlated with the item ‘Dispatch
inappropriately uses MEL when it would be better to fix equipment’ but positively
correlated to the item ‘ Dispatch is responsive to pilots concerns about safety of flight
operations’ and they were all significant. The better the perception of respondents on the
positive role of dispatch seems to have a positive effect on the perception of respondent
on the authority of pilots to make informed and safe decisions on flight issues.
Perception on Relationship between Formal Safety and Safety Behavior
(Personal Risk)
The effect and relationship of the scale on the risk perception and behavior of
respondents was determined using Multiple Regression. The question also attempted to
develop a model that can be used as a predictor of safety behavior from perceived
attitudes of respondents. The success of any proactive SMS depends on the ability to
identify leading indicators of safety to be able to determine the outcome of any safety
action of intervention (IATA, 2011). The predictive safety model could help in
proactively outlining significant predictors and their contribution in causing the safety
occurrence (outcome).
The item “Reported for duty, when fatigued, ill and under unusual stress because
you had no choice” was significant and had positive predictor ‘Pilots do not bother
reporting near misses or close calls, since this events do not cause real damage’, but a
negative predictor ‘pilots are willing to report information regarding marginal

107
performance or unsafe actions of pilots’. This shows that a pro active peer to peer safety
advocacy and non-punitive reporting system can reduce potential at risk flight related
behavior.
The item ‘been required to fly a university aircraft, you did not believe was in a
safe condition’’ had a positive predictor ‘Safety personnel have little or no authority as
compared to operational personnel’. The more respondents had a perception that safety
personnel lacked the authority to ensure safety oversight, the greater their perceived risk
of flying a university aircraft believed to be unsafe. This can indicate that there is an
expectation on safety personnel, to have more leverage in mitigating flight operational
risk. The item ‘Failed to challenge a superior on a safety issue for fear of ruining a cordial
relationship’ had a positive predictor ‘pilots do not bother reporting near misses or close
calls, since this events don’t cause any real damage’. The relationship between flight
crew is very important. The result is similar with the study done by Kanki ( 2010),which
showed that due to the effect of Trans-Cockpit Authority Gradient (TAG) ,subordinate
flight crew members assertiveness can be diminished and they may not voice out safety
concerns to their superiors on the flight deck.Helmreich (1999) also explained that Low
Uncertainity Avoidance effect, can affect some students not to be bold to voice out safety
concerns when flying with instructors or flight management personnel.
The item ‘allowed an instructor pilot’s or senior pilot’s error to go unchallenged’
had a predictor ‘ My university only keeps track of major safety problems and overlook
routine ones’.This results show a preception that the university is more concerned with
major safety problems and as such reporting errors or challenging senior pilots and
instructor pilots ,who are normally perecieved to be more proficient and less prone to

108
error,will not be important.This could indicate a serious misalignment of the perception
of respondents and flight management and has the potential to create safety occurrences.
Perception on Relationship between Organizational Commitment and Safety Behaviour
(Personal Risk)
The role of management to ensure that purposeful organization of human,material
and financial resources are avialable and judiciously distributed at all levels down the
organization is very crucial in setting and attaining goals (Dresner, 2002;CASA, 2009).
The item ‘ Been pressured to fly a university aircraft that you did not believe was in a
safe condition’ had three significant predictors.It had two positive predictors
‘managament does not show concerns for safety,until there is an accident’ and ‘Upper
Level management tries to get around safety,whenever they get the chance’.
The negative predictor ‘My university is willing to invest money and resources to
improve safety’ shows that respondents do not feel pressured and are less concerned
about the safety of the aircraft, when they percieve that the university is willing to invest
money and resources to improve safety. This finding is similar to research by Damon(
2011) which showed that when management pro actively invest in safety,there are
substantial returns on investment.Some of these returns are crew confidence,minimal
incidents,employee productivity and enhanced business outlook.
Limitations
There were some limitations present within the study. Since the survey is
anonymous there was no way for the researcher to follow up in case of questions
requiring further feedback and responses. In addition, due to this anonymity there was no
way to ensure that individuals only took the survey once. The sample was also limited to

109
commercial aviation students, international contract students and flight instructors who
are active in the flight program of the university. Perceptions are dynamic and can be
influenced by information, mood, attitude, sensory experience, cognitive structure and
changes in event (American Psychological Association, 2012).In all the data analysis, the
exclusion of certain data, based on non- responses by participants ,was done solely by the
SPSS software, which coded any non-response as zero .
It was assumed that during the period of the data collection, the safety culture at
the university was unchanged. The study also assumed that leading metrics of safety such
as perception and attitudes could have an effect on behavior and can be used as a
predictor of respondent behavior. The results of the study was also limited to the study
population, since safety culture is dynamic and could vary due to different procedures,
type of operations, environment and population. It was assumed that all international
contract students had a proficient reading and written comprehension level of the English
language, since the survey was in English. Finally the study could not actually
authenticate the truthfulness of self reported responses on personal risk or safety
behavior, since respondents were anonymous. The study assumed self reported responses
from participants were factual.
Future Studies
Safety Culture assessment is a dynamic process and requires establishing a
baseline for comparison. There has to be a continuous assessment over a given time
period to be able to build a confident data base for comprehensive analysis. Due to
changes in procedures, operations and even the human components, the safety culture of
an organization will always evolve and safety staff and management would have to

110
continuously review the effectiveness of the safety management system (ICAO, 2009).
Safety assurance is a cyclic process even when the SMS is fully matured, since
there will always be the need for periodic review and continuous improvement (Stolzer,
2011). Safety culture studies should be continued on other populations in the university’s
flight program like ATC, Maintenance and UAS personnel. There should also be an
assessment of the perceptions of university aviation management on the safety culture
and the results correlated with the perception of students to be able to gauge the vertical
extent of SMS saturation.
Another area that requires study is building good fit model of leading indicators
like perception, attitude and behavior and using it as a predictor of lagging indicators
(safety outcome) like incidents, accidents and violations (IATA, 2012). It is also
recommended that further studies be conducted in other collegiate aviation programs and
the results cross validated to build a useable database for predictive safety studies. It is
recommended that the FAA, university aviation programs in the US and industry players
provide funds for an intercollegiate safety culture assessment research program, to
provide baseline for the implementation and continuous improvement of SMS in
universities.
The proposed research on safety culture assessment and SMS, will establish the
necessary structures before the FAA adopts a final rule on SMS for Part 141 training
organizations in the near future. It is also more important to invest in SMS, because of
global awareness on the return on investment on safety and as more international flight
training contracts are undertaken by US universities (Lercel, 2011). Finally, more
studies should also be conducted on the effect of national culture on the perceptions and

111
behavior of foreign students in flight training programs of US universities, which are
implementing SMS.
Conclusion
As part of the implementation of a Safety Management System in a four year Part
141 collegiate aviation program, a safety culture assessment was conducted to find out
the perception of flight students and flight instructors on the safety culture in the flight
program. A safety culture perception survey of a sample of flight students and instructors
was conducted using a modified survey called CAPSCUS. The flight program had
perception mean values (M) of, Formal Safety Program (M= 3.65), Informal Safety
Program (M= 3.34), Operational Interaction (M = 3.32) and Organizational Commitment
(M = 3.32). The values were above the neutral point of 3 on a 5 point Likert Scale. This
means that cumulatively, the perception of the respondents on the safety culture in the
flight program of the university was good.
There was a good perception of respondents on the professional role of dispatch,
which seem to have an effect on their authority to make informed and safe decisions on
flight issues. There was a perception of respondents that the safety reporting system in
the program was convenient to use and personnel responsible for safety had a clear
understanding of the risk involved in flight training. The respondents also had a
perception that the university ensures that maintenance on aircraft, were adequately
performed and generally aircraft were safe to fly.
The respondents also had a very good perception that safety was a core value in
the university. The respondents also had a good perception that management viewed
regulations violations seriously, even when they don’t result in any serious injury to

112
personnel or damage to aircraft. There was also another good perception, that safety is
consistently emphasized during training at the university, however some respondents
perceived that ,there was over emphasis, which was leading to a state of ‘safety fatigue’.
There were however some negative perception of respondents. Respondents had
a perception that, the university flight management showed favoritism to certain pilots.
There was also a perception that equipping and up-dating aircraft was skewed to favor
fixed wing aircraft, to the disadvantage of helicopters. There was a perception that
respondents were seldom asked for input when, when university aviation procedures
were developed or changed. There was also a perception that respondents would cut
corners or compromise safety, when under operational pressure to do so. There was a
perception among respondents that sleep schedule and fatigue among CFI’s were
compromised and was a potential safety issue.
The study revealed that there were significant variance in the perception of
respondents on the safety culture by year groups and that could potentially arise due to
different flight operational experience level and years spent in the flight program. There
was an observed trend that the more years and time spent in the aviation program, the
better the perception of the safety culture. This was reflected in the responses between
the year groups. Significantly the responses between the juniors and freshmen showed
that while the juniors had a very favorable perception of the safety culture, the freshmen
had less favorable perception of the safety culture. There should be a proactive review of
the safety education program to better suit the characteristics of these aviation student
population, as part of the SMS implementation. There should be more attention and
emphasis of the safety program for freshmen and new personnel in the flight program.
113
There were also significant differences in the perceptions of US students and
international contract students on the program’s safety culture. The differences could be
as a result of prior or dissimilar operational experience, language and cultural
environment. Generally the US students had a more favorable perception of the safety
culture than the international contract students. The international students had a
perception that pilots who called in sick or fatigued, were scrutinized by flight
management personnel. The international students also perceived that pilots had little or
no authority to make decisions that affect flight safety. The international students also
had a perception that pilots who are new or less senior were unwilling to speak up
regarding flight safety issues.
The international students also had a perception that management did not show
much concern for safety, until there was an accident or incident and that management
tries to get around safety requirements, whenever they get the chance. The international
students also had a perception that flight management personnel were unavailable when
pilots need help. Finally the international students had a perception that they were
gambling with the safety of the aircraft any time they went on a training activity.
The study shows that there was a need to modify and restructure the safety
education program for international contract students, which will take their specific
national culture and differences into consideration. There should be a proactive effort, to
bridge the national culture and safety expectations of the international contract students
with the university safety culture, so that there will be less safety misalignment. The
safety alignment could be achieved through detailed and modified safety education

114
curriculum, during the initial phase of training at the university and through periodic
recurrent safety education.
The respondents also had a perception that due to the intensity and operational
tempo of flight training at the university, especially contract training, there was a high
likelihood of an incident and accident in the next twelve months of the flight year. The
respondents however had a perception that the university would not be cited by the FAA,
within the twelve month flight period. There was also significant correlation in some of
the items of Informal Safety scale and Operations Interaction. Relationships in the form
of regression models were derived to predict Safety Behavior and personal risk from the
perceptions of respondents on the Operation Interaction and Formal Safety. Some
predictors were statistically significant. This was a quote from a respondent on the
general perception of the safety culture.
“The program in place is great! I feel that with some culture changes to the mind
set, this program will show much improvement”.
An innovative, peer involved and dynamic approach should be adapted in the
promotion of safety and risk management. This approach would help to reduce
indifference and apathy towards the safety program. An exploratory model was
recommended to predict risky behavior and safety outcomes using self reported
perceived attitudes of front line personnel like flight students and flight instructors. This
would augment predictive safety risk management processes already in place like Flight
Data Monitoring and Data Mining.

APPENDICES

117
Appendix A
Commercial Aviation Program Safety Culture Survey (CAPSCUS) Q3 Reporting System Please rate the university aviation official system for reporting safety issues and concerns
Strongly Disagree
(1)
Disagree (2)
Neither Agree nor Disagree
(3)
Agree (4) Strongly Agree (5)
Not Applicable
(6)
The safety reporting system is
convenient and easy to
use. (1)
Pilots can report safety discrepancies
without fear of negative
repercussions. (2)
Pilots are willing to
report information
regarding marginal
performance or unsafe actions of
other pilots. (3)
Pilots do not bother
reporting near misses or close calls,since this events don't
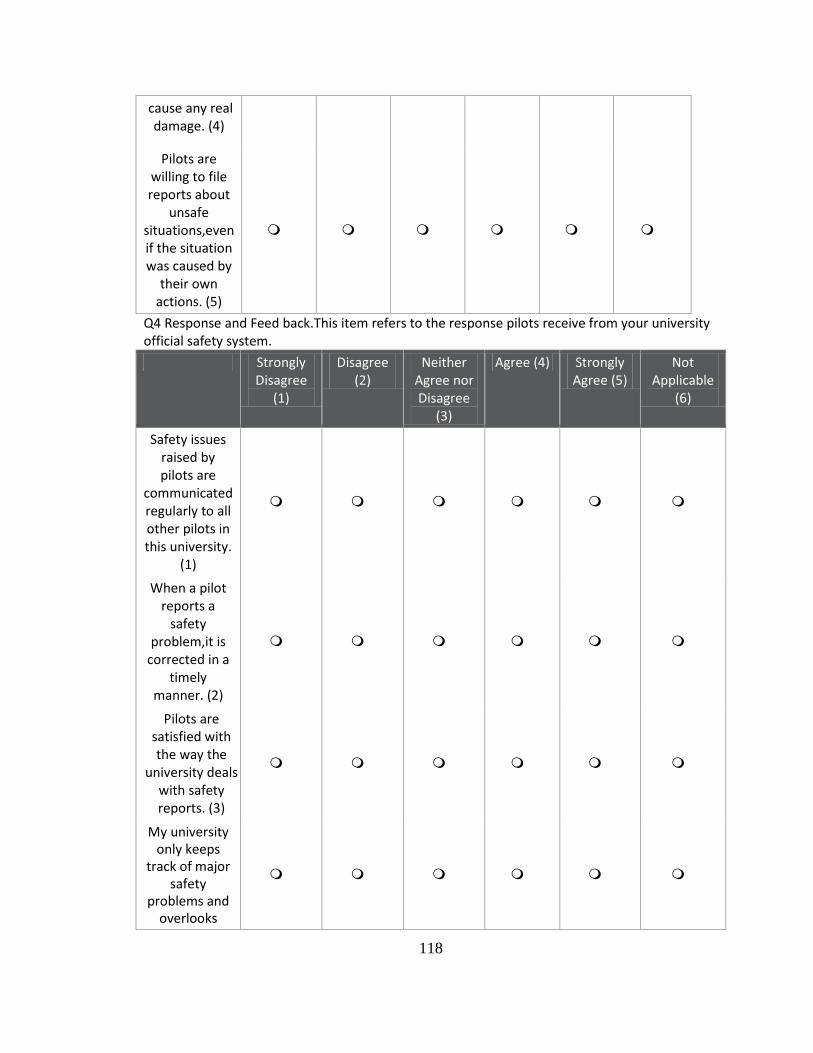
118
cause any real damage. (4)
Pilots are willing to file reports about
unsafe situations,even if the situation was caused by
their own actions. (5)
Q4 Response and Feed back.This item refers to the response pilots receive from your university official safety system.
Strongly Disagree
(1)
Disagree (2)
Neither Agree nor Disagree
(3)
Agree (4) Strongly Agree (5)
Not Applicable
(6)
Safety issues raised by pilots are
communicated regularly to all other pilots in this university.
(1)
When a pilot reports a
safety problem,it is
corrected in a timely
manner. (2)
Pilots are satisfied with the way the
university deals with safety reports. (3)
My university only keeps
track of major safety
problems and overlooks

119
routine ones. (4)
my university keeps
confidential database of
responses and feedback. (5)
Q5 Safety Personnel.This item refers to the person or people in your university who are formally designated as responsible for safety.
Strongly Disagree
(1)
Disagree (2)
Neither Agree nor Disagree
(3)
Agree (4) Strongly Agree (5)
Not Applicable
(6)
Personnel responsible
for safety hold high status in the university.
(1)
Personnel responsible for safety have the power to
make changes. (2)
Personnel responsible for safety
have a clear understanding
of the risk involved in
flight training. (3)
Safety personnel
have little or no authority compared to operational
personnel. (4)
Safety personnel

120
demonstrate a consistent commitment to safety. (5)
Q6 Please use the space below for any extra comment on Formal Safety Program. Q7 Accountability/Just Culture These items refer to the ways in which pilots are treated on their safe or unsafe behavior at your university.
Strongly Disagree
(1)
Disagree (2)
Neither Agree nor Disagree
(3)
Agree (4) Strongly Agree (5)
Not Applicable
(6)
University management
shows favoritism to certain pilots.
(1)
Standards of accountability
are consistently applied to all pilots in this
university. (2)
When pilots make a
mistake or do something
wrong, they are dealt with fairly by the
university. (3)
When an accident or
incident happens,
management always
blames the pilot. (4)
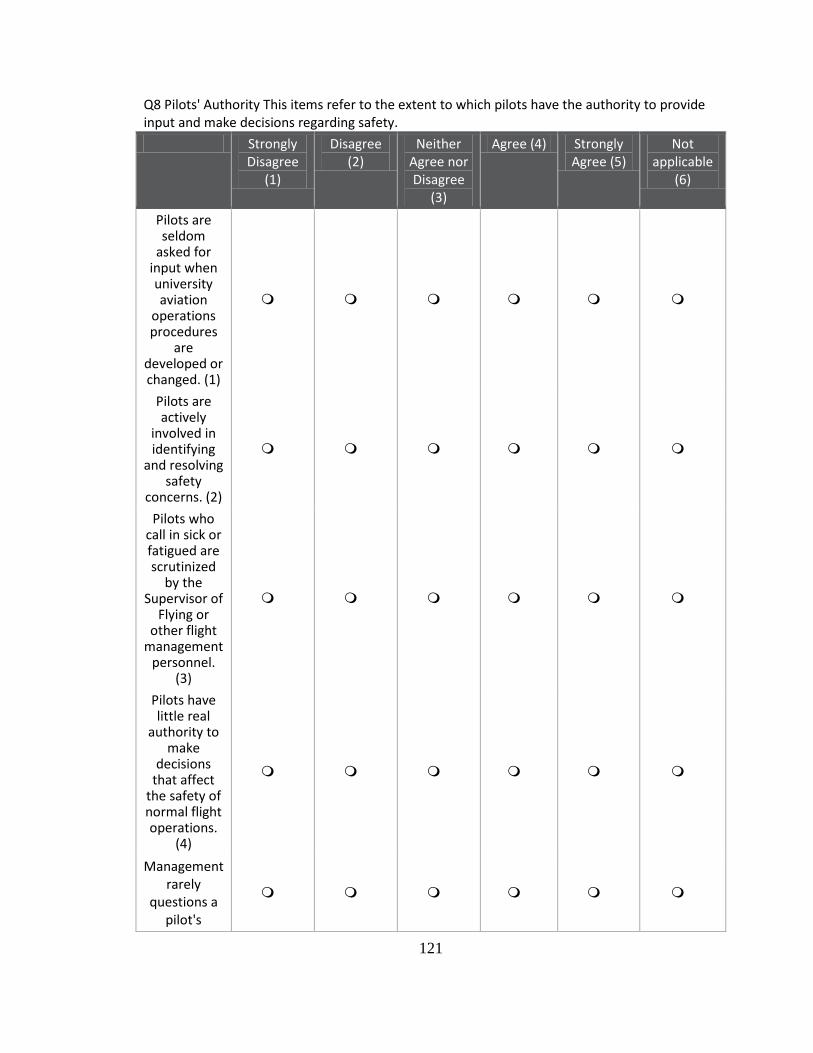
121
Q8 Pilots' Authority This items refer to the extent to which pilots have the authority to provide input and make decisions regarding safety.
Strongly Disagree
(1)
Disagree (2)
Neither Agree nor Disagree
(3)
Agree (4) Strongly Agree (5)
Not applicable
(6)
Pilots are seldom
asked for input when university aviation
operations procedures
are developed or changed. (1)
Pilots are actively
involved in identifying
and resolving safety
concerns. (2)
Pilots who call in sick or fatigued are scrutinized
by the Supervisor of
Flying or other flight
management personnel.
(3)
Pilots have little real
authority to make
decisions that affect
the safety of normal flight operations.
(4)
Management rarely
questions a pilot's

122
decision to delay or
request for cancellation of a flight for
a safety issue. (5)
Q9 Professionalism This issue refers to the attitudes you perceive among your fellow pilots in regards to safety
Strongly Disagree
(1)
Disagree (2)
Neither Agree nor Disagree
(3)
Agree (4) Strongly Agree (5)
Not applicable
(6)
Pilots view the
university's safety record as their own
and take pride in it. (1)
Pilots who don't fly
safely quickly develop a negative
reputation among other
pilots. (2)
Pilots who are new and less senior
are willing to speak up regarding
flight safety issues. (3)
Decisions made by
senior pilots and
instructors are difficult
to challenge. (4)

123
Pilots never cut corners
or compromise
safety regardless of
the operational pressures to
do so. (5)
Q10 Please use space below for any extra comments on Informal Safety Program Q11 Chief/Lead Certified Flight Instructors ( CFI's) and Supervisor of Flight (SoF)These items refer to Chief/Lead Certified Flight Instructors ( CFI's) and Supervisor of Flight (SoF),with whom you interact regularly.
Strongly Disagree
(1)
Disagree (2)
Neither Agree nor Disagree
(3)
Agree (4)
Strongly Agree (5)
Not Applicable
(6)
Chief/Lead CFI's and SoF do not hesitate to contact pilots to proactively discuss
safety. (1)
Chief/Lead CFI's and SoF are unavailable when pilots need
help. (2)
As long as there are no accidents or
incidents,Chief/Lead CFI's and SoF don't
care how flight operations are performed. (3)
Chief/Lead CFI's have a clear
understanding of the risk associated
with flight operations. (4)
Pilots often report safety concerns to their Chief/Lead
CFI's and SoF rather

124
than the safety department. (5)
Q12 Dispatch.These items refer to your university's dispatch procedures. Strongly
Disagree (1) Disagree
(2) Neither Agree
nor Disagree
(3)
Agree (4)
Strongly Agree (5)
Not Applicable
(6)
Dispatch consistently emphasizes
information or details (e.g.,weather requirements,NOTA
Ms) that affect Flight safety. (1)
Dispatch inappropriately uses
the Minimum Equipment List
(MEL) when it would be better to fix equipment. (2)
Dispatch is responsive to pilots'
concerns about safety of operations.
(3)
Dispatch would rather take a chance
with safety than cancel a flight. (4)

125
Q13 Instructors/Trainers This items refer to your university's flight instructors or trainers. Strongly
Disagree (1)
Disagree (2)
Neither Agree nor Disagree
(3)
Agree (4)
Strongly Agree (5)
Not applicable
(6)
Instructors/trainers have a clear
understanding of risk associated
with flight operations. (1)
Safety is consistently
emphasized during training at my university. (2)
Instructors/trainers teach shortcuts and ways to get around safety
requirements. (3)
Instructors/trainers prepare pilots for the various safety situations, even uncommon or
unlikely ones. (4)

126
Q14 Ramp Operations (Fuel truck drivers and maintenance personnel) these items refer to ramp operations at the university.
Strongly Disagree
(1)
Disagree (2)
Neither Agree nor Disagree
(3)
Agree (4) Strongly Agree (5)
Not Applicable
(6)
Ramp personnel are careful about positioning of
equipment (e.g. fuel
trucks, power carts) that
poses potential safety hazards.
(1)
The lack of communication between ramp personnel and
pilots frequently lead to an incident at the flight
line. (2)
I am confident ramp
personnel would notify
me of any minor
vehicle/aircraft collision that involves my
aircraft, even if damage is not
readily apparent. (3)
Ramp personnel are careless about
removing debris (e.g. cups, rags,

127
tools, clothing etc) near the
aircraft, which may pose FOD
hazards. (4)
Ramp activities are well
coordinated between pilots
and ramp employees at the flight line.
(5)
I feel like I am gambling with the safety of my aircraft
every time I go on a training activity. (6)
Q15 Please use the space below for any extra comments on Operational Interaction.
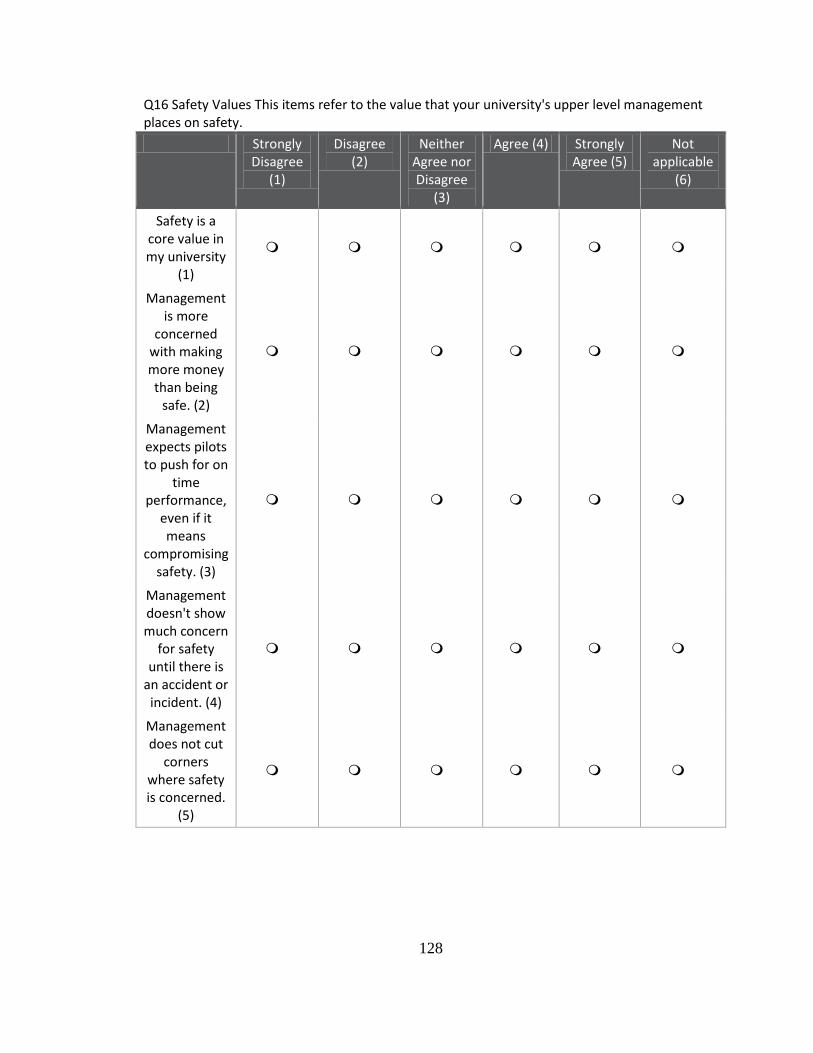
128
Q16 Safety Values This items refer to the value that your university's upper level management places on safety.
Strongly Disagree
(1)
Disagree (2)
Neither Agree nor Disagree
(3)
Agree (4) Strongly Agree (5)
Not applicable
(6)
Safety is a core value in my university
(1)
Management is more
concerned with making more money than being
safe. (2)
Management expects pilots to push for on
time performance,
even if it means
compromising safety. (3)
Management doesn't show much concern
for safety until there is
an accident or incident. (4)
Management does not cut
corners where safety is concerned.
(5)

129
Q17 Safety Fundamentals These items refer to your university's typical practices related to safety in various areas.
Strongly Disagree
(1)
Disagree (2)
Neither Agree nor Disagree
(3)
Agree (4) Strongly Agree (5)
Not applicable
(6)
Checklist and
procedures are easy to understand
(1)
My university's
flight operations manual are
carefully kept up to date. (2)
My university is
willing to invest
money, resources
and effort to improve
safety. (3)
My university is committed
to equipping aircraft with up-to-date technology.
(4)

130
My university
ensures that maintenance on aircraft is adequately performed
and that aircraft are
safe to operate. (5)
Q18 Going Beyond Compliance These items refer to university upper level management's commitment to meeting or exceeding safety requirements.
Strongly Disagree
(1)
Disagree (2)
Neither Agree nor Disagree
(3)
Agree (4) Strongly Agree (5)
Not Applicable
(6)
Management goes above and beyond regulatory minimums
when it comes to issues of
flight safety. (1)
Management schedules pilots as much as legally
possible; with little
concern for pilots' sleep schedule or fatigue. (2)
Management tries to get
around safety
requirements whenever
they get the

131
chance. (3)
Management views
regulation violations
very seriously,
even when they don't
result in any serious
damage or injury. (4)
Q19 Please use the space below for any extra comments on Organizational Commitment. Q20 Personal Risk (PR) and Organizational Risk (OR) The following items describe behaviors that aviation professionals sometimes engage in or feel pressured to engage in. Please answer each item twice. In the first case refer to your own behavior and the next to the behavior of other pilots that you know. Please remember that your answers to this questionnaire are COMPLETELY ANONYMOUS and no attempt will be made to personally identify you. Your honest answer will help me to make effective recommendations regarding aviation safety at your university.
Self Others
Never (1)
Sometimes (2)
Always (3)
Not Applicabl
e (4)
Never (1)
Sometimes (2)
Always (3)
Not Applicabl
e (4)
Reported for duty when
fatigued, ill, or under unusual stress
because you had no other
choice. (1)
been pressured to take -off or land in bad
weather with
minimal briefing, to maintain
schedule. (2)

132
Been pressured to
fly a university
aircraft you did not
believe was in safe
condition. (3)
Failed to challenge a superior on
a safety issue for fear of
losing you job. (4)
Made a hard landing that you did not report. (5)
Been aware that another
pilot was not flying safely but
said nothing. (6)
Allowed an instructor or
a senior pilot's error
to go unchallenge
d. (7)
Q21 Please use the space below for any extra comments on Safety Behavior. Q22 University Safety Record Items These items refer to your perception about the university's safety record.
Strongly Disagree
(1)
Disagree (2)
Neither Agree nor Disagree
(3)
Agree (4) Strongly Agree (5)
Not Applicable
(6)
The university's
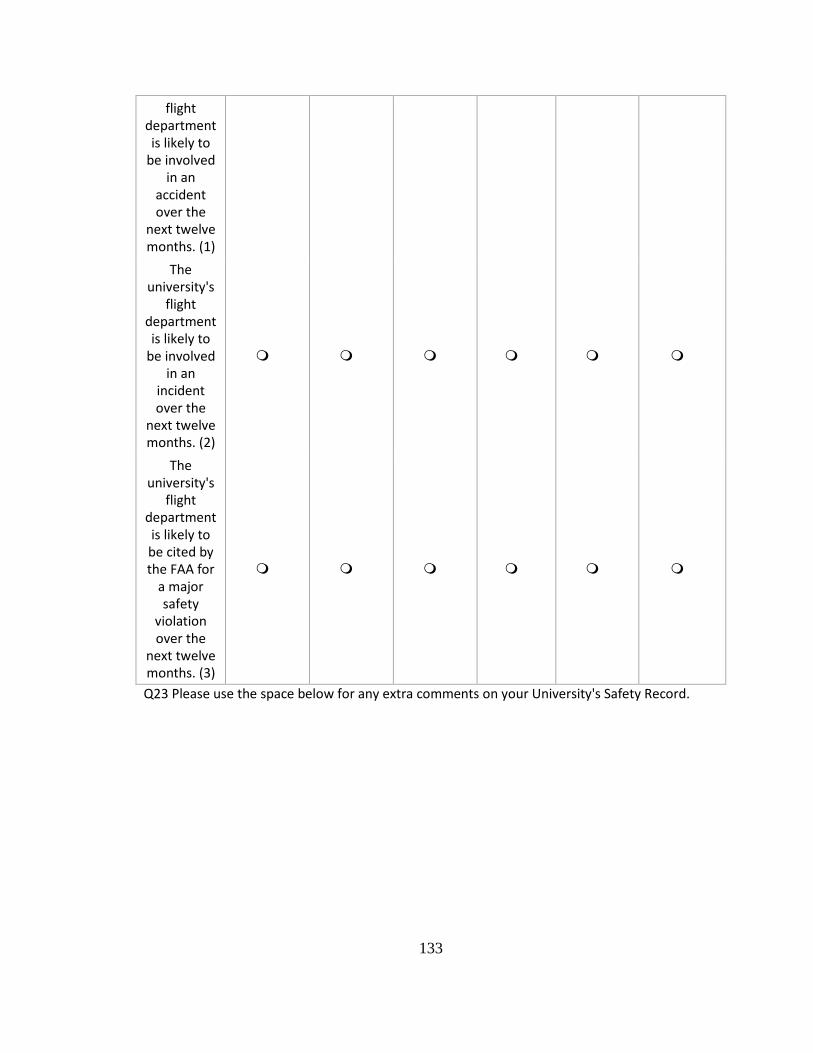
133
flight department is likely to
be involved in an
accident over the
next twelve months. (1)
The university's
flight department is likely to
be involved in an
incident over the
next twelve months. (2)
The university's
flight department is likely to be cited by the FAA for
a major safety
violation over the
next twelve months. (3)
Q23 Please use the space below for any extra comments on your University's Safety Record.

134
Q24 Please note: this information is for research purposes only and would not be used to identify you personally. Academic Year Group
Freshman (1) Sophomore (2) Junior (3) Senior (4) Other ( Please specify in the space below) (5) ____________________
Q25 Gender
Male (1) Female (2)
Q26 Are you an International Contract Student.
Yes (1) No (2)
Q27 Age
Below 20 (1) 20-30 (2) 31-40 (3) 41-50 (4) 51-60 (5) 60+ (6)
Q28 Certificates/Ratings (Please check all that apply)
Student (1) Private (2) Commercial - Single Engine (3) Commercial-Multi Engine (4) CFI (5) CFII (6) MEI (7) ATP (8) Other certificates and type ratings (9) ____________________
Q29 Have you ever reported a safety problem at your university?
Yes (1) No (2)
Q30 Please use the space below for any additional comments you have. Thank you very much for your time and participation in this survey.

135
Appendix B
Informed Consent Form
Introduction
This study attempts to collect information about the perception of front line operational personnel like commercial flight students and certified flight instructors (CFI's) referred to as PILOTS in this study, on the status of the safety culture in the collegiate aviation program. The study will also find out if there are differences in these perceptions and try to establish a relationship between these perceptions on the safety culture and safety behavior.
Procedures
You are invited to participate in this study and it is important, you understand the procedures and your rights. You are asked to answer a short questionnaire about your perception about the aviation safety culture in the university. The questionnaire consists of thirty (30) questions with 5 likert -scale and a Not Applicable options. The questionnaire includes open ended essay style questions with spaces for extra comments and will take approximately 30 minutes or less. Questions are designed to determine how you perceive the safety culture in the collegiate aviation program, after the implementation of a Safety Management System (SMS) phase 1 and 2.The questions also assess the strength of relationship between your perceived safety culture and safety behavior. This questionnaire will be conducted with an on-line created survey called the Collegiate Aviation Program Safety Culture Survey (CAPSCUS).
Risks/Discomforts
Risks are minimal for involvement in this study. However, you may feel emotionally uneasy when asked to make judgments based on your perception of some safety issues affecting aviation safety at the university. You are allowed to omit questions that you feel uncomfortable answering. Although we do not expect any harm to come upon any participants due to electronic malfunction of the computer, it is possible though extremely rare and uncommon.
Benefits
There are no direct financial benefits for participants. However, it is hoped that through your participation, the researcher will come up with recommendations on how to enhance a positive organizational safety culture and continuously improve aviation safety at the university.
Confidentiality
Identifying information will not be collected in this study. Data will only be reported in an aggregate format (by reporting only combined results and never reporting individual ones). All questionnaires will be secured by electronic password, and no one other than the primary investigator and individuals with legal authority will have access to them. The data collected will be stored in the UND-secure database until it is deleted by the primary investigator in accordance with UND policy on data disposal.
Compensation
There is no direct compensation; however, participants are strongly encouraged to partake in this survey to help in the continuous improvement of aviation safety at the university.
Participation
Participation in this research study is completely voluntary. You have the right to withdraw at anytime or refuse to participate entirely without jeopardy to your relationship with the aviation department or the university. If you desire to withdraw, please close your Internet browser and notify the principal investigator at this email: [email protected]
Questions about the Research
If you have questions regarding this study, you may contact Daniel Kwasi Adjekum , at 701-630-9743, [email protected] or [email protected].

136
Questions about your Rights as Research Participants If you have questions you do not feel comfortable asking the researcher, you may contact (Bill Watson,J.D.), 701-740-3277, 211 Odegard Hall, [email protected]. Or contact the director of UND's Institutional Review Board at 701-777-4279.

137
Appendix C
INVITATION TO PARTICIPATE IN AN AVIATION SAFETY CULTURE PERCEPTION SURVEY
My name is Daniel Kwasi Adjekum and I am a graduate student at the UND Odegard School of Aerospace Sciences. I am presently completing a Master of Science (MS) program in Aviation and in my third semester. I am currently working on my thesis, which is in the area of assessing the perceptions of commercial flight students and certificated flight instructors (CFI) on the safety culture of the UND flight program. The survey is an on line questionnaire, which is strictly voluntary and confidential and no identifying information will be collected. All information and data would be secured in line with UND IRB policy on handling of data. You are invited to kindly visit the link, which is pasted here. Your Anonymous Survey Link: https://und.qualtrics.com/SE/?SID=SV_6MzrGsI9Ma6egLP It will also be securely sent to your UND mail inbox and by using a password, which is your UND mail password, answer the questions. Your candid opinion will help me to establish relationships and differences in the perceived status of aviation safety at UND Aerospace and how it affects safety behavior. This study is in line with establishing a baseline study for our safety culture and to continuously improve safety as part of our Safety Management System (SMS) implementation plan. For any further clarification and information please feel free to send me an email at kadjekum@ yahoo.com or [email protected]. Thanks for your participation.

138
Appendix D
RE: Gentle Reminder about request for assistance 1 recipient CC: recipients You More BCC: recipients You Show Details FROM:
• Von Thaden, Terry L
TO:
• kwasi adjekum
Message starred Tuesday, October 16, 2012 3:11 AM Capt Adjekum, The CASS items are available in the open literature. You certainly may use them; just need to cite the source, that's all. Regards, Terry ********************************* Terry L. von Thaden, Ph.D. Illinois Fire Service Institute University of Illinois at Urbana-Champaign 217/244.8667 [email protected] Address: 11 Gerty Drive Champaign, IL 61820 USA http://www.fsi.illinois.edu/ "In theory, there is no difference between theory and practice, but in practice, there is." -- Jan L. A. van de Snepscheut
From: kwasi adjekum [[email protected]] Sent: Monday, October 15, 2012 11:00 AM To: Von Thaden, Terry L Subject: Gentle Reminder about request for assistance
Hi Terry I hope you had a good week end. I am writing to remind you about my request to use and modify if possible, the questions in the Commercial Aviation Safety Survey (CASS) for my intended safety culture survey at an accredited collegiate aviation flight department. This is part
139
of my research thesis for a Master of Science degree in aviation. I intend to use an array of questions from the CASS and other sources to assess the safety climate/culture and also draw inference on strength of relationship about perceptions and safety behavior. I would be most grateful if you could get me a feedback on the possibility of using the CASS and what the modalities will be in using it. Thanks and as always have a great day. Daniel Kwasi Adjekum Graduate Service Assistant UND Aerospace 701-630-9743
Search Results by Yahoo! SHORTCUTS
Search querySearch Web
Loading...

140
REFERENCES
Alkov, R. (1996). Aviation Safety- Human Factors. Casper: Endeavours Books. American Psychological Association. (2012). Human Perception and Performance.
Journal of Experimental Psychology Vol 16, 329-337. Åsa, E. (2007). Aviation on the Ground: Safety Culture in a Ground Handling Company.
International Journal Of Aviation Psychology,17(1), 59-76. Australian Transportation Safety Board. ( 2004). ATSB Aviation Safety Survey – Safety.
Canberra: Australian Transportation Safety Board. Bird Strike Control. (2009, July 02). Bird Strike Control . Retrieved from Flight Safety
News @ Bird Strike Control website : http://www.birdstrikecontrol.com/news/flight_safety/ntsb-night-time-collision-with-goose-brought-down-und-seminole/
Bjerke, E. (2011). Safety Council: Student Survey Results. Grand Forks: UND Aerospace. Block, E. S. (2007). The structure of safety climate for accident free flight crews.
International Journal of Applied Aviation Studies 7 (1), 46-59. Bos, P. L.-t. (2007, August/September). Safety Management Systems: A Primer. AAAE
Airport Magazine, pp. 44-48. Bruce, B. (2007, December 18). casa.gov.au. Retrieved from casa.gov.au website:
http://www.casa.gov.au/wcmswr/_assets/main/fsa/2007/dec/18-25.pdf Civil Aviation Authority.govt.nz. (2012, June 10). caa.govt.nz. Retrieved from caa: .
http://www.caa.govt.nz/SMS/SMS_home.htm Civil Aviation Safety Authority. (2009). Cost- Benefit Analysis Procedures.Civil Aviation
Safety Authority Manual.Version 1.0 . Canberra: Australian Government Press. Cooper, M. (2000). Towards a model of safety culture. Safety Science.Vol.36, 111-136. Cortina, J. (1993). What is coefficient alpha? An examination of theory and application.
Journal of Applied Psychology, 78,98-104.

141
Cox, J. (2011). Adapting Costing Methods to Safety — Using Financial Tools to Show Value in Safety Processes. Singapore: Flightsafety Foundation.
Creswell, J. (2009). Research Design: Qualitative,Quantitative,and Mixed Method
Approaches.3 edn. Thousand Oaks,CA: SAGE. Cronbach, L. (1951). Coefficeint of alpha and the internal structure of a test.
Psychometrika, 16,297-334. Damon, L. (2011). Aviation Safety Management System: Return on Investment Study. St
Louis,MO: Centre for Aviation Safety Research,Parks College of Engineering,Aviation and Technology.St Louis University.
Dekker, S. (2007). Just Culture: Balancing Safety and Accountability. Farnham,Surrey:
Ashgate Publishers International. Dillman, B. (2010). Safety Occurrences:Student Perceptions regarding failure to report.
Journal of Aviation Management and Education Vol 1 ( 1 ) , 1-10. Dresner, M. (2002). Metrics in Airline Industry: Handbook of airline Economics.Second
Edition. New York,NY: Mc Graw-Hill. Evans, B. G. (2007). Development and initial validation of an aviation safety climate
scale. Journal of Safety Research 38 (6), 675–682. Federal Aviation Administration. (2011, November 18). Faa website. Retrieved from
Federal Aviation Administration Website: http://www.faa.gov/about/plans_reports/media/2012/AVS%20FY12%20Business%20Plan%2011-11-28.pdf
Federal Aviation Administration . (2012). Safety Management System (SMS) for Pilot
Schools and Training Centers . Washington,DC : Air Traffic Organization Next Gen & Operations Planning.Office of Research and Technology Development.
Federal Aviation Administration. (2003, April 14). Federal Aviation Administration.
Retrieved from FAA.gov: http://www.faa.gov/documentLibrary/media/Order/8000.81.pdf
Federal Aviation Administration. (2008, September 30). FAA.gov . Retrieved from FAA
website: http://www.faa.gov/about/initiatives/sms/ Federal Aviation Administration. (2010, July 15). FAA.gov. Retrieved from FAA
website: https://av-info.faa.gov/vdrp/VDRP%20Introduction%20Guide%20-%20AirCarrier.pdf

142
Federal Aviation Administration. (2010, August 12). FAA.gov, AC 120-92A - Safety Management Systems for Aviation Service Providers. Retrieved from FAA website: http://www.faa.gov/regulations_policies/advisory_circulars/index.cfm/go/document.information/documentID/319228
Federal Aviation Administration. (2010, September 20). Federal Aviation
Administration. Retrieved from faa.gov web site: http://www.faa.gov/about/initiatives/sms/faq/
Federal Aviation Administration. (2010, November 05). Federal Register. Retrieved
from US Government Federal Register website: https://www.federalregister.gov/articles/2010/11/05/2010-28050/safety-management-systems-for-part-121-certificate-holders#p-214
Federal Aviation Administration. (2011, October 19). FAA.gov. Retrieved from Federal
Aviation Administration website: http://www.faa.gov/data_research/accident_incident/preliminary_data/
Federal Aviation Administration. (2012, February 27). Federal Aviation Administration.
Retrieved from Federal Aviation Administartion Web site: https://www.faa.gov/news/press_releases/news_story.cfm?newsId=13373
Fanjoy, R. (2011). Learning Styles of Chinese Aviation Students. International Journal
of Applied Aviation Studies 11 (1), 1-8. Federal Aviation Administration . (2012, July 10). Faa.gov. Retrieved from
Faa.gov/initiative/sms: http://www.faa.gov/about/initiatives/sms/pilot_projects/overview/
Federal Aviation Administration. (2008). Safety Management System Guidelines - Order
8000.369. Washington.D.C: FAA. Federal Aviation Administration. (2010). Safety Management Systems for Aviation
Service Providers.AC 120-92A. Washington D.C: Federal Aviation Administration.
Field, A. (2009). Discovering Statistics using SPSS 3 edition. London: Sage Publishing . Flight Safety Foundation. (2005). Road Map to a Just Culture: Enhancing the safety
environment. FlightSafety Digest Vol.24.No.3, 9-15. Flightsafety Foundation. (2005). Just Culture: A Road Map. Flightsafety Digest, 7-14. FlightSafety Foundation. (2011). Adapting Costing Methods to Safety — Using Financial
Tools to Show Value in Safety Processes. Singapore: FlightSafety Foundation.
143
Flouris, T. (2011). Adapting Costing Methods to Safety — Using Financial Tools to Show Value in Safety Processes: Power point Presentation. FlightSafety Foundations 64th annual International Air Safety Seminar (IASS). Singapore: FlightSafety Foundation.
Frankel, A. (2006). Fair and Just Culture-Team Behaviour and Leadership
Engagement:The tools to achieve High Reliability. Health Sevice Research, 1690-1709.
Global Aviation Initiative Network. (2004). RoadMap to a Just Culture:Enhancing the
Safety Environment- 1 edn. Mc Lean,Virginia : GAIN Working Group E . Galloti, V. (2006). ICAO: Harmonistaion of Safety Management Systems (SMS). 18th
FAA/ATA International Symposium on Human factors in Maintenace and Ramp Operations (pp. 17-18). Orlando,FL: FAA.
Gardiner, P. (2000). Operational Risk Management- Handbook For Airline Operations.
New York: Mc Graw-Hill Company. Gibbons, A. (2006). Development and Initial Validation of a Survey for Assessing Safety
Culture in Commercial Flight Operations. The International Journal Of Aviation Psychology. 16(2), 215–238, 215-238.
Gordon, R. (2004). Developing a Safety Culture in a Research and Development
Environment: Air Traffic Management Domain. Human factors and Ergonomic Society Conference-Europe Chapter. (pp. 2-4,6-8). Bretigny-sur-orge,France: Eurocontrol.
Guldenmund, F. (2007). The Use of Questionnaires in Safety Culture Research-An
Evaluation. Safety Science 45 ( 6), 723-743. Hofstede, G. (1980). Cultures'Consequences: International Differences in Work Related
Values. Bervely Hills: Sage. Hofstede, G. (2005). Cultures and Organizations: Softwares of the Mind 2nd Rev ed.
New York,NY: Mc Graw-Hill. Hopkin, D. (2010). HandBook of Aviation Human factors,2nd Ed. Boca Raton: C.R.C
Press. Hudson, P. (2001). Aviation Safety Culture. Canberra: Safesky. Hunter, D. (2006). Risk Perception among General Aviation pilots. International Journal
of Aviation Psychology 16 (2), 135-144.

144
International Atomic Energy Agency. (1998). Developing Safety Culture in Nuclear Activities: Safety Report Series 11 . Vienna,Austria: International Atomic Energy Agency.
International Air Transport Association . (2011). Human Factors program for Airside
safety -AHM 640. Montreal: IATA. International Air Transport Association . (2011). Safety Management System-
Implementation and Controls Handbook. Montreal: IATA Training and Development Institute.
International Air Transport Association. (2011). Airside Management and Safety.
Montreal: IATA training and development Institute. International Air Transport Association. (2012, July 16). IATA . Retrieved from IOSA
website: http://www.iata.org/ps/certification/iosa/Pages/index.aspx International Civil Aviation Organization. (2002). Line Oriented Safety Audit Manual:
Doc 9803. AN/761 1 edn. Montreal: ICAO. International Civil Aviation Organization. (2009). Safety Management Manual
(SMM).ICAO Doc. 9859 .2nd ed. Montreal: ICAO. International Civil Aviation Organization. (2009). Safety Management Manual (SMM)-
Doc 9859AN/460: 2nd ed. Montreal: ICAO. Retrieved from International Civil Aviation Organisation website.
In Wells, T. &. (2003). Commercial aviation safety ( 4th eds). . New York: Mc Graw-
Hills,Inc. International Air Transport Association. (2011). SMS Implementation and Control Guide
- Air Nigeria. Lagos: IATA. Joy, S. (2009). Are there cultural differences in learning styles? International Journal of
InterCultural Relations 33 (1), 69-85. Kanki, B. (2010). Crew Resosurce Management Vol 2. San Diego.CA: Academic Press-
Elsevier. Lercel, D. (2011). Aviation Safety Management System Return on Investment Study. St
Louis .MO: Centre for Aviation Safety Research,Parks College of Engineering,Aviation and Technology.St Louis University.
Lu, C.-t. (2006). ANOTHER APPROACH TO ENHANCE AIRLINE SAFETY: USING
MANAGEMENT SAFETY TOOLS. Journal of Air Transportation Vol. 11, No. 1, 115-121.

145
Lu, C.-t. (2011). Safety Culture: The Perception of Taiwans' Aviation Leaders. West Lafayyete,IN: Pardue University.
Lu, C.-t. A. (2008). Validating an airport Safety management system. . 2008 NASA
Airport Safety Competition. Lu, C.-t. B. (2007). System safety application: Constructing a comprehensive aviation
system safety management model (ASSMM). International Journal of Applied Aviation Studies, 7(1)., 28-45.
Lu, C.-t. P. (2005). Discovering the non-flight hazards and suggesting a safety training
model. . International Journal of Applied Aviation Science, 5(1), 135-152. Mc Cune, D. (2012, August 31). Safety Culture Assessment in Collegiate Aviation:
Survey Tool Development . (D. Adjekum, Interviewer) Moncton Flight College. (2009, October 22). MFC.nb.ca . Retrieved from MFC Web
site: http://mfc.nb.ca/in-the-news.html National Aeronautics Safety Administration. (2011). National Aeronatics and Space
Administration strategic Plan. Washington D.C: NASA. National Aeronautics Safety Administration. (2012, June 19-20). National
Transportation Safety Board General Aviation Safety Forum. Retrieved from NTSB Website: http://www.ntsb.gov/news/events/2012/GA_safety/index.html
Office of the Auditor Audit Services Division City and County of Denver. (2010, August
19). City and County of Denver. Retrieved from Denvergov.org website: http://www.denvergov.org/Portals/3/documents/2010%20Audit--DIA_Safety_Culture_08-19-10.pdf
Patankar, S. (2003). An assessment of safety culture in an aviation organisation.
International Journal of Applied Aviation Studies Vol. 3 (2), 243-259. PerezGonzalez, J. D. (2009). ICAO: human factors, management and organization.
Aviation Knowledge Vol 2009 , 4-5. Peterson, D. (1988). Safety Management. Goshen,New York: Aloray Inc. Piers, M. M. (2009). Safety culture framework for the ECAST SMS-WG. European
Strategic Safety Initiative. Cologne, Germany: European Aviation Safety Agency. Reason, J. (1997). Managing the Risks of Organizational Accidents. . Aldershot: Ashgate. Reason, J. (2003). Managing Maintenance Error: A Practical Guide. Aldershot: Ashgate.

146
Roughton, J. (2002). Developing a Safety Culture: A leadership approach. Woburn,MA: Butterworth Heinemann (BH).
Schiff, S. ( June 11 - 14, 2006 ). De-mystifying Organizational Culture For the Safety
Professional. ASSE Professional Development Conference and Exposition (pp. 1-6). Seattle, Washington: American Society of Safety Engineers.
Simon, S. C. ( 2009). “Transforming Safety Culture: Grassroots-Led/Management-
Supported Change at a Major Utility,”. Professional Safety, April edition, 28-35. Steven, D. (2009, March 20). caa.gov.nz. Retrieved from caa.gov.nz website:
http://www.caa.govt.nz/publicinfo/speeches.htm. Stevens, J. (2002). Applied Multivariate statistics for the social sciences ( 4th ed.).
Hillsdale,NJ: Erlbaum. Stolzer, A. (2008). Safety Management System in Aviation. Burlington: Ashgate Press. Stolzer, A. (2011). Implementing Safety Management Systems in Aviation . Surrey:
Ashgate Publishers. Tabachnick, B. (2007). Using Multivariate Statistics. 5th edition. . Boston: Allyn&
Bacon. Thaden, v. (2012, October 16). Permission to use CASS for Thesis Research. Urbana-
Champaign, IL, USA. Transport Canada. (2005). Safety Management System: An Assessment Guide TP 14326E.
Ottawa: Civil Aviation Communications Centre. Transport Canada. (2008). Guidance on Safety Management Development-Advisory
Circular 107-01,Issue 01 . Ottawa: Civil Aviation Communication Centre.Transport Canadal.
Transport Canada. (2011, April 14). Transport Canada. Retrieved from Transport
Canada Website: http://www.tc.gc.ca/eng/civilaviation/publications/tp14343-guide-3084.htm
Trejos, N. (2012, April 20). USA Today travel. Retrieved from USA Today:
http://travel.usatoday.com/flights/post/2012/04/airlines-post-losses-in-large-part-due-to-rising-fuel-costs/676371/1
Ullrich, G. (2012). Safety Mangement System Implementation Report Phases 1 and 2.
Grand Forks: UND Aerospace Foundation.

147
United States Airforce. (2004). Airforce Safety HandBook- International Flight Safety Officer Course Field HandBook2004B. Alburqueque,NM: Airforce Safety Centre.
United States Federal Register. (2011, July 13). Safety Management System for Part 121
Certificate Holders; Extension of Comment Period. Retrieved from The Daily Journal of the United States Government: https://www.federalregister.gov/articles/2011/01/31/2011-2049/safety-management-system-for-part-121-certificate-holders-extension-of-comment-period#p-16
von Thaden, T. (2008). Measuring Indicators of Safety Culture in a Major European
Airline Flight Operations Department. Sydney: Australian Aviation Psychology Association.
von Thaden, T. (2008). Safety culture in commercial aviation operations. University of
Illinois Human Factors Division Technical Report HFD-08-3/FAA-08-1. . Savoy: University of Illinois Human Factors Division .
von Thaden, T. (2008). Safety Culture Indicator Scale Measurement System ( SCISMS).
Savoy,IL: Human Factors Division: Institute of Aviation,University of Illinios. von Thaden, T. W. (2006). Organisational factors in aviation accidents. International
Journal of Aviation Psychology ( IJAP) 16(3), 239-255. Wald, A. (2010). Introduction to Aviation Management. Munster: LIT Verlag. Weigmann, D. A. (2004). Weigmann, D. A., Zhang, H., von Thaden, T. L., Sharma, G. &
G Safety culture: An integrative review [Abstract]. . International Journal of Aviation Psychology, 14(2), 117-134.
Wensveen, J. (2010). The Airline Industry:Trends, Challenges, Strategies. Faculty of
Economics and Business Leadership and Policy Seminar. (pp. 29-34). Sydney: The University of Sydney.
Wensveen, J. (2011). Air Transportation: A Management Perspective. . Burlington.VT:
Ashgate. Wiegmann, D. A. (2004). Safety Culture: An Integrative Review. International Journal
of Aviation Psychology ( IJAP) 14(2), 117-134. Wood, R. (2000). Safety Management Programs. Iverness,CO: Jeppeson. Wood, R. (2003). Aviation Safety Program - A Management Handbook 3rd Ed.
Englewood: Jeppesen Sanderson Inc.

148
Yule, S. (2008, Febuary 25). efcog.org working group. Retrieved from efcog website: http://www.efcog.org/wg/ism_pmi/docs/Safety_Culture/Feb08/safety_culture_and_safety_climate_a_review_of_the_literature.pdf
Zacks . (2012, September 4). Zacks Equity Research. Retrieved from Zacks Investment
Research: http://www.zacks.com/stock/news/82185/us-airlines-incur-loss-in-1h