safety & economic supervised by: prof. mohamed fahim eng. yusuf ismail presented by hessa...
TRANSCRIPT

Safety & EconomicSafety & Economic
Supervised By:Prof. Mohamed Fahim
Eng. Yusuf Ismail
Presented byHessa Al-sahlawi
Beshayer Al-DihaniLatifah Al-Qabandi

Agenda
. Environmental Consideration.
.Plant Safety.
.Economy.

Environmental Considerations
• Environmental Protection Agency (EPA):Environmental Protection Agency (EPA):
• The role of the EPA is to protect the environmental from the effects of human activity.
• For the chemical processing industries, this role relates to emissions to harmful or potentially harmful materials from the plant site to outside by air or by water.
• There are three classes of such emission: (1). Planned emissions. (2). Fugitive emissions. (3). Emergency emissions.

• In our process syngas production from the steam reforming of natural gas entails the disposal of the following waste effluent streams:
• 1- In stream 8 (Output from Compressor K-102) which is Gaseous flue gas mixture, containing mainly CO2 and H2O, but with traces of CO, SO2 and nitrogen oxides which discharge to the atmosphere.
• We study the chance that we have a harmful emission of CO, we found the concentration of CO was 41.24 mg/m³.
• From Gaussian Dispersion Model:
C = Q/(2πσyσZ u)*[ exp(-(z-H)²/2 σZ²)+exp(-(z+H) ²/ 2 σz ²)]
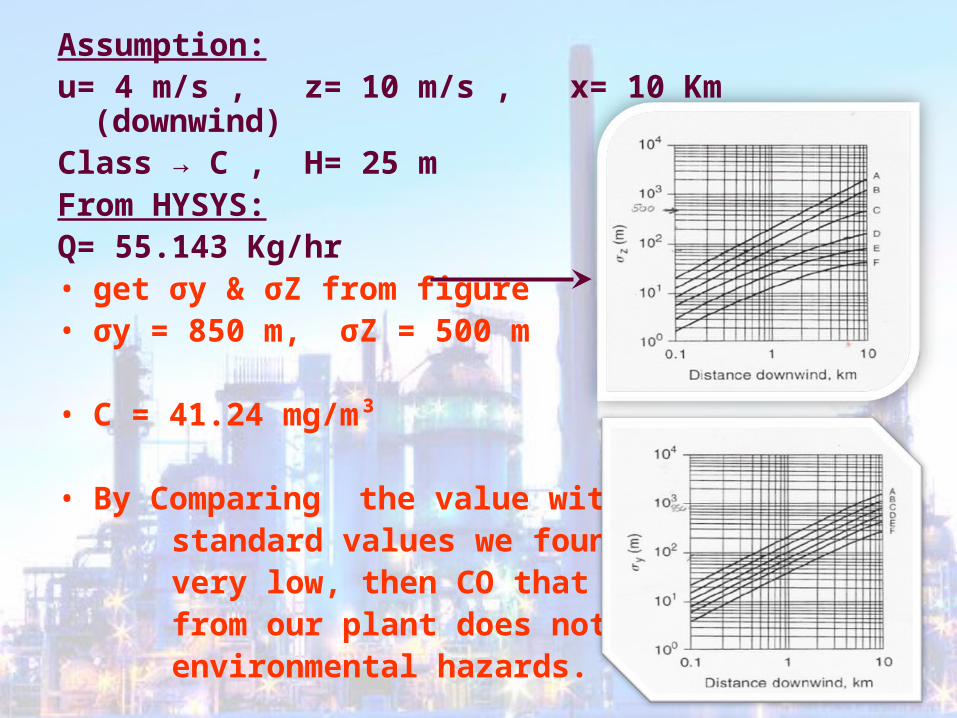
Assumption:u= 4 m/s , z= 10 m/s , x= 10 Km (downwind)Class → C , H= 25 mFrom HYSYS:Q= 55.143 Kg/hr• get σy & σZ from figure • σy = 850 m, σZ = 500 m
• C = 41.24 mg/m³
• By Comparing the value with EPA standard values we found it’s very low, then CO that product from our plant does not cause environmental hazards.


• 2- In stream 12, Gaseous, CO2 Purge stream which discharge to the atmosphere.
• 3- In stream 24, Aqueous, Condensate purge from the
cooled syngas stream. Traces of dissolved H2, with CH4, CO and CO2 send to waste water treatment.
• 4- In absorber [C-101] a zinc oxide system is environmentally desirable. Thus, no H2S is discharge to the atmosphere and the spent zinc oxide adsorbent is returned to the supplier to carry out the regeneration offsite.
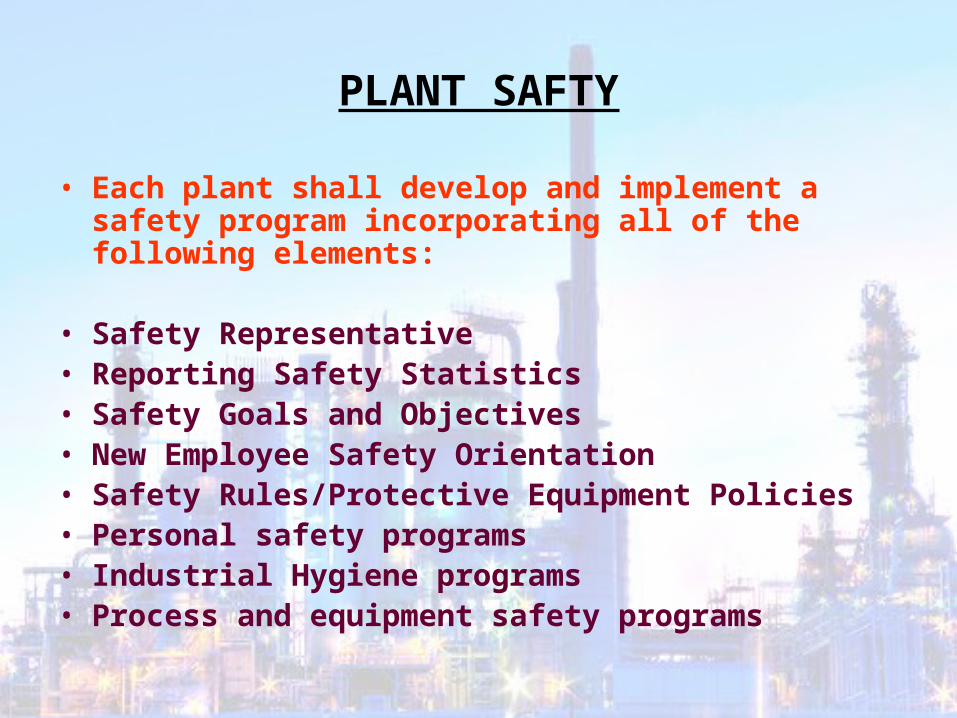
PLANT SAFTY
• Each plant shall develop and implement a safety program incorporating all of the following elements:
• Safety Representative• Reporting Safety Statistics• Safety Goals and Objectives • New Employee Safety Orientation• Safety Rules/Protective Equipment Policies • Personal safety programs • Industrial Hygiene programs • Process and equipment safety programs

What is HAZOP?
A Hazard and Operability (HAZOP) study is a structured and systematic examination of a planned or existing process or operation in order to identify and evaluate problems that may represent risks to personnel or equipment, or prevent efficient operation.
When to perform a HAZOP?
The HAZOP is usually carried out as a final check when the detailed design has been completed.

The following information should be available When study HAZOP:
•Process flow diagrams.
•Piping and instrumentation diagrams (P&IDs).
•Layout diagrams.
•Material safety data sheets.
•Provisional operating instructions.
•Heat and material balances.
•Equipment data sheets

Worksheet entriesWorksheet entries
Guide Word:
No flow – More of – Less of – Part of – As well as –
other than - Reverse.…
1.Deviation
2 .Cause
3 .Consequence
4. Action

Our process : E-101 Heat Exchanger
Intention: To provide feed to tubular reactor at 538˚C

Guide Word
DeviationCauseConsequenceAction
NoNo flow
(stream 4)Blockage in line
Fluid in E-101 overheats
Consider an interlock on fuel gas flow
NoNo flow
Out put StreamHeat tubes burstExplosion
Interlock with sudden pressure drop alarm
and shutdown
More ofMore flow in
(stream 4)Surge of K-103Unstable operationAlarm
More ofHigher pressureDown stream blockageTube failurePressure relief system
on tubes
Loss ofLess pressure in
tubesBurst pipe down stream
Explosion and toxic release
Alarm on low pressure or low flow
Other thanImpurities in Out
put StreamImpurities in feed or overheating in tubes
Impurities in product and/or catalyst
deactivation
Monitor E-101 temperatures
Part ofLow CO2 in
Stream 4K-103 not working
CO:H2 ratio off to R-101
Maintain spare compressor K-101
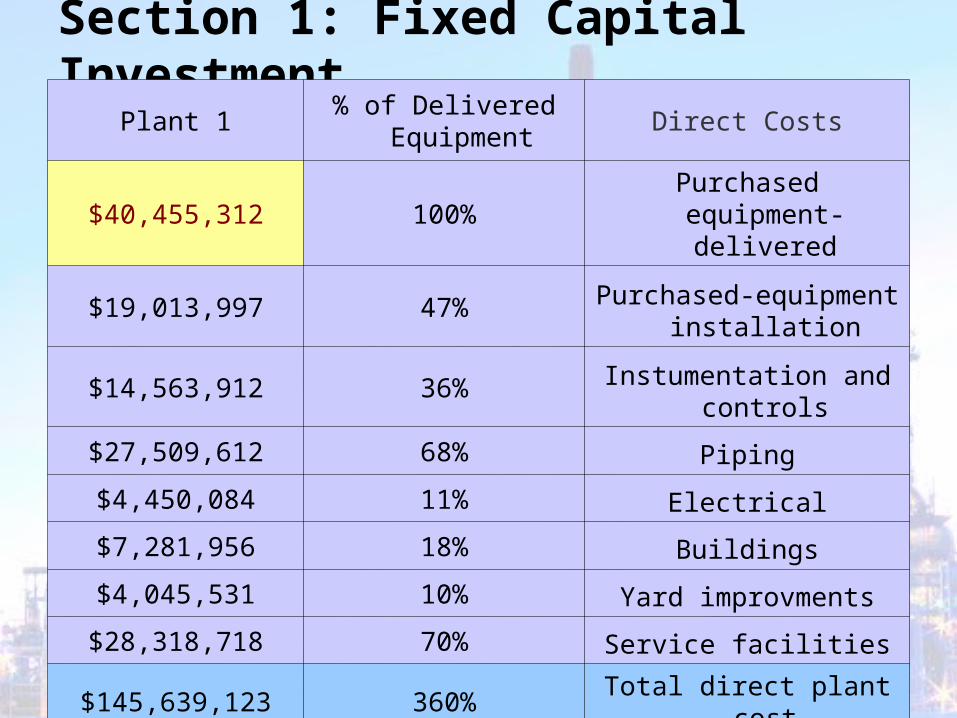
Section 1: Fixed Capital Investment
Direct Costs% of Delivered
EquipmentPlant 1
Purchased equipment-delivered
100%$40,455,312
Purchased-equipment installation
47%$19,013,997
Instumentation and controls
36%$14,563,912
Piping68%$27,509,612
Electrical11%$4,450,084
Buildings18%$7,281,956
Yard improvments10%$4,045,531
Service facilities70%$28,318,718
Total direct plant cost360%$145,639,123

Indirect Costs
Engineering and supevision
33%$13,350,253
Construction expenses
41%$16,586,678
Legal Expences4%$1,618,212
Contractor's fee22%$8,900,169
Contingency44%$17,800,337
Total Indirect Plant Cost
144%$58,255,649

Fixed capital investment
504%$203,894,772
Working capital89%$36,005,228
Total capital investment
593%$239,900,000
Total Fixed Capital Investment for Plant
$239,900,000

Total product cost
IManufacturing cost = Direct production cost + Fixed charges + Plant overhead costs
$84,761,420
ADirect production costs (about 36.5% of total product cost)
$67,807,000
1Raw materials (11% of the total product cost) $20,418,200
2Operating labor (5% of the total product cost) $9,281,000
3Direct supervisory and clerical labor (10% of operating labor)
$928,100
4Utilities (10% of total product cost) $18,562,000
5Maintenance and repairs (6% of fixed capital investment)
$14,394,000
6Operatint supplies (10% of cost of maintenance and repairs)
$1,439,400
7Laboratory charges (10% of operating labor) $928,100
8Patents and royalties (1% of total product cost)
$1,856,200

BFixed charges (2.1% of total product
cost) $3,961,020
1Depreciation (about 4% of fixed capital
investment and 2% of utlities)$1,330,840
2Insurance (0.4% of fixed capital
investment) $959,600
3Rent (9% of utilities) $1,670,580
CPlant overhead cost (7% of total
product cost) $12,993,400
IIGeneral expenses = administrative costs +
distribution and selling costs + research and development costs
$42,692,600
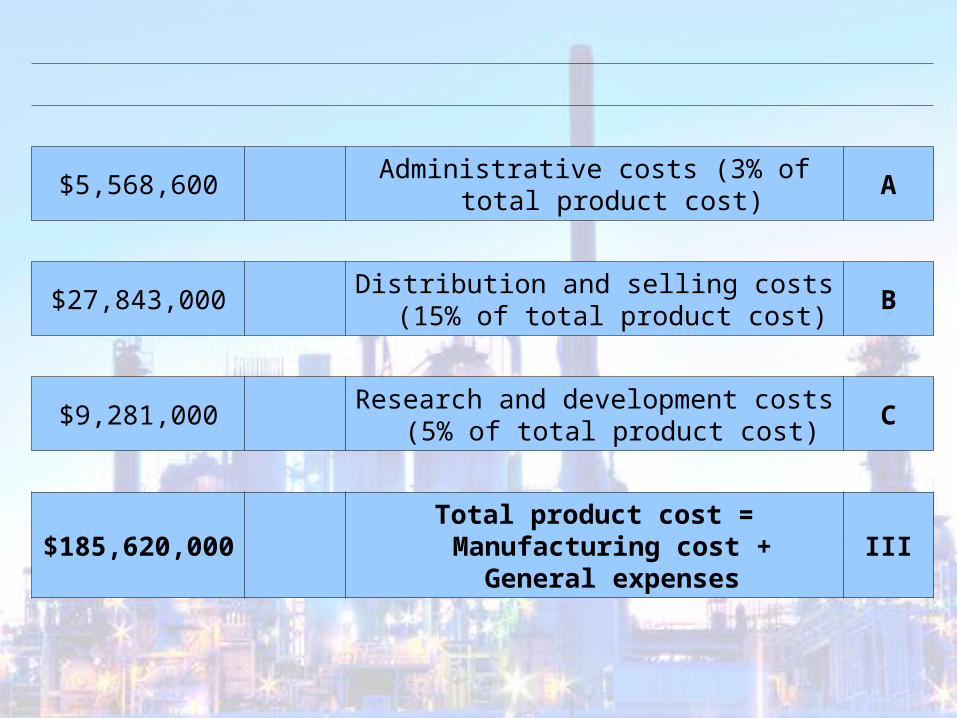
AAdministrative costs (3% of total product
cost) $5,568,600
BDistribution and selling costs (15% of
total product cost) $27,843,000
CResearch and development costs (5%
of total product cost) $9,281,000
IIITotal product cost = Manufacturing
cost + General expenses $185,620,000

Pay Back Period
Fixed Capital Investment =
$239,900,000i = 15%
Total manufacturing cost =$185,620,000.00
Total Product Sales =$271,300,000
Life of Plant =20 yr

YearFixed Capital InvestmentTotal Manufacturing
CostTotal Product
SalesEnd of year
Balance
0$239,900,000$0$0-$239,900,000
1$0$185,620,000$271,300,000-$190,205,000
2$0$185,620,000$271,300,000-$133,055,750
3$0$185,620,000$271,300,000-$67,334,113
4$0$185,620,000$271,300,000$8,245,771
5$0$185,620,000$271,300,000$95,162,636
6$0$185,620,000$271,300,000$195,117,032
7$0$185,620,000$271,300,000$310,064,586
8$0$185,620,000$271,300,000$442,254,274
9$0$185,620,000$271,300,000$594,272,416
10$0$185,620,000$271,300,000$769,093,278
11$0$185,620,000$271,300,000$970,137,270
12$0$185,620,000$271,300,000$1,201,337,860
13$0$185,620,000$271,300,000$1,467,218,539
14$0$185,620,000$271,300,000$1,772,981,320
15$0$185,620,000$271,300,000$2,124,608,518
16$0$185,620,000$271,300,000$2,528,979,795
17$0$185,620,000$271,300,000$2,994,006,765
18$0$185,620,000$271,300,000$3,528,787,779
19$0$185,620,000$271,300,000$4,143,785,946
20$0$185,620,000$271,300,000$4,851,033,838

-$1,000,000,000
$0
$1,000,000,000
$2,000,000,000
$3,000,000,000
$4,000,000,000
$5,000,000,000
0 1 2 3 4 5 6 7 8 9 10 11 12 13 14 15 16 17 18 19 20
Years
Payback Period

THANK YOU FOR LISTENING