safety performance on 20 construction sites in dublin
TRANSCRIPT

Technological University Dublin Technological University Dublin
ARROW@TU Dublin ARROW@TU Dublin
Masters Science
2004-01-01
Safety Performance on 20 Construction Sites in Dublin Safety Performance on 20 Construction Sites in Dublin
Paul McEvoy Technological University Dublin
Follow this and additional works at: https://arrow.tudublin.ie/scienmas
Part of the Environmental Health Commons
Recommended Citation Recommended Citation McEvoy, P. (2004)Safety Performance on 20 Construction Sites in Dublin. Masters dissertation. Masters dissertation. Technological University Dublin. doi:10.21427/D7KP58
This Theses, Masters is brought to you for free and open access by the Science at ARROW@TU Dublin. It has been accepted for inclusion in Masters by an authorized administrator of ARROW@TU Dublin. For more information, please contact [email protected], [email protected].
This work is licensed under a Creative Commons Attribution-Noncommercial-Share Alike 4.0 License
Safety Performance on Twenty
Construction Sites in Dublin
Paul Mc Evoy
Dublin Institute of Technology
M Phil Thesis 2007
Safety Performance on Twenty
Construction Sites in Dublin
Paul Mc Evoy
Dublin Institute of Technology
Supervisor, Mr. Victor Hrymak
Food Science & Environmental Health,
Cathal Brugha Street
2007
i
Abstract
The aim of this research was to assess factors affecting safety performance on twenty
apartment construction sites in Dublin using qualitative and quantitative risk
assessment techniques.
The quantitative techniques involved observing compliance with recommended safety
procedures. The qualitative techniques involved an assessment of site safety
management documentation and semi structured interviews with site management
regarding site safety procedures. The field work was carried out between November
2003 and October 2004.
The results showed that five sites out of twenty had high standards of safety and
prevented all possible falls from heights. The five best performing sites were
characterised by size of company in that that the largest construction companies were
found to be the best performing. What was also found was that when a site performed
well in terms of safety, it performed well across all safety categories. Evidence
showing that the presence on site of a safety representative improved safety relevant
to other sites was also found. The five best performing sites all had a safety
representative, whilst the remaining 15 sites had a lesser number of safety
representatives. However the overall number of safety representatives was too low to
prove statistical significance,
Interviews with site management regarding safety standards in the construction sector
over the last five years found the following. The majority of site management stated
there has been large improvement in safety. However, interviewees also stated that
there has been no improvement in relation to buildings being any safer to build and
hence no design improvements. Furthermore the clients influence on safety as
required by legislation has not improved and in some cases has lessened.
In terms of extrapolating the results against the literature the following can be stated.
There has been a modest but nevertheless welcome improvement in site safety
behaviour when comparing this research to comparable and previous Irish site safety
research carried out in 2002.

ii
Declaration
I certify that this thesis which I now submit for examination for the award of MPhil is
entirely my own work and has not been taken from the work of others save and to the
extent that such work has been cited and acknowledged within the text of my work.
This thesis was prepared according to the regulations for postgraduate studies of the
the Dublin Institute of Technology and has not been submitted in whole or in part for
an award in any other institute or university.
The Institute has permission to keep, to lend or copy this thesis in whole or in part, on
condition that such use of the material of this dissertation be duly acknowledged.
Signature: (Paul Mc Evoy) Date:
iii
ACKNOWLEDGEMENTS
I wish to acknowledge and thank the following organisations and people for their
assistance and time during the course of this study.
Mr. Victor Hrymak For his supervision, during the course of this study.
Building contractors and
site management.
For giving me the opportunity to measure safety
performance levels on their sites. The success of this
project is largely attributable to the co-operation and
support from the various construction companies and
on the site management teams.
Graduate studies and
research D.I.T
For their assistance and time.
Finally, to my wife, Eilish and to my children Conor, Eoin, and Ellen for their
patience throughout my research.
Thank you.
iv
Table of Contents
Abstract
Preface
Declaration
Preface
Acknowledgements
Preface
Chapter One Introduction
1 Introduction 1
1.1 Aim 1
1.2 Objectives 1
Chapter Two – Literature Review
2. Literature Review 3
2.1 Level of construction related fatalities 3
2.1.1 Introduction 3
2.1.2 Construction fatality rates in the EU 4
2.1.3 Construction related fatalities in Ireland 5
2.1.4 Construction related fatalities in the U.K 9
2.1.5 Falls from Heights 10
2.1.6 Summary 12
2.2 Levels of injuries 13
2.2.1 Level of injuries in Ireland 13
2.2.2 Levels of injury in the EU 17
2.2.3 Levels of injury in construction in the U.K 20
2.3 Safety Management systems for construction site safety 27
2.3.1 Introduction 27
2.3.2 Safe-T-Cert 28
2.3.3 Safe System of Work Plan (SSWP) 28
2.3.4 Quality Management Systems 29
2.4 Interventions to improve safety performance on building sites 31
2.4.1 Introduction 31
Chapter Three – Methodology
3. Methodology 47
3.1 Introduction 47
3.2 Construction site safety observational checklist 49
v
3.3 Construction site documentation checklist and analysis 55
3.4 Construction site management interviews 56
3.5 Limitation of methodology 57
Chapter Four – Results
4 Results 60
4.1 Overall summary of results 60
4.2 Summary of falls from height 61
4.2.1 Scaffolding 63
4.2.2 Ladder access to heights 64
4.2.3 Roof work 67
4.2.4 Mobile elevated work platforms 69
4.2.5 Workplace access 69
4.3 Summary of housekeeping safety compliance 70
4.3.1 Housekeeping 72
4.3.2 Workplace access 74
4.4 Summary of Personal Protective Equipment 76
4.4.1 Personal Protective Equipment 78
4.5 Site Documentation 80
4.6 Site Management summary 81
4.6.1 Site Management 82
4.7 Interviewee‘s background 86
4.7.1 Interviewee‘s questions summary 88
4.7.2 Interviewee‘s questions 89
4.7.3 Interviewee‘s suggestions to improve safety 94
4.8 Factors associated with the 5 best sites 95
Chapter Five – Discussion
5. Discussion 103
5.1 Overall safety performance for the twenty sites visited 103
5.2 Factors associated with the five best sites 106
5.2.1 Eliminating hazards at the design stage 108
5.2.2 Interviewee‘s perception regarding safety compliance in construction
in the last 5 yrs.
110
5.2.3 Consultation with employees 111
5.2.4 Reporting of accidents 112
Chapter Six – Conclusions and recommendations
6 Recommendations and conclusions 113
6.1 Conclusions 113
6.2 Recommendations 115
vi
Appendices
Appendix A Construction site observational checklist 116
Appendix B Site document checklist 121
Appendix C Interviewee interview template 123
Appendix D Site management interviewee template 134
Appendix E Explanation of site observational checklist and
recommended safety practice
143
Chapter Seven References
7.1 References 153
8.1 Bibliograph 162
vii
List of Tables
Table Title Page
Table 1 EU –15 Fatal accidents fatality rate per 100,000 workers 4
Table 2 Fatalities in the construction industry in Ireland (RoI) 1995-2005 5
Table 3 Construction fatality rates in Ireland per 100,000 employed
(1995-2005)
6
Table 4 Contributory factors to construction fatalities in Ireland 1991-2001
SM, HQ, IP
8
Table 5 UK construction fatalities per 100,000 workers 9
Table 6 Total construction & fall from height fatalities in Ireland 1991-
2001
11
Table 7 Results of inspections of European construction campaign 2003 11
Table 8 Injury and illness in construction and all sectors in Ireland 2004 13
Table 9 Injury and illnesses in construction 2003 13
Table 10 Rates of occupational injury and illness per 100,000 workers in
construction
14
Table 11 Incident type resulting in injury in construction 2001-2003 14
Table 12 Most frequent body part injured in construction 2001-2003 15
Table 13 Most frequent injury type sustained in construction 2001-2003 15
Table 14 All injuries with more than 3 days absences reported to the H.S.A 16
Table 15 Days lost through occupational injury and illness in construction
& all sectors 2002-2003
16
Table 16 Labour Force Survey 1992-1997 >3 days lost for construction and
all sectors
17
Table 17 Total days lost in construction in the EU 15 due to injury and ill-
health
17
Table 18 The EU-15 accidents greater than 3 days at work in construction
and all sectors
18
Table 19 The EU-15 + Norway non-fatal accidents per 100,000 workers as
per unit size
18
Table 20 The EU-15 non-fatal incidents rate per 100,000 workers 1994-
2001
19
Table 21 The EU-15 percentage of construction workers feeling that their
health is at risk of injury
19
Table 22 The UK self-reporting work related illnesses for construction 20
Table 23 Comparison of work related illness for those whose current or
most recent job was construction
20
Table 24 The UK workdays lost in construction for 2001-2002 21
Table 25 >3 days absences in construction in UK compared to the EU 21
Table 26 Musculoskeletal disorders in the UK construction sector
2000-2001
21
Table 27 Musculoskeletal disorders affecting bricklayers and masons 22
Table 28 Musculoskeletal diseases by trade 1996-1998 22
Table 29 Respiratory disease by trade 1996-1998 23
Table 30 Skin disease by trade 1996-1998 24
Table 31 New dermatitis cases reported to dermatologists 2000-2002 UK 24
Table 32 The annual rate of new cases of vibration white finger per 100,000
workers
25
Table 33 Cases of Mesothelioma, Asbestosis, and pleural thickening per 26
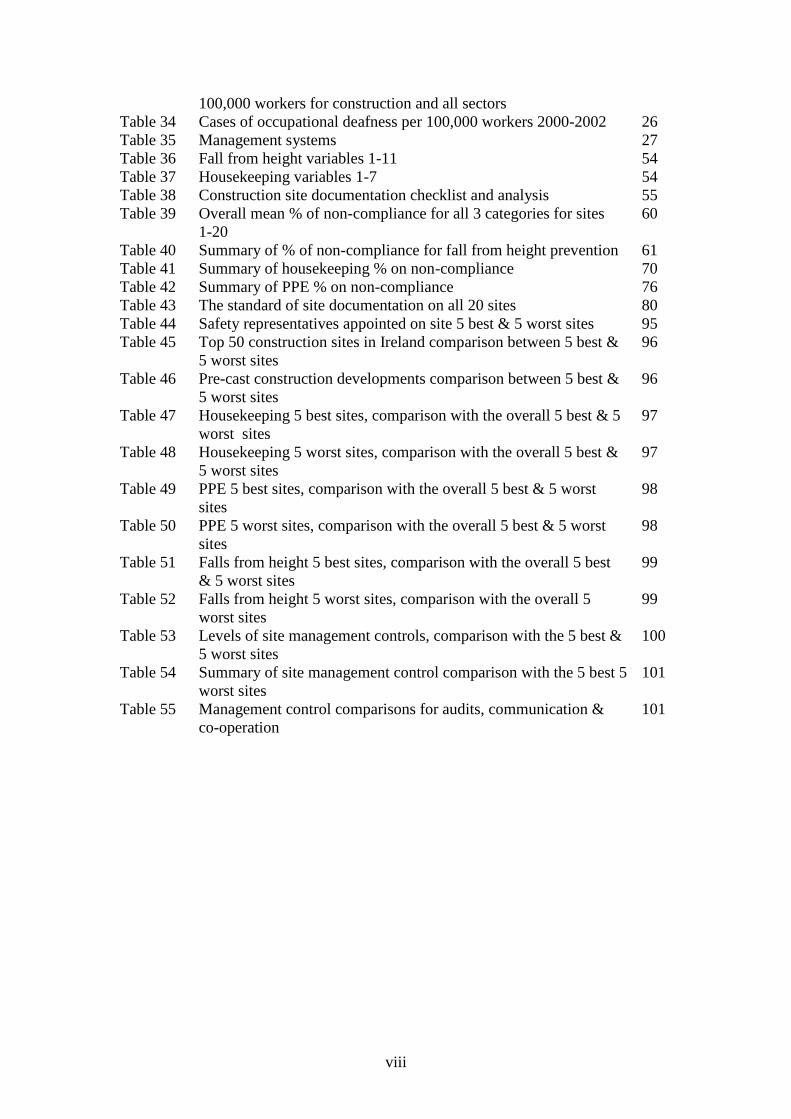
viii
100,000 workers for construction and all sectors
Table 34 Cases of occupational deafness per 100,000 workers 2000-2002 26
Table 35 Management systems 27
Table 36 Fall from height variables 1-11 54
Table 37 Housekeeping variables 1-7 54
Table 38 Construction site documentation checklist and analysis 55
Table 39 Overall mean % of non-compliance for all 3 categories for sites
1-20
60
Table 40 Summary of % of non-compliance for fall from height prevention 61
Table 41 Summary of housekeeping % on non-compliance 70
Table 42 Summary of PPE % on non-compliance 76
Table 43 The standard of site documentation on all 20 sites 80
Table 44 Safety representatives appointed on site 5 best & 5 worst sites 95
Table 45 Top 50 construction sites in Ireland comparison between 5 best &
5 worst sites
96
Table 46 Pre-cast construction developments comparison between 5 best &
5 worst sites
96
Table 47 Housekeeping 5 best sites, comparison with the overall 5 best & 5
worst sites
97
Table 48 Housekeeping 5 worst sites, comparison with the overall 5 best &
5 worst sites
97
Table 49 PPE 5 best sites, comparison with the overall 5 best & 5 worst
sites
98
Table 50 PPE 5 worst sites, comparison with the overall 5 best & 5 worst
sites
98
Table 51 Falls from height 5 best sites, comparison with the overall 5 best
& 5 worst sites
99
Table 52 Falls from height 5 worst sites, comparison with the overall 5
worst sites
99
Table 53 Levels of site management controls, comparison with the 5 best &
5 worst sites
100
Table 54 Summary of site management control comparison with the 5 best 5
worst sites
101
Table 55 Management control comparisons for audits, communication &
co-operation
101
ix
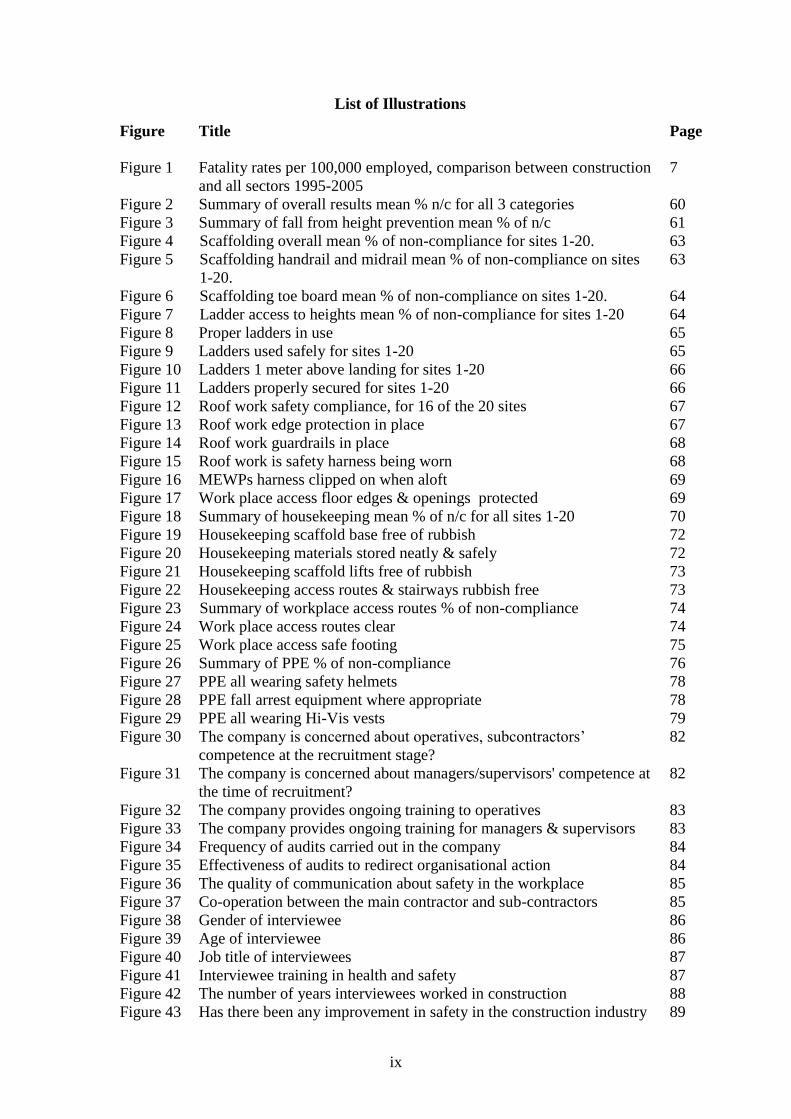
List of Illustrations
Figure Title Page
Figure 1 Fatality rates per 100,000 employed, comparison between construction
and all sectors 1995-2005
7
Figure 2 Summary of overall results mean % n/c for all 3 categories 60
Figure 3 Summary of fall from height prevention mean % of n/c 61
Figure 4 Scaffolding overall mean % of non-compliance for sites 1-20. 63
Figure 5 Scaffolding handrail and midrail mean % of non-compliance on sites
1-20.
63
Figure 6 Scaffolding toe board mean % of non-compliance on sites 1-20. 64
Figure 7 Ladder access to heights mean % of non-compliance for sites 1-20 64
Figure 8 Proper ladders in use 65
Figure 9 Ladders used safely for sites 1-20 65
Figure 10 Ladders 1 meter above landing for sites 1-20 66
Figure 11 Ladders properly secured for sites 1-20 66
Figure 12 Roof work safety compliance, for 16 of the 20 sites 67
Figure 13 Roof work edge protection in place 67
Figure 14 Roof work guardrails in place 68
Figure 15 Roof work is safety harness being worn 68
Figure 16 MEWPs harness clipped on when aloft 69
Figure 17 Work place access floor edges & openings protected 69
Figure 18 Summary of housekeeping mean % of n/c for all sites 1-20 70
Figure 19 Housekeeping scaffold base free of rubbish 72
Figure 20 Housekeeping materials stored neatly & safely 72
Figure 21 Housekeeping scaffold lifts free of rubbish 73
Figure 22 Housekeeping access routes & stairways rubbish free 73
Figure 23 Summary of workplace access routes % of non-compliance 74
Figure 24 Work place access routes clear 74
Figure 25 Work place access safe footing 75
Figure 26 Summary of PPE % of non-compliance 76
Figure 27 PPE all wearing safety helmets 78
Figure 28 PPE fall arrest equipment where appropriate 78
Figure 29 PPE all wearing Hi-Vis vests 79
Figure 30 The company is concerned about operatives, subcontractors‘
competence at the recruitment stage?
82
Figure 31 The company is concerned about managers/supervisors' competence at
the time of recruitment?
82
Figure 32 The company provides ongoing training to operatives 83
Figure 33 The company provides ongoing training for managers & supervisors 83
Figure 34 Frequency of audits carried out in the company 84
Figure 35 Effectiveness of audits to redirect organisational action 84
Figure 36 The quality of communication about safety in the workplace 85
Figure 37 Co-operation between the main contractor and sub-contractors 85
Figure 38 Gender of interviewee 86
Figure 39 Age of interviewee 86
Figure 40 Job title of interviewees 87
Figure 41 Interviewee training in health and safety 87
Figure 42 The number of years interviewees worked in construction 88
Figure 43 Has there been any improvement in safety in the construction industry 89

x
in the last 5yrs?
Figure 44 When did improvements start on building sites? 90
Figure 45 Why have safety standards on building sites improved? 90
Figure 46 Are building designs safer to construct? 91
Figure 47 Acceptance of responsibility for Health & Safety by management? 91
Figure 48 Degree of worker consultation? 92
Figure 49 Client influence? 92
Figure 50 Influence of training? 93
Figure 51 Reporting of accidents? 93
Figure 52 Interviewees suggestions to improve safety 94
1
1.0 Introduction
1.1 Aim
To assess the level of safety performance on twenty construction sites in
Dublin.
1.2 Objectives
To develop and implement a methodology to measure the level of health and
safety performance on 20 construction sites.
To assess factors that predicts good safety performance.
To assess any patterns or trends in safety management on the twenty
construction sites.
To make recommendations to the construction industry based on the results.

2
2.0 Literature Review

3
2.0 Literature review:
2.1 Level of Construction Related Fatalities.
2.1.1 Introduction
Construction is one of Europe‘s largest industries. Unfortunately, it also has the most
problematic occupational safety and health record. (Bilbao Declaration, ―Building in
Safety‖ 22 November 2004), (European agency for Safety and Health at Work, 2004).
Within the EU-15 alone the construction industry employs nearly 13 million workers
Labour Force Survey (2002). In 2002 there were some 1.9 million-construction
enterprises in the EU-15. Some 26 million workers in the EU depend, directly or
indirectly, on the construction industry. The construction industry‘s annual turnover
in the EU is in excess of EUR 900 billion, (European agency for Safety and Health at
Work, 2004).
In the period September to November 2005 in Ireland the numbers employed in the
construction continued to grow to record a new peak of 251,800 (CSO, 2005).
Construction employment in Ireland now accounts for nearly 12% of the total
employment nationally. The gross value of the construction industry in 2003 was
€21Bn, 15% of Gross Domestic product (CIF, 2005).
In the UK the construction industry employs two million people, making it that
country‘s biggest industry (HSE, 2004).
EU statistics on fatalities (see table 1, p4) show that fatal accidents in the construction
industry have generally fallen in the last number of years, nevertheless the fatal
accident rate in construction remains around twice as high as the EU sectoral average.
The causes of accidents and ill health in the construction industry are well known.
Falling from heights, such as scaffolding, is one of the biggest problems. According
to the European Agency for Safety and Health (2004) there is a growing recognition
that standards of occupational safety and health in construction has to be improved
4
throughout the EU. A brief comment on some fatality statistics for the EU, Ireland
and the UK is given below.
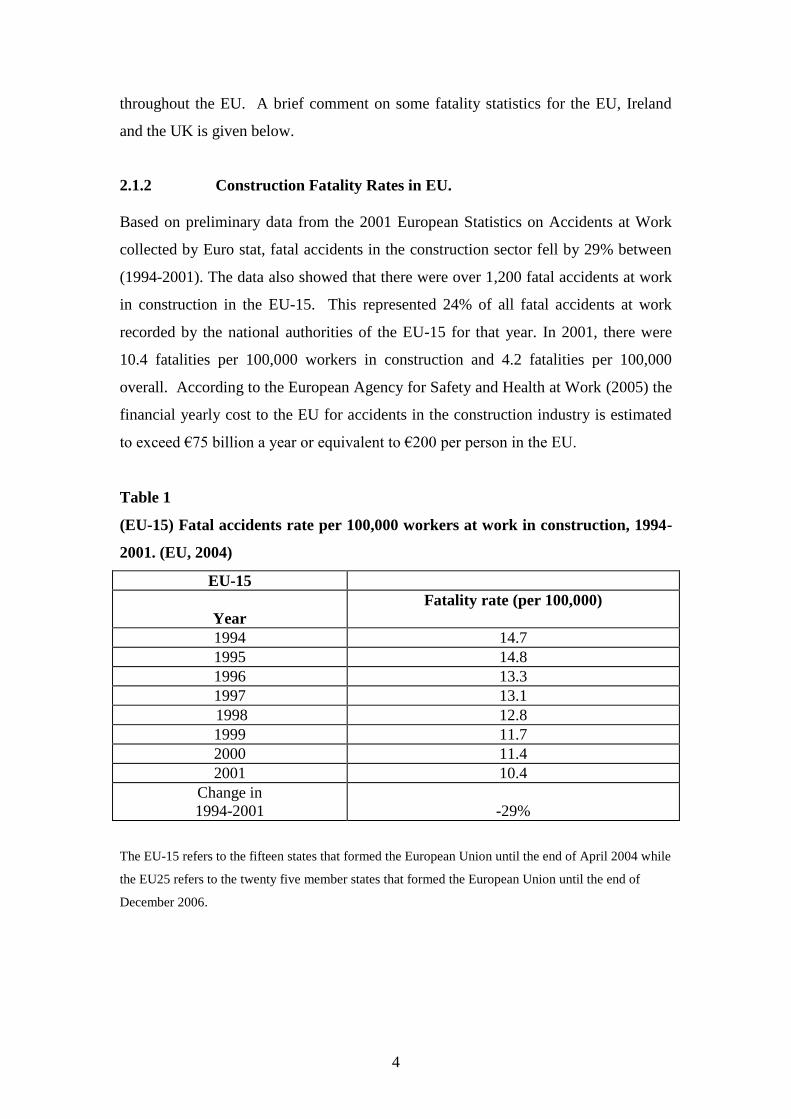
2.1.2 Construction Fatality Rates in EU.
Based on preliminary data from the 2001 European Statistics on Accidents at Work
collected by Euro stat, fatal accidents in the construction sector fell by 29% between
(1994-2001). The data also showed that there were over 1,200 fatal accidents at work
in construction in the EU-15. This represented 24% of all fatal accidents at work
recorded by the national authorities of the EU-15 for that year. In 2001, there were
10.4 fatalities per 100,000 workers in construction and 4.2 fatalities per 100,000
overall. According to the European Agency for Safety and Health at Work (2005) the
financial yearly cost to the EU for accidents in the construction industry is estimated
to exceed €75 billion a year or equivalent to €200 per person in the EU.
Table 1
(EU-15) Fatal accidents rate per 100,000 workers at work in construction, 1994-
2001. (EU, 2004)
EU-15
Year
Fatality rate (per 100,000)
1994 14.7
1995 14.8
1996 13.3
1997 13.1
1998 12.8
1999 11.7
2000 11.4
2001 10.4
Change in
1994-2001
-29%
The EU-15 refers to the fifteen states that formed the European Union until the end of April 2004 while
the EU25 refers to the twenty five member states that formed the European Union until the end of
December 2006.
5
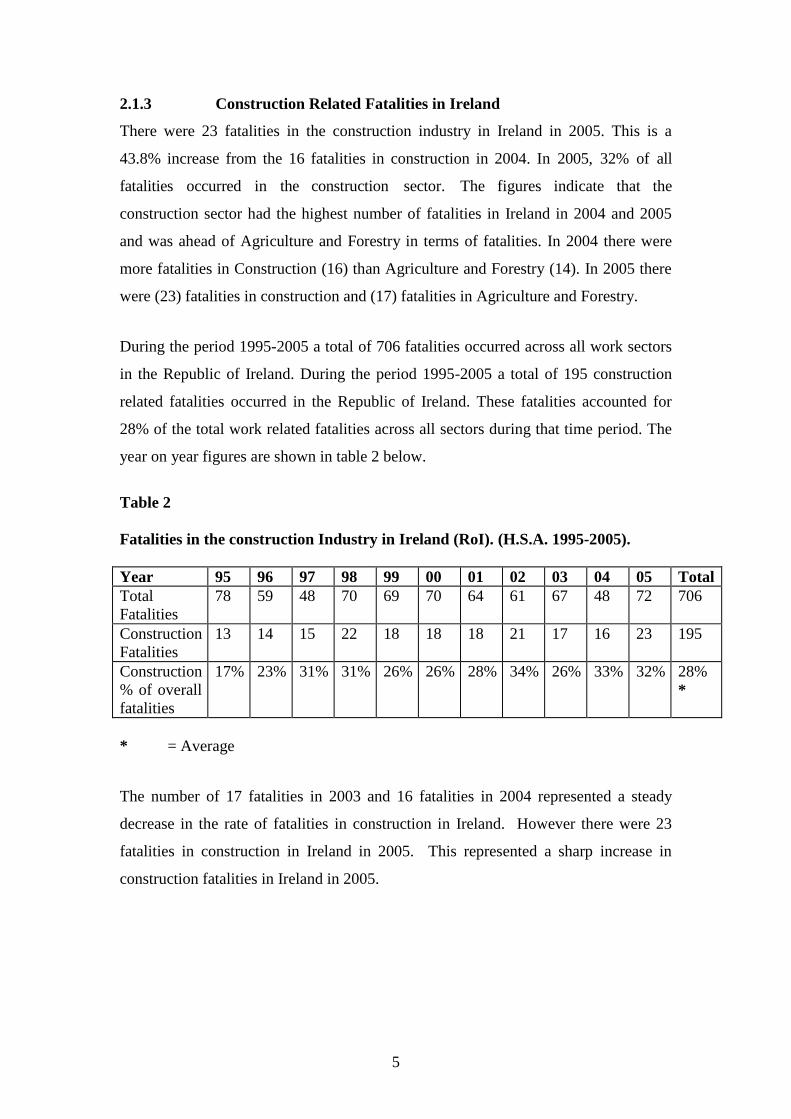
2.1.3 Construction Related Fatalities in Ireland
There were 23 fatalities in the construction industry in Ireland in 2005. This is a
43.8% increase from the 16 fatalities in construction in 2004. In 2005, 32% of all
fatalities occurred in the construction sector. The figures indicate that the
construction sector had the highest number of fatalities in Ireland in 2004 and 2005
and was ahead of Agriculture and Forestry in terms of fatalities. In 2004 there were
more fatalities in Construction (16) than Agriculture and Forestry (14). In 2005 there
were (23) fatalities in construction and (17) fatalities in Agriculture and Forestry.
During the period 1995-2005 a total of 706 fatalities occurred across all work sectors
in the Republic of Ireland. During the period 1995-2005 a total of 195 construction
related fatalities occurred in the Republic of Ireland. These fatalities accounted for
28% of the total work related fatalities across all sectors during that time period. The
year on year figures are shown in table 2 below.
Table 2
Fatalities in the construction Industry in Ireland (RoI). (H.S.A. 1995-2005).
Year 95 96 97 98 99 00 01 02 03 04 05 Total
Total
Fatalities
78 59 48 70 69 70 64 61 67 48 72 706
Construction
Fatalities
13 14 15 22 18 18 18 21 17 16 23 195
Construction
% of overall
fatalities
17% 23% 31% 31% 26% 26% 28% 34% 26% 33% 32% 28%
*
* = Average
The number of 17 fatalities in 2003 and 16 fatalities in 2004 represented a steady
decrease in the rate of fatalities in construction in Ireland. However there were 23
fatalities in construction in Ireland in 2005. This represented a sharp increase in
construction fatalities in Ireland in 2005.
6
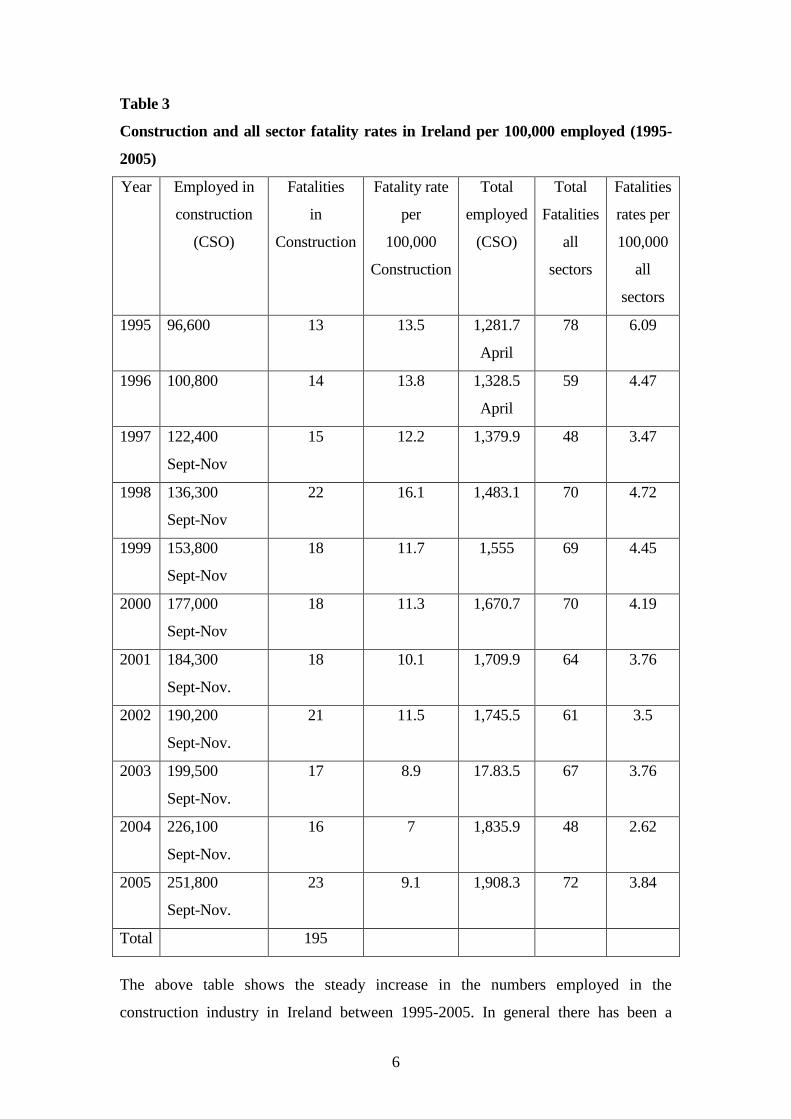
Table 3
Construction and all sector fatality rates in Ireland per 100,000 employed (1995-
2005)
Year Employed in
construction
(CSO)
Fatalities
in
Construction
Fatality rate
per
100,000
Construction
Total
employed
(CSO)
Total
Fatalities
all
sectors
Fatalities
rates per
100,000
all
sectors
1995 96,600 13 13.5 1,281.7
April
78 6.09
1996 100,800 14 13.8 1,328.5
April
59 4.47
1997 122,400
Sept-Nov
15 12.2 1,379.9 48 3.47
1998 136,300
Sept-Nov
22 16.1 1,483.1 70 4.72
1999 153,800
Sept-Nov
18 11.7 1,555 69 4.45
2000 177,000
Sept-Nov
18 11.3 1,670.7 70 4.19
2001 184,300
Sept-Nov.
18 10.1 1,709.9 64 3.76
2002 190,200
Sept-Nov.
21 11.5 1,745.5 61 3.5
2003 199,500
Sept-Nov.
17 8.9 17.83.5 67 3.76
2004 226,100
Sept-Nov.
16 7 1,835.9 48 2.62
2005 251,800
Sept-Nov.
23 9.1 1,908.3 72 3.84
Total 195
The above table shows the steady increase in the numbers employed in the
construction industry in Ireland between 1995-2005. In general there has been a
7
decrease in the numbers of fatalities per 100,000 employed during that period.
However in 1998, 2002 and 2005 there was an increase in the number of fatalities per
100,000 employed when compared to the previous year.
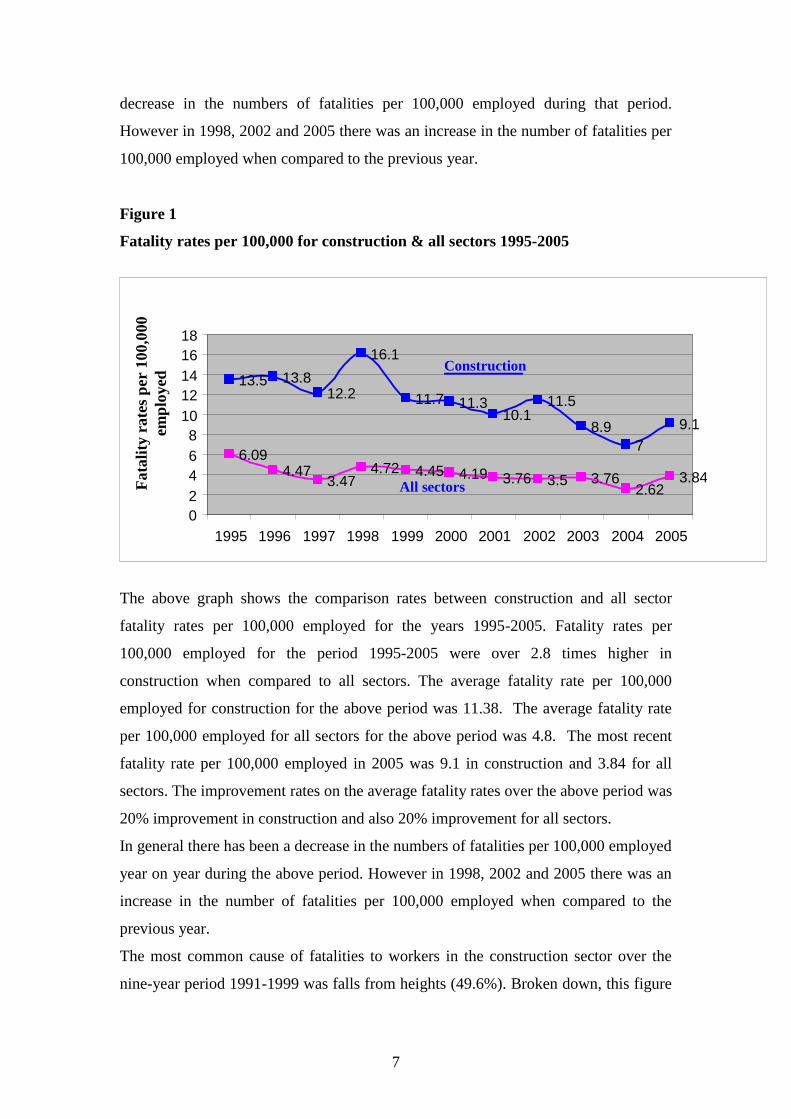
Figure 1
Fatality rates per 100,000 for construction & all sectors 1995-2005
The above graph shows the comparison rates between construction and all sector
fatality rates per 100,000 employed for the years 1995-2005. Fatality rates per
100,000 employed for the period 1995-2005 were over 2.8 times higher in
construction when compared to all sectors. The average fatality rate per 100,000
employed for construction for the above period was 11.38. The average fatality rate
per 100,000 employed for all sectors for the above period was 4.8. The most recent
fatality rate per 100,000 employed in 2005 was 9.1 in construction and 3.84 for all
sectors. The improvement rates on the average fatality rates over the above period was
20% improvement in construction and also 20% improvement for all sectors.
In general there has been a decrease in the numbers of fatalities per 100,000 employed
year on year during the above period. However in 1998, 2002 and 2005 there was an
increase in the number of fatalities per 100,000 employed when compared to the
previous year.
The most common cause of fatalities to workers in the construction sector over the
nine-year period 1991-1999 was falls from heights (49.6%). Broken down, this figure
13.5 13.8 12.2
16.1
11.7 11.3 10.1
11.5
8.9
7
9.1
6.09 4.47
3.47 4.72 4.45 4.19 3.76 3.5 3.76
2.62 3.84
0
2
4
6
8
10
12
14
16
18
1995 1996 1997 1998 1999 2000 2001 2002 2003 2004 2005
Fata
lity
rate
s p
er
100,0
00
emp
loyed
Construction
All sectors

8
reflects falls from or through roofs (17.6%), ladders (12.0%), scaffolds (11.2%),
openings or stairways (4.8%), and others (4.0%). (McDonald & Hrymak, 2002).
Survey information into fatal accidents 1995-1997: in the Construction Industry
(H.S.A. 1998) revealed that the‘ Housing and Apartments‘ sector of the construction
industry had the highest percentage (31%) of fatalities. Employees accounted for 63%
of fatal incidents and 21% of victims had been self-employed.‘ General Labourers‘
constituted 27% of all fatalities. Almost half (46%) of fatalities reported from
(H . S . A . 1997-2002) occurred on sites with between one and five workers employed.
A H.S.A. review for the 10-year period 1992-2002 in the construction sector established
that over one-third of fatalities on construction sites involved employees who were new
to the construction sector i.e. with less than 1yrs experience. A study by the H.S.A. for
the period 2004-2005 found that the rate of foreign national fatalities in the construction
sector was three times higher than the rate for Irish workers (RIA, 2006).
Contribution to fatalities 1991-2001 H S A
The results replicate the 2:1:1 ratio established in the (HSE, 1992) study and the
(H.S.A. 1998) study. The contributions to construction site fatalities in Ireland
1991-2001 were Site Management deficiencies contributed t o 47% of fatalities
while Headquarter and Injured Party issues represented 28% and 24% of fatalities
respectively.
Table 4
Contributory factors to construction fatalities in Ireland 1991-2001. (H.S.A.
2003)
N Headquarters
%
Site Management% Injured Party%
1991-2001 132 28.31 47.35 24.34
1991 5 32.24 30.23 37.54
1992 6 16.44 57.30 26.26
1993 5 40.14 43.83 16.04
1994 5 29.18 43.86 26.96
1995 12 21.24 50.95 27.81
1996 12 23.42 48.35 28.23
1997 15 25.83 43.90 30.27
1998 15 27.44 41.96 30.59
1999 13 37.02 49.14 13.84
2000 22 33.84 45.92 20.24
2001 22 25.89 54.02 20.10
9
Previous research on construction fatalities revealed that supervisors were not
appointed on 45% of sites where fatalities occurred between 1991 and 2001 (H.S.A.
2003).
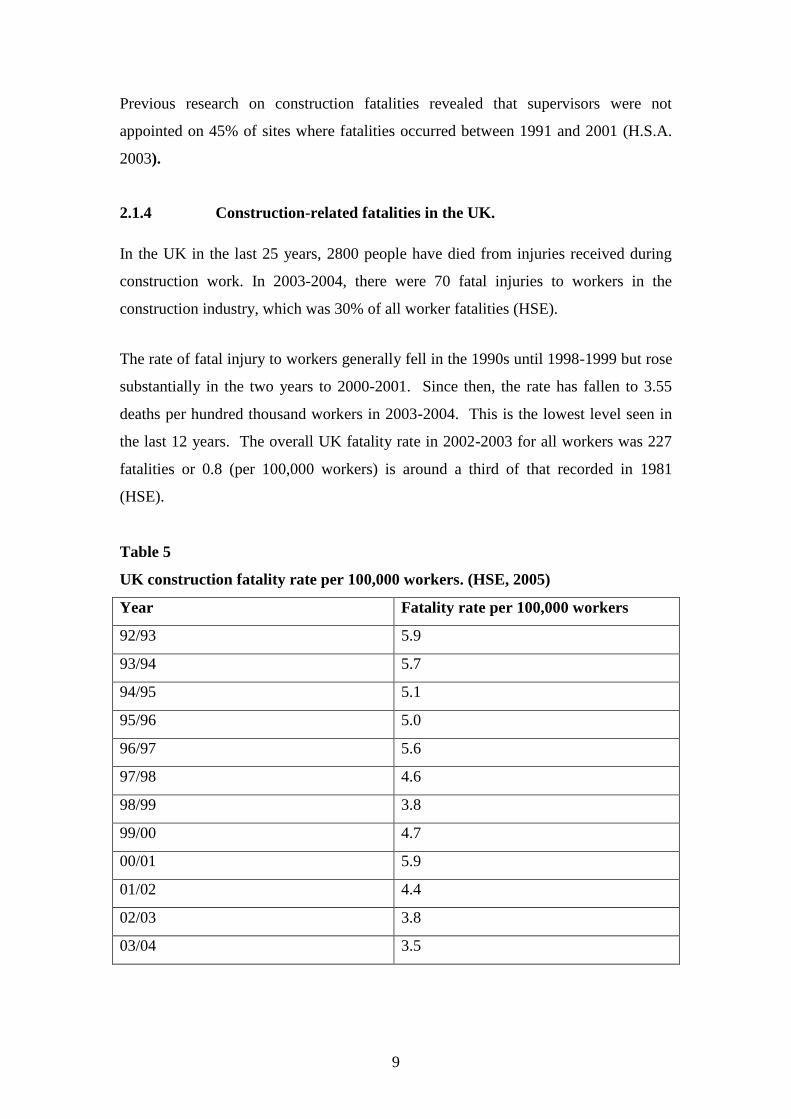
2.1.4 Construction-related fatalities in the UK.
In the UK in the last 25 years, 2800 people have died from injuries received during
construction work. In 2003-2004, there were 70 fatal injuries to workers in the
construction industry, which was 30% of all worker fatalities (HSE).
The rate of fatal injury to workers generally fell in the 1990s until 1998-1999 but rose
substantially in the two years to 2000-2001. Since then, the rate has fallen to 3.55
deaths per hundred thousand workers in 2003-2004. This is the lowest level seen in
the last 12 years. The overall UK fatality rate in 2002-2003 for all workers was 227
fatalities or 0.8 (per 100,000 workers) is around a third of that recorded in 1981
(HSE).
Table 5
UK construction fatality rate per 100,000 workers. (HSE, 2005)
Year Fatality rate per 100,000 workers
92/93 5.9
93/94 5.7
94/95 5.1
95/96 5.0
96/97 5.6
97/98 4.6
98/99 3.8
99/00 4.7
00/01 5.9
01/02 4.4
02/03 3.8
03/04 3.5

10
A report commissioned by the HSE, Brabazon et al. (2000) looked at the rate of
fatalities between 1993 and 1998 in the construction industry. The report showed the
scaffolding trades, roofing trades, and steel erectors as the highest risk trades for
fatalities in the construction industry.
The incidents of life threatening respiratory diseases in the construction industry for
the period between 1996 and 1999 are estimated to be about 200 to 300 per annum.
When compared to the total number of fatal injuries due to accidents in construction
industry over the same time period (236) and allied to the probable under reporting of
occupational ill health, the number of fatalities in the construction industry due to ill
health probably exceeds those due to injury (Brabazon et al, 2000).
Davies & Tomasin (1996) reported that 70-80% of all fatalities in the UK each year is
attributed to falls. Falls from one level to another, falls on the same level and plant
machinery and structures falling and striking, crushing or burying people were
accounted for that percentage. On the other hand, when considering only the category
―falls of people,‖ 52% out of the 681 construction-related deaths between
1981 and 1985 were in this category (McDonald & Hrymak et al, 2002).
2.1.5 Falls from Heights.
The HSE (2002) discussion document notes that the types of incidents that lead to
injuries and fatalities in the construction industry are foreseeable and preventable.
―We have known for years how to prevent them, but they often happen in the same
old ways‖. This is borne out by the finding that ‗falls from heights‘ consistently
account for almost 50% of construction fatalities. In the UK, fatalities among
scaffolders, roofers and steel erectors were all above the HSE‘s intolerable risk
criterion for the period 1993-1998 ( Brabazon et al., 2000). A third of all reported
fall from height incidents involve ladders and stepladders, on average this accounts for
14 deaths and 1200 major injuries to workers each year, HSE (Books, 2005).
11
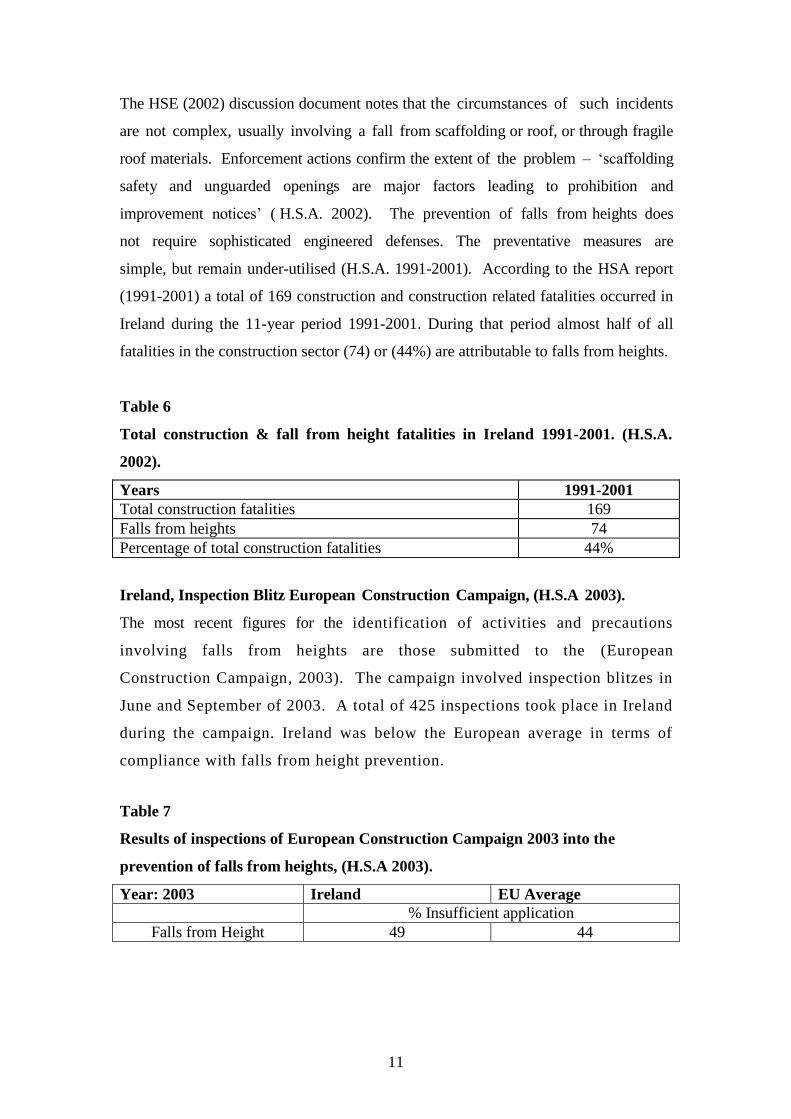
The HSE (2002) discussion document notes that the circumstances of such incidents
are not complex, usually involving a fall from scaffolding or roof, or through fragile
roof materials. Enforcement actions confirm the extent of the problem – ‗scaffolding
safety and unguarded openings are major factors leading to prohibition and
improvement notices‘ ( H.S.A. 2002). The prevention of falls from heights does
not require sophisticated engineered defenses. The preventative measures are
simple, but remain under-utilised (H.S.A. 1991-2001). According to the HSA report
(1991-2001) a total of 169 construction and construction related fatalities occurred in
Ireland during the 11-year period 1991-2001. During that period almost half of all
fatalities in the construction sector (74) or (44%) are attributable to falls from heights.
Table 6
Total construction & fall from height fatalities in Ireland 1991-2001. (H.S.A.
2002).
Years 1991-2001
Total construction fatalities 169
Falls from heights 74
Percentage of total construction fatalities 44%
Ireland, Inspection Blitz European Construction Campaign, (H.S.A 2003).
The most recent figures for the identification of activities and precautions
involving falls from heights are those submitted to the (European
Construction Campaign, 2003). The campaign involved inspection blitzes in
June and September of 2003. A total of 425 inspections took place in Ireland
during the campaign. Ireland was below the European average in terms of
compliance with falls from height prevention.
Table 7
Results of inspections of European Construction Campaign 2003 into the
prevention of falls from heights, (H.S.A 2003).
Year: 2003 Ireland EU Average
% Insufficient application
Falls from Height 49 44
12
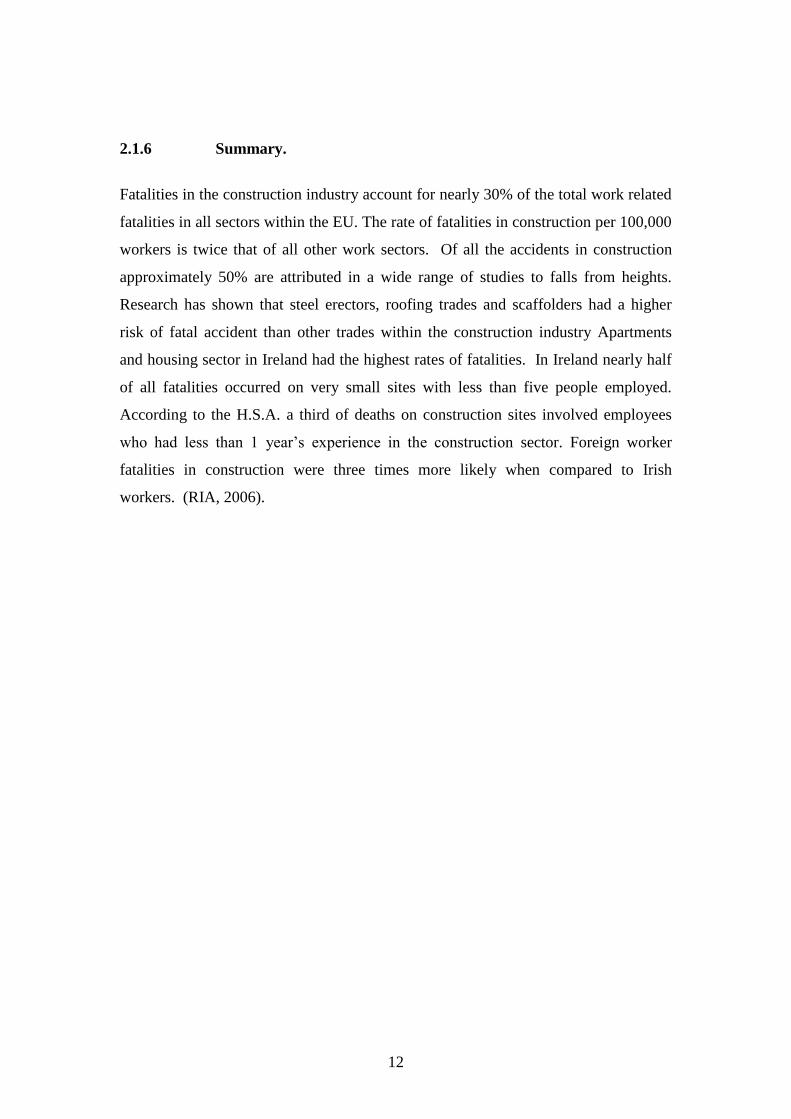
2.1.6 Summary.
Fatalities in the construction industry account for nearly 30% of the total work related
fatalities in all sectors within the EU. The rate of fatalities in construction per 100,000
workers is twice that of all other work sectors. Of all the accidents in construction
approximately 50% are attributed in a wide range of studies to falls from heights.
Research has shown that steel erectors, roofing trades and scaffolders had a higher
risk of fatal accident than other trades within the construction industry Apartments
and housing sector in Ireland had the highest rates of fatalities. In Ireland nearly half
of all fatalities occurred on very small sites with less than five people employed.
According to the H.S.A. a third of deaths on construction sites involved employees
who had less than 1 year‘s experience in the construction sector. Foreign worker
fatalities in construction were three times more likely when compared to Irish
workers. (RIA, 2006).

13
2.2 Level of injuries.
2.2.1 Level of injuries in Ireland
Figures released by the Central Statistics Office show that 1,374,813 workdays were
lost in 2004 due to occupational injury and work related illness. According to the
Health and Safety Review (2005) 100 times more days were lost in 2004 due to
occupational injuries and illness than industrial disputes. The number of days lost due
to injuries showed a dramatic rise of 172,000 from 2003, while the number of days
lost due to illness fell by 84,000.
Construction. 2004.
The occupational injury and illness figures, which are based on the CSO‘s National
Quarterly Household Survey show that 11,400 construction workers suffered injures
and 6,300 contracted illness. The construction injury rate per 100,000 was nearly
twice the all sector average.
Table 8
Injury & illness in construction and all sectors in (HSR, 2004).
Injury Rate per
100,000
Illness Rate per 100,000
Construction 11,400 5600 6,500 3200
All Sectors. 54,000 3000 46,300 2500
Table 9
Number of persons incurring occupational injury and illness in the construction
sector 2003 H.S.A (NQHS, 2003).
Number of Persons Injured Number of Illness cases
Total +3 days Total
7,500 4,200 4500

14
Table 10
Rate of Occupational Injury and illness per 100,000 workers in construction and
all sectors 2003 H.S.A. (NQHS, 2003).
Rate of persons injured per 100,000 Illness rate per 100,000
Total rate Rate +3 days Total
Construction 3980 2230 2390
All sectors Average. 2430 1180 2150
According to the H.S.A. annual reports 2001-2003 the most common type of incident
resulting in injury was incurred while handling, lifting or carrying. This type of
incident accounted for nearly a quarter of all injuries sustained. The top five incidents
accounted for on average over 80% of all injuries over the three-year period.
Table 11
Incident type resulting in injury in construction over the 3 year period (H.S.A.
2001-2003).
Incident Type Construction Percentage Incident type
2003 2002 2001 Average
Incident rate
Injury while handling, lifting or carrying 24.6% 22.5% 27.3% 24.13%
Slips, trips & falls on the same level 26.8% 19.1% 22.3% 22.73%
Fall from height 13.6% 15.5% 16.3% 15.13%
Injury by falling objects 9% 9.2% 10.8% 9.66%
Injury by hand tools 9.4% 9.6% 8.1% 9.03%
Total Percentage 83.4% 75.9% 84.8% 80.68%
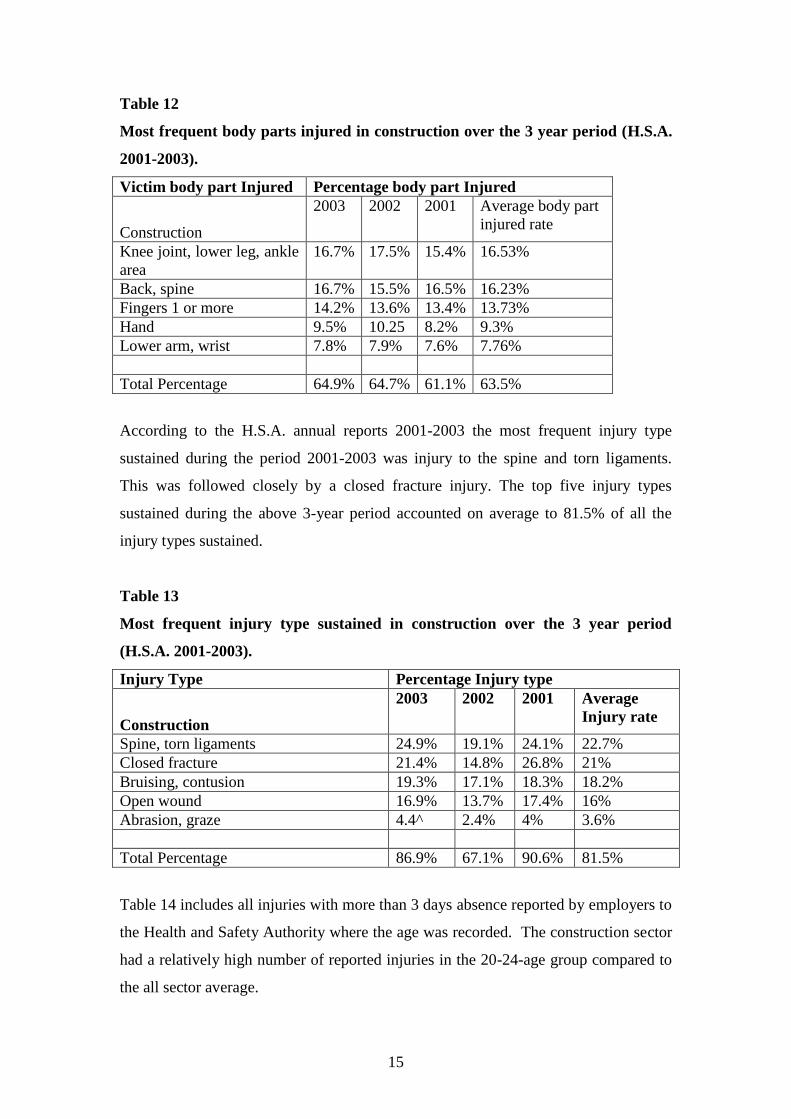
According to the H.S.A. annual reports 2001-2003 the most frequent victim body part
injured was the knee joint, lower leg and ankle. This was followed closely by back
and spinal injury.
15
Table 12
Most frequent body parts injured in construction over the 3 year period (H.S.A.
2001-2003).
Victim body part Injured Percentage body part Injured
Construction
2003 2002 2001 Average body part
injured rate
Knee joint, lower leg, ankle
area
16.7% 17.5% 15.4% 16.53%
Back, spine 16.7% 15.5% 16.5% 16.23%
Fingers 1 or more 14.2% 13.6% 13.4% 13.73%
Hand 9.5% 10.25 8.2% 9.3%
Lower arm, wrist 7.8% 7.9% 7.6% 7.76%
Total Percentage 64.9% 64.7% 61.1% 63.5%
According to the H.S.A. annual reports 2001-2003 the most frequent injury type
sustained during the period 2001-2003 was injury to the spine and torn ligaments.
This was followed closely by a closed fracture injury. The top five injury types
sustained during the above 3-year period accounted on average to 81.5% of all the
injury types sustained.
Table 13
Most frequent injury type sustained in construction over the 3 year period
(H.S.A. 2001-2003).
Injury Type Percentage Injury type
Construction
2003 2002 2001 Average
Injury rate
Spine, torn ligaments 24.9% 19.1% 24.1% 22.7%
Closed fracture 21.4% 14.8% 26.8% 21%
Bruising, contusion 19.3% 17.1% 18.3% 18.2%
Open wound 16.9% 13.7% 17.4% 16%
Abrasion, graze 4.4^ 2.4% 4% 3.6%
Total Percentage 86.9% 67.1% 90.6% 81.5%
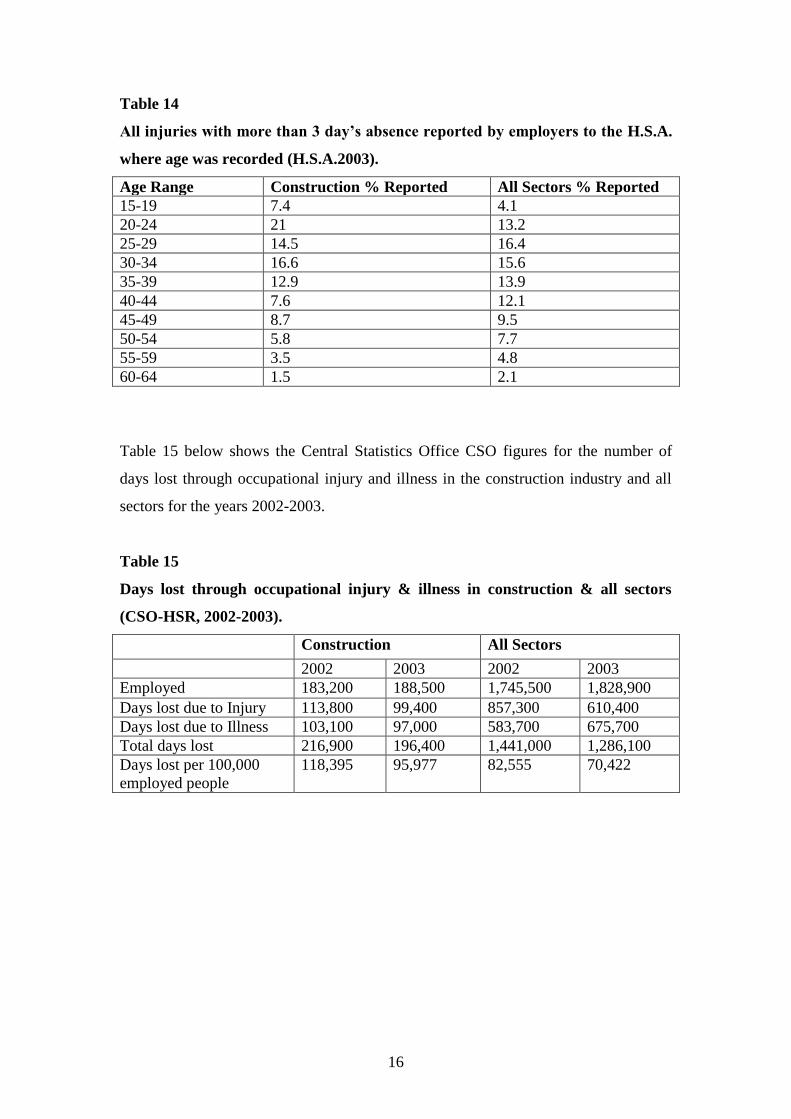
Table 14 includes all injuries with more than 3 days absence reported by employers to
the Health and Safety Authority where the age was recorded. The construction sector
had a relatively high number of reported injuries in the 20-24-age group compared to
the all sector average.
16
Table 14
All injuries with more than 3 day’s absence reported by employers to the H.S.A.
where age was recorded (H.S.A.2003).
Age Range Construction % Reported All Sectors % Reported
15-19 7.4 4.1
20-24 21 13.2
25-29 14.5 16.4
30-34 16.6 15.6
35-39 12.9 13.9
40-44 7.6 12.1
45-49 8.7 9.5
50-54 5.8 7.7
55-59 3.5 4.8
60-64 1.5 2.1
Table 15 below shows the Central Statistics Office CSO figures for the number of
days lost through occupational injury and illness in the construction industry and all
sectors for the years 2002-2003.
Table 15
Days lost through occupational injury & illness in construction & all sectors
(CSO-HSR, 2002-2003).
Construction All Sectors
2002 2003 2002 2003
Employed 183,200 188,500 1,745,500 1,828,900
Days lost due to Injury 113,800 99,400 857,300 610,400
Days lost due to Illness 103,100 97,000 583,700 675,700
Total days lost 216,900 196,400 1,441,000 1,286,100
Days lost per 100,000
employed people
118,395 95,977 82,555 70,422

17
Table 16 shows the results of the Labour Force Survey for the years from 1992 to
1997. It also compares the occupational injury rate per 100,000 at work in
construction against the all sector average.
Table 16
Labour Force Survey 1992-1997 for 3 days injury rate per 100,000 in
construction and all sectors
Construction Sector 1992 1993 1994 1995 1996 1997
Employment 74,000 70,800 77,900 82,800 86,700 96,700
Occupational Injuries for
persons at work (3 days lost)
1,200 1,300 1,200 1,500 1,500 1,900
Occupational Injury
(Rate per 100,000 at work)
Construction 1,622 1,836 1,540 1,812 1,730 1,965
All sector average. 961 1,207 1,162 1,082 1,272 1,240
2.2.2 Levels of injury in the EU.
According to the European Survey of Working Conditions (2000) construction
workers report an average of 7.3 days of illness absence from work during the year.
Of the total days of illness absence from work 32% are due to accidents at work, 28%
to non-accidental work-related health problems and 40% to non-work related health
problems. If applied to the 12.7 million workforces in construction, these figures
mean that 30 million days are lost each year because of accidents at work and 26
million days are lost due to other work-related health problems. The EU 15 refers to
the fifteen countries that formed the European Union until the end of April 2004 while
EU 25 refers to the current 25 member states.
Table 17
Total days lost in construction in EU-15 due to injury and ill health. (European
Survey of Working Conditions, 2000).
EU-15 Construction (2000)
Employed 12.7 million
Injury 30 million
Ill health 26 million
Total days lost 56 million
18
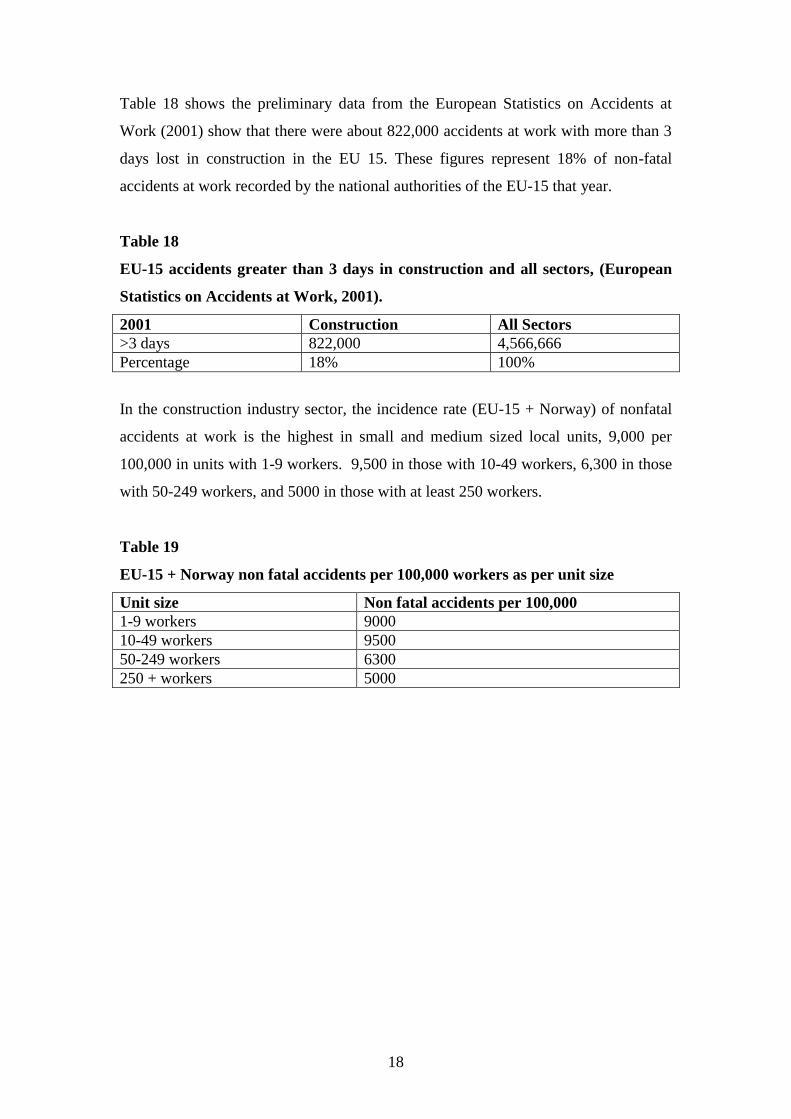
Table 18 shows the preliminary data from the European Statistics on Accidents at
Work (2001) show that there were about 822,000 accidents at work with more than 3
days lost in construction in the EU 15. These figures represent 18% of non-fatal
accidents at work recorded by the national authorities of the EU-15 that year.
Table 18
EU-15 accidents greater than 3 days in construction and all sectors, (European
Statistics on Accidents at Work, 2001).
2001 Construction All Sectors
>3 days 822,000 4,566,666
Percentage 18% 100%
In the construction industry sector, the incidence rate (EU-15 + Norway) of nonfatal
accidents at work is the highest in small and medium sized local units, 9,000 per
100,000 in units with 1-9 workers. 9,500 in those with 10-49 workers, 6,300 in those
with 50-249 workers, and 5000 in those with at least 250 workers.
Table 19
EU-15 + Norway non fatal accidents per 100,000 workers as per unit size
Unit size Non fatal accidents per 100,000
1-9 workers 9000
10-49 workers 9500
50-249 workers 6300
250 + workers 5000

19
Table 20 shows the non-fatal incident rate per 100,000 construction workers within
the EU-15 between the years 1994-2001. During the period 1994-2001 there was a
20% reduction in the non-fatal incidence rate per 100,000 construction workers.
Table 20
The EU-15 non-fatal incidence rate per 100,000 workers and percentage change
between (1994-2001), (EU, 2004).
EU-15 Construction
Per 100,000 workers
1994 9014
1995 9080
1996 8023
1997 7963
1998 8008
1999 7809
2000 7548
2001 7213
Change in
1994-2001
-20%
According to the European Survey of Working Conditions (2000) construction has the
highest prevalence of workers feeling that their health is at risk of injury because of
work (19%) as compared to (7%) of all workers feeling so.
Table 21
The EU-15 construction and all sectors percentage of prevalence of workers
feeling that their health is at risk of injury because of their work, (European
Survey of Working Conditions, 2000).
2000 EU-15 Construction All Sectors
Feeling their health is at risk of
injury on account of their work
19% 7%
20
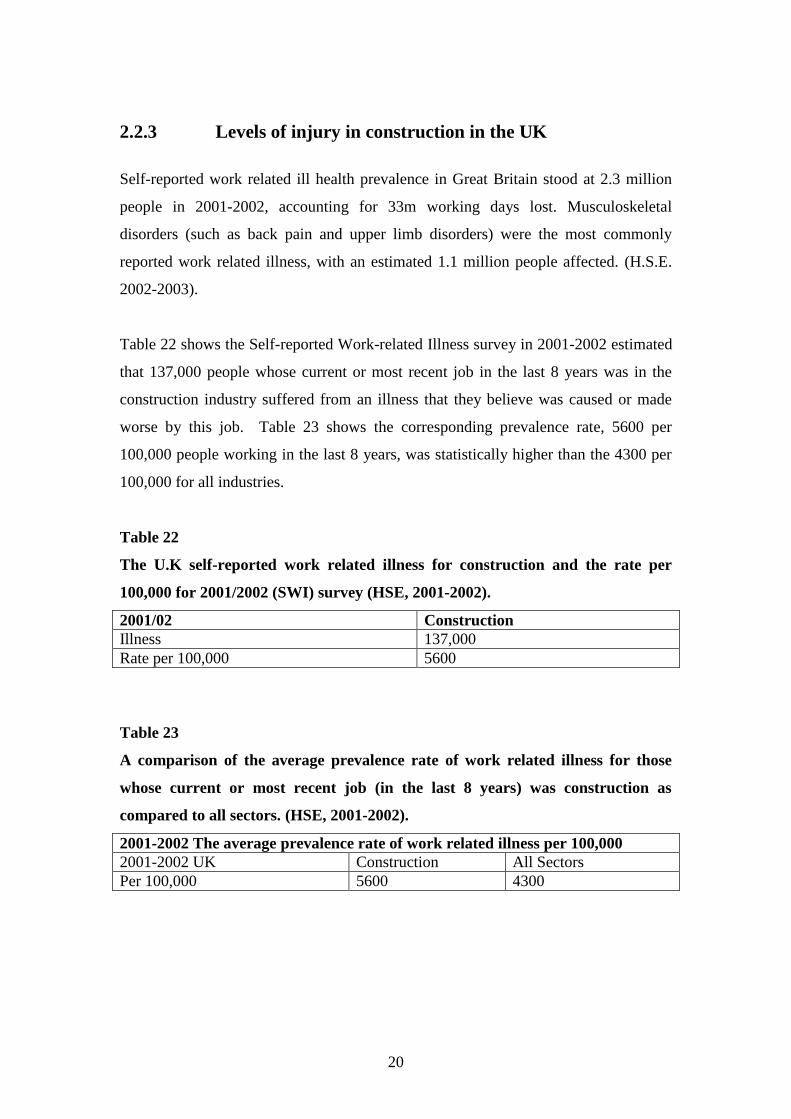
2.2.3 Levels of injury in construction in the UK
Self-reported work related ill health prevalence in Great Britain stood at 2.3 million
people in 2001-2002, accounting for 33m working days lost. Musculoskeletal
disorders (such as back pain and upper limb disorders) were the most commonly
reported work related illness, with an estimated 1.1 million people affected. (H.S.E.
2002-2003).
Table 22 shows the Self-reported Work-related Illness survey in 2001-2002 estimated
that 137,000 people whose current or most recent job in the last 8 years was in the
construction industry suffered from an illness that they believe was caused or made
worse by this job. Table 23 shows the corresponding prevalence rate, 5600 per
100,000 people working in the last 8 years, was statistically higher than the 4300 per
100,000 for all industries.
Table 22
The U.K self-reported work related illness for construction and the rate per
100,000 for 2001/2002 (SWI) survey (HSE, 2001-2002).
2001/02 Construction
Illness 137,000
Rate per 100,000 5600
Table 23
A comparison of the average prevalence rate of work related illness for those
whose current or most recent job (in the last 8 years) was construction as
compared to all sectors. (HSE, 2001-2002).
2001-2002 The average prevalence rate of work related illness per 100,000
2001-2002 UK Construction All Sectors
Per 100,000 5600 4300
21
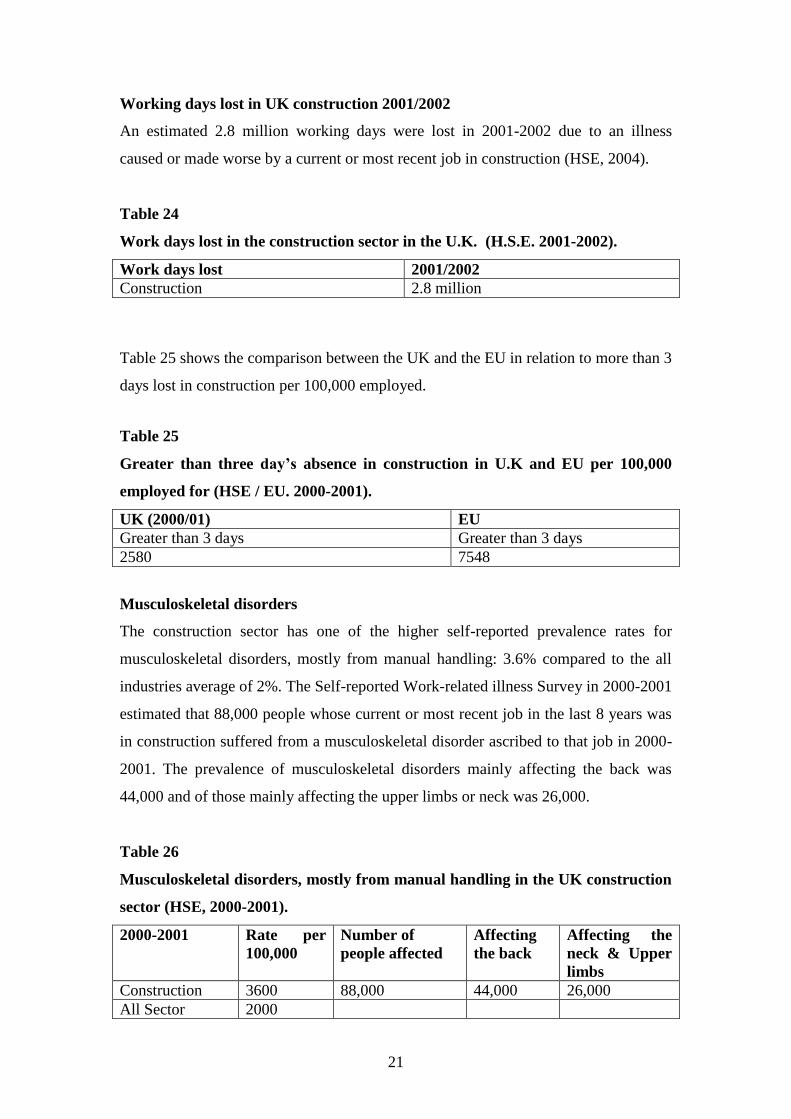
Working days lost in UK construction 2001/2002
An estimated 2.8 million working days were lost in 2001-2002 due to an illness
caused or made worse by a current or most recent job in construction (HSE, 2004).
Table 24
Work days lost in the construction sector in the U.K. (H.S.E. 2001-2002).
Work days lost 2001/2002
Construction 2.8 million
Table 25 shows the comparison between the UK and the EU in relation to more than 3
days lost in construction per 100,000 employed.
Table 25
Greater than three day’s absence in construction in U.K and EU per 100,000
employed for (HSE / EU. 2000-2001).
UK (2000/01) EU
Greater than 3 days Greater than 3 days
2580 7548
Musculoskeletal disorders
The construction sector has one of the higher self-reported prevalence rates for
musculoskeletal disorders, mostly from manual handling: 3.6% compared to the all
industries average of 2%. The Self-reported Work-related illness Survey in 2000-2001
estimated that 88,000 people whose current or most recent job in the last 8 years was
in construction suffered from a musculoskeletal disorder ascribed to that job in 2000-
2001. The prevalence of musculoskeletal disorders mainly affecting the back was
44,000 and of those mainly affecting the upper limbs or neck was 26,000.
Table 26
Musculoskeletal disorders, mostly from manual handling in the UK construction
sector (HSE, 2000-2001).
2000-2001 Rate per
100,000
Number of
people affected
Affecting
the back
Affecting the
neck & Upper
limbs
Construction 3600 88,000 44,000 26,000
All Sector 2000

22
The medical surveillance scheme in the Health and Occupational Reporting network
THOR (2000-2002) show that bricklayers & masons with an estimated incidence rate
of work related musculoskeletal disorders of 39 cases per 100,000 workers per year,
compared with a figure of 9 cases per 100,000 workers for all occupations. For upper
limb disorders, bricklayers & masons had and estimated incidence rate of 25 cases per
100,000 workers per year, compared with 7 per 100,000 for all occupations.
Table 27
Musculoskeletal and upper limb disorders affecting bricklayers/masons and all
sectors per 100,000. (HSE, 2000-2002).
(THOR) 2000-2002 Per 100,000 workers
Per 100,000 Musculoskeletal disorders Upper limb disorders
Bricklayers & Masons 39 25
All Sectors 9 7
Musculoskeletal Disease.
Table 28 presents the number of reported cases of musculoskeletal disease by trade
and can be summarised as follows. Floorers had very high rates of musculoskeletal
disease at 2,956 per 100,000 workers. There is also a high prevalence of
musculoskeletal disease among Bricklayers / Masons & Painters / decorators.
Carpenters / Joiners and Plumbers are also affected by musculoskeletal disease.
Table 28
Reported cases of Musculoskeletal disease by trade per 100,000 workers (1996-
1998) (Brabazon et al, 2000).
Trade Per 100,000 workers
Floorers 2,956
Bricklayer / Mason 696
Painter & Decorator 578
Carpenter / Joiner 258
Plumber 233
23
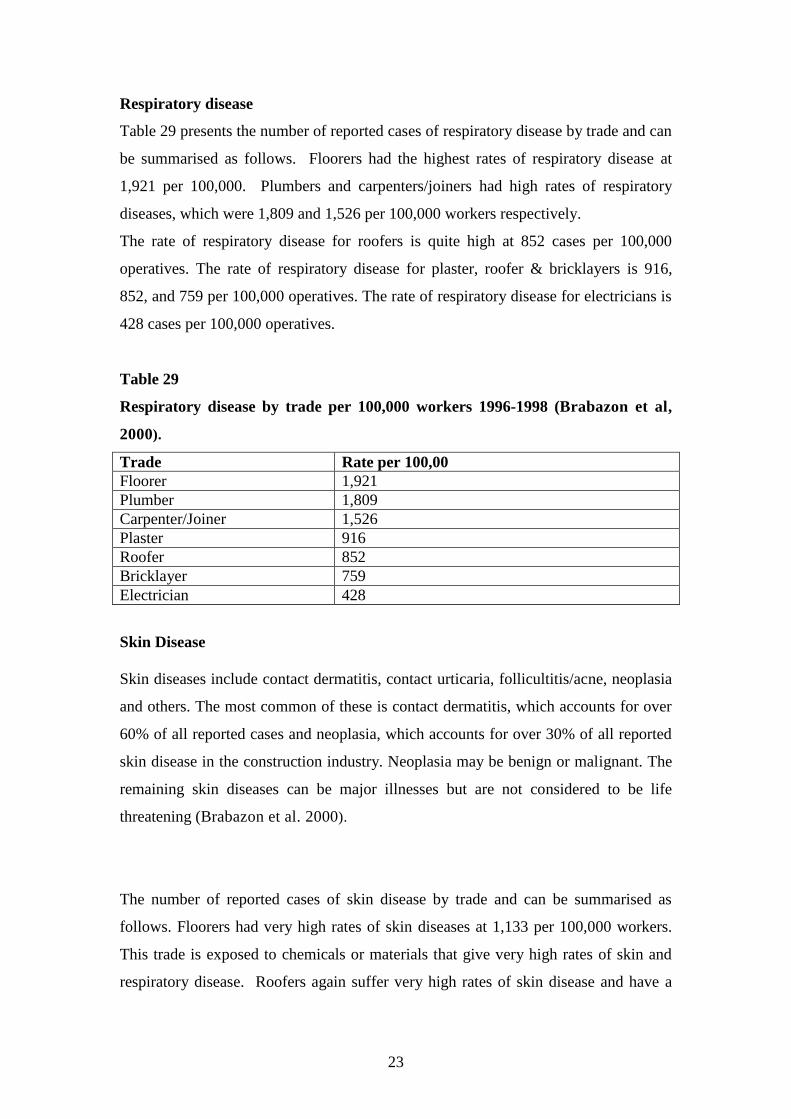
Respiratory disease
Table 29 presents the number of reported cases of respiratory disease by trade and can
be summarised as follows. Floorers had the highest rates of respiratory disease at
1,921 per 100,000. Plumbers and carpenters/joiners had high rates of respiratory
diseases, which were 1,809 and 1,526 per 100,000 workers respectively.
The rate of respiratory disease for roofers is quite high at 852 cases per 100,000
operatives. The rate of respiratory disease for plaster, roofer & bricklayers is 916,
852, and 759 per 100,000 operatives. The rate of respiratory disease for electricians is
428 cases per 100,000 operatives.
Table 29
Respiratory disease by trade per 100,000 workers 1996-1998 (Brabazon et al,
2000).
Trade Rate per 100,00
Floorer 1,921
Plumber 1,809
Carpenter/Joiner 1,526
Plaster 916
Roofer 852
Bricklayer 759
Electrician 428
Skin Disease
Skin diseases include contact dermatitis, contact urticaria, follicultitis/acne, neoplasia
and others. The most common of these is contact dermatitis, which accounts for over
60% of all reported cases and neoplasia, which accounts for over 30% of all reported
skin disease in the construction industry. Neoplasia may be benign or malignant. The
remaining skin diseases can be major illnesses but are not considered to be life
threatening (Brabazon et al. 2000).
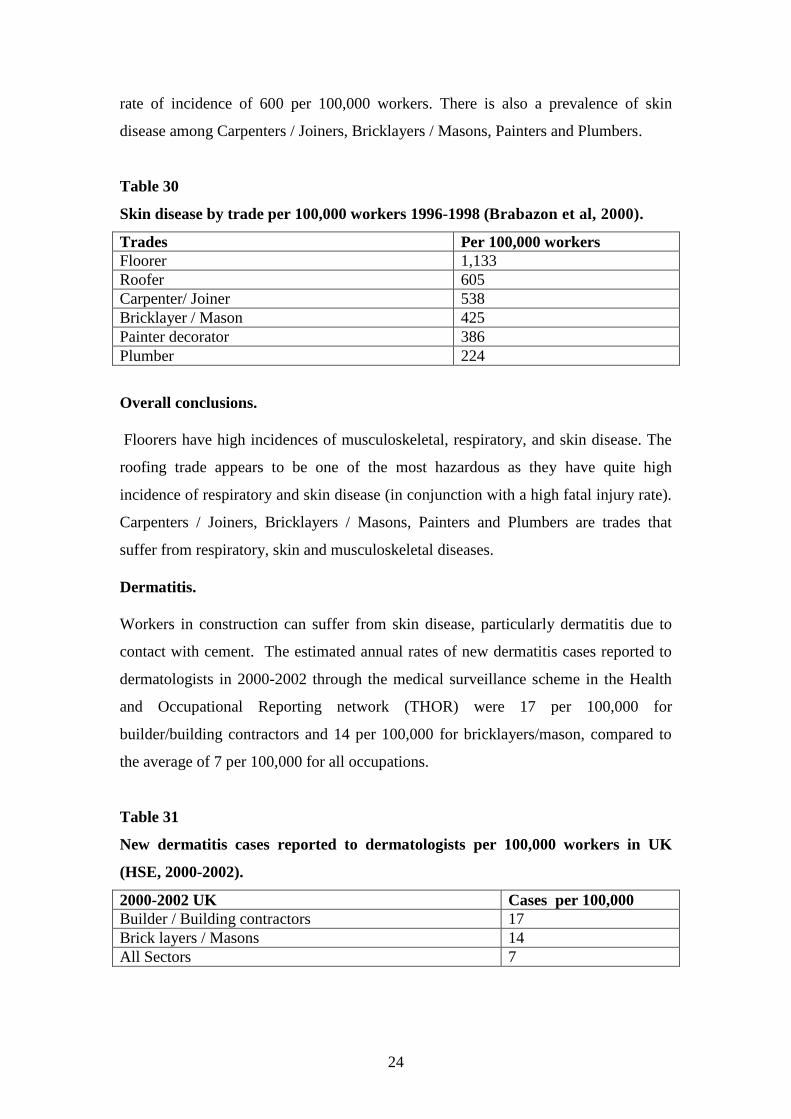
The number of reported cases of skin disease by trade and can be summarised as
follows. Floorers had very high rates of skin diseases at 1,133 per 100,000 workers.
This trade is exposed to chemicals or materials that give very high rates of skin and
respiratory disease. Roofers again suffer very high rates of skin disease and have a
24
rate of incidence of 600 per 100,000 workers. There is also a prevalence of skin
disease among Carpenters / Joiners, Bricklayers / Masons, Painters and Plumbers.
Table 30
Skin disease by trade per 100,000 workers 1996-1998 (Brabazon et al, 2000).
Trades Per 100,000 workers
Floorer 1,133
Roofer 605
Carpenter/ Joiner 538
Bricklayer / Mason 425
Painter decorator 386
Plumber 224
Overall conclusions.
Floorers have high incidences of musculoskeletal, respiratory, and skin disease. The
roofing trade appears to be one of the most hazardous as they have quite high
incidence of respiratory and skin disease (in conjunction with a high fatal injury rate).
Carpenters / Joiners, Bricklayers / Masons, Painters and Plumbers are trades that
suffer from respiratory, skin and musculoskeletal diseases.
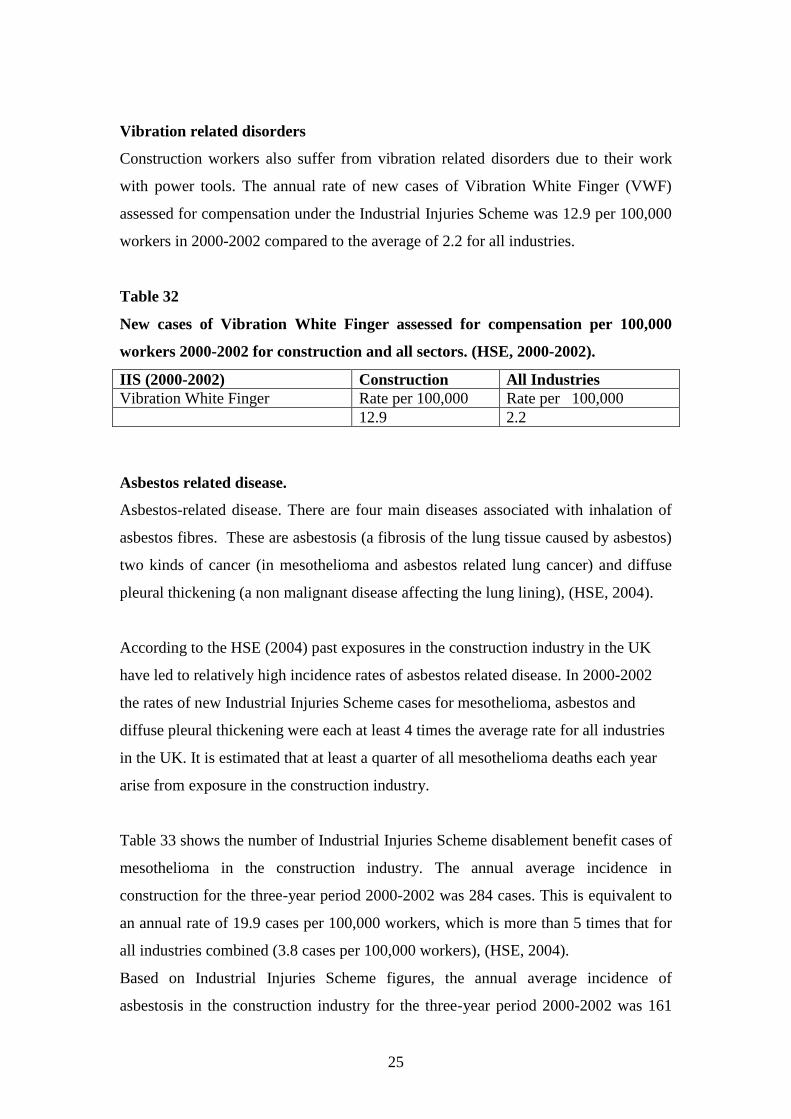
Dermatitis.
Workers in construction can suffer from skin disease, particularly dermatitis due to
contact with cement. The estimated annual rates of new dermatitis cases reported to
dermatologists in 2000-2002 through the medical surveillance scheme in the Health
and Occupational Reporting network (THOR) were 17 per 100,000 for
builder/building contractors and 14 per 100,000 for bricklayers/mason, compared to
the average of 7 per 100,000 for all occupations.
Table 31
New dermatitis cases reported to dermatologists per 100,000 workers in UK
(HSE, 2000-2002).
2000-2002 UK Cases per 100,000
Builder / Building contractors 17
Brick layers / Masons 14
All Sectors 7
25
Vibration related disorders
Construction workers also suffer from vibration related disorders due to their work
with power tools. The annual rate of new cases of Vibration White Finger (VWF)
assessed for compensation under the Industrial Injuries Scheme was 12.9 per 100,000
workers in 2000-2002 compared to the average of 2.2 for all industries.
Table 32
New cases of Vibration White Finger assessed for compensation per 100,000
workers 2000-2002 for construction and all sectors. (HSE, 2000-2002).
IIS (2000-2002) Construction All Industries
Vibration White Finger Rate per 100,000 Rate per 100,000
12.9 2.2
Asbestos related disease.
Asbestos-related disease. There are four main diseases associated with inhalation of
asbestos fibres. These are asbestosis (a fibrosis of the lung tissue caused by asbestos)
two kinds of cancer (in mesothelioma and asbestos related lung cancer) and diffuse
pleural thickening (a non malignant disease affecting the lung lining), (HSE, 2004).
According to the HSE (2004) past exposures in the construction industry in the UK
have led to relatively high incidence rates of asbestos related disease. In 2000-2002
the rates of new Industrial Injuries Scheme cases for mesothelioma, asbestos and
diffuse pleural thickening were each at least 4 times the average rate for all industries
in the UK. It is estimated that at least a quarter of all mesothelioma deaths each year
arise from exposure in the construction industry.
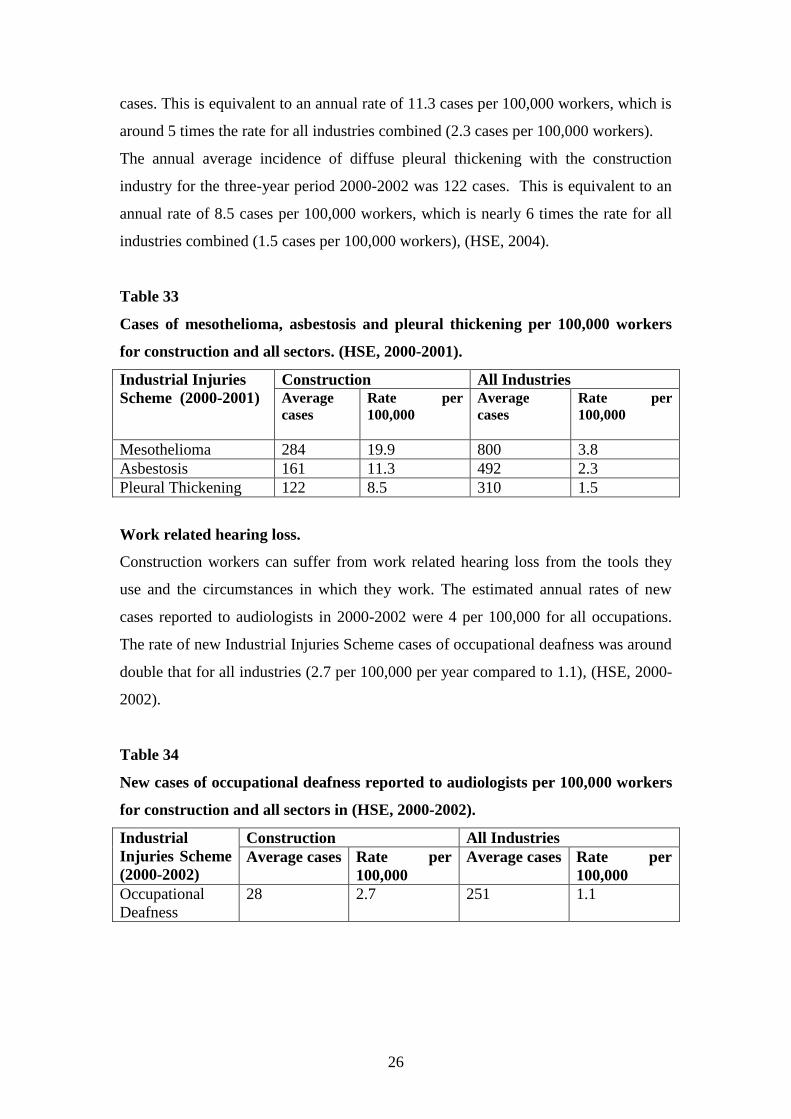
Table 33 shows the number of Industrial Injuries Scheme disablement benefit cases of
mesothelioma in the construction industry. The annual average incidence in
construction for the three-year period 2000-2002 was 284 cases. This is equivalent to
an annual rate of 19.9 cases per 100,000 workers, which is more than 5 times that for
all industries combined (3.8 cases per 100,000 workers), (HSE, 2004).
Based on Industrial Injuries Scheme figures, the annual average incidence of
asbestosis in the construction industry for the three-year period 2000-2002 was 161
26
cases. This is equivalent to an annual rate of 11.3 cases per 100,000 workers, which is
around 5 times the rate for all industries combined (2.3 cases per 100,000 workers).
The annual average incidence of diffuse pleural thickening with the construction
industry for the three-year period 2000-2002 was 122 cases. This is equivalent to an
annual rate of 8.5 cases per 100,000 workers, which is nearly 6 times the rate for all
industries combined (1.5 cases per 100,000 workers), (HSE, 2004).
Table 33
Cases of mesothelioma, asbestosis and pleural thickening per 100,000 workers
for construction and all sectors. (HSE, 2000-2001).
Industrial Injuries
Scheme (2000-2001)
Construction All Industries
Average
cases
Rate per
100,000
Average
cases
Rate per
100,000
Mesothelioma 284 19.9 800 3.8
Asbestosis 161 11.3 492 2.3
Pleural Thickening 122 8.5 310 1.5
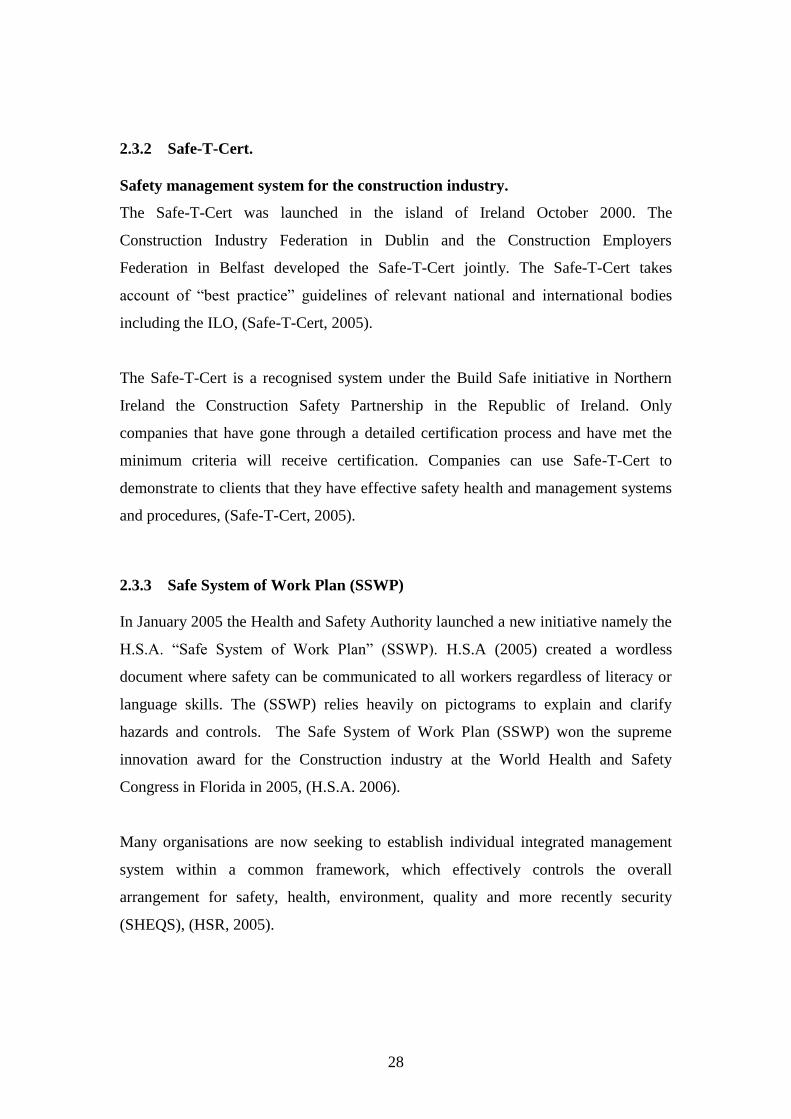
Work related hearing loss.
Construction workers can suffer from work related hearing loss from the tools they
use and the circumstances in which they work. The estimated annual rates of new
cases reported to audiologists in 2000-2002 were 4 per 100,000 for all occupations.
The rate of new Industrial Injuries Scheme cases of occupational deafness was around
double that for all industries (2.7 per 100,000 per year compared to 1.1), (HSE, 2000-
2002).
Table 34
New cases of occupational deafness reported to audiologists per 100,000 workers
for construction and all sectors in (HSE, 2000-2002).
Industrial
Injuries Scheme
(2000-2002)
Construction All Industries
Average cases Rate per
100,000
Average cases Rate per
100,000
Occupational
Deafness
28 2.7 251 1.1

27
2.3 Safety Management Systems for Construction Site Safety.
2.3.1 Introduction.
In order to reduce the level of fatalities, injury and ill-health in the construction
industry, a number of safety management systems are available and itemised on table
35.
Table 35
Safety Management systems
Protocol Status Year of
origin
Comment Available
for
Certification
HSG 65
UK
Successful Health &
Safety Management
Initial Model
developed by the
UK HSE to provide
OHSMS guidance
1st
1993
2nd
1997
Possibility of a new
edition with more
human factors guidance
Not available
BS 8800 Occupational health
and safety
management
system-Guide.
British Standards
Institution, London.
1996
Revised
2004
New version published
in July 2004 with
significant amendments
Not
Available
OHSAS
18001
Occupational Health
& Safety
Management
Systems.
Agreed specification
1999 Review in early 2005
4000 licenses issued
Available for
Certification
ILO
OSH
International
Guidance
International Labour
Office, Geneva.
2001 Available as an
international
"guidance" for national
governments, but pilot
work of a wider global
scope in progress
Not
Available
Safe-T-
Cert
Approved
CIF/CEF/IOSH
construction
1998 Republic of Ireland
and
Northern Ireland
Available for
Certification
28
2.3.2 Safe-T-Cert.
Safety management system for the construction industry.
The Safe-T-Cert was launched in the island of Ireland October 2000. The
Construction Industry Federation in Dublin and the Construction Employers
Federation in Belfast developed the Safe-T-Cert jointly. The Safe-T-Cert takes
account of ―best practice‖ guidelines of relevant national and international bodies
including the ILO, (Safe-T-Cert, 2005).
The Safe-T-Cert is a recognised system under the Build Safe initiative in Northern
Ireland the Construction Safety Partnership in the Republic of Ireland. Only
companies that have gone through a detailed certification process and have met the
minimum criteria will receive certification. Companies can use Safe-T-Cert to
demonstrate to clients that they have effective safety health and management systems
and procedures, (Safe-T-Cert, 2005).
2.3.3 Safe System of Work Plan (SSWP)
In January 2005 the Health and Safety Authority launched a new initiative namely the
H.S.A. ―Safe System of Work Plan‖ (SSWP). H.S.A (2005) created a wordless
document where safety can be communicated to all workers regardless of literacy or
language skills. The (SSWP) relies heavily on pictograms to explain and clarify
hazards and controls. The Safe System of Work Plan (SSWP) won the supreme
innovation award for the Construction industry at the World Health and Safety
Congress in Florida in 2005, (H.S.A. 2006).
Many organisations are now seeking to establish individual integrated management
system within a common framework, which effectively controls the overall
arrangement for safety, health, environment, quality and more recently security
(SHEQS), (HSR, 2005).
29
2.3.4 Quality Management Systems
Mc Hugh (2003) reports on the results of research carried out on the implementation
of BS EN ISO 9000 as a continuation of BS5750 in the U.K. construction industry.
This paper has shown that as far as the experiences of the managers that were
interviewed, ―the ISO 9000 standards series can form and has formed the basis for an
efficient and advantageous quality management system‖. Of particular importance are
the reviews required for the initial registration, the requirement for regular internal
audits, and reviews carried out for renewing registration.
Mc Hugh (2003) discusses the implementation of construction quality systems based
on the elements of the ISO 9001 series. Each of the elements of the ISO system are
described and adapted to construction safety systems, aimed at developing such
systems in a systematic manner thus leading to the improvement of safety
performance levels on site. This paper discusses the requirements of the safety
management system, which follows the methodology and structure of the ISO 9001
series.
Mc Hugh (2003) states that the framework for implementing an EMS system for the
construction industry relies on the following course of action, (Plan –Do –Check –
Act). Construction companies need to investigate as to how their activity impacts on
the environment. ISO 14000 must be integrated with a corporate environmental
strategy. This report states that construction companies should be proactive in their
approach to environmental management.
According to Koehn et al (2003) the international organisation for standardisation has
not yet released ISO 18000, but it is being utilised on a national level in the UK,
Australia, and Singapore. It may be considered an improved version of a safety
management system (SMS) which itself is a relatively new approach of controlling
safety policies, procedures and practices within a company. According to Wilson and
Keohn (2000) this philosophy is currently being implemented by many construction
companies to limit their liabilities and costs, thereby making them more competitive
in the construction market place.
30
In some countries and regions such as Singapore and Hong Kong, submission of a
safety management system is mandatory before starting a construction project above a
particular monetary volume. In the USA the Occupational Safety & Health
Administration (OSHA) mandates that employers such as contractors are responsible
for providing a safe and hazard free workplace for all employees. Proper
implementation of ISO 18000 (SMS) could serve the requirements of a governmental
regulatory body, such as OSHA as well as provide a firm base line towards a safer
working environment (OSHA, 2001).
McDonald & Hrymak (2002) stated that it is too easy to comply with legal
requirements through having a paper system, which does not effectively operate in
practice. This report argues that safety management systems should be audited to
assess the effectiveness of safety management systems; the duties of the safety officer
should be strengthened, while operational management of health & safety should be
measured and held accountable.
McDonald & Hrymak (2002) found that the presence of a site safety representative
showed the strongest relationship with safety compliance. They recommend that all
sites should have a safety representative and ‗their role and functions should be
reinforced as part of the safety management system.
31
2.4 Interventions on building sites designed to improve safety.
2.4.1 Introduction
There are many examples of interventions on building sites designed to reduce
accidents and ill health in the construction industry. The European Agency for Safety
and Health at Work (2004) presents a number of examples of good practice on the
prevention of risks in construction work.
NCC is a major construction and property development company in Sweden. NCC
wanted to provide health and safety information to its employees in a simple, non-
verbal format. NCC developed a picture book presenting different hazardous work
situations - the Silent Book - containing pictures of what not to do and what to do.
The Silent Book was distributed to all the company's employees in Sweden and in
other countries. As the booklet was pictorial, there were no translation problems.
NCC's work-related accident rate has declined over a ten-year period. The Silent
Book has played an important part of NCC's overall policy and actions to promote
health and safety improvements. According to the European Agency for Safety and
Health at Work the Silent Book is an excellent way of providing information to
everyone. The Silent Book is particularly suitable for those employees who not speak
the language of the country they live in, and for anyone who cannot read with
confidence, (European Agency for Safety and Health at Work, 2004)
One aspect of poor safety management in Finland has been the absence of tools for
reliably monitoring occupational safety. In 1992 and 1993, the Occupational Safety
and Health Inspectorate of Uusimaa, in cooperation with the Finnish Institute of
Occupational Health, developed a method for evaluating the occupational safety level
on construction sites, the 'TR method'.
The 'MVR method' was later developed for the civil engineering sector. Important
features of these methods are that they are simple, and the process is carried out with
both employer and employee acting together, thereby ensuring effective cooperation.
32
A competition was launched in Finland in 2001 to improve safety in the construction
industry. The TR and the MVR methods were used as safety performance tools in the
competition. Results show that in the past 4 years, accident frequency has fallen by
20% in the competing companies. According to a scientific study on the TR' method,
it is estimated that, because of the competition, the competing companies have as
many as 500 fewer accidents every year, (European Agency for Safety and Health at
Work, 2004)
Construction firms in Austria held discussions to identify ways to improve safety
when erecting and dismantling scaffolding to reduce the risk of serious accidents due
to falls from heights. The result of these discussions was that if an easy-to-use, ready
assembled, scaffolding system with corresponding anchorage parts and fittings were
developed there would be considerable benefits.
Results found that by using ―Ready Assembled Scaffolding‖ compared to the erection
of traditional scaffolding the risk of serious accidents due to falls from heights is
decisively reduced, (European Agency for Safety and Health at Work, 2004)
Johnson, et al (1998) carried out research for the Hawaii Occupational Safety and
Health Division into the protection of residential roof workers from falls. A number
of recommendations offered for improving the protection of residential roof workers
from falls are summarised below.
Reduce the complexity of the regulations.
Provide incentives for compliance. For example, discounts for workers, fall
protection equipment subsidies and tax credits.
Require special permits for renovations and home repair. Increase involvement
from risk managers or owners. Make licensing requirement more stringent.
Increase the amount of fines issued.
Develop a co-operative education program for contractors and workers alike.
Provide training in hazard analysis and the hierarchy of fall protection,
Provide certification of safe work practices that would allow for reduced
regulatory inspections.

33
Improve the safety culture at all levels, from the worker to the developer to the
individual homeowner.
Finally, innovative methods of protecting the workers must be developed. An
independent hazard analysis should be conducted for each phase of
construction, to determine appropriate methods of fall prevention or
protection.
The HSE in 1993 commissioned a two year study into construction site safety. The
research findings showed that the best performing sites overall were those where
management attended all the meetings with operatives at the commencement of the
intervention. These findings are also broadly in line with an overview of a variety of
managerial interventions. Rodgers et al. (1993) found that ―studies have consistently
reported that commitment from top management is essential‖ for an intervention to
succeed (Marsh, 1995).
This research examined the relationship between management commitment, the safety
climate and safe work behaviour in construction site environments in Australia in
2002. The empirical results indicate a significant relationship between the safety
climate and safe work behaviour. Management‘s commitment is a central element of
the safety climate (Zohar, 1980). Management‘s role has to go beyond organizing
and providing safety policies and working instructions. Langford et al. (2000) found
that when employees believe that the management cares about their personal safety,
they are more willing to cooperate to improve safety performance.
Positive safety climates seem to result from management‘s showing a committed and
non-punitive approach to safety. Positive safety climates seem to result from
management promoting a more open, free-flowing exchange about safety-related
issues. The result of this research verifies previous research (Zohar, 1980) and further
emphasises the importance of managers being committed to and personally involved
in safety activities to emphasise safety issues within the organisation, (Mohamed,
2002).
Researchers from Purdue University‘s School of Health Sciences, Indiana, USA.
conducted a study to determine what elements of the safety programmes of large
construction companies were responsible for a reduced rate of falls in comparison to
34
small construction companies (Construction Safety Alliance, 2003) The results can be
summed with three terms: motivation, training and money. The primary reason for the
success of large construction companies at reducing construction falls is that upper
management has made commitment to be safe, (Abraham et al, 2004).
Abraham et al (2004) showing that the rate of falls decreased as the cost of
construction projects increased.
Research was carried out into the risk of falls from heights for small construction
companies with less than 20 employees in Australia. Lingard et al (2001) cited
previous research, small businesses are characterised by poor management skills,
Jones et al (1998) and authoritarian management styles, (Orlandi, 1986), (Witte
1993). Small businesses are poorer at implementing OHS programmes than larger
businesses (Hollander and Lengermann, 1988), (Fielding and Piserchia, 1989)
(Eakins, 1992) (Holmes, 1995) and (Mayhew, 1995). Small businesses are
characterised by poorer communication between employees and management on OHS
(Williams, 1991) and (Rundmo, 1994). The results of the research suggest that at the
small construction companies there is a fatalistic resignation to OHS being an
unavoidable part of the job. This in turn leads to an emphasise on individual rather
than technological control for OHS risks, (Lingard et al, 2001).
Research was carried out to evaluate factors affecting safety performance levels on
three construction sites in the Rep. of Ireland. Mc Hugh (2003) found that the safety
management system was the most likely explanation of better safety performance on
site three when compared with site one and two. Whilst a safety management system
might not necessarily explain the improved safety performance levels on site three the
wider literature would support this view.
Mc Hugh (2003) reported that Health and safety management systems when properly
implemented have been identified as an important intervention to maintain high levels
of compliance, (Landin et al, 1999) and (Kievani et al, 1999) comment on quality
management systems that have been implemented in the construction industry while,
(Zhang et a,. 1999) comments on an appropriate framework for the implementation of
an environmental management system.
35
The HSE (1992) argued that poor safety performance levels in the construction
industry can often be traced back to management of health and safety issues. The
H.S.A. (2001) comments that good practice in health and safety management and
consultation is a key element of preventing injuries and ill health in the work place.
Whilst this management system may be in itself a manifestation of management
commitment (Booth and Lee, 1995) the importance of managing safety has been
clearly cited in the literature.
Mc Donald & Hrymak et al (2001) carried out research into the factors that influence
safety behaviour and compliance with safety requirements on construction sites. This
research found that the strongest relationship with the main safety compliance factor
was with the presence or absence of a safety representative. A safety representative on
site was associated with better compliance. The presence of a safety representative
was the only factor, which is significantly related to safety behaviours. Safety
representatives are associated with a greater likelihood of reporting risky situations
and a lower likelihood of simply continuing working in such situations. The presence
of a safety representative are also strongly related to the effectiveness of response to
audits and reported hazards. This pattern of relationships suggests that safety
representatives are the most important influence on the association between
effectiveness of response to audits and hazards and safety compliance.
The safety representative variable was also the only variable that shows a significant
relationship with reported safety behaviours–specifically reporting hazards and not
continuing to work in hazardous situations. Thus safety representatives encourage the
reporting of hazards and play the major role in ensuring that these reports lead to
better safety compliance on site. Their presence also makes it significantly more
likely that workers will not continue to work in hazardous situations.
The study recommends that all sites should have safety representatives and their role
and functions should be reinforced as part of the safety management system.
Abraham et al (2004) identified 17 contract provisions that were important for project
safety. One provision (contained in 83% of the contracts) was the requirement that the
36
contractor must assign at least one full-time safety representative to the construction
site.
Jaselskis et al (1996) found that to achieve outstanding project safety performance
field safety representatives should spend 30-40% of their time on safety issues.
Expending less time may compromise the project safety outcome.
Jaselskis et al (1996) through an analysis of construction companies and project safety
performance in the USA identified specific factors that are significant in improving
safety performance. These factors are summarised below.
―Upper management attitude‖
Strengthen upper management‘s attitude toward the importance of safety. Projects
that achieve average and outstanding project stature had strong upper-management
support compared to below average projects where management support was weaker.
―Project management team turnover‖
Reduce project-management team turnover as much as possible. Outstanding projects
experienced lower turnover rates (3.8%) compared to average or below average
projects (9.6%). This suggests that team stability plays a role in achieving better
safety performance.
―Time devoted to safety by field safety representatives‖.
Field safety representatives should spend 30-40% of their time on safety issues.
Spending less time may compromise the project safety outcome.
―Number of formal safety meetings with supervisors‖.
Increase the number of formal safety meetings with supervisors to one per week.
Outstanding projects averaged 3.5 meetings per month, compared to 2.6 for below
average and average projects.
―Number of informal safety meetings with supervisors‖.
Increase the number of informal safety meetings with supervisors to 6 per month.
Below average and average projects experienced about four meetings per month.)

37
―Site safety inspections‖
Increase informal site safety inspections to four per week. Below average and average
projects averaged approximately 1.5 informal inspections per week.
―Worker safety performance fines‖
Consider reducing the amount of money fined to workers who exhibit poor safety
performance. Outstanding projects fined workers an average of $13 pre violation
compared to $82 for below average and average projects. This suggests that workers
respond better to positive approaches when trying to comply with company safety
policies (Jaselskis, et al, 1996).
Marsh et al (1995) carried out research on improving safety behaviour using goal
setting and feedback on 13 building sites in the north west of England. Marsh et al
(1995) review of research on feedback demonstrates that performance is enhanced
when management provides clear feedback of performance-related information. These
techniques for modifying behaviour have already been shown to be of value in safety.
McAfee and Winn (1989) for example, showed that systematically monitoring safety-
related behaviour and providing feedback in conjunction with goal setting and or
training could improve safety behaviour in construction. Chookar and Wallin (1984)
demonstrated how safety performance with feedback and goal setting was better than
with only goal setting in a study of metal fabrication workers. Reber and Wallin
(1984) found similar results in a study of machine manufactures.
This research finding showed that goal setting and feedback can be used to produce
significant improvements in safety performance. This finding is consistent with and
adds to the findings of (Mattila and Hvodynmaa, 1988) in suggesting that the use of
goal setting and feedback techniques can significantly improve safety behaviour on
building sites.
In the Nevada survey only four respondents did not have a drug-testing program. The
injury rate for these contractors was considerably higher than the injury rate reported
by the firms with drug testing programs. For the Florida roofing contractors, the drug
tests that were associated with better safety performance were those conducted for
38
reasonable cause. These are tests that are deemed, necessary because of a worker‘s
appearance or demeanour that suggests drug abuse. It should be noted that only a few
firms did not conduct tests for reasonable cause, but these had a particularly high
injury rate. Those that did not conduct post accident drug testing had significantly
higher injury rates (Hinze et al, 2003).
Most firms surveyed had some form of drug testing in place. These tests included
random tests, tests for reasonable cause, post accident tests, and follow-up testing. All
did show that for at least one type of drug test, injury performance was favourably
impacted. No evidence suggests that drug testing is not effective in reducing injuries,
(Hinze et al, 2003)
The research of Garza et al (1998) and sponsored by Construction Industry Institute
CII in the USA analysed the different OSHA incident rates for construction
contractors who keep track of accidents versus those contractors who do not. Garza et
al (1998) analyses of those contractors who do not keep accident records by project,
averaged incident rates, which are about double those rates found in companies that
do keep these records by project. Levitt and Parker (1976) performed a study
examining the difference in accident rates for those contractors that keep records of
accidents by project to those that do not. The findings of this Construction Industry
Institute study are very similar to (Levitt and Parker‘s, 1976) findings in some ways.
They, too, saw that the accident rates for contractors that keep records of accidents by
project were substantially lower than those of the companies that do not keep these
records. Levitt and Parker (1976) quoted by (Garza, 1998) qualified their results by
stating that keeping such records can only be effective if top management is aware of
the existence of the records. The records produce results only if top management uses
them in evaluating superintendents and foremen. In essence, they found that success
is gained through measurement and implementation (Levitt and Parker, 1976). This
verified finding clearly confirms, ―What gets measured gets improved‖.
Recommendations to reducing compensation and injury claims in construction, Garza
et al (1998).
Avoid using a single indictor as a measure of contractor‘s safety performance.
Instead, use the collective criteria formed by the contractor‘s (EMR), The

39
Experience Modification Rate, (RIR) Recordable Incident Rate, (LTIR), Lost
Time Incident Rate, (WCCFI) Workers Compensation Claims Frequency
Indicator and its explicit commitment to zero-injuries.
Educate employees, employers and employee representatives about workers‘
compensation and its impact on business.
Participate in the selection of medical providers, focusing on those who
believe in getting the injured worker back to work as soon as is medically
practical.
Utilize modified work programs for injured employees where they can
perform productive duties without exposing them or their co-workers to
further injury.
Take an active role in interfacing with the insurance carrier or provider.
Participate in validating, approving, or denying employees‘ workers‘
compensation claims, including vigorous opposition and investigation of
suspected fraud.
Maintain frequent contact with injured employees. Make sure their needs and
expectations are being met and keep them abreast of jobsite activities.
Establish accountability for workers‘ compensation costs with projects and
supervisors.
Provide on-site first aid treatment appropriate to the size of the project.
Harper et al (1998) research highlights some of the areas addressed by Mason
Construction, Inc. Texas in the establishment of their safety programme, including
increased employee involvement. Mason Construction, Inc. is a contractor with
approximately $15 million annual revenue in the civil sector of the petrochemical
industry of southeast Texas. Mason Construction, Inc was also a recipient of the 1997
Construction Industry Safety Excellence (CISE) Award, which was presented by the
National Business Roundtable. Mason was one of only 11 companies in the nation to
win this prestigious award.
Specifically, the principal manner in which Mason has overcome the management
burden is through increased employee involvement in all phases of site safety. It is
generally known that employees are often more aware of hazards in the work place
40
than are employers (Koehn and Surabhi, 1996). By involving the employee in the
safety process, more commitment is gained from the employee. This additional
commitment may be attributable to the employee‘s desire to execute something,
which he or she has developed or assisted in developing. This type of involvement
enables the employees to gain a sense of ownership and increased responsibility.
Employees are more apt to accept and adapt to minor changes implemented into a
safety programme through time than they are to accept vast changes thrown upon
them at short notice (Paterson, 1996).
Again employee involvement is key here. In most instances it is the employees who
are most knowledgeable about the potential hazards peculiar to their work as well as
ways to avoid these hazards. Management need only tap this knowledge held by the
employees. Also, with employee involvement changes may be made much more
efficiently than by forced implementation with no input from the employees.
Contemporary theories of accident prevention hold that in order to behave safely
people need to possess the knowledge, skills, and abilities (KSAs) and the motivation
to do so. Lingard (2002) (Furnham, 1994), (Lindell, 1994), (Goldstein, 1993)
observed a low correlation between learning an ability to do something and actual job
behaviour.
Marsh et al (1995) reported that the role of the observer on site seems to be of vital
importance. Two factors are particularly interesting. First the role of the psychological
make up of the observer. Second the position within the organisation that the observer
holds. Marsh et al (1995) found that good observers do not need to be either ―safety
experts‖ or site management. Some, of the most efficient observers have been
operatives and trainee foremen. The duties involved require conscientiousness and a
methodical approach. Outstanding intellectual quality is, not important as the
fundamental philosophies that underpin the intervention are basic and easy to grasp. It
appears to help the observer if he or she has a good rapport with the operatives.
Ideally at least two fully trained observers are required on each site, (Marsh et al,
1995).

41
The principal objective of first aid training is to provide laypersons with the skills to
assist a casualty, before the arrival of specialist medical help, in the event of injury or
sudden illness. However research has shown that when administered in a work setting,
first aid training has a secondary effect of improving occupational health and safety
performance. For example, Lingard (2001), (Miller and Agnew, 1973), and (Mc
Kenna and Hale, 1981) found an association between traditional first aid training and
a lower incidence of workplace injuries. Lingard (2001) found that first aid training
had a positive and significant effect on certain aspects of the construction workers
behaviour.
Kashiwagi (2004) research in the USA proposed that quality performance and safety
issues are not a construction or engineering issue, but a business issue of supply and
demand. This $4 million research programme at Arizona University provides
evidence that the owner (and not the construction industry) has more impact on the
level of construction performance. It concludes that the relationship between the
owner‘s approach to construction and the level of performance (quality and safety, on
time, and on budget) is driven by the ability of the owner to efficiently demand
performance. If the owner out sources construction properly, by passing the risk of
performance to the contractor, the contractor is more likely to send highly trained
personnel who can perform on the project (and who are safe). The construction
industry‘s performance has shown that when the owner identifies minimum standards,
contractors have supplied the minimum level of performance. This research shows
that when the owner properly identifies and demands performance through correct
outsourcing, the level of performance of construction is extremely high (Kashiwagi,
2004).
Saurin (2004) reported that in the USA, (Hinze, 2002) and (Liska et al, 1993) have
consistently found that pre-project and pre-task safety planning are among the critical
measures required to achieve a zero accident target. Lingard (2001) reported that
(King and Hudson, 1985) research suggested that the inclusion of safety costs in a
tender reduces the loss time accident frequency rates from a range of 2.5-6.0 per
100,000 man hours worked to a range of 0.2-1.0 per 100,000 man hours worked on
major construction projects
42
Abraham (2004) in this research identified three principal areas in which facility
owners can and do influence safety performance on construction projects citing
(Hinze, 2003). These include the
Selection of safe contractors,
Carefully drafted contract documents.
Active involvement in safety during construction.
Abraham (2004) examined contract requirements found in all contracts which were
perhaps the foundation for project safety. The following list contains 17 contract
provisions on safety that were examined. These contract provisions state the
contractor must:
Comply with local, state and federal safety regulations.
Comply with safety requirements beyond the OSHA regulations.
Place at least one full-time safety representative on the project.
Submit the résumés of key safety personnel for owner‘s approval.
Provide specified minimum training for the workers.
Report all lost time injuries to the owner.
Report all OSHA recordable injuries to he owner.
Report all (including first aid) injuries to the owner.
Include owner personnel in coordination meetings.
Submit subcontractor list for owner approval.
Implement a substance abuse programme.
Participate in site safety inspections.
Conduct weekly safety meetings.
Submit a site-specific safety plan.
Submit a safety policy signed by its CEO.
Provide specified PPE (hard hats, safety glasses, gloves).
Implement a permit system for hazardous activities (line breaks,
lockout/tagout, excavations, proximity to power lines, confined space entry,
hot work etc.).

43
One provision (contained in 83% of the contracts) related to notable improvements in
safety was the requirement that the contractor must assign at least one full-time safety
representative to the construction site (Abraham et al, 2004).
Harper et al (1998) in this case study shows that the benefits attributable to a strong
safety program outweigh the costs of the program itself. Specific steps taken by
Mason Construction, Inc. in Texas to reduce its risks of accidents and increase worker
safety included,
Better safety management.
Hazard awareness through safety training.
Employee involvement.
Good housekeeping procedures.
Reduction in labour turnover rates.
Emphasis on safe work methods and procedures.
The reduction in work accidents seen by Mason Construction, Inc. has been
substantial since the inception of its current safety program, implemented in 1992.
This reduction in accidents has led to lower incidence rates, a lower experience
modification rate, reduced worker‘s compensation insurance rates, and a decreased in
monetary losses from legal fees associated with worker‘s compensation claims.
Additionally reduced loss time has lead directly to increased productivity.
Since implementation of its comprehensive safety program in 1992, which received
further enhancement and development in 1994, Mason Construction, Inc. has enjoyed
an overall decreasing incidence rate, which has fallen from 7.75 in 1992 to a rating of
zero in 1996. Comparatively, the industry average for SIC code 162 (Heavy
construction, except highway) under which Mason Construction is categorized was
11.4 in 1992 and had decreased only slightly to a low of 9.4 in 1995.
Overall, since the inception of Mason‘s current safety program the company has spent
roughly $545.000 on safety-related issues. Of this, approximately $177,000 was
directly spent on the implementation and management of its safety program. Total
returns stemming from the safety program and reduced worker accidents have been
44
approximately $956.000 since 1992, with approximately $654.300 of this savings
from insurance premiums alone. In particular, the ratio of the dollars returned to each
dollar invested in safety may be calculated to be 1.754.
As of March 1997 Mason Construction, Inc. employees had worked a total of 557,770
man-hours without a lost time accident and 447,035 man-hours with no recordable
incidents.
Young (1996) The Business Roundtable took the lead in the 1980s by recognizing
that improving construction safety performance is essential to improving the cost-
effectiveness and competitiveness of the U.S. construction industry. Their reports
clearly demonstrate how poor safety performance increase insurance costs as well as
indirect costs like lost productivity, schedule delays and adverse public relations.
Savings are maximised only by cost effective investment in management controls.
The Los Angeles Metro project began with a single safety professional in the
construction manager‘s organization. After five years of negative publicity concerning
safety issues, the project‘s managers increased their investment in safety by
approximately tenfold. The Washington Metro project also increased staff and
implemented a financial incentive program for contractors that have been credited
with saving $10 million per year (Young, 1996).
The Denver International Airport expanded its safety management staff from 6 to 39
people and realized a corresponding fourfold decrease in the cost of claims per hour
worked. Although some argue that the staffing increased was an overreaction to two
earlier fatalities, the investment resulted in improved performance. After three years,
the public officials managing the project could claim savings of approximately $35
million. (Young, 1996).
Gambatese, et al (1997) looked at a study by the Construction Industry Institute which
focused on creating a database of safety ideas and a design tool that allows designers
to address construction worker safety in their designs. Four hundred design
suggestions have been accumulated in this research. The design tool will be useful not
only for improving safety during the construction phase of the project, but also during
the start-up and maintenance phases. The design suggestions reflect all types of
45
design disciplines and construction hazards with the majority or 32.8% relating to
falls. Many falls on construction sites occur due to the architectural and structural
scope of work, the design of beams, columns, walls, stairways and ladders etc.
The following is an example of the design for safety suggestions in relation to fall
prevention.
Suggestion, Design components to facilitate prefabrication in the shop or on
the ground so that they may be erected in place as completed assemblies.
Purpose, reduces worker exposure to falls from elevations and the risk of
workers being struck by falling objects.
Suggestions, design steel columns with holes in the web at 0.53 and 1.07 m
above the floor level to provide support locations for guardrails and lifelines.
Purpose, by eliminating the need to connect special guardrail or lifeline
connections, such fabrication derails will facilitate worker safety immediately
upon erection of the columns.
Suggestion, design beam to column double connections to have continual
support for the beams during the connection process by adding a beam seat,
extra bolt hold, or other redundant connection point.
Purpose, continuing support for beams during erection will eliminate falls due
to unexpected vibrations, misalignment, and unexpected construction loads.
Suggestions, minimise the number of offsets in the building plan and make the
offsets a consistent size and as large as possible.
Purpose, prevent fall hazards by simplifying the work area for construction
workers.

46
3 Methodology
3.1. Aim
3.2 Objectives.
47
3.0 Methodology.
3.1 Introduction.
The methodology adopted was based on the Mc Donald & Hrymak (2002) research.
Similar methodologies have been used successfully to measure construction site
safety by the Health and Safety Executive, (HSE, 1999).
Aim
To assess the level of safety performance on twenty construction sites in
Dublin.
Objectives
To develop and implement a methodology to measure the level of health
and safety performance on 20 construction sites.
To assess any factors that predicts good safety performance.
To assess any patterns or trends in safety management on the twenty
construction sites.
To make recommendations to the construction industry based on the
results.
The methodologies used were:
1. Construction site safety observational checklist
2. Construction site documentation checklist and analysis
3. Construction site management interview
4. Site management evaluation and analysis
The variety of methodologies were adopted to reflect the different aspects of
construction sites and to reflect overall project objectives.
48
The McDonald & Hrymak (2002) methodology used a quantitative and qualitative
approach to measuring site safety performance. The quantitative work involved the
design of an observational study. This resulted in an observational study checklist to
evaluate safety and health performance levels with recommended health and safety
requirements on construction sites.
For this research a similar site safety observation item checklist was developed to pay
particular attention to the category falls from height in construction. A total of 20
construction sites were surveyed in the Dublin area all of which include apartment
buildings. All of the sites surveyed were large or medium size construction
developments. The sites were all visited within the period from November 2003 to
October 2004. Each site survey lasted on average three hours. In total there was 60-
site item observations made on each of the 20 sites, which amounted to a total of
1,200 site item observations.
Site background
The number of separate building units on the 20 different sites varied from 1-5 blocks
to over 10 blocks on site. On 15 (75%) out of 20 sites there were between 1-5 blocks
on site. On 1 (5%) site out of 20 sites there was between 6 and 10 blocks on site. On
4 (20%) out of 20 sites there were more than 10 blocks on site.
The number of employees working on site varied from less than 100 employees to
over 200 employees. Of the 20 sites 14 (70%) were small sites with less than 100
employees. There were 5 (25%) medium size sites with between 101 and 200
employees working. There was 1 large site with over 200 employees.
The different stages of work on the 20 sites also varied. On 16 (80%) out of the 20
sites involved mixed stages of construction work on site. On 3 (15%) out of 20 sites
construction work on site was at the external shell stage. On 1 (5%) out of 20 sites
construction work on site was above ground stage.
Site selection
The construction sites selected for this research were selected randomly. Most of the
construction site developments were observed while travelling through the city. The
49
relevant construction companies were then contacted and permission was requested to
visit those sites for the purpose of this research. Other construction companies were
contacted by phone to establish if they were currently developing any apartment
blocks in Dublin. By combining both site selection processes this research eventually
succeeded in selecting and visiting 20-construction sites.
The methodology was piloted successfully on one construction site in Dublin.
3.2 Construction site safety observational checklist.
A site safety observational checklist was produced to include site safety situations and
activities encountered under three categories.
1. Working at heights.
2. Housekeeping.
3. Personal Protective Equipment.
This checklist was used to measure of the level of safety performance on each
construction site visited. The observational items were listed under eight (8) different
headings.
1. Working at Height Category.
1 Scaffolding
The observational items that were measured under this category were:
1. Scaffolding sound footing
2. Base-plate & sole boards
3. Platforms properly supported
4. Scaffold braced properly
5. Scaffold tied properly
6. Ladder access provided
7. Platforms fully boarded
8. Handrail & midrail in place
9. Toe-boards in place
10. Platforms kept clean
50
11. Trap boards
12. Brick-guards in place
13. Trestles used properly
14. Platform loads within maximum safe working load
2 Ladder access to heights.
The observational items that were measured under this category were:
1. Proper ladders in use
2. Ladders in good condition
3. Ladders 1 meter above landing
4. Ladders properly secured
5. Ladders used safely
6. Stepladders used safely
3 Mobile scaffolds
The observational items that were measured under this category were:
1. Mobile Scaffold boards in place
2. Mobile Scaffold guardrails fitted
3. Mobile Scaffold toe boards fitted
4. Mobile Scaffold safe means of access
5. Mobile Scaffold ground firm & level
6. Mobile Scaffold tower tied if unattended
7. Mobile Scaffold wheels locked
8. Mobile Scaffold base height ratio 1-3
9. Mobile Scaffold clear of people & material when moved
10. Mobile Scaffold used safely
4 Roof work
The observational items that were measured under this category were:
1. Roof work warning notices of fragile roof
2. Roof work crawling boards in place
3. Roof work edge protection in place
4. Roof work guardrails in place
5. Roof work toe boards in place
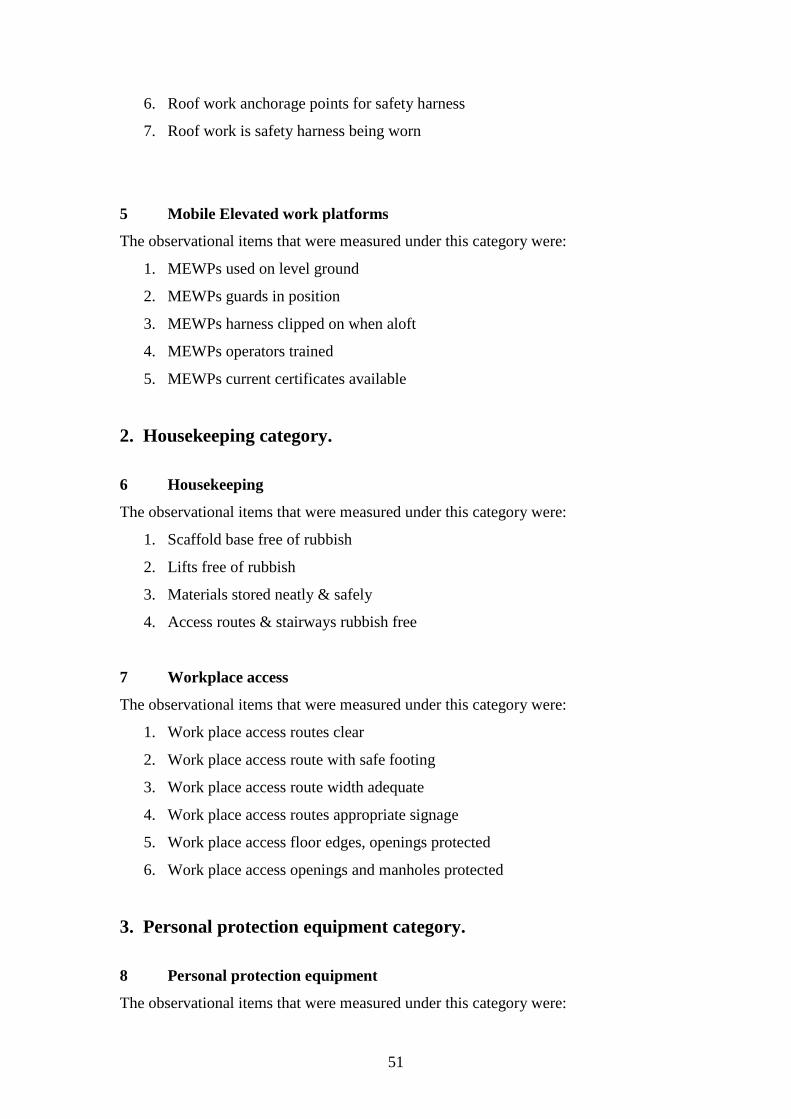
51
6. Roof work anchorage points for safety harness
7. Roof work is safety harness being worn
5 Mobile Elevated work platforms
The observational items that were measured under this category were:
1. MEWPs used on level ground
2. MEWPs guards in position
3. MEWPs harness clipped on when aloft
4. MEWPs operators trained
5. MEWPs current certificates available
2. Housekeeping category.
6 Housekeeping
The observational items that were measured under this category were:
1. Scaffold base free of rubbish
2. Lifts free of rubbish
3. Materials stored neatly & safely
4. Access routes & stairways rubbish free
7 Workplace access
The observational items that were measured under this category were:
1. Work place access routes clear
2. Work place access route with safe footing
3. Work place access route width adequate
4. Work place access routes appropriate signage
5. Work place access floor edges, openings protected
6. Work place access openings and manholes protected
3. Personal protection equipment category.
8 Personal protection equipment
The observational items that were measured under this category were:
52
1. Workers wearing safety footwear
2. Workers wearing safety helmets
3. Workers ear protection being worn where appropriate
4. Workers eye protection worn where appropriate
5. Workers respirators or masks worn where appropriate
6. Workers protective gloves worn where appropriate
7. Workers fall arrest equipment worn where appropriate
8. Workers wearing Hi-Vis vests
The results of the site visits were recorded in percentage of non-compliance with
recommended safety practice. All 60-site safety observational items were rated on a
percentage scale of compliance with recommended site safety practice.
The procedure for the observational study carried out on each site visited was as
follows: A generalised description of the site including the size of the site, the
number of blocks on site, number of site personnel and the stage of construction were
recorded. The description for the different stages of work on site included foundation
and groundwork, above ground, external shell, internal works and mixed stages. The
mixed stages description was used to describe work on site where two or more of the
different stages of work were being undertaken on site. The site was then surveyed
and all information was recorded on the site safety observational checklist. In
recording the information four responses were possible and recorded in specified
ways, namely, yes, no, not applicable and the percentage non-compliance.
Work carried out safely, i.e. in complete compliance with recommended safety
practice was recorded as 0% non-compliance. Unsafe conditions were recorded as a
percentage of items on site non-compliant, e.g 40% non-compliance.
For example when 30 out of 100 site workers were found not wearing hard hats, this
was recorded as 30% non-compliance. Similarly the amount of scaffold guardrails
found to be missing was expressed as a percentage of the total. Hence where 100
meters of scaffolding was in use and 10 meters of the scaffolding was without
adequate guarding, it was recorded as 10% non-compliance. Another example would
53
be when a quarter of all materials on site were found stacked or stored unsafely (i.e.
capable of toppling over and causing injury) it was recorded as 25% non-compliance.
If an item in the checklist was not found on site it was recorded as (N/A) not
applicable, not seen.
All safety items on the site safety observational checklist were completed for all the
20 sites surveyed.
The results of the research findings for the construction site observational checklist
(1-60) are presented for each different heading as a percentage of non-compliance. In
addition the percentages of non-compliance are grouped under 5 descriptions in the
graph/table, namely complete compliance, low, med, high and very high non-
compliance.
Complete compliance = 0% representing 0% non-compliance. This is complete
safety compliance.
Low = 0-4% representing 0% to 4% non-compliance with recommended
safety practices.
Medium = 5-9% representing 5-9% non- compliance with recommended
practice.
High = 10-20% representing 10-20% non- compliance with recommended
practice.
Very high = 20%> representing 20% or higher non- compliance with
recommended practice.
The construction site safety observational checklist study is included in appendix A.
The explanation of checklist item numbers & recommended practice is included in
Appendix F.
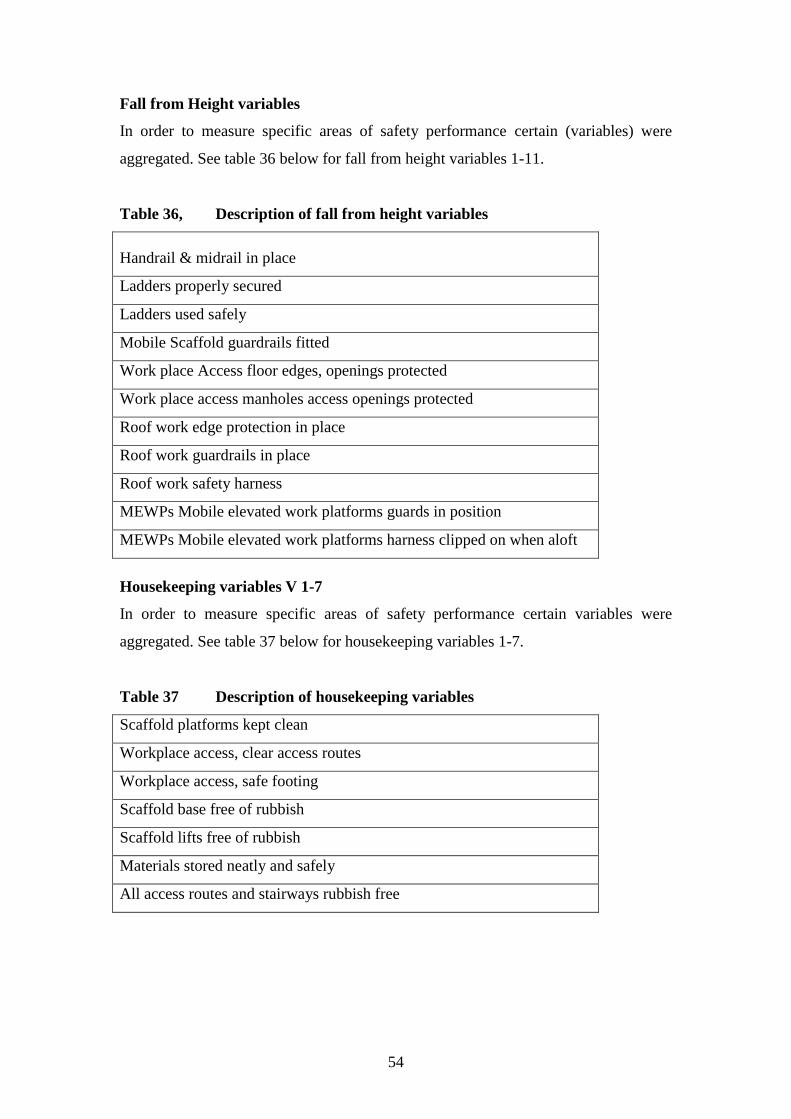
54
Fall from Height variables
In order to measure specific areas of safety performance certain (variables) were
aggregated. See table 36 below for fall from height variables 1-11.
Table 36, Description of fall from height variables
Handrail & midrail in place
Ladders properly secured
Ladders used safely
Mobile Scaffold guardrails fitted
Work place Access floor edges, openings protected
Work place access manholes access openings protected
Roof work edge protection in place
Roof work guardrails in place
Roof work safety harness
MEWPs Mobile elevated work platforms guards in position
MEWPs Mobile elevated work platforms harness clipped on when aloft
Housekeeping variables V 1-7
In order to measure specific areas of safety performance certain variables were
aggregated. See table 37 below for housekeeping variables 1-7.
Table 37 Description of housekeeping variables
Scaffold platforms kept clean
Workplace access, clear access routes
Workplace access, safe footing
Scaffold base free of rubbish
Scaffold lifts free of rubbish
Materials stored neatly and safely
All access routes and stairways rubbish free
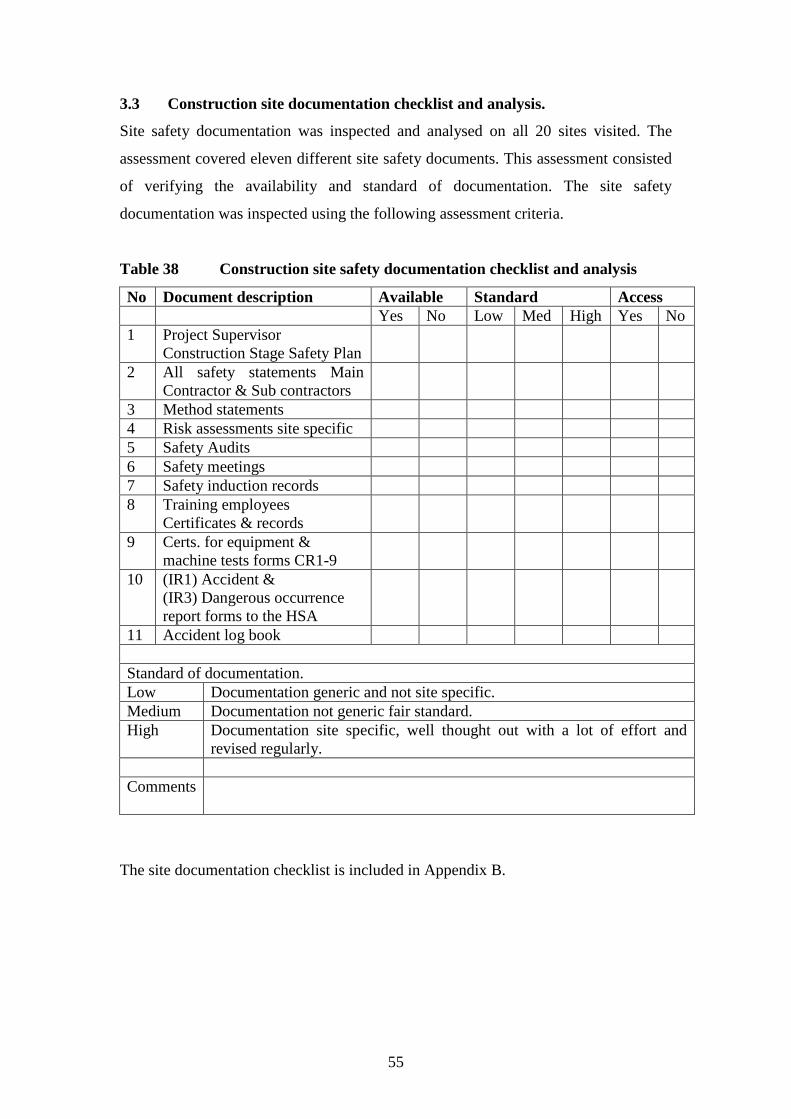
55
3.3 Construction site documentation checklist and analysis.
Site safety documentation was inspected and analysed on all 20 sites visited. The
assessment covered eleven different site safety documents. This assessment consisted
of verifying the availability and standard of documentation. The site safety
documentation was inspected using the following assessment criteria.
Table 38 Construction site safety documentation checklist and analysis
No Document description Available Standard Access
Yes No Low Med High Yes No
1 Project Supervisor
Construction Stage Safety Plan
2 All safety statements Main
Contractor & Sub contractors
3 Method statements
4 Risk assessments site specific
5 Safety Audits
6 Safety meetings
7 Safety induction records
8 Training employees
Certificates & records
9 Certs. for equipment &
machine tests forms CR1-9
10 (IR1) Accident &
(IR3) Dangerous occurrence
report forms to the HSA
11 Accident log book
Standard of documentation.
Low Documentation generic and not site specific.
Medium Documentation not generic fair standard.
High Documentation site specific, well thought out with a lot of effort and
revised regularly.
Comments
The site documentation checklist is included in Appendix B.
56
3.4 Construction site Management Interviews.
A total of 45 semi-structured interviews were conducted across 20 sites with a range
of managers and personnel responsible for safety. The sample included Project
Managers, Safety Officers, Engineers, Foremen, Safety Representatives and Quantity
Surveyors.
At the beginning of each site visit relevant site personnel were contacted and asked if
they were willing to take part in the interview. Each interviewee was briefed on the
background to the research and the research objectives.
Each of the areas of work explored also had a corresponding quantitative measure that
was completed at the end of each interview. The interviews lasted between 20 minutes
and 1 hour. Most management personnel interviews were conducted on site however
due to site commitments and time constraints it was not possible for some
management personnel to give interviews on site. As a result some interviews had to
be conducted by phone at a later time that was suitable to the interviewee. The
interviews were all recorded in writing and interviews were also audio recorded with
the prior consent of the interviewee. The completed written interview was then
checked against the audio recording to ensure the accuracy and detail of the interview.
The questions included,
Background information of interviewee‘s.
Plan of action for dealing with safety related issues.
Competence of workforce and ongoing training in safety.
Monitoring system.
Reporting system.
Communication in the workplace.
Responsibility for safety in the workplace.
Co-operation between the main contractor and sub-contractors.
Personal suggestions to improve safety.
The Interview template is included in Appendix C.
The site Management template is included in Appendix D.
57
3.5 Limitations.
There are a number of limitations in this methodology. Referring to interviews there is
the possibility of bias of interviewees, views, answers to questions and suggestions,
e.g. pro management bias or anti management bias. There is also the possibility of
transcription errors.
Observations.
The sites visited during this research represented large or medium sized construction
sites and did not represent small construction sites. The results therefore will not be a
true representation or reflection of the safety conditions on construction sites in
general as previous research found that larger construction sites had higher levels of
safety compliance when compared to smaller sites, (H.S.A. 2002).
Site management had prior knowledge of visits to their sites and on some sites
management may have made site personnel aware of visits and as a result site
personnel may have been more compliant with safety matters e.g. wearing PPE etc.
Also site management may have taken remedial action to improve safety on site prior
to visits.
All sites were visited on only one occasion and this may not represent a true picture of
the overall level of safety during the entire life of the construction project. A number
of site visits to each site over the life of the construction project would give a more
accurate result to the general overall safety levels on site.
Each construction site visited had a construction site observational checklist of sixty
items. For the 20 sites visited this represented 1,200 items. It must be cautioned that
all items may not have been observed correctly.
Mobile scaffolds were observed in use on only 2 sites. This sample is too small from
which to draw significance or conclusions from the research results.
58
Sample size.
The research sample surveyed in this research represented over 40% of the apartment
completions for Dublin in 2004. According to the Department of the Environment
housing statistics there was 16,810 residential units completed in Dublin in 2004,
6,995 of the completions were apartments or 42% of the entire residential
completions. The number of apartments being constructed on the 20 sites viewed in
this survey was over 2,800 apartments or over 40% of the entire apartment
completions for Dublin in 2004. The first site was visited in November 2003 while the
remaining 19 sites were visited in 2004. Even though the majority of construction
sites visited was in 2004 most of the construction on these sites was not completed
until 2005.
In 2005 in Dublin 18,019 residential units were complete of which 9,542 were
apartments or 53% of the entire residential completions. In 2005 a total of 18,035
apartments were completed for the entire country. The number of apartments
completed in Dublin in 2005 (9,542) represented nearly 53% of the entire apartments
completed in the entire country. Therefore the sample is representative of the
apartment building construction sector in Dublin.

59
4 Results
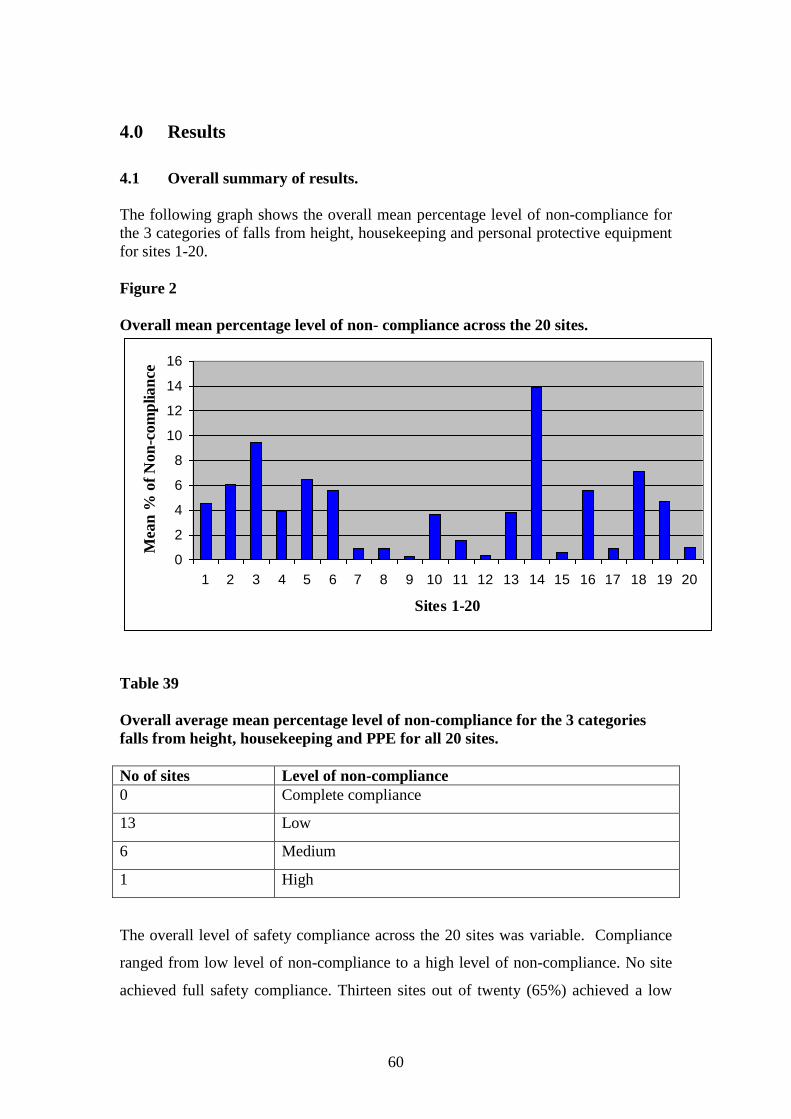
60
4.0 Results
4.1 Overall summary of results.
The following graph shows the overall mean percentage level of non-compliance for
the 3 categories of falls from height, housekeeping and personal protective equipment
for sites 1-20.
Figure 2
Overall mean percentage level of non- compliance across the 20 sites.
0
2
4
6
8
10
12
14
16
1 2 3 4 5 6 7 8 9 10 11 12 13 14 15 16 17 18 19 20
Sites 1-20
Mea
n %
of
Non
-com
plian
ce
Table 39
Overall average mean percentage level of non-compliance for the 3 categories
falls from height, housekeeping and PPE for all 20 sites.
No of sites Level of non-compliance
0 Complete compliance
13 Low
6 Medium
1 High
The overall level of safety compliance across the 20 sites was variable. Compliance
ranged from low level of non-compliance to a high level of non-compliance. No site
achieved full safety compliance. Thirteen sites out of twenty (65%) achieved a low
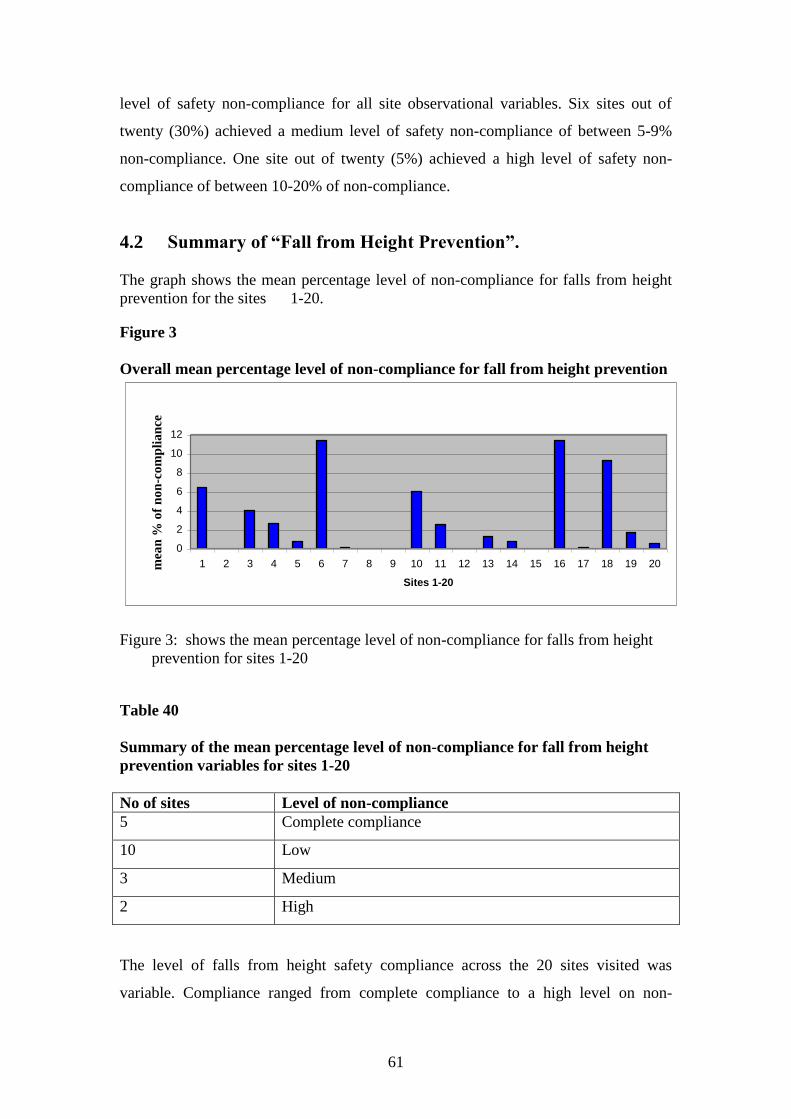
61
level of safety non-compliance for all site observational variables. Six sites out of
twenty (30%) achieved a medium level of safety non-compliance of between 5-9%
non-compliance. One site out of twenty (5%) achieved a high level of safety non-
compliance of between 10-20% of non-compliance.
4.2 Summary of “Fall from Height Prevention”.
The graph shows the mean percentage level of non-compliance for falls from height
prevention for the sites 1-20.
Figure 3
Overall mean percentage level of non-compliance for fall from height prevention
0
2
4
6
8
10
12
1 2 3 4 5 6 7 8 9 10 11 12 13 14 15 16 17 18 19 20
Sites 1-20
mea
n %
of
no
n-c
om
pli
an
ce
Figure 3: shows the mean percentage level of non-compliance for falls from height
prevention for sites 1-20
Table 40
Summary of the mean percentage level of non-compliance for fall from height
prevention variables for sites 1-20
No of sites Level of non-compliance
5 Complete compliance
10 Low
3 Medium
2 High
The level of falls from height safety compliance across the 20 sites visited was
variable. Compliance ranged from complete compliance to a high level on non-

62
compliance. Five sites out of twenty (25%) had complete compliance across the
eleven different falls from height variables. Ten out of the twenty sites (50%) had a
low level of non-compliance for falls from height variables. Three out of the twenty
sites (15%) had a medium percentage of non-compliance. Two sites out of twenty
(10%) of sites had a high level of non-compliance.
The areas of poor safety compliance for falls from heights.
The worst area of non-compliance in relation to falls from heights was floor edges and
openings not being protected. Here nine sites out of twenty (45%) did not protect
employees from falls. Three sites out of twenty (15%) had a high level of non-
compliance of between 10-20%.
Major non-compliance in relation to fall from height protection was also found where
ladders were not properly secured on five out of twenty sites (25%) of sites.
Major non-compliance was also found where roof work edge protection was missing
on four out of sixteen (25%) sites with a very high level of non-compliance on one
site with non-compliance over 20%.
Major non-compliance was also found where scaffolding handrails and midrails were
missing on four (20%) out the twenty sites did not have adequate protection to prevent
falls from heights.
Non-compliance was also found in the non-wearing of safety harnesses. On three
(36.75%) out of eight sites there was a high level of non-compliance in relation to the
wearing of roof work safety harnesses where non-compliance was between 10- 20%
non-compliance.
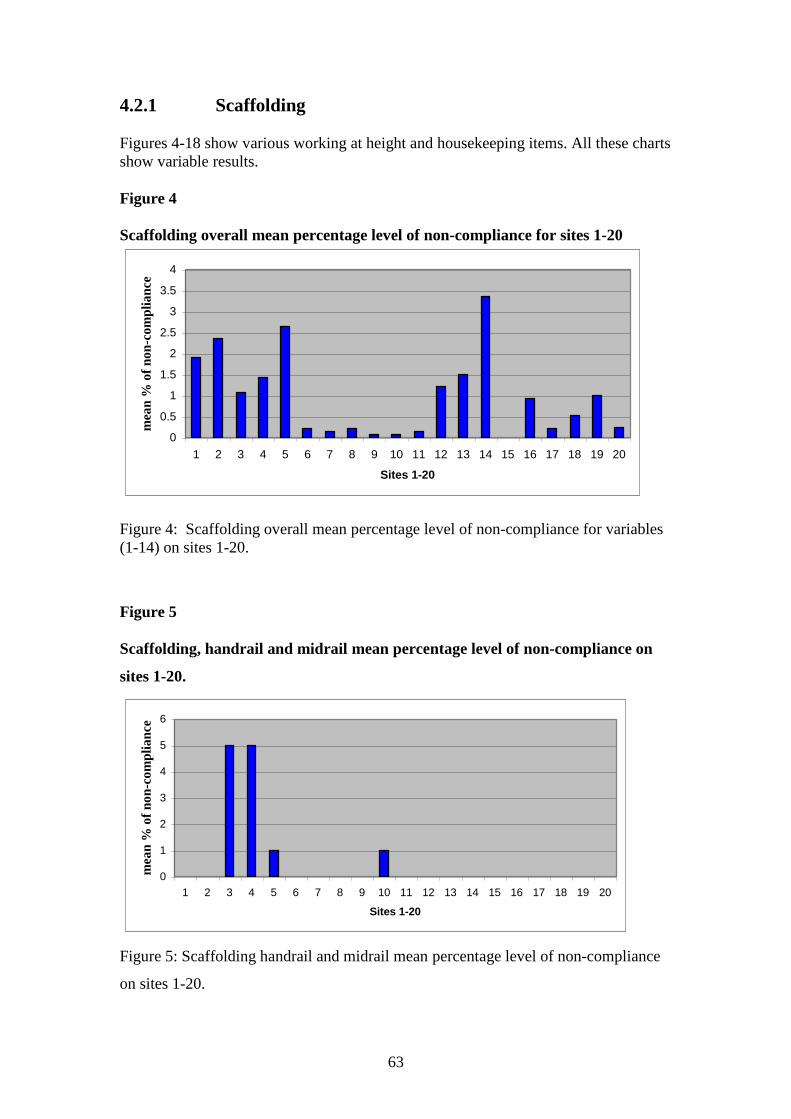
63
4.2.1 Scaffolding
Figures 4-18 show various working at height and housekeeping items. All these charts
show variable results.
Figure 4
Scaffolding overall mean percentage level of non-compliance for sites 1-20
0
0.5
1
1.5
2
2.5
3
3.5
4
1 2 3 4 5 6 7 8 9 10 11 12 13 14 15 16 17 18 19 20
Sites 1-20
mea
n %
of
no
n-c
om
pli
an
ce
Figure 4: Scaffolding overall mean percentage level of non-compliance for variables
(1-14) on sites 1-20.
Figure 5
Scaffolding, handrail and midrail mean percentage level of non-compliance on
sites 1-20.
0
1
2
3
4
5
6
1 2 3 4 5 6 7 8 9 10 11 12 13 14 15 16 17 18 19 20
Sites 1-20
mea
n %
of
no
n-c
om
pli
an
ce
Figure 5: Scaffolding handrail and midrail mean percentage level of non-compliance
on sites 1-20.

64
Figure 6
Scaffolding toe board mean percentage level of non-compliance on sites 1-20.
0
2
4
6
8
10
12
1 2 3 4 5 6 7 8 9 10 11 12 13 14 15 16 17 18 19 20
Sites 1-20
mea
n %
of
no
n-c
om
pli
an
ce
Figure 6: Scaffolding toe board mean percentage level of non-compliance on sites 1-
20.
4.2.2 Ladder access to Heights
Figure 7
Ladder access to heights overall mean percentage level of non-compliance,
variables 1-6 for sites 1-20
0
1
2
3
4
5
6
7
8
9
1 2 3 4 5 6 7 8 9 10 11 12 13 14 15 16 17 18 19 20
Sites 1-20
mea
n %
of
no
n-c
om
pli
an
ce
Figure 7: Ladder access to heights mean percentage level of non-compliance.
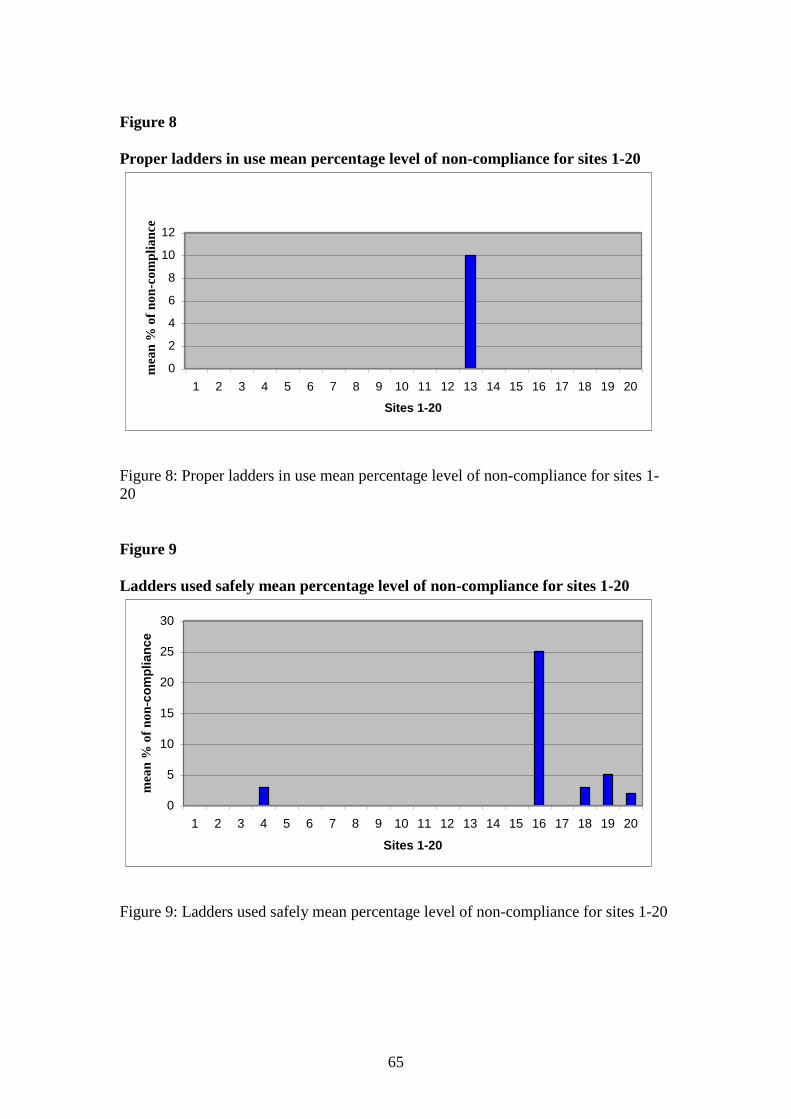
65
Figure 8
Proper ladders in use mean percentage level of non-compliance for sites 1-20
0
2
4
6
8
10
12
1 2 3 4 5 6 7 8 9 10 11 12 13 14 15 16 17 18 19 20
Sites 1-20
mea
n %
of
no
n-c
om
pli
an
ce
Figure 8: Proper ladders in use mean percentage level of non-compliance for sites 1-
20
Figure 9
Ladders used safely mean percentage level of non-compliance for sites 1-20
0
5
10
15
20
25
30
1 2 3 4 5 6 7 8 9 10 11 12 13 14 15 16 17 18 19 20
Sites 1-20
mea
n %
of
no
n- c
om
pli
an
ce
Figure 9: Ladders used safely mean percentage level of non-compliance for sites 1-20

66
Figure 10
Ladder positioned properly and extended 1 meter above landing mean
percentage level of non-compliance for sites 1-20.
0
1
2
3
4
5
6
1 2 3 4 5 6 7 8 9 10 11 12 13 14 15 16 17 18 19 20
Sites 1-20
mea
n %
of
no
n- c
om
pli
an
ce
Figure 10: Ladder positioned properly and extended 1 meter above landing mean
percentage level of non-compliance for sites 1-20
Figure 11
Ladders secured properly mean percentage level of non-compliance for sites 1-20
0
5
10
15
20
25
30
1 2 3 4 5 6 7 8 9 10 11 12 13 14 15 16 17 18 19 20
Sites 1-20
mea
n %
of
no
n- c
om
plian
ce
Figure 11: Ladders secured properly mean percentage level of non-compliance for
sites 1-20.
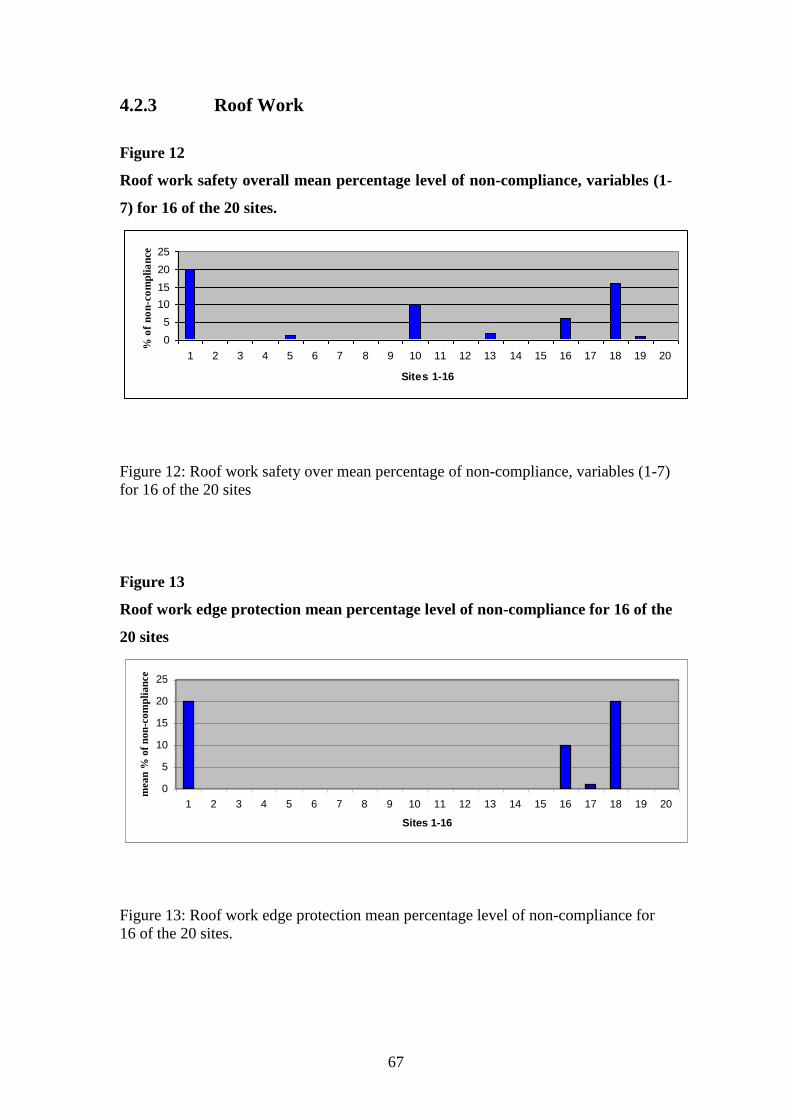
67
4.2.3 Roof Work
Figure 12
Roof work safety overall mean percentage level of non-compliance, variables (1-
7) for 16 of the 20 sites.
0
5
10
15
20
25
1 2 3 4 5 6 7 8 9 10 11 12 13 14 15 16 17 18 19 20
Sites 1-16
% o
f n
on
-co
mp
lia
nce
Figure 12: Roof work safety over mean percentage of non-compliance, variables (1-7)
for 16 of the 20 sites
Figure 13
Roof work edge protection mean percentage level of non-compliance for 16 of the
20 sites
0
5
10
15
20
25
1 2 3 4 5 6 7 8 9 10 11 12 13 14 15 16 17 18 19 20
Sites 1-16
mea
n %
of
no
n-c
om
pli
an
ce
Figure 13: Roof work edge protection mean percentage level of non-compliance for
16 of the 20 sites.

68
Figure 14
Roof work guardrails mean percentage level of non-compliance for 16 of the 20
sites.
0
5
10
15
20
25
1 2 3 4 5 6 7 8 9 10 11 12 13 14 15 16 17 18 19 20
Sites 1-16
mea
n %
of
no
n-c
om
pli
an
ce
Figure 14: Roof work guardrails mean percentage level of non-compliance for 16 of
the 20 sites.
Figure 15
Roof work safety harness being clipped on when aloft mean percentage level of
non-compliance for 8 of the 20 sites.
0
5
10
15
20
25
1 2 3 4 5 6 7 8 9 10 11 12 13 14 15 16 17 18 19 20
Sites 1-8
mea
n %
of
no
n-c
om
pli
an
ce
Figure 15: Roof work safety harness being clipped on when aloft mean percentage
level of non-compliance for 8 of the 20 sites.

69
4.2.4 Mobile Elevated Work Platform
Figure 16
MEWPs harness being clipped on when aloft mean percentage level of non-
compliance for 4 out of 20 sites where MEWPs were being used.
0
20
40
60
80
100
120
1 2 3 4 5 6 7 8 9 10 11 12 13 14 15 16 17 18 19
Sites 1-4
mea
n %
of
no
n-c
om
pli
an
ce
Figure 16: MEWPs harness being clipped on when aloft mean percentage level of
non-compliance for 4 of the 20 sites.
4.2.5 Workplace access
Figure 17
Workplace access floor edges & openings protected mean percentage level of
non-compliance for sites 1-20
0
2
4
6
8
10
12
1 2 3 4 5 6 7 8 9 10 11 12 13 14 15 16 17 18 19 20
Sites 1-20
mea
n %
of
no
n-c
om
pli
an
ce
Figure 32: Workplace access floor edges & openings protected mean percentage level
of non-compliance for sites 1- 20

70
4.3 Housekeeping safety compliance summary
Figure 8 shows the mean percentage of non-compliance for safety compliance for
housekeeping for sites 1-20.
Figure 18
Housekeeping overall mean percentage level of non-compliance for sites 1-20
0
5
10
15
20
25
30
1 2 3 4 5 6 7 8 9 10 11 12 13 14 15 16 17 18 19 20
Sites 1-20
mea
n %
of
no
n-c
om
pli
an
ce
Figure 18: Housekeeping mean percentage level of non-compliance for housekeeping
for sites 1-20
Table 41
Summary of housekeeping mean percentage level of non-compliance for sites
1-20
No of sites Level of non-compliance
0 Complete compliance
10 Low
6 Medium
3 High
1 Very high
In relative terms housekeeping was the least compliant area for safety compliance.
The level of housekeeping for all the housekeeping variables was variable ranging
from low to a very high level of non-compliance None of the twenty sites were fully
compliant. Only ten (50%) out of twenty sites had a low level of non- compliance. Six
(30%) out of twenty sites had a medium level of non-compliance of 5%-9% non-
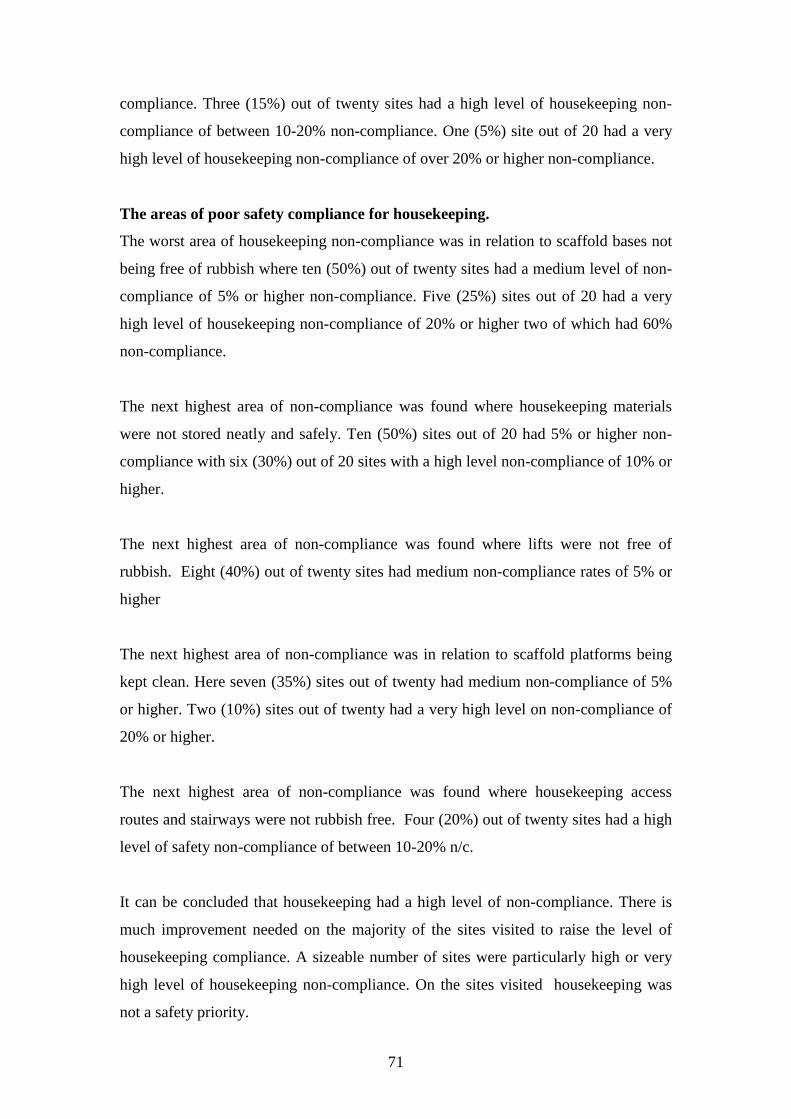
71
compliance. Three (15%) out of twenty sites had a high level of housekeeping non-
compliance of between 10-20% non-compliance. One (5%) site out of 20 had a very
high level of housekeeping non-compliance of over 20% or higher non-compliance.
The areas of poor safety compliance for housekeeping.
The worst area of housekeeping non-compliance was in relation to scaffold bases not
being free of rubbish where ten (50%) out of twenty sites had a medium level of non-
compliance of 5% or higher non-compliance. Five (25%) sites out of 20 had a very
high level of housekeeping non-compliance of 20% or higher two of which had 60%
non-compliance.
The next highest area of non-compliance was found where housekeeping materials
were not stored neatly and safely. Ten (50%) sites out of 20 had 5% or higher non-
compliance with six (30%) out of 20 sites with a high level non-compliance of 10% or
higher.
The next highest area of non-compliance was found where lifts were not free of
rubbish. Eight (40%) out of twenty sites had medium non-compliance rates of 5% or
higher
The next highest area of non-compliance was in relation to scaffold platforms being
kept clean. Here seven (35%) sites out of twenty had medium non-compliance of 5%
or higher. Two (10%) sites out of twenty had a very high level on non-compliance of
20% or higher.
The next highest area of non-compliance was found where housekeeping access
routes and stairways were not rubbish free. Four (20%) out of twenty sites had a high
level of safety non-compliance of between 10-20% n/c.
It can be concluded that housekeeping had a high level of non-compliance. There is
much improvement needed on the majority of the sites visited to raise the level of
housekeeping compliance. A sizeable number of sites were particularly high or very
high level of housekeeping non-compliance. On the sites visited housekeeping was
not a safety priority.
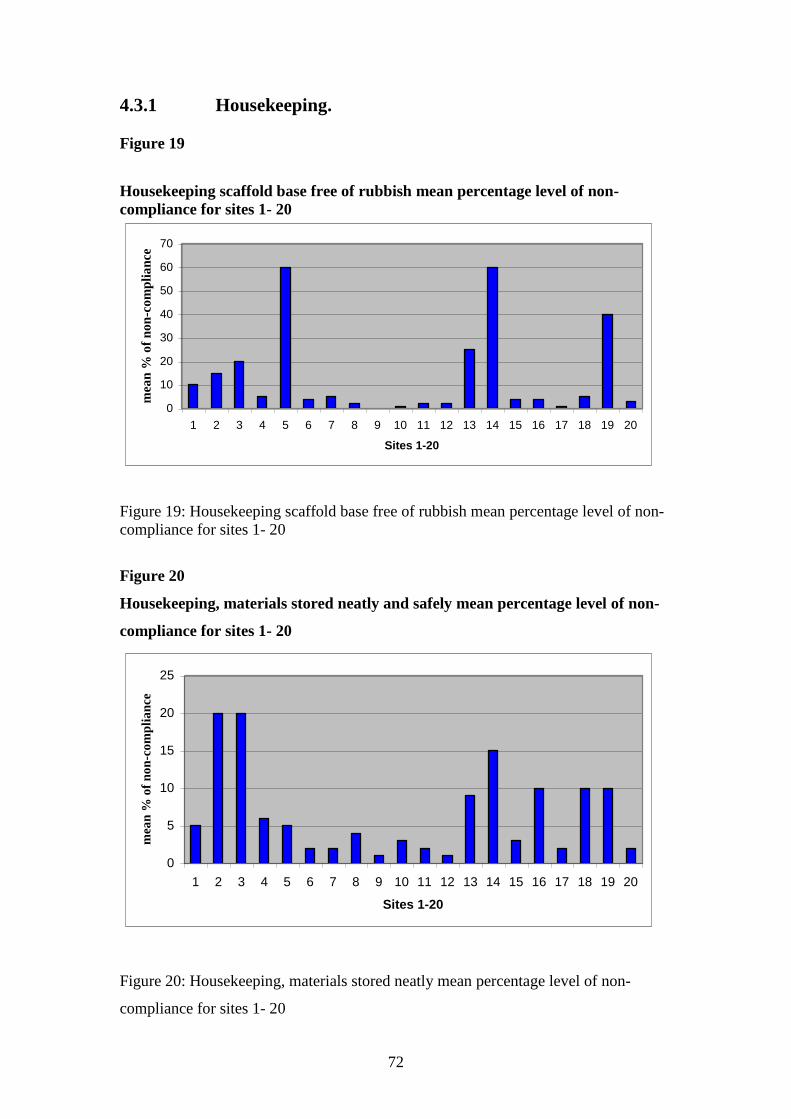
72
4.3.1 Housekeeping.
Figure 19
Housekeeping scaffold base free of rubbish mean percentage level of non-
compliance for sites 1- 20
0
10
20
30
40
50
60
70
1 2 3 4 5 6 7 8 9 10 11 12 13 14 15 16 17 18 19 20
Sites 1-20
mea
n %
of
no
n-c
om
pli
an
ce
Figure 19: Housekeeping scaffold base free of rubbish mean percentage level of non-
compliance for sites 1- 20
Figure 20
Housekeeping, materials stored neatly and safely mean percentage level of non-
compliance for sites 1- 20
0
5
10
15
20
25
1 2 3 4 5 6 7 8 9 10 11 12 13 14 15 16 17 18 19 20
Sites 1-20
mea
n %
of
no
n-c
om
pli
an
ce
Figure 20: Housekeeping, materials stored neatly mean percentage level of non-
compliance for sites 1- 20
73
Figure 21
Housekeeping, scaffold lifts rubbish free mean percentage level of non-compliance
for sites 1- 20
0
5
10
15
20
25
30
35
40
45
1 2 3 4 5 6 7 8 9 10 11 12 13 14 15 16 17 18 19 20
Site 1-20
mea
n %
of
no
n-c
om
pli
an
ce
Figure 21: Housekeeping, scaffold lifts rubbish mean percentage level of non-
compliance for sites 1- 20
Figure 22
Housekeeping all access routes & stairways rubbish free mean percentage level
of non-compliance for sites 1- 20
0
5
10
15
20
25
1 2 3 4 5 6 7 8 9 10 11 12 13 14 15 16 17 18 19 20
Site 1-20
mea
n %
of
no
n-c
om
pli
an
ce
Figure 22: Housekeeping all access routes & stairways rubbish free mean percentage
level of non-compliance for sites 1- 20
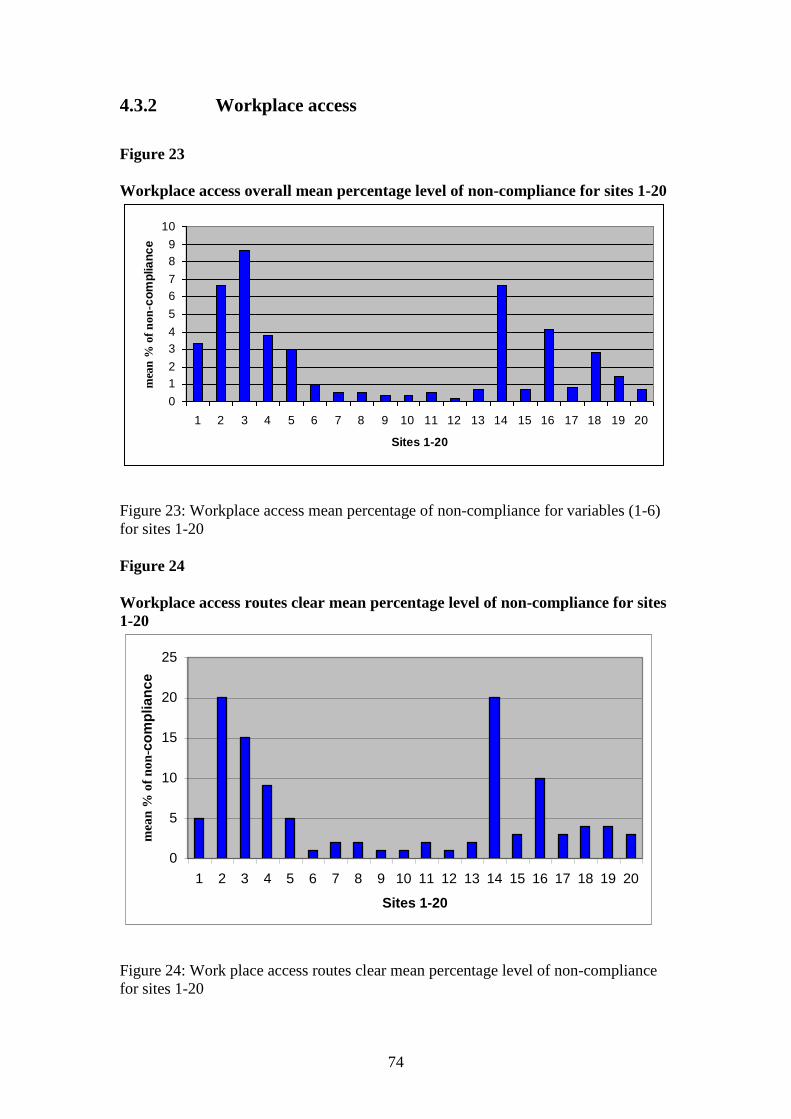
74
4.3.2 Workplace access
Figure 23
Workplace access overall mean percentage level of non-compliance for sites 1-20
0
1
2
3
4
5
6
7
8
9
10
1 2 3 4 5 6 7 8 9 10 11 12 13 14 15 16 17 18 19 20
Sites 1-20
mea
n %
of
no
n-c
om
plia
nc
e
Figure 23: Workplace access mean percentage of non-compliance for variables (1-6)
for sites 1-20
Figure 24
Workplace access routes clear mean percentage level of non-compliance for sites
1-20
0
5
10
15
20
25
1 2 3 4 5 6 7 8 9 10 11 12 13 14 15 16 17 18 19 20
Sites 1-20
mea
n %
of
no
n- c
om
plia
nc
e
Figure 24: Work place access routes clear mean percentage level of non-compliance
for sites 1-20
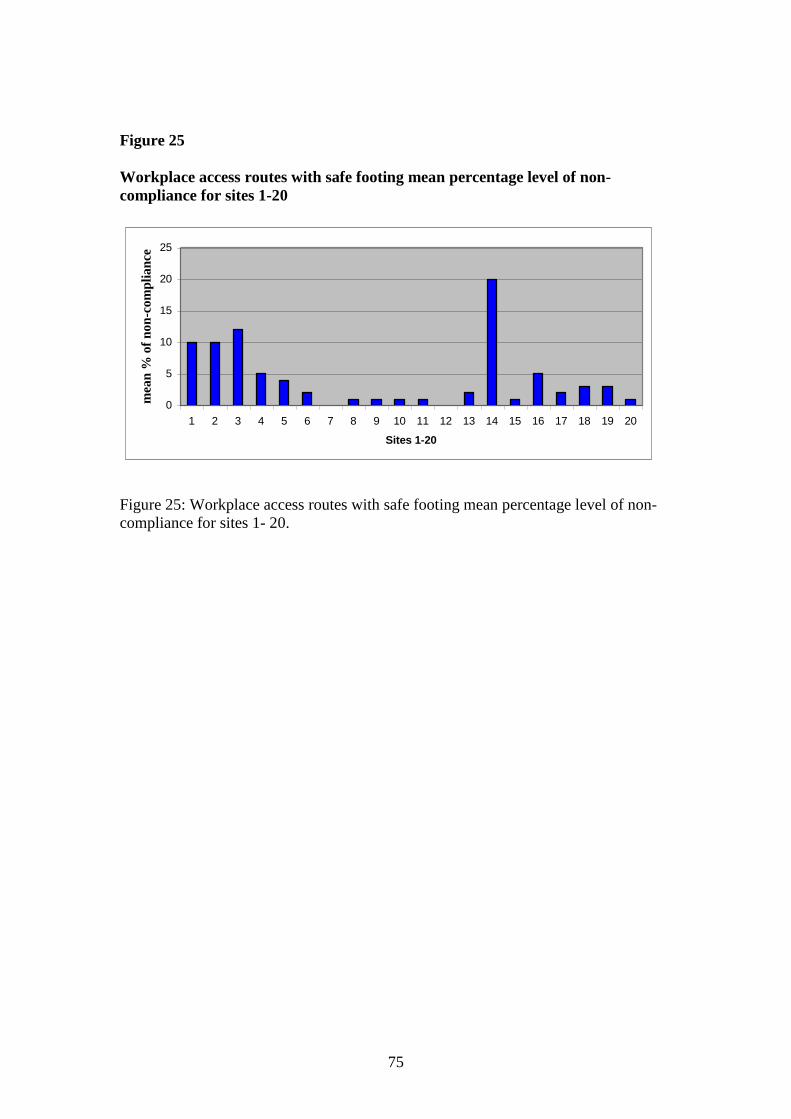
75
Figure 25
Workplace access routes with safe footing mean percentage level of non-
compliance for sites 1-20
0
5
10
15
20
25
1 2 3 4 5 6 7 8 9 10 11 12 13 14 15 16 17 18 19 20
Sites 1-20
mea
n %
of
no
n-c
om
pli
an
ce
Figure 25: Workplace access routes with safe footing mean percentage level of non-
compliance for sites 1- 20.
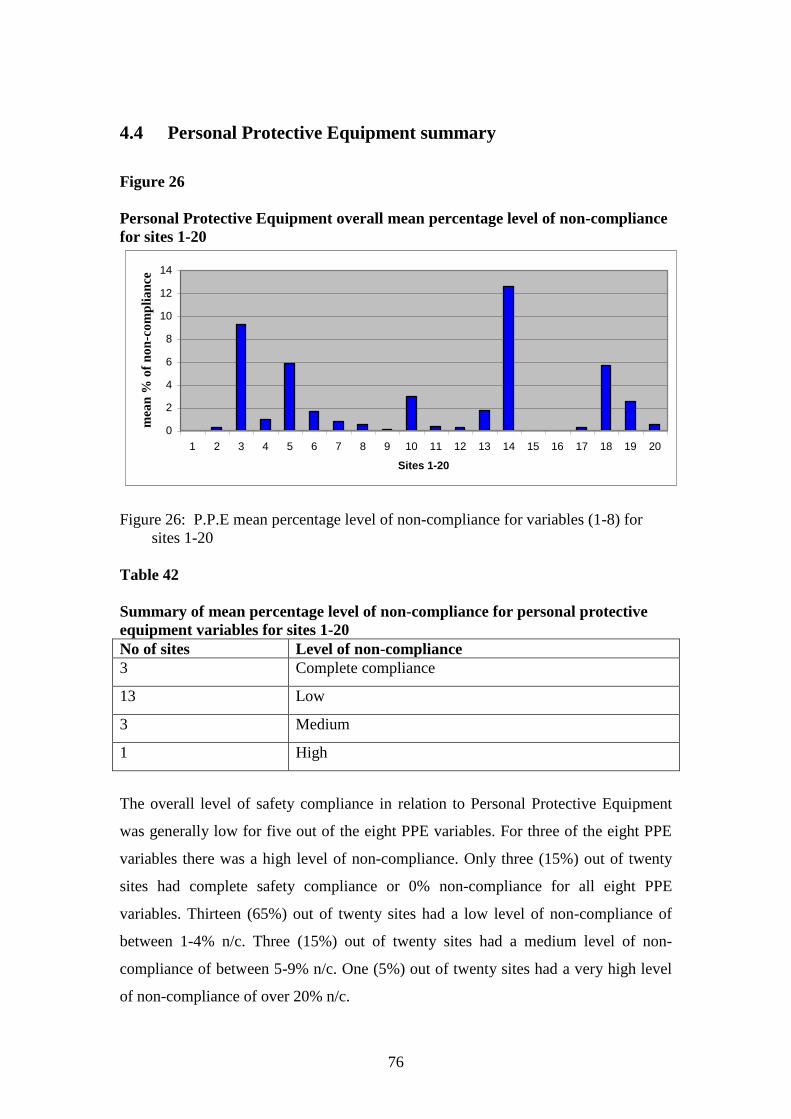
76
4.4 Personal Protective Equipment summary
Figure 26
Personal Protective Equipment overall mean percentage level of non-compliance
for sites 1-20
0
2
4
6
8
10
12
14
1 2 3 4 5 6 7 8 9 10 11 12 13 14 15 16 17 18 19 20
Sites 1-20
mea
n %
of
no
n-c
om
pli
an
ce
Figure 26: P.P.E mean percentage level of non-compliance for variables (1-8) for
sites 1-20
Table 42
Summary of mean percentage level of non-compliance for personal protective
equipment variables for sites 1-20
No of sites Level of non-compliance
3 Complete compliance
13 Low
3 Medium
1 High
The overall level of safety compliance in relation to Personal Protective Equipment
was generally low for five out of the eight PPE variables. For three of the eight PPE
variables there was a high level of non-compliance. Only three (15%) out of twenty
sites had complete safety compliance or 0% non-compliance for all eight PPE
variables. Thirteen (65%) out of twenty sites had a low level of non-compliance of
between 1-4% n/c. Three (15%) out of twenty sites had a medium level of non-
compliance of between 5-9% n/c. One (5%) out of twenty sites had a very high level
of non-compliance of over 20% n/c.
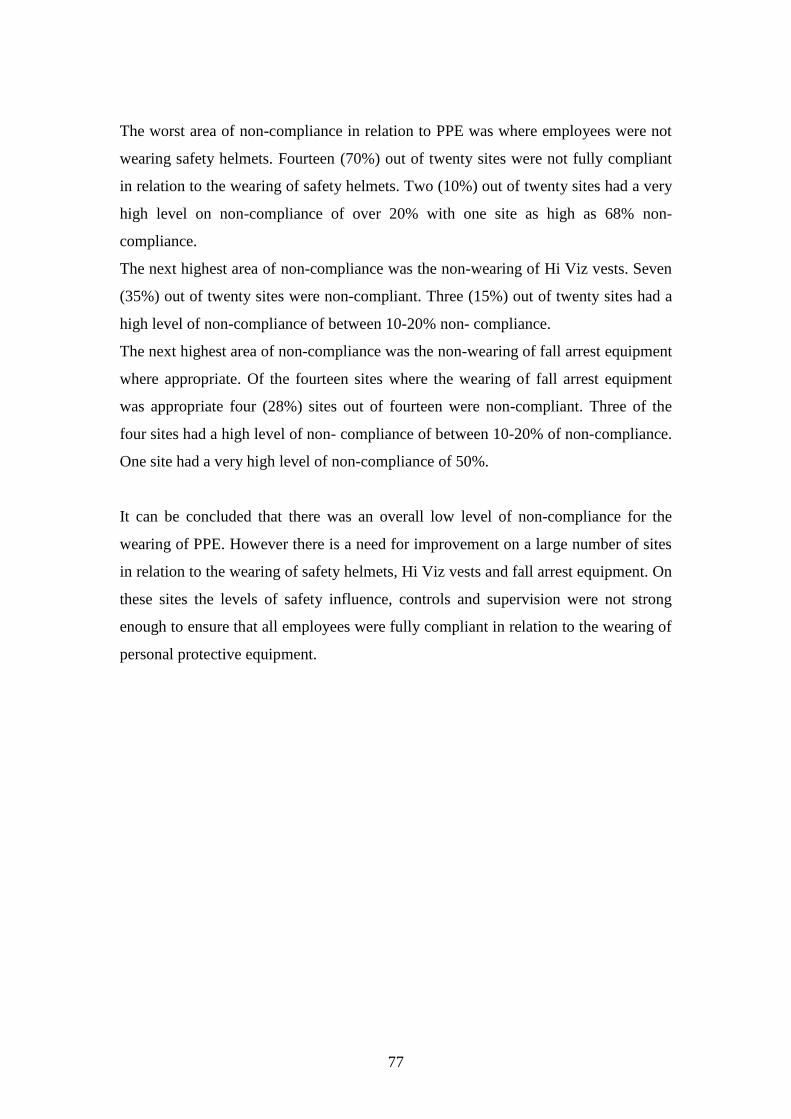
77
The worst area of non-compliance in relation to PPE was where employees were not
wearing safety helmets. Fourteen (70%) out of twenty sites were not fully compliant
in relation to the wearing of safety helmets. Two (10%) out of twenty sites had a very
high level on non-compliance of over 20% with one site as high as 68% non-
compliance.
The next highest area of non-compliance was the non-wearing of Hi Viz vests. Seven
(35%) out of twenty sites were non-compliant. Three (15%) out of twenty sites had a
high level of non-compliance of between 10-20% non- compliance.
The next highest area of non-compliance was the non-wearing of fall arrest equipment
where appropriate. Of the fourteen sites where the wearing of fall arrest equipment
was appropriate four (28%) sites out of fourteen were non-compliant. Three of the
four sites had a high level of non- compliance of between 10-20% of non-compliance.
One site had a very high level of non-compliance of 50%.
It can be concluded that there was an overall low level of non-compliance for the
wearing of PPE. However there is a need for improvement on a large number of sites
in relation to the wearing of safety helmets, Hi Viz vests and fall arrest equipment. On
these sites the levels of safety influence, controls and supervision were not strong
enough to ensure that all employees were fully compliant in relation to the wearing of
personal protective equipment.
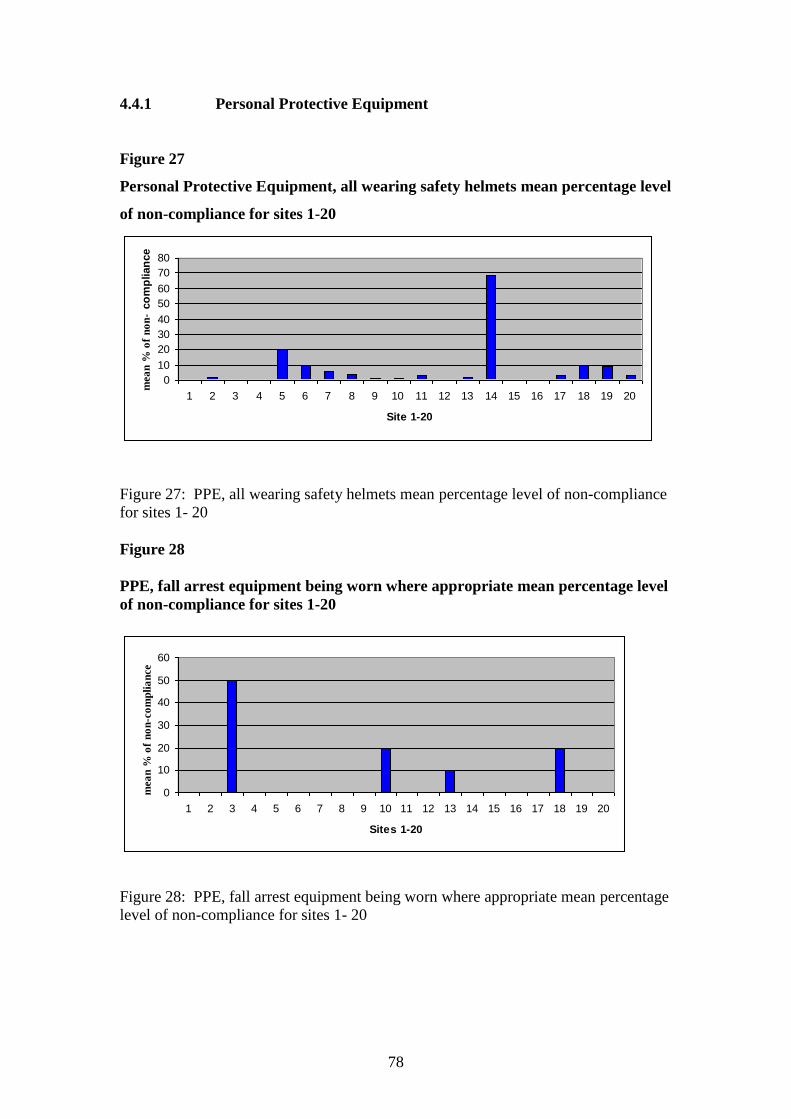
78
4.4.1 Personal Protective Equipment
Figure 27
Personal Protective Equipment, all wearing safety helmets mean percentage level
of non-compliance for sites 1-20
0
10
20
30
40
50
60
70
80
1 2 3 4 5 6 7 8 9 10 11 12 13 14 15 16 17 18 19 20
Site 1-20
mea
n %
of
no
n-
co
mp
lian
ce
Figure 27: PPE, all wearing safety helmets mean percentage level of non-compliance
for sites 1- 20
Figure 28
PPE, fall arrest equipment being worn where appropriate mean percentage level
of non-compliance for sites 1-20
0
10
20
30
40
50
60
1 2 3 4 5 6 7 8 9 10 11 12 13 14 15 16 17 18 19 20
Sites 1-20
mea
n %
of
no
n-c
om
pli
an
ce
Figure 28: PPE, fall arrest equipment being worn where appropriate mean percentage
level of non-compliance for sites 1- 20
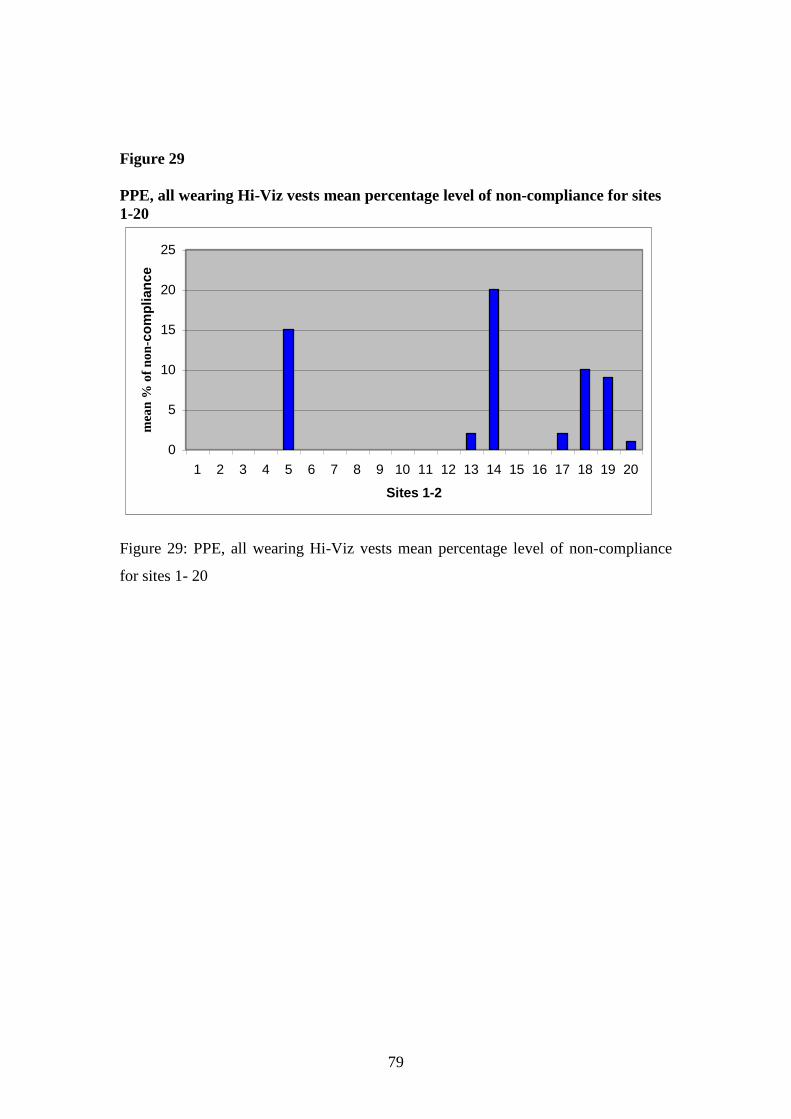
79
Figure 29
PPE, all wearing Hi-Viz vests mean percentage level of non-compliance for sites
1-20
0
5
10
15
20
25
1 2 3 4 5 6 7 8 9 10 11 12 13 14 15 16 17 18 19 20
Sites 1-2
mea
n %
of
no
n- c
om
pli
an
ce
Figure 29: PPE, all wearing Hi-Viz vests mean percentage level of non-compliance
for sites 1- 20
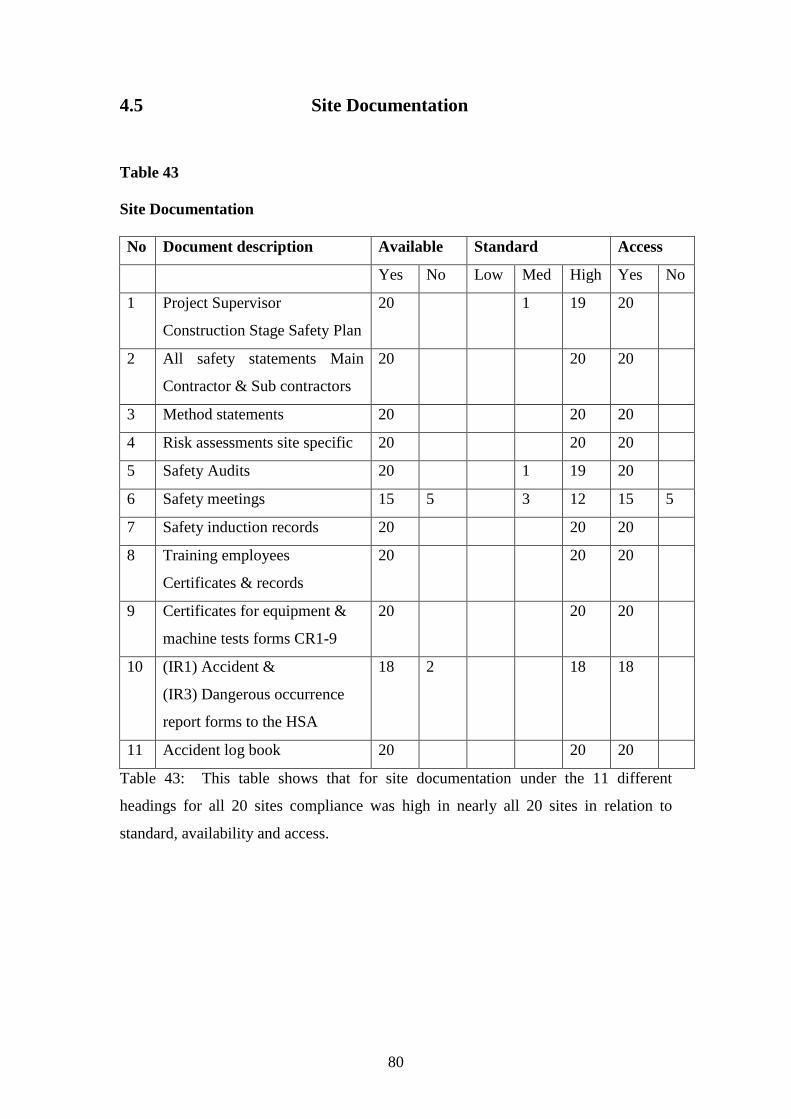
80
4.5 Site Documentation
Table 43
Site Documentation
No Document description Available Standard Access
Yes No Low Med High Yes No
1 Project Supervisor
Construction Stage Safety Plan
20 1 19 20
2 All safety statements Main
Contractor & Sub contractors
20 20 20
3 Method statements 20 20 20
4 Risk assessments site specific 20 20 20
5 Safety Audits 20 1 19 20
6 Safety meetings 15 5 3 12 15 5
7 Safety induction records 20 20 20
8 Training employees
Certificates & records
20 20 20
9 Certificates for equipment &
machine tests forms CR1-9
20 20 20
10 (IR1) Accident &
(IR3) Dangerous occurrence
report forms to the HSA
18 2 18 18
11 Accident log book 20 20 20
Table 43: This table shows that for site documentation under the 11 different
headings for all 20 sites compliance was high in nearly all 20 sites in relation to
standard, availability and access.
81
4.6 Site Management Summary
The number of interviewee‘s interviewed was forty five.
Overall site safety management as perceived by the interviewees was assessed using
the following eleven items using a low, medium and high scale. These eleven items
were,
Concrete plan of action to handle safety?
The company is concerned about operatives, subcontractors‘ training
/competence at the recruitment stage?
The company is concerned about managers/supervisors' competence at the
time of recruitment?
The company provides ongoing training to operatives?
The company provides ongoing training for managers & supervisors?
Frequency of audits carried out in the company?
Effectiveness of audits to redirect organisational action?
H.S.A. Inspections?
The quality of communication about safety in the workplace?
The assumption of responsibility by the main contractor for all safety in the
workplace?
Co-operation between the main contractor and sub-contractors?
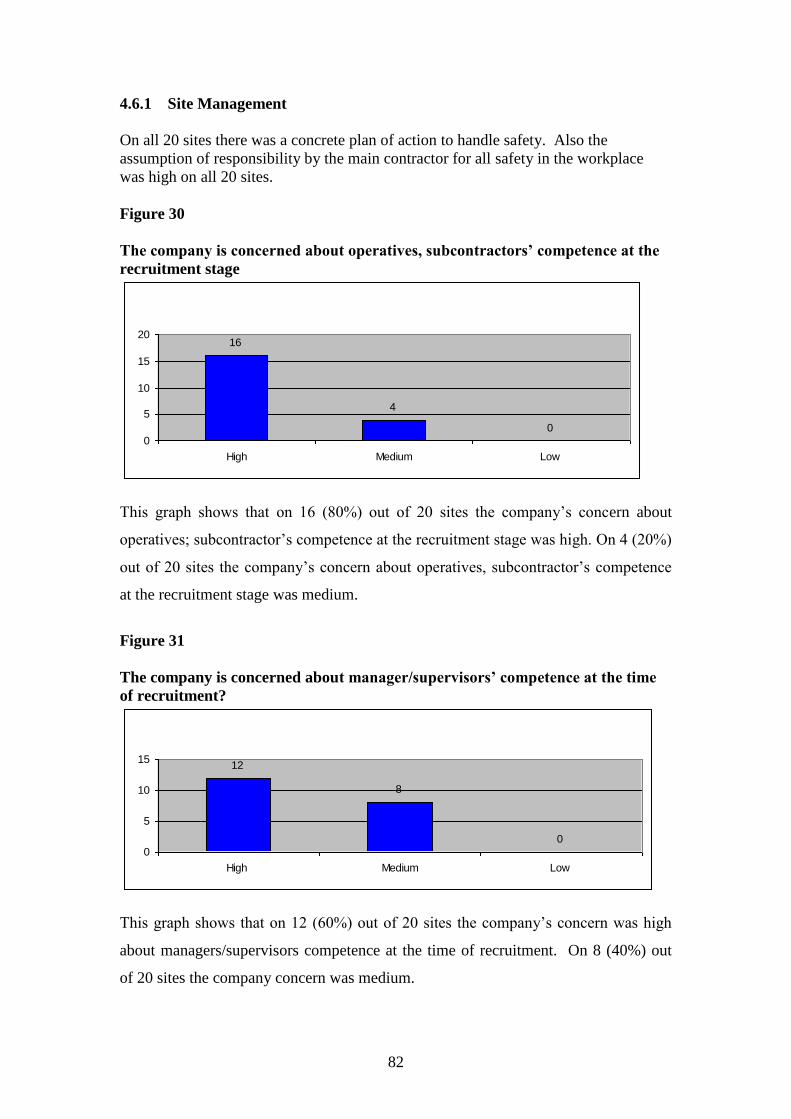
82
4.6.1 Site Management
On all 20 sites there was a concrete plan of action to handle safety. Also the
assumption of responsibility by the main contractor for all safety in the workplace
was high on all 20 sites.
Figure 30
The company is concerned about operatives, subcontractors’ competence at the
recruitment stage
16
4
0
0
5
10
15
20
High Medium Low
This graph shows that on 16 (80%) out of 20 sites the company‘s concern about
operatives; subcontractor‘s competence at the recruitment stage was high. On 4 (20%)
out of 20 sites the company‘s concern about operatives, subcontractor‘s competence
at the recruitment stage was medium.
Figure 31
The company is concerned about manager/supervisors’ competence at the time
of recruitment?
12
8
0
0
5
10
15
High Medium Low
This graph shows that on 12 (60%) out of 20 sites the company‘s concern was high
about managers/supervisors competence at the time of recruitment. On 8 (40%) out
of 20 sites the company concern was medium.

83
Figure 32
The company provides ongoing training to operatives
11
9
00
2
4
6
8
10
12
High Medium Low
This graph shows that on 11 (55%) out of 20 sites the company provides ongoing
training to operatives to a high standard. On 9 (45%) out 20 sites the standard was
medium.
Figure 33
The company provides ongoing training for managers & supervisors
9
0
11
0
2
4
6
8
10
12
High Medium Low
This graph shows that on 11 (55%) out of 20 sites the company provides ongoing
training for managers & supervisors to a high standard. On 9 (45%) out of 20 sites
the standard of ongoing training provided by the company for managers & supervisors
was medium.
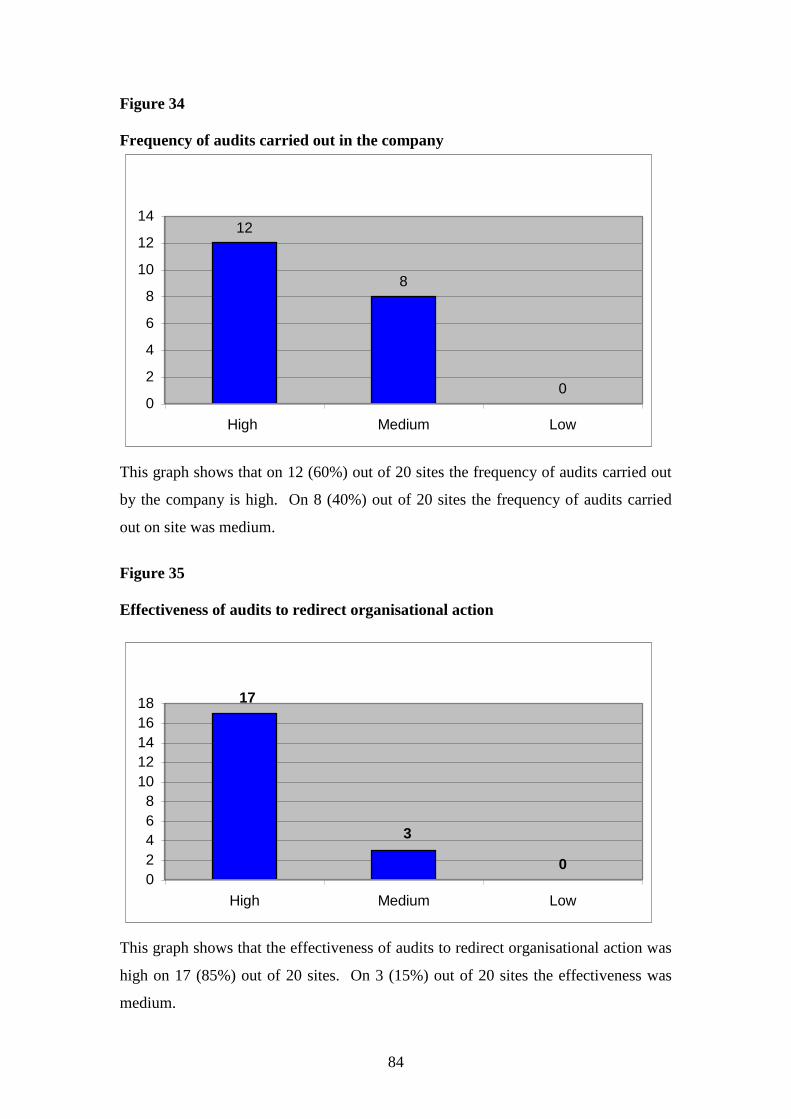
84
Figure 34
Frequency of audits carried out in the company
12
8
00
2
4
6
8
10
12
14
High Medium Low
This graph shows that on 12 (60%) out of 20 sites the frequency of audits carried out
by the company is high. On 8 (40%) out of 20 sites the frequency of audits carried
out on site was medium.
Figure 35
Effectiveness of audits to redirect organisational action
3
0
17
0
2
4
6
8
10
12
14
16
18
High Medium Low
This graph shows that the effectiveness of audits to redirect organisational action was
high on 17 (85%) out of 20 sites. On 3 (15%) out of 20 sites the effectiveness was
medium.
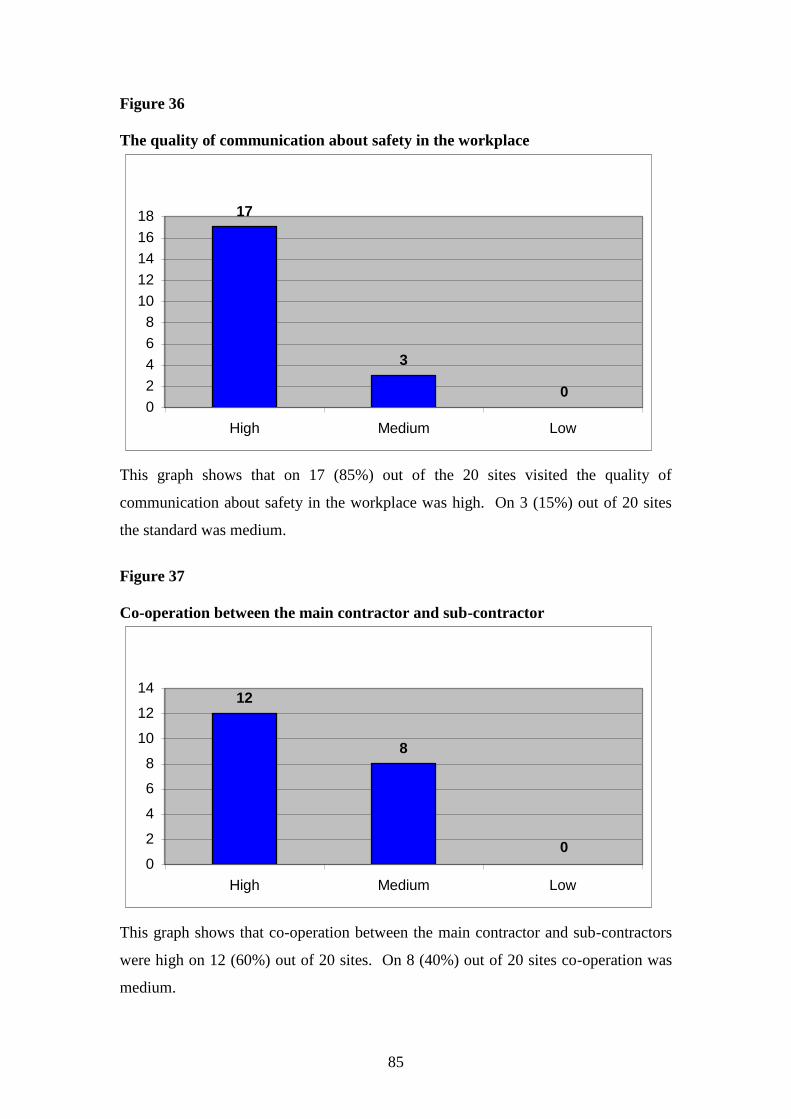
85
Figure 36
The quality of communication about safety in the workplace
0
3
17
0
2
4
6
8
10
12
14
16
18
High Medium Low
This graph shows that on 17 (85%) out of the 20 sites visited the quality of
communication about safety in the workplace was high. On 3 (15%) out of 20 sites
the standard was medium.
Figure 37
Co-operation between the main contractor and sub-contractor
0
8
12
0
2
4
6
8
10
12
14
High Medium Low
This graph shows that co-operation between the main contractor and sub-contractors
were high on 12 (60%) out of 20 sites. On 8 (40%) out of 20 sites co-operation was
medium.

86
4.7 Interviewees Background
Figure 38
Gender of Interviewee
39
6
0
5
10
15
20
25
30
35
40
45
Male Female
This graph shows that of the 45 interviewees 39 (87%) were male and 6 (13%) were
female.
Figure 39
Age of interviewee
5
1011
19
0
2
4
6
8
10
12
14
16
18
20
20-30 yrs 31-40 yrs 41-50 yrs 51-60 yrs
This graph shows that the majority, 30 (67%) out of the 45 interviewees were under
40yrs. with 19 (42%) out of 45 interviewees under 30yrs.

87
Figure 40
Job title of interviewees
2
5
78
10
13
02468
101214
Pro
ject
Man
ager
Saf
ety
Offi
cer
Site
Eng
inee
r
Forem
anSaf
ety
Rep
rese
ntat
ive
Qua
ntity
Sur
veyo
r
This graphs shows that out of the 45 interviewees the majority 13 (29%) were project
managers. The next largest group 10 (22%) were Safety Officers.
Figure 41
Interviewee training in health and safety
26
11
42 1
0
5
10
15
20
25
30
General health
& safety training
Cert in health &
safety
Diploma in
health & safety
Degree or
Masters in
health & safety
1st aid training
This graph shows that the majority of interviewees 26 (59%) received general health
and safety training, which included safe pass training, managing safely training. Six
out of forty five interviewee‘s had a high level of safety training of a Diploma or
Masters in health and safety.
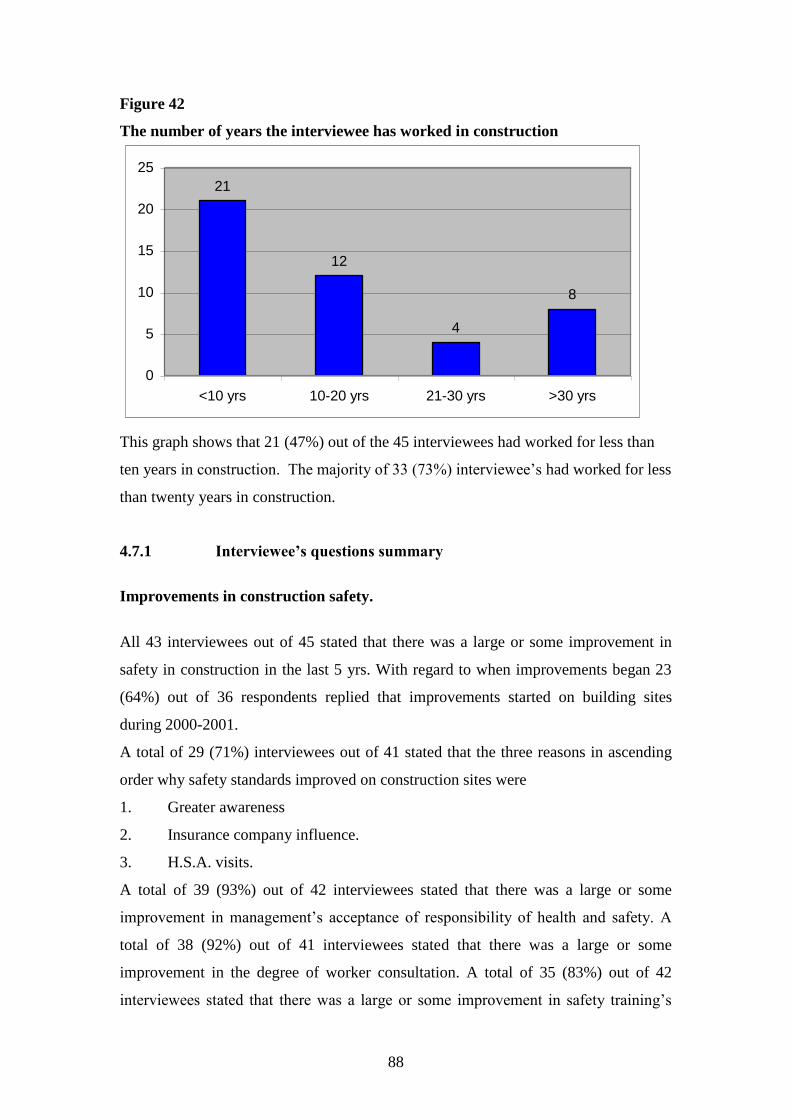
88
Figure 42
The number of years the interviewee has worked in construction
21
12
4
8
0
5
10
15
20
25
<10 yrs 10-20 yrs 21-30 yrs >30 yrs
This graph shows that 21 (47%) out of the 45 interviewees had worked for less than
ten years in construction. The majority of 33 (73%) interviewee‘s had worked for less
than twenty years in construction.
4.7.1 Interviewee’s questions summary
Improvements in construction safety.
All 43 interviewees out of 45 stated that there was a large or some improvement in
safety in construction in the last 5 yrs. With regard to when improvements began 23
(64%) out of 36 respondents replied that improvements started on building sites
during 2000-2001.
A total of 29 (71%) interviewees out of 41 stated that the three reasons in ascending
order why safety standards improved on construction sites were
1. Greater awareness
2. Insurance company influence.
3. H.S.A. visits.
A total of 39 (93%) out of 42 interviewees stated that there was a large or some
improvement in management‘s acceptance of responsibility of health and safety. A
total of 38 (92%) out of 41 interviewees stated that there was a large or some
improvement in the degree of worker consultation. A total of 35 (83%) out of 42
interviewees stated that there was a large or some improvement in safety training‘s

89
influence on safety in the construction industry. All 36 respondents stated that there
was a large or some improvement in the reporting of accidents.
However a total of 28 (68%) out of 41 interviewees stated that building designs have
made no change, little improvement and in some cases have got worse in regard to
being designed safer to build. Likewise a total of 25 (61%) out of 41 interviewees
stated that the client influence to improve safety had made little or no change or got a
little worse
4.7.2 Interviewee’s Questions
Figure 43
Has there been any improvement in safety in the construction industry in the last
5yrs?
30
13
0
5
10
15
20
25
30
35
Large Some
This graph shows that 30 (70%) interviewees stated that there was a large
improvement in safety in the construction industry in the last 5 yrs. Some
improvement was chosen by 13 (30%) interviewees.
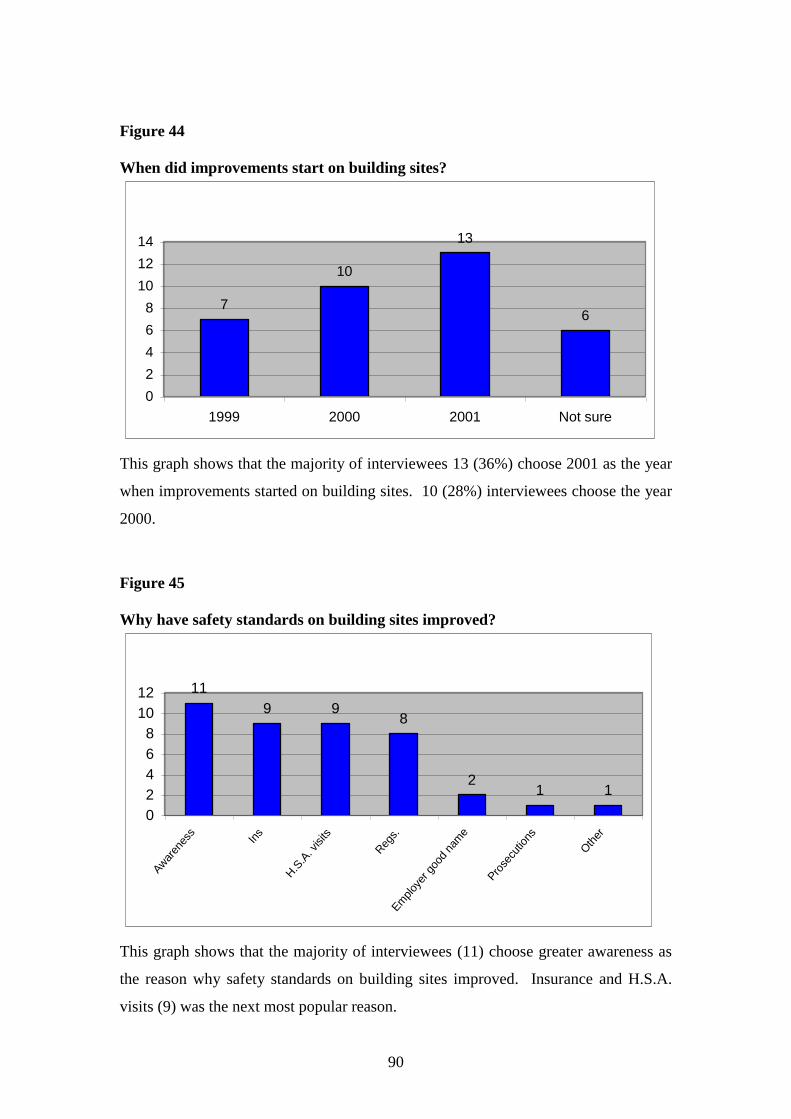
90
Figure 44
When did improvements start on building sites?
7
10
13
6
0
2
4
6
8
10
12
14
1999 2000 2001 Not sure
This graph shows that the majority of interviewees 13 (36%) choose 2001 as the year
when improvements started on building sites. 10 (28%) interviewees choose the year
2000.
Figure 45
Why have safety standards on building sites improved?
11
9 98
21 1
0
2
4
6
8
10
12
Awar
enes
s
Ins
H.S
.A. v
isits
Reg
s.Em
ploy
er g
ood
nam
e
Pro
secu
tions
Oth
er
This graph shows that the majority of interviewees (11) choose greater awareness as
the reason why safety standards on building sites improved. Insurance and H.S.A.
visits (9) was the next most popular reason.

91
Figure 46
Are building designs safer to construct?
2
57
8
19
02468
101214161820
No change Some
improvement
Little
improvement
Large
improvement
Little worse
This graph shows that the majority of interviewees (19) choose that there was no
change to making building designs safer to construct. 2 interviewees stated that
building designs are now a little worse.
Figure 47
Acceptance of responsibility for Health & Safety by management
12
11
28
0
5
10
15
20
25
30
Large
improvement
Some
improvement
Little
improvement
No change
This graph shows that the majority of interviewees (28) chose a large improvement in
safety management‘s acceptance of responsibility for Health & Safety. Some
improvement was chosen by 11 interviews.
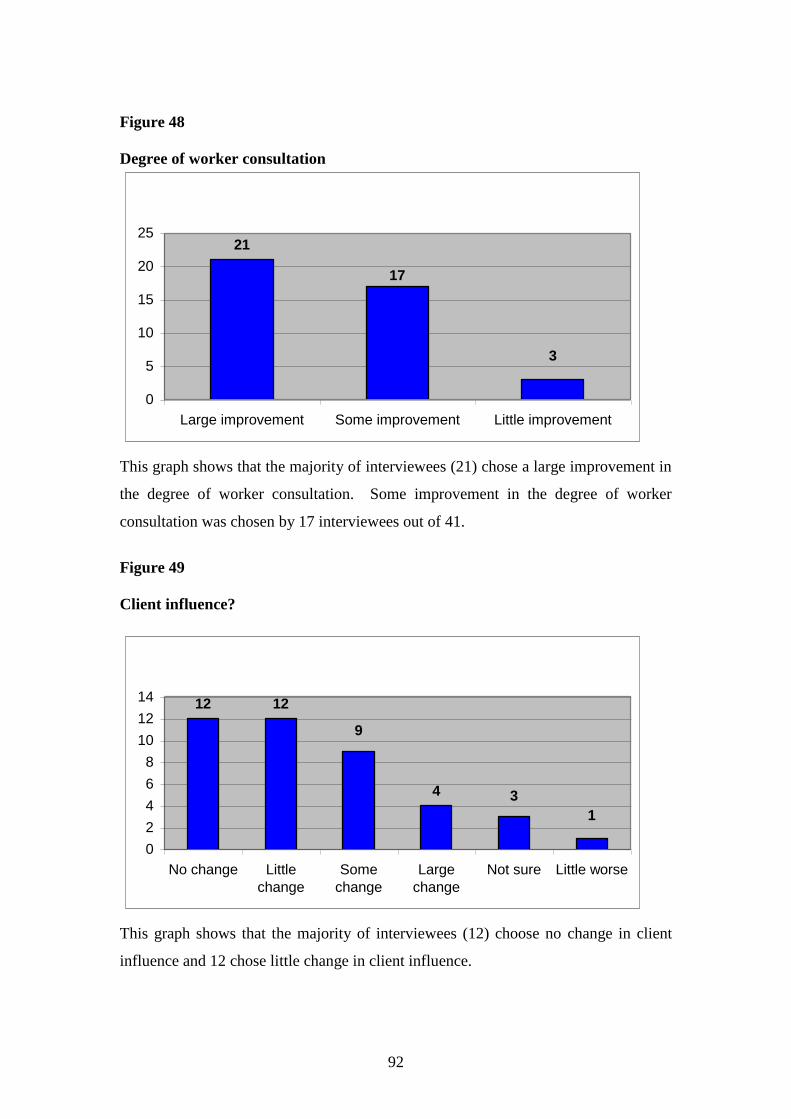
92
Figure 48
Degree of worker consultation
3
17
21
0
5
10
15
20
25
Large improvement Some improvement Little improvement
This graph shows that the majority of interviewees (21) chose a large improvement in
the degree of worker consultation. Some improvement in the degree of worker
consultation was chosen by 17 interviewees out of 41.
Figure 49
Client influence?
1
34
9
1212
0
2
4
6
8
10
12
14
No change Little
change
Some
change
Large
change
Not sure Little worse
This graph shows that the majority of interviewees (12) choose no change in client
influence and 12 chose little change in client influence.
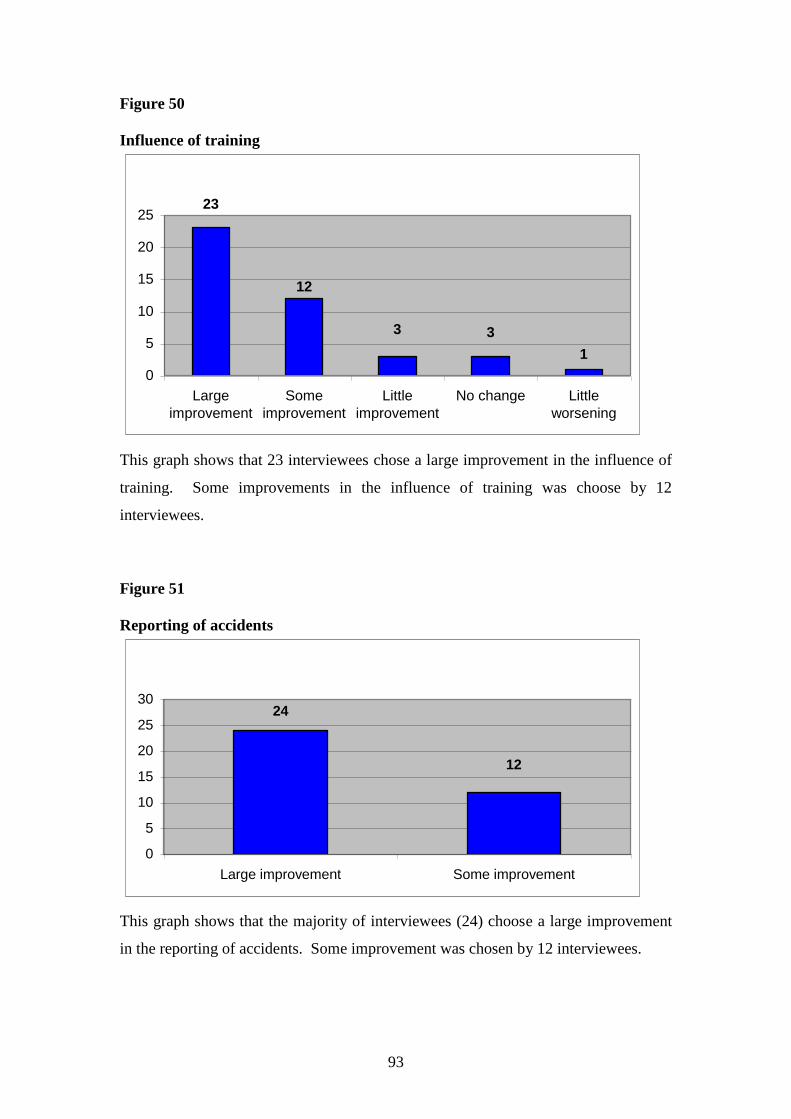
93
Figure 50
Influence of training
1
33
12
23
0
5
10
15
20
25
Large
improvement
Some
improvement
Little
improvement
No change Little
worsening
This graph shows that 23 interviewees chose a large improvement in the influence of
training. Some improvements in the influence of training was choose by 12
interviewees.
Figure 51
Reporting of accidents
12
24
0
5
10
15
20
25
30
Large improvement Some improvement
This graph shows that the majority of interviewees (24) choose a large improvement
in the reporting of accidents. Some improvement was chosen by 12 interviewees.

94
4.7.3 Interviewee’s suggestions to improve safety.
The majority or 42% of interviewees suggested training as the best way to improve
safety. Secondly improving safety awareness was suggested by 24% of interviewees.
Thirdly it was suggested by 18% of interviewees that the (PSDS) project supervisor
design stage design out hazards at the design stage.
Figure 52
Interviewee’s suggestions to improve safety.
19
108
6 5 4 3 3 2 2 2 2
02468
101214161820
Training
Awar
enes
s im
prov
e
PSD
S des
ign
out H
az
Com
mun
icat
ion
Red
uce
Paper
wor
k
Lang
uage
bar
rier
H.S
.A. I
nspe
ctions
H.S
.A E
nfor
cem
ent
Sm
aller s
ites at
tent
ion
Finan
cial in
cent
ive
Clie
nt
H.S
.A. c
larit
y
This graph shows the interviewees suggestions to improve safety. The majority of
interviewees suggested training as the best way to improve safety.
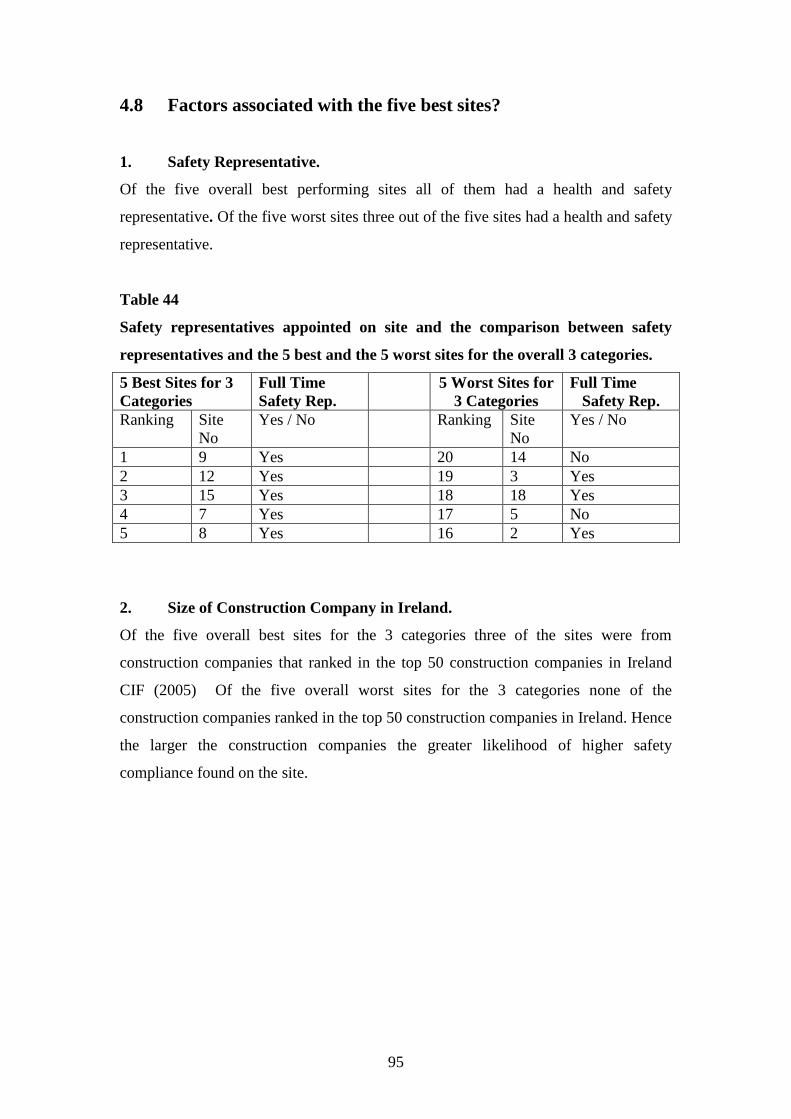
95
4.8 Factors associated with the five best sites?
1. Safety Representative.
Of the five overall best performing sites all of them had a health and safety
representative. Of the five worst sites three out of the five sites had a health and safety
representative.
Table 44
Safety representatives appointed on site and the comparison between safety
representatives and the 5 best and the 5 worst sites for the overall 3 categories.
5 Best Sites for 3
Categories
Full Time
Safety Rep.
5 Worst Sites for
3 Categories
Full Time
Safety Rep.
Ranking Site
No
Yes / No Ranking Site
No
Yes / No
1 9 Yes 20 14 No
2 12 Yes 19 3 Yes
3 15 Yes 18 18 Yes
4 7 Yes 17 5 No
5 8 Yes 16 2 Yes
2. Size of Construction Company in Ireland.
Of the five overall best sites for the 3 categories three of the sites were from
construction companies that ranked in the top 50 construction companies in Ireland
CIF (2005) Of the five overall worst sites for the 3 categories none of the
construction companies ranked in the top 50 construction companies in Ireland. Hence
the larger the construction companies the greater likelihood of higher safety
compliance found on the site.
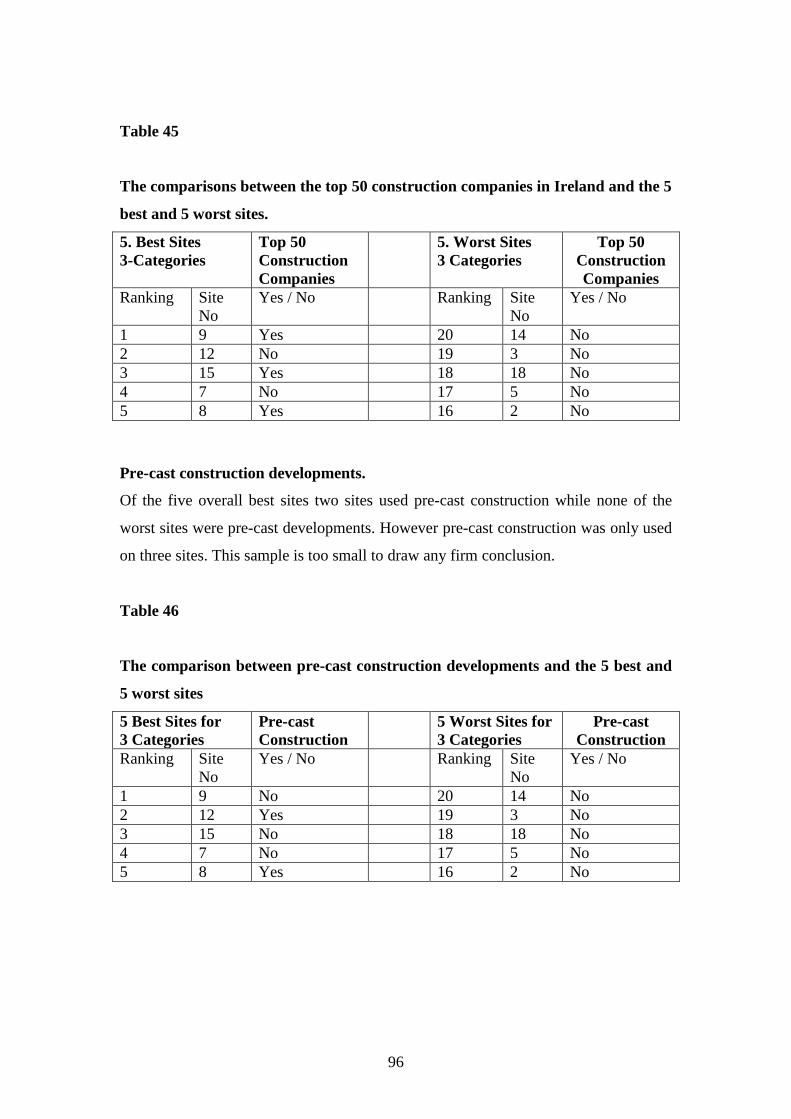
96
Table 45
The comparisons between the top 50 construction companies in Ireland and the 5
best and 5 worst sites.
5. Best Sites
3-Categories
Top 50
Construction
Companies
5. Worst Sites
3 Categories
Top 50
Construction
Companies
Ranking Site
No
Yes / No Ranking Site
No
Yes / No
1 9 Yes 20 14 No
2 12 No 19 3 No
3 15 Yes 18 18 No
4 7 No 17 5 No
5 8 Yes 16 2 No
Pre-cast construction developments.
Of the five overall best sites two sites used pre-cast construction while none of the
worst sites were pre-cast developments. However pre-cast construction was only used
on three sites. This sample is too small to draw any firm conclusion.
Table 46
The comparison between pre-cast construction developments and the 5 best and
5 worst sites
5 Best Sites for
3 Categories
Pre-cast
Construction
5 Worst Sites for
3 Categories
Pre-cast
Construction
Ranking Site
No
Yes / No Ranking Site
No
Yes / No
1 9 No 20 14 No
2 12 Yes 19 3 No
3 15 No 18 18 No
4 7 No 17 5 No
5 8 Yes 16 2 No
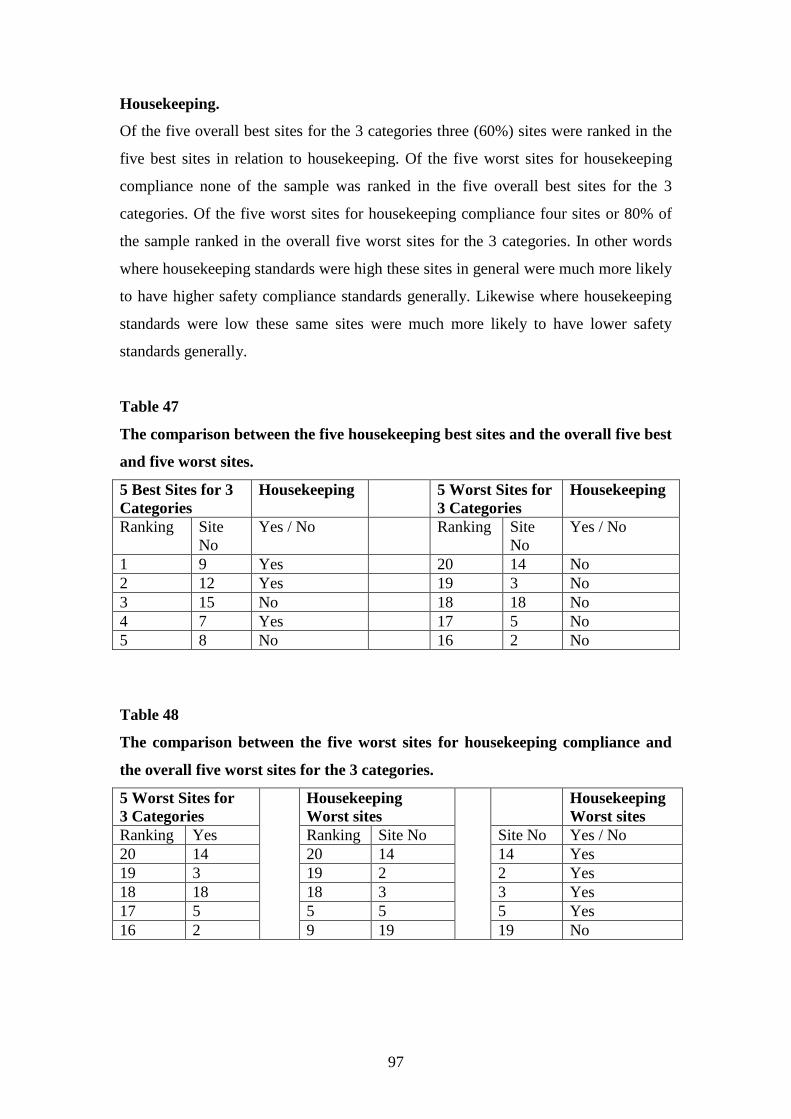
97
Housekeeping.
Of the five overall best sites for the 3 categories three (60%) sites were ranked in the
five best sites in relation to housekeeping. Of the five worst sites for housekeeping
compliance none of the sample was ranked in the five overall best sites for the 3
categories. Of the five worst sites for housekeeping compliance four sites or 80% of
the sample ranked in the overall five worst sites for the 3 categories. In other words
where housekeeping standards were high these sites in general were much more likely
to have higher safety compliance standards generally. Likewise where housekeeping
standards were low these same sites were much more likely to have lower safety
standards generally.
Table 47
The comparison between the five housekeeping best sites and the overall five best
and five worst sites.
5 Best Sites for 3
Categories
Housekeeping 5 Worst Sites for
3 Categories
Housekeeping
Ranking Site
No
Yes / No Ranking Site
No
Yes / No
1 9 Yes 20 14 No
2 12 Yes 19 3 No
3 15 No 18 18 No
4 7 Yes 17 5 No
5 8 No 16 2 No
Table 48
The comparison between the five worst sites for housekeeping compliance and
the overall five worst sites for the 3 categories.
5 Worst Sites for
3 Categories
Housekeeping
Worst sites
Housekeeping
Worst sites
Ranking Yes Ranking Site No Site No Yes / No
20 14 20 14 14 Yes
19 3 19 2 2 Yes
18 18 18 3 3 Yes
17 5 5 5 5 Yes
16 2 9 19 19 No

98
PPE.
Of the overall five best sites for the three categories three (60%) sites of the sample
were ranked in the five best sites in relation to PPE compliance. Of the five worst
sites for PPE compliance none or 0% of the sample were ranked in the five overall
best sites. Of the five worst sites for PPE compliance four sites or 80% of the sample
ranked in the overall five worst sites for the 3 categories. In other words where PPE
compliance standards were high on sites these sites in general were much more likely
to have higher safety compliance standards generally. Likewise where PPE
compliance standards were low these same sites were much more likely to have lower
safety standards generally.
Table 49
The comparison between the overall five best sites for the three categories and
the five best sites in relation to PPE compliance.
5 Best Sites for 3
Categories
PPE 5 Worst Sites for
3 Categories
PPE
Ranking Site
No
Yes / No Ranking Site
No
Yes / No
1 9 Yes 20 14 No
2 12 Yes 19 3 No
3 15 Yes 18 5 No
4 7 No 17 18 No
5 8 No 16 10 No
Table 50
The relationship between the five worst sites for PPE compliance and the five
worst sites for the overall three categories.
5 Worst Sites for 3
Categories
PPE
Worst sites
PPE
Worst sites
Ranking Yes Ranking Site No Site No Yes / No
20 14 20 14 14 Yes
19 3 19 3 3 Yes
18 18 18 5 5 Yes
17 5 17 18 18 Yes
16 2 16 10 10 No

99
Falls from Heights.
Of the five best sites four (80%) of the sample were ranked in the best sites in relation
to falls. Of the five worst sites for falls compliance 1 site or (20%) of the sample were
ranked in the five overall best sites. Of the five worst sites for falls compliance one
site (20%) of the sample ranked in the overall five worst sites. In other words where
fall from height prevention standards were high on sites these sites in general were
much more likely to have higher safety compliance standards generally.
Table 51
The comparison between the overall five best sites & five worst for the 3
categories and the 5 best sites in relation to falls from height.
5 Best Sites for 3
Categories
Falls from
height
5 Worst Sites for
3 Categories
Falls from
height
Ranking Site
No
Yes / No Ranking Site
No
Yes / No
1 9 Yes 20 14 No
2 12 Yes 19 3 No
3 15 Yes 18 18 Yes
4 7 No 17 5 No
5 8 Yes 16 2 No
Table 52
The comparison between the overall five worst sites for the 3 categories and the 5
worst sites in relation to falls from height.
5 Worst Sites for 3
Categories
Falls
Worst sites
Falls
Worst sites
Ranking Yes Ranking Site No Site No Yes / No
20 14 20 16 16 No
19 3 19 6 6 No
18 18 18 18 18 Yes
17 5 5 1 1 No
16 2 9 10 10 No

100
Site Management.
Table 53
The levels of site management controls, comparison between the 5 best sites and
the 5 worst sites for the overall 3 categories
Management controls 5 Best sites 5 Worst sites
High Medium High Medium
Concrete plan of action to handle
safety?
5 5
The company is concerned about
operatives, subcontractors‘ training
/competence at the recruitment stage?
4 1 3 2
The company is concerned about
managers/supervisors' competence at
the time of recruitment?
4 1 1 4
The company provides ongoing
training to operatives?
4 1 2 3
The company provides ongoing
training for managers & supervisors?
4 1 2 3
Frequency of audits carried out in the
company?
4 1 2 3
Effectiveness of audits to redirect
organisational action?
5 3 2
H.S.A. Inspections? N/A N/A N/A N/A
The quality of communication about
safety in the workplace?
5 2 3
The assumption of responsibility by
the main contractor for all safety in the
workplace?
5 5
Co-operation between the main
contractor and sub-contractors?
4 1 1 4
Totals 44 6 26 24
In conclusion the five best sites had much higher levels of management control on
site. The five best sites had high levels of management control for 44 out of the 50
management variables with medium management controls for 6 of the 50 variables for
the 5 sites. In comparison the five worst sites had high levels of management controls
for only 26 out of the 50 management variables and had medium management
controls for 24 out of the 50 management variables for the 5 sites.
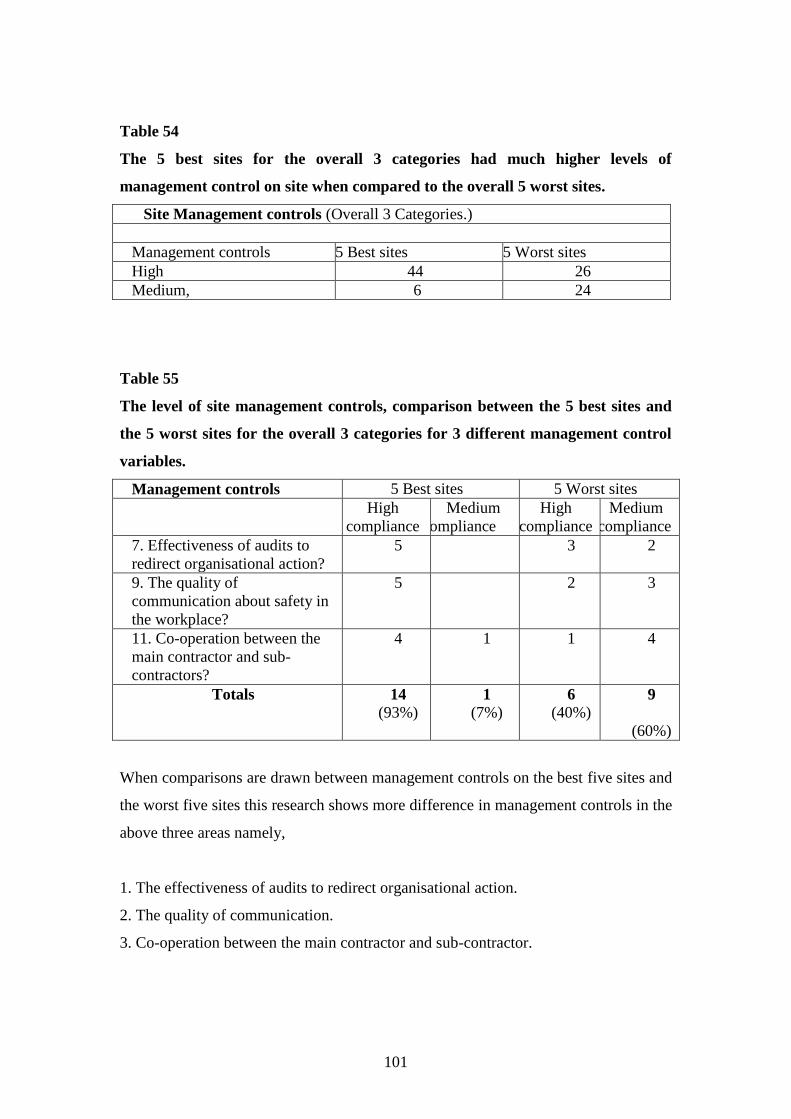
101
Table 54
The 5 best sites for the overall 3 categories had much higher levels of
management control on site when compared to the overall 5 worst sites.
Site Management controls (Overall 3 Categories.)
Management controls 5 Best sites 5 Worst sites
High 44 26
Medium, 6 24
Table 55
The level of site management controls, comparison between the 5 best sites and
the 5 worst sites for the overall 3 categories for 3 different management control
variables.
Management controls 5 Best sites 5 Worst sites
High
compliance
Medium
compliance
High
compliance
Medium
compliance
7. Effectiveness of audits to
redirect organisational action?
5 3 2
9. The quality of
communication about safety in
the workplace?
5 2 3
11. Co-operation between the
main contractor and sub-
contractors?
4 1 1 4
Totals 14
(93%) 1
(7%) 6
(40%) 9
(60%)
When comparisons are drawn between management controls on the best five sites and
the worst five sites this research shows more difference in management controls in the
above three areas namely,
1. The effectiveness of audits to redirect organisational action.
2. The quality of communication.
3. Co-operation between the main contractor and sub-contractor.

102
5 Discussion
103
5.0 Discussion
5.1 Overall safety performance for the twenty sites.
In overall terms the level of safety performance on the twenty sites was variable. The
most positive findings were that a quarter of the sites (five in total) achieved good
compliance with recommended safety practices and a complete prevention of falls.
Also certain safety practices such as adequate documentation was seen on all sites.
However no sites achieved total compliance with all required safety practices.
Unfortunately fifteen sites out of twenty did not achieve adequate falls from height
prevention measures and this remains an area of concern. The best level of
compliance found in employees with regard to safety practices was the wearing of
personal protective equipment which was generally of a high standard.
The majority of instances of inadequate falls from height protection was seen at the
highest point of the building during the survey visit or at roof level. This indicates that
the majority of opportunities for employees to fall is linked to the highest point of the
construction stage and generally involved carpenters block & brick layers, roofers,
scaffolders and carpenters.
Housekeeping was the least compliant area for safety and no site achieved full safety
compliance. However ten sites out of twenty achieved good standards with less than
5% non –compliance with good housekeeping practices. Sixteen sites out of twenty
recorded less than 5% non-compliance with the wearing of personal protective
equipment.
The five sites that achieved complete falls from height prevention also performed
better in overall terms with regard to the remaining categories of housekeeping and
PPE. In effect these sites tended to have a higher level of compliance across all
categories of site safety. Consequently the remaining fifteen sites were found to have
a lower level of safety compliance across all categories. This finding indicates that the
management systems found on these sites is as least identifying all aspects of safety

104
and the implementation of risk management is generally equally distributed across all
hazards. This also has to be seen in a positive light as it indicates that safety issues are
being treated in their entirety rather than as separate components. It also shows
another positive finding in that when risk management is successfully implemented it
tends to benefit all safety issues and does not leave certain safety practices ignored or
less prioritised.
A comparison can now be made with the McDonald & Hrymak (2002) study to assess
any progress in safety standards since 2002. In the McDonald & Hrymak (2002) study
only two sites out of twenty achieved adequate fall prevention. This study showed that
five out of twenty had achieved adequate fall prevention. This is a welcome but
modest increase. However this increase should be seen in a positive light as it shows
an improvement in an industry noted for its poor safety record. Therefore this finding
is encouraging. The small sample size of both studies and the fact that the sites in this
study are Dublin based rather than nationwide is noted. Nevertheless the improvement
seen in this study is welcome especially given the sample size of this research which
is representative of the apartment construction industry in the Dublin area.
Furthermore the poorest levels of safety found in this study were not as bad at the
poorest performing sites found in the McDonald & Hrymak (2002) study. Hence this
study can also report another improvement in that the number of poorly performing
sites has decreased.
McDonald & Hrymak (2002) asserted in their study that they achieved a reasonable
level of representativeness in their sample. Therefore whilst this study and the
McDonald & Hrymak (2002) study cannot be directly compared, the similarities and
difference can be said to be generally indicative of the construction sites they
represent.
Another improvement seen on these sites when compared to the McDonald &
Hrymak (2002) study is the increase in safety representation. In this study, sixteen
out of twenty sites had safety representatives. In the McDonald & Hrymak (2002)
study six out of twenty had safety representatives. As the McDonald & Hrymak
(2002) study showed a strong correlation between the presence of site safety
representative and good safety performance, this increase in the number of safety
105
representatives is a welcome improvement. In addition this increase in the number of
safety representatives found in this study represents the greatest increase in safety
performance seen between the two studies.
It is interesting to argue that this increase in safety representatives is responsible for
the increase in safety performance seen in this study. This would be a plausible
explanation; however the small sample size in this study means that a firm conclusion
cannot be drawn here. There has been a welcome improvement in site safety in
Ireland as evidenced by the fall in construction site fatalities since 2002 (Health and
Safety Authority 2005 Annual Report). No other reason in the literature stands out as
being primarily responsible for this improvement. The interviewees in this study gave
no overwhelming reason for this. Instead a variety of reasons were given with the
more frequent responses (10 interviewees each out of 39) included awareness,
insurance requirements, regulatory activity and legal requirements. None of these
reasons given would mutually exclude the activities of safety representatives; rather it
could be argued that that a safety representative would facilitate all of these reasons.
Also it should be remembered that by law construction sites with more that 20
employees require a safety representative. Hence this study provides evidence of the
role a safety representative can bring to improving site safety. However until twenty
similar sites without safety representatives can be studied, this link must remain as
strong speculation with supporting evidence.
There were a number of other similarities found between this study and the McDonald
& Hrymak (2002) study. Site documentation was good for all twenty sites in this
study showing that the level of documentation on sites did not reflect safety
performance. This finding is similar to the McDonald & Hrymak (2002) study which
also found that site safety documentation did not predict good site safety performance.
However this increase in documentation should also be seen in a positive light as it
indicates a higher standard of compliance with required site safety documentation.
Another similarity between these studies in the effect of regulatory activity on the
sites. In this study visits to the site by the Health and Safety Authority did not reflect
the level of safety performance found.
106
5.2 Factors associated with the best five sites.
One factor that strongly characterised the five sites in this study that performed well
was company size. The best performing sites were those operated by the biggest
construction companies among the group. Hence the bigger the construction company
the better the safety performance. Of the five best sites, three were from construction
companies from the top 50 construction companies in Ireland as listed by size, by the
Construction Industry Federation. Of the five worst sites none were in the top 50
This finding is consistent with CSA (2003) research from Purdue University‘s School
of Health Sciences which conducted a study to determine what elements of the safety
programmes of large construction companies were responsible for a reduced rate of
falls in comparison to small construction companies (Construction Safety Alliance,
2003). The results from this survey can be summed up in three terms: motivation,
training and money. The primary reason for given the success of large construction
companies at reducing construction falls with that upper management had made a
commitment to be safe. Hinze et al. (2002) also showed that the rate of falls decreased
as the cost of construction projects increased.
Harper et al (1998) states that the larger construction companies have more resources
and are best placed to fund safety programmes when compared to smaller
construction companies. This US based research also showed that the accidents and
incidence rates were substantially reduced as the investment in safety was increased.
Another factor that characterised the best performing sites, though not as strongly as
size, is the number of safety representatives on site. The five best performing sites all
had safety representatives. This is opposed to the relatively worst performing five
sites where three sites had site safety representatives. Although this factor is not as
strongly correlated as size due to the small number of sites and safety representatives
in the sample, it is nevertheless as mentioned above, a plausible explanation when
taking the literature into account, to say that site safety representatives play an
important role in site safety.
107
Abraham et al (2004) also noted one provision that the contractor must assign at least
one full-time safety representative to the construction site. Jaselskis et al (1996) also
recommended that safety representatives should spend 30-40% of their time on safety
issues. He stated that expending less time may compromise the project safety
outcome.
One other factor found on the best performing sites was the use of pre-cast concrete in
construction. This was used on three out of the five best performing sites. This may be
a factor but the numbers are too small to draw any firm conclusions other that to say
that the use of pre-cast concrete may lead to better safety standards due to the way it
is used. However there is literature to support this view especially with regard to
preventing falls from heights.
Hinze et al (1997) in a study carried out for the Construction Industry Institute
identified over four hundred design suggestions to increase worker safety. One of the
major suggestions was to design components to facilitate prefabrication in the shop or
on the ground so that they may be erected in place as completed assemblies. The
purpose of this was to reduce worker exposure to falls from elevations and the risk of
workers being struck by falling objects. Gibb et al (1997) stated that ―it is not
inconceivable that everything except the basic structure of an office building could be
prefabricated in the near future‖.
Other factors which may influence the level of site safety found in this study were
presented by the site management to improve site safety. Three main factors given by
them as possible motivating factors to improve safety were in ascending order training
(40%) followed by improving awareness (24%) and eliminating hazards at the design
stage (18%)
With regard to basic safety training for construction site employees the construction
industry can be said to be well trained. The FAS safer pass initiated under the
Construction Safety Partnership Scheme (H.S.A. 2002b) has achieved very high rate
participation. Under this scheme construction employees receive a basic one day
course in site safety. This training is a legal requirement. So it can be argued that this
training requirement as stated by the interviewees is already ongoing.

108
Improving awareness is a somewhat vague term which would seem to include training
as a component. Hence this finding cannot be interpreted very clearly. However the
suggestion of improving the designs of buildings so that they are less hazardous to
build is more promising.
5.2.1 Eliminating hazards at the design stage.
It was suggested by 18% of interviewees that the project supervisor design stage
could eliminate hazards at the design stage. An example of this would be the use of
prefabricated units for example pre-cast concrete walls. This idea shows three
findings. Firstly that the interviewees believed that the decisions at design stage can
influence site safety, secondly that site hazards are present due to decisions made at
the design stage, thirdly that more can and should be done at the design stage to
improve site safety. However interviewees stated that there was little or no
improvement in buildings being designed so that they are safer to build in the last five
years.
There is a good deal of literature to suggest that eliminating hazards at the design
stage is feasible.The Health and Safety Executive in the UK has identified that much
more can be done for the elimination of hazards at the design stage. According to them,
‗it is only by considering health and safety issues from the earliest stages that
designers can take full advantage of the opportunities for avoiding hazards on site
(HSE, 1995).
Carruthers (2002) refers to research conducted by the Institute of Civil Engineers in
the UK which showed that ‗75% of all engineers working on design believed that
more could be done to design out risks during construction‘.
The Construction Industry Institute focused on creating a database of safety ideas and
a design tool that allows designers to address construction worker safety in their
designs. Four hundred design suggestions have been accumulated in this research.
The majority of design suggestions or (32.8%) related to falls.

109
The HSA (2002) survey reported an urgent health and safety training need for
designers. The survey revealed that only 10% of designers of Project Supervisor Design
Stage had any health and safety qualification. According to the H.S.A. (2002) report
this is in many ways the most worrying result of the entire survey. The overwhelming
majority of members of the design professions do not have any recognised formal
health any safety training This lack of training was stated as one of the primary causes
for the poor understanding of designers in relation the understanding of their statutory
duties and of their general failure to implement general principle of prevention.
The H.S.A. (2002) report states that it is generally recognised that designers have a key
role to play in helping to prevent accidents on sites. The HSE (1995) report that there is
potential for the elimination of hazardous conditions at this stage for designers of
smaller building projects state that ‗it is only by considering health and safety issues
from the earliest stages that designers can take full advantage of the opportunities for
avoiding hazards on site‘.
The H.S.E. (2004) published a report which carried out research in analysing actual
incidents with respect to designer involvement. That report concluded that almost half
of all accidents in construction could have been prevented by designer intervention.
There was also sufficient evidence to support a prosecution of the designer in almost
half of the cases analysed. At least 1 in 6 of all incidents is at least partially the
responsibility of the lead designer in that opportunities to prevent incidents were not
taken. According to the European Agency for Safety and health at work (2005) up to
60% of the accidents on Europe‘s construction sites and over 25% of the fatalities
could be avoided by more careful design, planning and procurement before
construction starts.
It is interesting to note that the interviewees did not see regulatory activity including
the role of the client as being an important ways of improving site safety. The finding
that regulatory activity is not a principle factor in predicting safety is similar to
findings in the McDonald & Hrymak (2002) study. Therefore it is not surprising that
client influence is also seen as minimal as this in itself requires a regulatory input to
ensure enforcement of legal requirements. However the role of the client in achieving
site safety has received much attention in recent years. The recent Safety Health and
110
Welfare at Work Act 2005 now has specific regulations requiring the client to
influence site safety at the design stage by appointing competent designers.
Also there is a good deal of literature advocating increasing the influence of the client
on subsequate site safety standards. Data from the Health and Safety Authority
suggests that a significant proportion of clients are failing to meet their obligations,
(H.S.A. 2003) Previous research on construction fatalities revealed that supervisors
were not appointed on 45% of sites where fatalities occurred between 1991 and 2001
(HSA, 2003). The figures for the Irish submission to the European Construction
Campaign (2003) indicate that project supervisors were not appointed on 18% of
applicable sites.
According to the Health and Safety Executive in the UK HSE (2002), the client can
set the tone of the entire construction project and their choice of duty holders and
contractor reflects their priorities with regard to safety and production. The Health
and Safety Executive in the UK, HSE (2002) estimates ‗that 60% of fatal accidents
are attributable to decisions and choices made before the work began (H.S.A. 2002).
The Health and Safety Authority state that ―It is the client‘s attitude to safety that
has most impact. As they have the opportunity to emphasise safety through contact
with the design and construction teams‖ H.S.A (2002).
5.2.2 Interviewee’s perceptions regarding safety compliance in construction in
the last 5 yrs.
All of the interviewees stated that there was a large or some improvement in safety in
the construction industry in the last 5 yrs. and the majority of interviewees stated that
those improvements started during the period 2000-2001.
The majority of interviewees were in agreement that there was a large or some
improvement in the construction industry in relation to, management‘s acceptance of
their responsibility for health and safety on construction sites, consultation with
employees on site, reporting of accidents, and training.

111
This is a welcome finding as previous research has found that management‘s
involvement and commitment to construction site safety is essential to improve safety
performance. Rodgers et al. (1993), found that ―studies have consistently reported that
commitment from top management is essential‖ for safety interventions to succeed.
Management‘s commitment is a central element of the safety climate (Zohar 1980).
Langford et al. (2000) found that when employees believe that the management cares
about their personal safety, they are more willing to cooperate to improve safety
performance. Jaselskis, et al (1996) found that projects that achieve average and
outstanding project results had strong upper-management support. Likewise where
projects achieved below average results management support was weaker.
Mohamed (2002) found that empirical results indicate a significant relationship
between the safety climate and safe work behaviour. Positive safety climates seem to
result from management‘s showing a committed and non-punitive approach to safety.
Management can also promote a positive safety climate by encouraging a more open
free-flowing exchange about safety related issues.
5.2.3 Consultation with employees.
Interviewee‘s also reported a large improvement in consultation with employees on
building sites in the last 5yrs. This again is a welcome finding as there is literature to
support the idea that increased consultation improves safety standards. Harper et al
(1998) found that increased consultation with employees on site and increased
employee involvement resulted in improved safety performance and increased
responsibility for employees. It is generally known that employees are often more
aware of hazards in the work place than are employers (Koehn and Surabhi, 1996). By
involving the employee in the safety process, more commitment is gained from the
employee. This additional commitment may be attributable to the employee‘s desire
to execute something, which he or she has developed or assisted in developing. This
type of involvement enables the employees to gain a sense of ownership and
increased responsibility. Employees are more apt to accept and adapt to minor
changes implemented into a safety programme through time than they are to accept
vast changes thrown upon them at short notice (Paterson, 1996).

112
Again employee involvement is key here. In most instances it is the employees who
are most knowledgeable about the potential hazards peculiar to their work as well as
ways to avoid these hazards. Management need only tap this knowledge held by the
employees. Also, with employee involvement changes may be made much more
efficiently than by forced implementation with no input from the employees (Harper
et al, 1998).
Improvement in employee consultation is shown by a number of previous researches
to be consistent with improved safety performance in construction. This may be a
contributory factor in the role of safety representatives in improving safety.
5.2.4 Reporting of accidents.
The results in the interviews showed that there was a large or some improvement in
the reporting of accidents. Previous research has shown that keeping accident records
had a positive influence on safety performance. Levitt and Parker (1976) found that
those contractors who do not keep accident records by project averaged incident rates,
which are about double those rates found in companies that do keep these records by
project. They, too, saw that the accident rates for contractors that keep records of
accidents by project were substantially lower than those of the companies that do not
keep these records. Improved reporting of accidents can have positive effects on
improved safety performance.
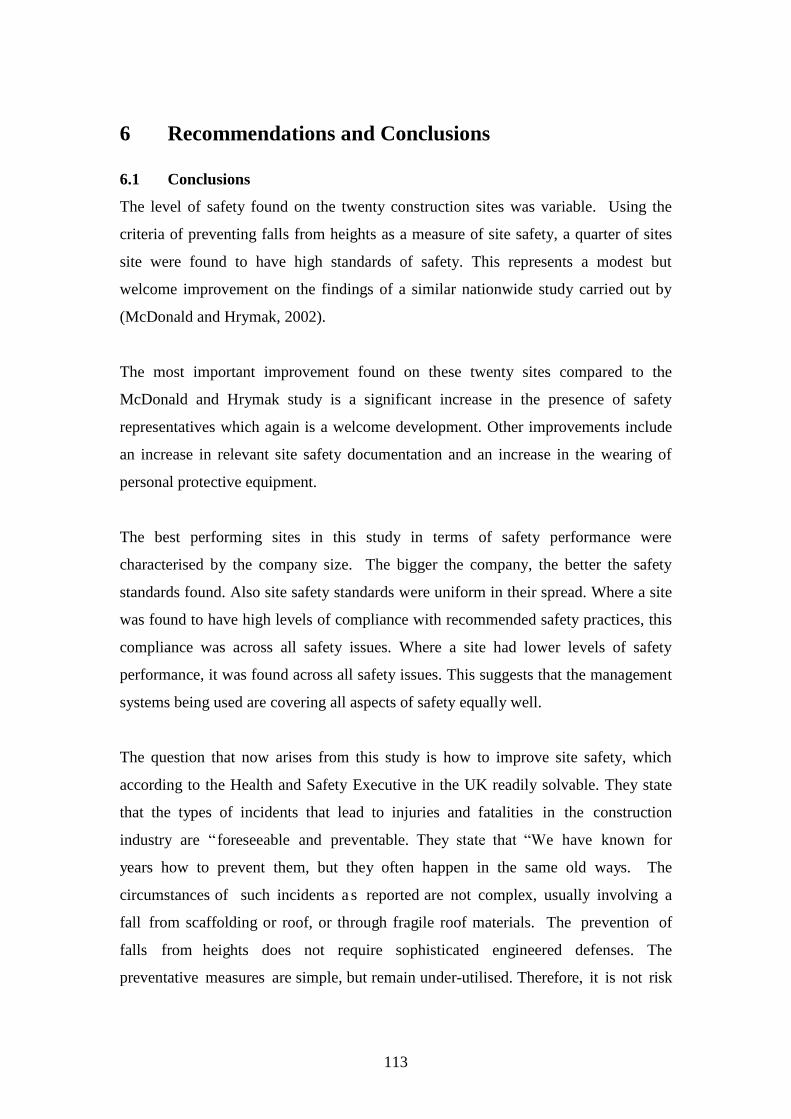
113
6 Recommendations and Conclusions
6.1 Conclusions
The level of safety found on the twenty construction sites was variable. Using the
criteria of preventing falls from heights as a measure of site safety, a quarter of sites
site were found to have high standards of safety. This represents a modest but
welcome improvement on the findings of a similar nationwide study carried out by
(McDonald and Hrymak, 2002).
The most important improvement found on these twenty sites compared to the
McDonald and Hrymak study is a significant increase in the presence of safety
representatives which again is a welcome development. Other improvements include
an increase in relevant site safety documentation and an increase in the wearing of
personal protective equipment.
The best performing sites in this study in terms of safety performance were
characterised by the company size. The bigger the company, the better the safety
standards found. Also site safety standards were uniform in their spread. Where a site
was found to have high levels of compliance with recommended safety practices, this
compliance was across all safety issues. Where a site had lower levels of safety
performance, it was found across all safety issues. This suggests that the management
systems being used are covering all aspects of safety equally well.
The question that now arises from this study is how to improve site safety, which
according to the Health and Safety Executive in the UK readily solvable. They state
that the types of incidents that lead to injuries and fatalities in the construction
industry are ― foreseeable and preventable. They state that ―We have known for
years how to prevent them, but they often happen in the same old ways. The
circumstances of such incidents a s reported are not complex, usually involving a
fall from scaffolding or roof, or through fragile roof materials. The prevention of
falls from heights does not require sophisticated engineered defenses. The
preventative measures are simple, but remain under-utilised. Therefore, it is not risk
114
identification or risk assessment particularly that is the problematic in the
construction context but rather the risk response‖.
Given the way construction sites are operated and regulated at present, safety
representatives still seem the best solution to improving site safety. Designing out
hazards offers good prospects if enforcement can be improved. But this is a circular
argument as enforcement is difficult to achieve due to current resource constraints.
Also it can be argued that if existing safety rules are more actively enforced site safety
could improve. This is not a criticism of the Health and Safety Authority as they can
only operate within their resource allocation. The number of Health and Safety
Authority Construction site inspectors in 2002 was approximately twenty (McDonald
and Hrymak , 2002), Given that the size of the construction industry in 2005 involved
nearly 250,000 employees, CSO (2005), the ratio of inspectors to sites quickly
becomes apparent.
Therefore enforcement as currently practiced does not seem the best way forward.
Taking this study into account together with Mc Donald and Hrymak (2002) study
and all relevant literature, persuading construction firms to increase the number and
influence of safety representatives seems to offer the best prospect for safety
improvements in the short term.

115
6.2 Recommendations
This research like previous research has identified the potential positive influence that
safety representative can play in influencing safety compliance on construction sites.
All constructions sites should have safety representatives and their role and functions
should be reinforced, including more formal defined roles and sufficient time
allocated on site to carry out these roles.
The site observational methodology worked well in measuring safety performance
during this research. However the methodology could be enhanced and improved for
use on all construction sites by including plant and machinery and all other
construction site activities.
By adapting this framework of research a more accurate indicator of the level of
safety compliance on construction sites at a national level may be obtained, a measure
of safety levels on smaller sites can also be achieved
Future research into the construction industry should place particular attention on the
role of the safety representative within the construction industry especially where
safety representatives were shown to have greater influence on improving safety
compliance. Further research should endeavour to establish trends and factors like
competence, training, selection by management or employees and the time allocated
on each site to allow the safety representative to carry out their roles.

116
Appendix A
Construction Site Observational
Checklist
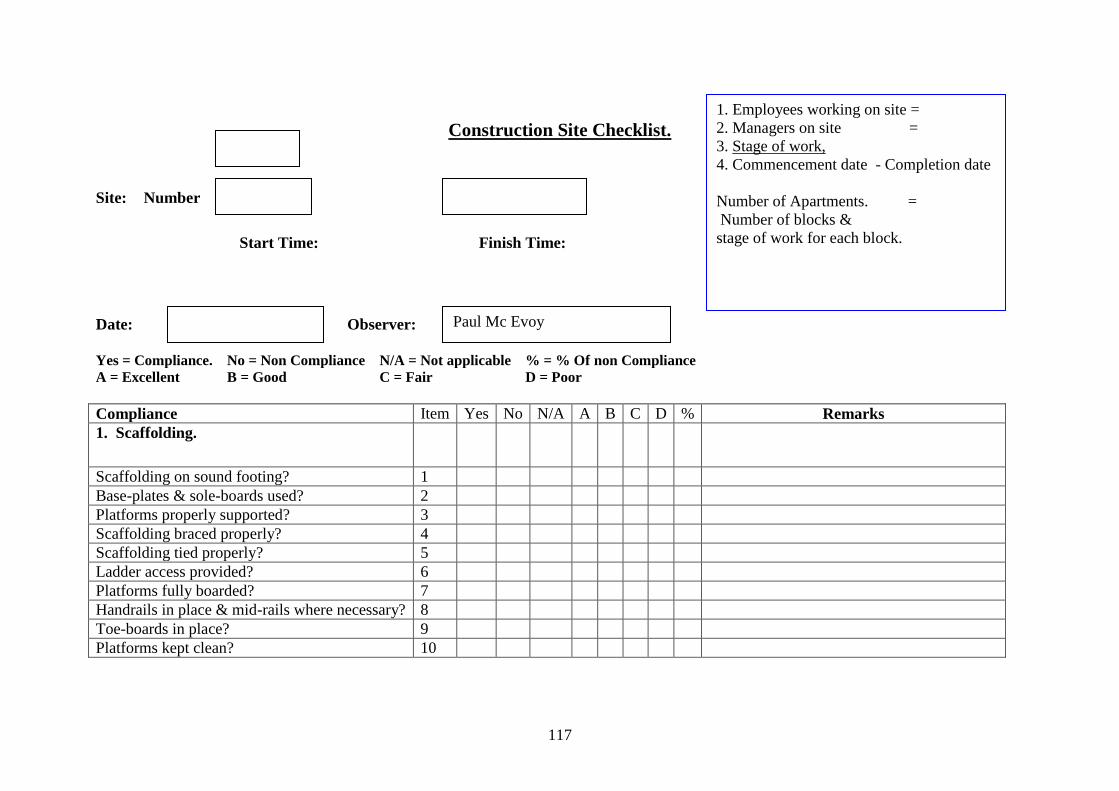
117
Construction Site Checklist.
Site: Number
Start Time: Finish Time:
Date: Observer:
Yes = Compliance. No = Non Compliance N/A = Not applicable % = % Of non Compliance
A = Excellent B = Good C = Fair D = Poor
Compliance Item Yes No N/A A B C D % Remarks
1. Scaffolding.
Scaffolding on sound footing? 1
Base-plates & sole-boards used? 2
Platforms properly supported? 3
Scaffolding braced properly? 4
Scaffolding tied properly? 5
Ladder access provided? 6
Platforms fully boarded? 7
Handrails in place & mid-rails where necessary? 8
Toe-boards in place? 9
Platforms kept clean? 10
Paul Mc Evoy
1. Employees working on site =
2. Managers on site =
3. Stage of work,
4. Commencement date - Completion date
Number of Apartments. =
Number of blocks &
stage of work for each block.
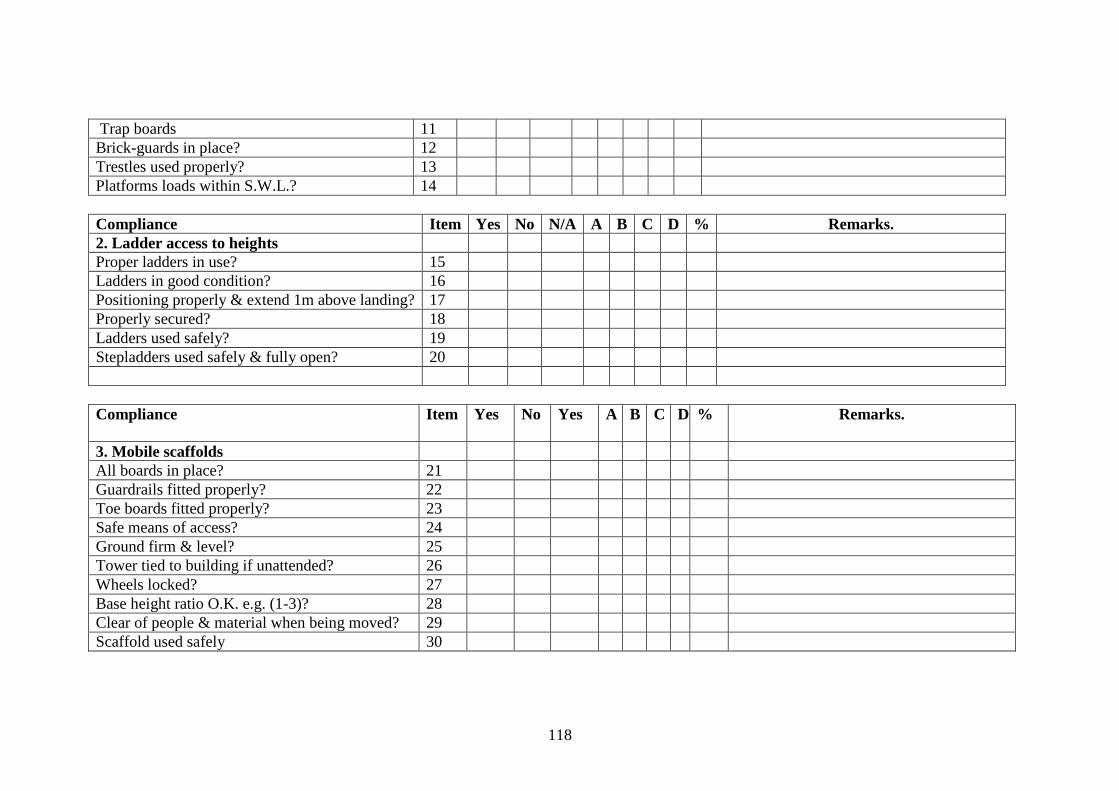
118
Trap boards 11
Brick-guards in place? 12
Trestles used properly? 13
Platforms loads within S.W.L.? 14
Compliance Item Yes No N/A A B C D % Remarks.
2. Ladder access to heights
Proper ladders in use? 15
Ladders in good condition? 16
Positioning properly & extend 1m above landing? 17
Properly secured? 18
Ladders used safely? 19
Stepladders used safely & fully open? 20
Compliance Item Yes No Yes A B C D
% Remarks.
3. Mobile scaffolds
All boards in place? 21
Guardrails fitted properly? 22
Toe boards fitted properly? 23
Safe means of access? 24
Ground firm & level? 25
Tower tied to building if unattended? 26
Wheels locked? 27
Base height ratio O.K. e.g. (1-3)? 28
Clear of people & material when being moved? 29
Scaffold used safely 30
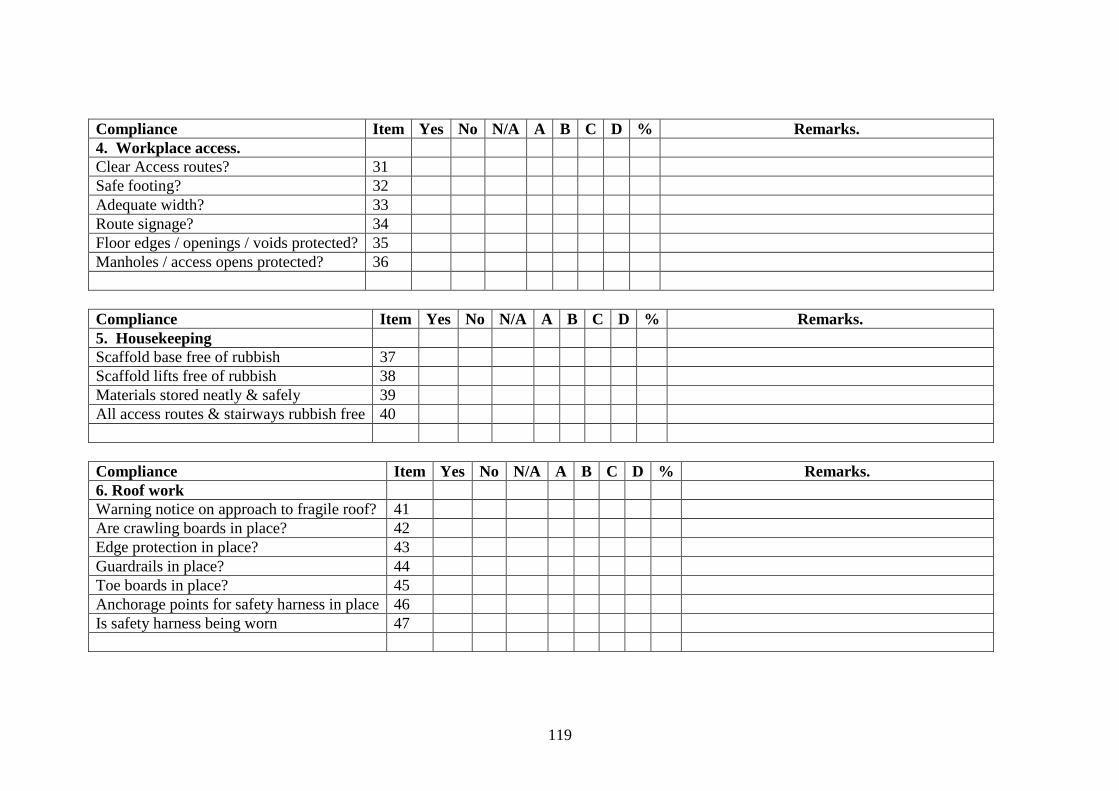
119
Compliance Item Yes No N/A A B C D % Remarks.
4. Workplace access.
Clear Access routes? 31
Safe footing? 32
Adequate width? 33
Route signage? 34
Floor edges / openings / voids protected? 35
Manholes / access opens protected? 36
Compliance Item Yes No N/A A B C D % Remarks.
5. Housekeeping
Scaffold base free of rubbish 37
Scaffold lifts free of rubbish 38
Materials stored neatly & safely 39
All access routes & stairways rubbish free 40
Compliance Item Yes No N/A A B C D % Remarks.
6. Roof work
Warning notice on approach to fragile roof? 41
Are crawling boards in place? 42
Edge protection in place? 43
Guardrails in place? 44
Toe boards in place? 45
Anchorage points for safety harness in place 46
Is safety harness being worn 47
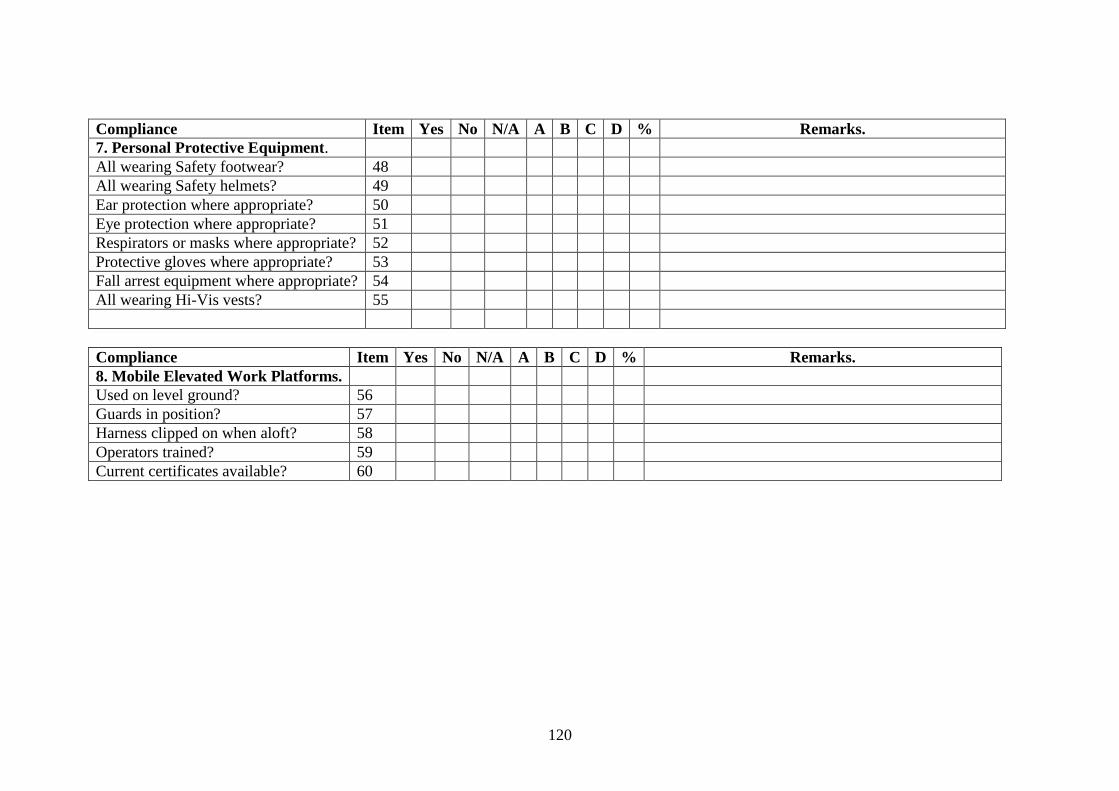
120
Compliance Item Yes No N/A A B C D % Remarks.
7. Personal Protective Equipment.
All wearing Safety footwear? 48
All wearing Safety helmets? 49
Ear protection where appropriate? 50
Eye protection where appropriate? 51
Respirators or masks where appropriate? 52
Protective gloves where appropriate? 53
Fall arrest equipment where appropriate? 54
All wearing Hi-Vis vests? 55
Compliance Item Yes No N/A A B C D % Remarks.
8. Mobile Elevated Work Platforms.
Used on level ground? 56
Guards in position? 57
Harness clipped on when aloft? 58
Operators trained? 59
Current certificates available? 60
Appendix B
Site Documentation
Checklist
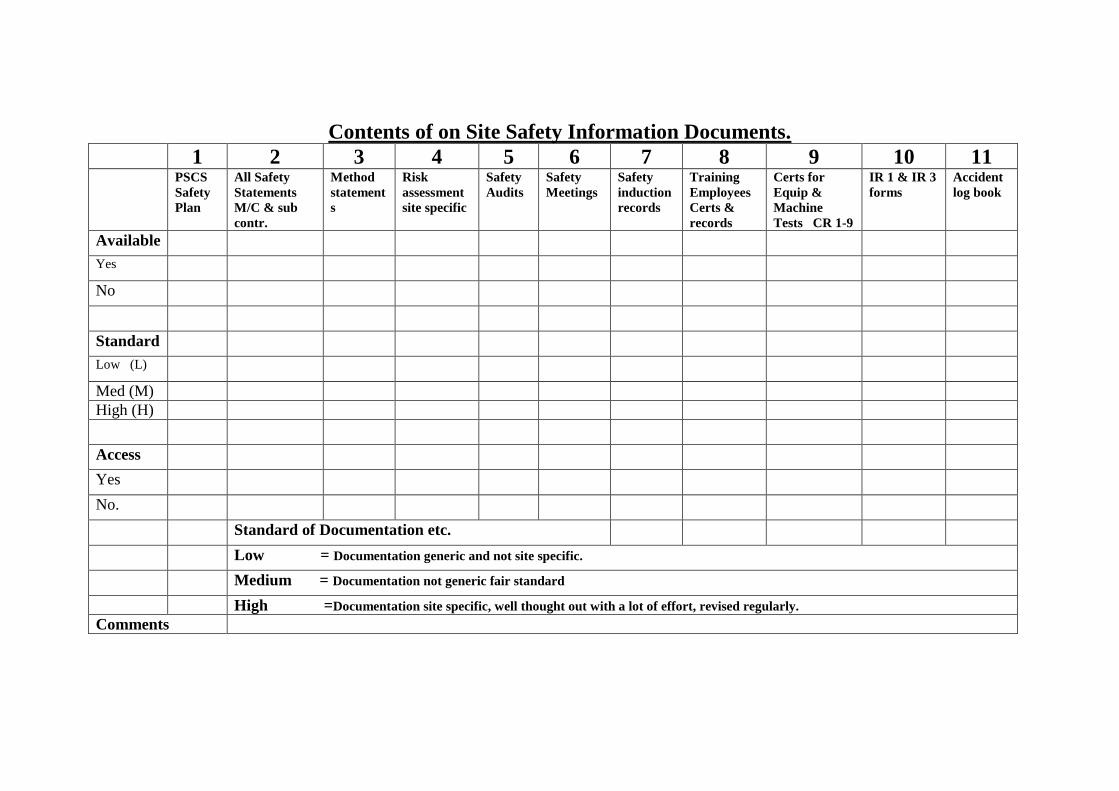
Contents of on Site Safety Information Documents. 1 2 3 4 5 6 7 8 9 10 11
PSCS
Safety
Plan
All Safety
Statements
M/C & sub
contr.
Method
statement
s
Risk
assessment
site specific
Safety
Audits
Safety
Meetings
Safety
induction
records
Training
Employees
Certs &
records
Certs for
Equip &
Machine
Tests CR 1-9
IR 1 & IR 3
forms
Accident
log book
Available Yes No
Standard Low (L) Med (M)
High (H)
Access Yes No. Standard of Documentation etc. Low = Documentation generic and not site specific.
Medium = Documentation not generic fair standard
High =Documentation site specific, well thought out with a lot of effort, revised regularly.
Comments
Appendix C
Interviewee
Template

124
Interviewee Template
1. Background.
Site No.
_____
Location: ____________________
Interview
1-5
Name of Interviewee:
Mobile:
Office/ Home:
Interview: Start: Finish:
Date:
Gender:
Male
Female
Age: Yrs:
Company for which you work:
Type of Company, e.g.
Client, M/C PSCS etc.
Job Title: What experience &
qualifications did you require
to reach this position?
How did you reach this
position?
Qualifications:
Personal Competence in
Safety:
Training received:
Quality of Training:
Where: When:
How long:
Years working in:
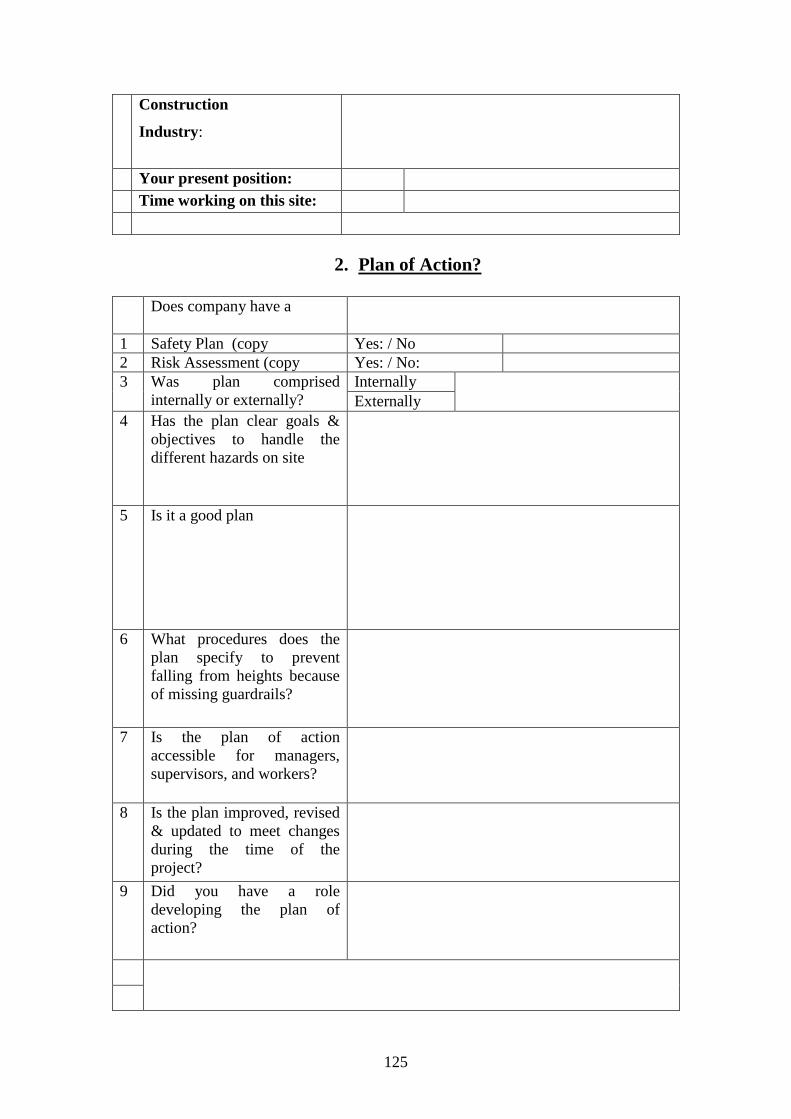
125
Construction
Industry:
Your present position: Time working on this site:
2. Plan of Action?
Does company have a
1 Safety Plan (copy Yes: / No
2 Risk Assessment (copy Yes: / No:
3 Was plan comprised
internally or externally?
Internally
Externally
4 Has the plan clear goals &
objectives to handle the
different hazards on site
5 Is it a good plan
6 What procedures does the
plan specify to prevent
falling from heights because
of missing guardrails?
7 Is the plan of action
accessible for managers,
supervisors, and workers?
8 Is the plan improved, revised
& updated to meet changes
during the time of the
project?
9 Did you have a role
developing the plan of
action?
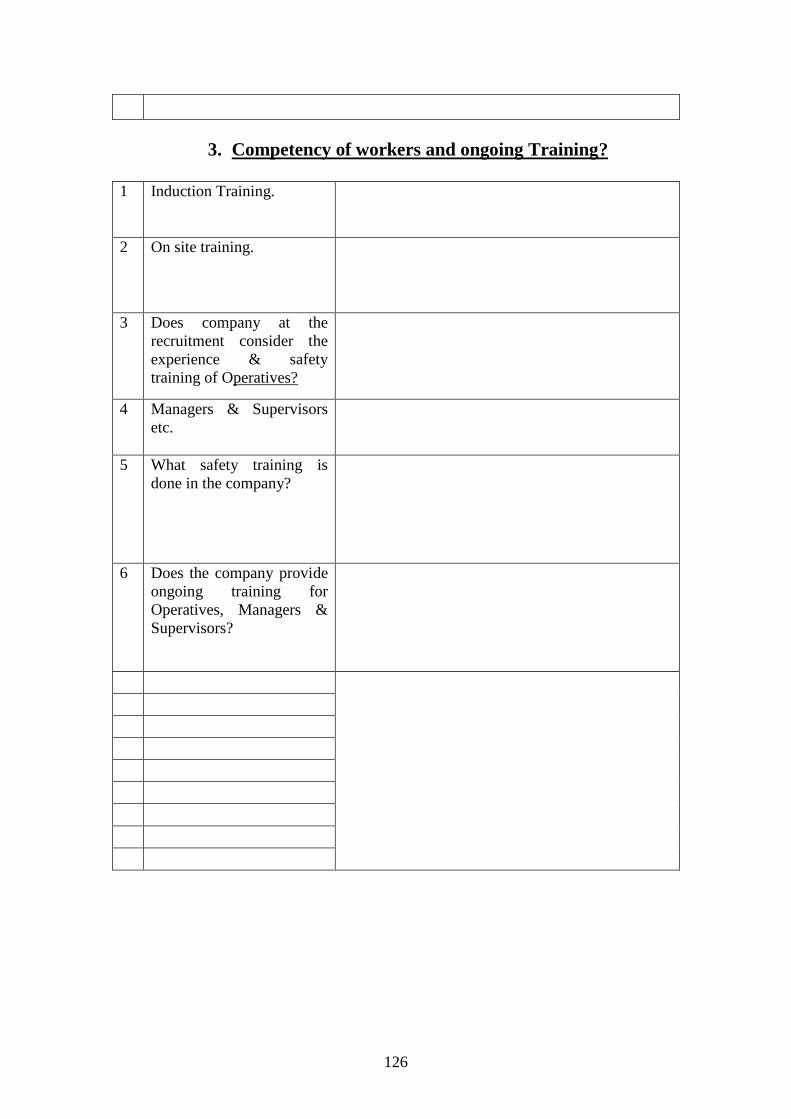
126
3. Competency of workers and ongoing Training?
1 Induction Training.
2 On site training.
3 Does company at the
recruitment consider the
experience & safety
training of Operatives?
4 Managers & Supervisors
etc.
5 What safety training is
done in the company?
6 Does the company provide
ongoing training for
Operatives, Managers &
Supervisors?
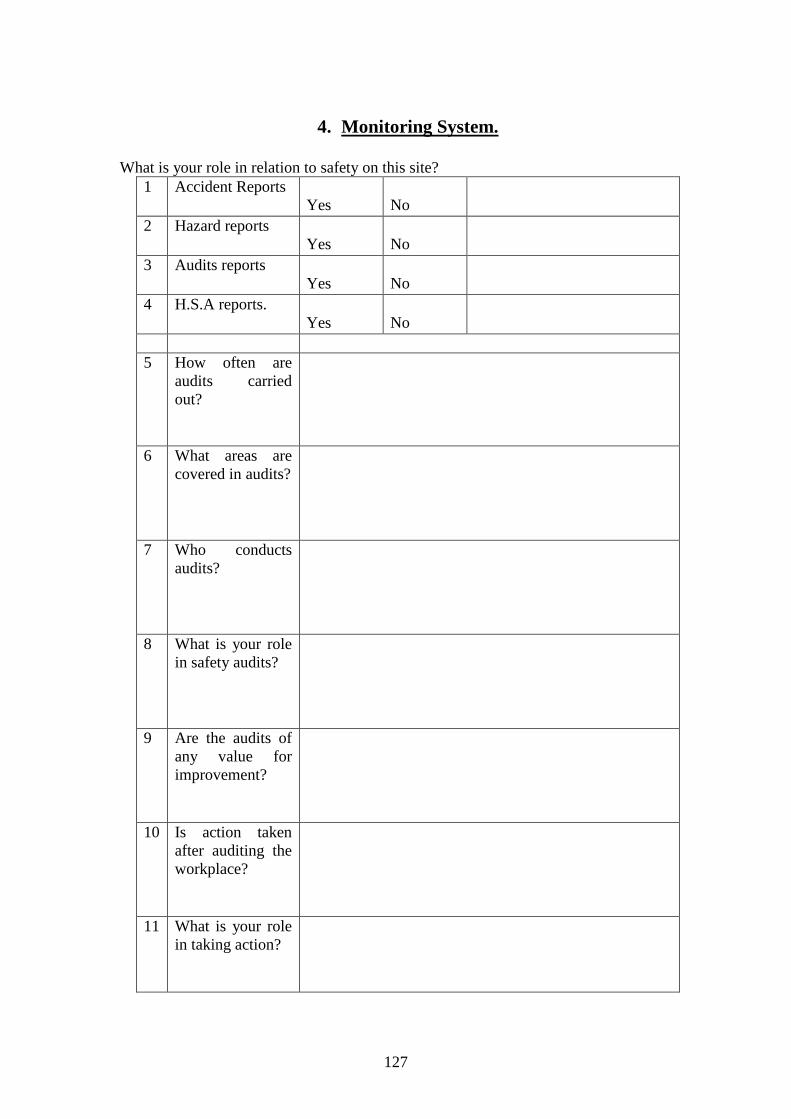
127
4. Monitoring System.
What is your role in relation to safety on this site?
1 Accident Reports
Yes
No
2 Hazard reports
Yes
No
3 Audits reports
Yes
No
4 H.S.A reports.
Yes
No
5 How often are
audits carried
out?
6 What areas are
covered in audits?
7 Who conducts
audits?
8 What is your role
in safety audits?
9 Are the audits of
any value for
improvement?
10 Is action taken
after auditing the
workplace?
11 What is your role
in taking action?

128
Hazard Reporting?
12 What are the formal
channels for reporting a
hazard?
13 What happens when a
hazard is reported?
Accident Reporting?
14 The formal channels
for reporting?
15 What happens when
accident is reported?
Incidents/
Near misses?
16 Do you consider
incidents and near
misses in your
reporting system?
Discipline?
17 When an accident
happens or dangerous
situation occurs what is
the policy of your
company?
18 Is any kind of
investigation carried
out?
19 What is the purpose of
the investigation?
20 Are there any
disciplinary procedures
for employees in
breach of safety?
129
21 What is your role in
this disciplinary
process?
H.S.A.
Inspections?
22 Has the H.S.A
visited your site?
23 When?
24 What was the
H.S.A. conclusion
about safety on this
site?
25 Have any changes
been brought about
after the visit?
130
5. Communication in the Workplace? .
1 What channels of
communication are
used when dealing
with safety on site?
Verbal Communication? Observed Communication?
Meetings? Regular inspection tours?
One-to-one discussions? Senior management in meetings?
Team briefings? Setting an example?
Quality circles? Joint consultation meetings?
Toolbox talks? Presentations, workshops, training?
Written Communication? External Communication?
Policy statements? Reporting accident and ill health?
Organisation charts? Dealing with statutory paperwork?
Performance standards? Interfacing with H.S.A.?
Risk assessments? Interfacing with information services?
Posters? Liaison with statutory bodies?
Newsletters?
How effective is the
communication used?
What is your role in this
process?
131
6. Responsibility for safety in the workplace?
Sub-contractors are legally required to co-operate with the M/C re safety on site.
1 Who takes
responsibility for
safety on site?
2 Does the main
contractor take
responsibility for
safety on site?
3 Does the PSCS
take responsibility
for safety on site?
4 If only some
responsibilities are
taken which ones
are they?
5 What are your
responsibilities for
safety on site?
Co-Operation? 6 The level of co-operation
between M/C and sub-
contractors?
7 Why is co-operation good or
bad?
8 Are sub-contractors & safety
reps. at safety meetings &
discussions?
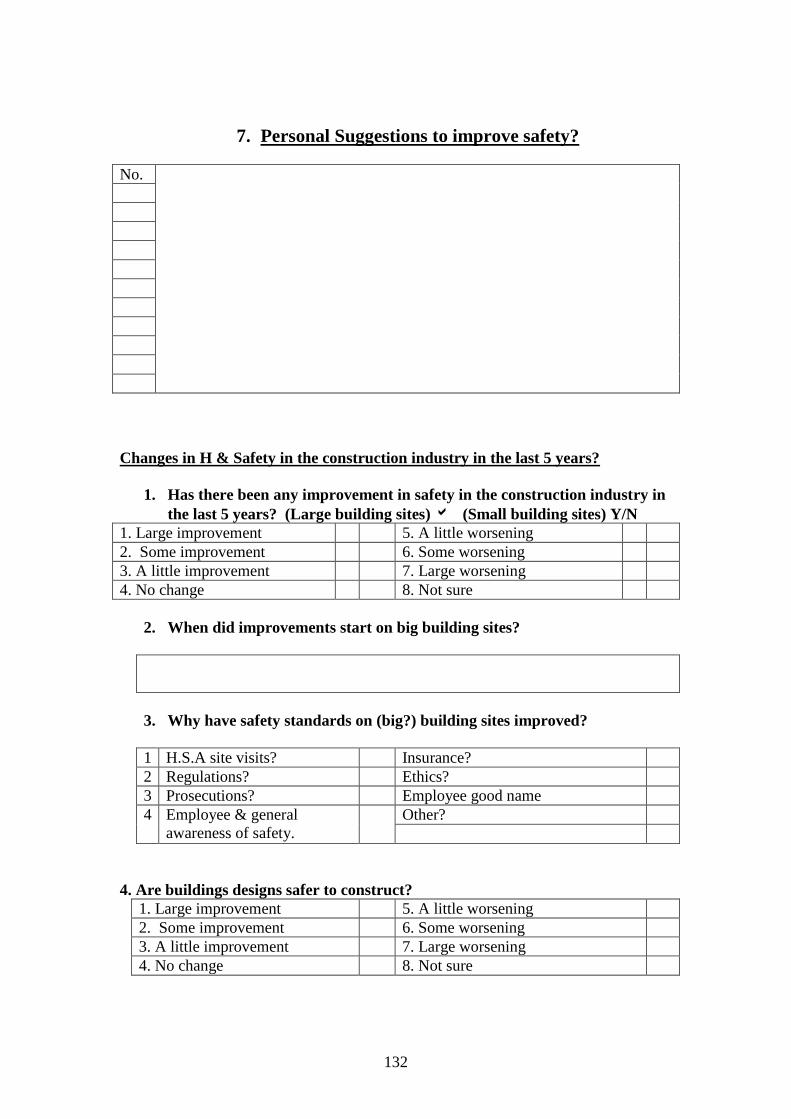
132
7. Personal Suggestions to improve safety?
No.
Changes in H & Safety in the construction industry in the last 5 years?
1. Has there been any improvement in safety in the construction industry in
the last 5 years? (Large building sites) (Small building sites) Y/N
1. Large improvement 5. A little worsening
2. Some improvement 6. Some worsening
3. A little improvement 7. Large worsening
4. No change 8. Not sure
2. When did improvements start on big building sites?
3. Why have safety standards on (big?) building sites improved?
1 H.S.A site visits? Insurance?
2 Regulations? Ethics?
3 Prosecutions? Employee good name
4 Employee & general
awareness of safety.
Other?
4. Are buildings designs safer to construct?
1. Large improvement 5. A little worsening
2. Some improvement 6. Some worsening
3. A little improvement 7. Large worsening
4. No change 8. Not sure
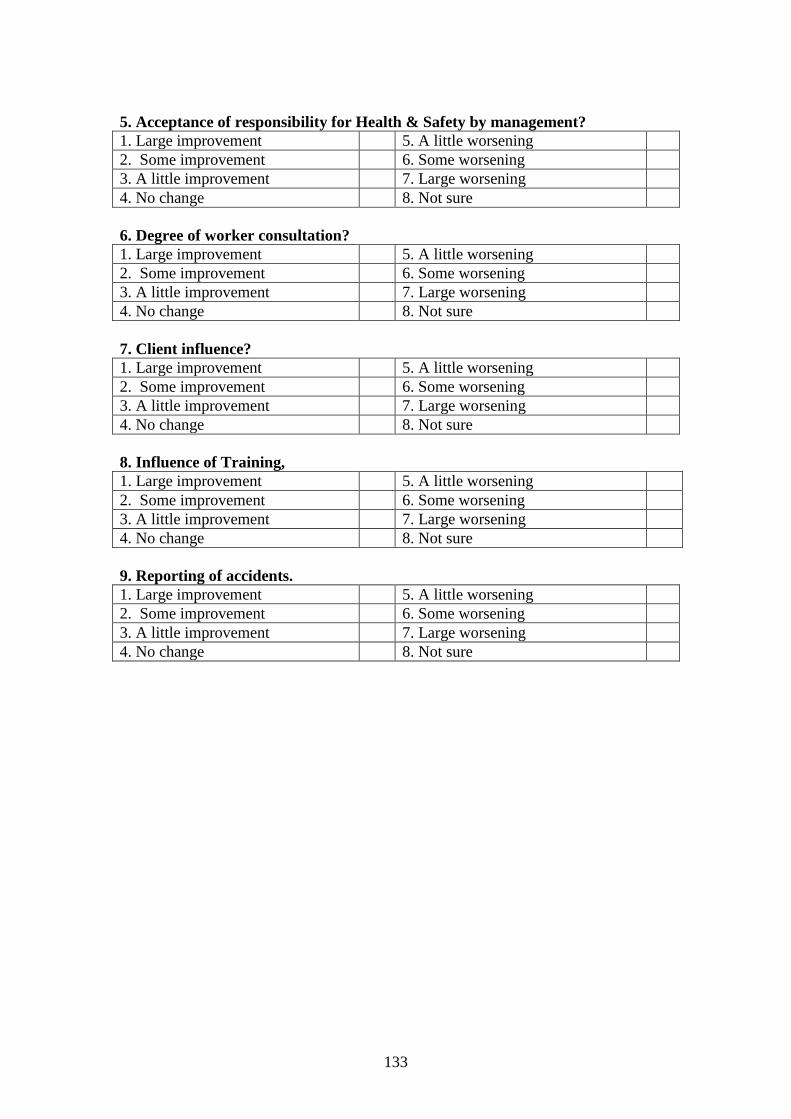
133
5. Acceptance of responsibility for Health & Safety by management?
1. Large improvement 5. A little worsening
2. Some improvement 6. Some worsening
3. A little improvement 7. Large worsening
4. No change 8. Not sure
6. Degree of worker consultation?
1. Large improvement 5. A little worsening
2. Some improvement 6. Some worsening
3. A little improvement 7. Large worsening
4. No change 8. Not sure
7. Client influence?
1. Large improvement 5. A little worsening
2. Some improvement 6. Some worsening
3. A little improvement 7. Large worsening
4. No change 8. Not sure
8. Influence of Training,
1. Large improvement 5. A little worsening
2. Some improvement 6. Some worsening
3. A little improvement 7. Large worsening
4. No change 8. Not sure
9. Reporting of accidents.
1. Large improvement 5. A little worsening
2. Some improvement 6. Some worsening
3. A little improvement 7. Large worsening
4. No change 8. Not sure
134
Appendix D
Site Management
Interview Template

Site Managers‘ Interview Template
for the Construction Industry
List of seven headings covered:
1. Plan of action
2. Competence of the workforce and ongoing training
3. Monitoring system
4. Communication in the workplace
5. Responsibility for safety in the workplace
SITE No. ______________
Date; _________________
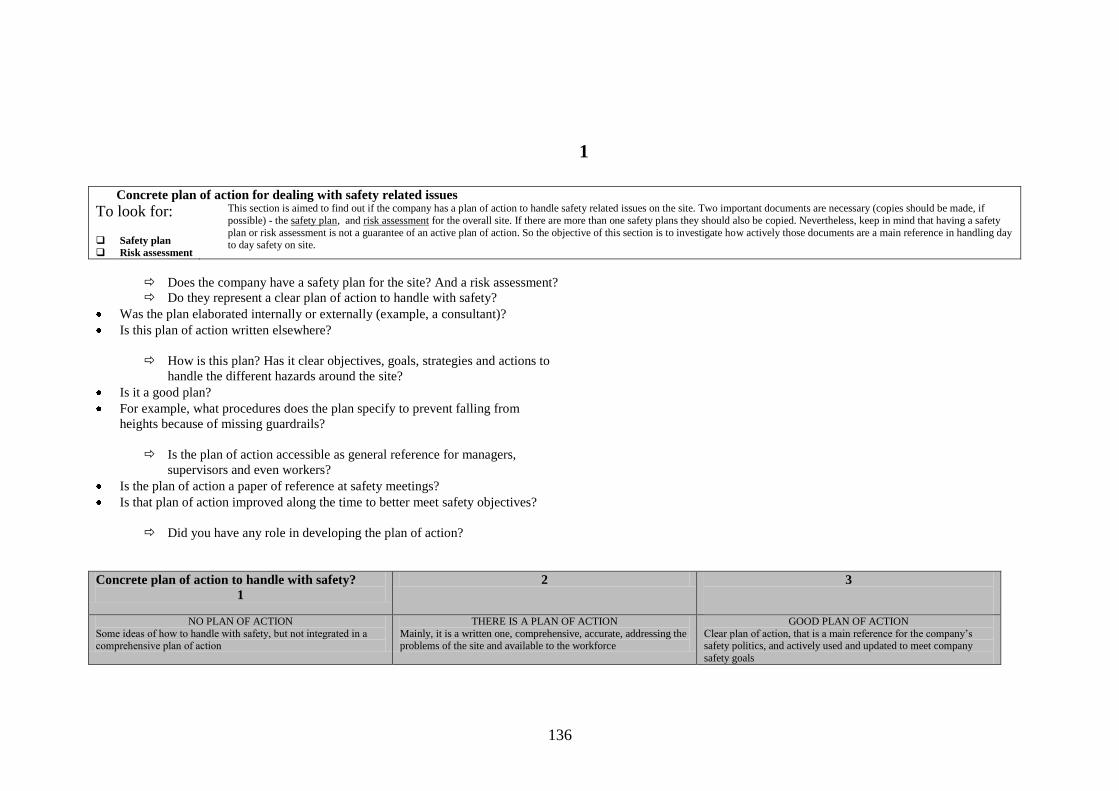
136
1
Concrete plan of action for dealing with safety related issues
To look for:
Safety plan
Risk assessment
This section is aimed to find out if the company has a plan of action to handle safety related issues on the site. Two important documents are necessary (copies should be made, if
possible) - the safety plan, and risk assessment for the overall site. If there are more than one safety plans they should also be copied. Nevertheless, keep in mind that having a safety
plan or risk assessment is not a guarantee of an active plan of action. So the objective of this section is to investigate how actively those documents are a main reference in handling day to day safety on site.
Does the company have a safety plan for the site? And a risk assessment?
Do they represent a clear plan of action to handle with safety?
Was the plan elaborated internally or externally (example, a consultant)?
Is this plan of action written elsewhere?
How is this plan? Has it clear objectives, goals, strategies and actions to
handle the different hazards around the site?
Is it a good plan?
For example, what procedures does the plan specify to prevent falling from
heights because of missing guardrails?
Is the plan of action accessible as general reference for managers,
supervisors and even workers?
Is the plan of action a paper of reference at safety meetings?
Is that plan of action improved along the time to better meet safety objectives?
Did you have any role in developing the plan of action?
Concrete plan of action to handle with safety?
1
2 3
NO PLAN OF ACTION
Some ideas of how to handle with safety, but not integrated in a comprehensive plan of action
THERE IS A PLAN OF ACTION
Mainly, it is a written one, comprehensive, accurate, addressing the problems of the site and available to the workforce
GOOD PLAN OF ACTION
Clear plan of action, that is a main reference for the company‘s safety politics, and actively used and updated to meet company
safety goals

137
2
Competence of the workforce, and ongoing training
To look for: Induction training
On-site training
This section is aimed to find out if the company has any safety criterion for recruitment and training for their workforce. Although possibly rare, written information about what kind of criteria they use for recruitment, and about number, duration, and, if possible, quality of the safety training carried out would be very useful.
Does the company have any criterion related with safety for:
Operatives‘ recruitment (experience, safety training…)
Subcontractors‘ selection (past safety records,…)
Recruitment of managers and supervisors working in safety related jobs
Does the company set, reward or enforce safety and technical training
among the workforce, supervisors and managers?
How is it done?
What safety training is done in the company?
Who is eligible for that training, your own employees, all staff?
How effective is that training for the pursued goals?
Which people is responsible for the training process?
What are the main limitations for carrying out the training program?
The Company is concerned about operatives and subcontractors‘ competence at the recruitment stage? Low
Safety backgrounds are rarely considered as an important issue in
operatives‘ recruitment
Medium Safety backgrounds are generally requested but there is no proper
system for ensuring it or for keeping records.
High Company checks safety backgrounds at the time of recruitment, & keep safety records of all employees & subcontractors.
The Company is concerned about managers/supervisors‘ competence at the time of recruitment? Low
Safety backgrounds are rarely considered as an important issue in operatives‘ recruitment
Medium
Safety backgrounds are considered at time of recruitment but there is no proper system for ensuring it or for keeping records.
High Company checks safety backgrounds at the time of recruitment
and look for high level of competence & safety standard history.
The Company provides ongoing training for operatives LOW
Company training is reduced to an induction programme.
MEDIUM
Company training on safety considers more than an induction
programme and takes over different times and phases along the site life-cycle.
High Company has an articulated safety training aimed both to an
active training on safety and to an active feedback of the
effectiveness of the training programme.
The Company provides ongoing training for managers and supervisors
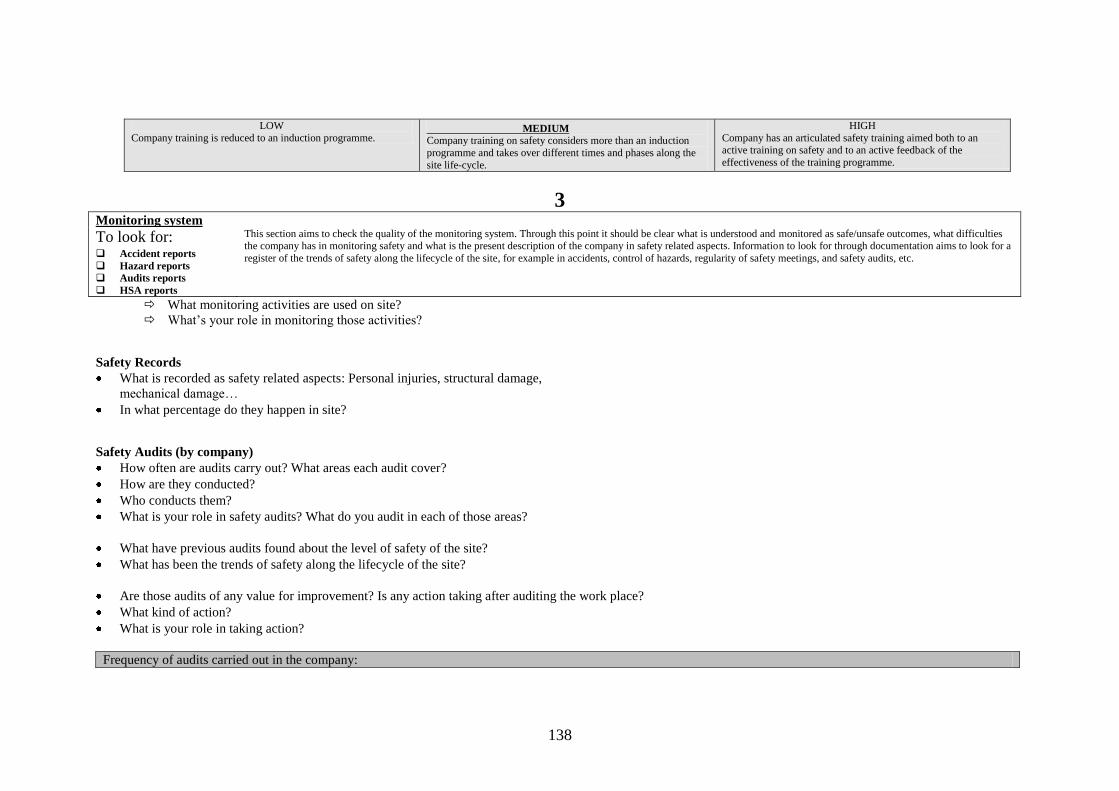
138
LOW
Company training is reduced to an induction programme. MEDIUM
Company training on safety considers more than an induction
programme and takes over different times and phases along the
site life-cycle.
HIGH
Company has an articulated safety training aimed both to an active training on safety and to an active feedback of the
effectiveness of the training programme.
3 Monitoring system
To look for: Accident reports
Hazard reports
Audits reports
HSA reports
This section aims to check the quality of the monitoring system. Through this point it should be clear what is understood and monitored as safe/unsafe outcomes, what difficulties the company has in monitoring safety and what is the present description of the company in safety related aspects. Information to look for through documentation aims to look for a
register of the trends of safety along the lifecycle of the site, for example in accidents, control of hazards, regularity of safety meetings, and safety audits, etc.
What monitoring activities are used on site?
What‘s your role in monitoring those activities?
Safety Records
What is recorded as safety related aspects: Personal injuries, structural damage,
mechanical damage…
In what percentage do they happen in site?
Safety Audits (by company)
How often are audits carry out? What areas each audit cover?
How are they conducted?
Who conducts them?
What is your role in safety audits? What do you audit in each of those areas?
What have previous audits found about the level of safety of the site?
What has been the trends of safety along the lifecycle of the site?
Are those audits of any value for improvement? Is any action taking after auditing the work place?
What kind of action?
What is your role in taking action?
Frequency of audits carried out in the company:
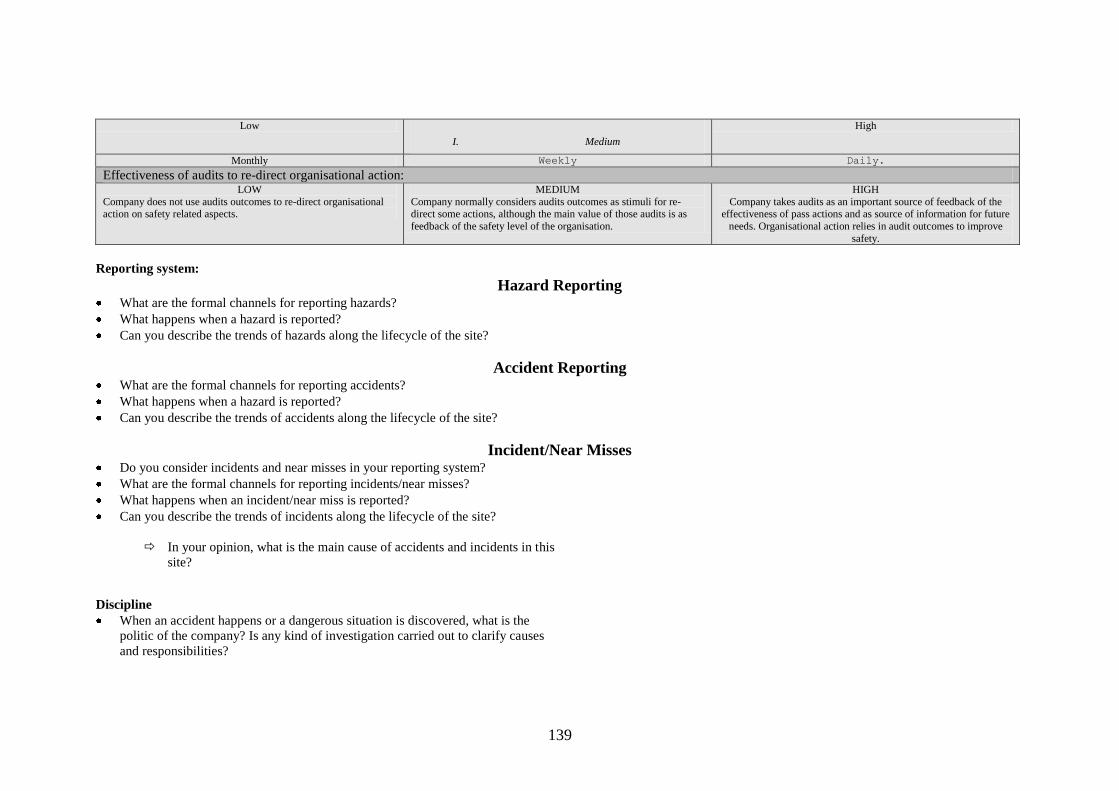
139
Low
I. Medium
High
Monthly Weekly Daily.
Effectiveness of audits to re-direct organisational action: LOW
Company does not use audits outcomes to re-direct organisational action on safety related aspects.
MEDIUM
Company normally considers audits outcomes as stimuli for re-direct some actions, although the main value of those audits is as
feedback of the safety level of the organisation.
HIGH
Company takes audits as an important source of feedback of the effectiveness of pass actions and as source of information for future
needs. Organisational action relies in audit outcomes to improve
safety.
Reporting system:
Hazard Reporting What are the formal channels for reporting hazards?
What happens when a hazard is reported?
Can you describe the trends of hazards along the lifecycle of the site?
Accident Reporting What are the formal channels for reporting accidents?
What happens when a hazard is reported?
Can you describe the trends of accidents along the lifecycle of the site?
Incident/Near Misses Do you consider incidents and near misses in your reporting system?
What are the formal channels for reporting incidents/near misses?
What happens when an incident/near miss is reported?
Can you describe the trends of incidents along the lifecycle of the site?
In your opinion, what is the main cause of accidents and incidents in this
site?
Discipline
When an accident happens or a dangerous situation is discovered, what is the
politic of the company? Is any kind of investigation carried out to clarify causes
and responsibilities?

140
What is your role in this disciplinary process? What can you do? What are your
limitations?
HSA Inspections
Has any HSA inspector visited your site? When?
What has been the HSA conclusions about the safety of your site?
Have any changes been brought about after the visits?
4 Communication in the workplace This section aims to check the quantity and quality of communication about safety in the workplace.
Is communication on safety a variable of importance for the company?
If ‗yes,‘ what (safety content) is communicated?
What goals does the company intend to reach?
How effectively is the communication used?
What are the limitations of the present way of communicating?
What is your role in this process?
What kind of channels are normally used by the company when dealing
with safety related aspects?
VERBAL COMMUNICATION:
Meetings
One-to-one discussions
Team briefings
Quality circles
Tool box talks
OBSERVED COMMUNICATION:
Regular inspection tours
Senior management involvement in meetings
Setting an example
Joint consultation meetings
Presentations/training sessions and workshops
(Some)
Yes/No

141
WRITTEN COMMUNICATION:
Policy statements
Organisation charts
Performance standards
Risk assessments
Posters
Newsletters
EXTERNAL COMMUNICATION
Reporting accident and ill health
Dealing with statutory paperwork
Interfacing with HSE
Interfacing with information services
Liaison with statutory undertakings and bodies
General appreciation of the quality of that communication (it could be reported):
LOW quality
It is mere informative communication without a clear link with
safety level
MEDIUM
Communication seems to be useful to keep the level of safety in the
workplace
HIGH Communication seem to be useful to enhance the level of safety in
the workplace
5
Responsibility for safety in the workplace It is characteristic of this industry to work with a high proportion of workers from sub-contractor companies or even self-employees. Nevertheless, the main contractor is the only legally responsible for safety on the
site. Subcontractors are legally required to co-operate with the main contractor to guarantee the safety of the workplace.
This section is aimed to explore in what degree the main contractor has assumed that responsibility, but also the degree and difficulties it can have in relation with co-operation with sub-contractors and employees in
general in safety related aspects.
Responsibility for safety
Does the main contractor take responsibility for [all, some or none of] the safety
duties and rights of all staff (for example, safety requirements and equipment are
controlled and given by her), or rather it is thought that the safety of the
workforce is responsibility of the specific sub-contractors?
If only some responsibilities are taken, which ones?
What are your responsibilities for safety issues on site?
Assumption of responsibility by main contractor for the general level of safety in the workplace:

142
NONE
Company tries to delegate her legal responsibility on subcontractors and workers.
SOME
Company assumes only some responsibilities for the general safety of the workplace
ALL Company assumes its responsibility for the general safety of the
workplace.
Co-operation:
Between main contractor and subcontractors
What is the level of co-operation between the main contractor and the different
sub-contractors to handle safety on site?
What percentage of subcontractors effectively co-operate with the main
contractor?
Are the different subcontractors and safety representatives taken into account in
safety meetings and discussions?
Is co-operation addressed in the safety plan of the company?
Are there any difficulties to keep the level of co-operation in site? Which ones?
What‘s your role in keeping the level of co-operation in site?
Quantity of co-operation between agents in the workplace: What is the level of co-operate with main contractor in respect with safety? Low Medium High
Monthly meetings. Weekly meetings Daily meetings.

Appendix E
Explanation of
Site Observational Checklist
and
Recommended Practice
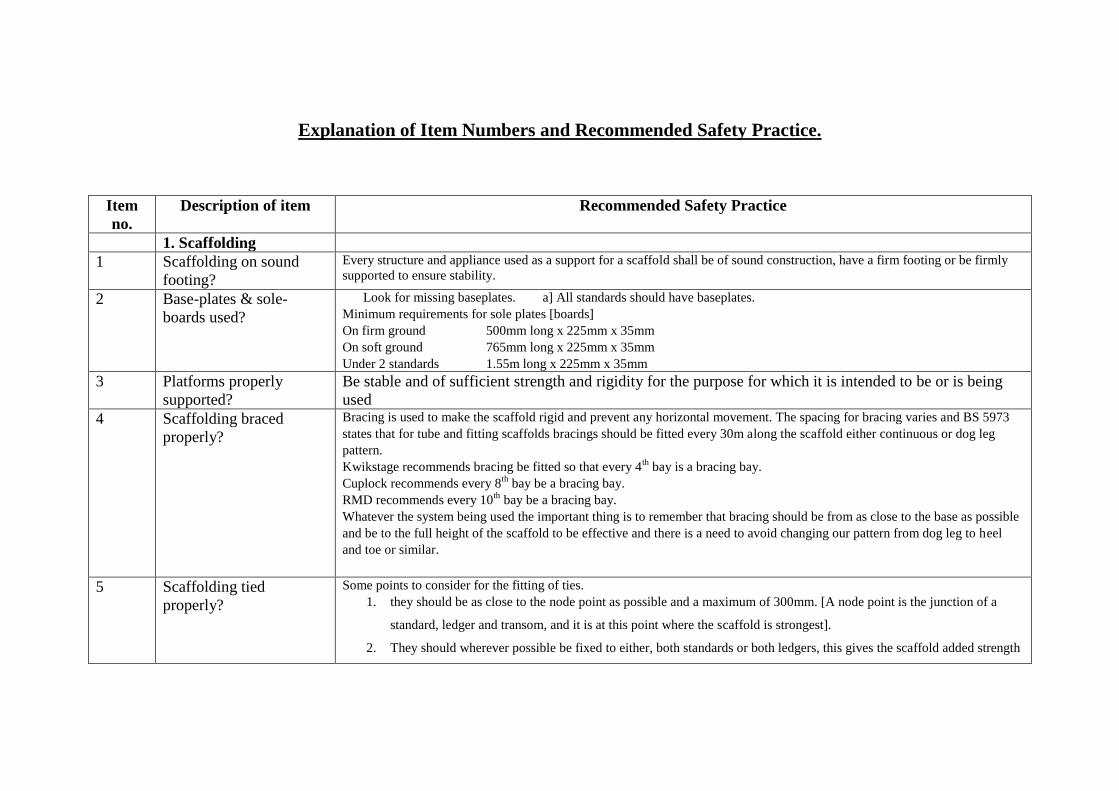
Explanation of Item Numbers and Recommended Safety Practice.
Item
no.
Description of item Recommended Safety Practice
1. Scaffolding
1 Scaffolding on sound
footing?
Every structure and appliance used as a support for a scaffold shall be of sound construction, have a firm footing or be firmly
supported to ensure stability.
2 Base-plates & sole-
boards used?
Look for missing baseplates. a] All standards should have baseplates.
Minimum requirements for sole plates [boards]
On firm ground 500mm long x 225mm x 35mm
On soft ground 765mm long x 225mm x 35mm
Under 2 standards 1.55m long x 225mm x 35mm
3 Platforms properly
supported?
Be stable and of sufficient strength and rigidity for the purpose for which it is intended to be or is being
used
4 Scaffolding braced
properly?
Bracing is used to make the scaffold rigid and prevent any horizontal movement. The spacing for bracing varies and BS 5973
states that for tube and fitting scaffolds bracings should be fitted every 30m along the scaffold either continuous or dog leg
pattern.
Kwikstage recommends bracing be fitted so that every 4th
bay is a bracing bay.
Cuplock recommends every 8th
bay be a bracing bay.
RMD recommends every 10th
bay be a bracing bay.
Whatever the system being used the important thing is to remember that bracing should be from as close to the base as possible
and be to the full height of the scaffold to be effective and there is a need to avoid changing our pattern from dog leg to heel
and toe or similar.
5 Scaffolding tied
properly?
Some points to consider for the fitting of ties.
1. they should be as close to the node point as possible and a maximum of 300mm. [A node point is the junction of a
standard, ledger and transom, and it is at this point where the scaffold is strongest].
2. They should wherever possible be fixed to either, both standards or both ledgers, this gives the scaffold added strength
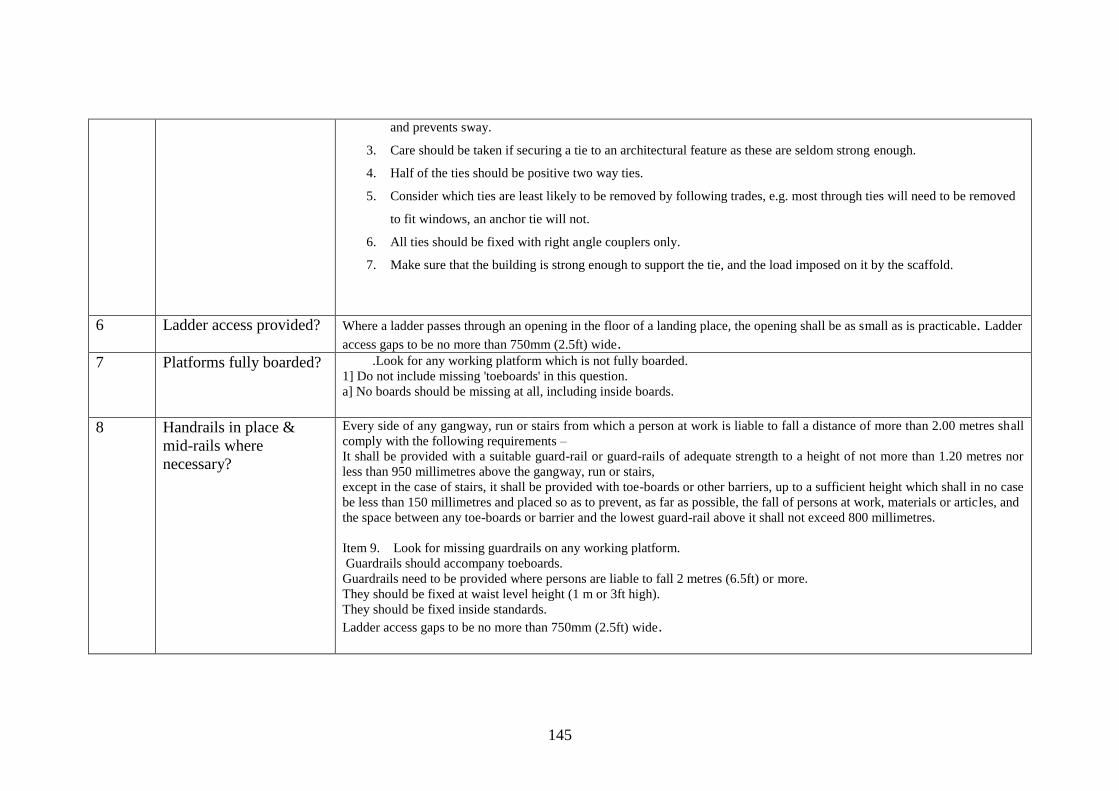
145
and prevents sway.
3. Care should be taken if securing a tie to an architectural feature as these are seldom strong enough.
4. Half of the ties should be positive two way ties.
5. Consider which ties are least likely to be removed by following trades, e.g. most through ties will need to be removed
to fit windows, an anchor tie will not.
6. All ties should be fixed with right angle couplers only.
7. Make sure that the building is strong enough to support the tie, and the load imposed on it by the scaffold.
6 Ladder access provided? Where a ladder passes through an opening in the floor of a landing place, the opening shall be as small as is practicable. Ladder
access gaps to be no more than 750mm (2.5ft) wide. 7 Platforms fully boarded? .Look for any working platform which is not fully boarded.
1] Do not include missing 'toeboards' in this question.
a] No boards should be missing at all, including inside boards.
8 Handrails in place &
mid-rails where
necessary?
Every side of any gangway, run or stairs from which a person at work is liable to fall a distance of more than 2.00 metres shall
comply with the following requirements –
It shall be provided with a suitable guard-rail or guard-rails of adequate strength to a height of not more than 1.20 metres nor
less than 950 millimetres above the gangway, run or stairs,
except in the case of stairs, it shall be provided with toe-boards or other barriers, up to a sufficient height which shall in no case
be less than 150 millimetres and placed so as to prevent, as far as possible, the fall of persons at work, materials or articles, and
the space between any toe-boards or barrier and the lowest guard-rail above it shall not exceed 800 millimetres.
Item 9. Look for missing guardrails on any working platform.
Guardrails should accompany toeboards.
Guardrails need to be provided where persons are liable to fall 2 metres (6.5ft) or more.
They should be fixed at waist level height (1 m or 3ft high).
They should be fixed inside standards.
Ladder access gaps to be no more than 750mm (2.5ft) wide.
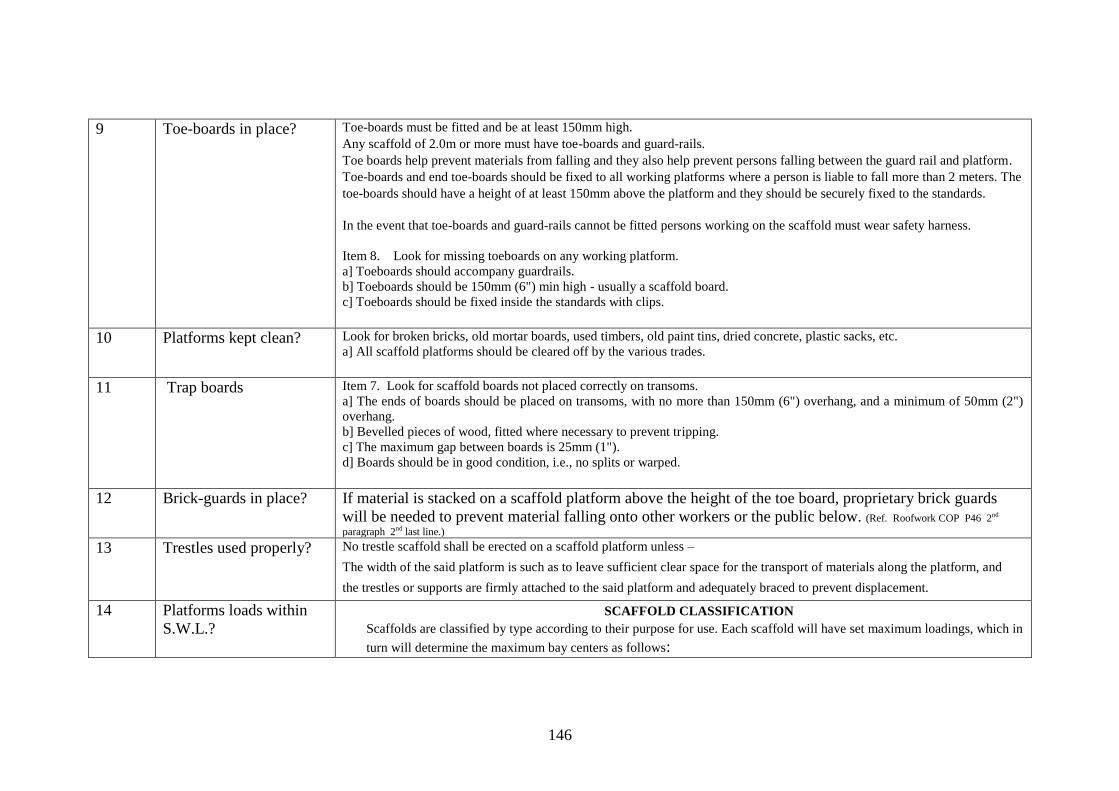
146
9 Toe-boards in place? Toe-boards must be fitted and be at least 150mm high.
Any scaffold of 2.0m or more must have toe-boards and guard-rails.
Toe boards help prevent materials from falling and they also help prevent persons falling between the guard rail and platform.
Toe-boards and end toe-boards should be fixed to all working platforms where a person is liable to fall more than 2 meters. The
toe-boards should have a height of at least 150mm above the platform and they should be securely fixed to the standards.
In the event that toe-boards and guard-rails cannot be fitted persons working on the scaffold must wear safety harness.
Item 8. Look for missing toeboards on any working platform.
a] Toeboards should accompany guardrails.
b] Toeboards should be 150mm (6") min high - usually a scaffold board.
c] Toeboards should be fixed inside the standards with clips.
10 Platforms kept clean? Look for broken bricks, old mortar boards, used timbers, old paint tins, dried concrete, plastic sacks, etc.
a] All scaffold platforms should be cleared off by the various trades.
11 Trap boards Item 7. Look for scaffold boards not placed correctly on transoms.
a] The ends of boards should be placed on transoms, with no more than 150mm (6") overhang, and a minimum of 50mm (2")
overhang.
b] Bevelled pieces of wood, fitted where necessary to prevent tripping.
c] The maximum gap between boards is 25mm (1").
d] Boards should be in good condition, i.e., no splits or warped.
12 Brick-guards in place? If material is stacked on a scaffold platform above the height of the toe board, proprietary brick guards
will be needed to prevent material falling onto other workers or the public below. (Ref. Roofwork COP P46 2nd
paragraph 2nd last line.) 13 Trestles used properly? No trestle scaffold shall be erected on a scaffold platform unless –
The width of the said platform is such as to leave sufficient clear space for the transport of materials along the platform, and
the trestles or supports are firmly attached to the said platform and adequately braced to prevent displacement.
14 Platforms loads within
S.W.L.?
SCAFFOLD CLASSIFICATION
Scaffolds are classified by type according to their purpose for use. Each scaffold will have set maximum loadings, which in
turn will determine the maximum bay centers as follows:

147
Type of
Scaffold
Use of
Scaffold
Platform
loadings
Number
of boards
& std, crs
Maximum
working
Platforms
Maximum
bay centers
Typical load
examples per
bay KN/m2 Kg/m
2
Very light duty
Independent
Inspection,
Painting,
Light Access
0.75
76
3
[0.77m]
1
2.7m
No materials, 1
man + tools
Light duty
Independent
Plasterers,
Painting,
Cleaning
1.5
153
4
[1.0m]
2
2.4m
2 men + 175 kg
materials
General
purpose
Independent
Building
work, light
brickwork
2.0
204
5
[1.2m]
2 + 1 very
light duty
2.1m
1 man + 350 kg
materials
Heavy duty
Independent
Brickwork,
Heavy
cladding
2.5
255
5
[1.2m]
2 + 1 very
light duty
2.0m
2 men + 250 kg
materials
Special or
Masonry
independent
Masonry
work,
Concrete,
Block work
3.0
306
6
[1.45m]
1 + 1 very
light duty
1.8m
2 men + 400 kg
materials
Putlog Scaffold New
Brickwork
2.5
255
5
[1.2m]
1
2.0m
1 man + 400
bricks
Light duty
Birdcage
Inspection,
Painting,
Cleaning
0.75
76
Fully
Boarded
1
2.5m
No materials 1
man+ tools
Hoist Tower To encage
Hoist
N/A N/A Nil N/A To suit
Hoist
No loading
2. Ladder access to
heights
15 Proper ladders in use? Check for ladders that are too short for the job.
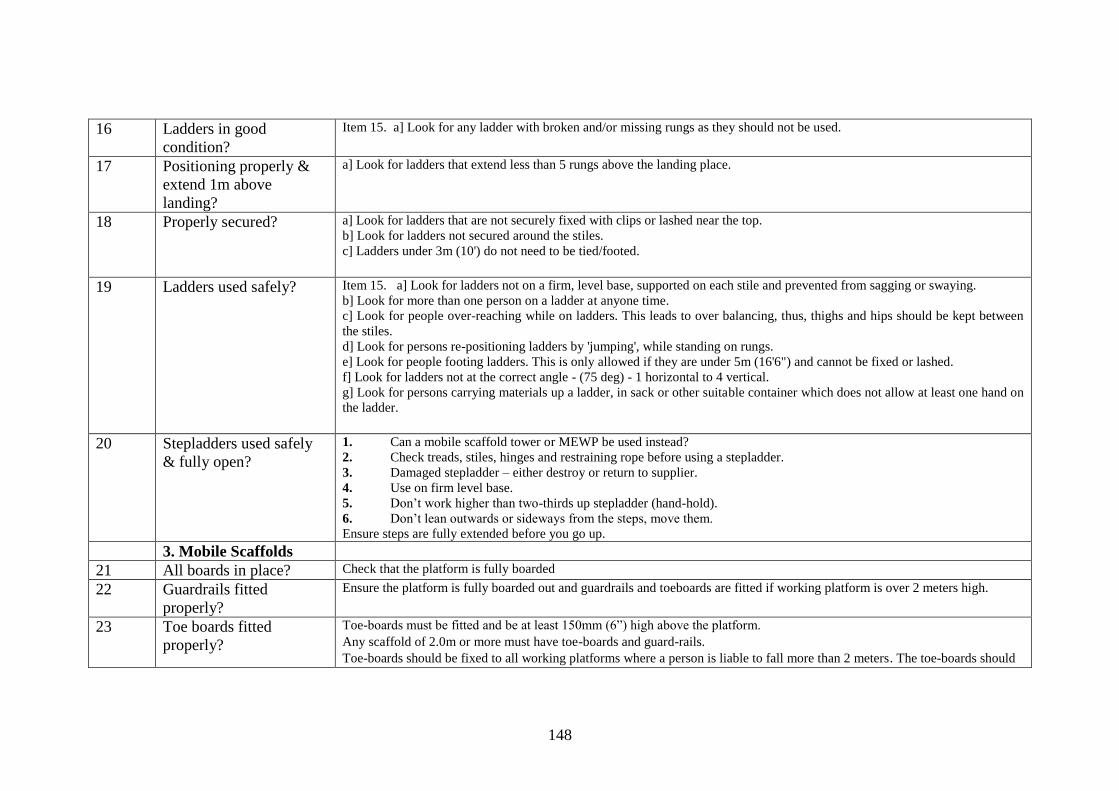
148
16 Ladders in good
condition?
Item 15. a] Look for any ladder with broken and/or missing rungs as they should not be used.
17 Positioning properly &
extend 1m above
landing?
a] Look for ladders that extend less than 5 rungs above the landing place.
18 Properly secured? a] Look for ladders that are not securely fixed with clips or lashed near the top.
b] Look for ladders not secured around the stiles.
c] Ladders under 3m (10') do not need to be tied/footed.
19 Ladders used safely? Item 15. a] Look for ladders not on a firm, level base, supported on each stile and prevented from sagging or swaying.
b] Look for more than one person on a ladder at anyone time.
c] Look for people over-reaching while on ladders. This leads to over balancing, thus, thighs and hips should be kept between
the stiles.
d] Look for persons re-positioning ladders by 'jumping', while standing on rungs.
e] Look for people footing ladders. This is only allowed if they are under 5m (16'6") and cannot be fixed or lashed.
f] Look for ladders not at the correct angle - (75 deg) - 1 horizontal to 4 vertical.
g] Look for persons carrying materials up a ladder, in sack or other suitable container which does not allow at least one hand on
the ladder.
20 Stepladders used safely
& fully open?
1. Can a mobile scaffold tower or MEWP be used instead?
2. Check treads, stiles, hinges and restraining rope before using a stepladder.
3. Damaged stepladder – either destroy or return to supplier.
4. Use on firm level base.
5. Don‘t work higher than two-thirds up stepladder (hand-hold).
6. Don‘t lean outwards or sideways from the steps, move them.
Ensure steps are fully extended before you go up.
3. Mobile Scaffolds
21 All boards in place? Check that the platform is fully boarded
22 Guardrails fitted
properly?
Ensure the platform is fully boarded out and guardrails and toeboards are fitted if working platform is over 2 meters high.
23 Toe boards fitted
properly?
Toe-boards must be fitted and be at least 150mm (6‖) high above the platform.
Any scaffold of 2.0m or more must have toe-boards and guard-rails.
Toe-boards should be fixed to all working platforms where a person is liable to fall more than 2 meters. The toe-boards should

149
have a height of at least 150mm above the platform and they should be securely fixed to the standards.
In the event that toe-boards and guard-rails cannot be fitted persons working on the scaffold must wear safety harness.
Look for missing toeboards on any working platform.
a] Toeboards should accompany guardrails.
b] Toeboards should be 150mm (6") min high - usually a scaffold board.
c] Toeboards should be fixed inside the standards with clips.
24 Safe means of access? Never climb up the outside of a tower – use the stairway or ladder on the inside.
25 Ground firm & level? Towers must only be used on firm surfaces. Where the ground is soft, adequate support must be provided. Ensure the tower is
vertical and square. ) Mobile scaffolds be used only on a firm and even surface not so sloping as to involve risk of
instability of the scaffold or any load thereon,
26 Tower tied to building if
unattended?
Tie the tower to a permanent structure where possible. Check that tower is tied if unattended
27 Wheels locked? Towers must not be used unless the wheels are locked.
28 Base height ratio O.K.
e.g. (1-3)?
Base height ratio. Follow manufacturer‘s instructions on base to height ratio.
29 Clear of people &
material when being
moved?
Check that tower is not moved if persons or materials are still on the platform. Check that tower is not pulled along while
standing on it.
30 Scaffold used safely Check that the manufacturer‘s SWL for the tower is not exceeded. When working, ensure access hatch is closed on platform.
4. Workplace access
31 Clear Access routes? Look for rubbish/debris on all areas of the site, including all floor levels.
a] Walkways, access routes and staircases should be free from rubbish/debris?
32 Safe footing? Look for rubbish, debris, materials, trip hazards, timber or materials with protruding nails on all areas of the site that is a source
of danger to persons on site.
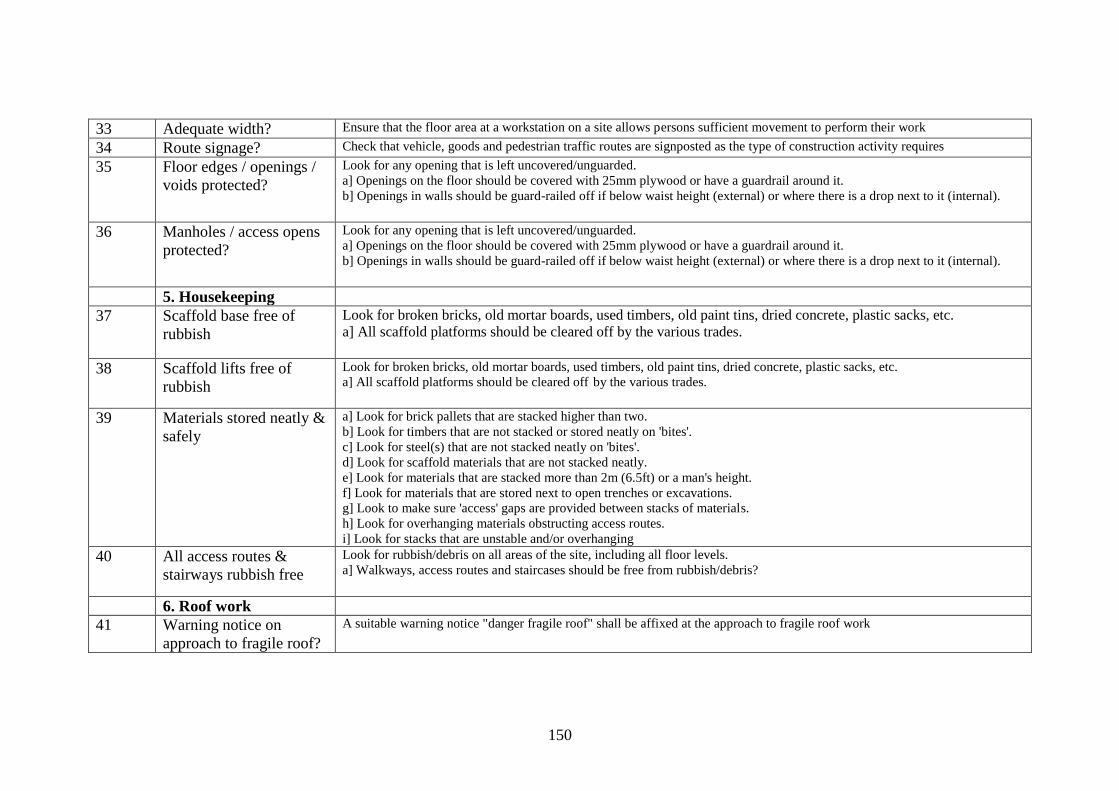
150
33 Adequate width? Ensure that the floor area at a workstation on a site allows persons sufficient movement to perform their work
34 Route signage? Check that vehicle, goods and pedestrian traffic routes are signposted as the type of construction activity requires
35 Floor edges / openings /
voids protected?
Look for any opening that is left uncovered/unguarded.
a] Openings on the floor should be covered with 25mm plywood or have a guardrail around it.
b] Openings in walls should be guard-railed off if below waist height (external) or where there is a drop next to it (internal).
36 Manholes / access opens
protected?
Look for any opening that is left uncovered/unguarded.
a] Openings on the floor should be covered with 25mm plywood or have a guardrail around it.
b] Openings in walls should be guard-railed off if below waist height (external) or where there is a drop next to it (internal).
5. Housekeeping
37 Scaffold base free of
rubbish
Look for broken bricks, old mortar boards, used timbers, old paint tins, dried concrete, plastic sacks, etc.
a] All scaffold platforms should be cleared off by the various trades.
38 Scaffold lifts free of
rubbish
Look for broken bricks, old mortar boards, used timbers, old paint tins, dried concrete, plastic sacks, etc.
a] All scaffold platforms should be cleared off by the various trades.
39 Materials stored neatly &
safely
a] Look for brick pallets that are stacked higher than two.
b] Look for timbers that are not stacked or stored neatly on 'bites'.
c] Look for steel(s) that are not stacked neatly on 'bites'.
d] Look for scaffold materials that are not stacked neatly.
e] Look for materials that are stacked more than 2m (6.5ft) or a man's height.
f] Look for materials that are stored next to open trenches or excavations.
g] Look to make sure 'access' gaps are provided between stacks of materials.
h] Look for overhanging materials obstructing access routes.
i] Look for stacks that are unstable and/or overhanging
40 All access routes &
stairways rubbish free
Look for rubbish/debris on all areas of the site, including all floor levels.
a] Walkways, access routes and staircases should be free from rubbish/debris?
6. Roof work
41 Warning notice on
approach to fragile roof?
A suitable warning notice "danger fragile roof" shall be affixed at the approach to fragile roof work
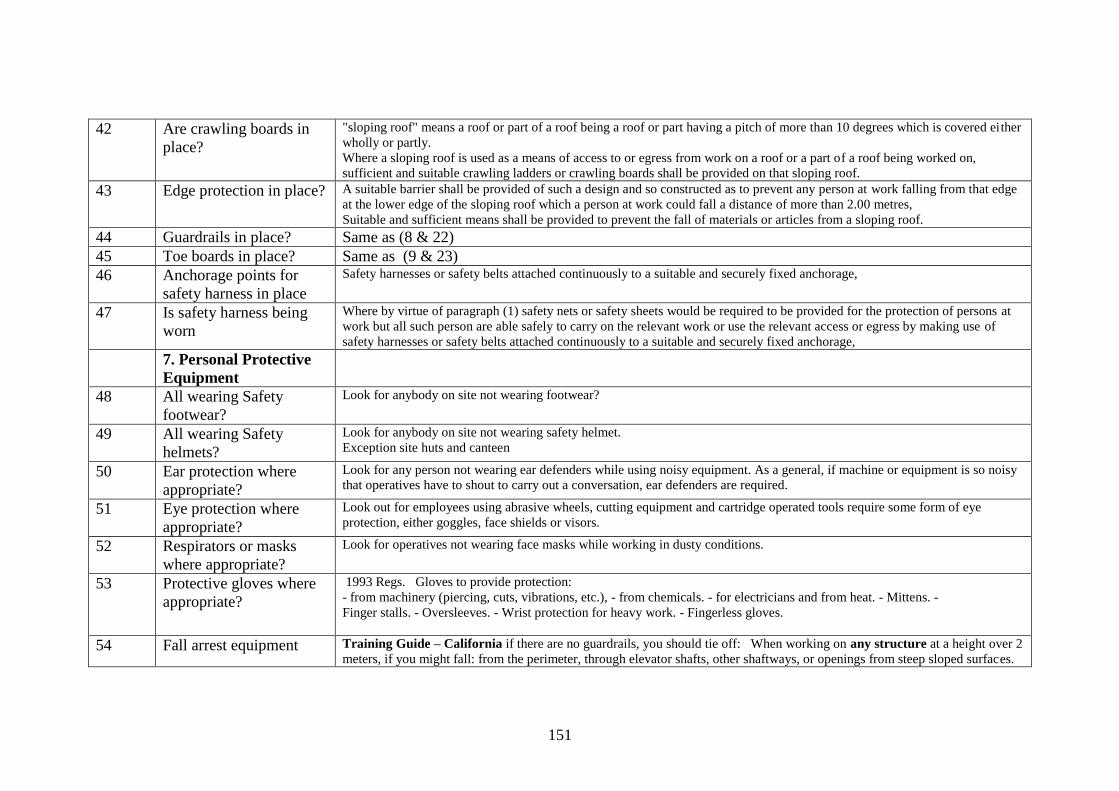
151
42 Are crawling boards in
place?
"sloping roof" means a roof or part of a roof being a roof or part having a pitch of more than 10 degrees which is covered either
wholly or partly.
Where a sloping roof is used as a means of access to or egress from work on a roof or a part of a roof being worked on,
sufficient and suitable crawling ladders or crawling boards shall be provided on that sloping roof.
43 Edge protection in place? A suitable barrier shall be provided of such a design and so constructed as to prevent any person at work falling from that edge
at the lower edge of the sloping roof which a person at work could fall a distance of more than 2.00 metres,
Suitable and sufficient means shall be provided to prevent the fall of materials or articles from a sloping roof.
44 Guardrails in place? Same as (8 & 22)
45 Toe boards in place? Same as (9 & 23)
46 Anchorage points for
safety harness in place
Safety harnesses or safety belts attached continuously to a suitable and securely fixed anchorage,
47 Is safety harness being
worn
Where by virtue of paragraph (1) safety nets or safety sheets would be required to be provided for the protection of persons at
work but all such person are able safely to carry on the relevant work or use the relevant access or egress by making use of
safety harnesses or safety belts attached continuously to a suitable and securely fixed anchorage,
7. Personal Protective
Equipment
48 All wearing Safety
footwear?
Look for anybody on site not wearing footwear?
49 All wearing Safety
helmets?
Look for anybody on site not wearing safety helmet.
Exception site huts and canteen
50 Ear protection where
appropriate?
Look for any person not wearing ear defenders while using noisy equipment. As a general, if machine or equipment is so noisy
that operatives have to shout to carry out a conversation, ear defenders are required.
51 Eye protection where
appropriate?
Look out for employees using abrasive wheels, cutting equipment and cartridge operated tools require some form of eye
protection, either goggles, face shields or visors.
52 Respirators or masks
where appropriate?
Look for operatives not wearing face masks while working in dusty conditions.
53 Protective gloves where
appropriate?
1993 Regs. Gloves to provide protection:
- from machinery (piercing, cuts, vibrations, etc.), - from chemicals. - for electricians and from heat. - Mittens. -
Finger stalls. - Oversleeves. - Wrist protection for heavy work. - Fingerless gloves.
54 Fall arrest equipment Training Guide – California if there are no guardrails, you should tie off: When working on any structure at a height over 2
meters, if you might fall: from the perimeter, through elevator shafts, other shaftways, or openings from steep sloped surfaces.
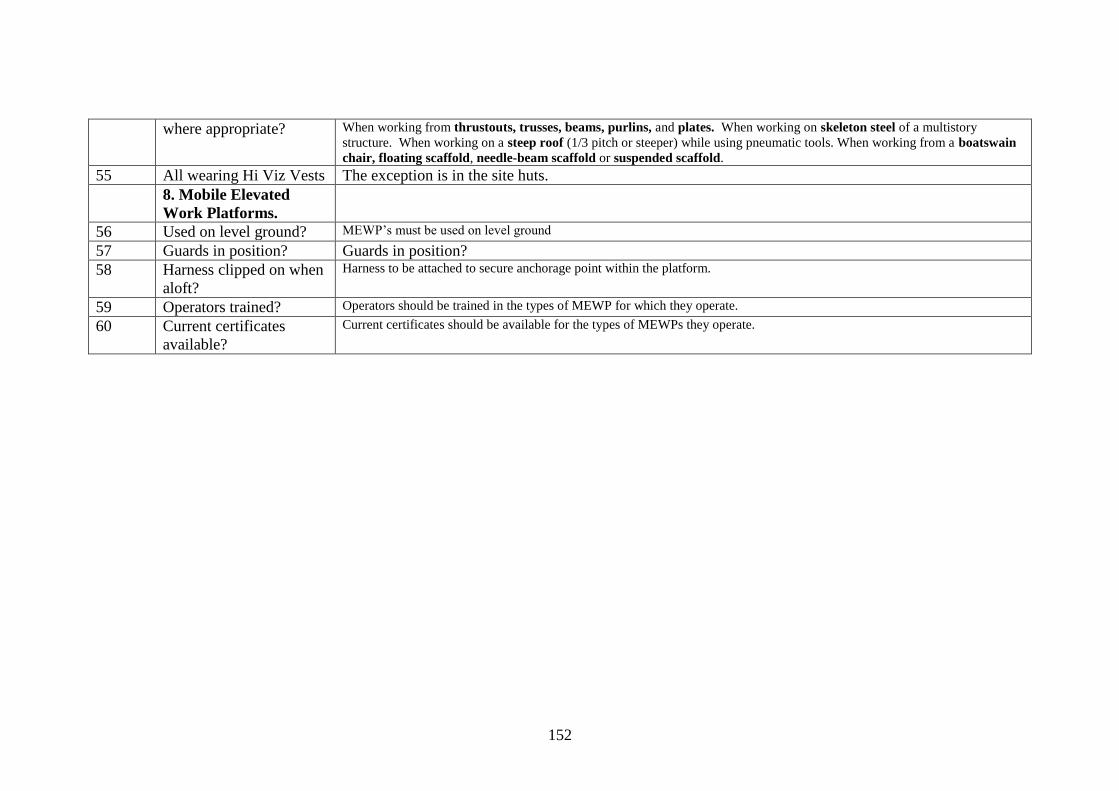
152
where appropriate? When working from thrustouts, trusses, beams, purlins, and plates. When working on skeleton steel of a multistory
structure. When working on a steep roof (1/3 pitch or steeper) while using pneumatic tools. When working from a boatswain
chair, floating scaffold, needle-beam scaffold or suspended scaffold.
55 All wearing Hi Viz Vests The exception is in the site huts.
8. Mobile Elevated
Work Platforms.
56 Used on level ground? MEWP‘s must be used on level ground
57 Guards in position? Guards in position?
58 Harness clipped on when
aloft?
Harness to be attached to secure anchorage point within the platform.
59 Operators trained? Operators should be trained in the types of MEWP for which they operate.
60 Current certificates
available?
Current certificates should be available for the types of MEWPs they operate.

REFERENCES
Abraham, D.M., McGlothlin, J.D., Halpin, D.W., Hinze, J. (2004) Construction Safety Alliance (CSA)
Examining Causes of Construction Injuries and Defining Best Practices: Improve Safety Performance.
Construction Information Quarterly, 6, (1) 9.
“A statistical portrait of health and safety at work in the construction industry”. available at the
European Agency for Safety and Health at Work website http://osha.europa.eu/publications/magazine/7
(2004)
Booth, R.T. & Lee, T.R. (1995) The role of human factors and safety culture in safety management.
Journal of Engineering Manufacture, 209 pp 396-399.
Brabazon, P. Tipping, A., Jones, J., (2000) Construction health and safety for the new millennium,
Health and Safety Executive, Contract Research Report 313/2000.
BS 8800 (1996). Guide to Occupational Health & Safety management Systems. London: British
Standards Institution:
Carruthers, D. R. (2002) Application of the Construction Site Directive in the EuropeanMember States.
European Conference jointly organised by FIEC and EFBWW, Brussels, 19-20 September, 2002
Central Statistics Office, CSO (1995-1997) Persons in employment (ILO) classified by NACE
Economic Sector. (Construction) 1995-1997, April
retrievable at www.cso.ie
Central Statistics Office, CSO Quarterly National Household Survey classified by ILO Economic
Status. (Construction) 1998-2005
retrievable at www.cso.ie/qnhs/main_result_qnhs.htm
Central Statistics Office, Construction Employees by Nationality Q4 (2005) retrievable at
www.cso.ie/newsevents/pr_contstructhouse.htm
Centre of Occupational Health, University of Manchester (ODIN) Occupational Disease Intelligence
Network
Chhokar, J.S. and Wallin, J.A. (1994) “Improving safety through applied behaviour analysis”. Journal
of Safety Research, Vol. 15 No. 4, pp. 141-51
CIF (2001) The Construction Industry Federation Ireland, retrievable at www.cif.ie
CIF (2005) The Construction Industry Federation Ireland, retrievable at www.cif.ie
Construction Safety Partnership Agreement 1999 Health and Safety Authority, 10 Hogan Place, Dublin
2. H.S.A. (1999)
154
CSO (1998-2005) Quarterly National Household Survey, Persons in the labour force, with those
classified by sector, (Construction) 1998-2005, September-November retrievable at www.cso.ie
Davies, V.J., Tomasin, K., Construction safety handbook 2nd Ed. Thomas Telford
Publishing 1996
Department of the Environment, Heritage and Local Government Annual Housing Statistics Bulletin
(2004) D.O.E (2004)
Department of the Environment, Heritage and Local Government Annual Housing Statistics Bulletin
(2005)
Dias, L.M.A. (1999). Implementing construction safety systems using quality system methodology. In:
Singh , Hinze & Coble eds. Implementation of Safety and Health on Construction Sites. Rotterdam:
Balkema, 1999, pp 101-113.
Eakins, J. (1992), Leaving it up to the workers: sociological perspectives on the management of health
and safety in small workplaces. International Journal of Health Services, 22 (4), 689-704
ECI 1996 European Construction Institute, Total project management of construction safety health and
environment. 2nd Ed.. 1996 Thomas Telford Publishing
European Agency for Safety and Health at Work 2004. retrievable at
http://agency.osha.eu.int/publications/magazine/7en/index _1.htm
European agency for Safety and Health at Work 2004 (Bilbao Declaration, “Building in Safety” 22
November (2004)
European agency for Safety and Health at Work (2004). Fatal accidents rate per 100,000 workers in
construction retrievable at http://osha.europa.eu/publications/factsheets/55
EU-15, Belgium, Germany, France, Italy, Luxembourg, Netherlands, Denmark, Ireland, United
Kingdom, Greece, Spain, Portugal, Reunification of Germany in 1990 brought in the East German,
Austria, Finland and Sweden. Retrievable at
http://www.bond.org.uk/eu/introeu.html
EU-25, Belgium, Germany, France, Italy, Luxembourg, Netherlands, Denmark, Ireland, United
Kingdom, Greece, Spain, Portugal, Reunification of Germany in 1990 brought in the East German,
Austria, Finland, Sweden, Cyprus, the Czech Republic, Estonia, Hungary, Latvia, Lithuania, Malta,
Poland, Slovenia and Slovakia. Retrievable at http://www.bond.org.uk/eu/introeu.html
European Agency for Safety and Health at Work (2005).
Improving safety for working at height by using ready assembled scaffolding
retrievable at http://osha.europa.eu/publications/reports/108/index_5.htm
European Agency for Safety and Health at Work (2005).
Actions to improve safety and health in the construction industry
retrievable at http://osha.europa.eu/publications/magazine/7/magazine7_en.pdf

155
European Agency for Safety and Health at Work (2005). Fact sheet 55
Achieving better safety and health in construction
retrievable at http://osha.europa.eu/publications/factsheets/55/
European Agency for Safety and Health at Work (2005).
retrievable at http://agency.osha.eu.int/publications/reports/108/index.htm
European Agency for Safety and Health at Work (2005).
retrievable at http://agency.osha.eu.int/publications/reports/108/en/index._1.htm
European Agency for Safety and Health at Work (2005).
The Silent Book – pictorial information and promotional material
retrievable at http://osha.europa.eu/publications/reports/108/index_14.htm
European Agency for Safety and Health at Work (2005).
retrievable at http://agency.osha.eu.int/publications/reports/108/en/index._17.htm
European Agency for Safety and Health at Work (2005).
A safety competition in the construction industry using effective monitoring systems.
retrievable at http://osha.europa.eu/publications/reports/108/index_3.htm
European Statistics on Accidents at Work ESAW (2001)
European Construction Campaign (2003). retrievable at
http://osha.europa.eu/good_practice/sector/construction/slic/slic_report_en.pdf
European Survey of Working Conditions ESWC (2000)
European Statistics on Accidents at Work ESAW (2001) preliminary data
Eurostat (2000). Accidents at work with more than 3 days absence from work & fatalities at work.
Luxembourg: Office for Official Publications of the European Communities.
Fielding, J.E. and Piserchia, P. V. (1989) Frequency of worksite health promotion activities. American
Journal of Public Health, 79(1): 16-20
Furnham, A. (1994) Personality at Work, Routledge, London.
Gambatese, J.A., Hinze, J.W., Haas, C.T. (1997) Tool to Design for Construction Worker Safety.
Journal of Architectural Engineering, 3, (1) 32.
Garza, J.M.D.L., Hancher, D.E., Decker, L. (1998) Analysis of Safety Indictors in Construction.
Journal of Construction Engineering and Management, 124, (4) 312.
Gibb, A.G.F., Neale, R.H. (1997) Management of Prefabrication for Complex Cladding: Case Study.
Journal of architectural Engineering, 3, (2) 60.
Goldstein, I. L. (1993) Training in Organisations, 3rd
Edn, Brookes/Cole, Pacific Grove, CA.
156
Guidelines on occupational safety and health management systems, International Labour Office,
Geneva, ILO – OSH 2001
Harper, R.S., Koehn, E. (1998) Managing Industrial Construction Safety in Southeast Texas. Journal
of Construction Engineering and Management, 124, (6) 452.
Hollander, R.B. and Lengermann, J. J. (1988) Corporate characteristics and worksite health promotion
programs: survey findings from Fortune 500 companies. Social Science and Medicine, 26 (5): 491-
501.
Holmes, N. (1995) Workplace understandings and perceptions of risk on OHS, Ph. D. thesis, Monash
University, Australia.
Health and Safety Authority (1998) Summary of information from survey into fatal accidents1995-1997
Construction Industry.
H.S.A (2003) Report of visits to designers undertaken by H.S.A. inspectors in (2001-2002), available in
PDF format on the H.S.A. website, retrievable at www.hsa.ie
H.S.A. (2002b) Construction Safety Partnership Plan (2000-2002)
Health and Safety Authority, 10 Hogan Place Dublin 2.
H.S.A. 1995 Guidelines to the Safety Health and Welfare (Construction) Regulations 1995 Health and
Safety Authority, 10 Hogan Place Dublin 2.
Health and Safety Authority (1999b). Code of Practice for Access and Working Scaffolds. Dublin:
HSA.
Health and Safety Authority (1995). Annual report. Dublin: H.S.A.
Health and Safety Authority (1996). Annual report. Dublin: H.S.A.
Health and Safety Authority (1997). Annual report. Dublin: H.S.A.
Health and Safety Authority (1998). Annual report. Dublin: H.S.A.
Health and Safety Authority (1999). Annual report. Dublin: H.S.A.
Health and Safety Authority (2000). Annual report. Dublin: H.S.A.
Health and Safety Authority (2001a). Annual report. Dublin: HSA.
Health and Safety Authority (2002). Annual report. Dublin: H.S.A.
Health and Safety Authority (2003. Annual report. Dublin: H.S.A.
Health and Safety Authority (2004. Annual report. Dublin: H.S.A.
Health and Safety Authority (2005). Annual report. Dublin: H.S.A.)

157
Health and Safety Authority (2002b) Fatal accidents in the Irish Construction Industry 1991-2001: A
survey of contributory factors. Dublin H.S.A. (2002)
Health and Safety Authority, An examination of duty holder responsibilities: Fatal construction
accidents 1997-2002. Dublin H.S.A. (2003)
H.S.A (2003) Report of visits to designers undertaken by H.S.A. inspectors in (2001-2002), available in
PDF format on the H.S.A. website, retrievable at www.hsa.ie
HSA ―Workplace Safety and Health Management‖ publication
HSE Books, ISBN 0 7176 6105 9. (2005)
HSE web site www.hse.gov.uk/statistics/industry (2004)
HSE (1994), Construction Design and Maintenance Regulations (1994) HMSO
HSE Occupational Health Statistics Bulletin (2003-2004) retrievable at
http:www.hse.gov.uk/statistics/causdis//swi0102.pdf
HSE Occupational Health Statistics Bulletin (2003-2004) retrievable at
http:www.hse.gov.uk/statistics/causdis/lungcan.htm
HSE Occupational Health Statistics Bulletin (2003-2004) retrievable at
http::www.hse.gov.uk/statistics/causdis/musc.htm
HSE Occupational Health Statistics Bulletin (2003-2004) retrievable at
http:www.hse.gov.uk/statistics/disease.htm
HS (G) 65 (1991). Successful Health and Safety Management. London: HSE (HS (G) 65, 1991).
HSE 1997 Successful Health and Safety Management HS(G)65 The Health and Safety Executive
Health and Safety Executive, Occupational Health Statistics Bulletin 2003/2004
http://www.hse.gov.uk/statistics/overall/ohsb0304.pdf
Health and Safety Executive, Occupational Ill Health in the Construction Industry, Statistical fact sheet
(Last up dated May 2004) retrievable at
http://www.hse.gov.uk/statistics/industry/factcon.pdf
Health and Safety Executive, Statistics of Fatal Injuries (2002/03) Fatal Injuries to Workers in
Construction (P8). retrievable at
http://www.hse.gov.uk/statistics/overall/fatl0203.pdf
H.S.A (2005) Safe System of Work Plan retrievable at
http://www.hsa.ie/publisher/index.jsp?aID=1447&nID=428&pID=427
H.S.A (2006) Safe System of Work Plan, International award retrievable at
158
http://www.hsa.ie/publisher/index.jsp?aID=1797&nID=508&pID=96
Health and Safety Executive, (2005) retrievable at http://www.hse.gov.uk/construction/index.htm
Health and Safety Review (2005) HSR Vol. 9 Issue 8 Developing an OHSMS –an auditor‘s perspective
Health and Safety Review (2005) retrievable at http://www.healthandsafetyreview.ie/
Health and Safety Review (2004) retrievable at http://www.healthandsafetyreview.ie/
Hinze, J., Wilson, G. (2000) Moving toward a Zero Injury Objective. Journal of Construction
Engineering and Management, 126, (5) 399.
Hinze, J. Gambatese, J. (2003) Factors That Influence Safety Performance of Specialty Contractors.
Journal of Construction Engineering and Management, 129, (2) 159.
Ireland, Inspection Blitz European Construction Campaign, HSA (2003).
Jaselskis, E.J., Anderson, S. D. & Russell, J.S. (1996). Strategies for Achieving Excellence in
Construction Safety Performance. Journal of Construction Engineering and Management, 13 (1), 61-
70.
Jaselskis, EJ., Anderson, S.D., Russell, J.S. (1996) Strategies for Achieving Excellence in Construction
Safety Performance. Journal of Construction Engineering and Management, 122, (1) 61.
Johnson, H.M., Singh, A.,Young, R.H.F. (1998) Fall Protection Analysis for Workers on Residential
Roofs. Journal of Construction Engineering and Management, 124 (5) 418.
Kashiwagi, D., Savicky, J. (2004) Quality and Safety in Construction is a Supply and Demand Issue.
Construction Information Quarterly, 6, (1) 17.
Kievani, R.M., Ghanbari, A.R.& Kagaya, S. (1999). ISO 9000 standards: perceptions and experiences
in the U.K. Construction Industry. Construction management and Economics, 17,107-119.
King, R. W. and Hudson, R. (1985) Construction Hazard and Safety Handbook, Butterworths, London.
Koehn, E. and Surabhi, M.R. (1996)”Future changes/improvements in construction safety.” Proc,
Civil Engineers Influencing Public Policy, ASCE, Reston, Va., 121-128
Koehn, E. and Datta, N.K. (2003) “Quality, Environmental and Health and Safety Management
Systems for Construction Engineering.” Journal of Construction Engineering and Management, 129 (5)
562
Langford, D., Rowlinson. & Sawacha, E. (2000). Safety behaviour and safety management: Its
influence on the attitudes of workers in the UK construction industry. Engineering Construction and
Architectural Management, 7 (2), 133-141.

159
Levitt, R. E. and Parker, H. W. (1976) “Reducing construction accidents --- Top management role.” J.
Constr. Div., ASCE, 102(3), 465—458
Lindell, M. K. (1994) Occupational Medicine: State of the art Reviews, Vol. 9, No. 2, Hanley and
Belfus, Philadelphia, PA, pp. 211-40
Lingard, H. (2002) The effect of first aid training on Australian construction workers’ occupational
health and safety knowledge motivation to avoid work-related injury or illness. Construction
Management and Economics, 20, (3) 263.
Lingard, H. (2001) The effect of first aid training on objective safety behaviour in Australian small
business construction firms. Construction Management and Economics, 19, (6) 611.
Lingard, H., Holmes, N. (2001) Understandings of occupational health and safety risk control in
small business construction firms: barriers implementing technological controls. Construction
Management and Economics, 19, (2) 217.
Lingard, H., Rowlinson, S. (1998) Behaviour-based safety management in Hong Kong’s construction
industry: the results of a field study. Construction Management and Economics, 16, (4) 481.
Lingard, H. (2001) The effect of first aid training on objective safety behaviour in Australian small
business construction firms. Construction Management and Economics, 19(6), 611-8
Liska, R. W,. Goodloe, D,. and Sen, R. (1993)‖Zero accidents techniques.” Source Document 86,
Constr. Industry Inst, Univ. of Texas at Austin Texas.
(cited by Jaselskis 1996 Res. 48)
Mattila, M. and Hyodynmaa, M. (1998), “Promoting job safety in building: an experiment on the
behaviour analysis approach”. Journal of Occupational Accidents, Vol 9. pp. 255-67
Marsh, T.W., Robertson, I.T., Duff, A.R., Phillips, R.A., Cooper, M.D.A. (1995) Improving safety
behaviour using goal setting and feedback. Leadership and Organization Development Journal, 16, (1)
5.
Mc Affee, R.B. and Winn, A.R. (1989), “The use of incentives/feedback to enhance work place safety:
a critique of the literature”. Journal of Safety Research, Vol. 20. No. 1. pp. 7-19.
Mc Donald. N. & Hrymak .V. et al (2002) Safety Behaviour in the Construction Sector. Contract
Research Report, Health and Safety Authority and Health and Safety Executive, Northern Ireland
Mc Hugh. Sean, Seamus (2003), Safety Performance on Three Construction Sites
Mc Kenna, S.P. and Hale, A. R. (1982) Changing behaviour towards danger: the effect of first aid
training. Journal of Occupational Accidents, 4, 47, 209-18
Millar, G. and Agnew, N. (1973) First aid training and accidents. Occupational Psychology, 47, 209-
18
160
Mohamed, S. (2002) Safety Climate in Construction Site Environments. Journal of Construction
Engineering and Management, 128, (5) 375.
Occupational Disease Intelligence Network (ODIN). Centre for Occupational Health, University of
Manchester,
(Occupational 2001). Occupational Safety and Health Administration, Washington, D.C. (2001)
retrievable at www.osha.gov/oshstats (May 2001)
Occupational Ill health in the Construction Industry Statistical fact sheet May 2004
OHSAS 18001 (1999). Occupational Health and Safety Management Systems – Guidelines for the
Implementation of OHSAS 18001. London: British Standard Institution.
Orlandi, M. A. (1986) The diffusion and adoption of worksite health promotion innovations: and
analysis of barriers. Prevention medicine 15, 522-36
Paterson, I (1996) “Reject the code of silence”. J. Am. Soc. Safety Engineers, 7.
Reber, R.A. and Wallin, J.A. (1984), “The effects of training, goal setting, and knowledge of results on
safe behaviour: a component analysis”. Academy of Management Journal Vol. 27 No. 3 pp, 544-60
RIA, Regulatory Impact Assessment, - Safety, Health and Welfare at Work (Construction) Regulations
2006, DoETE Doc No 270/01/02/0048/4, retrievable at
http://www.entemp.ie/publications/employment/2006/riaconstregs.pdf
Rundmo, T. (1994) Associations between organisational factors and safety and contingency measures
on off shore petroleum platforms, Scandinavian Journal of Work Environment and Health, 20, 122-7
Samelson, N. M. and Levitt, R.E. (1982). “Owner’s guidelines for selecting safe contractors.”
J.Consts. Div., ASCE, 108(4), 617--623
Saurin, T.A., Formoso, C.T. and Guimares, L.B.M. (2004) Safety and production: an integrated
planning and control model. Construction Management and Economics, 22, (2) 159.
Safety Health and Welfare at Work (Construction) Regulations 1995
Safety Health and Welfare at Work (Construction) Regulations 2001
Safety Health and Welfare at Work (Construction) Regulations 2006
Safety Health and Welfare at Work Act 1989
Safe-T-Cert (2005) retrievable at http://www.safe-t-cert.ie/sch.htm
(SSWP) ―Safe System of Work Plan‖H.S.A. 2005
Successful health and safety management (2nd
edition), HSG 65, HSE Books, London 1997, ISBN 0
7176 1276 7.
161
U.K self-reported work related Illness (SWI) survey 2001/2002
Williams, P. (1991) Planning factors contributing to ongoing health promotion programs, Journal of
Occupational Health and Safety – Australia and New Zealand, 7, 489-494
Wilson and Keohn John Joe ref ISO 18000 Workplace Safety and Health Management. Published by
the Health and Safety Authority, January 2006. H.S.A. Dublin.
Witte, K. (1993) Managerial style and health promotion programs Social Science and Medicine, 36(3),
227-35.
Young, S. (1996) Construction Safety: A Vision for the Future. Journal of Management in
Engineering, 12, (4) 33.
Zohar, D. (1980). “Safety climate in industrial organisations: Theoretical and applied implications.” J.
Appl. Psychol., 65(1), 96-101.
Zhang, Z., H., Shen, l., Y., Love, P., E., D., & Treloar, G. (1999). A framework for implementing ISO
14000 in construction. Environmental Management and Health, 11(2), 139-148.
162
Bibliograph
Abdelhamid, T.S., Everett, J.G. (2002) Physiological Demands during Construction Work. Journal of
Construction Engineering and Management, 128, (5) 427.
Abudayyeh, O., Federicks, T., Palmquist, M. and Torres, H. (2003) Analyis of Occupational Injuries
and Fatalities in Electrical Contracting Industry. Journal of Construction Engineering and
Management, 129, (2) 152.
Andrews, J.D., Henry, J.J. (1997) A computerized fault tree construction methodology. Proceedings
of the Institution of Mechanical Engineers-E. 211, (3) 171.
ANON. (2003) A new guide from CCFRA will help food companies that are building or refurbishing
premises to avoid costly with the hygienic design and construction of floors for food production areas
and better assure the safety of the products. Nutritition and Food Science, 33, (3) 7.
ANON (1997) The long-term importance of education to raise safety levels and the implementation of
the CDM regulations European building industry. Structural Survey, 15, (2) 87.
ANON (2002) Construction Site Safety. Practice Periodical on Structural Design and Construction,
7, (2) 53
Barnes, R. (1992) Independent auditing of building environments: a property management
responsibility. Property Management, 10, (3).
Bleedorn, K., McKee, M., Yarbough, D., Yu, C., Zechmani, L., Mann, J.A. (2002) Noise source
identification and control of a contractor grade table saw. Journal of the Acoustical Society of America,
111, (5) 2449.
Casas, J.R. (1997) Reliability-Based Partial Safety Factors in Cantilever Construction of Concrete
Bridges. Journal of Structural Engineering-Reston, 123, (3) 305.
Chiang, Y.H., Tang, B.S., Leung, W.Y. (2001) Market structure of the construction industry in Hong
Kong. Construction Management and Economics, 19, (7) 675.
Chua, D.K.H., Goh, Y.M. (2004) Incident Causation Model for Improving Feedback of Safety
Knowledge. Journal of Construction Engineering and Management, 130, (4) 542.
Coble, R..J., Blatter, R.L. (1999) Concerns with Safety in Design/Build Process. Journal of
Architectural Engineering, 5, (2) 44.
Cowburn, M., Dominelli, L. (2001) Masking hememonic masculinity:reconstructing the paedophile as
the dangerous stranger. British Journal of Social Work, 31, (3) 399.
Edwards, D.J., Nicholas, J. (2002) The state of health and safety in the UK construction industry with
a focus on plant operators. Structural Survey, 20, (2) 78.
163
Elazouni, A.M. (1997) Constructability Improvement of Steel Silos during Field Operations. Journal
of Construction Engineering and Management, 123, (1) 21.
Elbeltagi, E., Hegazy, T., Eldosouky, A. (2004) Dynamic Layout of Construction Temporary Facilities
Considering Safety. Journal of Construction Engineering and Management. 130, (4) 534.
Elbeltagi, E., Hegazy, T., Hosny, A.H., Eldosouky, A. (2001) Schedule-dependent evolution of site
layout planning. Construction Management and Economics, 19, (7) 689.
El-Diraby, T.E. , O‘Connor, J.T. (2001) Model for Evaluating Bridge Construction Plans. Journal of
Construction Engineering and Management, 127, (5) 399.
Enshassi, A. (1997) Construction safety issues in Gaza Strip. Building Research and information, 25,
(6) 370.
Ettouney, M., Smilowitz, R., Rittenhouse, T. (1996) Blast Resistant Design of Commercial Buildings.
Practice Periodical on Structural Design and Construction, 1, (1) 31.
Fang, D.P., Huang, X.Y., Hinze, J. (2004) Benchmarking Studies on Construction Safety Management
in China. Journal of Construction Engineering and Management, 130, (3) 424.
Fredericks, T., Abudayyeh, O., Palmquist, M., Torres, H.N. (2002) Mechanical Contracting Safety
issues. Journal of Construction Engineering and Management, 128, (1) 40.
Garza, J.M.D.L., Hancher, D.E., Decker, L. (1998) Analysis of Safety Indictors in Construction.
Journal of Construction Engineering and Management, 124, (4) 312.
Goodrum, P.M., Gangwar, M. (2004) The relationship between changes in equipment technology and
wages in the US construction industry. Construction Management and Economics, 22, (3) 291.
Griffith, A. (2004) Health and Safety Planning for Demolition Projects. Construction Information
Quarterly, 6, (1) 3.
Gyi, D.E., Gibb, A.G.F. , Haslam, R.A. (1999) The quality of accident and health data in the
construction industry: interviews with senior managers. Construction Management and Economics, 17,
(2)197.
Hadikusumo, B.H.W. , Rowlinson, S. (2004) Capturing Safety Knowledge Using Design-for-Safety-
Process Tool. Journal of Construction Engineering and Management, 130, (2) 281.
Haight, R.Q., Billington D.P. , Khazem, D. (1997) Cable Safety Factors for Four Suspension Bridge.
Journal of Bridge Engineering, 2, (4) 157.
Hancher, D.E., Garza, J.M.D.L., Eckert, G.K. (1997) Improving Worker‘s Compensation
Management in Construction. Journal of Construction Engineering and Management, 123, (3) 285.
Hegazy, T., Elbeltagi, E. (1999) EvoSite:Evolution-Based Model for Site Layout Planning. Journal of
Computing in Civil Engineering, 13, (3) 198.

164
Hellmich, C., Sercombe, J., Ulma, F.J., Mang, H. (2000) Modeling of Early-Age Creep of Shotcrete.
II: Application to Tunneling. Journal of Engineering Mechanics – Proceedings of the ASE, 126, (3)
292
Hetherington, T. (1995) Why involve design professionals in construction safety? Structural Survey,
13, (1) 5.
Ho, D.C.P., Ahmed, S.M., Kwan, J.C., Ming, F.Y. (2000) Site Safety Management in Hong Kong.
Journal of Management in Engineering, 16, (6) 34.
Hoffman, D.E. (2003) Worker and Environment Protection Issues in the Remediation of an
Abandoned Source Manufacturing Factors. Health Physics, 84, (2) S30.
Holland, G.R. (1994) Piling Methods - Pros and Cons. Structural Survey, 12, (3) 27.
Issa, R.R.A., Cox, R.F., Killingsworth, C.F. (1999) Impact of Multimedia-Based Instruction on
Learning and Retention. Journal of Computing in Civil Engineering, 13, (4) 281.
Jannadi, O.A., Almishari, S. (2003) Risk Assessment in Construction. Journal of Construction
Engineering and Management, 129, (5) 492.
Kartam, N.A. (1997) Integrating Safety and Health Performance into Construction CPM. Journal of
Construction Engineering and Management, 123 (2) 121.
Kartam, N., Flood, I. (1997) Constructability Feedback Systems: Issues and Illustrative Prototype.
Journal of Performance of Constructed Facilities, 11, (4) 178.
Korve, M.J., Niemeier, D.A. (2002) Benefit-Cost Analysis of Added Bicycle Phase at Existing
Signalized Intersection. Journal of Transportation Engineering, 128, (1) 40.
Laukkanen, T. (1999) Construction work and education:occupation health and safety reviewed.
Construction Management and Economics, 17, (1) 53.
Lee, H.S., Lee, J.Y., Lee, J.S. (1999) Nonshored Formwork System for Top-Down Construction.
Journal of Construction Engineering and Management, 125, (6) 392.
Lee, J., Lorenc, S.J., Bernold, L.E. (1999) Saving Lives and Money with Robotic Trenching and Pipe
Installation. Journal of Aerospace Engineering, 12, (2) 43.
Lee, S., Halpin, D.W. (2003) Predictive Tool for Estimating Accident Risk. Journal of Construction
Engineering and Management, 129, (4) 431.
Lin, K.L., Haas, C.T. (1996) Multiple Heavy Lifts Optimization. Journal of Construction
Engineering and Management, 122, (4) 354.
Liou, D.D. (1999) Thermal Effects in Large-Sized Diaphragm Wall. Journal of Performance of
Constructed Facilities, 13, (1) 17.

165
Loosemore, M. (1998) Psychology of Accident Prevention in the Construction Industry. Journal of
Management in Engineering, 14, (3) 50.
Loosemore, M., Lam, A.S.Y. (2004) The locus of control: a determinant of opportunistic in
construction health and safety. Construction Management and Economics, 22, (4) 385.
Martin, R., Delatte, N.J. (2000) Another Look at the L‘Ambiance Plaza Collapse. Journal of
Performance of Constructed Facilities, 14, (4) 160.
Moon, S., Bernold, L.E. (1998) Graphic-Based Human-Machine Interface for Construction
Manipulator Control. Journal of Construction Engineering and Management, 124, (4) 305.
Nelson, E.J. (2003) Safety as a Value in Engineering and Construction. Leadership and Management
in Engineering, 3, (1) 18.
O‘Connor, J.T., El-Diraby, T.E. (2000) Urban Freeway Bridge Reconstruction Planning: Case of
Mockingbird Bridge. Journal of Construction Engineering and Management, 126, (1) 61.
Ohrn, L.G., Schexnayder, C. (1997) Effect of Performance-Related Specifications on Highway
Construction. Practice Periodical on Structural Design and Construction, 2, (4) 172.
Park, S.W., Lytton, R.L., Button, J.W. (1999) Forensic Investigation of Pavement Distortions Using
Soil Suction. Journal of Transportation Engineering, 125, (1) 60.
Pelikant, A., Turowski, J. (1998) Field and power loss distribution on covers of power transformers.
Compel, 17, (3) 302.
Pongpeng, J., Liston, J. (2003) Contractor ability criteria: a view from the Thai construction industry.
Construction Management and Economics, 21, (3) 267.
Price, S.M. (1997) Strand Jacks: Development as Versatile Tool of Moving Large Structures. Practice
Periodical on Structural Design and Construction, 2, (4) 185.
Revey, G.F. (1996) To Blast or Not to Blast?. Practice Periodical on Structural Design and
Construction, 1, (3) 81.
Rich, P.J. (1997) High-Octane Safety on a Low-Octane Budget. Practice Periodical on Structural
Design and Construction, 2, (1) 25.
Schierle, G.G. (1996) Quality Control in Seismic Design and Construction. Journal of Performance of
Constructed Facilities, 10, (3) 90.
Sii, H.S., Wang, J. (2003) A design-decision support framework for evaluation of design
options/proposals using a composite structur methodology based on the approximate reasoning
approach and the evidential reasoning method. Proceedings of the Institutionof Mechanical Engineers
– E. 217, (1) 59.
Singh, S. (1997) State of the Art in Automation of Earthmoving. Journal Aerospace Engineering, 10,
(4) 179.

166
Shami, M., Kanafani, A. (1997) Coping with Construction in Operational Airports: SFIA Case Study.
Journal of Transportation Engineering, 123, (6) 417.
Shapira, A. (1999) Contemporary Trends in Formwork Standards-A Case Study. Journal of
Construction Engineering and Management, 125, (2) 69.
Slaughter, E.S. (1999) Assessment on construction processes and innovations through simulation.
Construction Management and Economics, 17, (3) 341.
Tam, C.M., Fung, I.W.H. (1998) Effectiveness of safety management strategies on safety performance
in Hong Kong. Construction Management and Economics, 16, (1) 49.
Tam, C.M., Fung, Ivan, W.H., Chan, A.P.C. (2001) Study of attitude changes in people after the
implementation of a new safety management system: the super plan. Construction Management and
Economics, 19, (4) 393.
Tam, C.M., Fung, I.W.H., Yeung, T.C.L., Tung, K.C.F. (2003) Relationship between construction
safety signs and symbols recognition and characteristics of construction personnel. Construction
Management and Economics, 21, (7) 745.
Toole, T. M. (2002) Construction Site Safety Roles. Journal of Construction Engineering and
Management, 128, (3) 203.
Toole, T.M. (2002) Comparision of Site Safety Policies of Construction Industry Trade Groups.
Practice Periodical on Structural Design and Construction, 7, (2) 90.
Tsai, J.J.P., Juan, E.Y.T. (2001) Modeling and Verification of High-Assurance Properties of Safety-
Critical Systems. Computer Journal – Oxford, 44, (6) 504.
Usmen, M.A., Baradan, S., Jayyousi, K. (2002) Safety Program Guidelines for Public School Facility
Construction and Operations. Practice Periodical on Structural Design and Construction, 7, (2) 74.
Van Binsbergen, A., Bovy, P. (2000) Underground urban goods distribution networks. Innovation -
European Journal of the Social Sciences, 13, (1) 111.
Wang, C.H., Huang, Y.C. (1998) Controlling activity interval times in LOB scheduling. Construction
Management and Economics, 16, (1) 5.
Winch, G. (1998) The growth of self-employment in British construction. Construction Management
and Economics, 16, (15) 531.
Yates, J.K., Lockley, E.E. (2002) Documenting and Analyzing Construction Failures. Journal of
Construction Engineering and Management, 128, (1) 8.