safety report - wmata
TRANSCRIPT

Safety Report Safety and Security Committee January 26, 2012
Washington Metropolitan Area Transit Authority
Page 7 of 51

• Provide the Committee updated information on Metro’s safety progress relative to:
• Safety Statistics
• National Transportation Safety Board’s (NTSB) Open
Recommendations since July 2011 briefing to the Committee
• FTA Audit Update
• Recent Incidents
• Fatigue Matrix/Brief
Purpose
Page 8 of 51

Performance Indicators
Page 9 of 51
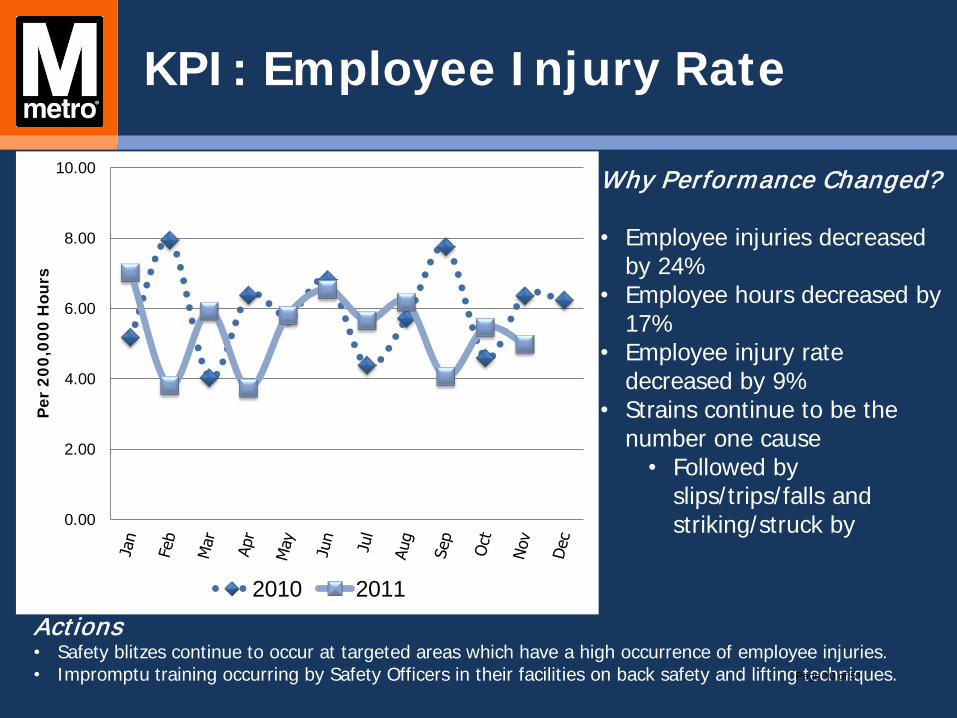
KPI: Employee Injury Rate
Why Performance Changed?
• Employee injuries decreased by 24%
• Employee hours decreased by 17%
• Employee injury rate decreased by 9%
• Strains continue to be the number one cause
• Followed by slips/trips/falls and striking/struck by
Actions • Safety blitzes continue to occur at targeted areas which have a high occurrence of employee injuries. • Impromptu training occurring by Safety Officers in their facilities on back safety and lifting techniques.
0.00
2.00
4.00
6.00
8.00
10.00
Per
20
0,0
00
Hou
rs
2010 2011
Page 10 of 51

KPI: Customer Injury Rate
Why Performance Changed?
• Customer injuries increased 35%
• Customer trips decreased by
6% (1.6 M trips)
• Customer injury rate increased by 42%
• Ten bus collisions caused 20 transports
Actions • Safety inspections at all Rail Stations continue to occur on a regular basis. • A safety communications campaign is underway in attempts to build a safety culture for our customers.
0.00
1.00
2.00
3.00
4.00
5.00
Per
Mill
ion
Pas
sen
ger
Trip
s
2010 2011
Page 11 of 51

Corrective Action Plans
53
27
49
64
21
27
149
2
5
3
2
1
168
0 50 100 150 200 250 300 350
2004
2005
2006
2007
2008
2009
2010
2010 new
Closed Open Page 12 of 51

New Corrective Action Plans
The 317 New CAPs comprised of …
40%
33% 14%
6%
5%
2% 13%
TOC 2010 Audit (127) Internal Safety (106) Investigations (43) Inspec. General (19) NTSB (17) VTX Report (5)
0
50
100
150
200
250
300
350
317 Total New CAPs
149
168
New Closed New Open Page 13 of 51

Hazard Resolution Matrix of Open Corrective Action Plans
Frequency of Occurrence Hazard Categories
Catastrophic 1 Critical 2 Marginal 3 Negligible 4
A = Frequent 1A 2A 3A 4A
B = Probable 1B 2B 3B 4B
C = Occasional 1C 2C 3C 4C
D = Remote 1D 2D 3D 4D
E = Improbable 1E 2E 3E 4E
1A, 1B, 1C, 2A, 2B, 3A 3 Unacceptable – Executive Leadership with Chief Safety Officer
1D, 2C, 2D, 3B, 3C 94 Undesirable - Executive Safety Committee decision required
1E, 2E, 3D, 3E, 4A, 4B 19 Acceptable with review by Executive Safety Committee
4C, 4D, 4E 49 Acceptable without review
0 1
1
28
0
0 1
21
10
0
0 0
35
14
4
0 1
17
32
0
Page 14 of 51

NTSB Recommendations
Page 15 of 51

Background on NTSB Recommendations
• Currently have 27 “open and acceptable” recommendations with the NTSB
– 15 are related to Fort Totten Incident
– 12 pre-date Fort Totten Incident
• 16 of the 27 were submitted for closure and are awaiting a response from NTSB
• 2 of the 27 NTSB recommendations are hazard classified by WMATA as Category I (unacceptable)
• Update will address NTSB recommendations “in-progress” or not submitted for closure
Page 16 of 51

NTSB Recommendations Pre Fort Totten
• One open recommendation from the 2006 Woodley Park Incident
1. Equip all WMATA rolling stock with roll back protection
• One recommendation remaining from the 2007 Mount Vernon Incident
1. Replace all #8 turnouts with guarded #8 turnouts
• 156 of 178 have been completed (88%)
• Two open recommendations from the Eisenhower / DuPont Employee Fatalities of 2006
1. Perform periodic hazard analyses
2. Develop new technology for automatic alert of workers on or near the tracks
Page 17 of 51

Fort Totten Incident
• NTSB issued two recommendations prior to the completion of their investigative report, and 13 additional recommendations at its conclusion
• 15 recommendations, 7 are in-progress at this time (8 awaiting closure from NTSB)
1. Develop real time loss of shunt detection system
• System has been developed and tested
2. Remove unnecessary communication systems
• Red Line 53% complete
• Orange Line 5% complete
Page 18 of 51
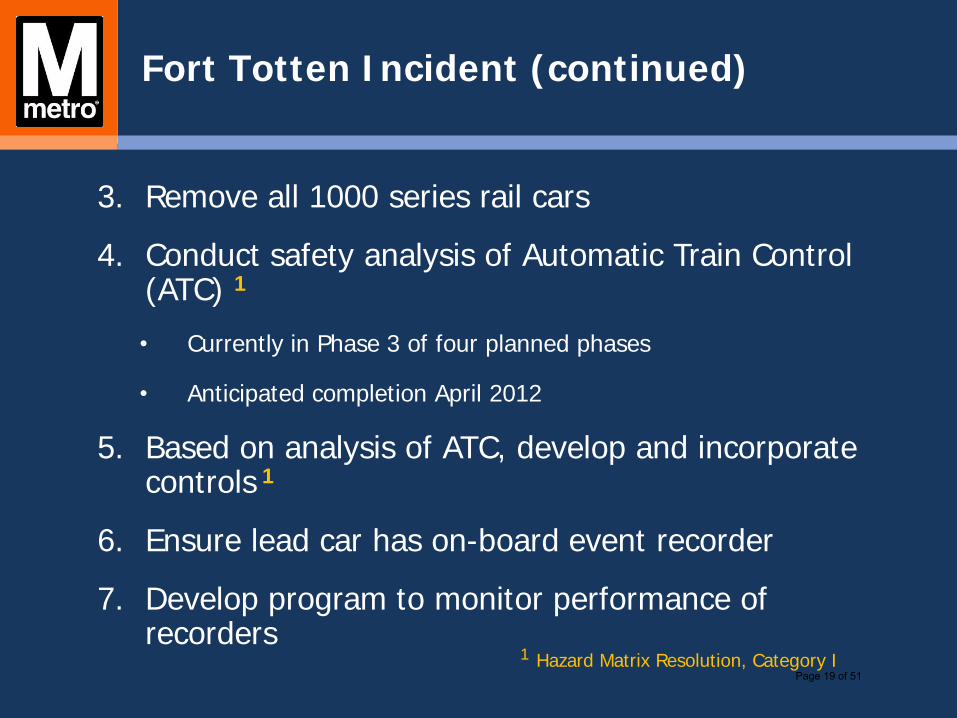
Fort Totten Incident (continued)
3. Remove all 1000 series rail cars
4. Conduct safety analysis of Automatic Train Control (ATC) 1
• Currently in Phase 3 of four planned phases
• Anticipated completion April 2012
5. Based on analysis of ATC, develop and incorporate controls 1
6. Ensure lead car has on-board event recorder
7. Develop program to monitor performance of recorders
1 Hazard Matrix Resolution, Category I
Page 19 of 51
FTA State Safety Oversight Audit
Page 20 of 51
FTA State Safety Oversight Audit
• FTA conducted State Safety Oversight Program Audit on Metro and TOC
• Issued Final Audit Report on March 4, 2010
• Ten recommendations placed significant pressure to change organization and culture
• As of January 11, 2012, FTA closed out all recommendations citing:
“ (WMATA) strong commitment to addressing FTA’s concerns and to re-building a strong foundation to improved safety performance.”
Page 21 of 51

Recent Incident Update
• December 2, 2011 – Ten Car Train
• December 20, 2011 – Rail Friction Ring
• December 28, 2011 – Auto/Bus Accident
• January 6, 2012 – Rail Friction Ring
Page 22 of 51

• December 2, 2011 – 1413 hours
• Shady Grove – Train left Shady Grove Yard with a 10-car consist • 26 Red Line Stations were serviced • 2 cars were off of the platform at each station
• When entering Glenmont Yard the Interlocking Operator noticed
that the consist had 10-cars.
Ten Car Train
Page 23 of 51

Tuesday morning, December 20, 2011 – Train 406
Broken Mounting Hub – car 5012
Rail Friction Ring
Page 24 of 51

Bus Accident
• Afternoon of December 28, 2011
• Rockville Pike & Elsmere Avenue (Montgomery County)
• Pickup truck struck Metrobus #6206
• Six passenger injuries (non-life threatening)
Page 25 of 51

Friday Morning - January 6, 2012 – Train 907
Cracked Friction Ring
Rail Friction Ring
Page 26 of 51

Fatigue Rules / Standard
Page 27 of 51

Fatigue Rules / Standard
Max Duty Time
Actual Work Time
Minimum Rest Period
(Consecutive)
Fatigue Risk
Mgmt System
Cumulative Limits per
Week/Month
Fitness for Duty
Final Rule
FAA 14-hrs 8/9-hrs 10-hrs Yes Yes Joint
responsibility Yes
FMCSA 14-hrs 11-hrs 10-hrs NA Yes NA Yes,
Tiered
FRA 12-hrs NA 8/10-hrs Yes Yes NA Yes
APTA 14-hrs NA 10-hrs NA NA NA No
Page 28 of 51

Appendix
Page 29 of 51

Status of 27 NTSB Recommendations
YEAR INCIDENT RECOMMENDATION STATUS
1 2006 Woodley Park Equip all WMATA rolling stock with roll back protection In-Progress
2 2007 Mount Vernon New QA process; proper wheel truing Completed w/ NTSB
3 2007 Mount Vernon New car procurement configuration management Completed w/ NTSB
4 2007 Mount Vernon Single point of responsibility within CENV; investigations Completed w/ NTSB
5 2007 Mount Vernon New written procedures; rail point face lubrication Completed w/ NTSB
6 2007 Mount Vernon Replace all #8 turnouts with guarded #8 turnouts In-Progress
7 2006 Eisenhower/DuPont Review and update Metrorail Safety Rules & Procedures Handbook
Completed w/ NTSB
8 2006 Eisenhower/DuPont Establish Systematic approach for audit checks Completed w/ NTSB
9 2006 Eisenhower/DuPont Perform periodic hazard analysis In-Progress
10 2006 Eisenhower/DuPont Develop new technology for automatic alert of workers near tracks In-Progress
Page 30 of 51

Status of 27 NTSB Recommendations
YEAR INCIDENT RECOMMENDATION STATUS
11 2009 All Properties Modify physical exam and forms; sleep apnea Completed w/ NTSB
12 2009 All Properties Establish program to identify operators at high risk for sleep disorders
Completed w/ NTSB
13 2009 Fort Totten Develop real time loss of shunt detection system In-Progress
14 2009 Fort Totten Develop program, train control system performance Completed w/ NTSB
15 2009 Fort Totten Permanently remove Generation 2 track circuit modules Completed w/ NTSB
16 2009 Fort Totten Enhance distribution of technical bulletins Completed w/ NTSB
17 2009 Fort Totten Remove unnecessary communication systems In-Progress
18 2009 Fort Totten Conduct safety analysis of Automatic Train Control (ATC) In-Progress
19 2009 Fort Totten Based on analysis of ATC, develop and incorporate controls In-Progress
20 2009 Fort Totten Implement cable resistance testing Completed w/ NTSB
21 2009 Fort Totten Work with TOC to address FTA Audit, 8 of 10 complete Completed w/ NTSB Page 31 of 51
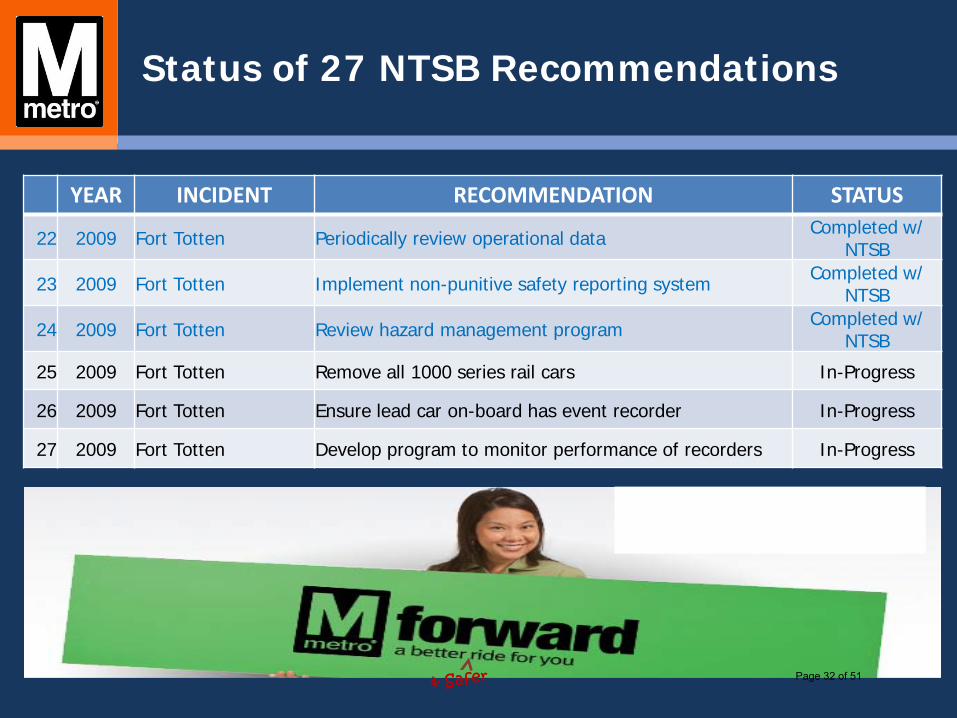
Status of 27 NTSB Recommendations
YEAR INCIDENT RECOMMENDATION STATUS
22 2009 Fort Totten Periodically review operational data Completed w/ NTSB
23 2009 Fort Totten Implement non-punitive safety reporting system Completed w/ NTSB
24 2009 Fort Totten Review hazard management program Completed w/ NTSB
25 2009 Fort Totten Remove all 1000 series rail cars In-Progress
26 2009 Fort Totten Ensure lead car on-board has event recorder In-Progress
27 2009 Fort Totten Develop program to monitor performance of recorders In-Progress
Page 32 of 51

Injury Rates Per 200,000 Hours Operations Groups January – November 2011
Operations Group
Recordable Injuries
Injury Rate
Active Employees
BMNT 34 4.16 943 BTRA 196 7.42 3,079 CMNT 30 3.38 1,030 ELES 16 8.54 217 PLNT 29 3.73 838 RTRA 89 6.54 1,449 SMNT 21 2.35 838 TRST 29 5.76 470
Totals 444 5.50 8,864 Page 33 of 51
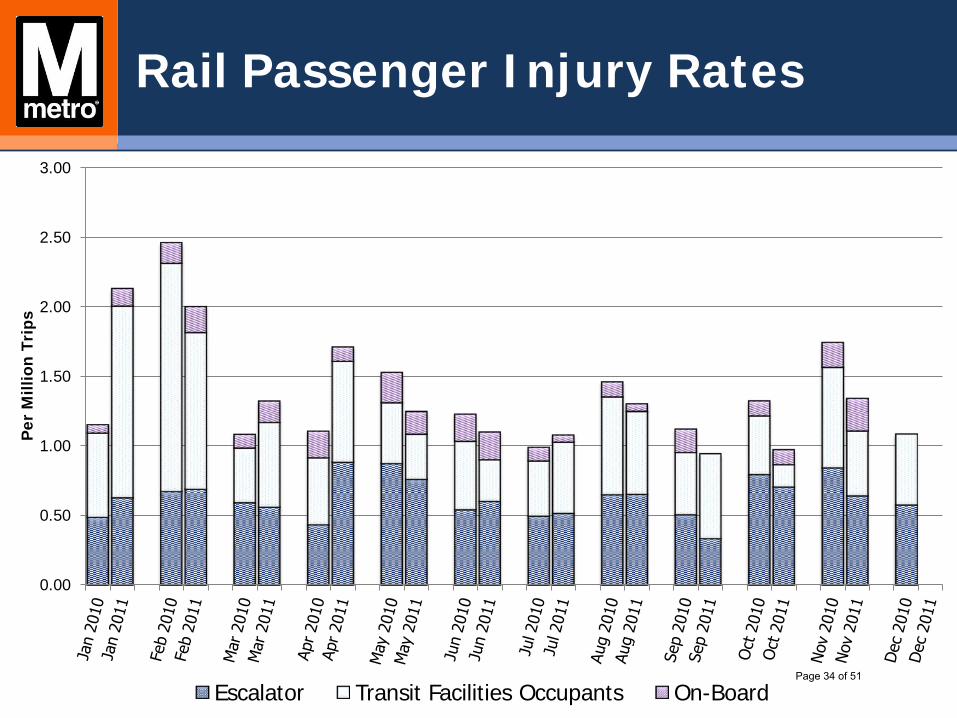
Rail Passenger Injury Rates
0.00
0.50
1.00
1.50
2.00
2.50
3.00
Per
Mill
ion
Tri
ps
Escalator Transit Facilities Occupants On-Board Page 34 of 51

Bus Passenger Injury Rates
0
2
4
6
8
10
12
14
0.00
1.00
2.00
3.00
4.00
5.00
6.00
7.00
8.00
Nu
mbe
r of
Con
trib
uti
ng
Col
lisio
ns
Rat
e P
er M
illio
n T
rips
Other Collision Related 2010 Collisions 2011 Collisions Page 35 of 51

MetroAccess Passenger Injury Rates
0.00
10.00
20.00
30.00
40.00
50.00
60.00
Per
Mill
ion
Tri
ps
Other Collision Related Page 36 of 51

Rail Vehicle Incidents January – November
0
1
2
3
4
Derailment Collision Other Page 37 of 51

Bus Collision Rates
0.0
10.0
20.0
30.0
40.0
50.0
60.0
70.0
Per
Mill
ion
Mile
s
Preventable Non-Preventable Page 38 of 51

MetroAccess Collision Rates
0.0
10.0
20.0
30.0
40.0
50.0
Per
Mill
ion
Mile
s
Preventable Non-Preventable Page 39 of 51

Bus Pedestrian/Cyclist Incidents
0
1
2
3
4
5
2010 2011 Page 40 of 51

Smoke and Fire Incidents
0
5
10
15
20
25
30
35
40
Smoke Fire Page 41 of 51

Suicides
0
1
2
3
4
2009 2010 2011 Page 42 of 51
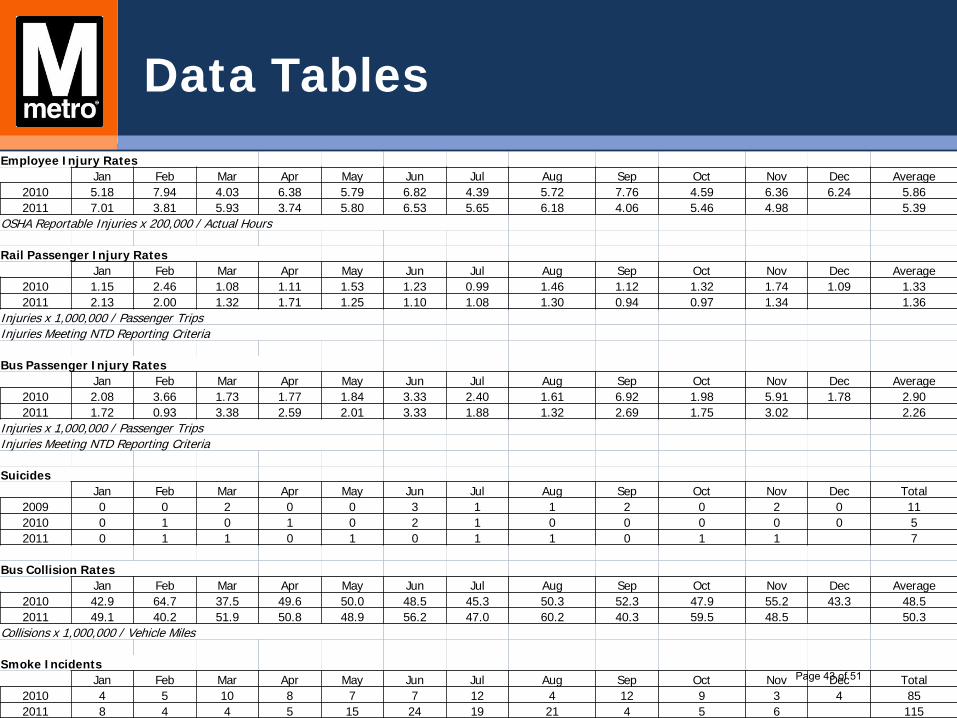
Data Tables Employee Injury Rates
Jan Feb Mar Apr May Jun Jul Aug Sep Oct Nov Dec Average 2010 5.18 7.94 4.03 6.38 5.79 6.82 4.39 5.72 7.76 4.59 6.36 6.24 5.86 2011 7.01 3.81 5.93 3.74 5.80 6.53 5.65 6.18 4.06 5.46 4.98 5.39
OSHA Reportable Injuries x 200,000 / Actual Hours
Rail Passenger Injury Rates Jan Feb Mar Apr May Jun Jul Aug Sep Oct Nov Dec Average
2010 1.15 2.46 1.08 1.11 1.53 1.23 0.99 1.46 1.12 1.32 1.74 1.09 1.33 2011 2.13 2.00 1.32 1.71 1.25 1.10 1.08 1.30 0.94 0.97 1.34 1.36
Injuries x 1,000,000 / Passenger Trips Injuries Meeting NTD Reporting Criteria
Bus Passenger Injury Rates Jan Feb Mar Apr May Jun Jul Aug Sep Oct Nov Dec Average
2010 2.08 3.66 1.73 1.77 1.84 3.33 2.40 1.61 6.92 1.98 5.91 1.78 2.90 2011 1.72 0.93 3.38 2.59 2.01 3.33 1.88 1.32 2.69 1.75 3.02 2.26
Injuries x 1,000,000 / Passenger Trips Injuries Meeting NTD Reporting Criteria
Suicides Jan Feb Mar Apr May Jun Jul Aug Sep Oct Nov Dec Total
2009 0 0 2 0 0 3 1 1 2 0 2 0 11 2010 0 1 0 1 0 2 1 0 0 0 0 0 5 2011 0 1 1 0 1 0 1 1 0 1 1 7
Bus Collision Rates Jan Feb Mar Apr May Jun Jul Aug Sep Oct Nov Dec Average
2010 42.9 64.7 37.5 49.6 50.0 48.5 45.3 50.3 52.3 47.9 55.2 43.3 48.5 2011 49.1 40.2 51.9 50.8 48.9 56.2 47.0 60.2 40.3 59.5 48.5 50.3
Collisions x 1,000,000 / Vehicle Miles
Smoke Incidents Jan Feb Mar Apr May Jun Jul Aug Sep Oct Nov Dec Total
2010 4 5 10 8 7 7 12 4 12 9 3 4 85 2011 8 4 4 5 15 24 19 21 4 5 6 115
Page 43 of 51
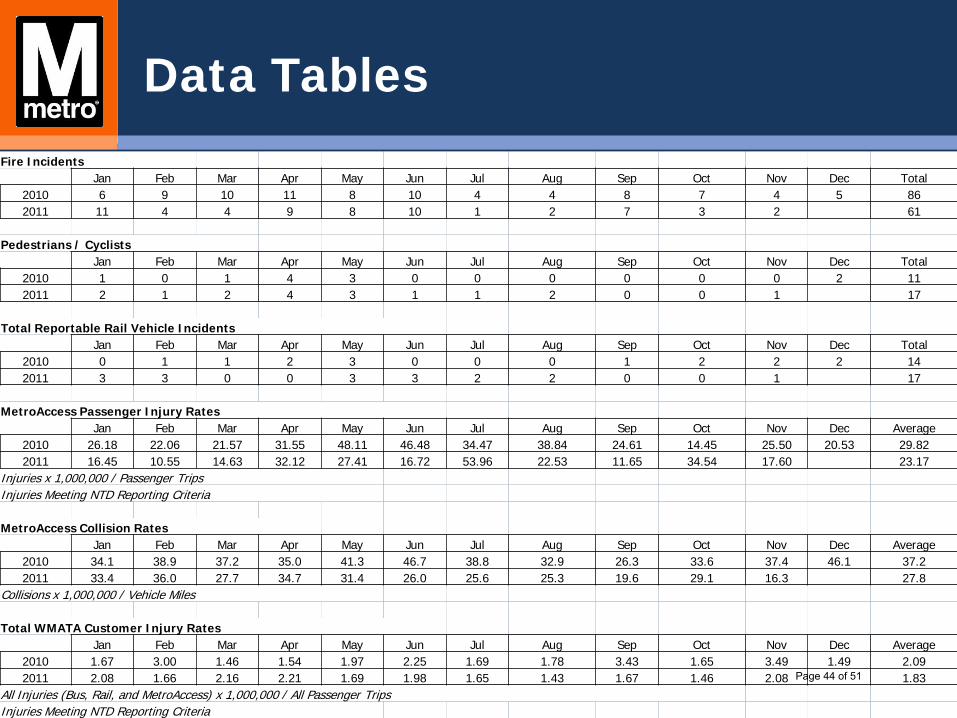
Data Tables Fire Incidents
Jan Feb Mar Apr May Jun Jul Aug Sep Oct Nov Dec Total 2010 6 9 10 11 8 10 4 4 8 7 4 5 86 2011 11 4 4 9 8 10 1 2 7 3 2 61
Pedestrians / Cyclists Jan Feb Mar Apr May Jun Jul Aug Sep Oct Nov Dec Total
2010 1 0 1 4 3 0 0 0 0 0 0 2 11 2011 2 1 2 4 3 1 1 2 0 0 1 17
Total Reportable Rail Vehicle Incidents Jan Feb Mar Apr May Jun Jul Aug Sep Oct Nov Dec Total
2010 0 1 1 2 3 0 0 0 1 2 2 2 14 2011 3 3 0 0 3 3 2 2 0 0 1 17
MetroAccess Passenger Injury Rates Jan Feb Mar Apr May Jun Jul Aug Sep Oct Nov Dec Average
2010 26.18 22.06 21.57 31.55 48.11 46.48 34.47 38.84 24.61 14.45 25.50 20.53 29.82 2011 16.45 10.55 14.63 32.12 27.41 16.72 53.96 22.53 11.65 34.54 17.60 23.17
Injuries x 1,000,000 / Passenger Trips Injuries Meeting NTD Reporting Criteria
MetroAccess Collision Rates Jan Feb Mar Apr May Jun Jul Aug Sep Oct Nov Dec Average
2010 34.1 38.9 37.2 35.0 41.3 46.7 38.8 32.9 26.3 33.6 37.4 46.1 37.2 2011 33.4 36.0 27.7 34.7 31.4 26.0 25.6 25.3 19.6 29.1 16.3 27.8
Collisions x 1,000,000 / Vehicle Miles
Total WMATA Customer Injury Rates Jan Feb Mar Apr May Jun Jul Aug Sep Oct Nov Dec Average
2010 1.67 3.00 1.46 1.54 1.97 2.25 1.69 1.78 3.43 1.65 3.49 1.49 2.09 2011 2.08 1.66 2.16 2.21 1.69 1.98 1.65 1.43 1.67 1.46 2.08 1.83
All Injuries (Bus, Rail, and MetroAccess) x 1,000,000 / All Passenger Trips Injuries Meeting NTD Reporting Criteria
Page 44 of 51

Description of Measures
Employee Injuries and Accidents • Based on required OSHA reporting • Reportable employee accidents / 200,000 hours • Calendar year versus fiscal year • Organization-level; does not impact current individual performance plans • WMATA-wide rate target by end of 2011 calendar year of 5.5 reportable
accidents / 200,000 hours; 2010 actual was 5.86 Customer Injuries
• Based on National Transit Database (NTD) reporting • Key requirement – Transport away for medical treatment • Rail passenger injuries per million trips
• On board, in facilities, escalators • Calendar year 2011 target is 1.26 injuries
• Bus & MetroAccess passenger injuries per million trips • Major = collision related; Minor = all other • Calendar year 2011 target is 2.62 injuries
Page 45 of 51

Employee Injury Rate
Employee Injury Rate: Normalized number of reportable injuries experienced per 100 employees, working the course of a normal year • (Total number of reportable injuries x 200,000) / number of
hours worked = employee injury rate
Where an OSHA Reportable injury is work related and results in: • Medical treatment above first aid • Loss of consciousness • Days away from work • Restricted duty or job transfer • Death
Page 46 of 51

Customer Injury Rate, Rail
Customer Injury Rate: Normalized number of reportable injuries experienced by our customers per million passenger trips.
• (Total number of NTD reportable injuries x 1,000,000) / actual number of trips = customer injury rate
Rail Customer Injury Rate: Normalized (per 1 mil. trips) number of NTD reportable injuries experienced by our rail service customers who were:
• On board a “revenue” transit vehicle or were an intending/de-boarded passenger within a transit facility excluding employees. Includes escalators, elevators, stairs, platforms…
Where an NTD reportable injury is related to the operation of our system and required immediate medical attention away from the scene for one or more persons
Page 47 of 51

Customer Injury Rate, Bus and MetroAccess
Bus Customer Injury Rate: Normalized (per 1 mil. trips) • Number of NTD reportable injuries experienced by our Bus service
customers
MetroAccess Customer Injury Rate: Normalized (per 1 mil. trips) • Number of NTD reportable Injuries experienced by our
MetroAccess Customers
Where the injuries are: • Collision related: Injuries requiring immediate medical attention
away from the scene due to a collision. (NTD classifies these as major – regardless of injury severity)
• Other on-board: Injuries related to the operation of a Transit Bus System, requiring immediate medical attention away from the scene. (NTD classifies these as minor – regardless of injury severity)
Page 48 of 51