saga of glass damage in urban environments continues...
TRANSCRIPT

Saga of Glass Damage in Urban Environments Continues:
Consequences of Aerodynamics and Debris Impact During Hurricane Ike
Ahsan Kareem
11/14/2008
Notre Dame, IN 46556
University of Notre Dame NatHaz Modeling Laboratory
www.nd.edu/~nathaz GCOE Partner
156 Fitzpatrick Hall

NatHaz Modeling Laboratory University of Notre Dame
The Saga of Glass Damage in Urban Environments Continues: Consequences of Aerodynamics and Debris Impact during Hurricane Ike Ahsan Kareem Robert M. Moran Professor of Engineering
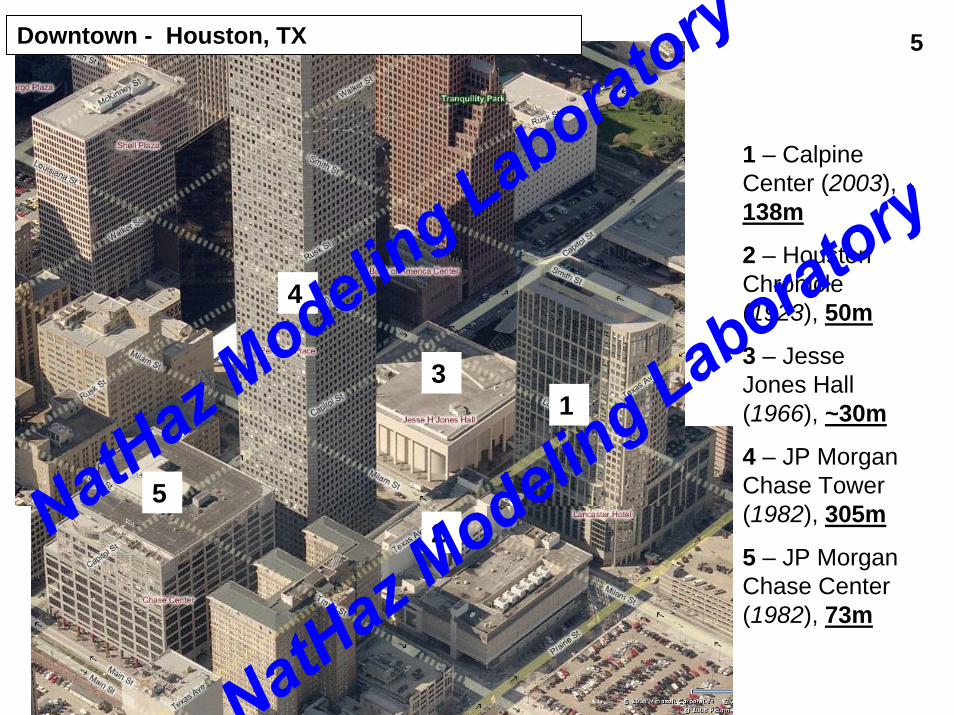
Hurricane Ike made landfall on the Texas coast on September 13, 2008, with the eye of the storm passing just east of the city of Houston. Initial reconnaissance suggested that the observed glass/cladding damage was likely caused by windborne debris. Though not of the magnitude experienced during Alicia in 1983, of particular interest was the extensive localized glass damage to the JP Morgan Chase Tower and the adjacent parking structure, in the Central Business District (CBD) of Houston (See: PP-1). Visual evidence shows that a large number of glass panels of the south-east face of the JP Morgan Chase Tower were damaged, and this was primarily limited to the lower 1/3 of the building with sparsely dispersed damaged glass at upper levels. Additionally, glass/cladding damage was observed on the adjacent parking structure, on the surface facing the JP Morgan Chase Tower. Based on this evidence, it was proposed initially that the damage to these two structures likely resulted from the impact of entrapped windborne debris between the two structures in a vortical flow pattern, which was accentuated by the directionality of Ike’s wind field near the time of noted damage. Similar observations were made by others including reports from the local media and the ABS Consulting.
In order to assess the nature and causes of the glass/cladding damage, the NatHaz Modeling Laboratory, following field observations in the CBD of Houston, constructed a physical model of the JP Morgan Tower, and surrounding buildings in the immediate vicinity, to conduct flow visualization experiments, while a similar model was also developed in a computational domain where the flow field was modeled utilizing a computational fluid dynamics (CFD) software. The objective was to assess the flow field around the buildings, under investigation, resulting from the likely flow direction and the layout and the orientation of adjacent buildings. The investigation focused on an approaching wind field from the NNW direction, as maps of wind speed and direction (See: PP-2 &3) from the passing of the hurricane to the east of CBD indicate that this was the most likely impact direction.
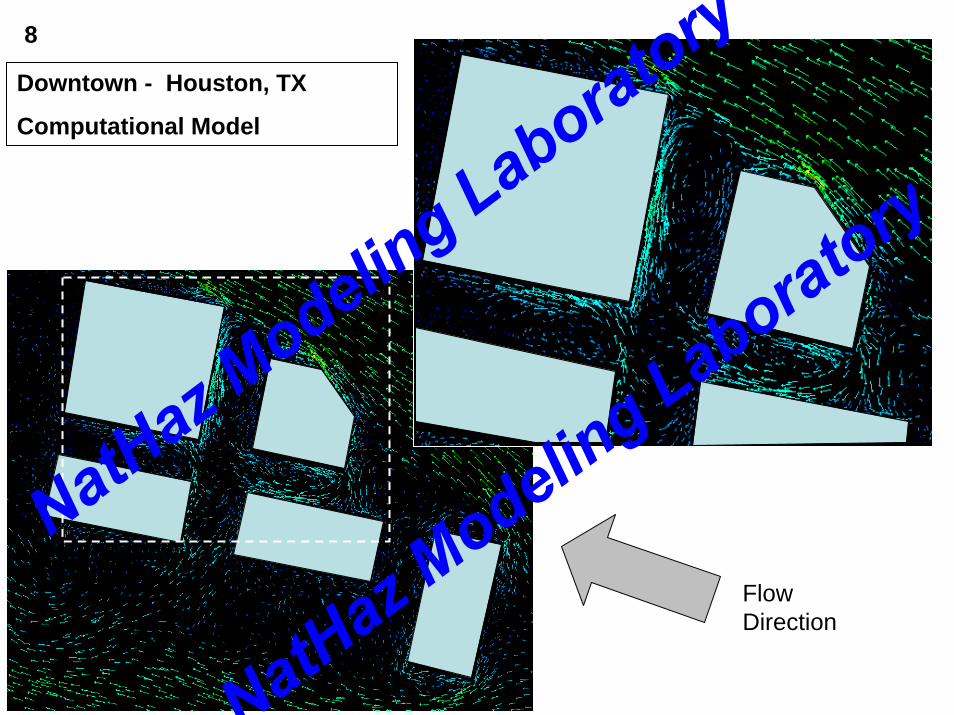
Flow visualization and computational flow field models (See: PP-4-8) demonstrated that a series of vortical flow structures formed between the tower and parking structure, and that these vortices evolved from flow entering the region between the buildings. The computational model additionally suggests that the parking structure experienced higher pressures on the surface between the two structures as a result of the orientation of the flow. It was surmised that the vortices which formed in between the parking garage and
tower initiated a series of events which caused the windows on the parking structure to fail, with the windows on the tower subsequently failing from the ensuing impact by windborne debris carrying glass chards in the entrapped vortices (See: PP-9). This validation through flow visualization and CFD also provides reaffirmation of the various hypotheses floated following Ike regarding the damage. Similar mechanisms of debris damage were witnessed during Hurricane Alicia, impacting CBD of Houston in 1983. Ongoing assessment of both the physical and computational models suggests that flow field emerging from the surrounding structures may have also played a role in the entrapment of enhancement of vortices between the tower and parking structure (See: PP-9). The following pages are based on a Power Point presentation on the topic made by the author, which complement the comments made in this brief report. A description of each slide is given on the following page. A detailed paper on the anatomy of glass damage from hurricanes, tornados and thunderstorms is forthcoming. Acknowledgements: The author would like to thank many contributions made by the students at the NatHaz Modeling laboratory, particularly Mr. Kyle Butler who led the team of Mr. Patrick Brewick; Ms. Sara Bobby; Ms. Rachel Bashor; Ms. Tiphaine Williams to conduct wind tunnel and CFD experiments and documentation of damage. The support for the study was in part provided by the Collaborative Research Program at NatHaz Laboratory with the Global Center of Excellence at Tokyo Polytechnic University: New Frontier of Education and Research in Wind Engineering. The center is directed by Prof. Yukio Tamura and funded by the Ministry of Education, Culture, Sports, Science and Technology (MEXT), Japan. The opinions presented in this report do not necessarily reflect the views of the collaborators or the sponsor.

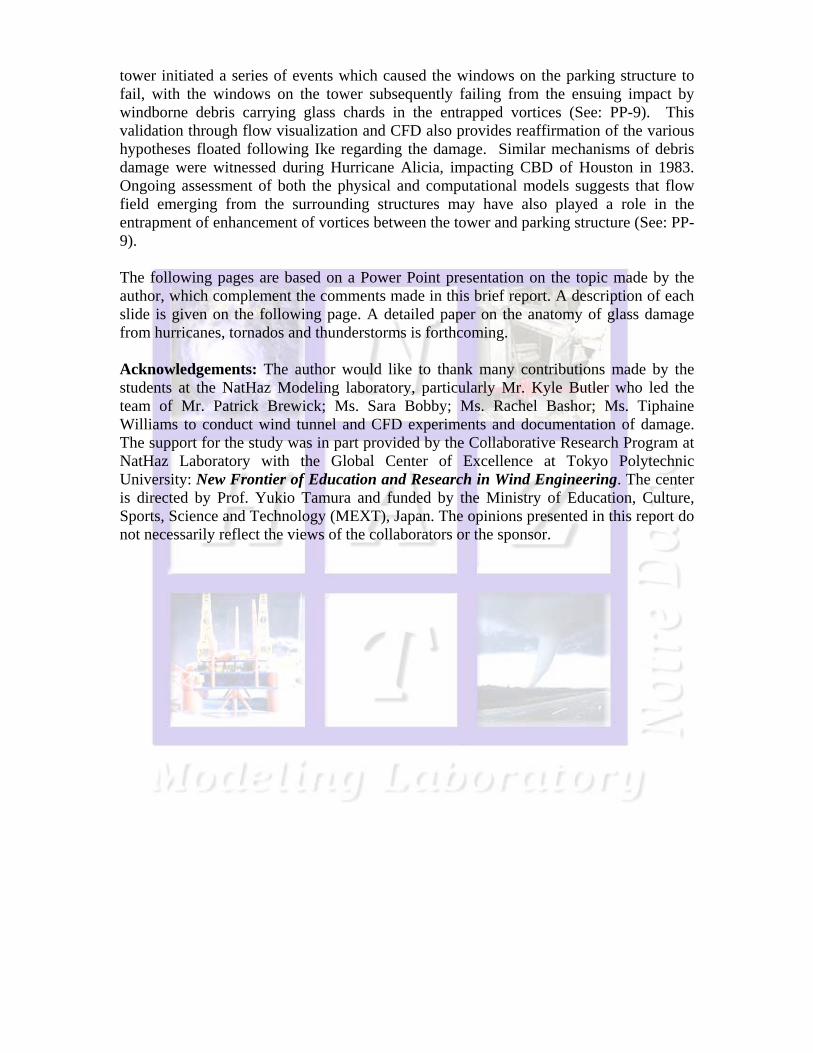
Description of Slides: Slide 1: Images of the damage to the JP Morgan Chase Tower and the adjacent parking structure in the after math of Ike (Source: NatHaz Laboratory and media reports). Slide 2: Wind speed contour map, with wind direction arrows, of Hurricane Ike at the time of landfall off the Galveston, TX coastline (Source: AOML/NOAA). Slide 3: Wind speed contour map, with wind direction arrows, of Hurricane Ike as it passed to the North-East of CBD Houston, TX (Source: AOML/NOAA). Slide 4: Aerial view of downtown Houston at the intersections of Texas Ave. and Milam St. and Travis St, centered on the JP Morgan Chase Tower. Each of the buildings adjacent to the JP Morgan Chase Tower is listed with their respective heights and dates of construction (Source: Google Earth/NatHaz Laboratory). Slide 5: Profile view of the JP Morgan Chase Tower (Source: Google Earth/NatHaz Laboratory). Slide 6: Still frame images of smoke flow visualization around a scale model of the JP Morgan Chase Tower and surrounding buildings. The scale buildings are color coded with the actual buildings in the companion aerial photograph. The arrows in the photograph show the approximate mean flow direction modeled in the visualization experiment. Rotational flow (white-cloud) can be seen in the space between the tower and garage models (Source: NatHaz Modeling Laboratory). Slide 7: Side profile images of the smoke flow visualization scale model (Source: NatHaz Modeling Laboratory). Slide 8: Computational model of the wind velocity vectors around the JP Morgan Chase Tower and surrounding buildings. The wind velocity vectors in the image represent an instantaneous realization of the flow field at a fixed height. The image in the upper right is zoomed in on the region between the tower and parking structure. Areas of rotational flow can be seen between the tower and adjacent buildings. A digital movie of the simulated flow patterns is in development (Source: NatHaz Modeling Laboratory). Slide 9: Idealized schematic of the general flow pattern around the JP Morgan Chase Tower and surrounding buildings. This schematic flow pattern is based upon both the smoke flow visualization experiment and instantaneous realizations of the flow field vectors generated within the CFD model (Source: NatHaz Modeling Laboratory).

Nationalgeographic.comreuters.com
reuters.com Google.com
Hurricane Ike: Sept. 13th, 2008 Houston, TX 1
NatHaz Modelin
g Laboratory
NatHaz Modelin
g Laboratory

50
60
50
504030
60 70
70
8050
0730 UTC 9/13/2008 (wind speed in kts.) source: http://www.aoml.noaa.gov/hrd/data_sub/wind.html
Hurricane Ike: Sept. 13th, 2008 Houston, TX 2
NatHaz Modelin
g Laboratory
NatHaz Modelin
g Laboratory

50
50
40
60
70
6050 40
3020
701030 UTC 9/13/2008 (wind speed in kts.) source: http://www.aoml.noaa.gov/hrd/data_sub/wind.html
Hurricane Ike: Sept. 13th, 2008 Houston, TX 3
NatHaz Modelin
g Laboratory
NatHaz Modelin
g Laboratory

1 – Calpine Center (2003), 138m
2 – Houston Chronicle (1923), 50m
3 – Jesse Jones Hall (1966), ~30m
4 – JP Morgan Chase Tower (1982), 305m
5 – JP Morgan Chase Center (1982), 73m
1
2
5
3
4
N
Downtown - Houston, TX 4
NatHaz Modelin
g Laboratory
NatHaz Modelin
g Laboratory
1 – Calpine Center (2003), 138m
2 – Houston Chronicle (1923), 50m
3 – Jesse Jones Hall (1966), ~30m
4 – JP Morgan Chase Tower (1982), 305m
5 – JP Morgan Chase Center (1982), 73m
1
25
3
4
Downtown - Houston, TX 5
NatHaz Modelin
g Laboratory
NatHaz Modelin
g Laboratory

Downtown - Houston, TX
Flow Visualization
N
6
NatHaz Modelin
g Laboratory
NatHaz Modelin
g Laboratory

Flow Direction
Downtown - Houston, TX
Flow Visualization (video)
N
7
NatHaz Modelin
g Laboratory
NatHaz Modelin
g Laboratory
Downtown - Houston, TX
Computational Model
Flow Direction
8
NatHaz Modelin
g Laboratory
NatHaz Modelin
g Laboratory

1
2
5
34
maps.live.com
N
Generalized Flow Pattern (above 30 m)
1 – Calpine Center (2003), 138m
2 – Houston Chronicle (1923), 50m
3 – Jesse Jones Hall (1966), ~30m
4 – JP Morgan Chase Tower (1982), 305m
5 – JP Morgan Chase Center (1982), 73m
9
NatHaz Modelin
g Laboratory
NatHaz Modelin
g Laboratory