sagar cements limited corporate presentation cement - corporate... · corporate presentation sagar...
TRANSCRIPT

Corporate Presentation
Sagar Cements Limited

Disclaimer xx
22
This presentation and the accompanying slides (the “Presentation”), which have been prepared by Sagar Cements Limited (the “Company”), have been prepared
solely for information purposes and do not constitute a prospectus, offering circular or offering memorandum or an offer, or a solicitation of any offer, to purchase or
sell, any shares and should not be considered as a recommendation that any investor should subscribe for or purchase any of the Company’s equity shares. This
Presentation is strictly confidential and may not be copied or disseminated, in whole or in part, and in any manner or for any purpose. No person is authorized to give
any information or to make any representation not contained in or inconsistent with this Presentation and if given or made, such information or representation must
not be relied upon as having been authorized by any person. Failure to comply with this restriction may constitute a violation of the applicable securities laws.
This Presentation has been prepared by the Company based on information and data which the Company considers reliable, but the Company makes no
representation or warranty, express or implied, whatsoever, and no reliance shall be placed on, the truth, accuracy, completeness, fairness and reasonableness of the
contents of this Presentation. This Presentation may not be all inclusive and may not contain all of the information that you may consider material. Any liability in
respect of the contents of, or any omission from, this Presentation is expressly excluded.
Certain matters discussed in this Presentation, may contain statements regarding the Company’s market opportunity and business prospects that are individually
and collectively forward looking statements. Such forward-looking statements are not guarantees of future performance and are subject to known and unknown risks,
uncertainties and assumptions that are difficult to predict. These risks and uncertainties include, but are not limited to, the performance of the Indian economy and
of the economies of various international markets, the performance of the cement industry in India and world-wide, competition, the company’s ability to
successfully implement its strategy, the Company’s future levels of growth and expansion, technological implementation, changes and advancements, changes in
revenue, income or cash flows, the Company’s market preferences and its exposure to market risks, as well as other risks. The Company’s actual results, levels of
activity, performance or achievements could differ materially and adversely from results expressed in or implied by this Presentation. The Company assumes no
obligation to update any forward-looking information contained in this Presentation. Any forward-looking statements and projections made by third parties included
in this Presentation are not adopted by the Company and the Company is not responsible for such third party statements and projections. The information contained
herein is subject to change without notice. Past performance is not indicative of future results.
None of the Company, its Directors, Promoters or affiliates, nor any of its or their respective employees, advisors or representatives or any other person accepts any
responsibility or liability whatsoever, whether arising in tort, contract or otherwise, for any errors, omission or inaccuracies in such information or opinions or for any
loss, cost or damage suffered or incurred however arising, directly or indirectly, from any use of this Presentation or its contents or otherwise in connection with this
Presentation. By attending this Presentation you acknowledge that you will be solely responsible for your own assessment of the market and the market position of
the Company and that you will conduct your own analysis and be solely responsible for forming your own view of the potential future business of the Company.
This document has not been and will not be reviewed or approved by a regulatory authority in India or by any stock exchange in India.

Table of Contents
Sagar Cement Limited - Corporate Overview 4
Key Investment Highlights 17
Historical Financial Performance 29Section 3
Section 1
Section 2
33

xx
4
Sagar Cements Limited – Corporate Overview
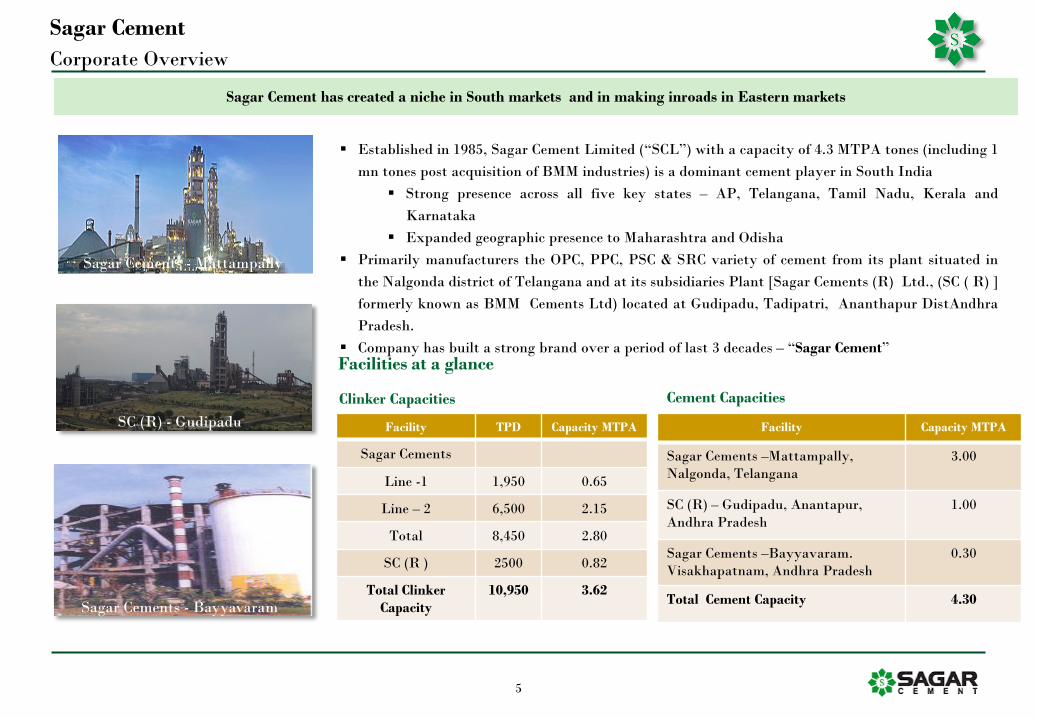
Established in 1985, Sagar Cement Limited (“SCL”) with a capacity of 4.3 MTPA tones (including 1
mn tones post acquisition of BMM industries) is a dominant cement player in South India
Strong presence across all five key states – AP, Telangana, Tamil Nadu, Kerala and
Karnataka
Expanded geographic presence to Maharashtra and Odisha
Primarily manufacturers the OPC, PPC, PSC & SRC variety of cement from its plant situated in
the Nalgonda district of Telangana and at its subsidiaries Plant [Sagar Cements (R) Ltd., (SC ( R) ]
formerly known as BMM Cements Ltd) located at Gudipadu, Tadipatri, Ananthapur DistAndhra
Pradesh.
Company has built a strong brand over a period of last 3 decades – “Sagar Cement”
55
Sagar Cement has created a niche in South markets and in making inroads in Eastern markets
Sagar Cement
Corporate Overview
Facility TPD Capacity MTPA
Sagar Cements
Line -1 1,950 0.65
Line – 2 6,500 2.15
Total 8,450 2.80
SC (R ) 2500 0.82
Total Clinker
Capacity
10,950 3.62
Facility Capacity MTPA
Sagar Cements –Mattampally,
Nalgonda, Telangana
3.00
SC (R) – Gudipadu, Anantapur,
Andhra Pradesh
1.00
Sagar Cements –Bayyavaram.
Visakhapatnam, Andhra Pradesh
0.30
Total Cement Capacity 4.30
Clinker Capacities Cement Capacities
Facilities at a glance
Sagar Cements - Mattampally
SC (R) - Gudipadu
Sagar Cements - Bayyavaram
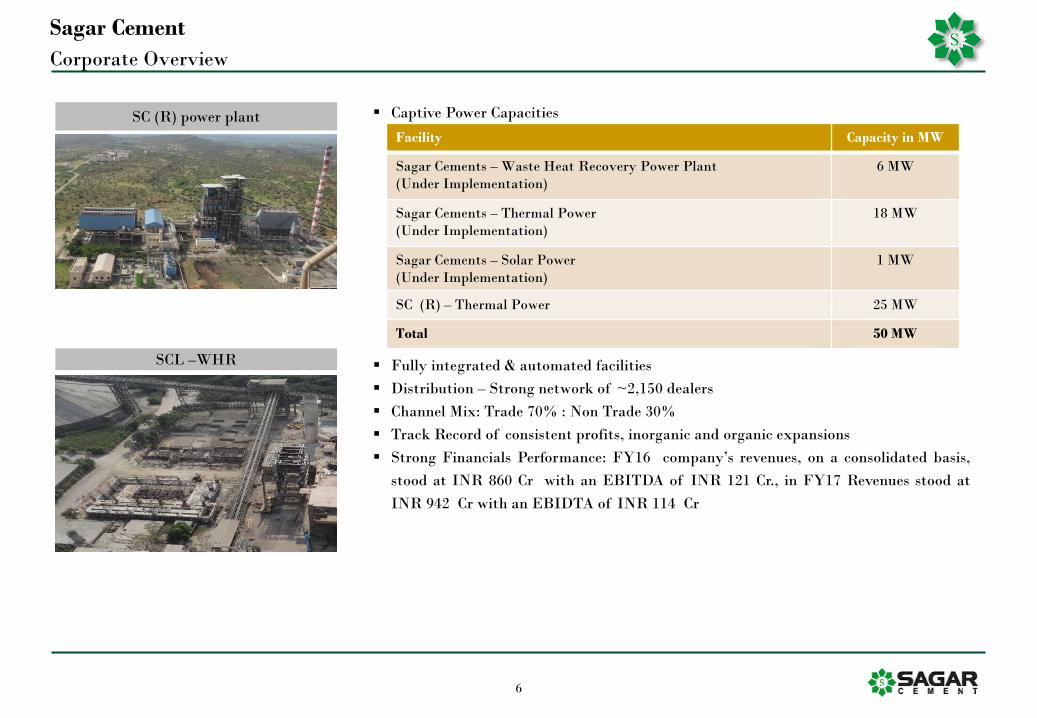
Captive Power Capacities
Fully integrated & automated facilities
Distribution – Strong network of ~2,150 dealers
Channel Mix: Trade 70% : Non Trade 30%
Track Record of consistent profits, inorganic and organic expansions
Strong Financials Performance: FY16 company’s revenues, on a consolidated basis,
stood at INR 860 Cr with an EBITDA of INR 121 Cr., in FY17 Revenues stood at
INR 942 Cr with an EBIDTA of INR 114 Cr
66
Sagar Cement
Corporate Overview
Facility Capacity in MW
Sagar Cements – Waste Heat Recovery Power Plant
(Under Implementation)
6 MW
Sagar Cements – Thermal Power
(Under Implementation)
18 MW
Sagar Cements – Solar Power
(Under Implementation)
1 MW
SC (R) – Thermal Power 25 MW
Total 50 MW
SC (R) power plant
SCL –WHR

7
SC (R) Plant
Sagar Plant
Bayyavaram Plant
Capacity 3.0 MTPA
Location Mattampally , Telangana
Capacity Utilisation
(H1FY17)
50%
Markets Catered AP, Telangana, Odisha,
Maharashtra
Limestone More than 600 mn Tonnes (100
Yrs Lease )
Capacity 1.0 MTPA
Location Gudipadu , AP
Capacity Utilisation0
(H1FY17)
67%
Markets Catered AP , Karantaka , TN
Limestone 174.7 mn Tonnes (20 Yrs Lease)
Captive Power Plant 25 MW
Capacity (Grinding) 0.3 MTPA
Location Vizag , AP
Markets Catered Visakhapatnam, Vizag,
Srikakulam and parts of Odisha
Limestone NA
3 MTPA Plant is Located at Mattampally,
Nalgonda District, Telangana
1 MTPA & 25 MW Power Plant is Located at
Gudipadu, Ananthapur District in Andhra
Pradesh
Part of Nalgonda & Yerraguntla Cement Cluster
Head Office based in Hyderabad
Bayyavaram Grinding Plant (Toshali)
Sagar Cement – Corporate Overview
Asset Overview

8
Fully Automated and Integrated Cement Plant at Mattampally, Telangana
Clinker Plant
Robotic Lab for consistent quality Surface Mining – Zero Overburden Railway Siding
Grinding Unit 6 MW – WHR Under Construction
Sagar Cement – Corporate Overview
Facilities at a Glance

9
• Added additional
cement mill &
tertiary crusher
Installation of
KIDS cooler, VFDs
for Raw Mills and
Coal Mills.
Installation of 6 stage inline
calciner with pre heater,
cooler modification & RTKM
separator for Coal Mill.
1985
19961998
20022008
• Plant Commissioned
with 200 TPD Kiln
with 4 stage pre
heater
Formed a JV with Vicat to
set up a 5.5 mtpa cement
plant in Karnataka
20142015
• Brownfield capacity expansion by
adding additional 6 stage inline
calciner pre heater, Kiln and
Pendulum cooler & 2.65 mtpa
cement grinding capacity adjacent to
the existing Kiln.
• Exited Vicat JV for a consideration of
INR 425 cr
• Acquired BMM Cements with a
capacity of 1 mtpa with 25 mw CPP
Commissioned VRPM
taking the capacity to 3
mpta.
Also commissioned a
railway siding
2016
1993
• Expansion by installing separate
line calciner with 5 stage pre
heater & adding jaw crusher
• Additional Raw mill, ESP for
Kiln and cooler modification
Clinker Capacity200
1985
600
1993
900
1998
1,600
2002
7,000
200810,950
2017
TPD
YEAR
Sagar Cement – Corporate Overview
Key Milestones
10
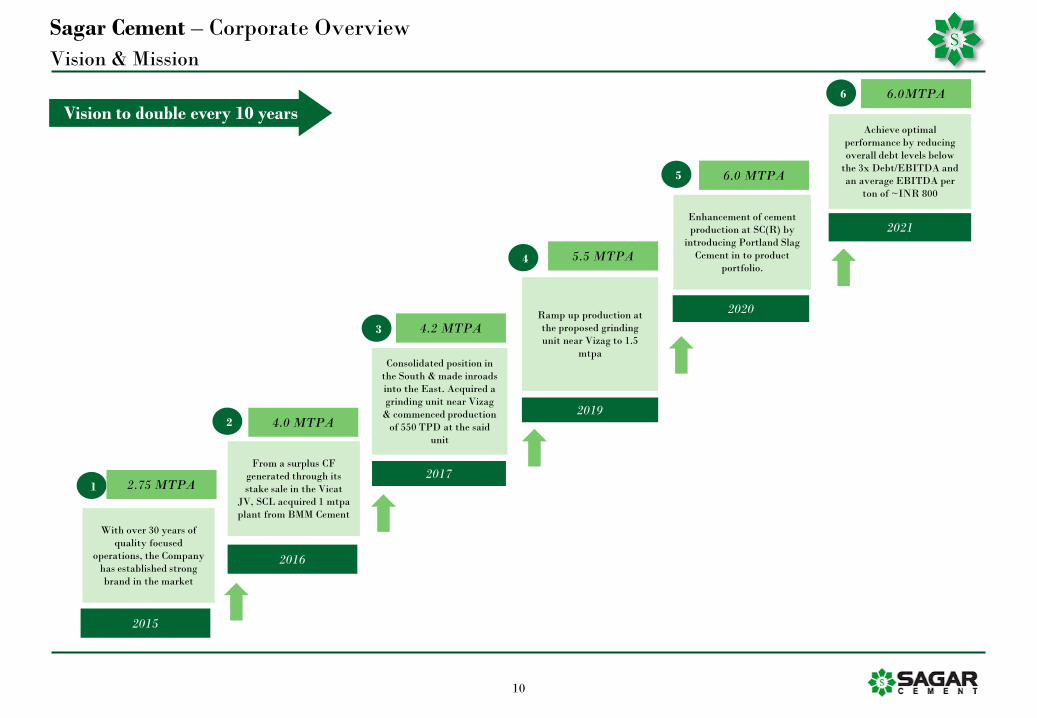
With over 30 years of
quality focused
operations, the Company
has established strong
brand in the market
Vision to double every 10 years
Consolidated position in
the South & made inroads
into the East. Acquired a
grinding unit near Vizag
& commenced production
of 550 TPD at the said
unit
Ramp up production at
the proposed grinding
unit near Vizag to 1.5
mtpa
Enhancement of cement
production at SC(R) by
introducing Portland Slag
Cement in to product
portfolio.
Achieve optimal
performance by reducing
overall debt levels below
the 3x Debt/EBITDA and
an average EBITDA per
ton of ~INR 800
From a surplus CF
generated through its
stake sale in the Vicat
JV, SCL acquired 1 mtpa
plant from BMM Cement
1
2
3
4
5
6
2.75 MTPA
4.0 MTPA
4.2 MTPA
5.5 MTPA
6.0 MTPA
6.0MTPA
2016
2017
2019
2021
2020
2015
Sagar Cement – Corporate Overview
Vision & Mission

11
Distribution & Consignment Agents # 60
Dealers # 2150
Bus Panel
Bus Shelter Bus Paintings
Shop Paintings
Wall Paintings Cab Paintings
Distribution Network – Focused on South Strong Brand Equity & Recall
Strong Brand Equity & Recall
Sagar Cement – Corporate Overview
Strong Sales & Distribution Channel

12
Resources Market
FinancialsPlant
Mattampally Limestone Reserves and Resources: More than 600
mn tons
Mining Lease, for 1,158 Acres & Prospecting License for
1,967 Acres at Mattampally
Geographic location with proximity to coal mines (Major
Fuel) and ports (less than 150 kms from the plant)
SC(R) Limestone Reserves: 174.7 mn Tonnes & mining lease for
20 Years
Packing Material is mostly sourced from Panchavati Polyfibres
Limited, a company belongs to Promoters Group – Panchavati
Polyfibres Limited
Part of Nalgonda & Yerraguntla Cement Cluster
Sagar Cement – Corporate Overview
Inherent Strengths
Fully automated 3MTPA plant in Nalgonda Cluster
6 MW WHR under construction
Proposed 15MW Thermal power plant
Railway Siding added logistics advantage
Acquired State of Art 1 MTPA SC(R) plant at Ananthapur
District, AP and
25 MW Captive Power Plant through Acquisition
of SC(R) –Formerly known as BMM Cements Ltd.
Bayyavaram grinding plant (Toshali) – Vizag – 0.2 MTPA
Grinding Unit – expandable to 1.5 MTPA
Net worth increased more than 10 times in 7 years, Net
Debt/ Equity of 0.7x
Long term debt rating A- ( India Ratings)
Financial Performance –
The company has been consistently Making Profits
barring a couple of years under expansion anddue to
Industry slowdown
Sales & EBITDA growth at a 23% & 27% CAGR
over last 10 years respectively (FY 2006 – 2016)
Track record of consistent dividends
Plant located in close proximity to Major Markets in South and
select markets in Maharashtra & Odisha
Average Lead Distance below 500 kms
Strong sales and distribution network – 2150 dealers
Well connected to various Markets and ports
Acquisition of SC(R) & Bayyavaram grinding plant (Toshali) to
increase market penetration
SC(R) – Deeper access to southern markets with
significant less lead distance – (Increasing margins &
reach)
Bayyavaram grinding plant (Toshali) – Vizag ->
Leveraging locational benefit to capture coastal
northern AP & south Odisha markets
Resources
Strong Financial Fundamentals State of Art – Integrated Plants – 4.2 MTPA
Market

13
Mr S. Veera Reddy
Managing Director
Mr S. Sreekanth Reddy
Executive Director
Dr.S.Anand Reddy
Joint Managing Director
Inducted on the Board in 1991, and later appointed
as a Whole-time Director (Marketing and Projects)
in 1992
He has been instrumental in promoting the
subsidiary company Sagar Power Limited where he
is presently its Managing Director
He is a doctor by qualification
Mr M S A Narayana Rao
Group President
Mr K Ganesh
President – Projects &
Development
Mr K Prasad
CFO
Mr.P.S.Prasad
President - Marketing
Has 35 years of experience in Marketing
Holds Bachelor Degree in Arts
Worked in various organisations in different levels
Had served as General Manager – (Marketing) in Sri
Vishnu Cements Limited
R. Soundararajan
Company Secretary,
Compliance Officer
Has more than 40 years of experience.
Holds ACS, ACMA and a Law degree.
Heading the Secretarial & Compliance functions of
the Group.
Sagar Cement – Corporate Overview
Professional & Experienced Management…
An agriculturalist turned industrialist. Was a co-
promoter of well known Priyadarshini Group of
Companies.
Appointed as Managing Director in 1991, he has
played a key role in steering the company to its
present status
After having gained industrial experience of over
15 years, he joined Sagar Cements as its Technical
Consultant in 2002 and later was inducted in the
Board as a Whole-time Director.
Holds PG Dip in Cement Technology
Has more than 50 Year experience in Cement
Industry.
Holds B.E. Hons. (Mechanical).
Served as President (Works), NCL Industries
Limited
Has more than 30 years of experience in Project
execution.
Holds B.E (Mechanical)
Served as Senior Engineer in Bhagawati Priya
consulting Engineers Limited, Mumbai
Has more than 20 years of experience.
Heading the Finance & Accounts function of the
Group.
Holds M.Com., ACA
He served as Senior Manager in Sagarsoft (India)
Limited

14
Exec
uti
ve D
irec
tors
No
n-e
xec
uti
ve D
irec
tors
Mr O. Swaminatha Reddy
Chairman & Independent Director
Mr John-Eric Bertrand
Director
Mr V.H. Ramakrishnan
Director
Smt. S. Rachana
Non-Executive Director
Mr K. Thanu Pillai
Independent Director
A Financial and Management consultant, known for his acumen in corporate finance. He has been associated with the Board since 1983.
Earlier he had served as Chairman of Andhra Bank and AP State Finance Corporation. He is on the Board of several reputed companies.
B.Com.(Hons) ACA
An agriculturalist turned industrialist. He was a co-promoter of well known Priyadarshini Group of Companies. He was appointed as
Managing Director Sagar Cements in 1991
He has played a key role in steering the company to its present status
Mr S. Veera Reddy
Managing Director
Dr. S. Anand Reddy
Joint Managing Director
Inducted on the Board on 23rd November 1991, was later appointed as a Whole-time Director (Marketing and Projects) in 1992. He has
been instrumental for promoting the subsidiary company Sagar Power Limited, of which he is presently the Managing Director.
He is a qualified doctor (MBBS)
Mr S. Sreekanth Reddy
Executive Director
After having gained industrial experience of over 15 years, he joined Sagar Cements as its Technical Consultant in 2002 and was inducted
in the Board as a Whole-time Director.
PG Dip in Cement Technology
Mr T.Nagesh Reddy
Nominee Director
Extensive experience for more than 35 years in both Domestic and International Banking during his career with Bank of India. Retired
as its General Manager (International) in April, 2001
BSC, ACA, ACMA
Appointed as Director on 27th February 1997. He has more than 30 years of experience in Banking and retired as Managing Director of
State Bank of Hyderabad. He is also on the Board of several listed companies.
M.B.A. , CAIIB
Investment Manager at Ackermans & van Haaren NV. Before joining AVH, he worked as Senior Consultant at Roland Berger Strategy
Consultants.
Commercial Engineer & MBA
Non –Executive Director
Working as Executive Director in Panchavati Poly Fibre Limited
She holds Bachelor Degree in Science
Nominee Director of APIDC
Sagar Cement – Corporate Overview
…Backed by the Strong Board

15
Shareholding Pattern (As on March 2017)
Capital Structure
Select Public Investors
Particulars Nominal Amount
Authorised Share Capital (Face Value Rs.10/- per share) 22,00,00,000
Issued, Subscribed and Paid up Share Capital 20,40,00,000
SN Shareholders % Holding
1 AVH Resources India Pvt Limited 17.57
2 Mutual Funds 18.93
3 Twinvest Financial Services 3.99
Sagar Cement – Corporate Overview
Shareholding Structure
Promoters, 50.04%
FIIs & MFs, 18.93%
Bodies Corporate, 42.22%
Public (Individuals), 7.74%

16
RV Consulting
Reputed Turn Key Solutions provider (Design, Engineering & Project Management) to Cement Industry & Small Hydro Power Projects
Select Customers include:
Bharathi Cement Corporation Limited, Vicat Sagar Cement Private Limited, Maruthi Cements Limited, Nepal, Keerthi Industries
Limited, Hyderabad, Super Hydro Electric Private Limited, Syrian Cement Co., Aleppo, Alchaba Cement, Syria, Trotus Cement,
Syria, Amrit Cement, Meghalaya
Panchvati Polyfibers Limited
Incorporated in 1984, Engaged in manufacturing PP Fabric / Woven Sacks for Cement Industries
Capacity: Manufacturing of Woven Sacks with a capacity of 58.50 Million sacks with 90 Looms
Select Customers include:
Sagar Cements, My Home Cements, Penna Cements and other Cement Industries in Andhra Pradesh
Sagar Soft (India) Limited
Incorporated in 1996, engaged in providing software development and consultancy services in India and the United States
Primarily offerings include mobility, enterprise solutions, as well as research and data mining, social media engagement, financial
analytic and business intelligence, testing and quality assurance, and technology related solutions across sectors
Sagarsoft provides its services using onsite, offsite, offshore and hybrid delivery models
Listed on BSE Limited
Sagar Power Limited
Engaged in operating hydroelectric power generation. The company was incorporated in 1994
Projects:
Hydro Power : 8.30 MW ( 4.30 MW plant at Guntur Dist. & 4.00 MW at Kurnool Dist., Andhra Pradesh , India)
Wind Power : 1.65 MW capacity on June 2nd 2009 at Theni Dist., Tamil Nadu and expected PLF is 32%
Owns 100% stake in Super Hydro Electric Pvt Ltd., which is implementing Hydro Power Generation Plant of combined capacity of 28.30
MW in Uttarakhand
Sagar Cement – Corporate Overview
Companies associated with promoter group

xx
17
Sagar Cements Limited – Key Investment Highlights

MBL’s Positioning
18
Sagar Cements Limited – Key Investment Highlights
18
Well Positioned to Capture the Demand Revival in South
Strategic Expansion Plan – Rightly Timed and Well Thought-out
Acquisition Synergies to Derive Multiple Benefits
Strong Financials
Professional Management with Strong Execution Track Record

91.7 90.0 99.0 107.6 113.8 121.1 135.6153.3 169.0 183.4
202.4 210.9 224.8 231.7 238.0 250.2 260.7 274.6292.0
311.7334.8
360.2
FY00 FY01 FY02 FY03 FY04 FY05 FY06 FY07 FY08 FY09 FY10 FY11 FY12 FY13 FY14 FY15 FY16 FY17P FY18P FY19P FY20P FY21P
19
Strategic Expansion Plan – Robust and Well Thought-out
“Rightly Timed Expansion during Down cycle”C
em
ent
Dem
and
(M
TPA
) 5.7 %
Sagar Cement, with BMM & Bayyavaram grinding unit acquisitions at current capacity of 4.2MTPA is strongly positioned to derive full
benefit in the Cement Up cycle
Strategic Expansion Plan
Capturing up-cycle in South Markets
BMM Strategic acquisition providing
superior access and short lead distance
to increase profitability
Expand market reach in Eastern Markets
Coastal Slag Market – Leveraging lead
time with grinding unit at Vizag with
minimal capex
Bayyvaram grinding unit’s strategic
location with slag availability and
clinker from mother plant
Expansion to 1.5 MTPA
Cost Optimisation & Energy Efficiency
Improving operation efficiencies in fuel &
freight
A Captive power plant with all units
ensuring power security at reasonable
prices
25MW Captive plant at BMM
6 MW Waste Heat Recovery plant –
Under construction
18 MW Thermal Power Captive plant
at Mattampally (Under construction)
Railway Siding for logistics advantage
Expansion not at expense of Financial
Strength
Minimal leveraging & intent to keep capex
cost escalation below inflation
Financial Prudence
To Double the existing capacity at every 10
Years in targeted markets through
Debottlenecking – Up gradation
Organic & Inorganic expansion
Future Expansion
10.8% 4.3%
Up-cycleDown-cycleDown-cycle Up-cycle
6.5 – 7.5%
Source: Crisil Research Annual Review November 2016

59%58%
56%57%
54%
56%
58%
59%
61%62%
49%
51%
53%
55%
57%
59%
61%
63%
0.0
20.0
40.0
60.0
80.0
100.0
120.0
140.0
160.0
180.0
2010-11 2011-12 2012-13 2013-14 2014-15 2015-16 2016-17P 2017-18P 2018-19P 2019-20P 2020-21P
Effective Capacity Demand Capacity Utilisation
20
• Capacity Addition CAGR (FY11-16) – 5.0%
• Demand CAGR (FY11-16) – (0.1 – 0.0) %
• Average Utilization – 57%
• Capacity Addition CAGR (FY16-21E) – 2.8%
• Demand CAGR (FY16-21E) – 5.0- 6.0%
• Average Utilization – 59%
Major capacity Addition Post FY07Demand subdued till FY16 resulting in excess capacity
Capacity utilization declined to 54%
Limited incremental capacity, political stability, formation of new state augurs well for demand spurt
Capacity utilization to reach 60% in next three years
Well Positioned to Capture South Recovery
“Southern Markets to Witness Demand Revival after Years of Declining to Muted Demand…”
Source: Crisil Research Annual Review November 2016, Industry Articles
67%
MTPA
“K
ey G
row
th D
rive
rs” Growth Recovery in Cement Demand Post Formation of Telangana – Driven by 2-BHK housing scheme and demand from Infra
projects especially road and irrigation projects
Limited capacity additions and an anticipated pick-up in construction and irrigation projects going forward is expected to drive demand in southern markets
Double Digit Growth in Andhra Pradesh driven by development of commercial and government infrastructure in Amarawati Capital
States with muted growth in past such as Tamil Nadu and Karnataka are expected to witness some upward bias on back of growth in
some pockets such as North Karnataka
Key infrastructure projects in South include Kakatiya and Bhagiratha mission, Low Cost Housing / Smart Cities, Metro Rail Projects,
Large NHAI projects amongst others

21
Well Positioned to Capture South Recovery
“…Gradually built Proximity to key Markets with Shorter Lead Distances”
Maharashtra
Karnataka
Andhra Pradesh
Tamil Nadu
Telengana
53.7% 51.0% 54.0%38.8% 41.7% 45.0%
13.9% 14.0% 11.0%
15.1% 10.5%16.3%
11.8% 13.3% 10.0%16.1% 16.8%
16.3%
11.8% 13.5% 16.0% 20.0% 19.0%12.8%
3.8% 3.9% 6.0% 7.1% 8.7% 5.6%5.0% 4.3% 3.0% 2.9% 3.3% 3.7%
FY12 FY13 FY14 FY15 FY16 FY17
AP&T Karnataka TN Maharashtra Orrisa Others
Sagar has built a strong presence across key southern markets as it
diversified its base from AP&T (> 4 MTPA)
Presence across all five key states in the southern region – AP, Telangana,
Tamil Nadu, Karnataka and Kerala
Proximity of SCL’s plants to key markets, particularly in AP & T
Superior reach with shorter lead distances post acquisition across
select markets (TN, Karnataka, Kerala)
Strong brand presence built over years, backed by deep distribution
network in South ~ 2,150 dealers
Average Lead Distance across key markets ~ 300 - 500 Km
Diversifying Geographic Spread (Revenue wise)
22
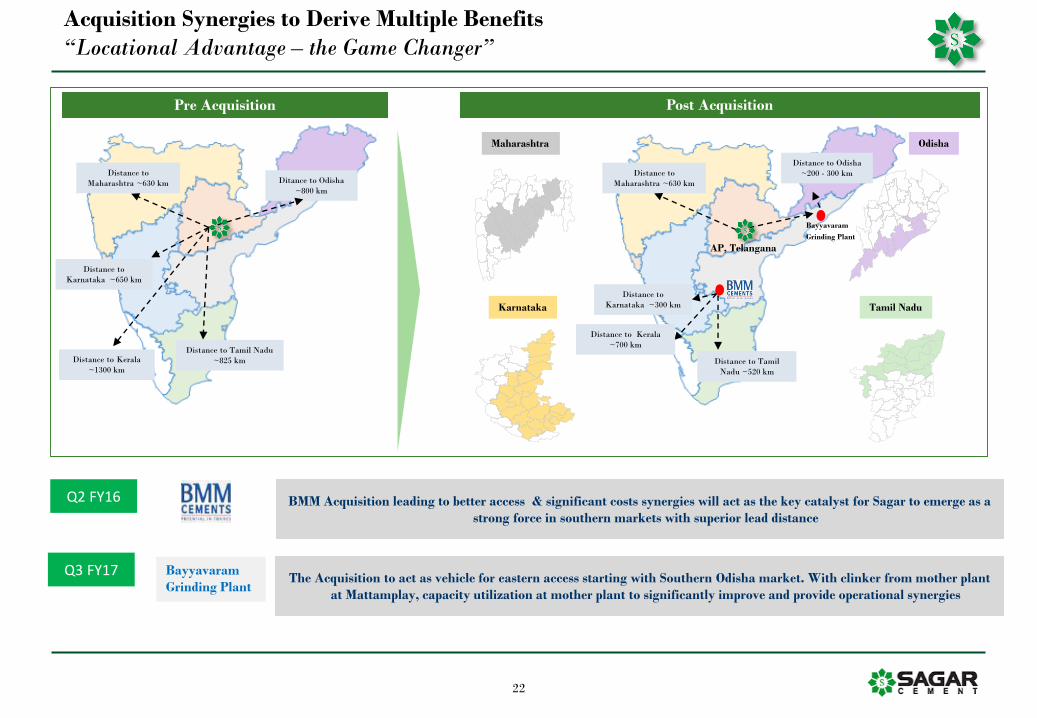
Acquisition Synergies to Derive Multiple Benefits
“Locational Advantage – the Game Changer”
Q2 FY16 BMM Acquisition leading to better access & significant costs synergies will act as the key catalyst for Sagar to emerge as a
strong force in southern markets with superior lead distance
The Acquisition to act as vehicle for eastern access starting with Southern Odisha market. With clinker from mother plant
at Mattamplay, capacity utilization at mother plant to significantly improve and provide operational synergies
Q3 FY17
Pre Acquisition Post Acquisition
Distance to
Maharashtra ~630 km
Distance to Odisha
~200 - 300 km
Distance to Tamil
Nadu ~520 km
Distance to
Karnataka ~300 km
Distance to
Karnataka ~650 km
Distance to Tamil Nadu
~825 km
Distance to
Maharashtra ~630 km Ditance to Odisha
~800 km
Karnataka Tamil Nadu
Odisha
AP, Telangana
Maharashtra
Bayyavaram
Grinding Plant
Bayyavaram
Grinding Plant
Distance to Kerala
~700 km
Distance to Kerala
~1300 km

23
Post BMM acquisition– Tamil Nadu, Karnataka & Kerala markets can now be serviced through a shorter lead
distance. Tamil Nadu & Kerala account for 28% of SCL Sales’ volumes in FY16
Capacity 1 MTPA
Location Karnataka & AP Border
Capacity Utilisation (FY17) 67%
Power 25 MW CPP
Limestone 174.7 mn Tonnes (20 Yrs
lease 2016)
Revenue (FY17) INR 343 Cr
Synergies
Asset Details
23
Key Mkt Lead Distance (Appox.)
Tamil Nadu
Karnataka
Kerala
From 825 km
From 650 km
From 1300 km
To 520 km
To 300 km
To 700 km
Acquisition Synergies to Derive Multiple Benefits
“BMM Acquisition”
Locational Advantage - Reduced Lead Distance
Market Reach
Freight Cost Improvement
Reduction in Power Cost
Future Expansion
Freight /tonne is expected to reduce from ~INR 1200/tonne for these markets, company expects a total freight saving
of ~INR 140-150/tonne on a blended basis
Reduction in power cost – Excess capacity in BMM power generating plant (25MW) to be supplied to Mattampally
plant and remaining to be sold to third parties to generate additional revenue
Limestone reserves adequate to support any expansions for BMM - blended raw material costs to further reduce going
forward
600450
Pre Acquistion Post Acquistion
Effective Lead Distance (Km)
FY17 Sales (Vol)
AP, 18%
KA, 46%
TN, 33%
Others, 3%
2424
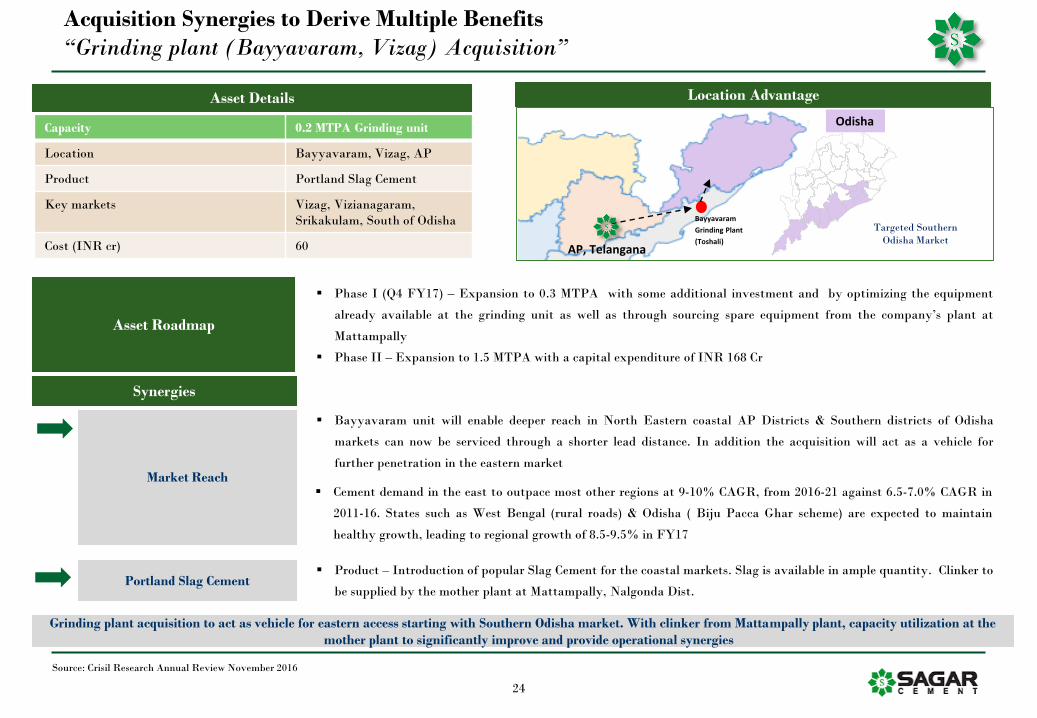
Acquisition Synergies to Derive Multiple Benefits
“Grinding plant (Bayyavaram, Vizag) Acquisition”
Capacity 0.2 MTPA Grinding unit
Location Bayyavaram, Vizag, AP
Product Portland Slag Cement
Key markets Vizag, Vizianagaram,
Srikakulam, South of Odisha
Cost (INR cr) 60
Asset Details
Synergies
Grinding plant acquisition to act as vehicle for eastern access starting with Southern Odisha market. With clinker from Mattampally plant, capacity utilization at the
mother plant to significantly improve and provide operational synergies
Bayyavaram unit will enable deeper reach in North Eastern coastal AP Districts & Southern districts of Odisha
markets can now be serviced through a shorter lead distance. In addition the acquisition will act as a vehicle for
further penetration in the eastern marketMarket Reach
Portland Slag Cement Product – Introduction of popular Slag Cement for the coastal markets. Slag is available in ample quantity. Clinker to
be supplied by the mother plant at Mattampally, Nalgonda Dist.
Phase I (Q4 FY17) – Expansion to 0.3 MTPA with some additional investment and by optimizing the equipment
already available at the grinding unit as well as through sourcing spare equipment from the company’s plant at
Mattampally
Phase II – Expansion to 1.5 MTPA with a capital expenditure of INR 168 Cr
Asset Roadmap
Location Advantage
Targeted Southern
Odisha Market
Odisha
AP, Telangana
Bayyavaram
Grinding Plant
(Toshali)
Source: Crisil Research Annual Review November 2016
Cement demand in the east to outpace most other regions at 9-10% CAGR, from 2016-21 against 6.5-7.0% CAGR in
2011-16. States such as West Bengal (rural roads) & Odisha ( Biju Pacca Ghar scheme) are expected to maintain
healthy growth, leading to regional growth of 8.5-9.5% in FY17

25
Professional Management
“Strong Execution Track Record”
Mr K Prasad
CFO
Mr M S A Narayana Rao
Group President
Mr K Ganesh
President Projects & Development
Professional Management with over 3 decades of experience & in-depth understanding of market and customer behaviour
Proven track record of setting-up Greenfield plants (e.g. Vicat etc)
Ability to acquire and integrate plants and processes
Most of the Senior Management personnel have been with the Company for more than a decade
Mr.P.S.Prasad
President Marketing
R. Soundararajan
Company Secretary, Compliance Officer
Mr S. Veera Reddy
Managing Director
Dr.S.Anand Reddy
Joint Managing Director
Mr S. Sreekanth Reddy
Executive Director

xx
26
Sagar Cements Limited – Financial Summary

113
42
1
56
122 11318.9
7.6
0.3
10.4
16.2
13.8
FY12 FY13 FY14 FY15 FY16 FY17
EBITDA Margin (%)
449
-26
297
44
-4
7.4%1.6% -5.2%
54.5%
5.9%-0.5%
FY12 FY13 FY14 FY15 FY16 FY17
PAT Margin (%)
595 559
489 545
753 814
FY12 FY13 FY14 FY15 FY16 FY17
Net Revenue
EBITDA
INR crINR cr
PAT
Capacity & Capacity Utilization
INR cr
Note: FY15, PAT includes INR 280.52 crores on account of sale of investments in the JV
1127
2.8 2.8 2.8 2.8
3.8
4.259%
58%
52%
56%
53%54%
FY12 FY13 FY14 FY15 FY16 FY17
Capacity (in mtpa) Capacity Utilisation (%)
Sagar Cements
Financial Performance – On An Upward Trajectory
Revenue on an upward trend driven by volume growth, coupled with margin improvement

28
Income Statement (Consolidated) Balance Sheet (Consolidated)
Sagar Cements
Summary Financial Highlights
Note: Numbers in FY14 & FY15 are on standalone basis and FY16 & H1 FY17 numbers are on consolidated basis
Particulars (INR cr) FY14 FY15 FY16 FY17
Net Sales 488.9 548.1 753.42 813.83
Other Income 17.8 363 4.08 3.52
Total Income 506.8 911.1 757.51 817.36
Total Expenses 487.6 488.4 630.31 703.47
EBITDA 19.1 422.7 127.20 113.89
Interest 29.5 23.1 41.86 62.08
Depreciation 26.9 21.5 34.72 47.59
PBT -37.4 378.1 50.62 4.22
Tax -11.8 81.4 6.35 8.14
PAT -25.6 296.7 44.27 -3.92
Particulars (INR cr) FY14 FY15 FY16 FY17
Equity Share Capital 17.4 17.4 17.4 20.4
Reserves 223.5 503.9 531.7 742.6
Long Term Loans 111.4 121.1 295.4 349.7
Non Current Liabilities 100.2 107.3 95.3 80.6
Short Term Borrowings 66.4 88 87.0 95.6
Other Current Liabilities 148.5 158.9 241.4 244.4
Non Current Assets 507.2 520.1 1,051.6 1,125.4
Cash & Cash Eq. 4.6 219.3 3.0 161.8
Inventories 41.8 62.3 90.5 110.3
Other Current Assets 113.8 195.4 123.1 135.7

29
Historical Performance – Sagar Cements (Standalone)
In lakh(except Dividend,D/E Ratio,EPS,Book Value per Share)
SN Year Production Net worth Turnover PBID NPAT Dividend % D/E RatioBook Value Per
Share (INR)
1 Dec-85 75919 374.76 941.47 242.81 87.69 10 1.54 12.78
2 Dec-86 111389 544.87 1307.43 338.09 167.2 10 1.06 18.79
3 Dec-87 111890 584.33 1275.74 322.29 46.89 12 1.01 20.21
4 Mar-89 150813 593.99 1626.02 281.69 32.96 10 1.2 20.59
5 1989-90 122074 596.52 1340.03 254.3 31.03 10 0.97 20.72
6 1990-91 120633 697.5 1604.76 393.03 143.68 15 0.6 24.31
7 1991-92 130407 753.6 1828.6 388.08 101.71 16 0.34 26.31
8 1992-93 154878 1834.05 2488.16 542.94 151.1 16 0.6 21.81
9 1993-94 180973 1786.15 2826.58 250.96 -85.37 - 0.77 21.31
10 1994-95 256901 1951.48 4201.63 705.71 153.64 - 0.91 23.43
11 1995-96 256691 2349.91 6260.26 1188.51 551.37 20 0.63 28.39
12 1996-97 278827 2669.4 7078.94 1111 455.22 16 0.53 32.38
13 1997-98 305541 2897.55 7380.83 915.66 297.23 16 0.48 35.25
14 1998-99 296109 3015.58 6766.06 707.9 123.95 - 0.42 36.77
15 1999-00 340107 3370.75 7574.53 542.99 50.01 - 0.65 37.77
16 2000-01 393509 3624.15 9553.18 1153.73 346.58 12 0.52 32.18
17 2001-02 386545 3868.06 10073.54 1073.55 222.94 0 0.51 34.68
18 2002-03 312887 3006.59 8119.64 -16.52 -726.96 0 0.74 26.96
19 2003-04 355004 3018.66 11134.26 950.1 64.58 0 0.73 27.07
20 2004-05 341118 3170.29 12377.68 1089.07 172.41 10 0.19 28.43
21 2005-06 279500 3299.19 15443.46 848.04 283.35 10 0.04 29.58
22 2006-07 276400 8210.55 24802.14 4383.73 2766.68 25 0.17 59.63
23 2007-08 282242 11682.6 27561.42 5759.05 3095.56 25 1.8 84.15
24 2008-09 431250 21243.08 33511.06 5985.54 1645.67 20 1 141.6
25 2009-10 1120351 23745.8 52979.04 8645.92 1912.35 25 0.73 158.28
26 2010-11 1490662 22164.74 55394.89 8139.19 1741.2 20 0.72 148.16
27 2011-12 1625336 25970.1 75468.8 12469.2 4411.6 30 0.44 149.36
28 2012-13 1587419 26644.65 72120.29 6822.15 877.98 10 0.54 153.24
29 2013-14 1419943 24086.55 63071.16 1912.94 -2558.11 0 0.51 138.52
30 2014-15 1551598 52133.27 63179.84 42265.6 29665.20 75 0.27 299.82
31 2015-16 * 1834837 54907.07 86242.02 12719.69 4426.84 50 0.63 315.77
32 2016-17 * 2190907 76295.81 94158.89 11388.74 -392.15 15 0.51 373.99
* Consolidated

30
Awards & Accolades
Awards & Accolades
ISO 9001 : 2000 QMS
ISO 14001 : 2004 EMS
OHSAS 18001 : 2005
RMF & ICD for SOX Compliance
NABL accreditation for our Mattampally Lab
Certifications
• Best Employer Award from Telangana State
Government for the Year 2015 and 2017
• State Level award for overall performance during
Mines Safety week from Director General of
Mines