saic motor corporation limited annual report...
TRANSCRIPT

SAIC MOTOR ANNUAL REPORT 2016
- 1 -
Company Code:600104 Abbreviation of Company: SAIC
SAIC MOTOR CORPORATION LIMITED
Annual Report 2016 Important Note
1. Board of directors (the "Board"), board of supervisors, directors, supervisors and senior
management of the Company certify that this report does not contain any false or
misleading statements or material omissions and are jointly and severally liable for the
authenticity, accuracy and integrity of the content.
2. All directors attended Board meetings.
3. Deloitte Touche Tohmatsu Certified Public Accountants LLP issued standard unqualified
audit report for the Company.
4. Mr. Chen Hong, Chairman of the Board, Mr. Wei Yong, the chief financial officer, and Ms.
Gu Xiao Qiong. Head of Accounting Department, certify the authenticity, accuracy and
integrity of the financial statements contained in the annual report of the current year.
5. Plan of profit distribution or capital reserve capitalization approved by the Board
The Company plans to distribute cash dividends of RMB 16.50 (inclusive of tax) per 10 shares,
amounting to RMB 19,277,711,252.25 in total based on total shares of 11,683,461,365. The
Company has no plan of capitalization of capital reserve this year. The cash dividend
distribution for the recent three years accumulates to RMB48,605,718,485.39 in total (including
the year of 2016).
6. Risk statement of forward-looking description
√Applicable □N/A
The forward-looking description on future plan and development strategy in this report does not
constitute substantive commitment to investors. Please note the investment risk.
7. Does the situation exist where the controlling shareholders and their related parties occupy
the funds of the Company for non-operational use?
No.

SAIC MOTOR ANNUAL REPORT 2016
- 2 -
8. Does the situation exist where the Company provides external guarantee which is not in
compliance with the required decision-making procedures?
No.
9. Significant risk alert
√Applicable □N/A
There are no significant risks which have substantive effects on Company's production and
operation during the reporting period. The Company has described the possibly existing relevant
risks exposure in the process of production and operation in this report. Relevant details can
refer to “Possible Risks” in Section IV Discussion and Analysis for Operation
10. Others
□Applicable √ N/A

SAIC MOTOR ANNUAL REPORT 2016
- 3 -
Contents
Section I Definitions .................................................................................................................................. 4
Section II General Information and Financial Indicators of the Company ......................................... 5
Section III The Company's Business Overview .................................................................................... 10
Section IV Discussion and Analysis for Operation .............................................................................. 11
Section V Important Events ................................................................................................................... 22
Section VI Changes in Ordinary Shares and Information of Shareholders ...................................... 30
Section VII Preferred Stock Information ............................................................................................. 33
Section VIII Directors,Supervisors and Senior Management and Employees .................................. 34
Section IX Corporate Governance ........................................................................................................ 41
Section X Corporate Bonds .................................................................................................................... 46
Section XI Financial Statements ............................................................................................................ 47
Section XII List of Documents Available For Inspection .................................................................. 179

SAIC MOTOR ANNUAL REPORT 2016
- 4 -
Section I Definitions
I. Definition
In this report, unless the context otherwise requires, the following terms shall have the meanings set out below: Definition of usual words
CSRC Refers to China Securities Regulatory Commission
SSE Refers to Shanghai Stock Exchange
Shanghai SASAC Refers to Shanghai State-owned Assets Supervision and Administration Commission
Company, the Company, the Group Refers to SAIC Motor Corporation Limited
SAIC Refers to Shanghai Automotive Industry Corporation (Group)
SAIC VOLKSWAGEN Refers to SAIC Volkswagen Automobile Co., Ltd.
SAIC GM Refers to SAIC General Motors Co., Ltd.
SAIC Passenger Vehicle Refers to SAIC Motor Corporation Limited Passenger Vehicle Branch
SGMW Refers to SAIC GM Wuling Co., Ltd. SAIC Maxus Refers to SAIC Maxus Vehicle Co., Ltd. Shanghai Sunwin Refers to Shanghai Sunwin Bus Co., Ltd. IVECO Hongyan, SAIC-IVECO Hongyan Refers to SAIC-IVECO Hongyan Commercial
Vehicle Co., Ltd. Nanjing Iveco Refers to Nanjing Iveco Automobile Co., Ltd. SAIC Motor-CP Refers to SAIC Motor-CP Co., Ltd
HASCO Motor, HASCO Refers to HUAYU Automotive Systems Co., Ltd.
SFC Refers to SAIC Finance Co., Ltd.
GMAC-SAIC Refers to SAIC-GMAC Automotive Finance Co., Ltd.
SAIC-ACMT Refers to Shanghai SAIC Anyo Charging Material Technology Co., Ltd.
SAIC-FCM Refers to SAIC Motor Finance Controlling Management Co., Ltd.

SAIC MOTOR ANNUAL REPORT 2016
- 5 -
Section II General Information and Financial Indicators of the Company
I. Information of the Company Legal company name in Chinese 上海汽车集团股份有限公司 Abbreviation of legal company name in Chinese 上汽集团
Legal company name in English SAIC Motor Corporation Limited Abbreviation of legal company name in English SAIC MOTOR
Legal representative of the Company Mr. Chen Hong II. Contacts Secretary to the Board Securities affairs representative Name Ms. Wang Jianzhang Mr. Wei Yong
Address No.489,Weihai Road, Jing'an District, Shanghai, China
No.489,Weihai Road, Jing'an District, Shanghai, China
Telephone number (021)22011138 (021)22011138 Facsimile number (021)22011777 (021)22011777 E-mail [email protected] [email protected] III. Basic information of the Company
Registration address Room 509,No.1 Tower,No.563, Songtao Road Pilot Free Trade Zone, Shanghai, China
Post code of registration address 201203 Office address No. 489 Weihai Road, Jing'an District, Shanghai, China Post code of office address 200041 Website http://www.saicmotor.com E-mail [email protected] IV. Information disclosure and the locations Designated newspapers for information disclosure
"Shanghai Securities News", "China Securities Journal" and "Securities Times"
Website designated by CSRC for the publication of the Company's annual report
http://www.sse.com.cn
The Company's annual report is available at Office of the Board
V. Abbreviation of the Company's shares
Abbreviation of the Company's shares Class of shares Stock exchange Short name Stock code Former short name
A shares Shanghai Stock Exchange
上汽集团(SAIC MOTOR) 600104 上海汽车(Shanghai
Automotive)

SAIC MOTOR ANNUAL REPORT 2016
- 6 -
VI. Other relevant information
Information of the accounting firm appointed by the Company (domestic)
Name Deloitte Touche Tohmatsu Certified Public Accountants LLP
Office address F/30,Bund Center, No. 222 Yan An Road East, Shanghai
Signing Certified Public Accountant
Yuan Shouqing, Ma Tiantian
Sponsor performing continuous supervision duties in the reporting period*
Name Guotai Junan Securities Co., Ltd.
Office address F/29,No.168 Yincheng Middle Road, Pudong New Area, Shanghai
Authorized sponsor representative
Chi Huitao, Ding Yinghua
Continuous supervision period December 10,2010 - December 31,2011
Note: On January 19, 2017, the Company completed the registration of newly additional shares of a private-offering share project which was launched at the end of 2015. The sponsor of such private-offering project was Guotai Junan Securities Co., Ltd. which would perform its supervision duty from January19, 2017 to December 31, 2018. On March 9,2017, according to Announcement for the Change of Sponsor Representatives issued by the Company,the authorized sponsor representatives for continuous supervision were changed to Mr. Chi Huitao and Mrs. Ding Yinghua. (Details refer to www.sse.com.cn.). VII. Major accounting data and financial indicators in recent three years (1) Major accounting data
Unit: RMB Major accounting data 2016 2015 Year-on-year (%) 2014
Total operating income 756,416,165,065.29 670,448,223,139.34 12.82 630,001,164,437.70 Operating income 746,236,741,228.56 661,373,929,792.65 12.83 626,712,394,486.86 Net profit attributable to shareholders of the Company
32,008,610,688.65 29,793,790,723.65 7.43 27,973,441,274.41
Net profit excluding non-recurring profit or loss attributable to shareholders of the Company
30,328,970,857.53 27,330,818,075.38 10.97 25,916,187,753.37
Net cash flow from operating activities 11,376,933,816.05 25,992,574,916.30 -56.23 23,283,810,974.30
December 31,2016 December 31,2015 Year-on-year (%) December 31,2014 Net assets attributable to shareholders of the Company
191,920,977,560.73 175,128,738,657.93 9.59 157,664,385,972.52
Total assets 590,628,137,524.05 512,955,958,115.78 15.14 414,870,673,481.85

SAIC MOTOR ANNUAL REPORT 2016
- 7 -
(II) Major financial indicators Major financial indicators 2016 2015 Year-on-year (%) 2014 Basic earnings per share (RMB/Share) 2.903 2.702 7.44 2.537 Diluted earnings per share (RMB/Share) N/A N/A N/A N/A Basic earnings per share excluding non-recurring profit or loss (RMB/Share)
2.751 2.479 10.97 2.351
Weighted average return on net assets (%) 17.53 17.91 Decreased by 0.38 percentage points 18.97
Weighted average return on net assets excluding non-recurring profit or loss (%) 16.61 16.43 Increased by 0.18
percentage points 17.58
Explanations for accounting data and financial indicators for recent three years The net cash flow from operating activities has been decreased by 56.23% comparing with the same period of last year, mainly due to addition of individual automotive consumption loans issued by a subsidiary of the Company, SFC. As required by the Circular of the Ministry of Finance on Issuing and Provisions concerning VAT Accounting Treatment (Cai Kuai [2016] No.22) enacted by the Ministry of Finance on December 3, 2012, and the Accounting Standard for Business Enterprise No.30-Presenation of Financial Statement, the opening balance of total assets in the annual report 2016 has been reclassified according to the presentation of the financial statements in the current year. VIII. Differences between figures under foreign and domestic accounting principles i. Differences between net profit and net assets attributable to shareholders of the Company
disclosed by Chinese Accounting Principles and International Accounting Principles
□Applicable √ N/A ii. Differences between net profit and net assets attributable to shareholders of the Company
disclosed by Chinese Accounting Principles and foreign Accounting Principles
□Applicable √ N/A iii. Explanations for differences between under domestic and foreign accounting principles
□Applicable √ N/A IX. Quarterly financial data for the year 2016
Unit:RMB
First Quarter (Jan. to Mar.)
Second Quarter (Apr. to Jun.)
Third Quarter (Jul. to Sept.)
Fourth Quarter (Oct. to Dec.)
Total operating income 185,156,097,501.33 166,109,247,022.19 180,318,025,486.94 224,832,795,054.83 Operating income 182,722,880,191.27 163,571,868,391.47 177,559,855,082.09 222,382,137,563.73 Net profit attributable to shareholders of the Company
7,935,718,748.36 7,123,844,443.67 8,031,987,223.15 8,917,060,273.47
Net profit excluding non-recurring profit or loss attributable to shareholders of the Company
7,354,422,446.40 6,615,254,203.45 8,086,267,331.17 8,273,026,876.51
Net cash flow from operating activities -4,053,936,120.57 -783,348,022.54 20,663,544,009.70 -4,449,326,050.54 Explanations for differences between quarterly data and disclosed data in periodic report □Applicable √ N/A

SAIC MOTOR ANNUAL REPORT 2016
- 8 -
X. Items and amounts of non-recurring profit or loss
√Applicable □N/A Unit: RMB
Items and amounts of non-recurring profit or loss 2016 Note(if
applicable) 2015 2014
Profit or loss on disposal of non-current assets -274,439,799.71 -810,291,807.86 78,151,532.81 Government grants recognized in profit or loss for the current year, except those closely related with normal business courses, and given on quota basis continuously based on the state policy
2,547,141,715.81 2,964,271,237.07 2,672,209,600.09
The excess of acquirer's proportionate share of fair value of identifiable net assets of acquiree over the consideration paid for the acquisition of subsidiaries, associates and joint ventures
170,851,191.00 204,657,090.00 802,311.00
Profit or loss on debt restructuring 266,280.06 199,000.89 538,622.93 Profit or loss on changes in the fair value of held-for-trading financial assets and held-for-trading financial liabilities and investment income on disposal of held-for-trading financial assets, held-for-trading financial liabilities and available-for-sale financial assets, other than those for effective hedging activities relating to recurring operating business
8,285,353.69 -21,514,132.79 141,464,229.85
Reversal of impairment provision for accounts receivable with individually test of impairment - 752,487,529.12 -
Profit or loss on entrusted loans 29,826,908.01 38,707,922.55 21,203,441.14 Other non-operating income and expenses other than the above -232,900,943.80 -96,602,430.85 -165,240,686.44
Other non-recurring profit or loss items Impairment loss on available-for-sale financial assets -30,000,000.00 Amounts attributable to minority interests (after taxation) -254,988,503.67 -316,981,790.31 -300,617,158.36 Income tax effects -314,402,370.27 -251,959,969.55 -361,258,371.98 Total 1,679,639,831.12 2,462,972,648.27 2,057,253,521.04
XI. Items at fair value
√Applicable □N/A Unit: RMB
XII Others
□Applicable √ N/A
Item December 31,2015 December 31,2016 Movement Effects on profit or loss
Financial assets at fair value through profit or loss 1,221,103,619.65 1,559,753,224.57 338,649,604.92 -17,509,759.92
Available-for-sale assets 65,495,009,648.25 50,484,749,497.34 -15,010,260,150.91 -
Financial liabilities at fair value through profit or loss 7,486,291.00 - -7,486,291.00 7,486,291.00
Total 66,723,599,558.90 52,044,502,721.91 -14,679,096,836.99 -10,023,468.92

SAIC MOTOR ANNUAL REPORT 2016
- 9 -
Section III The Company's Business Overview
I. Major businesses, operation models and industry profile in the reporting period
The Company is mainly engaged in research and development, manufacturing and sales of automobiles (including passenger vehicles and commercial vehicles) and automobile spare parts (including engines, transmissions, power trains, chassis, interior and exterior trim, electronic appliances, etc.), as well as service, trading and financial investment related to automobiles. On the basis of hybrid operation model combining investment holding and business operation, the Company holds investment in its affiliated companies including SAIC Volkswagen, SAIC GM, SGMW, etc., and it operates the business of owned brands. The Company is the largest domestic automobile group in terms of sales and manufacturing scale by far, and the largest automobile company listed in A share in terms of market capitalization. Since 2004, the Company has been listed in Fortune Top 500 for 12 times consecutively and was ranked 46th in 2016 with total consolidated revenue of USD 106.68 billion for prior year. Detailed industry information of the Company refer to Section IV “Discussion and Analysis for Operation” in this report. II. Explanations of significant changes on major assets of the Company in the reporting period
□Applicable √N/A III. Analysis of core competitiveness during the reporting period
√Applicable □N/A Firstly, the Company has competitive advantage by owning the entire automotive industry chain. Operations of the Group have covered the entire automotive industry chain, which is propitious to produce synergistic effect and enhance the comprehensive competitive capacity. Secondly, the Company has leading advantage in domestic market. The Company plays a leading role for years in vehicle production and sales, with varieties of product categories and extensive sales network under continuous optimization in layout, which is beneficial for the Company to enhance the market presence and capability of quick reaction to customers' needs. Thirdly, innovation capability, an emerging advantage of the Company, is being advanced. As the Company has increasingly improved its independent R&D framework and reinforced its self-owned innovation capability, it independently masters the core technology for new energy automotive and obtained leading advantages in R&D and application for internet automotive; major joint ventures of the Company are getting stronger in the local R&D capability; and also, the Company accelerated its innovation layout in automobile aftermarket, and highlighted itself for its leading business scale in automotive finance services with consistently innovation efforts.

SAIC MOTOR ANNUAL REPORT 2016
- 10 -
Section IV Discussion and Analysis for Operation
I. Discussion and Analysis for Operation
Despite the gradually steady Chinese micro-economy, the year 2016 witnessed unconstrained fluctuation that decreased at first and then recovered later in domestic automotive market, which may be contributed by the incentive of the favorable policy of purchase tax on low-emission vehicles (≤1.6T) as it was greatly beyond the expectation at the beginning of year. In 2016, a total of 28.187 million vehicles were sold in domestic market, a year-on-year increase of 12.3% and a year-on-year speed increase of 8.1%, including 24.243 million passenger vehicles and 3.944 million commercial vehicles, representing 15.7% year-on-year increase and 5.1 % year-on-year decrease. Such result specified that, after two consecutive years of low-speed growth, the increased speed in domestic automotive market had recovered to double-digit scope again Though the drastic fluctuation in domestic automotive market had greatly challenged the production, organization and supply chain guarantee, depending on closely cooperation and unremitting efforts by different business segments, the Company totally sold 6.489 million vehicles in 2016, a year-on-year increase of 9.9% including 5.666 million passenger vehicles and 0.823 million commercial vehicles, representing 14.8% year-on-year increase and 14.9 % year-on-year decrease. In domestic automotive market, the Company still kept on leading, taking up 22.6% of domestic automotive market shares; in oversea automotive market, the Company totally exported and distributed 129,000 vehicles in 2016, a year-on-year increase of 50%, realizing a rise of exported vehicles in an overall swoon export background all over the country, which enabled the Company become the one exported the greatest number of vehicles in China at first. During the reporting period, the Company's total operating income is RMB 756.416 billion, with a year-on-year increase of 12.82%; the net profit attributable to the shareholders of the Company is RMB 32.009 billion, with a year-on-year increase of 7.43%. The Company has created a new record of operating performance. II. Operation conditions in the reporting period Facing the complicated and changeable market fluctuation, the Company, adhering to the general guideline of promoting development while ensuring stability, came into the next chapter of self-owned brand and achieved new breakthroughs in key innovation projects on the basis of a greater vehicle sales scale and a more excellent operating performance, representing a new scene that developing self-owned brand to keep pace with joint-venture brand, and updating innovation driving force. The growth rate for sales of self-owned brand vehicles is much higher than the average growth rate in this industry, where the self-owned brand passenger vehicles were sold over 320,000 in 2016 with a year-on-year increase of 89%; SUV Roewe RX5, the world's first internet automobile in mass production, was sold more than 90,000 within five months from its first launch in market; and SAIC Maxus, the self-owned brand light commercial vehicle, was sold more than 460,000 with a year-on-year increase of 32%. Meanwhile, driven by the sales of e550 and e950, the Company sold more than 25,000 new energy vehicles in 2016, a year-on-year increase of 85% in a strong growth trend. Among the affiliated major joint ventures, SAIC VOLKSWAGEN became the first passenger vehicle company realizing annual sales more than 2 million in China; SAIC GM ranked the second place in the sales market of passenger vehicles; and SGMW maintained the first place in the sales market of vehicles in China and successfully broke into Top four companies with the largest sales volume of passenger vehicles in the domestic market.

SAIC MOTOR ANNUAL REPORT 2016
- 11 -
In the international operation, the Company realized a higher sales volume in the overseas key regional markets with the sales of MG brand and Maxus light commercial vehicles increased by 20% and 53% respectively; meanwhile, the Company began to construct a new SAIC plant in Thailand, was constructing the vehicle and auto-parts park in Indonesian as scheduled, and had completed the negotiation for the acquisition of GM India factory with an agreement formally signed. At the same time of making great efforts on market expansion, the Company, adhering to focusing on innovation during the exploration and implementation of the supply-side structural reform, actively sought solutions for transformation and upgrading of the automotive industry. Inspired by the "electric, networking, intelligent, and shared" tendency, the Company accelerated the implementation of relevant strategic projects. In the respect of new energy vehicles, the Company achieved a series of breakthroughs, including the successful launches of e950, Maxus EG10 and other new products, the mass production capability of the first generation of electric-driving gearbox EDU, the key technology breakthrough of the second generation of EDU, and the mass production realization of independently developed battery management system. For vehicles used fuel cells, the Company had completed the National Innovation Demonstration Project of equipping 200B electric pile at Rongwei 750 and Rongwei 950, and started the development of 300B high-power and high-density electric pile. Regarding the network connection, the successful launch of the first generation Internet vehicle RX5 had established an application and development system for vehicle hardware and automotive Internet system, taking the solid first step toward the establishment of future Internet vehicles with self-owned brands and their ecosphere. In the field of intelligent forward-looking technology research, the Company, after active research of 5G communication technology, was developing the communication technology between vehicles, and vehicles and traffic infrastructures, and realized the integrated development of V2X function based on LTE-V on Rongwei RX5; it independently began to lay out algorithm software technology which supported the development of intelligent driving products and develop the controlling platform with independent iterative function for intelligent vehicles. For sharing businesses, the Company combined "e sharing car" with EVCARD time-sharing rental businesses; established the Global Chexiang as to accelerate its steps to the goal of “focusing on Shanghai, expanding in China and gradually walking into the world”. In the aftermarket, the Company continued to speed up the online construction of e-commerce Chexiang platform and the offline service expansion, resulting an increase of 3 million new members registered in Chexiang Platform, online sales of 30,000 vehicles and increment of 700 new service outlets of "Che Xiang Jia" in 2016. In the financial business, the Company, with the initial success of the internet vehicle financial brand "Good Car e loan", continuously innovated electronic and intelligent service forms, such as launching a fast loan products named "Rapid Loan" and providing the online " Artificial intelligence approval system for consumption credit "; it actively enlarged investments in PE / VC projects with a fast increment in management assets; it accelerated the construction of insurance sales management platform as to promote insurance innovation services; and it integrated financial resources and reinforced business coordination, aiming to provide users with professional, market-oriented, integrated financial services.

SAIC MOTOR ANNUAL REPORT 2016
- 12 -
The Company accelerated the market-oriented institutional changes as to support a deeper implementation of the innovation strategy. In the exploration to establish market-oriented operating system, "Che Xiang Jia" successfully attracted external investors to take round A financing; DIAS Automotive Electronic has finished the equity transfer and would be an open, innovative and entrepreneurial technology companies in an accelerated way in the future. In the innovation of deepening incentive mechanism, the Company, combining with the development tendency of innovative business, implemented the performance sharing program, and actively explored restraint mechanisms of incentives such as employee share ownership and equity incentive mechanism. As formal approved by CSRC for private share-offering project, the Company successfully implemented the share ownership plan of key employees. In 2017, a total of 2,207 employees had participated in such plan with an overall subscription amount of RMB 1.105 billion, waking a step forward to the long-term incentive mechanism of sharing benefits and bearing risks with employees, assuming common responsibility and creating joint achievements. In addition, in respect of the brand construction, Shanggang soccer team, wearing the uniform printing “SAIC”, participated AFC, Super League and FA Cup games all over the year; in addition, the Company effectively combined the automotive industry and cultural career to build a new landmark of Shanghai culture by naming "SAIC • Shanghai Cultural Square".
(I) Analysis on principal businesses
Analysis on accounts changes in profit statement and cash flow statement Unit: RMB
Items 2016 2015 Changes (%) Operating income 746,236,741,228.56 661,373,929,792.65 12.83 Operating costs 650,218,105,936.37 585,832,883,216.26 10.99 Selling expenses 47,503,416,645.57 35,537,515,509.27 33.67 Administrative expenses 28,258,363,189.63 23,329,485,273.44 21.13 Financial expenses -332,319,541.95 -231,192,097.17 -43.74 Net cash flow from operating
activities 11,376,933,816.05 25,992,574,916.30 -56.23
Net cash flow from investing activities 26,436,503,697.64 -13,736,860,282.34 292.45
Net cash flow from financing activities -6,141,748,281.24 -22,356,869,623.95 72.53
Research and development expenditures 9,408,710,888.38 8,371,404,317.02 12.39
As required by the Circular of the Ministry of Finance on Issuing and Provisions concerning VAT
Accounting Treatment (Cai Kuai [2016] No.22) enacted by the Ministry of Finance on December 3, 2012,
and the Accounting Standard for Business Enterprise No.30-Presenation of Financial Statement, amounts of
administrative expenses and taxes and levies in 2015 have been reclassified according to the presentation of
the financial statements in the current year.

SAIC MOTOR ANNUAL REPORT 2016
- 13 -
1. Income and cost analysis (1) Analysis on principal businesses by industry, product and geographical region
Unit: RMB By industry
By industry Operating income Operating costs
Gross margin
ratio (%)
Change of operating
Income (%)
Change of operating Costs (%)
Change of gross margin ratio (%)
Automotive manufacturing 746,236,741,228.56 650,218,105,936.37 12.87 12.83 10.99 Increased by 1.45
percentage points
Financial services 10,179,423,836.73 2,185,917,356.04 78.53 12.18 -8.63 Increased by 4.90
percentage points Total 756,416,165,065.29 652,404,023,292.41 13.75 12.82 10.91 Increased by 1.49
percentage points By product
By product Operating income Operating costs
Gross margin
ratio (%)
Change of operating
Income (%)
Change of operating Costs (%)
Change of gross margin ratio (%)
Vehicles 564,301,490,751.90 502,515,928,898.24 10.95 11.58 9.50 Increased by 1.69 percentage points
Parts 144,288,509,910.21 114,859,534,193.23 20.40 14.76 13.52 Increased by 0.87 percentage points
Trading 9,708,826,846.79 9,272,742,731.13 4.49 -1.93 -2.29 Increased by 0.35 percentage points
Service and others 27,937,913,719.66 23,569,900,113.77 15.63 39.78 45.17 Decreased by 3.14
percentage points
Finance 10,179,423,836.73 2,185,917,356.04 78.53 12.18 -8.63 Increased by 4.90 percentage points
Total 756,416,165,065.29 652,404,023,292.41 13.75 12.82 10.91 Increased by 1.49 percentage points
By region By
geographical region
Operating income Operating costs
Gross margin
ratio(%)
Change of operating
income(%)
Change of operating costs(%)
Change of gross margin ratio(%)
China 726,026,800,331.32 625,335,189,557.38 13.87 10.66 8.70 Increased by 1.55 percentage points
Others 30,389,364,733.97 27,068,833,735.03 10.93 111.75 109.06 Increased by 1.15 percentage points
Total 756,416,165,065.29 652,404,023,292.41 13.75 12.82 10.91 Increased by1.49 percentage points
Explanations for main businesses by industry, product or region: √Applicable □N/A The year 2016 witnessed a great surge in operating income and cost of overseas business, which mainly attributable to the incorporation of Yanfeng Automotive Interior Trim System Co., Ltd newly established by HASCO, the controlling subsidiary of the Company and Johnson Control Inc. whom carried out restructuring of global auto interior Trim during July 2015.

SAIC MOTOR ANNUAL REPORT 2016
- 14 -
(2) Analysis on production and sales
√Applicable □N/A
Enterprises Production (Volume) Sales (Volume)
Inventories (Volume)
December 1, 2016
Change of Production (Volume)
(%)
Change of Sales
(Volume) (%)
Change in inventories
(%)
SAIC VOLKSWAGEN 1,968,571 2,001,777 53,126 9.15 10.47 -40.58 SAIC GM 1,876,256 1,887,071 47,107 8.52 7.71 -8.33 SAIC Passenger Vehicle 320,461 321,717 13,202 86.70 89.23 -9.28
SGMW 2,144,368 2,130,177 150,490 6.94 4.42 10.32 SAIC Maxus 47,198 46,123 3,600 32.94 31.58 42.57 Shanghai Sunwin 2,007 2,007 4 -4.61 -4.56 0.00 IVECO Hongyan, SAIC-IVECO Hongyan
16,017 15,517 2,745 63.76 78.19 22.11
Nanjing Iveco 73,515 75,772 2,519 -7.38 -1.59 -47.26 SAIC Motor-CP 8,406 8,706 1,194 63.89 77.38 -13.04 Total 6,456,799 6,488,867 273,987 10.54 9.95 -9.48
(3) Cost analysis Unit: RMB
Divided by Industry
By industry Items 2016 Proportion
to total costs (%)
2015 Proportion
to total costs (%)
Changes (%)
Automotive manufacturing
raw material, labor salaries and wages, depreciation, energy, etc.
650,218,105,936.37 99.66 585,832,883,216.26 99.59 10.99
Financial services
labor salaries and wages, depreciation, energy, etc. 2,185,917,356.04 0.34 2,392,505,093.48 0.41 -8.63
Total 652,404,023,292.41 100.00 588,225,388,309.74 100.00 10.91 Divided by Product
By product Items 2016 Proportion
to total costs (%)
2015 Proportion
to total costs (%)
Changes (%)
Vehicles raw material, labor salaries and wages, depreciation, energy, etc.
502,515,928,898.24 77.02 458,925,975,996.17 78.02 9.50
Parts raw material, labor salaries and wages, depreciation, energy, etc.
114,859,534,193.23 17.61 101,181,521,349.86 17.20 13.52
Trading raw material, labor salaries and wages, depreciation, energy, etc.
9,272,742,731.13 1.42 9,489,601,764.09 1.61 -2.29
Service and others
raw material, labor salaries and wages, depreciation, energy, etc.,
23,569,900,113.77 3.61 16,235,784,106.14 2.76 45.17
Finance labor salaries and wages, depreciation, energy, etc. 2,185,917,356.04 0.34 2,392,505,093.48 0.41 -8.63
Total 652,404,023,292.41 100.00 588,225,388,309.74 100.00 10.91
Explanations for other information of cost analysis:
□Applicable √N/A

SAIC MOTOR ANNUAL REPORT 2016
- 15 -
(4) Key customers for sales and suppliers
√Applicable □N/A
The turnover from top five customers amounted to RMB 7,757.61556 million, accounting for 10.40% of the
total annual turnover, of which the amount from related parties(based on the definition of the Stock Listing
Rules of the Shanghai Stock Exchange) is RMB 0, accounting for 0% of the total annual turnover.
The procurement from top five suppliers’ amounted to RMB 40,669.69975 million, accounting for 62.54 %
of the total annual procurement amount, of which the amount from related parties (based on the definition
of the Stock Listing Rules of the Shanghai Stock Exchange) is RMB 0, accounting for 0% of the total
annual procurement amount.
2. Expenses
√Applicable □N/A Unit: RMB
Items 2016 2015 Changes% Selling expenses 47,503,416,645.57 35,537,515,509.27 33.67 Administrative expenses 28,258,363,189.63 23,329,485,273.44 21.13 Financial expenses -332,319,541.95 -231,192,097.17 -43.74 Income tax expenses 6,530,495,764.20 5,735,707,263.02 13.86 Note: 1) Compared with last year, selling expenses increased by RMB 11.966 billion, or 33.67% on a
year-on-year basis, mainly due to the growing of promotional allowances, transportation expenses and warranty expenditures.
2) Compared with last year, financial expenses decreased by RMB 101 million, or 43.46% on a
year-on-year basis, mainly due to the increase of the Company’s exchange earnings. 3. Research and development ("R&D") expenditures √Applicable □N/A
Unit: RMB R&D investments expensed in the current period 9,408,710,888.38 R&D investments capitalized in the current period 0.00 Total R&D investments 9,408,710,888.38 Proportion of R&D investments to operating income (%) 1.26 Headcounts of R &D personnel 22,563 Proportion of R&D headcount to total employee headcount (%) 13.16
Proportion of capitalization of R&D expenditures (%) 0.00 Explanations □Applicable √N/A

SAIC MOTOR ANNUAL REPORT 2016
- 16 -
4. Cash flow
Unit: RMB Items 2016 2015 Changes
Net cash flow from operating activities 11,376,933,816.05 25,992,574,916.30 -14,615,641,100.25 Net cash flow from investing activities 26,436,503,697.64 -13,736,860,282.34 40,173,363,979.98 Net cash flow from financing activities -6,141,748,281.24 -22,356,869,623.95 16,215,121,342.71 Note: 1) Compared with last year, net cash flow from operating activities decreased by RMB1.4616
billion, or 56.23%, mainly due to incremental scale of individual automotive consumption loans issued by SFC, a subsidiary of the Company,
2) Compared with last year, net cash flow from investing activities increased by RMB40.173 billion, or 292.45%, mainly due to the redemption of fund products by SFC, a subsidiary of the Company in 2016.
3) Compared with last year, net cash flow from financing activities increased by RMB16.215 billion, or 72.53%, mainly due to the increased cash derived from bonds issued by SFC, a subsidiary of the Company, in the current period.
(II) Significant changes on profit arising from non-principal business □Applicable √N/A (III) Analysis of assets and liabilities
√Applicable □N/A
1. Assets and liabilities Unit: RMB
Items Amount December 31,2016
Proportion to total
assets (%) December
31,2016
Amount December 31,2015
Proportion to total
assets (%) December
31,2015
Changes (%)
Cash and bank balances 105,932,535,526.29 17.94 72,672,666,192.62 14.17 45.77
Prepayments 20,529,658,025.70 3.48 13,388,651,691.99 2.61 53.34 Other receivables 6,960,725,526.23 1.18 5,080,900,116.77 0.99 37.00 Non-current assets due within one year 52,837,948,607.91 8.95 29,213,526,240.21 5.70 80.87
Loans and advances 46,220,053,713.07 7.83 34,676,090,843.68 6.76 33.29 Long-term receivables 1,957,243,976.67 0.33 801,879,818.41 0.16 144.08 Short-term borrowings 8,728,150,584.10 1.48 4,908,346,545.97 0.96 77.82 Notes payable 11,740,912,162.92 1.99 7,282,802,230.82 1.42 61.21 Taxes payable 13,913,799,886.15 2.36 8,692,447,359.26 1.69 60.07 Non-current liabilities due within one year 8,673,620,748.14 1.47 4,974,248,176.38 0.97 74.37
Note: 1) The balance of cash and bank balances increased by RMB33.260 billion compared with the
opening balance, mainly due to the capital arrangement by SFC, a subsidiaries of the Company, as to ensure the Company’s liquidity safety at the year-end.
2) The balance of prepayments increased by RMB7.141 billion compared with opening balance, mainly due to incremental prepayments by the Company to vehicle joint ventures.
3) The balance of other receivables increased by RMB1.88 billion compared with opening balance, mainly due to the increase in new-energy subsidies receivables of the Company in the current period.
4) The balance of non-current assets due within one year increased by RMB 23.624 billion compared with opening balance, mainly because of incremental scale of individual automotive consumption

SAIC MOTOR ANNUAL REPORT 2016
- 17 -
loans due within one year from SFC, a subsidiary of the Company. 5) The balance of loans and advances increased by RMB11.544 billion compared with opening
balance, mainly due to the incremental scale of medium-term and long-term individual automotive consumption loans from SFC, a subsidiary of the Company.
6) The balance of long-term receivables increased by RMB1.155 billion compared with opening balance, mainly due to the increase in finance lease receivables arising from the business scale expansion of ANJI Leasing Co., Ltd.
7) The balance of short-term borrowings increased by RMB3.82 billion compared with opening balance, mainly due to new borrowings to the Company for the requirement of business development
8) The balance of notes payable increased by RMB4.458 billion compared with opening balance, mainly due to increased notes payable based on the Company’s business expansion.
9) The taxes payables increased by RMB5.221 billion compared with opening balance, mainly due to increase in VAT and enterprise income tax payable by the Company in the current period. As required by the Circular of the Ministry of Finance on Issuing and Provisions concerning VAT Accounting Treatment (Cai Kuai [2016] No.22) enacted by the Ministry of Finance on December 3, 2016, and the Accounting Standard for Business Enterprise No.30-Presenation of Financial Statement, The comparative balance of tax payables has been reclassified according to the presentation of the financial statements in the current year.
10) The balance of non-current liabilities due within one year increased by RMB3.699 billion compared with opening balance, mainly for the reason that SFC, a subsidiary of the Company, increased asset-backed securitization production and financial bonds due within one year.
2. Restriction of significant assets as of 31 December 2016
□Applicable √N/A
3. Others □Applicable √N/A
(IV) Analysis on operational data in automotive industry
√Applicable □N/A
Analysis of operation data for automotive manufacturer
1. Production capacity
√Applicable □N/A
Existing production capacity
√Applicable □N/A
Major manufacturers Designed production capacity
Production capacity in the period
Utilization rate(%)
SAIC VOLKSWAGEN 1,548,000 1,969,000 127 SAIC GM 1,668,000 1,876,000 112 SAIC Passenger Vehicle 280,000 320,000 114 SGMW 1,760,000 2,144,000 122 SAIC Maxus 52,000 47,000 91 Shanghai Sunwin 2,000 2,000 100 SAIC-IVECO Hongyan 28,000 16,000 57 Nanjing Iveco 140,000 74,000 53 SAIC Motor-CP 24,000 8,000 35

SAIC MOTOR ANNUAL REPORT 2016
- 18 -
Capacity under construction √Applicable □N/A
Unit: 0'000RMB Workshop under
construction Planning
investment
Amount invested in the
period
Accumulated investment
Estimated completion
date
Estimated capacity
Expansion of Pukou base of SAIC Passenger Vehicle 145,160 128,580 145,160 2017 120,000
Expansion of Ningbo Branch of SAIC VOLKSWAGEN
637,314 89,961 399,992 2018 240,000
Expansion of Wuhan North plant of SAIC GM 354,000 173,658 241,658 2017 240,000
Expansion of Wuxi manufacture base of SAIC Maxus
217,679 38,770 184,906 2017 124,000
SAIC-Motor-CP Thailand New Plant 145,600 2,857 33,257 2018 40,000
SGMW Indonesia Plant 255,260 104,300 144,200 2017 60,000 Capacity calculation criteria √Applicable □N/A The calculation of designed production capacity is on the basis of 250 working days per year, and 16 working hours per day, namely 4000 working hours for one year. ; "production capacity in the period" refers to actual output for the reporting period; utilization rate is actual output for the reporting period divided by designed production capacity.
2. Sales and production of vehicles
√Applicable □N/A By vehicle type √Applicable □N/A
Sales (Volume) Production (Volume) Categories 2016 2015 Changes (%) 2016 2015 Changes (%)
Car 3,302,670 2,978,974 10.87 3,270,923 2,982,320 9.68 SUV 1,179,354 825,837 42.81 1,174,869 791,073 48.52 MPV 1,184,416 1,132,119 4.62 1,187,526 1,116,868 6.33 Cross passenger car 450,008 615,798 -26.92 441,271 602,416 -26.75 Passenger car 66,206 61,773 7.18 66,653 62,836 6.07 Truck 306,213 287,387 6.55 315,557 285,772 10.42
Total 6,488,867 5,901,888 9.95 6,456,799 5,841,285 10.54 By region √Applicable □N/A
Sales in domestic market Sales in overseas market Categories 2016 2015 Changes (%) 2016 2015 Changes (%)
Car 3,249,702 2,920,879 11.26 52,968 58,095 -8.83 SUV 1,129,591 824,256 37.04 49,763 1,581 3,047.56 MPV 1,177,794 1,130,737 4.16 6,622 1,382 379.16 Cross passenger car 438,204 599,616 -26.92 11,804 16,182 -27.05
Passenger car 61,119 57,054 7.12 5,087 4,719 7.80 Truck 303,226 284,191 6.70 2,987 3,196 -6.54 Total 6,359,636 5,816,733 9.33 129,231 85,155 51.76

SAIC MOTOR ANNUAL REPORT 2016
- 19 -
3. Sales and production of auto parts □Applicable √N/A The Company’s businesses of auto parts are mainly operated by HASCO (security code: 600741), a subsidiary controlled by the Company. Details of its business in 2016 refer to the annual report 2016 published on www.sse.com.cn by HASCO (600741). 4. New energy vehicles √Applicable □N/A Production capacity of new energy vehicle √Applicable □N/A
Major workshops Designed production capacity
Production capacity in the period
Utilization rate (%)
SAIC Passenger Vehicle - 21,515 NA SAIC Maxus - 3,526 NA Shanghai Sunwin - 1,089 NA Sales and production of new energy vehicles √Applicable □N/A
Sales (Volume) Production (Volume)
Categories 2016 2015 Changes (%) 2016 2015 Changes
(%) EV-Roewe E50 1,495 412 262.86 1,390 309 349.84 PHEV-Roewe 550 15,145 10,711 41.40 16,202 12,001 35.01 PHEV-Roewe RX5 - - - 26 - - PHEV-Roewe 950 3,377 - - 3,897 - - Sunwin EV-Passenger Vehicle 1,059 641 65.21 1,059 641 65.21 Sunwin PHEV-Passenger Vehicle 30 162 -81.48 30 162 -81.48 EVMPV-MaxusG10 60 - - 69 - - EV Passenger Vehicle-MaxusV80 3,559 1,014 250.99 3,457 1,250 176.56
Total 24,725 12,940 91.07 26,130 14,363 81.93 Note: The statistics are made according to the scope of consolidated financial statements. Income and subsidies of new energy vehicles √Applicable □N/A
Unit: 0'000 RMB Categories Revenues Subsidy for new energy
vehicles Proportion of subsidy to
revenue (%) EV- Roewe E50 24,678 10,503 43 PHEV- Roewe 550 299,745 73,587 25 PHEV- Roewe 950 78,417 15,664 20 EV Passenger Vehicle-Maxus V80 117,320 67,968 58 EVMPV-Maxus G10 1,737 384 22 Sunwin New Energy Passenger Vehicle 127,373 55,175 43 5. others
□Applicable √N/A

SAIC MOTOR ANNUAL REPORT 2016
- 20 -
(V) Investment Analysis
1. General analysis on equity investment The Company is mainly engaged in R&D, sales, manufacture of vehicles (including passenger vehicles and commercial vehicles) and auto parts (including engine, transmission, electric power and electronics, key components of new energy, chassis system. and interior and exterior trim, etc.),as well as automobile service trading and financial investment in varieties. In perspective of long-term equity investment only, at the end of the reporting period, the long-term equity investment was amounted to RMB 62.677 billion, increased by RMB3.658 billion or 6.20% comparing with opening balance. Details of various investments are set out in Notes to the annual report.
(1) Significant equity investment □Applicable √N/A
(2) Significant non-equity investment □Applicable √N/A (3) Financial assets at fair value √Applicable □N/A
Unit: RMB Items 2015 2016 Changes Effects on current
profit Financial assets at fair value through profit or loss 1,221,103,619.65 1,559,753,224.57 338,649,604.92 -17,509,759.92
Available-for-sale financial assets 65,495,009,648.25 50,484,749,497.34 -15,010,260,150.91 0.00
Financial liabilities at fair value through profit or loss 7,486,291.00 0.00 -7,486,291.00 7,486,291.00
Total 66,723,599,558.90 52,044,502,721.91 -14,679,096,836.99 -10,023,468.92
(VI) Significant disposal of assets and equity □Applicable √N/A
(VII) Analysis of major invested companies with controlling shareholding and minority
shareholding
√Applicable □N/A Unit: RMB 0'000
Company name Business nature
Main products or
services
Registered capital Total assets
Net assets attributable to owners of the company
Total revenue
Net profit attributable to owners of the company
SAIC VOLKSWAGEN Manufacturing
Manufacturing and sales of
vehicles 1,150,000 11,802,138 4,207,013 22,855,059 2,568,200
SAIC GM Manufacturing
Manufacturing and sales of
vehicles
USD 108,300 10,470,615 3,173,021 20,295,878 1,694,769
SGMW Manufacturing Manufacturing
and sales of vehicles
166,808 5,399,313 1,021,340 10,405,599 519,818
HASCO Manufacturing Manufacturing
and sales of auto-parts
315,272 10,761,171 3,809,677 12,429,581 607,576
SFC Finance Financial service 1,038,000 20,377,879 1,845,172 1,130,340 334,838

SAIC MOTOR ANNUAL REPORT 2016
- 21 -
(VIII) Structured entities controlled by the Company
□Applicable √N/A
III. Discussion and analysis on future development of the Company
(I) Industry competitive landscape and development trend
Against the background of complicated and changeable global economy, gradually steady micro- economy on a dip in China, and increasingly enhanced supply-side structural reform, great challenges and important opportunities both available to Chinese automotive industry both during the profound transformation process it is now experiencing. On the one hand, though the domestic market has entered into a new stage of steady growth subsequent to more than a decade of fast development, it is more urgent for innovation, transformation, updating and development of automotive industry due to increasingly obvious structure differentiation of regional markets and product market segmentations at various levels and accelerated change of traditional appearance caused by high-tech outbreaks and cross-border entry. On the other hand, as the new four tendencies, namely, "electric, networking, intelligent, and shared” have been emerged in the automotive industry, and innovation of product technology and business model have brought new opportunities for industrial development, it is a significant time for the self-owned brands to take innovations and developments; meanwhile, considering the structural opportunities in overseas markets according to “The Belt and Road” strategy of the state, new growth points are emerging in the automotive industry. It is estimated that the domestic sales of vehicles in 2017 will reach 29.30 million units, increase by 3.7%, including approximately 25.50 million units of passenger vehicles with a year-on-year increase of 5%, and 3.80 million units of commercial vehicles with a year-on-year decrease of 3.8%.
(II) The Company's development strategy
The Company will keep pace with the development trend of technology improvement, market evolution, and industry transformation. Focused on the "electric, networking, intelligent, and shared” tendency in automotive industry, the Company, by deploying innovation chain based on value chain, will spare no efforts to occupy the favorable position and explore transformation and upgrading solution of automotive industry against the background of big data and the reconstruction of industrial chain and value chain in accordance with the idea of “accelerating extension to both ends, and speeding up transformation”. Meanwhile, the Company has established market-oriented operating systems and mechanisms to fully mobilize and stimulate internal vitality on the basis of making great efforts to break system and mechanism obstacles that have constrained innovation developments, which injects new vitality to the future development of SAIC. (III) Business plan In 2017, insisting on the overall guideline of promoting development while ensuring stability, with efforts concentrated on innovation during the practice of supply-side structural reform by SAIC, the Company will make great efforts to improve the quality and efficiency of economic operation based on current situations by maintaining a sense of crisis and preventing various market risks; carrying forward the spirit of innovation while looking ahead to the future, the Company will sustainably further implement SAIC’s strategy of innovation, transformation, updating and development as to consecutively strengthen the core competitiveness, trying to seize the "electric, networking, intelligent, and shared” tendency and firmly push the development of “13th Five-year Plan”. The Company will spare no efforts to achieve the target sales of 6.735 million units, with estimated operating income of RMB773 billion and estimated operating cost of RMB 664.8 billion.

SAIC MOTOR ANNUAL REPORT 2016
- 22 -
The main operation tasks of the Company in 2017 consist: 1. On the basis of timely reaction of market changes, the Company will seize the opportunities of new product debut and continue to optimize the structure of sales and production, as to ensure economic operation improves steadily and self-owned brand develops quickly, making good use of advantages of new energy and internet products to increase sales volume, optimize structure, improve capability and promote brank image; 2. Striving to grasp the new "four" tendency opportunities with increasing force on both ends, the Company will develop new products through technical breakthroughs, and drive business transformation based on model innovation;3. The Company, at the same of focusing on the improvement of international operation system and resource cooperation, will lower its cost and lift its efficiency by doing well on domestic work, and enhance its capacity for oversea businesses; 4. Emphasizing on safety and environmental protection awareness, the Company will further implement quality improvement activity and strengthen the construction of qualified personnel to improve internal control management; 5. Paying attentions to company value and brand construction, the Company, will improve the communication system for investors and the public, and reinforce market value management in a further step through guarantee of “basic work”, implementation of “innovation work” and good promotion of “communication work” by taking as an opportunity the formal implementation of stock ownership plan for key employees. (IV) Potential risks The Company may be exposed to the following risks: 1. The macroeconomic environment is still facing greater uncertain risks. In particular, the aggravating trade protectionism will bring adverse impacts on the global trade environment while exchange rate risks and other financial risks cannot be ignored; 2. Due to growing fierce competition arising from differentiated market growth, it is more difficult for automotive enterprises to provide effective products and services day after day as technic and model innovation may face more uncertain risks; 3. Despite the extension of the favorable policy for levying purchase tax at a rate of 7.5% on low-emission vehicles, it is unavoidable that the incentive effects on automotive consumption will diminish after the peaking of sales volume, hence the market growth is facing greater challenges. IV. Reasons for noncompliance with disclosure requirements where the requirements are not
applicable to the Company or due to other special situation □Applicable √N/A

SAIC MOTOR ANNUAL REPORT 2016
- 23 -
Section V Important Events
I. Ordinary shares distribution or preliminary proposal for capitalization of capital reserve
(I) Policies of cash dividend distribution of the Company and the implementation or adjustment
Pursuant to item 157 of the Articles of Association, profit distribution policy of the Company is: (1) Profit distribution of the Company shall reflect a reasonable investment return for the investors and take into account of sustainable development of the Company. Profit distribution policy shall be consistent and stable. (2) The Company can distribute dividends in cash or by stocks, and cash dividend should be considered first. The Company can make mid-year cash dividend distribution. (3) The Company shall make cash dividends distribution when its net profits and accumulated retained profits in the audited financial statements of the Company during the current year are presented in positive figures, and the cash flow of the Company can satisfy the Company’s ordinary operation and sustainable development. Total amount for cash dividends distribution by the Company in the current year shall be equal to or exceed 30% of net profits attributable to shareholders of the Company in the audited consolidated financial statements in the current year. Cash paid for the repurchase of shares shall be deemed as cash dividends. (4) If the Company does not propose cash dividends distribution plan though it makes profits and accumulated retained profits are presented in positive figures during the current year, independent directors shall issue a clear opinion, meanwhile the Company shall explain in details the reasons for not making profit distribution in the annual report, and the usage of the funds which would otherwise have been used for cash dividend distribution. (5) If circumstance exists that shareholders occupy the funds of the Company which is in violation of the regulations, the occupied amount should be deducted from the shareholder's cash dividend in order to repay the cash the shareholders occupy. (6) When significant changes incur in the Company’s operating environment or the Board think it is necessary, the Company will changes the profit distribution policies. During the adjustment of profit distribution policies proposed by the Company, opinions of minority shareholders should be considered, while reasons of the adjustment should be specified by the Board on the basis of an issue of independent opinions from independent directors. Resolution in respect of the adjustment of profit distribution shall be passed by 2/3 of voting rights held by shareholders who present the general meeting. During the reporting period, the Company completed the profit distribution of year 2015. The profit distribution scheme complies with the requirements of Article of Association of the Company and the approval process, which has fully protected the interests of investors. (II) Plan or preliminary proposal for ordinary share distribution and capitalization of capital
reserve of the Company in recent three years
In 2016, based on total 11,683,461,365 shares at present, the Company plans to distribute RMB 16.50 (inclusive of tax) per 10 shares, amounting to RMB 19,277,711,252.25. The Company has no plan of converting capital reserve into capital this year. The accumulative cash dividends during the last three years (including year 2016) of the Company were RMB 48,605,718,485.39. (The distribution plan for 2016 dividends is still to be approved by 2016 general shareholder meetings.)
Unit: RMB
Year
Stock dividend
per 10 shares (shares)
Cash dividend per 10 shares
(RMB) (inclusive of tax)
Capital reserve transferred
into share capital
per 10 shares (share)
Amount of cash dividend
(inclusive of tax)
Net profit attributable to shareholders of the
Company in consolidated financial statements for the year
of dividend distribution
Proportion of net profit
attributable to the
Company in consolidated
financial statements
(%) 2016 - 16.50 - 19,277,711,252.25 32,008,610,688.65 60.23
2015 - 13.60 - 14,994,770,615.44 29,793,790,723.65 50.33
2014 - 13.00 - 14,333,236,617.70 27,973,441,274.41 51.24

SAIC MOTOR ANNUAL REPORT 2016
- 24 -
(III) Particulars of repurchase of shares in cash offer recognized in cash dividends □Applicable √N/A (IV) Where the preliminary proposal for cash profits distribution of ordinary shares is
not proposed although the Company earns profits and the distributed profits attributable for ordinary shareholders is set out in positive figures, the Company shall disclose relevant reasons in details, and the usage and plan for retained profits.
□Applicable √N/A II. Performance on commitment matters
(I) Commitments in or sustain to the reporting period in actual controllers, shareholders, related
parties, purchaser, companies or others relating to commitments
□Applicable √N/A (II) For assets or projects which the Company estimates their profits and still within the estimate period
as of the reporting period, the Company shall state whether the estimated profits are achieved and explain relevant reasons.
□Achieved □Not achieved √N/A III. Funds occupation and settlement during the reporting period □Applicable √N/A
IV. Explanations on “Non-standard Auditor’s Report” issued by certified public accountants by
the Board □Applicable √N/A V. Analysis and explanation of the Company for reasons and effects of accounting policy and
estimation change and significant accounting mistakes correction (I) Analysis and explanation of the Company for reasons and effects of accounting policy and
estimation change □Applicable √ N/A (II) Analysis and explanation of the Company for reasons and effect of significant accounting
mistakes correction □Applicable √ N/A (III) Communication with the previous accounting firms □Applicable √ N/A (IV) Others □Applicable √ N/A VI. Appointment and dismissal of auditor
Unit: RMB 0'000 Current status Domestic auditor Deloitte Touche Tohmatsu Certified
Public Accountants LLP Remuneration paid to auditor 860 Service period of auditor 11 years

SAIC MOTOR ANNUAL REPORT 2016
- 25 -
Name Remuneration Auditor for internal control audit Deloitte Touche Tohmatsu Certified Public
Accountants LLP 200
Sponsor Guotai Junan Securities Co., Ltd. 1,900 Explanations on the appointment and dismissal of auditor □Applicable √N/A Explanations on changing the auditor. □Applicable √N/A VII. Risk exposure to the s uspension of listing (I) Reasons to explain the suspension of listing □Applicable √N/A (II) Measures adopted by the Company to resume listing □Applicable √N/A VIII. Events that the listing of shares shall be terminated and relevant explanation □Applicable √ N/A IX. Bankruptcy and reorganization □Applicable √N/A X. Significant lawsuit and arbitration □ Significant lawsuits and arbitrations for the year √ No significant lawsuits and arbitrations for the year XI. Penalty and rectification of the Company and its directors, supervisors, senior management,
controlling shareholders, actual controllers and purchasers □Applicable √N/A XII. Credit situation of the Company and its controlling shareholders and actual controllers
during the reporting period. √Applicable □N/A During the reporting period, the Company and its controlling shareholders, and actual controllers have solid credit ratings. XIII. The Company’s share option incentive scheme, employee stock ownership plan or other
employee incentive scheme and relevant impacts. (I) Related incentive schemes that have been disclosed in the temporary announcement but have
no progress or change subsequently □Applicable √N/A (II) Incentive schemes not disclosed in the temporary announcement or having subsequent
progresses. Share option incentive scheme □Applicable √N/A Others □Applicable √N/A

SAIC MOTOR ANNUAL REPORT 2016
- 26 -
Employee stock ownership plan For the purpose to accelerate the development strategy driven by innovation, and speed up transformation and upgrading to create a world-famous automotive company full of innovation, Shanghai Motor Corporation Limited raised RMB 15 billion funds through private offering of shares in domestic A share market for investments in new energy vehicles, internet vehicles, intelligence, automotive services and automotive finance and other projects. Meanwhile, as to further motivate employees’ enthusiasm, initiative, creation to form an interest community between employees and enterprises, the Company has implemented a key employee stock ownership plan at the same time to offer shares privately, for which participants including group leaders (including directors, supervisors and senior management other than external directors and external supervisors), factory-level cadres, and key employees. As the Company issued 657,894,736 shares privately this time, total shares of the Company after this issue has increased to 11,683,461,365 shares. In accordance with the actual subscription, a total of 2,207 employees (including directors, supervisors, senior management totaled in 14 people) eventually participated in the Company's key employee stock ownership plan pursuant to which 48,449,561 private-offering shares issued this time are subscribed at a consideration of RMB 1,104,650,000 through special pension management products administrated by Changjiang Pension Insurance Co., Ltd., accounting for 0.41% of the Company’s total shares offered this time. (Refer to Announcement published by the Company in www.sse.com.cn on January 21, 2017 for details) After joint efforts of the management and employees, the Company has successfully implemented the key employee stock ownership plan, which not only fully demonstrates the Company’s determination and confidence in innovation driving, transformation and upgrading, but also creates a long-term incentive mechanism of sharing interests, risks, responsibilities and careers between employees and the Company, hence it will be benefit to promote employee’s cohesion and the Company’s competitiveness, and improve corporate governance as to consolidate the Company’s sustainable development. Other incentive measures In 2012, the Company formulated and implemented the Corporate Incentive Fund Plan. Considering the Company’s operating results in prior year satisfy the implementation conditions of the incentive fund plan, the Board of Directors reviewed and approved the 2015 Implementation Scheme for Corporate Incentive Fund Plan whose actual incentive objects included key personnel such as medium-and-senior management and key backbones of the Company. Leaders of the Company have not participated in the 2015 incentive fund allocation as they should be subject to the remuneration regulations by Shanghai SASAC. XV Significant related party transactions of the Company during the reporting period (I) Significant related party transactions related to daily operations 1. Events that have been disclosed in the temporary announcement but have no progress or change
subsequently □Applicable √N/A
2. Events that have been disclosed in the temporary announcement and have progresses or changes
subsequently □Applicable √N/A
3. Events that not been disclosed in the temporary announcement
□Applicable √N/A

SAIC MOTOR ANNUAL REPORT 2016
- 27 -
(II) Significant related party transactions related to assets or equity acquisition and disposal 1. Events that have been disclosed in the temporary announcement but have no progress or change
subsequently □Applicable √N/A
2. Events that have been disclosed in the temporary announcement and have progresses or changes
subsequently □Applicable √N/A
3. Events that not been disclosed in the temporary announcement
□Applicable √N/A
4. Performance achievement events involving performance convention in reporting period which should be disclosed □Applicable √N/A
(III) Significant related party transactions related to external joint investment 1. Events that have been disclosed in the temporary announcement but have no progress or change
subsequently □Applicable √N/A
2. Events that have been disclosed in the temporary announcement and have progresses or changes
subsequently □Applicable √N/A
3. Events that not been disclosed in the temporary announcement
□Applicable √N/A (IV) Balances due from/to related parties 1. Events that have been disclosed in the temporary announcement but have no progress or change
subsequently □Applicable √N/A
2. Events that have been disclosed in the temporary announcement and have progresses or changes
subsequently □Applicable √N/A
3. Events that not been disclosed in the temporary announcement □Applicable √N/A
(V) Others □Applicable √N/A XIII Significant contracts and implementation
(I) Trusteeship, contracting and leasing 1. Trusteeship
□Applicable √N/A
2. Contracting □Applicable √N/A
3. Leasing □Applicable √N/A

SAIC MOTOR ANNUAL REPORT 2016
- 28 -
(II) Guarantee
√Applicable □N/A Unit: RMB 0'000
General information of guarantee (except guarantee provided for subsidiaries)
Guarantor Relationship Guarantee Amount of guarantee
Signed date of
guarantee
Starting date of
guarantee
Ending date of
guarantee
Type of guarantee
Completion of guarantee
Overdue of guarantee
Overdue amount of guarantee
Counter guarantee
Related party
guarantee
Relationship
SAIC Hong Kong Limited
Wholly-owned subsidiary
IEE SA Lux 8,768.16 March 29
2016 March 29
2016 November 8
2016
Joint liability
guarantee Yes No - No No
HUAYU Automotive Systems Co.,
Ltd.
Controlled subsidiary
HUAYU KS Alu
Tech GmbH 7,306.80 July 1
2016 July 1 2016
June 30 2017
Joint liability
guarantee No No - No No
Total amount of guarantee incurred during the reporting period (except guarantee
provided for subsidiaries) 16,074.96
Total balance of guarantee at the end of the reporting period(A) (except guarantee
provided for subsidiaries) 8,606.73
Guarantee provided for subsidiaries from the Company and its subsidiaries.
Total amount of guarantees provided for subsidiaries during the reporting period 182,395.90
Total balance of guarantees provided for subsidiaries at the end of the reporting
period(B) 242,091.52
Total amount of guarantees provided (including guarantee provided for subsidiaries)
Total amount of guarantees provided (A and B) 250,698.25
Ratio of total amount of guarantee against net assets - %) 1.31
Including:
Amount of guarantee provided for shareholders, actual controller and its related
parties (C)
-
Direct or indirect debt guarantees provided for guaranteed parties whose
asset-liability ratio exceeds 70% (D)
204,077.01
Amount of total amount exceeding 50% of net assets (E) -
Total amount of guarantee above (C, D and E) 204,077.01
Statement for joint liability of undue guarantee None
Information of guarantee None
SAIC MOTOR ANNUAL REPORT 2016
- 29 -
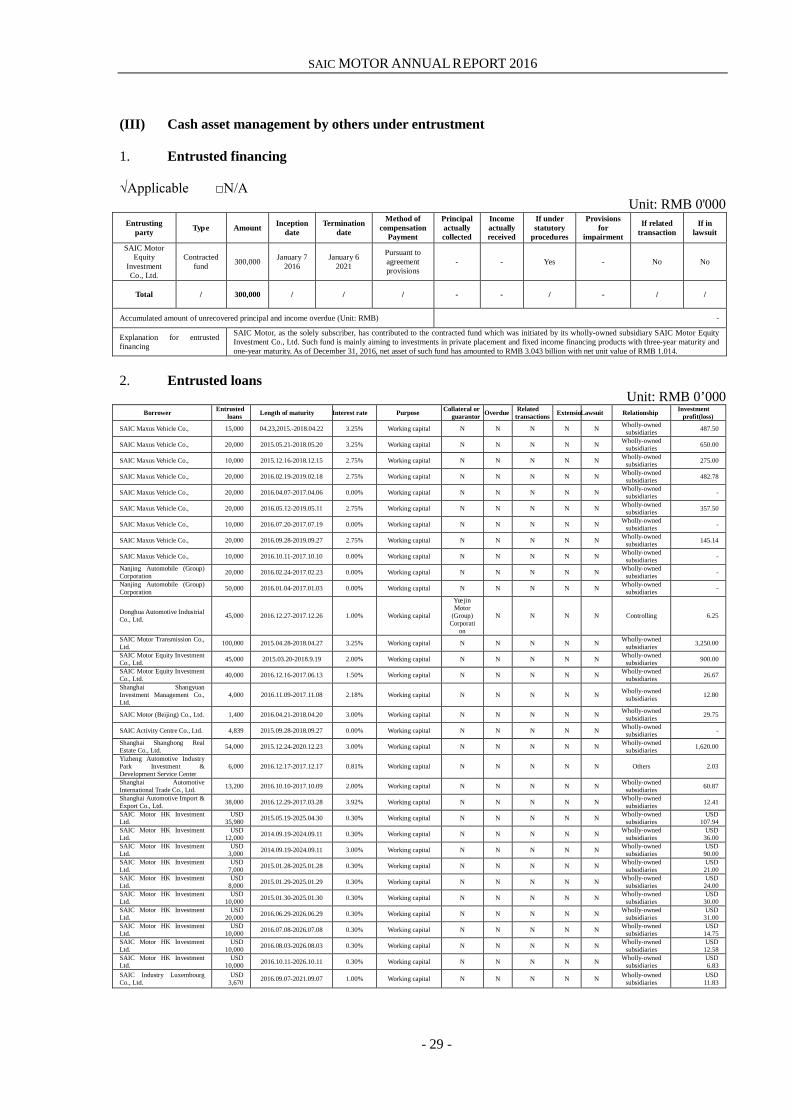
(III) Cash asset management by others under entrustment
1. Entrusted financing
√Applicable □N/A
Unit: RMB 0'000 Entrusting
party Type Amount Inception date
Termination date
Method of compensation
Payment
Principal actually collected
Income actually received
If under statutory
procedures
Provisions for
impairment
If related transaction
If in lawsuit
SAIC Motor Equity
Investment Co., Ltd.
Contracted fund 300,000 January 7
2016 January 6
2021
Pursuant to agreement provisions
- - Yes - No No
Total / 300,000 / / / - - / - / /
Accumulated amount of unrecovered principal and income overdue (Unit: RMB) -
Explanation for entrusted financing
SAIC Motor, as the solely subscriber, has contributed to the contracted fund which was initiated by its wholly-owned subsidiary SAIC Motor Equity Investment Co., Ltd. Such fund is mainly aiming to investments in private placement and fixed income financing products with three-year maturity and one-year maturity. As of December 31, 2016, net asset of such fund has amounted to RMB 3.043 billion with net unit value of RMB 1.014.
2. Entrusted loans
Unit: RMB 0’000 Borrower Entrusted
loans Length of maturity Interest rate Purpose Collateral or guarantor Overdue Related
transactions Extensio Lawsuit Relationship Investment profit(loss)
SAIC Maxus Vehicle Co., 15,000 04.23,2015.-2018.04.22 3.25% Working capital N N N N N Wholly-owned subsidiaries 487.50
SAIC Maxus Vehicle Co., 20,000 2015.05.21-2018.05.20 3.25% Working capital N N N N N Wholly-owned subsidiaries 650.00
SAIC Maxus Vehicle Co., 10,000 2015.12.16-2018.12.15 2.75% Working capital N N N N N Wholly-owned subsidiaries 275.00
SAIC Maxus Vehicle Co., 20,000 2016.02.19-2019.02.18 2.75% Working capital N N N N N Wholly-owned subsidiaries 482.78
SAIC Maxus Vehicle Co., 20,000 2016.04.07-2017.04.06 0.00% Working capital N N N N N Wholly-owned subsidiaries -
SAIC Maxus Vehicle Co., 20,000 2016.05.12-2019.05.11 2.75% Working capital N N N N N Wholly-owned subsidiaries 357.50
SAIC Maxus Vehicle Co., 10,000 2016.07.20-2017.07.19 0.00% Working capital N N N N N Wholly-owned subsidiaries -
SAIC Maxus Vehicle Co., 20,000 2016.09.28-2019.09.27 2.75% Working capital N N N N N Wholly-owned subsidiaries 145.14
SAIC Maxus Vehicle Co., 10,000 2016.10.11-2017.10.10 0.00% Working capital N N N N N Wholly-owned subsidiaries -
Nanjing Automobile (Group) Corporation 20,000 2016.02.24-2017.02.23 0.00% Working capital N N N N N Wholly-owned
subsidiaries -
Nanjing Automobile (Group) Corporation 50,000 2016.01.04-2017.01.03 0.00% Working capital N N N N N Wholly-owned
subsidiaries -
Donghua Automotive Industrial Co., Ltd. 45,000 2016.12.27-2017.12.26 1.00% Working capital
Yuejin Motor
(Group) Corporati
on
N N N N Controlling 6.25
SAIC Motor Transmission Co., Ltd. 100,000 2015.04.28-2018.04.27 3.25% Working capital N N N N N Wholly-owned
subsidiaries 3,250.00
SAIC Motor Equity Investment Co., Ltd. 45,000 2015.03.20-2018.9.19 2.00% Working capital N N N N N Wholly-owned
subsidiaries 900.00
SAIC Motor Equity Investment Co., Ltd. 40,000 2016.12.16-2017.06.13 1.50% Working capital N N N N N Wholly-owned
subsidiaries 26.67
Shanghai Shangyuan Investment Management Co., Ltd.
4,000 2016.11.09-2017.11.08 2.18% Working capital N N N N N Wholly-owned subsidiaries 12.80
SAIC Motor (Beijing) Co., Ltd. 1,400 2016.04.21-2018.04.20 3.00% Working capital N N N N N Wholly-owned subsidiaries 29.75
SAIC Activity Centre Co., Ltd. 4,839 2015.09.28-2018.09.27 0.00% Working capital N N N N N Wholly-owned subsidiaries -
Shanghai Shanghong Real Estate Co., Ltd. 54,000 2015.12.24-2020.12.23 3.00% Working capital N N N N N Wholly-owned
subsidiaries 1,620.00
Yizheng Automotive Industry Park Investment & Development Service Center
6,000 2016.12.17-2017.12.17 0.81% Working capital N N N N N Others 2.03
Shanghai Automotive International Trade Co., Ltd. 13,200 2016.10.10-2017.10.09 2.00% Working capital N N N N N Wholly-owned
subsidiaries 60.87
Shanghai Automotive Import & Export Co., Ltd. 38,000 2016.12.29-2017.03.28 3.92% Working capital N N N N N Wholly-owned
subsidiaries 12.41
SAIC Motor HK Investment Ltd.
USD 35,980 2015.05.19-2025.04.30 0.30% Working capital N N N N N Wholly-owned
subsidiaries USD
107.94 SAIC Motor HK Investment Ltd.
USD 12,000 2014.09.19-2024.09.11 0.30% Working capital N N N N N Wholly-owned
subsidiaries USD
36.00 SAIC Motor HK Investment Ltd.
USD 3,000 2014.09.19-2024.09.11 3.00% Working capital N N N N N Wholly-owned
subsidiaries USD
90.00 SAIC Motor HK Investment Ltd.
USD 7,000 2015.01.28-2025.01.28 0.30% Working capital N N N N N Wholly-owned
subsidiaries USD
21.00 SAIC Motor HK Investment Ltd.
USD 8,000 2015.01.29-2025.01.29 0.30% Working capital N N N N N Wholly-owned
subsidiaries USD
24.00 SAIC Motor HK Investment Ltd.
USD 10,000 2015.01.30-2025.01.30 0.30% Working capital N N N N N Wholly-owned
subsidiaries USD
30.00 SAIC Motor HK Investment Ltd.
USD 20,000 2016.06.29-2026.06.29 0.30% Working capital N N N N N Wholly-owned
subsidiaries USD
31.00 SAIC Motor HK Investment Ltd.
USD 10,000 2016.07.08-2026.07.08 0.30% Working capital N N N N N Wholly-owned
subsidiaries USD
14.75 SAIC Motor HK Investment Ltd.
USD 10,000 2016.08.03-2026.08.03 0.30% Working capital N N N N N Wholly-owned
subsidiaries USD
12.58 SAIC Motor HK Investment Ltd.
USD 10,000 2016.10.11-2026.10.11 0.30% Working capital N N N N N Wholly-owned
subsidiaries USD
6.83 SAIC Industry Luxembourg Co., Ltd.
USD 3,670 2016.09.07-2021.09.07 1.00% Working capital N N N N N Wholly-owned
subsidiaries USD
11.83

SAIC MOTOR ANNUAL REPORT 2016
- 30 -
3. Investment on other financing and derivative products □Applicable √N/A (IV) Other significant contracts □Applicable √N/A XVI. Explanations on other significant matters On November 6, 2015, the Company published a series of announcements, including "Announcement to Related Parties Transactions in Respect of Private Offering of A-shares", "Preliminary Proposal of Private Offering of A-shares by Shanghai Motor Corporation Limited" and the "Announcement of Matters in Respect of Key Employee Stock Ownership of the Company". (Refer to www.sse.com.cn for details) On December 5, 2015, the Company published the Announcement for “the Obtainment of Approval of Private Offering of Shares by State-owned Assets Supervision and Administration Commission of Shanghai Municipal Government”. In the first extraordinary general meeting of the Company held on December 11, 2015, the proposal in respect of private offering was passed by more than 99% of voting rights. (Refer to Announcement for the Resolution in the First Extraordinary General Meeting in 2015 published in www.sse.com.cn
on December 12, 2015 for details.
On December 21, 2015, the Company received the Notice to the Acceptance of Administrative Licensing Application by China Securities Regulatory Commission (No.153617). Chinese Securities Regulatory Commissions decided to accept the administrative licensing application as considering the application materials were complete and in compliance with the statutory form after a legal review on the administrative licensing application materials submitted by the Company regarding to Private Offering of Shares by Listed Company. (Refer to Announcement on the Reception of Notice to the Acceptance of Administrative Licensing Application by China Securities Regulatory Commission published in www.sse.com.cn on December 23, 2015 for details) On January 18, 2016, a variety of files were approved in the fifth session of the sixth the Board, including the "Proposal for Impact on the Company’s Major Financial Indicators Arising from Diluted Current Return due to Private Offering of Shares and Measures Adopted" by the Company, "Commitment to Filling Measures by Relevant Entities on Diluted Current Return due to Private Offering of Shares", "Proposal on Supplementary Contract of Equity Subscription Agreement Subject to a Condition Precedent By and Between the Company and Shanghai Automotive Industry Corporation(Group)", "Proposal on Supplementary Contract of Equity Subscription Agreement Subject to a Condition Precedent By and Between the Company and Changjiang Pension Insurance Co., Ltd. ", "Preliminary Proposal on Private Offering of A-shares by the Company (Revised) ", and "Proposal on the Convening of the Company’s First Extraordinary General Meeting in 2016". Pursuant to above files, the Company revised the preliminary proposal of this private offering of shares. (Refer to relevant announcements published in www.sse.com.cn on January 19, 2016 for details.) In the first extraordinary general meeting of the Company held on February 3, 2016, it was passed by more than 99% of voting rights for the "Proposal for Impact on the Company’s Major Financial Indicators Arising from Diluted Current Return due to Private Offering of Shares and Measures Adopted by the Company", and "the Commitment to Filling Measures by Relevant Entities on Diluted Current Return due to Private Offering of Shares". (Refer to Announcement for the Announcement for the Resolution in the First Extraordinary General Meeting in 2016 published in www.sse.com.cn
on February 4, 2016 for details.
On January 26, 2016, the Company issued the "Reply to the Feedback on Application Documents in respect of Private Offering of Shares" in accordance with the "Notice to Review Opinion on Administrative Licensing Items" by China Securities Regulatory Commission (No.153617). (Refer to www.sse.com.cn for details.)

SAIC MOTOR ANNUAL REPORT 2016
- 31 -
On April 20, 2016, China Securities Regulatory Commission Issuance Examination Commission reviewed the application from the Company in respect of private offering of A-shares. According to the result of such review, it is approved the Company’s application in respect of private offering of A-shares this time. (Refer to www.sse.com.cn for details.) Considering the Company implemented 2015 profit distribution plan on July 8, 2016, the Company adjusted the bottom price and the ceiling quantity of this private offering. On July 9, 2016, the Company issued Announcement on the Adjustment of Bottom Price and Quantity in Respect of Private Offering of Shares Subsequent to the Implementation of 2015 Profit Distribution Plan, for which the bottom price of this private offering of shares was adjusted to RMB 14.2 per share while the ceiling quantity of this private offering of shares was adjusted to not more than 1,056,338,028 shares. (Refer to www.sse.com.cn for details.) On December 5, 2016, the Company issued the Announcement for Approval of Application in Respect of Private Offering of Shares from China Securities Regulatory Commission after received the Reply from the China Securities Regulatory Commission on Approving the Private Offering of Shares by Shanghai Motor Corporation Limited (License No. 2077) on December, 2016. (Refer to www.sse.com.cn for details.) In January 2010, through marketing bids and legal procedures, the Company privately offered 657,894,736 shares of A-share at a price of RMB 22.80 per share, in which the Company raised net fund of RMB 14,854,499,980.80 after deducting the issue expenses. On January 19, 2017, the Company completed new share registration and trusteeship. On January 21, 2017, the Company issued a series of announcements such as Announcement for Results of Private Offering of Shares and Relevant Changes, Announcement for the Resolutions in the First Meeting of Holders Regarding Key Employee Stock Ownership of Shanghai Motor Corporation Limited and so on (Refer to www.sse.com.cn for details). XVII. Active fulfilment of social responsibility
(I) Poverty alleviation by listed companies
√Applicable □N/A Details refer to the Company’s 2016 Social Responsibility Report (announced in www.sse.com.cn)
(II) Achievement of fulfilling social responsibility
√Applicable □N/A
Refer to the Company’s 2016 Social Responsibility Report (announced in www.sse.com.cn) (III) Environment protection of the Companies and their subsidiaries in high pollution industries
regulated by the State Environmental Protection Department. □Applicable √N/A
(IV) Others □Applicable √N/A
XVIII. Convertible bonds of the Company (I) Issue of convertible bonds
□Applicable √ N/A
(II) Holders and guarantors of convertible bonds during the reporting period □Applicable √ N/A
(III) Changes in convertible bonds during the reporting period
□Applicable √ N/A

SAIC MOTOR ANNUAL REPORT 2016
- 32 -
(IV) Previous price adjustments on convertible bonds
□Applicable √ N/A
(V) The Company’s liability and credit changes and cash arranges for future payments □Applicable √ N/A
(VI) Others □Applicable √ N/A
Section VI Share Capital Changes and Information of Shareholders
I. Changes in share capital of ordinary shares (I) Changes in ordinary shares 1. Changes in ordinary shares There is no change in total amount and share structure during the reporting period. On January 19, 2017, as the Company had registered new shares of the private offering project, the total ordinary shares of the Company increased to 11,683,461,365 shares due to the new issue of 657,894,736 shares of restricted circulating shares by the Company. 2. Explanation for changes of ordinary shares □Applicable √N/A 3. Effect of changes in ordinary shares in financial indicators including earnings per share and
net assets per share in latest year/period(if any) □Applicable √N/A 4. Other content the Company considers necessary or required to be disclosed by regulators □Applicable √N/A (II) Changes of restricted shares □Applicable √N/A II. Shares issuing and listing (I) Securities issuing as of the reporting period Explanation for securities issuing as of the reporting period (Please specify separately for bonds with different interest rate in the duration): (II) Changes in the Company’s total ordinary shares and shareholders’ structure, as well as assets and
liabilities. □Applicable √N/A (III) Existed shares held by internal employees □Applicable √N/A

SAIC MOTOR ANNUAL REPORT 2016
- 33 -
III. Shareholders and actual controller (I) Total number of shareholders: Number of ordinary shareholders at the end of the reporting period
103,088
Number of ordinary shareholders at the end of last month prior to the announcement of the annual report
113,214
(II) Shareholding of top ten shareholders, and top ten circulating shareholders (or shareholders of
non-restricted shares) as of the end of reporting period Unit: share
Top ten shareholders
Name of shareholders
Increase/decrease during reporting
period
Number of shares held
Proportion (%)
NNumber of restricted
shares hold
Number of shares pledged
or frozen
Nature of sharehold
ers Status quantity
Shanghai Automotive Industry Corporation (Group) - 8,191,449,931 74.30 0 None
Stated-owned legal person
Yuejin Motor (Group) Corporation - 413,919,141 3.75 0 None Stated-owned legal person
China Securities Finance Corporation Limited -4,693,072 298,390,619 2.71 0 None Unknown
Shanghai International Group Co., Ltd -137,396,429 197,012,346 1.79 0 None Stated-owned legal person
Hong Kong Securities Clearing Company Ltd 32,037,007 169,337,909 1.54 0 None Unknown
Central Huijin Investment Ltd. - 100,754,000 0.91 0 None Unknown Industrial and Commercial Bank of China-China Securities Shanghai SOE Trading Open-end Index Funds Security Investment Fund
49,621,302 49,621,302 0.45 0 None Unknown
Zhongyuan Equity Investment Management Co., Ltd.
32,647,994 32,647,994 0.30 0 Pledged
32,360,000 Unknown
Industrial and Commercial Bank of China-Shanghai Securities 50 Trading Open-end Index Funds Security Investment Fund
442,859 24,496,223 0.22 0 None Unknown
Central Bank Of Malaysia 2,448,583 24,061,646 0.22 0 None Unknown Top ten shareholders of non-restricted shares
Name of shareholders Number of non-restricted shares held
Type of shares and number Type Number
Shanghai Automotive Industry Corporation (Group) 8,191,449,931 Ordinary shares in RMB 8,191,449,931
Yuejin Motor (Group) Corporation 413,919,141 Ordinary shares in RMB 413,919,141
China Security Finance Corporation Limited 298,390,619 Ordinary shares in RMB 298,390,619
Shanghai International Group Co., Ltd 197,012,346 Ordinary shares in RMB 197,012,346
Hong Kong Securities Clearing Company Ltd 169,337,909 Ordinary shares in RMB 169,337,909
Central Huijin Investment Ltd. 100,754,000 Ordinary shares in RMB 100,754,000
Industrial and Commercial Bank of China-China Securities Shanghai SOE Trading Open-end Index Funds Security Investment Fund
49,621,302 Ordinary shares in RMB 49,621,302
Zhongyuan Equity Investment Management Co., Ltd. 32,647,994 Ordinary shares in RMB 32,647,994
Industrial and Commercial Bank of China-Shanghai Securities 50 Trading Open-end Index Funds Security Investment Fund
24,496,223 Ordinary shares in RMB 24,496,223

SAIC MOTOR ANNUAL REPORT 2016
- 34 -
National Bank Of Malaysia 24,061,646 Ordinary shares in RMB 24,061,646
Explanation of the related relationship or concerted actions among the above shareholders
Among the top 10 shareholders, Shanghai Automotive Industry Corporation (Group) and other 9 shareholders have no related relationships nor persons acting in concert as regulated in Administrative Rules on Acquisition of Listed Company, it is unknown whether other 9 shareholders have related relationships or persons acting in concert.
Quantity of restricted shares held by the top ten shareholders and the restricted conditions. □Applicable √N/A (III) Strategic investors or general legal representative who have been included in top 10
shareholders due to placement of new shares. □Applicable √N/A IV. Holding shareholders and actual controlling party (I). Corporate controlling shareholder 1. Legal person Name Shanghai Automotive Industry Corporation (Group) Legal representative Mr. Chen Hong Date of establishment March 1, 1996
Business scope
Manufacturing, development, sales and investment of automobiles, motorcycles and tractors, operation and management of state-owned assets under authorization, domestic trading (except for special provisions) and advisory services.
Investment in domestic or foreign listed companies during the reporting period
None
Other explanations None
2. Natural Person □Applicable √N/A
3. Special explanation for no controlling shareholders in the Company □Applicable √N/A
4. Index and date of changes of controlling shareholders in the reporting period □Applicable √N/A

SAIC MOTOR ANNUAL REPORT 2016
- 35 -
5. The Company’s organizational chart of ownership and controlling relationships are
illustrated as below: √Applicable □ N/A
Note: On January 19, 2017, as the Company had registered new shares of the private offering project, the total ordinary shares of the Company increased to 11,683,461,365 shares due to the new issue of 657,894,736 shares of restricted circulating shares by the Company. When such issue has been completed, Shanghai Automotive Industry Corporation (Group) holds 8,323,028,878 shares in the Company, accounting for 71.24% of the total shares, hence it is still the controlling shareholder of the Company. (II) Actual controller 1. Legal person
√Applicable □ N/A
Actual controller of the Company is State-owned Assets Supervision and Administration Commission of Shanghai Municipal Government which is directly under Municipal Government of Shanghai and authorized to represent the Municipal Government of Shanghai to perform responsibilities as contributor and supervise municipal state-owned assets. 2. Natural Person □Applicable √N/A 3. Special explanation for no actual controller in the Company □Applicable √N/A 4. Index and date of changes of actual controller in the reporting period □Applicable √N/A
Shanghai Automotive Industry Corporation (Group)
74.30%
Shanghai Motor Corporation Limited

SAIC MOTOR ANNUAL REPORT 2016
- 36 -
5. The block diagram of controlling relationship and ownership between the Company and the actual controller √Applicable □N/A State-owned Assets Supervision and Administration Commission of Shanghai Municipal Government 100% Shanghai Automotive Industry Corporation (Group) 74.30% Shanghai Motor Corporation Limited Note: On January 19, 2017, as the Company had registered new shares of the private offering project, the total ordinary shares of the Company increased to 11,683,461,365 shares due to the new issue of 657,894,736 shares of restricted circulating shares by the Company. When such issue has been completed, Shanghai Automotive Industry Corporation (Group) holds 8,323,028,878 shares in the Company, accounting for 71.24% of the total shares, hence it is still the controlling shareholder of the Company. State-owned Assets Supervision and Administration Commission of Shanghai Municipal Government is still the actual controller of the Company. 6. The actual controller controls the Company through trust and other asset management □Applicable √N/A (III) Other particulars about the controlling shareholder and the actual controller □Applicable √N/A V. Other corporate shareholders holding more than 10% shares of the Company □Applicable √N/A VI. Explanation of less ownership of restricted shares □Applicable √N/A
Section VII Preferred Stock Information □Applicable √N/A
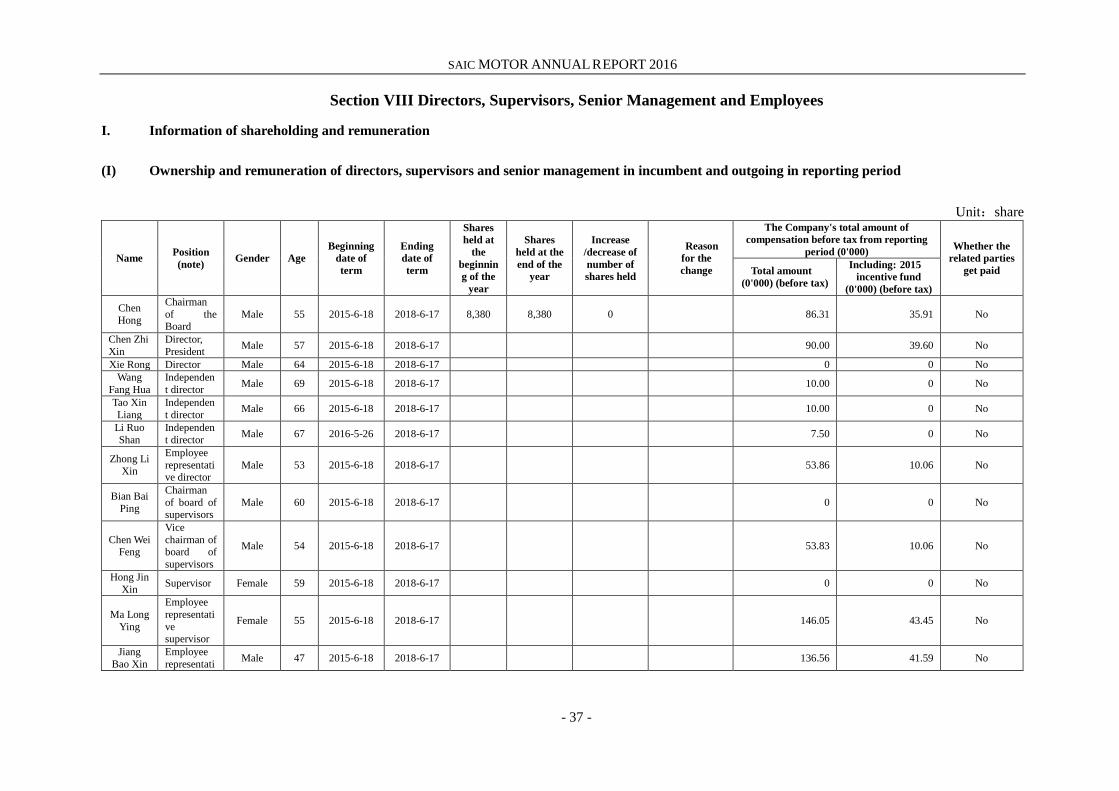
SAIC MOTOR ANNUAL REPORT 2016
- 37 -
Section VIII Directors, Supervisors, Senior Management and Employees
I. Information of shareholding and remuneration (I) Ownership and remuneration of directors, supervisors and senior management in incumbent and outgoing in reporting period
Unit:share
Name Position (note) Gender Age
Beginning date of term
Ending date of term
Shares held at
the beginning of the
year
Shares held at the end of the
year
Increase /decrease of number of shares held
Reason for the change
The Company's total amount of compensation before tax from reporting
period (0'000) Whether the related parties
get paid Total amount (0'000) (before tax)
Including: 2015 incentive fund
(0'000) (before tax)
Chen Hong
Chairman of the Board
Male 55 2015-6-18 2018-6-17 8,380 8,380 0 86.31 35.91 No
Chen Zhi Xin
Director, President Male 57 2015-6-18 2018-6-17 90.00 39.60 No
Xie Rong Director Male 64 2015-6-18 2018-6-17 0 0 No Wang
Fang Hua Independent director Male 69 2015-6-18 2018-6-17 10.00 0 No
Tao Xin Liang
Independent director Male 66 2015-6-18 2018-6-17 10.00 0 No
Li Ruo Shan
Independent director Male 67 2016-5-26 2018-6-17 7.50 0 No
Zhong Li Xin
Employee representative director
Male 53 2015-6-18 2018-6-17 53.86 10.06 No
Bian Bai Ping
Chairman of board of supervisors
Male 60 2015-6-18 2018-6-17 0 0 No
Chen Wei Feng
Vice chairman of board of supervisors
Male 54 2015-6-18 2018-6-17 53.83 10.06 No
Hong Jin Xin Supervisor Female 59 2015-6-18 2018-6-17 0 0 No
Ma Long Ying
Employee representative supervisor
Female 55 2015-6-18 2018-6-17 146.05 43.45 No
Jiang Bao Xin
Employee representati Male 47 2015-6-18 2018-6-17 136.56 41.59 No

SAIC MOTOR ANNUAL REPORT 2016
- 38 -
ve supervisor
Zhou Lang Hui
Vice president Male 45 2015-6-18 2018-6-17 78.48 33.48 No
Yu Jian Wei
Vice president Male 56 2015-6-18 2018-6-17 44.41 16.33 No
Chen De Mei
Vice president Male 54 2015-6-18 2018-6-17 57.50 12.74 No
Wang Xiao Qiu
Vice president Male 52 2015-6-18 2018-6-17 75.54 31.14 No
Shen Yang
Vice president Male 55 2015-6-18 2018-6-17 57.50 12.74 No
Lan Qing Song
Vice president Male 51 2015-6-18 2018-6-17 53.03 9.23 No
Cheng Jing Lei
Chief engineer Male 49 2015-6-18 2018-6-17 53.92 10.12 No
Wei Yong
Acting CFO Male 44 2016-10-28 2018-6-17 147.08 44.72 No
Wang Jian
Zhang
Secretary to the Board Female 47 2015-6-18 2018-6-17 146.05 43.69 No
Zhang Hai
Liang
Former vice president
Male 46 2015-6-18 2016-3-11 10.95 0 No
Gu Feng Former CFO Male 44 2015-6-18 2016-9-29 68.14 31.14 No
Sun Zheng
Former independent director
Male 59 2015-6-18 2016-5-25 0 0 No
Total / / / / / 8,380 8,380 0 / 1,388.29 472.34 /
Note“ As the Company’s leaders are excluded from the 2015 incentive fund distribution according to the remuneration regulation provided by State-owned Assets Supervision and Administration Commission of Shanghai Municipal Government, the incentive funds they have received in the reporting period refer to the deferred payment for incentive funds distributed for 2013 and 2014.
Name Major working experience
Chen Hong He served as president, vice board chairman and vice secretary of Party Committee of SAIC Motor Corporation Limited; and vice chairman of the Board, president and secretary of Party Committee of SAIC Motor Corporation Limited. He is currently the chairman of the Board, and secretary of Party Committee of SAIC Motor Corporation Limited.
Chen Zhi Xin He served as executive vice president of SAIC Motor Corporation Limited and general manager of passenger vehicle branch; president of SAIC Motor Corporation Limited, vice secretary of Party Committee of SAIC Motor Corporation Limited and general manager of passenger vehicle branch. He is currently director, president and vice secretary of Party Committee of SAIC Motor Corporation Limited.

SAIC MOTOR ANNUAL REPORT 2016
- 39 -
Zhong Li Xin He served as assistant president, head of president office of SAIC Motor Corporation Limited; and assistant president, chairman of the labor union and head of president office of SAIC Motor Corporation Limited. He is currently employee representative director, chairman of the labor union and head of Party Committee office of SAIC Motor Corporation Limited.
Xie Rong He served as vice dean of Shanghai National Accounting Institute. He is currently director of SAIC Motor Corporation Limited and professor of Shanghai National Accounting Institute.
Wang Fang Hua
He is a professor with a master degree of economics. He served as director of industrial economy teaching and research section of School of Management, assistant to dean of School of Management and director of department of business management of Fudan University, vice dean, general vice dean and dean of School of Management of Fudan University, dean of Antai College of Economics & Management of Shanghai Jiao Tong University. He is currently an independent director of SAIC Motor Corporation Limited and special adviser of Shanghai Jiao Tong University.
Tao Xin Liang
He is a professor with a master degree of management. He served as a section chief of research department of Shanghai University of Technology, deputy director of research department of Shanghai University of Technology, vice president and president of patents affairs bureau; deputy dean of Faculty of Humanities of Shanghai University Of Technology; deputy dean, executive deputy dean, and dean of Intellectual Property Academy of Shanghai University; Deputy dean of Law School of Shanghai University; Dean of Intellectual Property Academy of Tongji University. He currently serves as an independent director at SAIC Motor Corporation Limited, dean of Intellectual Property Academy of Dalian University of Technology and honorary dean of Intellectual Property Academy of Shanghai University.
Li Ruo Shan
He served as deputy director of Accounting Department of Economic College of Xiamen University, deputy dean of Economic College of Xiamen University; deputy dean of School of Management, director of accounting department and director of finance department of Fudan University; and independent directors of CPIC, Sinochem International and other listing companies. He currently serves as academic director of Professional Master of Accounting of School of Management of Fudan University, deputy president of Shanghai Institute of Accounting and Shanghai Institute of Audit, member of Shanghai SASAC and an independent director of SAIC Motor Corporation Limited.
Bian Bai Ping
He served as Secretary of Changning District. He is currently the chairman of board of supervisors of SAIC Motor Corporation Limited and Shanghai City Investment (Group) Co., Ltd.
Chen Wei Feng
He served as a party member and the chief of management department of party commission in SAIC Motor Corporation Limited). He currently serves as vice chairman, secretary of discipline inspection commission in Shanghai Motor Corporation Limited.
Hong Jin Xin She served as the supervisor officer and supervisor officer in administrative audit business of Shanghai Municipal Audit Bureau and economic responsibility auditing. She currently serves as full-time supervisor in Shanghai Motor Corporation Limited, and vice researcher in economic responsibility auditing of Shanghai Municipal Audit Bureau.
Ma Long Ying (Note)
She served as vice chairman of labor union of Shanghai Automotive Industry Corporation (Group). She is currently the employee representative supervisor of SAIC Motor Corporation Limited.
Jiang Bao Xin
He served as the CFO of Shanghai Diesel Engine Co., Ltd and vice supervisor of audit office in Shanghai Motor Corporation Limited. He currently serves as employee representative supervisor and supervisor of audit office in Shanghai Motor Corporation Limited.
Zhou Lang Hui He is currently vice president and vice secretary of Party Committee of SAIC Motor Corporation Limited.
Yu Jian Wei He is currently vice president of SAIC Motor Corporation and secretary of Party Committee of Nanjing Automobile (Group) Corporation

SAIC MOTOR ANNUAL REPORT 2016
- 40 -
concurrently.
Chen De Mei He served as vice president of Shanghai Automotive Industry Corporation (Group). He is currently vice president of SAIC Motor Corporation Limited.
Wang Xiao Qiu
He served as general manager and vice secretary of Party Committee of Shanghai Diesel Engine Co., Ltd; vice chief economic engineer of SAIC Motor Corporation Limited, general manager of SGM. He is currently vice president of SAIC Motor Corporation Limited, general manager of passenger vehicle branch and director of technology center concurrently.
Shen Yang He is currently the vice president of SAIC Motor Corporation Limited and general manager of SGMW.
Lan Qing Song
He served as vice manager of department of commercial vehicle of SAIC Motor Corporation Limited, general manager of SAIC Motor Commercial Vehicle Co., Ltd. and general manager of SAIC Maxus. He is currently general manager of department of commercial vehicle of SAIC Motor Corporation Limited and vice president of SAIC Motor Corporation Limited.
Cheng Jing Lei
He served as vice chief engineer and executive director of department of strategy and business planning of SAIC Motor Corporation Limited. He is currently the chief engineer of SAIC Motor Corporation Limited.
Wei Yong
He served as executive president of department of capital operation of SAIC Motor Commercial Vehicle Co., Ltd. He currently serves as acting CFO, head of board of directors office, general manager of security affairs department, general manager of finance affairs department of SAIC Motor Corporation Limited, general management of SAIC Motor HK Investment Co., Ltd., as well as general manager and security affairs representative of SAIC investment management Co., Ltd.
Wang Jian Zhang She is currently secretary to the Board and executive director of Risk Management Department of SAIC Motor Corporation Limited.
Note: According to the Company’s announcement on March 24, 2017, Mrs. Ma Long Ying, an employee representative supervisor of the Company, resigned the employee representative supervisor of the 6th Board of Directors of the Company.

SAIC MOTOR ANNUAL REPORT 2015
- 41 -
Others □Applicable √N/A (II) Information of incentive shares awarded to directors, supervisors and senior management
during reporting period □Applicable √N/A II. Information of directors, supervisors and senior management in incumbent and outgoing
in the reporting period (I). Information of positions held in shareholders' entities √Applicable □N/A
Name Name of shareholder entity Position held Starting date of
term Ending date of
term Chen Hong Shanghai Automotive
Industry Corporation (Group)
Board chairman
2014-10-16 2017-10-15
Chen Zhi Xin Shanghai Automotive Industry Corporation
(Group)
Director 2014-10-16 2016-12-20
Zhou Lang Hui
Shanghai Automotive Industry Corporation
(Group)
Supervisor 2014-10-16 2017-10-15
Chen De Mei Shanghai Automotive Industry Corporation
(Group)
Director 2014-10-16 2017-10-15
Wei Yong Shanghai Automotive Industry Corporation
(Group)
Director 2016-9-29 2016-12-20
Gu Feng Shanghai Automotive Industry Corporation
(Group)
Director 2014-10-16 2016-9-28
(II) Duties in other entities √Applicable □N/A
Name Name of other entity Position held Starting
date of term Ending
date of term Chen Hong HUAYU Automotive
Systems Co., Ltd. Chairman of the
Board 2015-5-29 2018-5-28
Chen Zhi Xin HUAYU Automotive Systems Co., Ltd.
vice president 2015-5-29 2018-5-28
Zhong Li Xin HUAYU Automotive Systems Co., Ltd.
Director 2015-5-29 2018-5-28
Zhou Lang Hui HUAYU Automotive Systems Co., Ltd.
Chairman of board of supervisors
2015-5-29 2018-5-28
Zhou Lang Hui Shanghai Diesel Engine Co., Ltd.
Chairman of board of supervisors
2015-5-20 2018-5-19
Lan Qing Song Shanghai Diesel Engine Co., Ltd.
Director 2015-5-20 2018-5-19
Jiang Bao Xin Shanghai Diesel Engine Co., Ltd
Supervisor 2015-5-20 2018-5-19

SAIC MOTOR ANNUAL REPORT 2015
- 42 -
III. Compensation of directors, supervisors and key management personnel √Applicable □N/A
Decision-making process of remuneration of directors supervisors and senior management
The allowance of independent directors shall be decided by the Board and subject to the approval of general meeting of shareholders. Each independent director may receive allowance of RMB100,000 and the necessary and reasonable costs arising from performing the duties shall be borne by the Company. The Company's non-independent directors shall not receive remuneration for the position of directors. The Company's supervisors shall not receive remuneration for the position of supervisors.
Basis for decision of remuneration of directors, supervisors and senior management
The remuneration is based on performance review of senior management according to the key performance indicators including the Company's operating performance and individual's performance.
Actual payment of remuneration of directors, supervisors and senior management
In 2016, according to Incentive Fund Plan of Shanghai Motor Corporation Limited approved by the 36th session of the 4th board of directors of the Company, the Company implemented 2015 Implementation Scheme for Incentive Fund Plan of Shanghai Motor Corporation Limited as approved by 8th session of the 6th
board of directors of the Company with detailed amount of incentive fund included in the total annul remuneration payable. Leaders of the Company have not participated in the 2015 incentive fund allocation as they should be subject to the remuneration regulations by Shanghai SASAC.
Total remuneration of directors supervisors and senior management received by the end of the reporting period
RMB13,882,900
IV Alteration of directors, supervisors and key management personnel
Name Position Changes Reason for the change
Li Ruo Shan Independent director Election Elected at the Company’s 2015 shareholders meeting
Sun Zheng Independent director Resignation Resigned due to in compliance with relevant provisions by the Ministry of Education
Wei Yong Acting CFO Appointment Appointed by the Board of Directors Gu Feng CFO Resignation Resigned for personal reasons
Zhang Hai Liang Vice President Resignation Resigned for personal reasons
V. Penalty by regulators in recent three years □Applicable √N/A

SAIC MOTOR ANNUAL REPORT 2015
- 43 -
VI. Information of the Company's employees (I) Information of employees Amount of employees of parent company 8,589 Amount of employees of main subsidiaries 162,806 Total amount of employees on active duty 171,395 Retired employees whose expense is undertaken by parent company and main subsidiaries 44,869
Composition of employees by specialization Areas of specialization Headcounts (persons)
Production personnel 1,431 Marketing and sales personnel 396
Engineering technical personnel 5,298 Finance and auditing personnel 146
Administrative personnel 556 Others 762
Total 8,589 Composition of employees by education level
Education level Headcounts (persons) Postgraduate or above 3,035 University graduate 3,955
Secondary school diploma or below 1,599 Total 8,589
(II) Remuneration policy The Company complies with relevant national labor laws and regulations strictly by establishing remuneration and welfare system, paying employees remuneration in full and on time and contributing to employee social insurance schemes. In the meantime, the Company has established salary growth mechanism, where the increase of employees' income is in line with labor productivity and operating performance, by determining annual salary adjustment program based on CPI index, enterprise salary guideline set by the local government, operating performance of the Company and the benchmark of the market. The Company has explored diversified incentives, creating high performance and high motivated atmosphere. The Company has implemented incremental profit incentive plan to all staff to share the fruits of enterprise development; innovation incentive fund on technology and management for key employees to mobilize the initiative of core and mature talents; incentive fund plan to core talents. Meanwhile the Company has implemented key employee stock ownership plan, which improved the efficiency of retaining and motivating core talents. (III) Training plan
The Company, focused on vision, mission and value to lead innovation and development, accelerates capability cultivation and vocational education for employees of SAIC Motor. Firstly, the Company has reinforced the team construction of senior operation and management talents. The Company enriches knowledge structure of senior management personnel through “bi-week courses” for factory-level cadres, overseas training, young cadre training class, Seminar held by Tsinghua University specialized on innovation, large theory public lecture for reserve cadres and other approaches, to widen horizon., enrich idea, enhance ability and promote work efficiency.

SAIC MOTOR ANNUAL REPORT 2015
- 44 -
Secondly, the Company has held induction training for new employees. The Company organizes 13 induction training for all university graduators newly employed by SAIC to help them understand SAIC cultures and set up group awareness. Thirdly, the Company has cultivated professional technicians in a deep-going way. In 2016, through continuous education, the Company rained 17,000 automotive engineers and 2000 technicians of other professional fields such accounting, internal audit and so on approximately. In 2016, one employee got a subsidy project from Shanghai Municipality for outstanding technical leaders, one obtained the young technology star project, and one won China Automobile Industry Talent Award in SAIC. Fourthly, the Company has trained more skilled talents. The Company implements continue education of technicians and organizes high-skilled personnel to participate in industry trainer training; holds more vocational skills competitions including 12 competitions and entries at various levels. In 2016, about 15,000 skilled personnel in SAIC passed vocational skills training and identification, achieving promotions regarding professional skills level, of which more than 1,000 people were promoted as senior workers. SAIC Motor has constructed a training base with a total construction area of about 35,500 square meters through continuously reinforced training base construction since it was approved as high-skilled personnel training base in 2011.
Section IX Corporate Governance
I. Corporate governance and related information In accordance with laws and regulations including Corporate Law, Securities Law, Code of Corporate Governance for Listed Companies, Stock Listing Rules of Shanghai Stock Exchange, Articles of Association and relevant normative documents issued by CSRC and SSE, the Company, based on the establishment of governance system that guides the Company’s sustainable development and satisfies the Company’s production and operation, has insisted on standard operation, reinforced scientific governance and strict performance of disclosure obligation, as a way to develop the management of investor relations effectively and improve the Company’s government and operation consecutively. 1. Shareholders and general meeting of shareholders During the reporting period, the Company strictly followed the relevant provisions of Code of Corporate Governance for Listed Companies, Articles of Association and Rules of Procedure for General Meeting of Shareholders to convene general meetings of shareholders, combine online voting with on-site voting, and to ensure that all shareholders have equal status and rights. At the same time, the Company commissioned an attorney to attend general meetings of shareholders to witness and verify meeting procedures, matters for deliberation and the identification of the attendants to ensure the validity of the general meetings of shareholders and the equal status and rights of all shareholders to exercise their rights. The Company held three annual general meetings of shareholders in year 2016, and please refer to “shareholders meeting review” for more details.

SAIC MOTOR ANNUAL REPORT 2015
- 45 -
2. Directors and Board There are seven directors of the Company including 1 external director (no other duty role in the Company except for director and is not an independent director) and 3 independent directors. Strategic committee, audit committee as well as nomination, remuneration and assessment committee are established under the Board of the Company, of which external directors and independent directors account for three fifths, and comprise audit committee and nomination, remuneration and assessment committee with the independent director acting as chairman of the committee. Nine Board meetings, one meetings of strategic committee, five meetings of audit committee and four meetings of nominations, remuneration and assessment committee were made during the reporting period. Special committee meetings play an important role in significant operation decision making including making 13th
Five-year Plan strategy, reviewing periodic report, modifying proposed private offering share plans and preparing annual implementation scheme for incentive fund plan, supplementary election of independent directors, recruiting senior management, improving internal controls, supervising external audit entities etc.
During the reporting period, all the directors performed their obligations and duties in a faithful and diligent manner. They devoted continuous attention to the operation and management of the Company and actively participated in on-site interviews and investigations. On board meetings, they carefully deliberated on the proposals, carried out thorough discussion and exchange and made scientific decisions. No circumstances of violating against laws and regulations or the damaging the interests of the Company or shareholders were found.
3. Supervisors and board of supervisors The Company's board of supervisors and supervisors have earnestly performed the supervisory and examination responsibilities endowed by the general meeting of shareholders in a spirit of being highly responsible for all the shareholders according to the provisions of the Articles of Association and Rules of Procedure for the Board of Supervisors and implemented effective supervision on the Company's operation, financial condition, internal control construction and duty-performing of directors and senior management. During the reporting period, the board of supervisors held 6 meetings for reviewing and supervising the Company's periodic reports, private offering of shares, internal control construction, use of raised-funds and related transaction, etc, aware of no circumstances of violation of laws and regulations or no damage to interests of the Company or shareholders. 4. Corporate governance system During the reporting period, the Company continues to optimize the institutional system by amending the Administration Rules for Secretary of Board of Directors of the Company in accordance with the latest supervision requirement combining with the actual requirement of operation and management. The Company strictly executed related regulations to ensure orderly working regarding information disclosure, investors’ relationships management, dividends distribution as well as fund raise and management. Meanwhile, the Company carries out registration management system for insiders to continue its good work in management including training, registering, reporting, and etc, to effectively maintain fair disclosure of company information. 5. Performance evaluation, incentive and restraining mechanism The Company has selected managerial personnel according to the principle of ability and integrity, equality and fairness and implemented tenure system. In the meantime, the Company has established a performance evaluation and remuneration system which links remuneration of management with the Company's operating performance and individual's performance. Meanwhile, in order to improve the Company's operating performance continuously and to achieve sustainable development, the Company implemented "The Incentive Fund Plan of the Company" in year 2012. Considering the Company’s operating results in prior year satisfy the implementation conditions of the incentive fund plan, the Board of Directors reviewed and approved the 2015 Implementation Scheme for Corporate Incentive Fund Plan.

SAIC MOTOR ANNUAL REPORT 2015
- 46 -
6. Stakeholders The Company has fully demonstrated due respect to maintain legal rights of stakeholders and actively perform social responsibilities to balance interest in shareholders, employee and society etc. to promote sustainable and healthy development of the Company eventually. (Please refer to the Company’s social responsibility report in 2016) 7. Information disclosure and transparency During the reporting period, the Company took initiative to work on investors' relationship in accordance with the requirements as set forth in Investors Relationship Management System and Information Disclosure Management System. During year 2016, the Company received 280 investment agents' visits, 1540 individual investors' visits and more than 1320 enquiry calls. In addition, 2 meetings for communication of financial performance and 34 attendance in investors communication meetings organized by security traders were organized to facilitate investors' understanding of the Company's operating results timely and accurately. Moreover, as an active participant in the "small-and-medium-scale investors closer to the listed company" activities, the Company organized small-and-medium-scale investors to visit vehicle enterprises and communication with them in internet, which has contributed good interactions with small-and-medium-scale investors During the reporting period, the Company disclosed 4 periodic reports, made 50 temporary announcements, and made no announcement of correction, so that the investors could be informed of the true status of the Company on a timely, fair, accurate and comprehensive basis. If corporate governance is different from related requirements of China Securities Regulatory Commission; if there is difference, specify the reason □Applicable √N/A II. Brief introduction of Shareholders meeting
Sequence of the Meeting Date Designated index website of resolutions publicized
Disclosure date of resolutions
First temporary shareholders meeting in 2016 February 3, 2016
Shanghai Stock Exchange Website http://www.sse.com.cn
February 4, 2016
Shareholders meeting in 2015 May 26,2016 Shanghai Stock Exchange Website http://www.sse.com.cn
May 27,2016
Second temporary shareholders meeting in 2016 December 1,2016
Shanghai Stock Exchange Website http://www.sse.com.cn
December 2,2016
Explanation for Shareholder meeting □Applicable √N/A

SAIC MOTOR ANNUAL REPORT 2015
- 47 -
III. General meeting of shareholders (I) Attendance of directors in the meeting of Board of Directors and shareholder meeting
Name of director
Independent director
(yes or no)
Attendance of directors in board meetings
Attendance of directors in general meeting of shareholders
Number of board meetings for
attendance(Times
Attended in person (Times)
Attended via communication tools (Times)
Attended by delegation(Times)
Absence (Times)
Absence twice consecutively (yes or no)
Number of attendance in general meeting of shareholders
Chen Hong
No 9 9 7 0 0 No 3
Chen Zhi Xin
No 9 9 7 0 0 No 1
Xie Rong No 9 8 7 1 0 No 1 Zhong Li Xin
No 9 9 7 0 0 No 3
Wang Fang Hua
Yes 9 9 7 0 0 No 0
Tao Xin Liang
Yes 9 9 7 0 0 No 2
Li Ruo Shan
Yes 5 5 4 0 0 No 0
Sun Zheng
Yes 4 4 3 0 0 No 1
Note: In December 2015, in accordance with relevant regulations by the Ministry of Education, independent director Sun Zheng requested to resign as the independent director. As independent director Sun Zheng’s resignation will lead to the independent directors falling one-third less than members of the Board, Sun Zheng’s resignation will not take effect until a new independent director is elected at shareholders meeting. On May 26, 2016, the Company selected Mr. Li Ruo Shan as independent director of 6th
board of directors in the shareholders meeting in 2015.
Statement of absence twice consecutively None Number of meetings of the Board 9 Including: Number of on-site meetings 2 Number of meetings via communication tools 7 Number of meetings on-site and via communication tools simultaneously 0 (II) Circumstance where independent directors raised different opinions
□Applicable √N/A

SAIC MOTOR ANNUAL REPORT 2015
- 48 -
(III) Others Establishment of sound work system for independent directors and performance of independent directors: Pursuant to laws and regulations including “Corporate Law”, “Guiding Opinion on Establishing Independent Director System by Listed Companies” and “Code of Corporate Governance for Listed Companies”, the Company established “Work System for Independent Directors and Work System for Independent Directors with Regard to Annual Reports”, which ensured independent directors' performance of their duties. During the reporting period, independent directors performed their duties of good faith and due diligence, took their roles in specialized committees actively and protected the interests of the Company and shareholders, in particular, of the minority shareholders. Independent directors actively participated in the Board meetings and specialized committees meetings, especially deepen their understandings of the Company’s 13th
“Five-Year Plan” strategy, conscientiously evaluated the implementation of inner control system, attentively researched annual implementation scheme of incentive fund plan, and proposed their recommendations for the Company’s administration and long-term development, which can ensure consecutive improvement of corporate governance. During the reporting period, independent directors also expressed their independent opinions on election of directors, employment of senior management, external guarantees, related transactions, private offering of shares and other significant matters. During the preparation of the annual report, independent directors communicated with finance department, internal audit office and statutory auditor of the Company according to "Work System for Independent Directors with Regards to Annual Reports".
IV. Important comments and suggestions made by specialized committees under the Board when performing their duties during the reporting period, any disagreement should be disclosed with details. During the reporting period, the Strategic Committee of the Board held 1 conferences to mainly review important matters including the Company’s 13th “Five-year Plan” strategy, establishment of financial investment management platform and so on. The Strategic Committee, in the process of reviewing and approving the 13th
“Five-year Plan” Strategy of SAIC Motor, considered the 13th “Five-year Plan” strategy is significant to guide the Company’s future five-year development. Therefore, the Company was suggested to pay great attentions to the reorganization tendency in value chain of automotive industry and reinforce research and plan on emerging businesses.
Audit committee of the Board held 5 meetings to mainly review important matters including regularly reviewing financial reports, assessing external audit institutions, guiding internal audit work, and inspecting effectiveness of internal control. When reviewing the Report for 2015 Annual Report Audit Work from Deloitte, the audit committee proposed that it was urgent to study effects of variation tendency of domestic and foreign accounting standards on the Company’s financial statements, and try to establish an unverified fund management platform meanwhile as to reinforce financial management to overseas companies. The Company’s Nomination, Performance and Assessment convened 4 meetings to review important matters including supervising implementation of remuneration system, reviewing annual implementation scheme for incentive fund plan, reviewing senior management applications, and so on. While reviewing the Proposal to 2015 Implementation Scheme for Corporate Incentive Fund Plan, the Nomination, Performance and Assessment suggested to gradually improve incentive system of the Company to enlarge its coverage and dynamics and engage in preparation work for research for a new round incentive schemes. V. Illustration about the risks of the Company identified by board of supervisors
□Applicable √N/A

SAIC MOTOR ANNUAL REPORT 2015
- 49 -
VI. Declaration on whether the Company is independent from the controlling shareholder on
business, personnel, assets, organization and finance and whether it can keep independent operating abilities
□Applicable √N/A Resolutions, work schedules and subsequent working plan for peer rivalry □Applicable √N/A VII. The establishment and execution of evaluation and incentive system for senior
management during the reporting period √Applicable □N/A (I) Performance Assessment Plan for Management in SAIC Motor Corporation Limited is to be prepared to assess performance of senior management. (II) Board of directors approved 2015 Implementation Scheme for Incentive Fund Plan of SAIC Motor Corporation Limited, and implemented after the annual general meeting approved the annual report. VIII. If the Company release self-assessment report on internal control or not √Applicable □N/A In accordance with internal control system and evaluation method, the Company evaluated effectiveness of internal control on December 31, 2016 (reference date of internal control evaluation report) based on regular and special supervision on internal control and then drew an internal control self-assessment report. The financial statement is free from significant deficiency regarding internal control at the reference date of internal control evaluation report based on assertions made on internal control of the Company. Directors believe that the Company has successfully maintained effective internal control in all aspects in accordance with relevant requirements and internal control system of enterprise. Please refer to Internal Control Evaluation Report of SAIC Motor Corporation Limited in 2016 published on Shanghai Stock Exchange website on the same issuing day of this report for more details. Explanations of significant deficiency in internal control during the reporting period □Applicable √N/A IX. Auditors' report on internal control Deloitte Touche Tohmatsu Certified Public Accountants LLP issued "Auditors' Report on Internal Control of SAIC Motor Corporation Limited" (De Shi Bao (Shen) Zi (17) No. S00109). For details, please refer to relevant announcements of the Company. If the Company release internal control report or not:Yes X. Others □Applicable √N/A
Section X Circumstances about Corporate Bonds □Applicable √N/A

SAIC MOTOR ANNUAL REPORT 2015
- 50 -
Section XII List of Documents Available For Inspection List of Documents Available For
Inspection
Financial statements with signatures of legal person, responsible person of accounting professional and accountant in charge
List of Documents Available For
Inspection
Auditor report with signatures of accounting firm and certificated accountants
List of Documents Available For
Inspection
Announcement and document released on paper of CSRC during reporting period
Board of Directors:Chen Hong
Date of Approval by the board:April 6, 2017
Other revised information Not Applicable

SAIC MOTOR CORPORATION LIMITED
Financial Statements and Auditors’ Report For the Year Ended December 31, 2016

SAIC MOTOR CORPORATION LIMITED FINANCIAL STATEMENTS AND AUDITORS’ REPORT
For the Year Ended December 31, 2016
CONTENTS
PAGES
AUDITORS’ REPORT 1 - 2 THE CONSOLIDATED AND THE COMPANY’S BALANCE SHEETS 3 - 6 THE CONSOLIDATED AND THE COMPANY’S INCOME STATEMENTS 7 - 8 THE CONSOLIDATED AND THE COMPANY’S CASH FLOW STATEMENTS 9 - 10 THE CONSOLIDATED AND THE COMPANY’S STATEMENTS OF CHANGES IN SHAREHOLDERS’ EQUITY 11 - 14 NOTES TO THE FINANCIAL STATEMENTS 15 - 130

第 1 页
AUDITOR’S REPORT
De Shi Bao (Shen) Zi (17) No. P00888
To the shareholders of SAIC Motor Corporation Limited:
We have audited the accompanying financial statements of SAIC Motor Corporation Limited (“SAIC Motor”), which comprise the consolidated and the company’s balance sheets as of December 31, 2016, and the consolidated and the company’s income statements, the consolidated and the company’s statements of changes in shareholders’ equity and the consolidated and the company’s cash flow statements for the year then ended, and the notes to the financial statements.
1. Management’s responsibility for the financial statements
Management of SAIC Motor is responsible for the preparation and fair presentation of these financial statements. This responsibility includes: (1) preparing the financial statements in accordance with the requirements of Accounting Standards for Business Enterprises to achieve fair presentation of the financial statements. (2) designing, implementing and maintaining internal control that is necessary to enable that the financial statements are free from material misstatement, whether due to fraud or error.
2. Auditor’s responsibility
Our responsibility is to express our audit opinion on these financial statements based on our audit. We conducted our audit in accordance with China Standards on Auditing. China Standards on Auditing require that we comply with the Code of Ethics for Chinese Certified Public Accountants and plan and perform the audit to obtain reasonable assurance as to whether the financial statements are free from material misstatement.
An audit involves performing audit procedures to obtain audit evidence about the amounts and disclosures in the financial statements. The procedures selected depend on the auditors’ judgment, including the assessment of the risks of material misstatement of the financial statements, whether due to fraud or error. While making those risk assessments, the certified public accountants consider the internal control relevant to the preparation and fair presentation of the financial statements in order to design audit procedures that are appropriate in the circumstances. An audit also includes evaluating the appropriateness of accounting policies used and the reasonableness of accounting estimates made by management, as well as evaluating the overall presentation of the financial statements.
We believe that the audit evidence we have obtained is sufficient and appropriate to provide a basis for our audit opinion.

第 2 页
AUDITOR’S REPORT - continued
De Shi Bao (Shen) Zi (17) No. P00888
3. Opinion
In our opinion, the consolidated and the company’s financial statements of SAIC Motor present fairly, in all material respects, the financial position of SAIC Motor as of December 31, 2016, and the consolidated and the company’s results of operations and cash flows for the year then ended in accordance with Accounting Standards for Business Enterprises.
Deloitte Touche Tohmatsu Chinese Certified Public Accountant Certified Public Accountants LLP Yuan Shouqing Shanghai, China Ma Tiantian March 31, 2017
The auditors’ report and the accompanying financial statements are English translations of the Chinese auditors’ report and statutory financial statements prepared under accounting principles and practices generally accepted in the People’s Republic of China. These financial statements are not intended to present the financial position and results of operations and cash flows in accordance with accounting principles and practices generally accepted in other countries and jurisdictions. In case the English version does not conform to the Chinese version, the Chinese version prevails.

SAIC MOTOR CORPORATION LIMITED
第 3 页
DECEMBER 31, 2016
Consolidated Balance Sheet Unit: RMB
Item Notes December 31, 2016 December 31, 2015 Current assets: Cash and bank balances (VI)1 105,932,535,526.29 72,672,666,192.62 Financial assets at fair value through profit or loss (VI)2 1,559,753,224.57 1,221,103,619.65 Notes receivable (VI)3 30,038,463,383.46 36,273,968,771.39 Accounts receivable (VI)4 30,662,080,933.17 29,332,370,952.75 Prepayments (VI)5 20,529,658,025.70 13,388,651,691.99 Interest receivable 330,661,934.30 382,043,515.93 Dividends receivable (VI)6 1,622,991,754.82 1,597,857,015.27 Other receivables (VI)7 6,960,725,526.23 5,080,900,116.77 Financial assets purchased under resale agreements (VI)8 978,112,755.49 - Inventories (VI)9 37,039,781,805.92 37,243,441,948.98 Assets classified as held for sale - 27,459,029.83 Non-current assets due within one year (VI)10 52,837,948,607.91 29,213,526,240.21 Other current assets (VI)11 42,452,846,627.08 44,821,975,435.22 Total current assets 330,945,560,104.94 271,255,964,530.61 Non-current assets: Loans and advances (VI)12 46,220,053,713.07 34,676,090,843.68 Available-for-sale financial assets (VI)13 50,484,749,497.34 65,495,009,648.25 Long-term receivables (VI)14 1,957,243,976.67 801,879,818.41 Long-term equity investments (VI)15 62,677,189,671.79 59,019,671,405.86 Investment properties (VI)16 2,546,831,984.39 2,684,961,353.45 Fixed assets (VI)17 47,053,906,445.66 38,690,585,922.68 Construction in progress (VI)18 13,266,057,505.24 11,856,268,860.79 Intangible assets (VI)19 10,794,050,663.91 8,360,918,797.39 Development expenditure (VI)20 2,391,298.20 4,298,394.04 Goodwill (VI)21 668,658,526.45 463,459,170.13 Long-term deferred expenses (VI)22 1,542,669,098.09 1,286,897,910.97 Deferred tax assets (VI)23 20,852,244,252.47 16,991,606,228.73 Other non-current assets (VI)24 1,616,530,785.83 1,368,345,230.79 Total non-current assets 259,682,577,419.11 241,699,993,585.17 TOTAL ASSETS 590,628,137,524.05 512,955,958,115.78

SAIC MOTOR CORPORATION LIMITED
第 4 页
DECEMBER 31, 2016
Consolidated Balance Sheet - Continued Unit: RMB
Item Notes December 31, 2016 December 31, 2015 Current liabilities: Short-term borrowings (VI)25 8,728,150,584.10 4,908,346,545.97 Customer deposits and deposits from banks and other
financial institutions (VI)26 43,145,588,464.38 44,384,484,259.05
Loans from banks and other financial institutions (VI)27 27,400,000,000.00 23,429,657,800.31 Financial liabilities at fair value through profit or loss (VI)28 - 7,486,291.00 Notes payable (VI)29 11,740,912,162.92 7,282,802,230.82 Accounts payable (VI)30 104,730,635,798.55 99,034,578,618.58 Receipts in advance (VI)31 22,675,737,991.07 18,317,063,798.28 Financial assets sold under repurchase agreements 49,999,900.00 - Employee benefits payable (VI)32 10,154,726,765.87 8,406,294,056.51 Taxes payable (VI)33 13,913,799,886.15 8,692,447,359.26 Interest payable 445,071,370.07 230,220,570.51 Dividends payable (VI)34 255,265,008.62 448,541,726.94 Other payables (VI)35 45,367,709,948.89 38,646,826,463.17 Non-current liabilities due within one year (VI)36 8,673,620,748.14 4,974,248,176.38 Other current liabilities (VI)37 200,154,593.51 230,091,563.68 Total current liabilities 297,481,373,222.27 258,993,089,460.46 Non-current liabilities: Long-term borrowings (VI)38 4,285,992,305.58 1,398,811,144.23 Bonds payable (VI)39 14,160,128,076.50 8,208,109,400.04 Long-term payable 184,416,188.05 12,010,354.00 Long-term employee benefits payable (VI)40 6,309,621,019.47 6,018,478,333.05 Special payable (VI)41 824,105,091.72 902,125,492.72 Provisions (VI)42 12,238,453,168.78 9,869,134,713.81 Deferred income (VI)43 17,836,094,586.61 13,803,658,069.28 Deferred tax liabilities (VI)23 2,211,579,861.31 2,833,255,427.98 Total non-current liabilities 58,050,390,298.02 43,045,582,935.11 TOTAL LIABILITIES 355,531,763,520.29 302,038,672,395.57 SHAREHOLDERS' EQUITY: Share capital (VI)44 11,025,566,629.00 11,025,566,629.00 Capital reserve (VI)45 39,807,249,252.90 38,939,769,815.73 Other comprehensive income (VI)46 9,966,472,713.03 10,916,793,233.73 Special reserve 335,356,348.86 275,789,416.38 Surplus reserve (VI)47 32,254,579,593.08 26,728,261,764.70 General risk reserve 1,738,792,163.43 844,919,712.17 Retained earnings (VI)48 96,792,960,860.43 86,397,638,086.22 Total shareholders’ equity attributable to
shareholders of the Company 191,920,977,560.73 175,128,738,657.93
Minority interests 43,175,396,443.03 35,788,547,062.28 TOTAL SHAREHOLDERS’ EQUITY 235,096,374,003.76 210,917,285,720.21 TOTAL LIABILITIES AND SHAREHOLDERS’
EQUITY 590,628,137,524.05 512,955,958,115.78
The accompanying notes form part of the financial statements.
The financial statements on pages 3 to 130 were signed by the following:
Head of the Company Chief Financial Officer Head of Accounting Department
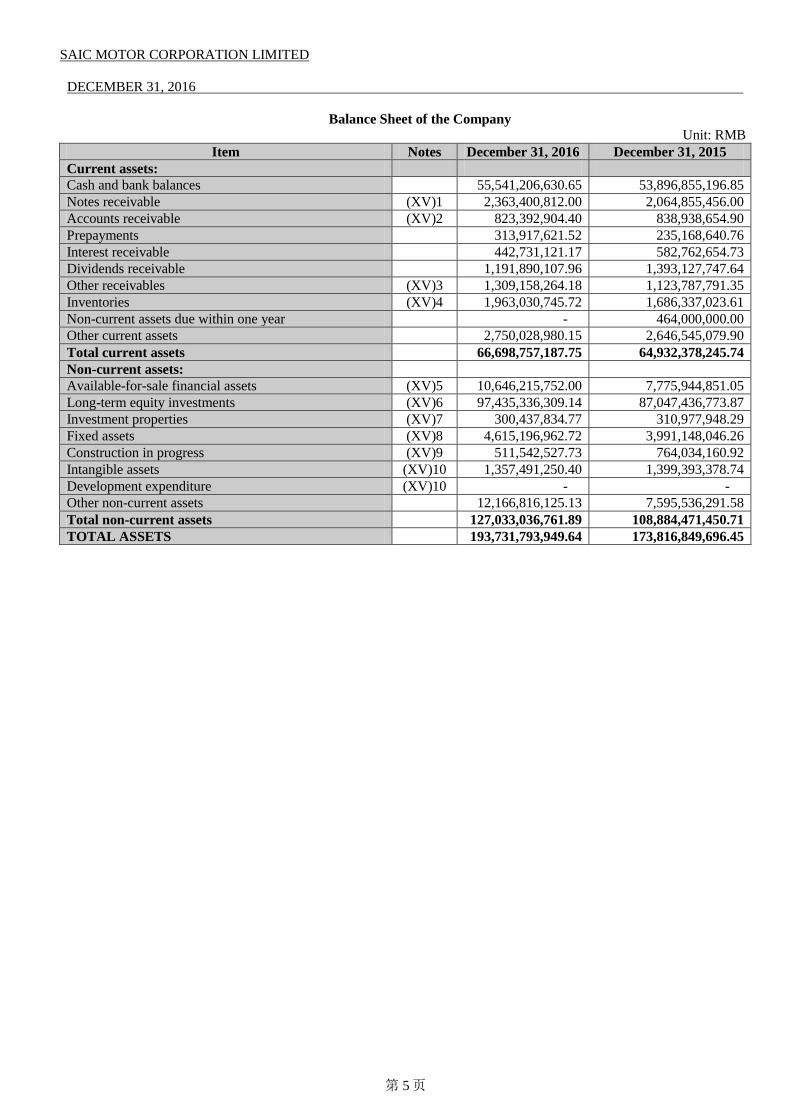
SAIC MOTOR CORPORATION LIMITED
第 5 页
DECEMBER 31, 2016
Balance Sheet of the Company Unit: RMB
Item Notes December 31, 2016 December 31, 2015 Current assets: Cash and bank balances 55,541,206,630.65 53,896,855,196.85 Notes receivable (XV)1 2,363,400,812.00 2,064,855,456.00 Accounts receivable (XV)2 823,392,904.40 838,938,654.90 Prepayments 313,917,621.52 235,168,640.76 Interest receivable 442,731,121.17 582,762,654.73 Dividends receivable 1,191,890,107.96 1,393,127,747.64 Other receivables (XV)3 1,309,158,264.18 1,123,787,791.35 Inventories (XV)4 1,963,030,745.72 1,686,337,023.61 Non-current assets due within one year - 464,000,000.00 Other current assets 2,750,028,980.15 2,646,545,079.90 Total current assets 66,698,757,187.75 64,932,378,245.74 Non-current assets: Available-for-sale financial assets (XV)5 10,646,215,752.00 7,775,944,851.05 Long-term equity investments (XV)6 97,435,336,309.14 87,047,436,773.87 Investment properties (XV)7 300,437,834.77 310,977,948.29 Fixed assets (XV)8 4,615,196,962.72 3,991,148,046.26 Construction in progress (XV)9 511,542,527.73 764,034,160.92 Intangible assets (XV)10 1,357,491,250.40 1,399,393,378.74 Development expenditure (XV)10 - - Other non-current assets 12,166,816,125.13 7,595,536,291.58 Total non-current assets 127,033,036,761.89 108,884,471,450.71 TOTAL ASSETS 193,731,793,949.64 173,816,849,696.45

SAIC MOTOR CORPORATION LIMITED
第 6 页
DECEMBER 31, 2016
Balance sheet of the Company - Continued Unit: RMB
Item Notes December 31, 2016 December 31, 2015 Current liabilities: Short-term borrowings 500,000,000.00 - Accounts payable 15,855,274,854.57 10,077,574,279.58 Receipts in advance 1,388,133,388.31 1,383,138,953.65 Employee benefits payable (XV)11 2,526,191,281.11 2,036,723,433.58 Taxes payable 532,019,418.47 81,819,053.93 Other payables 1,855,010,583.86 2,226,473,576.34 Non-current liabilities due within one year (XV)12 569,797,570.00 249,019,844.71 Total current liabilities 23,226,427,096.32 16,054,749,141.79 Non-current liabilities: Long-term employee benefits payable (XV)13 3,729,383,850.39 3,339,937,865.69 Special payables (XV)14 822,960,091.72 863,767,352.72 Provisions (XV)15 1,342,327,510.96 1,238,399,125.71 Deferred income (XV)16 527,301,786.46 486,400,776.62 Deferred tax liabilities (XV)17 402,317,976.24 421,477,341.10 Total non-current liabilities 6,824,291,215.77 6,349,982,461.84 TOTAL LIABILITIES 30,050,718,312.09 22,404,731,603.63 SHAREHOLDERS’ EQUITY: Share capital 11,025,566,629.00 11,025,566,629.00 Capital reserve (XV)18 50,924,492,456.98 50,924,492,456.98 Other comprehensive income (XV)19 2,827,492,771.52 3,195,353,753.27 Surplus reserve 32,254,579,593.08 26,728,261,764.70 Retained earnings 66,648,944,186.97 59,538,443,488.87 TOTAL SHAREHOLDERS’ EQUITY 163,681,075,637.55 151,412,118,092.82 TOTAL LIABILITIES AND SHAREHOLDERS’
EQUITY 193,731,793,949.64 173,816,849,696.45
The accompanying notes form part of the financial statements.

SAIC MOTOR CORPORATION LIMITED
第 7 页
DECEMBER 31, 2016
Consolidated Income Statement Unit: RMB
Item Notes Year Ended December 31, 2016
Year Ended December 31, 2015
I. Total operating income 756,416,165,065.29 670,448,223,139.34 Including: Operating income (VI)49 746,236,741,228.56 661,373,929,792.65 Interest income (VI)50 9,117,963,901.15 8,295,161,232.11 Fee and commission income (VI)51 1,061,459,935.58 779,132,114.58 Less: Total operating costs 738,563,673,025.25 656,253,568,393.27 Including: Operating costs (VI)49 650,218,105,936.37 585,832,883,216.26 Interest expenses (VI)50 2,118,097,016.20 2,347,899,980.15 Fee and commission expenses (VI)51 67,820,339.84 44,605,113.33 Taxes and levies (VI)52 7,520,718,033.98 6,544,198,929.46 Selling expenses (VI)53 47,503,416,645.57 35,537,515,509.27 Administrative expenses (VI)54 28,258,363,189.63 23,329,485,273.44 Financial expenses (VI)55 (332,319,541.95) (231,192,097.17) Impairment losses of assets (VI)56 3,209,471,405.61 2,848,172,468.53 Add: Gain (loss) from changes in fair values (VI)57 (10,023,468.92) (285,516,870.56) Investment income (VI)58 30,572,263,291.07 29,663,134,420.97 Including: Income from investments in associates and JCEs 27,751,499,506.33 26,631,281,828.54 Foreign exchange gains 18,271,097.34 15,758,109.29 II. Operating Profit 48,433,002,959.53 43,588,030,405.77 Add: Non-operating income (VI)59 3,313,765,181.06 3,666,663,216.93 Including: Gains from disposal of non-current assets 369,860,085.83 130,869,909.39 Less: Non-operating expenses (VI)60 1,254,310,678.05 1,445,017,136.44 Including: Losses from disposal of non-current assets 216,270,785.25 385,789,730.40 III. Total profit 50,492,457,462.54 45,809,676,486.26 Less: Income tax expenses (VI)61 6,530,495,764.20 5,735,707,263.02 IV. Net profit 43,961,961,698.34 40,073,969,223.24 Net profit attributable to shareholders of the Company 32,008,610,688.65 29,793,790,723.65 Profit or loss attributable to minority interests 11,953,351,009.69 10,280,178,499.59 V. Other comprehensive income (loss), net of tax (VI)62 (1,004,780,036.58) 1,041,372,544.12 Other comprehensive income (loss) attributable to shareholders of the
Company (950,320,520.70) 1,213,297,812.07
1.Other comprehensive income(loss) that will not be reclassified subsequently to profit or loss (326,278,439.57) (223,640,942.42)
(1) Changes in net liabilities or net assets due to remeasurement of defined benefit plans (325,208,427.95) (213,487,736.64)
(2) Shares of other comprehensive income that will not be reclassified subsequently to profit or loss of invested entities under equity method (1,070,011.62) (10,153,205.78)
2.Other comprehensive income that may be reclassified subsequently to profit or loss (624,042,081.13) 1,436,938,754.49
(1) Shares of other comprehensive income that may be reclassified subsequently to profit or loss of invested entities under equity method in future 85,449,035.00 19,984,713.86
(2) Changes in fair value of available-for-sale financial assets (1,335,080,324.33) 1,059,919,194.99 (3) Exchange differences arising on translating 625,589,208.20 357,034,845.64
Other comprehensive income (loss) attributable to minority shareholders, net of tax (54,459,515.88) (171,925,267.95)
VI. Total comprehensive income 42,957,181,661.76 41,115,341,767.36 Total comprehensive income attributable to shareholders of the
Company 31,058,290,167.95 31,007,088,535.72
Total comprehensive income attributable to minority shareholders 11,898,891,493.81 10,108,253,231.64 VII. Earnings per share (I) Basic earnings per share 2.903 2.702 (II) Diluted earnings per share Not applicable Not applicable The accompanying notes form part of the financial statements.

SAIC MOTOR CORPORATION LIMITED
第 8 页
DECEMBER 31, 2016
Income Statement of the Company Unit: RMB
Item Notes Year Ended December 31, 2016
Year Ended December 31, 2015
I. Operating income (XV)20 33,523,982,028.22 17,007,469,320.41 Less: Operating costs (XV)20 27,908,021,210.00 15,638,660,056.78 Taxes and levies 713,154,833.78 400,441,079.30 Selling expenses 4,229,523,960.44 2,643,246,645.61 Administrative expenses 6,759,056,672.18 5,889,424,398.40 Financial expenses (1,232,286,841.92) (1,323,292,047.16) Impairment losses of assets (XV)21 246,009,777.41 1,120,503,033.68 Add: Investment income (XV)22 32,446,515,522.96 30,934,319,046.09
Including: Income from investments in associates and JCEs 23,046,941,236.04 22,024,257,822.65
II. Operating profit 27,347,017,939.29 23,572,805,199.89 Add: Non-operating income 337,895,705.32 1,083,785,133.86
Including: Gains from disposal of non-current assets 18,639.48 185,123,580.06
Less: Non-operating expenses 53,324,502.69 196,091,048.97 Including: Losses from disposal of non-current assets 1,086,187.34 6,338,958.38
III. Total profit 27,631,589,141.92 24,460,499,284.78 Less: Income tax expenses - - IV. Net Profit 27,631,589,141.92 24,460,499,284.78 V. Other comprehensive income (loss), net of tax (367,860,981.75) 430,237,141.74
(I) Other comprehensive income (loss) that will not be reclassified subsequently to profit or loss (334,724,093.58) (113,665,129.31)
1.Changes in net liabilities or net assets due to remeasurement of defined benefit plans (334,724,093.58) (113,665,129.31)
(II) Other comprehensive income (loss) that may be reclassified subsequently to profit or loss (33,136,888.17) 543,902,271.05
1. Shares of other comprehensive income that may be reclassified subsequently to profit or loss of invested entities under equity method in future
75,432,846.02 29,672,456.00
2. Changes in fair value of available-for-sale financial assets (108,569,734.19) 514,229,815.05
VI. Total comprehensive income 27,263,728,160.17 24,890,736,426.52 The accompanying notes form part of the financial statements.

SAIC MOTOR CORPORATION LIMITED
第 9 页
YEAR ENDED DECEMBER 31, 2016
Consolidated Cash Flow Statement Unit: RMB
Item Notes Year Ended December 31, 2016
Year Ended December 31, 2015
I. Cash flow from operating activates: Cash receipts from the sale of goods and rendering of services 891,624,152,917.55 755,958,174,719.75 Net increase in customer deposits and deposits from bank and other financial institutions - 112,553,683.71
Net decrease in balance with the central bank - 6,313,425,501.05 Cash receipts from interests, fees and commissions 12,137,954,947.50 10,165,188,014.62 Net increase in taking from banks and other financial institutions 3,970,342,199.69 - Receipts of tax refunds 315,804,729.84 469,468,307.74 Other cash receipts relating to operating activities 3,430,186,492.66 3,614,956,863.82 Sub-total of cash inflow from operating activities 911,478,441,287.24 776,633,767,090.69 Cash payments for goods purchased and services received 771,545,924,735.73 659,768,302,155.44 Net decrease in Customer deposits and deposits from banks and other financial institutions 1,164,823,240.27 -
Net decrease in financial assets sold under repurchase arrangements 928,112,855.49 - Net increase in balance with the central bank 285,558,383.51 - Net increase in loans and advances 34,100,724,650.15 3,591,474,452.80 Net decrease in loans from banks and other financial institutions - 10,786,444,397.74 Cash payments for interests, fees and commissions 1,873,216,942.67 2,688,009,640.71 Cash payments to and on behalf of employees 27,911,567,005.55 18,541,620,374.81 Payments for various types of taxes 31,307,759,251.02 22,773,045,906.76 Other payments relating to operating activities 30,983,820,406.80 32,492,295,246.13 Sub-total of cash outflow relating to operating 900,101,507,471.19 750,641,192,174.39 Net cash flow from operating activities (VI)65 11,376,933,816.05 25,992,574,916.30 II. Cash flow from investing activities: Cash receipts from recovery of investments 305,428,704,452.85 22,600,221,585.81 Cash receipts from investment income 28,538,886,862.19 28,389,009,121.72 Net cash receipts from disposals of fixed assets, intangible assets and
other long-term assets 1,311,241,931.48 571,074,171.25
Other cash receipts relating to investing activities 1,953,383,592.77 3,815,669,522.46 Sub-total of cash inflow from investing activities 337,232,216,839.29 55,375,974,401.24 Cash payment to acquire or construct fixed assets, intangible assets
and other long-term assets 17,266,516,975.29 15,426,903,859.94
Cash payments to acquire investments 293,036,078,827.77 51,491,759,050.83 Net cash payments for acquisitions of subsidiaries 474,280,676.67 2,194,171,772.81 Net cash payments for disposal of subsidiaries 18,836,661.92 - Sub-total of cash outflow relating to investing activities 310,795,713,141.65 69,112,834,683.58 Net Cash flow from investing activities 26,436,503,697.64 (13,736,860,282.34) III. Cash flow from financing activities: Cash receipts from capital contributions 5,514,889,666.09 1,006,657,925.94 Including: cash receipts from capital contributions from minority
shareholders of subsidiaries 5,514,889,666.09 1,006,657,925.94
Cash receipts from borrowings 12,741,532,471.17 7,666,107,288.01 Cash receipts from bonds issuance 13,821,280,926.40 6,280,000,000.00 Sub-total of cash inflow from financing activities 32,077,703,063.66 14,952,765,213.95 Cash repayments of borrowings 12,469,531,734.73 13,498,299,173.08 Cash payments for distribution of dividends or profits or settlement
of interest expenses 24,753,281,341.06 23,210,888,620.20
Including: payments for distribution of dividends or profit to minority shareholders of subsidiaries 9,225,573,030.82 8,333,152,753.30
Other cash payments relating to financing activities (VI)64 996,638,269.11 600,447,044.62 Sub-total of cash outflow relating to financing activities 38,219,451,344.90 37,309,634,837.90 Net cash flow from financing activities (6,141,748,281.24) (22,356,869,623.95) IV. Effect of foreign exchange rate changes on cash and cash
equivalents 305,983,448.60 137,133,961.98
V. Net increase (decrease) in cash and cash equivalents 31,977,672,681.05 (9,964,021,028.01) Add: Opening balance of cash and cash equivalents (VI)65 62,107,494,271.45 72,071,515,299.46 VI. Closing balance of cash and cash equivalents (VI)65 94,085,166,952.50 62,107,494,271.45 The accompanying notes form part of the financial statements.

SAIC MOTOR CORPORATION LIMITED
第 10 页
YEAR ENDED DECEMBER 31, 2016
Cash Flow Statement of the Company Unit: RMB
Item Notes Year Ended December 31, 2016
Year Ended December 31, 2015
I. Cash flow from operating activities: Cash receipts from the sale of goods and rendering of services 38,052,265,317.38 20,231,228,325.19 Other cash receipts relating to operating activities 1,615,152,421.88 2,256,750,827.09 Sub-total cash inflow from operating activities 39,667,417,739.26 22,487,979,152.28 Cash payments for goods purchased and services rendered 26,343,886,833.35 14,628,684,928.65 Cash payments to and on behalf of employees 2,986,336,223.28 2,585,902,282.17 Payments of various types of taxes 660,325,762.55 410,716,525.43 Other cash payments relating to operating activities 7,472,027,086.69 5,416,433,825.44 Sub-total cash outflow relating to operating activities 37,462,575,905.87 23,041,737,561.69 Net Cash Flow from operating activities (XV)23 2,204,841,833.39 (553,758,409.41) II. Cash flow from investing activities: Cash receipts from recovery of investments 2,945,752,541.99 19,369,926,200.00 Cash receipts from investment income 31,807,110,514.17 31,470,475,554.14 Net cash receipts from disposal of fixed assets, intangible assets
and other long-term assets 1,681,364.30 31,665,317.37
Sub-total cash flow from investing activities 34,754,544,420.46 50,872,067,071.51 Cash payments to acquire or construct fixed assets, intangible
assets and other long-term assets 1,307,500,251.65 1,451,389,278.50
Cash payments to acquire investments 19,503,644,942.77 26,294,694,437.62 Sub-total cash outflow relating to investing activities 20,811,145,194.42 27,746,083,716.12 Net cash flow from investing activities 13,943,399,226.04 23,125,983,355.39 III. Cash flow from financing activities Cash receipts from borrowings 500,000,000.00 - Sub-total cash inflow from financing activities 500,000,000.00 - Cash payments for distribution of dividends or profits or settlement
of interest expenses 14,994,770,615.44 14,333,236,617.70
Sub-total cash outflow relating to financing activities 14,994,770,615.44 14,333,236,617.70 Net Cash flow from financing activities (14,494,770,615.44) (14,333,236,617.70) IV. Effect of foreign exchange rate on cash and cash equivalents (9,119,010.19) 2,659,720.89
V. Net Increase in cash and cash equivalents 1,644,351,433.80 8,241,648,049.17 Add: Opening balance of cash and cash equivalents (XV)23 53,896,855,196.85 45,655,207,147.68 VI. Closing Balance of cash and cash equivalents (XV)23 55,541,206,630.65 53,896,855,196.85 The accompanying notes form part of the financial statements.

SAIC MOTOR CORPORATION LIMITED
第 11 页
YEAR ENDED DECEMBER 31, 2016
Consolidated Statement of Changes in Shareholders’ Equity Unit: RMB
Item
Shareholders’ equity attributable to shareholders of the Company Minority interests
Total shareholders'
equity Share capital Capital reserve Other
comprehensive income
Special reserve Surplus reserve General risks
reserve Retained earnings Sub-total
Balance as of January 1, 2016 11,025,566,629.00 38,939,769,815.73 10,916,793,233.73 275,789,416.38 26,728,261,764.70 844,919,712.17 86,397,638,086.22 175,128,738,657.93 35,788,547,062.28 210,917,285,720.21 Changes during the year - 867,479,437.17 (950,320,520.70) 59,566,932.48 5,526,317,828.38 893,872,451.26 10,395,322,774.21 16,792,238,902.80 7,386,849,380.75 24,179,088,283.55 (I) Total comprehensive income - - (950,320,520.70) - - - 32,008,610,688.65 31,058,290,167.95 11,898,891,493.81 42,957,181,661.76 (II) owners’ contribution - - - - - - - - 5,688,827,866.09 5,688,827,866.09 (III) Profit distribution - 691,909.88 - - 5,526,317,828.38 893,872,451.26 (21,613,287,914.44) (15,192,405,724.92) (9,261,927,816.53) (24,454,333,541.45) 1. Appropriation of surplus reserve - - - - 5,526,317,828.38 - (5,526,317,828.38) - - - 2. Distribution to shareholders - - - - - - (14,994,770,615.44) (14,994,770,615.44) (9,032,296,312.50) (24,027,066,927.94) 3. Appropriation to general risk reserve - - - - - 893,872,451.26 (893,872,451.26) - - - 4. Others - 691,909.88 - - - - (198,327,019.36) (197,635,109.48) (229,631,504.03) (427,266,613.51) (IV) Special reserve - - - 59,566,932.48 - - - 59,566,932.48 9,619,037.82 69,185,970.30 1.Provision for special reserve - - - 89,562,781.54 - - - 89,562,781.54 24,589,881.36 114,152,662.90 2.Use of special reserve - - - (29,995,849.06) - - - (29,995,849.06) (14,970,843.54) (44,966,692.60) (V) Others - 866,787,527.29 - - - - - 866,787,527.29 (948,561,200.44) (81,773,673.15) 1. Changes due to changes in the scope
of consolidation during the year - - - - - - - - 16,719,684.40 16,719,684.40
2. Changes due to changes of proportion of capital contribution to subsidiaries during the year
- 811,774,445.98 - - - - - 811,774,445.98 (853,410,425.98) (41,635,980.00)
3. Others - 55,013,081.31 - - - - - 55,013,081.31 (111,870,458.86) (56,857,377.55) Balance as of December 31, 2016 11,025,566,629.00 39,807,249,252.90 9,966,472,713.03 335,356,348.86 32,254,579,593.08 1,738,792,163.43 96,792,960,860.43 191,920,977,560.73 43,175,396,443.03 235,096,374,003.76

SAIC MOTOR CORPORATION LIMITED
第 12 页
YEAR ENDED DECEMBER 31, 2016
Consolidated Statement of Changes in Shareholders’ Equity - Continued Unit: RMB
Item
Shareholders’ equity attributable to shareholders of the Company
Minority interests Total
shareholders' equity Share capital Capital reserve
Other comprehensive
income Special reserve Surplus reserve
General risks reserve
Retained earnings Sub-total
Balance as of January 1, 2015 11,025,566,629.00 37,986,599,121.54 9,703,495,421.66 181,962,263.44 21,836,161,907.74 844,919,712.17 76,085,680,916.97 157,664,385,972.52 27,334,691,042.39 184,999,077,014.91 Changes during the year - 953,170,694.19 1,213,297,812.07 93,827,152.94 4,892,099,856.96 - 10,311,957,169.25 17,464,352,685.41 8,453,856,019.89 25,918,208,705.30 (I) Total comprehensive income - - 1,213,297,812.07 - - - 29,793,790,723.65 31,007,088,535.72 10,108,253,231.64 41,115,341,767.36 (II) Owners’ contribution - - - - - - - - 731,025,925.94 731,025,925.94 (III) Profit distribution - 1,641,152.55 - - 4,892,099,856.96 - (19,481,833,554.40) (14,588,092,544.89) (8,899,227,681.13) (23,487,320,226.02) 1. Appropriation of surplus reserve - - - - 4,892,099,856.96 - (4,892,099,856.96) - - - 2. Distribution to shareholders - - - - - - (14,333,236,617.70) (14,333,236,617.70) (8,644,162,539.85) (22,977,399,157.55) 3. Others - 1,641,152.55 - - - - (256,497,079.74) (254,855,927.19) (255,065,141.28) (509,921,068.47) (IV) Special reserve - - - 93,827,152.94 - - - 93,827,152.94 (190,588.71) 93,636,564.23 1.Provision for special reserve - - - 96,313,710.21 - - - 96,313,710.21 3,364,228.93 99,677,939.14 2.Use of special reserve - - - (2,486,557.27) - - - (2,486,557.27) (3,554,817.64) (6,041,374.91) (V) Others - 951,529,541.64 - - - - - 951,529,541.64 6,513,995,132.15 7,465,524,673.79 1. Changes due to changes in the
scope of consolidation during the year
- - - - - - - - 4,718,647,016.24 4,718,647,016.24
2. Changes due to changes of proportion of capital contribution to subsidiaries during the year
- 938,708,711.25 - - - - - 938,708,711.25 1,789,807,776.81 2,728,516,488.06
3. Others - 12,820,830.39 - - - - - 12,820,830.39 5,540,339.10 18,361,169.49 Balance as of December 31, 2015 11,025,566,629.00 38,939,769,815.73 10,916,793,233.73 275,789,416.38 26,728,261,764.70 844,919,712.17 86,397,638,086.22 175,128,738,657.93 35,788,547,062.28 210,917,285,720.21

SAIC MOTOR CORPORATION LIMITED
第 13 页
YEAR ENDED DECEMBER 31, 2016
Statement of Changes in Shareholders’ Equity of the Company Unit: RMB
Item Share capital Capital reserve Other comprehensive income Surplus reserve Retained earnings Total shareholders’
equity Balance as of January 1, 2016 11,025,566,629.00 50,924,492,456.98 3,195,353,753.27 26,728,261,764.70 59,538,443,488.87 151,412,118,092.82 Changes during the year - - (367,860,981.75) 5,526,317,828.38 7,110,500,698.10 12,268,957,544.73 (I) Total comprehensive income - - (367,860,981.75) - 27,631,589,141.92 27,263,728,160.17 (II) Profit distribution - - - 5,526,317,828.38 (20,521,088,443.82) (14,994,770,615.44) 1. Appropriation of surplus reserve - - - 5,526,317,828.38 (5,526,317,828.38) - 2. Distribution to shareholders - - - - (14,994,770,615.44) (14,994,770,615.44) Balance as of December 31, 2016 11,025,566,629.00 50,924,492,456.98 2,827,492,771.52 32,254,579,593.08 66,648,944,186.97 163,681,075,637.55

SAIC MOTOR CORPORATION LIMITED
第 14 页
YEAR ENDED DECEMBER 31, 2016
Statement of Changes in Shareholders’ Equity of the Company - Continued Unit: RMB
Item Share capital Capital reserve Other
comprehensive income
Surplus reserve Retained earnings Total shareholders’ equity
Balance as of January 1, 2015 11,025,566,629.00 50,924,492,456.98 2,765,116,611.53 21,836,161,907.74 54,303,280,678.75 140,854,618,284.00 Changes during the year - - 430,237,141.74 4,892,099,856.96 5,235,162,810.12 10,557,499,808.82 (I) Total comprehensive income - - 430,237,141.74 - 24,460,499,284.78 24,890,736,426.52 (II) Profit distribution - - - 4,892,099,856.96 (19,225,336,474.66) (14,333,236,617.70) 1. Appropriation of surplus reserve - - - 4,892,099,856.96 (4,892,099,856.96) - 2. Distribution to shareholders - - - - (14,333,236,617.70) (14,333,236,617.70) Balance as of December 31, 2015 11,025,566,629.00 50,924,492,456.98 3,195,353,753.27 26,728,261,764.70 59,538,443,488.87 151,412,118,092.82

SAIC MOTOR CORPORATION LIMITED NOTES TO THE FINANCIAL STATEMENTS YEAR ENDED DECEMBER 31, 2016
第 15 页
I. GENERAL
SAIC Motor Corporation Limited (hereinafter referred to as the “Company”) is a stock limited company exclusively initiated by Shanghai Automotive Industry Corporation (Group) (hereinafter referred to as “SAIC”) as approved by [1997] No.41 issued by Shanghai Municipal People’s Government and by Hu Zheng Si [1997] No.104 issued by Shanghai Securities Management Office in August, 1997. The Company received the legal entity business license with Registration No. 310000000000840, and the operating period is infinite. On November 7, 1997, as approved by China Securities Regulatory Commission (hereinafter referred to as “CSRC”) with Zheng Jian Fa Zi [1997] No. 500, the Company issued the domestic shares that are listed in China (A Share) to the public for trading in the market, with the stock code of 600104. After the establishment, the Company has undertaken quite a few equity transactions. As of January 1, 2011, the Company’s total share capital was RMB 9,242,421,691.00, in 9,242,421,691 shares, of which SAIC held 6,742,713,768 shares, accounting for 72.95% of the total shares, Yuejin Motor Group Corporation (hereinafter referred to as “Yuejin”) held 468,398,580 shares, accounting for 5.07% of the total shares, and remaining shares held by the public were 2,031,309,343 shares, accounting for 21.98% of the total shares. On April 1, 2011, “Proposal of Assets Acquisition through Share Issue and Related Party Transactions of SAIC Motor Corporation Limited” was approved by the 4th session of the board of the Company on the 26th board meeting and the Company is approved to acquire assets from SAIC and Shanghai Automotive Industry Co., Ltd. (hereinafter referred to as “SAIC Ltd”) through issuing shares to SAIC and SAIC Ltd. According to “Assets Acquisition through Share Issue Agreement” entered into between the Company, SAIC and SAIC Ltd on April 1, 2011, the Company was to issue shares to SAIC and SAIC Ltd to acquire assets and equity investments related to business of independent supply of auto parts, automotive service and trading and new energy automotive owned by SAIC and SAIC Ltd (hereinafter referred to as “2011 Restructuring”). On May 11, 2011, “Proposal of Assets Acquisition through Share Issue and Related Party Transaction of the Company” and “Proposal of Signing 'Supplement Agreement of Assets Acquisition through Share Issue” were approved by the 4th session of the board of the Company on the 29th meeting. The Company, SAIC and SAIC Ltd signed Supplemental Agreement of Assets Acquisition through Share Issue on the same day. On May 20, 2011, Shanghai SASAC approved 2011 Restructuring with “Approval of the Nonpublic Issue of Shares of SAIC Motor Corporation Limited” (Hu Guo Zi Wei Chan Quan [2011] No. 187). On May 27, 2011, “Proposal of Assets Acquisition through Share Issue and Related Party Transaction” and “Proposal of Signing ‘Assets Acquisition through Share Issue Agreement’ and ‘Supplemental Agreement of Assets Acquisition through Share Issue’” were approved by the second temporary general meeting of shareholders of 2011. On September 9, 2011, CSRS approved 2011 Restructuring with “Approval of Assets Acquisition through Share Issue” (Zheng Jian Xu Ke [2011] No. 1431). On December 13, 2011, the Company signed “Delivery Memorandum” with SAIC and SAIC Ltd, and completed the delivery of assets of 2011 restructuring on the same day. On December 27, 2011, the Company completed the issue of 1,783,144,938 shares, including 1,448,736,163 shares issued to SAIC and 334,408,775 shares issued to SAIC Ltd. On December 28, 2011, the Company received the Security Change Registration Certificate issued by Shanghai Branch of China Security Depository and Clearing Corporation Limited for the above share issue. After 2011 Restructuring, the Company had 11,025,566,629 shares in issue, with share capital of RMB 11,025,566,629.00, of which SAIC held 8,191,449,931 shares, accounting for 74.30% of the total shares, Yuejin held 468,398,580 shares, accounting for 4.25% of the total shares, SAIC Ltd held 334,408,775 shares, accounting for 3.03% of the total shares, and other public shareholders held 2,031,309,343 shares, accounting for 18.42% of the total shares. During the year of 2012, Yuejin had transferred 54,479,439 shares of the Company.
On February 12, 2015, SAIC Ltd. reached a gratuitous transfer of state-owned equity interest agreement with Shanghai International Group Ltd (hereinafter referred to as “SIG”) to transfer 334,408,775 shares of the Company to SIG. In April 2015, Shanghai SASAC approved the transfer with “Approval of the Gratuitous Transfer of Shares of SAIC Motor Corporation Limited held by Shanghai Automotive Industry Co., Ltd.” (Hu Guo Zi Wei Chan Quan [2015] No. 88). The share transfer procedure was completed on May 7, 2015 in the China Securities Depository and Clearing Co., Ltd. Shanghai Branch. After the transfer, the Company still had 11,025,566,629 shares in issue, of which SAIC held 8,191,449,931 shares, accounting for 74.30% of the total shares, SIG held 334,408,775 shares, accounting for 3.03% of the total shares. During the year, SIG reduced 137,396,429 shares of the Company accumulatively.

SAIC MOTOR CORPORATION LIMITED NOTES TO THE FINANCIAL STATEMENTS YEAR ENDED DECEMBER 31, 2016
第 16 页

SAIC MOTOR CORPORATION LIMITED NOTES TO THE FINANCIAL STATEMENTS YEAR ENDED DECEMBER 31, 2016
第 17 页
I. GENERAL - continued As of December 31, 2016, the Company’s total share capital was RMB 11,025,566,629.00 in 11,025,566,629 shares, of which SAIC held 8,191,449,931 shares, accounting for 74.30% of the total shares, Yuejin held 413,919,141 shares, accounting for 3.75% of the total shares, SIG held 197,012,346 shares, accounting for 1.79% of the total shares, and other public shareholders held 2,223,185,211 shares, accounting for 20.16% of the total shares. Business scope of the Company includes manufacturing and sales of automobiles, motorcycles, tractors and other motor vehicles, and power trains and automobile parts, domestic trading (except those under special provisions), advisory services, export of self-manufactured products and technology, import of machinery and equipment, spare parts, raw and supplementary materials, and technology needed in the business operating (except goods and technology forbidden to import and export by Chinese government), rental of cars and machinery and equipment, industrial investment, periodical publishing, advertisements in the Company’s own media, import and export business of goods and technology (Any project that requires to be approved by law can only be carried out after approval by relevant authorities). The Company’s parent company is SAIC, which is a state-owned enterprise supervised by Shanghai SASAC. Refer to Note (VIII) "interests in other entities" for details of the scope of consolidated financial statements of the year. Refer to note (VII) "Changes in the scope of consolidation" for details of changes in the scope of consolidation during the year.
II. BASIS OF PREPARATION OF FINANCIAL STATEMENTS The Company and its subsidiaries (hereinafter collectively referred to as the “Group”) adopt Accounting Standards for Business Enterprises (hereinafter referred to as “ASBE”) and other related regulations issued by the Ministry of Finance of the People’s Republic of China. In addition, the Group discloses financial information in accordance with “Information Disclosure and Preparation and Reporting Rules for Companies Offering Securities to the Public No. 15 - General Provisions on Financial Reporting (Revised in 2014)”.
III. SIGNIFICANT ACCOUNTING POLICIES AND ACCOUNTING ESTIMATES
1. Statement of compliance with ASBE The financial statements of the Company have been prepared in accordance with ASBE, and present truly and completely, the consolidated and the Company’s financial position as of December 31, 2016, and the consolidated and the Company’s results of operations and cash flows for the year then ended. 2. Basis of accounting and principle of measurement The Group has adopted the accrual basis of accounting. Except for certain financial instruments which are measured at fair value, the Company has adopted the historical cost as the principle of measurement of the financial statements. Where assets are impaired, provisions for asset impairment are made in accordance with relevant requirements. Under the basis of historical cost, assets are measured by amount of cash or cash equivalents paid for purchase or fair value of paid consideration. Liabilities are measured by funds or amount of assets received by current obligation or amount of contract, or anticipated cash and cash equivalents paid for repayment of liabilities in daily routines. Fair value is the price that would be received to sell an asset or paid to transfer a liability in an orderly transaction between market participants at the measurement date, regardless of whether that price is directly observable or estimated using another valuation technique. Fair value for measurement and disclosure purposes in the financial statements is determined on such a basis.

SAIC MOTOR CORPORATION LIMITED NOTES TO THE FINANCIAL STATEMENTS YEAR ENDED DECEMBER 31, 2016
第 18 页
III. SIGNIFICANT ACCOUNTING POLICIES AND ACCOUNTING ESTIMATES - continued 2. Basis of accounting and principle of measurement - continued Fair value measurements are categorized into 3 levels based on the degree to which the inputs to the fair value measurements are observable and the significances of the inputs to the fair value measurement in its entirety, which are described as follows: • Level 1 inputs are quoted prices (unadjusted) in active markets for identical assets or liabilities that the
entity can access at the measurement date; • Level 2 inputs are inputs, other than quoted prices included within Level 1, that are observable for the asset
or liability, either directly or indirectly; and • Level 3 inputs are unobservable inputs for the asset or liability. 3. Accounting period The Group has adopted the calendar year as its accounting year, i.e. from January 1 to December 31. 4. Operating cycle Operating cycle is the period from purchasing assets for processing to realizing cash and cash equivalents. The operating cycle of the Group is usually about 12 month. 5. Functional currency Renminbi (“RMB”) is the currency of the primary economic environment in which the Company and its domestic subsidiaries operate. Therefore, the Company and its domestic subsidiaries choose RMB as their functional currency. The Company’s foreign subsidiaries determine their functional currencies in accordance with the currencies in the primary economic environment where they operate. The Group adopts RMB to prepare its financial statements. 6. Business combination and preparation of consolidated financial statements Business combinations are classified into business combinations involving enterprises under common control and business combinations not involving enterprises under common control.
6.1 Business combination involving enterprises under common control
A business combination involving enterprises under common control is a business combination in which all of the combining enterprises are ultimately controlled by the same party or parties both before and after the combination, and that control is not transitory. Assets and liabilities obtained shall be measured at their respective carrying amounts as recorded by the combining entities at the date of the combination. The difference between the carrying amount of the net assets obtained and the carrying amount of the consideration paid for the combination is adjusted to the share premium in capital reserve. If the share premium is not sufficient to absorb the difference, any excess shall be adjusted against retained earnings. Costs that are directly attributable to the combination are charged to profit or loss in the period in which they are incurred.

SAIC MOTOR CORPORATION LIMITED NOTES TO THE FINANCIAL STATEMENTS YEAR ENDED DECEMBER 31, 2016
第 19 页
III. SIGNIFICANT ACCOUNTING POLICIES AND ACCOUNTING ESTIMATES - continued 6. Business combination and preparation of consolidated financial statements - continued
6.2 Business combination not involving enterprises under common control and goodwill
A business combination not involving enterprises under common control is a business combination in which all of the combining enterprises are not ultimately controlled by the same party or parties before and after the combination.
The cost of combination is the aggregate of the fair values, at the acquisition date, of the assets given, liabilities incurred or assumed, and equity securities issued by the acquirer in exchange for control of the acquiree. Where a business combination not involving enterprises under common control is achieved in stages that involve multiple transactions, the cost of combination is the sum of the consideration paid at the acquisition date and the fair value at the acquisition date of the acquirer's previously held interest in the acquiree. The intermediary expenses incurred by the acquirer in respect of auditing, legal services, valuation and consultancy services, etc. and other associated administrative expenses attributable to the business combination are recognized in profit or loss when they are incurred. The acquiree’s identifiable assets, liabilities and contingent liabilities, acquired by the acquirer in a business combination, that meet the recognition criteria shall be measured at fair value at the acquisition date. Where the cost of combination exceeds the acquirer’s interest in the fair value of the acquiree’s identifiable net assets, the difference is treated as an asset and recognized as goodwill, which is measured at cost on initial recognition. Where the cost of combination is less than the acquirer’s interest in the fair value of the acquiree’s identifiable net assets, the acquirer firstly reassesses the measurement of the fair values of the acquiree's identifiable assets, liabilities and contingent liabilities and measurement of the cost of combination. If after that reassessment, the cost of combination is still less than the acquirer’s interest in the fair value of the acquiree’s identifiable net assets, the acquirer recognizes the remaining difference immediately in profit or loss for the current period. Goodwill arising on a business combination is measured at cost less accumulated impairment losses, and is presented separately in the consolidated financial statements.
6.3 Preparation of consolidated financial statements
The scope of consolidation in the consolidated financial statements is determined on the basis of control. Control is the power over the investee, exposure or rights to variable returns from its involvement with the investee, and the ability to use its power over the investee to affect the amount of the investor's returns. If changes of related facts and situations lead to changes of related elements of control, the Group will undertake reassessment. The combination of subsidiaries begins with controlling the subsidiary by the Group, and ends with the Group's losing control of the subsidiary. For a subsidiary disposed of by the Group, the operating results and cash flows before the date of disposal (the date when control is lost) are included in the consolidated income statement and consolidated statement of cash flows, as appropriate. For a subsidiary acquired through a business combination not involving enterprises under common control, the operating results and cash flows from the acquisition date (the date when control is obtained) are included in the consolidated income statement and consolidated statement of cash flows, as appropriate.

SAIC MOTOR CORPORATION LIMITED NOTES TO THE FINANCIAL STATEMENTS YEAR ENDED DECEMBER 31, 2016
第 20 页
III. SIGNIFICANT ACCOUNTING POLICIES AND ACCOUNTING ESTIMATES - continued 6. Business combination and preparation of consolidated financial statements - continued 6.3 Preparation of consolidated financial statements
- continued
No matter when the business combination occurs in the reporting period, subsidiaries acquired through a business combination involving enterprises under common control or the party being absorbed under merger by absorption are included in the Group's scope of consolidation as if they had been included in the scope of consolidation from the date when they first came under the common control of the ultimate controlling party. Their operating results and cash flows from the beginning of the earliest reporting period are included in the consolidated income statement and consolidated statement of cash flows, as appropriate. The significant accounting policies and accounting periods adopted by the subsidiaries are determined based on the uniform accounting policies and accounting periods set out by the Company. All significant intra-group balances and transactions are eliminated on consolidation. The portion of subsidiaries' equity that is not attributable to the Company is treated as minority interests and presented as "minority interests" in the consolidated balance sheet within shareholders' equity. The portion of net profits or losses of subsidiaries for the period attributable to minority shareholders is presented as "minority interests" in the consolidated income statement below the "net profit" line item. When the amount of loss for the period attributable to the minority shareholders of a subsidiary exceeds the minority shareholders' portion of the opening balance of owners' equity of the subsidiary, the excess amount are still allocated against minority interests. Acquisition of minority interests or disposal of interest in a subsidiary that does not result in the loss of control over the subsidiary is accounted for as equity transactions. The carrying amounts of the Company's interests and minority interests are adjusted to reflect the changes in their relative interests in the subsidiary. The difference between the amount by which the minority interests are adjusted and the fair value of the consideration paid or receipts is adjusted to capital reserve under shareholders' equity. If the capital reserve is not sufficient to absorb the difference, the excess are adjusted against retained earnings. For the stepwise acquisition of equity interest till acquiring control after a few transactions and leading to business combination not under common control, this should be dealt with for whether this belongs to 'package deal': if it belongs to 'a bundled transaction', transactions will be dealt as transaction to acquire control. If it does not belong to 'a bundled transaction', transactions to acquire control on acquisition date will be under accounting treatment, the fair value of acquiree's shares held before acquisition date will be revalued, and the difference between fair value and book value will be recognized in profit or loss of current period; if acquiree's shares held before acquisition date involve in changes of other comprehensive income and other equity of owners under equity method, this will be transferred to income of acquisition date. When the Group loses control over a subsidiary due to disposal of certain equity interest or other reasons, any retained interest is re-measured at its fair value at the date when control is lost. The difference between (i) the aggregate of the consideration received on disposal and the fair value of any retained interest and (ii) the share of the former subsidiary's net assets cumulatively calculated from the acquisition date according to the original proportion of ownership interest is recognized as investment income in the period in which control is lost, and goodwill is offset at the same time. Other comprehensive income associated with investment in the former subsidiary is reclassified to investment income in the period in which control is lost.

SAIC MOTOR CORPORATION LIMITED NOTES TO THE FINANCIAL STATEMENTS YEAR ENDED DECEMBER 31, 2016
第 21 页
III. SIGNIFICANT ACCOUNTING POLICIES AND ACCOUNTING ESTIMATES - continued 6. Business combination and preparation of consolidated financial statements - continued 6.3 Preparation of consolidated financial statements
- continued
When the Group loses control of a subsidiary in two or more arrangements (transactions), terms and conditions of the arrangements (transactions) and their economic effects are considered. One or more of the following indicate that the Group shall account for the multiple arrangements as a single transaction:: (i) they are entered into at the same time or in contemplation of each other; (ii) they form a single transaction designed to achieve an overall commercial effect; (iii) the occurrence of one arrangement is dependent on the occurrence of at least one other arrangement; (iv) one arrangement considered on its own is not economically justified, but it is economically justified when considered together with other arrangements. If the transactions of disposal of equity interest of a subsidiary are assessed as a single transaction, these transactions are accounted for as one transaction of disposal of a subsidiary. Before losing control, the difference of consideration received on disposal and the share of net assets of the subsidiary continuously calculated from acquisition date is recognized as other comprehensive income. When losing control, the cumulated other comprehensive income is transferred to profit or loss of the period of losing control. If the transactions of disposal of equity investment of a subsidiary are not assessed as a single transaction, these transactions are accounted for as unrelated transactions.
Special purpose trust
The Group establishes a special purpose trust (structured entity) to satisfy the need of specific businesses. The Group will assess the nature of the relationship with the special purpose trust and relevant risks and rewards to determine whether the Group has control over the special purpose trust. During the above assessment, the Group make the judgement on whether it obtains control over special purpose trust based on all relevant facts and circumstances. Once the elements involved in the definition of control changes due to changes in relevant facts and circumstances, the Group will make a reassessment. Relevant facts and circumstances include: (1) Motivation for establishing special purpose trust; (2) Activities related to the special purpose trust and how to make decisions on such activities; (3) Capabilities of the Group to dominate activities related to the special purpose trust which depends on the rights enjoyed by the Group; (4) Possibility of enjoying variable returns by participating activities related to the special purpose trust; (5) Capabilities of the Group to affect the return amount by using its power on the invested entities; (6) Relationship between the Group and other parties. If the results of the assessment show that the Group obtains control over the special purpose trust, the special purpose trust will be merged by the Group.
7. Classification of joint arrangement and accounting treatment of joint operation Joint arrangement is classified into joint operation and joint venture, depending on the rights and obligations of the parties to the arrangement, which is assessed by considering the structure and the legal form of the arrangement, the terms agreed by the parties in the contractual arrangement and, when relevant, other facts and circumstances. A joint operation is a joint arrangement whereby the parties that have joint control of the arrangement have rights to the assets, and obligations for the liabilities, relating to the arrangement. A joint venture is a joint arrangement whereby the parties that have joint control of the arrangement have rights to the net assets of the joint arrangement. The Group accounts for investments in joint ventures using equity method. Refer to Note (III) 14.3.2 "Long-term equity investment accounted for using the equity method" for details.
When a group entity undertakes its activities under joint operations, the Group as a joint operator recognizes in relation to its interest in a joint operation: - its assets, including its share of any assets held jointly; - its liabilities, including its share of any liabilities incurred jointly; - its revenue from the sale of its share of the output arising from the joint operation; - its share of the revenue from the sale of the output by the joint operation; and - its expenses, including its share of any expenses incurred jointly. The Group accounts for the assets, liabilities, revenues and expenses relating to its interest in a joint operation in accordance with the accounting standards applicable to the particular assets, liabilities, revenues and expenses.

SAIC MOTOR CORPORATION LIMITED NOTES TO THE FINANCIAL STATEMENTS YEAR ENDED DECEMBER 31, 2016
第 22 页
III. SIGNIFICANT ACCOUNTING POLICIES AND ACCOUNTING ESTIMATES - continued
8. Recognition criteria of cash and cash equivalents Cash comprises cash on hand and deposits that can be readily withdrawn on demand. Cash equivalents are short-term, highly liquid investments that are readily convertible to known amounts of cash and which are subject to an insignificant risk of change in value. 9. Translation of transactions and financial statement denominated in foreign currencies
9.1 Transactions denominated in foreign currencies
A foreign currency transaction is recorded, on initial recognition, by applying the spot exchange rate on the date of the transaction. At the balance sheet date, foreign currency monetary items are translated into RMB using the spot exchange rates at the balance sheet date. Exchange differences arising from the differences between the spot exchange rates prevailing at the balance sheet date and those on initial recognition or at the previous balance sheet date are recognized in profit or loss for the period, except that (i) exchange differences related to a specific-purpose borrowing denominated in foreign currency that qualify for capitalization are capitalized as part of the cost of the qualifying asset during the capitalization period, (ii) exchange differences related to hedging instruments for the purpose of hedging against foreign currency risks are accounted for using hedge accounting, (iii) exchange differences arising from available-for-sale non-monetary items (such as shares) denominated in foreign currencies and changes in the carrying amounts (other than the amortized cost) of available-for-sale monetary items are recognized as other comprehensive income. When the consolidated financial statements include foreign operation(s), if there is foreign currency monetary item constituting a net investment in a foreign operation, exchange difference arising from changes in exchange rates are recognized as “exchange differences arising on translation of financial statements denominated in foreign currencies” in other comprehensive income, and in profit and loss for the period upon disposal of the foreign operation.
Foreign currency non-monetary items measured at historical cost are translated to the amounts in functional currency at the spot exchange rates on the dates of the transactions and the amounts in functional currency remain unchanged. Foreign currency non-monetary items measured at fair value are re-translated at the spot exchange rate on the date the fair value is determined. Difference between the re-translated functional currency amount and the original functional currency amount is treated as changes in fair value (including changes of exchange rate) and is recognized in profit and loss or as other comprehensive income.
9.2 Translation of financial statements denominated in foreign currencies
For the purpose of preparing the consolidated financial statements, financial statements of a foreign operation are translated from the foreign currency into RMB using the following method: assets and liabilities on the balance sheet are translated at the spot exchange rate prevailing at the balance sheet date, shareholders’ equity items except for retained earnings are translated at the spot exchange rates at the dates on which such items arose, all items in the income statement as well as items reflecting the distribution of profits are translated at the spot exchange rates on the dates of the transactions, the opening balance of retained earnings is the translated closing balance of the previous year’s retained earnings, the closing balance of retained earnings is calculated and presented on the basis of each translated income statement and profit distribution item. The difference between the translated assets and the aggregate of liabilities and shareholders’ equity items is separately presented as the exchange differences arising on translation of financial statements denominated in other comprehensive income under the shareholders’ equity in the balance sheet. Cash flows arising from a transaction in foreign currency and the cash flows of a foreign subsidiary are translated at the spot exchange rate on the date of the cash. The effect of exchange rate changes on cash and cash equivalents is regarded as a reconciling item and presented separately in the cash flow statement as “effect of exchange rate changes on cash and cash equivalents”.

SAIC MOTOR CORPORATION LIMITED NOTES TO THE FINANCIAL STATEMENTS YEAR ENDED DECEMBER 31, 2016
第 23 页
III. SIGNIFICANT ACCOUNTING POLICIES AND ACCOUNTING ESTIMATES - continued 9. Translation of transactions and financial statement denominated in foreign currencies - continued 9.2 Translation of financial statements denominated in foreign currencies
- continued
The opening balances and the comparative figures of previous year are presented at the translated amounts in the previous year’s financial statements. On disposal of the Group’s entire interest in a foreign operation, or upon a loss of control over a foreign operation due to disposal of certain interest in it or other reasons, the Group transfers the accumulated exchange differences arising on translation of financial statements of this foreign operation attributable to the owners’ equity of the Company and presented under shareholders’ equity, to profit or loss in the period in which the disposal occurs. When the Group decreases equity interest in a foreign operation without losing control by partial disposal or other means, the proportionate share of accumulated exchange differences arising on translation of financial statements are re-attributed to minority interests and are not recognized in profit and loss. For partial disposals of equity interests in foreign operations which are associates or joint ventures, the proportionate share of the accumulated exchange differences arising on translation of financial statements of foreign operations is reclassified to profit or loss. 10. Financial instruments Financial assets and financial liabilities are recognized when the Group becomes a party to the contractual provisions of the instrument. Financial assets and financial liabilities are initially measured at fair value. For financial assets and financial liabilities at fair value through profit or loss, transaction costs are immediately recognized in profit or loss. For other financial assets and financial liabilities, transaction costs are included in their initial recognized amounts.
10.1 Effective interest method
The effective interest method is a method of calculating the amortized cost of a financial asset or a financial liability (or a group of financial assets or financial liabilities) and of allocating the interest income or interest expense over the relevant period, using the effective interest rate. The effective interest rate is the rate that exactly discounts estimated future cash flows through the expected life of the financial asset or financial liability or, where appropriate, a shorter period to the net carrying amount of the financial asset or financial liability. When calculating the effective interest rate, the Group estimates future cash flows considering all contractual terms of the financial asset or financial liability (without considering future credit losses), and also considers all fees paid or received between the parties to the contract giving rise to the financial asset and financial liability that are an integral part of the effective interest rate, transaction costs, and premiums or discounts, etc.
10.2 Classification, recognition and measurement of financial assets
On initial recognition, the Group’s financial assets are classified into one of the four categories, including financial assets at fair value through profit or loss, held-to-maturity investments, loans and receivables, and available-for-sale financial assets. All regular way purchases or sales of financial assets are recognized and derecognized on a trade date basis.
10.2.1 Financial assets at fair value through profit or loss (“FVTPL”)
Financial assets at FVTPL include financial assets held for trading and those designated as at fair value through profit or loss.

SAIC MOTOR CORPORATION LIMITED NOTES TO THE FINANCIAL STATEMENTS YEAR ENDED DECEMBER 31, 2016
第 24 页
III. SIGNIFICANT ACCOUNTING POLICIES AND ACCOUNTING ESTIMATES - continued 10. Financial instruments - continued 10.2 Classification, recognition and measurement of financial assets
- continued
10.2.1 Financial assets at fair value through profit or loss (“FVTPL”)
- continued
A financial asset is classified as held for trading if one of the following conditions is satisfied: (i) It has been acquired principally for the purpose of selling in the near term, or (ii) On initial recognition it is part of a portfolio of identified financial instruments that the Group manages together and there is objective evidence that the Group has a recent actual pattern of short-term profit-taking, or (iii) It is a derivative that is not designated and effective as a hedging instrument, or a financial guarantee contract, or a derivative that is linked to and must be settled by delivery of an unquoted equity instrument (without a quoted price in an active market) whose fair value cannot be reliably measured.
A financial asset may be designated as at FVTPL upon initial recognition only when one of the following conditions is satisfied: (i) Such designation eliminates or significantly reduces a measurement or recognition inconsistency that would otherwise result from measuring assets or recognizing the gains or losses on them on different bases, or (ii) The financial asset forms part of a group of financial assets or a group of financial assets and financial liabilities, which is managed and its performance is evaluated on a fair value basis, in accordance with the Group’s documented risk management or investment strategy, and information about the grouping is reported to key management personnel on that basis; (iii) The hybrid financial instrument combines financial asset with embedded derivatives. Financial assets at FVTPL are subsequently measured at fair value. Any gains or losses arising from changes in the fair value and any dividend or interest income earned on the financial assets are recognized in profit or loss.
10.2.2 Held-to-maturity investments
Held-to-maturity investments are non-derivative financial assets with fixed or determinable payments and fixed maturity dates that the Group’s management has the positive intention and ability to hold to maturity.
Held-to-maturity investments are subsequently measured at amortized cost using the effective interest method. Gain or loss arising from derecognition, impairment or amortization is recognized in profit or loss.
10.2.3. Loans and receivables
Loans and receivables are non-derivative financial assets with fixed or determinable payments that are not quoted in an active market. Financial assets classified as loans and receivables by the Group include notes receivable, accounts receivable, interest receivable, dividends receivable, and other receivables. Loans and receivables are subsequently measured at amortized cost using the effective interest method. Gain or loss arising from derecognition, impairment or amortization is recognized in profit or loss.
10.2.4. Available-for-sale financial assets
Available-for-sale financial assets include non-derivative financial assets that are designated on initial recognition as available for sale, and financial assets that are not classified as financial assets at fair value through profit or loss, loans and receivables or held-to-maturity investments.
Available-for-sale financial assets are subsequently measured at fair value, and gains or losses arising from changes in the fair value are recognized as other comprehensive income, except that impairment losses and exchange differences related to amortized cost of monetary financial assets denominated in foreign currencies are recognized in profit or loss, until the financial assets are derecognized, at which time the gains or losses are released and recognized in profit or loss.

SAIC MOTOR CORPORATION LIMITED NOTES TO THE FINANCIAL STATEMENTS YEAR ENDED DECEMBER 31, 2016
第 25 页
III. SIGNIFICANT ACCOUNTING POLICIES AND ACCOUNTING ESTIMATES - continued 10. Financial instruments - continued 10.2 Classification, recognition and measurement of financial assets - continued 10.2.4. Available-for-sale financial assets - continued Interests obtained and the dividends declared by the investee during the period in which the available-for-sale financial assets are held, are recognized in investment gains. For investments in equity instruments that do not have a quoted market price in an active market and whose fair value cannot be reliably measured, and derivative financial assets that are linked to and must be settled by delivery of such unquoted equity instruments, they are measured at cost. 10.3 Impairment of financial assets The Group assesses at each balance sheet date the carrying amounts of financial assets other than those at fair value through profit or loss. If there is objective evidence that a financial asset is impaired, the Group determines the amount of any impairment loss. Objective evidence that a financial asset is impaired is evidence that, arising from one or more events that occurred after the initial recognition of the asset, the estimated future cash flows of the financial asset, which can be reliably measured, have been affected. Objective evidence that a financial asset is impaired includes the following observable events: (1) Significant financial difficulty of the issuer or obligor, (2) A breach of contract by the borrower, such as a default or delinquency in interest or principal payments, (3) The Group, for economic or legal reasons relating to the borrower’s financial difficulty, granting a
concession to the borrower, (4) It becoming probable that the borrower will enter bankruptcy or other financial reorganizations, (5) The disappearance of an active market for that financial asset because of financial difficulties of the issuer, (6) Upon an overall assessment of a group of financial assets, observable data indicates that there is a
measurable decrease in the estimated future cash flows from the group of financial assets since the initial recognition of those assets, although the decrease cannot yet be identified with the individual financial assets in the group. Such observable data includes: - Adverse changes in the payment status of borrower in the group of assets; - Economic conditions in the country or region of the borrower which may lead to a failure to pay the group
of assets, (7) Significant adverse changes in the technological, market, economic or legal environment in which the issuer
operates, indicating that the cost of the investment in the equity instrument may not be recovered by the investor,
(8) A significant or prolonged decline in the fair value of an investment in an equity instrument. At each balance sheet date, the Group assesses available-for-sale equity instruments on an item-by-item basis. Impairment is indicated when the fair value of an equity instrument is lower than its initial investment cost over 50% (including 50%) or the fair value has been lower than its initial investment cost for over 12 months (including 12 months).
(9) Other objective evidence indicating there is an impairment of a financial asset. - Impairment of financial assets measured at amortized cost If financial assets carried at amortized cost are impaired, the carrying amounts of the financial assets are reduced to the present value of estimated future cash flows (excluding future credit losses that have not been incurred) discounted at the financial asset’s original effective interest rate. The amount of reduction is recognized as an impairment loss in profit or loss. If, subsequent to the recognition of an impairment loss on financial assets carried at amortized cost, there is objective evidence of a recovery in value of the financial assets which can be related objectively to an event occurring after the impairment is recognized, the previously recognize impairment loss is reversed. However, the reversal is made to the extent that the carrying amount of the financial asset at the date the impairment is reversed does not exceed what the amortized cost would have been had the impairment not been recognized.

SAIC MOTOR CORPORATION LIMITED NOTES TO THE FINANCIAL STATEMENTS YEAR ENDED DECEMBER 31, 2016
第 26 页
III. SIGNIFICANT ACCOUNTING POLICIES AND ACCOUNTING ESTIMATES - continued
10. Financial instruments - continued 10.3 Impairment of financial assets - continued - Impairment of financial assets measured at amortized cost - continued
For a financial asset that is individually significant, the Group assesses the asset individually for impairment. For a financial asset that is not individually significant, the Group assesses the asset individually for impairment or includes the asset in a group of financial assets with similar credit risk characteristics and collectively assesses them for impairment. If the Group determines that no objective evidence of impairment exists for an individually assessed financial asset (whether significant or not), it includes the asset in a group of financial assets with similar credit risk characteristics and collectively reassesses them for impairment. Assets for which an impairment loss is individually recognized are not included in a collective assessment of impairment. - Impairment of available-for-sale financial assets
When an available-for-sale financial asset is impaired, the cumulative loss arising from decline in fair value previously recognized directly in other comprehensive income is reclassified from other comprehensive income to profit or loss. The amount of the cumulative loss that is reclassified from capital reserve to profit or loss is the difference between the acquisition cost (net of any principal repayment and amortization) and the current fair value, less any impairment loss on that financial asset previously recognized in profit or loss. If, subsequent to the recognition of an impairment loss on available-for-sale financial assets, there is objective evidence of a recovery in value of the financial assets which can be related objectively to an event occurring after the impairment is recognized, the previously recognized impairment loss is reversed. The amount of reversal of impairment loss on available-for-sale equity instruments is recognized as other comprehensive income, while the amount of reversal of impairment loss on available-for-sale debt instruments is recognized in profit or loss.
- Impairment of financial assets measured at cost
If an impairment loss has been incurred on an investment in unquoted equity instrument (without a quoted price in an active market) whose fair value cannot be reliably measured, or on a derivative financial asset that is linked to and must be settled by delivery of such an unquoted equity instrument, the carrying amount of the financial asset is reduced to the present value of estimated future cash flows discounted at the current market rate of return for a similar financial asset. The amount of reduction is recognized as an impairment loss in profit or loss. The impairment loss on such financial asset is not reversed once it is recognized. 10.4 Transfer and derecognition of financial assets
Transfer of the Group's financial assets, includes following two situations: (1) The contractual right of receiving cash flow of financial assets has been transferred, (2) Although the financial assets have been transferred, the Group retains the contractual right of receiving cash
flow of financial assets and undertakes obligation of paying received cash flow to final recipient,
• When receiving cash flow from financial assets, the obligation of paying to final recipients should be undertaken. The Group incurs short-term advance payment, and has the right of recovering all advances and receiving interests calculated by bank loan interest, meeting the criteria;
• According to agreement of contract, the financial assets cannot be sold or taken as collateral, but they can be the guarantee of paying cash flow to final recipients;
• Obligation of paying received cash flow to final recipients. The Group has no right of using cash flow to reinvest, except that the Group uses cash and cash equivalents to invest during interval of two payments. The Group reinvests according to contract agreement, and the investment income should be paid to final recipients according to contract agreement.

SAIC MOTOR CORPORATION LIMITED NOTES TO THE FINANCIAL STATEMENTS YEAR ENDED DECEMBER 31, 2016
第 27 页
III. SIGNIFICANT ACCOUNTING POLICIES AND ACCOUNTING ESTIMATES - continued
10. Financial instruments - continued
10.4 Transfer and derecognition of financial assets - continued
A financial asset or a part of a financial asset will be derecognized if one of the following conditions is satisfied:
(1) Contractual right of receiving cash flow from the financial asset terminates; (2) The financial asset has been transferred, and meets one of the following conditions:
• The Group has transferred almost all risks and reward of the financial asset; • The Group has not retained or transferred ownership of the financial asset, and not keeps control on
the financial asset.
If the financial asset has been transferred and the risks and reward of its ownership has not been retained, and the control of the financial asset has not been transferred, the Group will recognize related financial asset according to the extent of the Group’s continuing involvement in the transferred asset. For a transfer of a financial asset in its entirety that satisfies the derecognition criteria, the difference between (i) the carrying amount of the financial asset transferred, and (ii) the sum of the consideration received from the transfer and any cumulative gain or loss that has been recognized in other comprehensive income, is recognized in profit or loss. 10.5 Assets securitization As a part of operating activities, the Group has securitized certain credit assets. The Group normally transfers such assets to structured entities, which issues securities to investors. The conditions of derecognition of financial assets are set out in Note (III) 10.4. When applying the conditions of derecognition of financial assets, the Group considers the degree to which the risks and rewards of the assets are transferred to structured entities and the degree to which the Group can exercise control over the structured entities. For credit assets securitization not meeting derecognition conditions, relevant financial assets are not derecognized, fund raised from third party will are treated as financing.
10.6 Classification, recognition and measurement of financial liabilities Debt and equity instruments issued by the Group are classified into financial liabilities or equity on the basis of the substance of the contractual arrangements and the economic nature not merely its legal form. On initial recognition, financial liabilities are classified into financial liabilities at fair value through profit or loss and other financial liabilities. 10.6.1 Financial liabilities at fair value through profit or loss Financial liabilities at FVTPL consist of financial liabilities held for trading and those designated as at FVTPL on initial recognition. A financial liability is classified as held for trading if one of the following conditions is satisfied: (1) It has been acquired principally for the purpose of repurchasing in the near term; (2) On initial recognition it is part of a portfolio of identified financial instruments that the Group manages together and there is objective evidence that the Group has a recent actual pattern of short-term profit-taking; (3) It is a derivative, except for a derivative that is a designated and effective hedging instrument, or a financial guarantee contract, or a derivative that is linked to and must be settled by delivery of an unquoted equity instrument (without a quoted price in an active market) whose fair value cannot be reliably measured.

SAIC MOTOR CORPORATION LIMITED NOTES TO THE FINANCIAL STATEMENTS YEAR ENDED DECEMBER 31, 2016
第 28 页
III. SIGNIFICANT ACCOUNTING POLICIES AND ACCOUNTING ESTIMATES - continued
10. Financial instruments - continued 10.6 Classification, recognition and measurement of financial liabilities - continued 10.6.1 Financial liabilities at fair value through profit or loss - continued A financial liability may be designated as at FVTPL upon initial recognition only when one of the following conditions is satisfied: (1) Such designation eliminates or significantly reduces a measurement or recognition inconsistency that would otherwise result from measuring liabilities or recognizing the gains or losses on them on different bases, or (2) The financial liability forms part of a group of financial liabilities or a group of financial assets and financial liabilities, which is managed and its performance is evaluated on a fair value basis, in accordance with the Group’s documented risk management or investment strategy, and information about the grouping is reported to key management personnel on that basis; or (3) The hybrid financial instrument with related embedded derivatives which meets the requirements. Financial liabilities at FVTPL are subsequently measured at fair value. Any gains or losses arising from changes in the fair value or any dividend or interest expenses related to the financial liabilities are recognized in profit or loss.
10.6.2 Other financial liabilities For a derivative liability that is linked to and must be settled by delivery of an unquoted equity instrument (without a quoted price in an active market) whose fair value cannot be reliably measured, it is subsequently measured at cost. Except for financial guarantee contracts, financial liabilities and loan commitments are subsequently measured at amortized cost using the effective interest method, with gain or loss arising from derecognition or amortization recognized in profit or loss. 10.6.3. Financial guarantee contracts A financial guarantee contract is a contract by which the guarantor and the lender agree that the guarantor would settle the debts or bear obligations in accordance with terms of the contract in case the borrower fails to settle the debts. Financial guarantee contracts that are not designated as financial liabilities at fair value through profit or loss are initially measured at their fair values less the directly attributable transaction costs. Subsequent to initial recognition, they are measured at the higher of: (i) the amount determined in accordance with "Accounting Standard for Business Enterprises No. 13-Contingencies", and (ii) the amount initially recognized less cumulative amortization recognized in accordance with the principles set out in "Accounting Standard for Business Enterprises No. 14-Revenue".
10.7 Derecognition of Financial Liabilities The Group derecognizes a financial liability (or part of it) only when the underlying present obligation (or part of it) is discharged. An agreement between the Group (an existing borrower) and an existing lender to replace the original financial liability with a new financial liability with substantially different terms is accounted for as an extinguishment of the original financial liability and the recognition of a new financial liability. When the Group derecognizes a financial liability or a part of it, it recognizes the difference between the carrying amount of the financial liability (or part of the financial liability) derecognized and the consideration paid (including any non-cash assets transferred or new financial liabilities assumed) in profit or loss.
SAIC MOTOR CORPORATION LIMITED NOTES TO THE FINANCIAL STATEMENTS YEAR ENDED DECEMBER 31, 2016
第 29 页
III. SIGNIFICANT ACCOUNTING POLICIES AND ACCOUNTING ESTIMATES - continued
10. Financial instruments - continued 10.8 Derivatives and embedded derivatives Derivative financial instruments include forward exchange contracts etc. Derivatives are initially measured at fair value at the date when the derivative contracts are entered into and are subsequently re-measured at fair value. The resulting gain or loss is recognized in profit or loss unless the derivative is designated and highly effective as a hedging instrument, in which case the timing of the recognition in profit or loss depends on the nature of the hedge relationship. An embedded derivative is separated from the hybrid instrument, where the hybrid instrument is not designated as a financial asset or financial liability at fair value through profit or loss, and treated as a standalone derivative if 1) the economic characteristics and risks of the embedded derivative are not closely related to the economic characteristics and risks of the host contract, and 2) a separate instrument with the same terms as the embedded derivative would meet the definition of a derivative. If the Group is unable to measure the embedded derivative separately either at acquisition or at a subsequent balance sheet date, it designates the entire hybrid instrument as a financial asset or financial liability at fair value through profit or loss.
10.8.1 Convertible loan notes Convertible loan notes issued by the Group that contain both the liability and conversion option components are classified separately into respective items on initial recognition. Conversion option that is settled by the exchange of a fixed amount of cash or another financial asset for a fixed number of the Company’s own equity instruments is an equity instrument. On initial recognition, the fair value of the liability component is determined using the prevailing market interest of similar non-convertible debts. The difference between the gross proceeds of the issue of the convertible loan notes and the fair value assigned to the liability component, representing the conversion option for the holder to convert the loan notes into equity instrument, is included in capital reserve (other capital reserve-share conversion option). In subsequent periods, the liability component of the convertible loan notes is carried at amortized cost using the effective interest method. The conversion option classified as equity remains in equity. No gain or loss is recognized in profit or loss upon conversion or expiration of the option. Transaction costs incurred for the issue of convertible loan notes are allocated to the liability component and equity component in proportion to their respective fair values. Transaction costs relating to the equity component are charged directly to equity. Transaction costs relating to the liability component are included in the carrying amount of the liability component and amortized over the period of the convertible loan notes using the effective interest method. 10.9 Offsetting financial assets and financial liabilities Where the Group has a legal right that is currently enforceable to set off the recognized financial assets and financial liabilities, and intends either to settle on a net basis, or to realize the financial asset and settle the financial liability simultaneously, a financial asset and a financial liability shall be offset and the net amount is presented in the balance sheet. Except for the above circumstances, financial assets and financial liabilities shall be presented separately in the balance sheet and shall not be offset. 10.10 Equity instruments An equity instrument is any contract that evidences a residual interest in the assets of the Group after deducting all of its liabilities. Equity instruments issued (including refinanced), repurchased, sold and written off by the Group are recognized as changes of equity. Change of fair value of equity instruments is not recognized by the Group. Transaction costs related to equity transaction are deducted from equity. The Group recognizes the distribution to holders of the equity instruments as distribution of profits, and dividends paid do not affect total amount of shareholders equity.

SAIC MOTOR CORPORATION LIMITED NOTES TO THE FINANCIAL STATEMENTS YEAR ENDED DECEMBER 31, 2016
第 30 页
III. SIGNIFICANT ACCOUNTING POLICIES AND ACCOUNTING ESTIMATES - continued
1. Receivables 11.1 Receivables that are individually significant and for which bad debt provision is individually assessed Basis or monetary criteria for determining an individually significant receivable
A receivable that exceeds RMB100 million or other receivable that exceeds RMB50 million is deemed as an individually significant receivable by the Group.
Method of determining provision for receivables that are individually significant and for which bad debt provision is individually assessed
For receivables that are individually significant, the Group assesses the receivables individually for impairment. For a financial asset that is not impaired individually, the Group includes the asset in a group of financial assets with similar credit risk characteristics and collectively assesses them for impairment. Receivables for which an impairment loss is individually recognized are not included in a collective assessment of impairment.
11.2 Receivables for which bad debt provision is collectively assessed on a portfolio basis Basis for determining a portfolio The Group classifies the receivables that are not individually significant
and those that are individually significant but are not impaired individually into groups of financial assets according to the similarity and relevance of credit risk characteristics. These credit risks usually reflect the debtors’ ability to pay the amounts due at maturity under contractual terms of related assets and are related to the estimation of future cash flows of the assets subject to assessment.
Bad debt provision method for a portfolio
While assessing the provision of bad debt of the Group, the provision is measured by historical loss experience and the existing loss between current economic situation and expected receivable portfolio, according to the structure of the Group and credit risk characteristics( aging of receivables), and the provision for bad debts is determined by aging analysis.
11.3 Receivables that are not individually significant but for which bad debt provision is individually assessed Reasons for individual bad debt provision
The receivables that prove the impairment of financial assets due to serious financial difficulties of the debtor and for other reasons are subject to individual assessment, and provision is made for bad debts.
Method of determining provision for receivables
Individual determination method
2. Inventories 12.1 Categories of inventories The Group’s inventories mainly include raw materials, work-in-progress, finished goods or goods on hand and property under development. Inventories are initially measured at cost. Cost of inventories comprises all costs of purchase, costs of conversion and other expenditures incurred in bringing the inventories to their present location and condition. 12.2 Valuation method of inventories upon delivery Upon delivery of inventories, the weighted average method is used to assign the actual cost of inventories. Inventories are accounted for using the planned costing method upon delivery. Cost variances are computed at the end of month to adjust planned costs to actual costs.

SAIC MOTOR CORPORATION LIMITED NOTES TO THE FINANCIAL STATEMENTS YEAR ENDED DECEMBER 31, 2016
第 31 页
III. SIGNIFICANT ACCOUNTING POLICIES AND ACCOUNTING ESTIMATES - continued
12. Inventories - continued 12.3 Basis for determining net realizable value of inventories and provision methods for decline in value of inventories At the balance sheet date, inventories are measured at the lower of cost and net realizable value. If the net realizable value is below the cost of inventories, a provision for decline in value of inventories is made. Net realizable value is the estimated selling price in the ordinary course of business less the estimated costs of completion, the estimated costs necessary to make the sale and relevant taxes. Net realizable value is determined on the basis of conclusive evidence obtained, and takes into consideration the purposes of holding inventories and effect of post balance sheet events. For inventories, provision for inventory depreciation is made according to the difference between the cost of an individual inventory item and its realizable net value. After the provision for decline in value of inventories is made, if the circumstances that previously caused inventories to be written down below cost no longer exist so that the net realizable value of inventories is higher than their cost, the original provision for decline in value is reversed and the reversal is included in profit or loss for the period.
12.4 Inventory count system The perpetual inventory system is maintained for stock system. 12.5 Amortization method for low cost and short-lived consumable items and packaging materials Packaging materials and low cost and short-lived consumable items are amortized using the immediate write-off method. Other reusable materials are amortized using the immediate write-off method. 13. Assets classified as held for sale When a component or non-current assets (except deferred tax assets) of the Group meets all the following conditions, the Group classifies such assets as held for sale: the component or non-current assets are available for immediate sale in its present condition subject only to terms that are usual and customary for sales of such assets; the Group has decided to dispose the component or non-current assets; the Group has signed an irrevocable transfer agreement with the transferee; the transfer is to be completed within one year. Non-current assets held for sale are not accounted for using equity method, not depreciated or amortized, and are measured at the lower of carrying amount and fair value less costs to disposal. 14. Long-term equity investments 14.1. Determination of control, joint control and significant influence Control is achieved when the investor has power over the investee, is exposed, or has rights, to variable returns from its involvement with the investee, and the ability to use its power to affect its returns. Joint control is the contractually agreed sharing of control of an arrangement, which exists only when decisions about the relevant activities require unanimous consent of the parties sharing control. Significant influence is the power to participate in the financial and operating policy decisions of the investee but is not control or joint control over those policies. When assessing whether the investor can has control or significant influence over the investee, it has considered potential voting rights (e.g. exercisable convertible bonds and warrants) held by the investor and other parties.

SAIC MOTOR CORPORATION LIMITED NOTES TO THE FINANCIAL STATEMENTS YEAR ENDED DECEMBER 31, 2016
第 32 页
III. SIGNIFICANT ACCOUNTING POLICIES AND ACCOUNTING ESTIMATES - continued
14. Long-term equity investments - continued 14.2 Determination of initial investment cost For a long-term equity investment acquired through business combination involving enterprises under common control, shares of book value of owners' equity of combined party in financial statements of ultimate controlling party are recognized as initial investment cost of long-term equity investment at combination date. The difference between initial investment cost of long-term equity investment and cash paid, non-cash assets transferred and book value of liabilities assumed, is adjusted in capital reserve. If the balance of capital reserve is not sufficient, any excess is adjusted to retained earnings. If the consideration of the combination is satisfied by the issue of equity securities, the initial investment cost of the long-term equity investment is the share of book value of owners' equity of the acquired entity in the ultimate controlling party’s consolidated financial statements at the date of combination. The aggregate face value of the shares issued is accounted for as share capital. The difference between the initial investment cost and the aggregate face value of the shares issued is adjusted to capital reserve. If the balance of capital reserve is not sufficient, any excess is adjusted to retained earnings. Where equity interests in an acquiree are acquired in stages through stepwise transactions ultimately constituting a business combination involving entities under common control, the acquirer shall determine if these transactions are considered to be "a bundled transaction". If yes, these transactions are accounted for as a single transaction where control is obtained. If no, the initial investment cost of the long-term equity investment is the share of book value of owners' equity of the acquired entity in the ultimate controlling party’s consolidated financial statements at the date of combination. The difference between the initial investment cost and the sum of carrying amount of equity investments previously held in the acquiree and the new investment cost is adjusted to capital reserve. If the balance of capital reserve is not sufficient, any excess is adjusted to retained earnings. Other comprehensive income recognized for the previously held equity investments by accounting treatment of equity method or available-for-sale financial assets is not subject to accounting treatment temporarily. For a long-term equity investment acquired through business combination not involving enterprises under common control, the investment cost of the long-term equity investment is the cost of acquisition. Where equity interests in an acquiree are acquired in stages through multiple transactions ultimately constituting a business combination not involving entities under common control, the acquirer shall determine if these transactions are considered to be "a bundled transaction". .If yes, these transactions are accounted for as a single transaction where control is obtained. If no, the sum of carrying amount of equity investments previously held in the acquiree and the new investment cost is deemed as the initial investment cost of long-term equity investments that was changed to be accounted for using cost method. If the equity previously held was accounted for using the equity method, the corresponding other comprehensive income is not subject to accounting treatment temporarily. If the equity investment previously held was classified as available-for-sale financial assets, the difference between the fair value and carrying amount, together with the accumulated fair value previously included in other comprehensive income are transferred to profit or loss for the period. The expenses incurred by the acquirer in respect of auditing, legal services, valuation and consultancy services and other associated administrative expenses attributable to the business combination are recognized in profit or loss when they are incurred. Long-term equity investment acquired otherwise than through a business combination is initially measured at its cost. When the entity is able to exercise significant influence or joint control (but not control) over an investee due to additional investment, the cost of long-term equity investments is the sum of the fair value of previously-held equity investments determined in accordance with "Accounting Standard for Business Enterprises No.22 - Financial Instruments Recognition and Measurement" and the additional investment cost.

SAIC MOTOR CORPORATION LIMITED NOTES TO THE FINANCIAL STATEMENTS YEAR ENDED DECEMBER 31, 2016
第 33 页
III. SIGNIFICANT ACCOUNTING POLICIES AND ACCOUNTING ESTIMATES - continued
14. Long-term equity investments - continued
14.3 Subsequent measurement and recognition of profit or loss 14.3.1. Long-term equity investment accounted for using the cost method Long-term equity investments in subsidiaries are accounted for using the cost method in the Company’s separate financial statements. A subsidiary is an investee that is controlled by the Group. Under the cost method, a long-term equity investment is measured at initial investment cost. When additional investment is made or the investment is recouped, the cost of the long-term equity investment is adjusted accordingly. Investment income is recognized in the period in accordance with the attributable share of cash dividends or profit distributions declared by the investee. 14.3.2. Long-term equity investment accounted for using the equity method The Group accounts for investment in associates and joint ventures using the equity method. An associate is an entity over which the Group has significant influence and a joint venture is an entity over which the Group exercises joint control along with other investors. Under the equity method, where the initial investment cost of a long-term equity investment exceeds the Group’s share of the fair value of the investee’s identifiable net assets at the time of acquisition, no adjustment is made to the initial investment cost. Where the initial investment cost is less than the Group’s share of the fair value of the investee’s identifiable net assets at the time of acquisition, the difference is recognized in profit or loss for the period, and the cost of the long-term equity investment is adjusted accordingly. Under the equity method, the Group recognizes its share of the net profit or loss of the investee for the period as investment income or loss for the period. The Group recognizes its share of the investee’s net profit or loss based on the fair value of the investee’s individual separately identifiable assets, etc. at the acquisition date after making appropriate adjustments to conform with the Group’s accounting policies and accounting period. Unrealized profits or losses resulting from the Group’s transactions with its associates and joint ventures are recognized as investment income or loss to the extent that those attributable to the Group’s equity interest are eliminated. However, unrealized losses resulting from the Group’s transactions with its associates and joint ventures which represent impairment losses on the transferred assets are not eliminated. Changes in owners’ equity of the investee other than net profit or loss are correspondingly adjusted to the carrying amount of the long-term equity investment, and recognized as other comprehensive income which is included in the capital reserve. The Group discontinues recognizing its share of net losses of the investee after the carrying amount of the long-term equity investment together with any long-term interests that in substance form part of its net investment in the investee is reduced to zero. If the Group has incurred obligations to assume additional losses of the investee, a provision is recognized according to the expected obligation, and recorded as investment loss for the period. Where net profits are subsequently made by the investee, the Group resumes recognizing its share of those profits only after its share of the profits exceeds the share of losses previously not recognized. For long-term equity investments in associates and joint ventures which had been held by the Group before its first-time adoption of ASBE on January 01, 2007, where the initial investment cost of a long-term equity investment exceeds the Group’s interest in the investee’s net assets at the time of acquisition, the excess is amortized and is recognized in profit or loss on a straight line basis over the original remaining life.

SAIC MOTOR CORPORATION LIMITED NOTES TO THE FINANCIAL STATEMENTS YEAR ENDED DECEMBER 31, 2016
第 34 页
III. SIGNIFICANT ACCOUNTING POLICIES AND ACCOUNTING ESTIMATES - continued
14. Long-term equity investments - continued
14.4. Disposal of long-term equity investments On disposal of a long term equity investment, the difference between the proceeds actually received and the carrying amount of receivables is recognized in profit or loss for the period. For a long-term equity investment accounted for using the equity method, the amount included in the owners’ equity attributable to the percentage interest disposed is transferred to profit or loss for the period. For a long-term equity investment accounted for using the cost method, if it is still accounted for cost method after disposal, other comprehensive income recognized before controlling the investee according to equity method or recognition and measurement of financial instruments, account for them on the basis of related assets and liabilities, and recognized in profit or loss for proportion; change of owners' equity except for net profit or loss, other comprehensive income and profit distribution is recognized in profit or loss of current period. The Group loses control on investee due to disposal of part of shares, during preparing separate financial statement, remaining shares after disposal can make joint control or significant influence on investee, are accounted under equity method, and adjust them as they are accounted under equity method from acquisition date; if remaining shares after disposal cannot make joint control or significant influence on investee, they are accounted according to recognition and measurement of financial instrument, and the difference between fair value on date of losing control and book value is recognized in profit or loss of current period. Before the Group controls the investee, other comprehensive income recognized due to equity method or recognition and measurement of financial instruments, account for them on the basis of related assets and liabilities, and recognized in profit or loss for proportion; change of owners' equity except for net profit or loss, other comprehensive income and profit distribution is recognized in profit or loss of current period. Remaining shares after disposal are accounted under equity method, other comprehensive income and other owners' equity are carried forward as proportion; remaining shares after disposal are accounted due to recognition and measurement of financial instruments other comprehensive income and other owners' equity are all carried forward. For the Group loses joint control or significant influence on investee after part disposal of shares, remaining shares after disposal are accounted according to recognition and measurement of financial instruments, the difference between fair value at the date of losing joint control or significant influence and book value is recognized in profit or loss of current period. Other comprehensive income recognized under equity method, is accounted on the basis of related assets or liabilities when stop using equity method, change of owners' equity except for net profit or loss, other comprehensive income and profit distribution is recognized in profit or loss of current period The Group loses control on subsidiaries through stepwise transactions of disposal, if transactions are a bundled transaction, all transactions are seemed as one transaction of disposal investment on subsidiaries, difference between amount of disposal and book value of long-term equity investment, is recognized as other comprehensive income, and recognized in profit or loss when losing control.
15. Investment properties Investment property is property held to earn rentals or for capital appreciation or both. It includes a land use right that is leased out, a land use right held for transfer upon capital appreciation, and a building that is leased out. An investment property is measured initially at cost. Subsequent expenditures incurred for such investment property are included in the cost of the investment property if it is probable that economic benefits associated with an investment property will flow to the Group and the subsequent expenditures can be measured reliably. Other subsequent expenditures are recognized in profit or loss in the period in which they are incurred.
The Group uses the cost model for subsequent measurement of investment property, and adopts a depreciation or amortization policy for the investment property which is consistent with that for buildings or land use rights. When an investment property is sold, transferred, retired or damaged, the Group recognizes the amount of any proceeds on disposal net of the carrying amount and related taxes in profit or loss for the period.

SAIC MOTOR CORPORATION LIMITED NOTES TO THE FINANCIAL STATEMENTS YEAR ENDED DECEMBER 31, 2016
第 35 页
III. SIGNIFICANT ACCOUNTING POLICIES AND ACCOUNTING ESTIMATES - continued
16. Fixed assets 16.1 Recognition criteria for fixed assets Fixed assets are tangible assets that are held for use in the production or supply of goods or services, for rental to others, or for administrative purposes, and have useful lives of more than one accounting year. A fixed asset is recognized only when it is probable that economic benefits associated with the asset will flow to the Group and the cost of the asset can be measured reliably. Fixed assets are initially measured at cost. Subsequent expenditures incurred for the fixed asset are included in the cost of the fixed asset and if it is probable that economic benefits associated with the asset will flow to the Group and the subsequent expenditures can be measured reliably. Meanwhile the carrying amount of the replaced part is derecognized. Other subsequent expenditures are recognized in profit or loss in the period in which they are incurred. 16.2 Depreciation of each category of fixed assets A fixed asset is depreciated over its useful life using the straight-line method, the units of production method or the double declining balance method since the month subsequent to the one in which it is ready for intended use. The useful life, estimated net residual value rate and annual depreciation rate of each category of fixed assets are as follows:
Category Depreciation method Depreciation period (years)
Residual value rate
(%)
Annual depreciation rate
(%) Buildings Straight-line depreciation 8 - 50 0 - 10 1.8 - 12.5 Machinery and equipment Straight-line depreciation 5 - 20 0 - 10 4.5 - 20 Electronic equipment, appliance and furniture Straight-line depreciation 2 - 20 0 - 10 4.5 - 50
Transportation vehicles Straight-line depreciation 3 - 12 0 - 10 7.5 - 33.33
Molds Straight-line depreciation or units of production method Not applicable 0 - 5 Not applicable
Estimated net residual value of a fixed asset is the estimated amount that the Group would currently obtain from disposal of the asset, after deducting the estimated costs of disposal, if the asset were already of the age and in the condition expected at the end of its useful life. 16.3 Identification, valuation and depreciation method for fixed assets under finance lease At the beginning of lease term, the lower between fair value of lease assets at the beginning of lease term and present value of the least payment is recognized as book value of lease assets, and recognize minimum least payment as book value of long-term payables, and the difference as unrecognized financial charge. In addition, in the process of lease negotiating and signing lease contract, initial direct expense attributable to lease item is recognized in value of assets.
The Group adopts a depreciation policy for a fixed asset held under a finance lease which is consistent with that for its owned fixed asset. If there is reasonable certainty that the Group will obtain ownership of the leased asset at the end of the lease term, the leased asset is depreciated over its useful life. If there is no reasonable certainty that the Group will obtain ownership of the leased asset at the end of the lease term, the leased asset is depreciated over the shorter of the lease term and its useful life.

SAIC MOTOR CORPORATION LIMITED NOTES TO THE FINANCIAL STATEMENTS YEAR ENDED DECEMBER 31, 2016
第 36 页
III. SIGNIFICANT ACCOUNTING POLICIES AND ACCOUNTING ESTIMATES - continued 16. Fixed assets - continued 16.4 Other explanations If a fixed asset is upon disposal or no future economic benefits are expected to be generated from its use or disposal, the fixed asset is derecognized. When a fixed asset is sold, transferred, retired or damaged, the amount of any proceeds on disposal of the asset net of the carrying amount and related taxes is recognized in profit or loss for the period.
The Group reviews the useful life and estimated net residual value of a fixed asset and the depreciation method applied at least once at each financial year-end, and account for any change as a change in an accounting estimate. 17. Construction in progress Construction in progress is measured at its actual costs. The actual costs include various construction expenditures during the construction period, borrowing costs capitalized before it is ready for intended use and other relevant costs. Construction in progress is not depreciated. Construction in progress is transferred to a fixed asset when it is ready for intended use.
18. Borrowing costs Borrowing costs directly attributable to the acquisition, construction or production of qualifying asset are capitalized when expenditures for such asset and borrowing costs are incurred and activities relating to the acquisition, construction or production of the asset that are necessary to prepare the asset for its intended use or sale have commenced. Capitalization of borrowing costs ceases when the qualifying asset being acquired, constructed or produced becomes ready for its intended use or sale. Capitalization of borrowing costs is suspended during periods in which the acquisition, construction or production of a qualifying asset is suspended abnormally and when the suspension is for a continuous period of more than 3 months. Capitalization is suspended until the acquisition, construction or production of the asset is resumed. Other borrowing costs are recognized as an expense in the period in which they are incurred. Where funds are borrowed under a specific-purpose borrowing, the amount of interest to be capitalized is the actual interest expense incurred on that borrowing for the period less any bank interest earned from depositing the borrowed funds before being used on the asset or any investment income on the temporary investment of those funds. Where funds are borrowed under general-purpose borrowings, the Group determines the amount of interest to be capitalized on such borrowings by applying a capitalization rate to the weighted average of the excess of cumulative expenditures on the asset over the amounts of specific-purpose borrowings. The capitalization rate is the weighted average of the interest rates applicable to the general-purpose borrowings. During the capitalization period, exchange differences related to a specific-purpose borrowing denominated in foreign currency are all capitalized. Exchange differences in connection with general-purpose borrowings are recognized in profit or loss in the period in which they are incurred.

SAIC MOTOR CORPORATION LIMITED NOTES TO THE FINANCIAL STATEMENTS YEAR ENDED DECEMBER 31, 2016
第 37 页
III. SIGNIFICANT ACCOUNTING POLICIES AND ACCOUNTING ESTIMATES - continued 19. Intangible assets 19.1 Intangible assets Intangible assets include land use rights, non-patent technology, royalty, software license, patents, and trademark etc. An intangible asset is measured initially at cost. When an intangible asset with a finite useful life is available for use, its original cost less net residual value and any accumulated impairment losses is amortized over its estimated useful life using the straight-line method.
Category Amortization method Useful life (year) Land use right Straight-line method 40 - 50 Non-patent technology Straight-line method 3 - 10 Royalty Straight-line method 10 - 20 Software license Straight-line method 5 - 10 Patents Straight-line method 3 - 10 Trademark Straight-line method 10 For an intangible asset with a finite useful life, the Group reviews the useful life and amortization method at the end of the period, and makes adjustments when necessary.
19.2 Internal research and development expenditure Expenditure during the research phase is recognized as an expense in the period in which it is incurred. Expenditure during the development phase that meets all of the following conditions at the same time is recognized as intangible asset. Expenditure during development phase that does not meet the following conditions is recognized in profit or loss for the period: (1) It is technically feasible to complete the intangible asset so that it will be available for use or sale, (2) The Group has the intention to complete the intangible asset and use or sell it, (3) The Group can demonstrate the ways in which the intangible asset will generate economic benefits,
including the evidence of the existence of a market for the output of the intangible asset or the intangible asset itself or, if it is to be used internally, the usefulness of the intangible asset,
(4) The availability of adequate technical, financial and other resources to complete the development and the ability to use or sell the intangible asset, and
(5) The expenditure attributable to the intangible asset during its development phase can be reliably measured. If the expenditures cannot be distinguished between the research phase and development phase, the Group recognizes all of them in profit or loss for the period.

SAIC MOTOR CORPORATION LIMITED NOTES TO THE FINANCIAL STATEMENTS YEAR ENDED DECEMBER 31, 2016
第 38 页
III. SIGNIFICANT ACCOUNTING POLICIES AND ACCOUNTING ESTIMATES - continued
20. Impairment of long-term assets The Group assesses at each balance sheet date whether there is any indication that long-term equity investment, investment property, fixed assets and construction in progress and the intangible assets with a finite useful life may be impaired. If there is any indication that such assets may be impaired, recoverable amounts are estimated for such assets. Intangible assets with indefinite useful life and intangible assets not yet available for use are tested for impairment annually, irrespective of whether there is any indication that the assets may be impaired. Recoverable amount is estimated on individual basis. If it is not practical to estimate the recoverable amount of an individual asset, the recoverable amount of the asset group to which the asset belongs will be estimated. Recoverable amount is the higher of net value of fair value of assets or assets group less disposal expenses and present value of anticipated future cash flow. If the recoverable amount of an asset or an asset group is less than its carrying amount, the deficit is accounted for as an impairment loss and is recognized in profit or loss for the period. Goodwill is at least undertaken impairment test at balance sheet date. When goodwill is undertaken impairment test, it is combined with related asset group or asset group portfolio. From the acquisition date, the book value of goodwill is divided into asset group or asset portfolio benefited from synergy effect of the Company, if the recoverable amount of asset group or asset portfolio including divided goodwill is less than its book value, corresponding impairment loss is recognized. Firstly, amount of impairment loss should offset the book value of goodwill of asset group or asset portfolio, and offset book value of other assets according to proportion of other assets in asset group or asset portfolio. Once the impairment loss of such assets is recognized, it is not be reversed in any subsequent period. 21. Long-term prepaid expenses Long-term prepaid expenses represent expenses incurred that should be borne and amortized over the current and subsequent periods (together of more than one year). Long-term prepaid expenses are amortized using the straight-line method over the expected periods in which benefits are derived. 22. Employee benefits 22.1 Accounting treatment of short-term benefits Actually occurred short-term employee benefits are recognized as liabilities, with a corresponding charge to the profit or loss for the period or in the costs of relevant assets in the accounting period in which employees provide services to the Group. Staff welfare expenses incurred by the Group are recognized in profit or loss for the period or the costs of relevant assets based on the actually occurred amounts when it actually occurred. Non-monetary staff welfare expenses are measured at fair value. Payment made by the Group of social security contributions for employees such as premiums or contributions on medical insurance, work injury insurance and maternity insurance, etc. and payments of housing funds, as well as trade union fund and employee education fund provided in accordance with relevant requirements, are calculated according to prescribed bases and percentages in determining the amount of employee benefits and recognized as relevant liabilities, with a corresponding charge to the profit or loss for the period or the costs of relevant assets in the accounting period in which employees provide services. 22.2 Accounting treatment of post-employment benefits Post-employment benefits are classified into defined contribution plans and defined benefit plans. During the accounting period of rendering service to employees of the Group, amount which should be paid according to defined contribution plans is recognized as liabilities, and recognized in profit or loss or related costs of assets.

SAIC MOTOR CORPORATION LIMITED NOTES TO THE FINANCIAL STATEMENTS YEAR ENDED DECEMBER 31, 2016
第 39 页
III. SIGNIFICANT ACCOUNTING POLICIES AND ACCOUNTING ESTIMATES - continued 22. Employee benefits - continued 22.2 Accounting treatment of post-employment benefits - continued For defined benefit plans, the Group calculates defined benefit plan obligations using projected unit credit method and the service cost resulting from employee service in the current period is recorded in profit or loss or the cost of related assets. Defined benefit costs are categorized as follows: • service cost (including current service cost, past service cost, as well as gains and losses on curtailments
and settlements); • net interest expense or income (including interest income of planned assets, interest expenses of defined
benefit plan liabilities and effect of asset ceiling); and • Remeasurement of net liabilities or net assets of defined benefit plans.
Service costs and net interest of net liabilities and net assets of defined benefit plans are recognized in profit or loss of current period or costs of related assets. Remeasurements of the net defined benefit liability (asset) (including actuarial gains and losses, the return on plan assets, excluding amounts included in net interest on the net defined benefit liability (asset), and any change in the effect of the asset ceiling, excluding amounts included in net interest on the net defined benefit liability (asset)) are recognized in other comprehensive income. Deficit or surplus from present value of obligation of defined benefit plans less fair value of planned asset of defined benefit plans are recognized as net liabilities or net assets of a defined benefit plan. When the defined benefit plan has a surplus, the defined benefit asset is measured at the lower of the surplus in the defined benefit plan and asset ceiling. 22.3 Accounting treatment of termination benefits A liability for a termination benefit is recognized at the earlier of when the Group can no longer unilaterally withdraw the offer of the termination benefit and when the Group recognizes any related restructuring costs. The Group provides early retirement benefits to employees who accept arrangement of early retirement. Early retirement is that the Group pays salaries and social insurance to employees whose age is below the statutory retirement age, and they quit their jobs voluntarily approved by management of the Group. The Group pays early retirement benefits to early retirement employees from the date of early retirement arrangement to statutory retirement age of employees. The Group accounts for early retirement benefits using the same accounting policy for termination benefits. When recognition criteria for termination benefits are met, the Group recognizes the salaries and social insurance of early retirement employees for the period from the date termination of service to the date of statutory retirement as liabilities, and recognizes the cost in profit or loss of current period. The difference arising from actuarial gains and losses and adjustment of benefit standards is recognized in profit or loss of current period when it incurs. 22.4 Accounting treatment of other long-term employee benefit For other long-term employee benefits, where the definition of defined contribution plans is met, it is accounted for according to related requirements of defined contribution plans. Otherwise, net liabilities or net assets of such other long-term employee benefit are recognized and measured according to related requirements of defined benefit plans. At balance sheet date, cost of employee benefit generated from other long-term employee benefit comprises service cost, net interest of net liabilities or net assets of other long-term employee benefit and changes arising from remeasurement of net liabilities or net assets. Net value of these items is recognized in profit or loss or cost of related assets.

SAIC MOTOR CORPORATION LIMITED NOTES TO THE FINANCIAL STATEMENTS YEAR ENDED DECEMBER 31, 2016
第 40 页
III. SIGNIFICANT ACCOUNTING POLICIES AND ACCOUNTING ESTIMATES - continued 23. Provisions Provisions are recognized when the Group has a present obligation related to a contingency such as products quality assurance, it is probable that an outflow of economic benefits will be required to settle the obligation, and the amount of the obligation can be measured reliably. The amount recognized as a provision is the best estimate of the consideration required to settle the present obligation at the balance sheet date, taking into account factors pertaining to a contingency such as the risks, uncertainties and time value of money. Where the effect of the time value of money is material, the amount of the provision is determined by discounting the related future cash outflows. Where all or some of the expenditure required to settle a provision is expected to be reimbursed by a third party, the reimbursement is recognized as a separate asset only when it is virtually certain that reimbursement will be received, and the amount of reimbursement recognized does not exceed the carrying amount of the provision. 24. Revenue 24.1 Revenue from sale of goods Revenue from sale of goods is recognized when (i) the Group has transferred to the buyer the significant risks and rewards of ownership of the goods, (ii) the Group retains neither continuing managerial involvement to the degree usually associated with ownership nor effective control over the goods sold, (iii) the amount of revenue can be measured reliably, (iv) it is probable that the associated economic benefits will flow to the Group, and (v) the associated costs incurred or to be incurred can be measured reliably. 24.2 Revenue from rendering of services Revenue from rendering of services is recognized when (1) the amount of revenue can be measured reliably, (2) it is probable that the associated economic benefits will flow to the enterprise, (3) the stage of completion of the transaction can be determined reliably, and (4) the associated costs incurred or to be incurred can be measured reliably. Revenue from rendering of services is recognized using the percentage of completion method at the balance sheet date. The stage of completion of a transaction for rendering for services is determined based on the proportion that costs incurred to date bear to the estimated total costs of the transaction. When the outcome of the transaction involving the rendering of services cannot be estimated reliably, revenue is recognized only to the extent of the costs incurred that will be recoverable, and the costs incurred are recognized as expenses for the period. When it is not probable that the costs incurred will be recovered, revenue is not recognized. 25. Government grants Government grants are transfer of monetary assets and non-monetary assets from the government to the Group at no consideration. Government grants are classified into government grants related to assets and government grants related to income according the subjects required by the Government documents. A government grant is recognized only when the Group can comply with the conditions attaching to the grant and the Group will receive the grant. If a government grant is in the form of a transfer of a monetary asset, it is measured at the amount received or receivable. If a government grant is in the form of a non-monetary asset, it is measured at fair value. If the fair value cannot be reliably determined, it is measured at a nominal amount. A government grant measured at a nominal amount is recognized immediately in profit or loss for the period. 25.1 Identification and accounting treatment of government grants related to assets
The Group's government grants include land eviction grant, subsidy for fixed assets purchase and technical transformation, because the grants are the government grants received by the Group to purchase or construct long-term assets, these grants are accounted for as government grants related to assets. The government grants related to assets are recognized as deferred income, and recognized in profit or loss in using the straight-line method over the useful life of the relevant assets.

SAIC MOTOR CORPORATION LIMITED NOTES TO THE FINANCIAL STATEMENTS YEAR ENDED DECEMBER 31, 2016
第 41 页
III. SIGNIFICANT ACCOUNTING POLICIES AND ACCOUNTING ESTIMATES - continued 25. Government grants- continued 25.2 Identification and accounting treatment of government grants related to income The Group's government grants mainly include allowance for project development and fiscal subsidies. These government grants are accounted for as government grants related to income. For a government grant related to income, if the grant is a compensation for related expenses or losses to be incurred in subsequent periods, the grant is recognized as deferred income, and recognized in profit or loss over the periods in which the related costs are recognized. If the grant is a compensation for related expenses or losses already incurred, the grant is recognized immediately in profit or loss for the period. For repayment of a government grant already recognized, if there is related deferred income, the repayment is offset against the carrying amount of the deferred income, and any excess is recognized in profit or loss for the period. If there is no related deferred income, the repayment is recognized immediately in profit or loss for the period.
Relocation compensation received for relocation in the public interests If the Group relocates for the benefits of the public interests such as overall planning of urban and rural areas and receives relocation compensation appropriated by the government directly from its fiscal budget, it recognizes such income as special payable. The income attributable to compensation for losses of fixed assets and intangible assets, related expenses, losses from suspension of production incurred during the relocation and reconstruction period, and purchases of assets after the relocation is transferred from special payable to deferred income and is accounted for as either a government grant related to an asset or a government grant related to income based on its nature. Any surplus of relocation compensation after deducting the amount transferred to deferred income is recognized as capital reserve. 26. Deferred tax assets/ deferred tax liabilities
The income tax expenses include current income tax and deferred income tax. 26.1 Current income tax At the balance sheet date, current income tax liabilities (or assets) for the current and prior periods are measured at the amount expected to be paid (or recovered) according to the requirements of tax laws. 26.2 Deferred tax assets and deferred tax liabilities
For temporary differences between the carrying amounts of certain assets or liabilities and their tax base, or between the nil carrying amount of those items that are not recognized as assets or liabilities and their tax base that can be determined according to tax laws, deferred tax assets and liabilities are recognized using the balance sheet liability method.
Deferred tax is generally recognized for all temporary differences. Deferred tax assets for deductible temporary differences are recognized to the extent that it is probable that taxable profits will be available against which the deductible temporary differences can be utilized. However, for temporary differences associated with the initial recognition of goodwill and the initial recognition of an asset or liability arising from a transaction (not a business combination) that affects neither the accounting profit nor taxable profits (or deductible losses) at the time of transaction, no deferred tax asset or liability is recognized. For deductible losses and tax credits that can be carried forward, deferred tax assets are recognized to the extent that it is probable that future taxable profits will be available against which the deductible losses and tax credits can be utilized.

SAIC MOTOR CORPORATION LIMITED NOTES TO THE FINANCIAL STATEMENTS YEAR ENDED DECEMBER 31, 2016
第 42 页
III. SIGNIFICANT ACCOUNTING POLICIES AND ACCOUNTING ESTIMATES - continued
26. Deferred tax assets/ deferred tax liabilities - continued
26.2 Deferred tax assets and deferred tax liabilities - continued
Deferred tax liabilities are recognized for taxable temporary differences associated with investments in subsidiaries and associates, and interests in joint ventures, except where the Group is able to control the timing of the reversal of the temporary difference and it is probable that the temporary difference will not reverse in the foreseeable future. Deferred tax assets arising from deductible temporary differences associated with such investments and interests are only recognized to the extent that it is probable that there will be taxable profits against which to utilize the benefits of the temporary differences and they are expected to reverse in the foreseeable future. At the balance sheet date, deferred tax assets and liabilities are measured at the tax rates, according to tax laws, that are expected to apply in the period in which the asset is realized or the liability is settled. Current and deferred tax expenses or income are recognized in profit or loss for the period, except when they arise from transactions or events that are directly recognized in other comprehensive income or in shareholders’ equity, in which case they are recognized in other comprehensive income or in shareholders’ equity, and when they arise from business combinations, in which case they adjust the carrying amount of goodwill. At the balance sheet date, the carrying amount of deferred tax assets is reviewed and reduced if it is no longer probable that sufficient taxable profits will be available in the future to allow the benefit of deferred tax assets to be utilized. Such reduction in amount is reversed when it becomes probable that sufficient taxable profits will be available. 26.3 Offset of income tax When the Group has a legal right to settle on a net basis and intends either to settle on a net basis or to realize the assets and settle the liabilities simultaneously, current tax assets and current tax liabilities are offset and presented on a net basis. When the Group has a legal right to settle current tax assets and liabilities on a net basis, and deferred tax assets and deferred tax liabilities relate to income taxes levied by the same taxation authority on either the same taxable entity or different taxable entities which intend either to settle current tax assets and liabilities on a net basis or to realize the assets and liabilities simultaneously, in each future period in which significant amounts of deferred tax assets or liabilities are expected to be reversed, deferred tax assets and deferred tax liabilities are offset and presented on a net basis. 27. Leases Leases are classified as finance leases whenever the terms of the lease transfer substantially all the risks and rewards of ownership to the lessee. All other leases are classified as operating leases. 27.1 Accounting treatment of operating lease 27.1.1 The Group as lessee under operating leases Operating lease payments are recognized on a straight-line basis over the term of the relevant lease, and are either included in the cost of related asset or charged to profit or loss for the period. Initial direct costs incurred are charged to profit or loss for the period. Contingent rents are charged to profit or loss in the period in which they are actually incurred. 27.1.2 The Group as lessor under operating leases Rental income from operating leases is recognized in profit or loss on a straight-line basis over the term of the relevant lease. Initial direct costs with more than an insignificant amount are capitalized when incurred, and are recognized in profit or loss on the same basis as rental income over the lease term. Other initial direct costs with an insignificant amount are charged to profit or loss in the period in which they are incurred. Contingent rents are charged to profit or loss in the period in which they actually arise.

SAIC MOTOR CORPORATION LIMITED NOTES TO THE FINANCIAL STATEMENTS YEAR ENDED DECEMBER 31, 2016
第 43 页
III. SIGNIFICANT ACCOUNTING POLICIES AND ACCOUNTING ESTIMATES - continued 27. Leases - continued 27.2 Accounting treatment of finance lease 27.2.1 The Group as lessee under finance leases Recognition and measurement of finance leased assets are set out in notes (III) 16.3 identification, valuation and depreciation method for fixed assets under finance lease.
Unrecognized finance charge is recognized as current finance charge by effective interest method during the lease term. Contingent rental is recognized in profit or loss when incurred. Minimum lease payment net of unrecognized finance charge is presented as long-term liabilities and long-term liabilities due within one year. 27.2.2 The Group as lessor under finance leases At the commencement of the lease term, the aggregate of the minimum lease receivable at the inception of the lease and the initial direct costs is recognized as a finance lease receivable, and the unguaranteed residual value is recorded at the same time. The difference between the aggregate of the minimum lease receivable, the initial direct costs and the unguaranteed residual value, and the aggregate of their present values is recognized as unearned finance income. Unearned finance income is recognized as finance income for the period using the effective interest method over the lease term. Contingent rents are credited to profit or loss in the period in which they are actually incurred. The net amount of finance lease receivables less unearned finance income is separated into long-term debts receivable and the portion of long-term debts receivable due within one year for presentation. 28. Other important accounting policies and accounting estimates 28.1 Transfer of assets under repurchase agreement 28.1.1 Financial assets purchased under resale agreements According to agreement, financial assets to be sold on certain future date are not recognized in balance sheet. Cost paid to purchase such assets, is presented in balance sheet as financial assets purchased under resale agreements. The difference between price to purchase and price to sell is calculated by effective interest method, recognized in interest income. 28.1.2 Financial assets sold under repurchase agreements According to agreement, financial assets to be purchased on future certain date are not recognized in balance sheet. Cash received from sale of such assets, is presented in balance sheet as financial assets sold under repurchase agreements. The difference between price to purchase and price to sell is calculated by effective interest method, recognized in interest expense. 28.2 Debt restructuring Recording of debt restructuring obligation as the debtor
When a debt is settled by cash in a debt restructuring, the difference between the carrying amount of the debt and the cash actually paid is recognized in profit or loss for the period. When a debt is satisfied by a transfer of non-cash asset(s), the difference between the carrying amount of the debt and the fair value of the non-cash asset(s) transferred is recognized in profit or loss for the period. The difference between the fair value of the non-cash asset(s) transferred and its (their) carrying amount(s) is recognized in profit or loss for the period. When a debt is converted into capital in a debt restructuring, the difference between the carrying amount of the debt and the fair value of the capital issued to the creditor is recognized in profit or loss for the period.

SAIC MOTOR CORPORATION LIMITED NOTES TO THE FINANCIAL STATEMENTS YEAR ENDED DECEMBER 31, 2016
第 44 页
III. SIGNIFICANT ACCOUNTING POLICIES AND ACCOUNTING ESTIMATES - continued 28. Other important accounting policies and accounting estimates - continued 28.2 Debt restructuring - continued Recording of debt restructuring obligation as the debtor - continued When a debt restructuring involves the modification of other terms of a debt, the restructured debt is recorded at the fair value of the debt with the modified terms. The difference between the carrying amount of the original debt and the recorded amount of the restructured debt is recognized in profit or loss for the period. When a debt restructuring adopts a combination of various methods, the carrying amount of the debt is reduced by, and in the sequence of, the cash payment, the fair value of the non-cash asset(s) transferred and the fair value of the capital issued to the creditor, and is then accounted for using the same treatment as the above debt restructuring involving the modification of other terms of a debt. 28.3 Safe production fund Safe production fund accrued according to relevant regulations is recognized in the cost of relevant products or profit or loss for the current period and is recorded as special reserve. Accounting treatments for the use of safe production fund are distinguished whether fixed assets are formed, for those in the nature of expenses are directly charged against special reserve, for those which form part of fixed assets, the accumulated cost is recognized in fixed assets when it is ready for intended use, meanwhile special reserve is reversed at the same amount and depreciation is recognized at the same amount.
IV BASIS OF DETERMINING SIGNIFICANT ACCOUNTING POLICIES AND KEY ASSUMPTIONS AND UNCERTAINTIES IN ACCOUNTING ESTIMATES In the application of the Group’s accounting policies, which are described in Note III, the Group is required to make judgments, estimates and assumptions about the carrying amounts of items in the financial statements that cannot be measured accurately, due to the inherent uncertainty of the operating activities. These judgments, estimates and assumptions are based on historical experiences of the Group’s management as well as other factors that are considered to be relevant. Actual results may differ from these estimates. The aforementioned judgments, estimates and assumptions are reviewed regularly on a going concern basis. The effect of a change in accounting estimate is recognized in the period of the change, if the change affects that period only; or recognized in the period of the change and future periods, if the change affects both. The followings are the critical judgments that the Group has made in the process of applying the accounting policies and that have significant effect on the amounts recognized in the financial statements: Bad debt provision for receivables The Group recognizes bad debt provision for receivables based on the assessment of the collectability of receivables. When there are indications that the collectability of receivables is in doubt, the Group recognizes bad debt provision. The management needs to make assumptions and judgement according to history of the collection, aging and financial condition of debtors when estimating bad debt provision, so the estimate of bad debt provision has uncertainty. If actual bad debt or re-estimate result is different from the current estimate, the difference will affect the book value of receivables during the period of changing estimate. Provision for decline in value of inventory The Group recognizes provision for decline in value of inventories based on estimate of the net realizable value of inventories. Net realizable value is the estimated selling price in the ordinary course of business less the estimated cost of completion, the estimated costs necessary to make the sale and related taxes. When there is any indication that net realizable value of inventory is lower than its cost, provision for decline in value of inventories is recognized. The determination of net realizable value involves judgment and estimate. If there is difference between re-estimate result and current estimate, the difference will affect book value of inventories during the period of changing estimate.

SAIC MOTOR CORPORATION LIMITED NOTES TO THE FINANCIAL STATEMENTS YEAR ENDED DECEMBER 31, 2016
第 45 页
IV. BASIS OF DETERMINING SIGNIFICANT ACCOUNTING POLICIES AND KEY ASSUMPTIONS AND UNCERTAINTIES IN ACCOUNTING ESTIMATES - continued Impairment of non-current assets The Group assesses at balance sheet date whether there is any indication that the non-current assets excluding financial assets may be impaired. If there is any indication that the book value of such non-current assets is not recoverable, the Group makes impairment assessment. Provision for impairment of an asset or an asset group is calculated by the lower of book value and recoverable amount. Recoverable amount of an asset or an asset group is determined by the higher of fair value less cost of disposal and the present value of the future cash flows of an asset or an asset group. When estimating present value of the future cash flows, the management needs to estimate the future cash flow and determine appropriate discount rate. When calculating fair value less cost of disposal, the fair value is the price that would be received to sell an asset in an orderly transaction between market participants. If re-estimated recoverable amount is lower than current estimate, the difference will affect book value of asset during the period of changing. Estimated useful life and residual value of fixed assets The Group determines the useful life and estimated net residual value of a fixed asset based on the historical experience in the actual useful life and net residual value of fixed assets with similar function and nature and can be significantly changed by technology renovation and other factors. When the estimated useful life and net residual value become different from the current estimate, the Group will change the useful life and estimated residual, and treat it as changes in accounting estimate. Capitalization of development expenditure Development expenditures which meet the criteria set out in Note (III) 19.2 are capitalized, otherwise such expenditures are expensed. Judgment and estimation are required when determining whether development expenditures are capitalized or expensed. Estimate of provision for warranty Warranty is estimated for expenditures and claims related to products sold. The Group estimates and makes corresponding provision for warranty based on contract terms and history experience. Provision for warranty involves judgment and estimate. If there is difference between re-estimate result and current estimate, the difference will affect book value of provisions during the period of changing. Recognition of deferred tax assets As of end of the year and beginning of the year, the Group recognized deferred tax assets amounting to RMB20,852,244,252.47 and RMB 16,991,606,228.73, respectively. Realization of deferred tax assets majorly depends on the future deductible taxable profits, and the tax rate of the period when deductible loss and temporary differences are utilized. If it is probable that sufficient taxable profit will not be available in future periods or the applicable tax rate is lower than the estimation to allow the benefit of the deferred tax asset to be realized, the carrying amount of the deferred tax asset is reversed and recognized in the profit or loss. In addition, as stated in Note (VI) 23, at the beginning and the end of the year, it was uncertain whether the Group could obtain sufficient taxable profits in the future, certain deductible losses and deductible temporary differences were not recognized as deferred tax assets. Actuarial valuation of defined benefit plans obligation The Group provides benefits to retired employees, employees in position and early-retired employees and this supplementary retirement benefits, which are defined benefit plans. The Group engaged professional institution to conduct actuarial valuation for liabilities and expenses of defined benefit plans. The amount of the supplementary retirement benefit expenses and liabilities are calculated by assumptions. The Group determined discount rate on the basis of government bonds rate, death rate on the basis of “China Life Insurance Mortality Table (2010-2013)” and benefit increase rate on basis of price index. If there is difference between reassessment of related assumptions and current assessment, the difference will change liabilities of defined benefit plans and other comprehensive income.

SAIC MOTOR CORPORATION LIMITED NOTES TO THE FINANCIAL STATEMENTS YEAR ENDED DECEMBER 31, 2016
第 46 页
V TAXES
Major categories of taxes and tax rates of the Group:
Category of tax Basis of tax computation/type of income Tax rate
Value-Added Tax (Note 1)
Sales of goods, rending of processing and repair and replacement services, and tangible movable property rental service
17%
Transportation service 11% Modern service (excluding real estate leases and tangible movable property rental services) (including research and technical services, and logistics support services, etc.)
6%
Immovable property rental services 11% or 5% Financial services 6%
Consumption tax Sales of automobiles by vehicle manufacturer 1% - 25% Business tax (Note 1) Immovable property rental services and Financial services 5% Enterprise income tax (Note 2) Enterprise taxable income 15%,25%
Note 1: According to Notice on Full Launch of the Pilot Scheme on Levying Value-added Tax in Place of
Business Tax (Cai Shui [2016] No. 36) which was jointly issued by Ministry of Finance and Statement Administration of Taxation, from May 1, 2016, the work to levy value added tax in place of business tax has been implemented all over the country, hence taxpayers of business tax regarding construction, real estate, finance and lifestyle services, etc. are all included in the pilot scope, paying VAT instead of business tax. The transition from business tax to VAT has been implemented over real estate leases and financial services of the Group from May 1, 2016.
Note 2: Enterprise income tax (hereinafter referred to as “EIT”) rates of the Company and major subsidiaries of
the current year are as follows:
(1) According to “Enterprise Income Tax Law of the People’s Republic of China” (hereinafter referred to as “EIT Law”) and other related regulations, the Company is recognized as a High-Technology Enterprise which is qualified to get the state’s special support. In 2014, the Company passed the reassessment of High-Technology Enterprise and the qualification is effective from 2014 to 2016. So the applicable income tax rate for the Company is 15% for the current year.
(2) SGMW is located in Liuzhou, Guangxi, which is covered in grand western development area. On
August 20, 2014, "Catalogue of Encouraged Industries in the Western Region (Order of The National Development and Reform Commission No.15) has included vehicle manufacturing and special vehicle manufacturing in the catalogue of encouraged industries of Guangxi and Chongqing. According to “Circular on the Issues Concerning Related Tax Policies for the In-depth Implementation of the West Development Strategy ” (Cai Shui[2011]No. 58), SGMW's headquarter in Liuzhou Guangxi and Chongqing Branch are subject to the EIT rate of 15%.
(3) According to the EIT Law and other relevant regulations, SAIC Motor Transmission Co., Ltd.,
and Shanghai Diesel Engine Co., Ltd. (“Shanghai Diesel”) were recognized as High-Technology Enterprises which was qualified to get the country’s special support. In 2014, SAIC Motor Transmission Co., Ltd. and Shanghai Diesel passed the reassessment of High-Technology Enterprise and the qualification is effective from 2014 to 2016. Therefore, these companies are subject to the EIT rate of 15% for the current year.
(4) According to the EIT Law, SAIC Volkswagen Sales Co., Ltd., SAIC General Motors Sales Co.,
Ltd., SAIC Finance Co., Ltd. ("SFC"), SAIC-GMAC Automotive Finance Co., Ltd. (“GMAC”), China United Automotive System Co., Ltd., HUAYU Automotive Systems Co., Ltd. (“HASCO”), SAIC Maxus Vehicle Co., Ltd.(“SAIC Maxus”), Anji Automotive Logistics Co., Ltd (“Anji Logistics”)., Shanghai Automotive Industry Sales Co., Ltd.(“Industry Sales”), Shanghai Automobile Import & Export Co., Ltd., SAIC Motor Equity Investment Co., Ltd., Donghua Automobile Industrial Co., Ltd.(“Donghua”), Shanghai Sunwin Bus Co., Ltd.(“Shanghai Sunwin”), Shanghai Shanghong Real Estate Co., Ltd.(“Shanghong Real Estate”) and SAIC Investment Management (“Investment Management”)Co., Ltd. are subject to the EIT rate of 25%.
(5) Income tax rates of the foreign subsidiary for the current year follow tax law in their respective
tax jurisdictions.
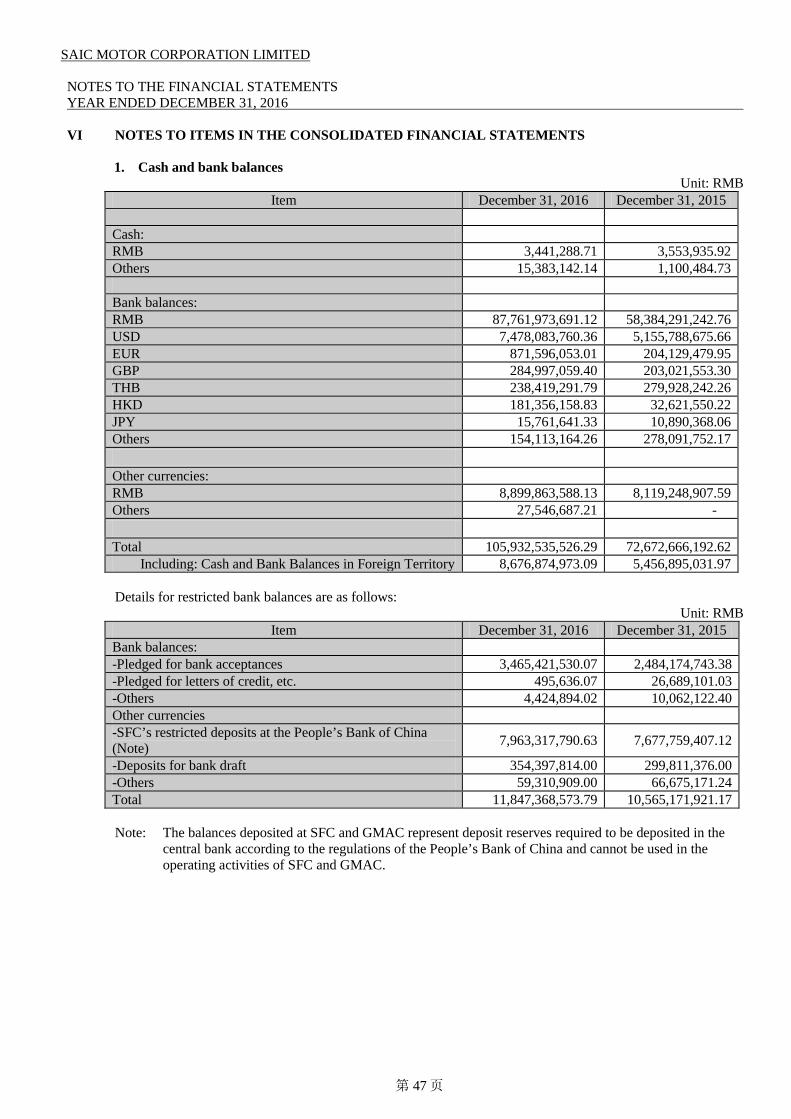
SAIC MOTOR CORPORATION LIMITED NOTES TO THE FINANCIAL STATEMENTS YEAR ENDED DECEMBER 31, 2016
第 47 页
VI NOTES TO ITEMS IN THE CONSOLIDATED FINANCIAL STATEMENTS
1. Cash and bank balances
Unit: RMB Item December 31, 2016 December 31, 2015
Cash: RMB 3,441,288.71 3,553,935.92 Others 15,383,142.14 1,100,484.73
Bank balances: RMB 87,761,973,691.12 58,384,291,242.76 USD 7,478,083,760.36 5,155,788,675.66 EUR 871,596,053.01 204,129,479.95 GBP 284,997,059.40 203,021,553.30 THB 238,419,291.79 279,928,242.26 HKD 181,356,158.83 32,621,550.22 JPY 15,761,641.33 10,890,368.06 Others 154,113,164.26 278,091,752.17
Other currencies: RMB 8,899,863,588.13 8,119,248,907.59 Others 27,546,687.21 - Total 105,932,535,526.29 72,672,666,192.62 Including: Cash and Bank Balances in Foreign Territory 8,676,874,973.09 5,456,895,031.97
Details for restricted bank balances are as follows:
Unit: RMB Item December 31, 2016 December 31, 2015
Bank balances: -Pledged for bank acceptances 3,465,421,530.07 2,484,174,743.38 -Pledged for letters of credit, etc. 495,636.07 26,689,101.03 -Others 4,424,894.02 10,062,122.40 Other currencies -SFC’s restricted deposits at the People’s Bank of China (Note) 7,963,317,790.63 7,677,759,407.12
-Deposits for bank draft 354,397,814.00 299,811,376.00 -Others 59,310,909.00 66,675,171.24 Total 11,847,368,573.79 10,565,171,921.17
Note: The balances deposited at SFC and GMAC represent deposit reserves required to be deposited in the
central bank according to the regulations of the People’s Bank of China and cannot be used in the operating activities of SFC and GMAC.

SAIC MOTOR CORPORATION LIMITED NOTES TO THE FINANCIAL STATEMENTS YEAR ENDED DECEMBER 31, 2016
第 48 页
VI. NOTES TO ITEMS IN THE CONSOLIDATED FINANCIAL STATEMENTS - continued
2. Financial assets at fair value through profit or loss Unit: RMB
Item Fair value at December 31, 2016
Fair value at December 31, 2015
Held-for-trading financial assets 8,542,400.00 111,413,005.47 Including: Equity instruments 8,542,400.00 111,413,005.47 Designated as financial assets at fair value through profit or loss 1,551,210,824.57 1,109,690,614.18
Including: Equity instruments 1,551,210,824.57 1,109,690,614.18 Total 1,559,753,224.57 1,221,103,619.65
Note: At the year-end, the equity instruments with fair value amounted to RMB 150,109,198.93 has been
pledged as collateral for borrowings, refer to Note VI, 38. 3. Notes receivable
(1) Details of notes receivable are as follows:
Unit: RMB Item December 31, 2016 December 31, 2015
Bank acceptances 29,711,490,453.19 35,508,680,679.43 Commercial acceptances 326,972,930.27 765,288,091.96 Total 30,038,463,383.46 36,273,968,771.39
(1) At the year-end, detail of bank acceptances that were pledged as collateral is as follow:
Unit: RMB Item December 31, 2016
Bank acceptances (Note 1) 792,100,803.00 Short-term borrowing collaterals(Note 2) 29,610,000.00 Total 821,710,803.00
Note1: Notes receivable were pledged as collateral to issue bank acceptances. Note2: Refer to Note VI, 25.
4. Accounts receivable
(1) Disclosure of accounts receivable by categories:
Unit: RMB Category
December 31, 2016 December 31, 2015 Book balance Bad debt provision Book value
Book balance Bad debt provision Book value Amount % Amount % Amount % Amount % Receivables for individually significant items and with individual provision for bad debts
- - - - - - - - - -
Receivables with provisions that were assessed by credit risk characteristics
31,750,039,675.48 100.00 1,087,958,742.31 100.00 30,662,080,933.17 29,975,370,402.04 100.00 642,999,449.29 100.00 29,332,370,952.75
Receivables for individually non-significant items but individual provision for bad debts
- - - - - - - - - -
Total 31,750,039,675.48 100.00 1,087,958,742.31 100.00 30,662,080,933.17 29,975,370,402.04 100.00 642,999,449.29 100.00 29,332,370,952.75

SAIC MOTOR CORPORATION LIMITED NOTES TO THE FINANCIAL STATEMENTS YEAR ENDED DECEMBER 31, 2016
第 49 页
VI. NOTES TO ITEMS IN THE CONSOLIDATED FINANCIAL STATEMENTS - continued
4. Accounts receivable - continued
(1) Disclosure of accounts receivable by categories – continued :
Aging analysis of accounts receivable is as follows: Unit: RMB
Aging
December 31, 2016 Book value Bad debt provision
Amount Proportion (%)
Amount Proportion (%)
Within 1 year 29,996,950,730.25 94.48 185,253,325.57 0.62 1-2 years 885,756,140.05 2.79 202,633,852.18 22.88 2-3 years 311,779,007.70 0.98 156,264,865.26 50.12 Over 3 years 555,553,797.48 1.75 543,806,699.30 97.89 Total 31,750,039,675.48 100.00 1,087,958,742.31 3.43
(2) Bad debt provision, withdrawal or reversal and written-off:
During the year, bad debt provision, reversal and written-off are RMB 317,948,838.06, RMB 69,729,702.25 and RMB 1,041,528.83 respectively. For increased bad debt due to changes of exchange rate, the amount is RMB 3,210,048.67. For increased bad debt provision due to changes in the scope of consolidation during the year, the amount is RMB194,991,416.74. For decreased bad debt provision due to changes in the scope of consolidation during the year, the amount is RMB 419,779.37.
(3) Top five balances of accounts receivable classified by debtor:
Unit: RMB
Name Relationship
with the Group
Amount Aging Proportion to total accounts receivable (%)
Company 1 JCE 4,806,407,913.90 Within 1 year 15.14 Company 2 JCE 3,469,691,531.50 Within 1 year 10.93 Company 3 JCE 1,801,682,633.59 Within 1 year 5.67 Company 4 Associate 1,376,049,892.71 Within 1 year 4.33 Company 5 JCE 1,227,262,107.74 Within 1 year 3.87 Total 12,681,094,079.44 39.94
(4) At the year-end, accounts receivable of RMB18,750,000.00 were pledged to banks as collateral for loans,
refer to Note (VI) 25. 5. Prepayments
(1) Aging analysis of prepayments is as follows:
Unit: RMB
Aging December 31, 2016 December 31, 2015 Amount Proportion (%) Amount Proportion (%)
Within 1 year 20,304,119,200.01 98.90 13,121,213,324.07 98.00 1-2 years 151,736,993.60 0.74 193,953,109.00 1.45 2-3 years 33,404,459.32 0.16 51,771,146.28 0.39 Over 3 years 40,397,372.77 0.20 21,714,112.64 0.16 Total 20,529,658,025.70 100.00 13,388,651,691.99 100.00

SAIC MOTOR CORPORATION LIMITED NOTES TO THE FINANCIAL STATEMENTS YEAR ENDED DECEMBER 31, 2016
第 50 页
VI. NOTES TO ITEMS IN THE CONSOLIDATED FINANCIAL STATEMENTS - continued
5. Prepayments - continued
(2) Top five balances of prepayments:
Unit: RMB
Name Relationship
with the Group
Amount Aging Proportion to total prepayments (%)
Company 1 JCE 15,422,722,168.90 Within 1 year 75.12 Company 2 Third party 661,873,309.87 Within 1 year 3.22 Company 3 Third party 364,131,673.43 Within 1 year 1.77 Company 4 Third party 289,711,304.83 Within 1 year 1.41 Company 5 Third party 201,661,728.90 Within 1 year 0.98
Total 16,940,100,185.93 82.50
6. Dividends receivable Unit: RMB
Item December 31, 2016 December 31, 2015 Dividends receivable due from JCEs 1,456,101,750.12 1,512,344,555.68 Dividends receivable due from associates 160,904,835.18 85,512,459.59 Others 5,985,169.52 - Total 1,622,991,754.82 1,597,857,015.27
7. Other receivables
(1) Disclosure of other receivables by categories:
Unit: RMB Category
December 31, 2016 December 31, 2015 Book balance Bad debt provision Book value Book balance Bad debt provision Book value Amount % Amount % Amount % Amount %
Other receivables for individually significant items and with individual provision for bad debts
136,599,388.17 1.84 136,599,388.17 29.33 - 136,628,388.17 2.46 136,628,388.17 29.39 -
Other receivables with provisions that were assessed by credit risk characteristics
7,289,861,118.42 98.16 329,135,592.19 70.67 6,960,725,526.23 5,409,131,386.28 97.54 328,231,269.51 70.61 5,080,900,116.77
Receivables for individually non-significant items but individual provision for bad debts
- - - - - - - - - -
Total 7,426,460,506.59 100.00 465,734,980.36 100.00 6,960,725,526.23 5,545,759,774.45 100.00 464,859,657.68 100.00 5,080,900,116.77
Aging analysis for other receivables is as follows:
Unit: RMB
Aging December 31, 2016
Book balance Bad debt provision Amount Proportion (%) Amount Proportion (%)
Within 1 year 6,094,244,320.85 83.60 82,351,164.99 1.35 1-2 years 858,918,345.00 11.78 77,500,260.76 9.02 2-3 years 124,369,854.03 1.71 46,378,193.12 37.29 Over 3 years 212,328,598.54 2.91 122,905,973.32 57.88 Total 7,289,861,118.42 100.00 329,135,592.19 4.51

SAIC MOTOR CORPORATION LIMITED NOTES TO THE FINANCIAL STATEMENTS YEAR ENDED DECEMBER 31, 2016
第 51 页
VI. NOTES TO ITEMS IN THE CONSOLIDATED FINANCIAL STATEMENTS - continued
7. Other receivables - continued
(2) Bad debt provision, withdrawal or reversal and written-off: During the year, bad debt provision, withdrawal or reversal, and written-off are RMB 31,374,745.86, RMB 64,443,174.59 and RMB 61,753,151.17 respectively. For increased bad debt provision due to changes in the foreign exchange rate during the year, the amount is RMB7,441,690.00. For increased bad debt provision due to changes in the scope of consolidation during the year, the amount is RMB90,171,509.31. For decreased bad debt provision due to changes in the scope of consolidation during the year, the amount is RMB1,916,296.73. (3) Disclosure of other receivables by nature:
Unit: RMB Nature of other receivables December 31, 2016 December 31, 2015
New energy subsidies 2,627,398,500.00 697,096,000.00 Disposal of assets 661,009,144.34 610,934,992.61 Advances to project 719,846,342.06 958,416,772.30 Guarantees, deposits, etc. 3,418,206,520.19 3,279,312,009.54 Total 7,426,460,506.59 5,545,759,774.45
(4) Top five balances of other receivables:
Unit: RMB
Name Relationship with the Group Amount Aging Proportion to total
other receivables (%) Company 1 Third party 1,844,438,500.00 Within 2 years 24.84 Company 2 Third party 731,468,000.00 Within 2 years 9.85 Company 3 Third party 661,009,144.34 Within 3 year 8.90 Company 4 Third party 275,026,667.31 Within 1 year 3.70 Company 5 Third party 131,217,108.40 Within 1 year 1.77 Total 3,643,159,420.05 49.06
8. Financial assets purchased under resale agreements
Unit: RMB
Item Closing balance Opening balance Financial assets purchased under resale agreements 978,112,755.49 -
9. Inventories
(1) Categories of inventories
Unit: RMB Item December 31, 2016 December 31, 2015
Book balance Provision Book value Book balance Provision Book value Raw materials 5,914,159,801.87 428,835,962.75 5,485,323,839.12 5,055,503,400.22 561,857,444.53 4,493,645,955.69 Work-in- process 1,444,784,240.35 72,329,980.44 1,372,454,259.91 1,341,485,023.66 67,769,542.40 1,273,715,481.26 Finished goods or goods on hand 31,337,867,616.08 1,155,863,909.19 30,182,003,706.89 32,498,000,327.63 1,193,408,856.41 31,304,591,471.22
Development costs - - - 171,489,040.81 - 171,489,040.81 Total 38,696,811,658.30 1,657,029,852.38 37,039,781,805.92 39,066,477,792.32 1,823,035,843.34 37,243,441,948.98

SAIC MOTOR CORPORATION LIMITED NOTES TO THE FINANCIAL STATEMENTS YEAR ENDED DECEMBER 31, 2016
第 52 页
VI. NOTES TO ITEMS IN THE CONSOLIDATED FINANCIAL STATEMENTS - continued
9. Inventories - continued
(2) Provision for decline in value of inventories Unit: RMB
Categories of inventories
December 31, 2015
Increase due to changes in the
scope of consolidation
Provision
Decrease during the year
December 31, 2016 Reversal Write-off
Raw materials 561,857,444.53 13,872,251.64 134,403,139.01 11,175,452.10 270,121,420.33 428,835,962.75 Work-in- process 67,769,542.40 15,213,604.70 28,298,769.18 5,477,474.74 33,474,461.10 72,329,980.44 Finished goods or goods on hand 1,193,408,856.41 68,084,697.30 464,508,624.67 56,857,846.63 513,280,422.56 1,155,863,909.19
Total 1,823,035,843.34 97,170,553.64 627,210,532.86 73,510,773.47 816,876,303.99 1,657,029,852.38
(3) Circumstances of provision for decline in value of inventories
Item Basis of provision for decline in value of inventories Reason for reversal of provision
Raw materials Lower of cost or net realizable value Value recovery Work-in-process Lower of cost or net realizable value Value recovery Finished goods or goods on hand Lower of cost or net realizable value Value recovery
10. Non-current assets due within one year
Unit: RMB Item December 31, 2016 December 31, 2015
Long-term loans due within one year (Note (VI)12) 51,361,586,216.03 28,168,396,145.83 Long-term receivables due within one year (Note (VI)14) 1,476,362,391.88 772,710,099.76 Other non-current assets due within one year(Note (VI)24) - 272,419,994.62 Total 52,837,948,607.91 29,213,526,240.21
11. Other current assets
Unit: RMB Item December 31, 2016 December 31, 2015
Short-term loans issued by SFC and GMAC 40,180,882,384.43 41,881,892,666.99 Input VAT to be deducted 2,205,423,854.16 1,325,267,276.57 Prepaid and deferred costs 409,873,637.22 416,181,577.57 Short-term entrusted loans 334,200,000.00 569,500,000.00 Wealth management products 315,000,000.00 550,000,000.00 Discount held by SFC 161,111,370.11 787,852,506.47 Receivables investment - 168,053,082.54 Sub-total 43,606,491,245.92 45,698,747,110.14 Less: Impairment loss on other current assets 1,153,644,618.84 876,771,674.92 Total 42,452,846,627.08 44,821,975,435.22
12. Loans and advances
Unit: RMB Item December 31, 2016 December 31, 2015
Long-term loans issued by SFC and GMAC 100,304,364,038.49 64,569,467,693.25 Less: Impairment loss on loans 2,722,724,109.39 1,724,980,703.74 Net book value of long-term loans issued 97,581,639,929.10 62,844,486,989.51 Less: Long-term loans due within one year (Note (VI)10) 51,361,586,216.03 28,168,396,145.83 Long-term loans due after one year 46,220,053,713.07 34,676,090,843.68

SAIC MOTOR CORPORATION LIMITED NOTES TO THE FINANCIAL STATEMENTS YEAR ENDED DECEMBER 31, 2016
第 53 页
VI. NOTES TO ITEMS IN THE CONSOLIDATED FINANCIAL STATEMENTS - continued
13. Available-for-sale financial assets
(1) Available-for-sale financial assets: Unit: RMB
Item December 31, 2016 December 31, 2015 Available-for-sale debt instruments 1,896,097,086.38 522,074,000.78 Available-for-sale equity instruments 48,588,652,410.96 64,972,935,647.47 -measured at fair value 48,334,334,570.96 64,775,823,055.47 -measured at cost 254,317,840.00 197,112,592.00 Total 50,484,749,497.34 65,495,009,648.25
(2) Available-for-sale financial assets measured at fair value:
Unit: RMB
Categories of available-for-sale financial assets December 31, 2016
Available-for-sale debt instruments
Available-for-sale equity instruments Total
Costs of equity instruments / amortized cost of debt instrument 36,618,020,336.06 1,894,818,086.59 38,512,838,422.65
Fair value 48,334,334,570.96 1,896,097,086.38 50,230,431,657.34 Accumulated amount of changes of fair value recognized in other comprehensive income 11,849,930,334.45 1,278,999.79 11,851,209,334.24
Impairment provisions 133,616,099.55 - 133,616,099.55
(3) Available-for-sale financial assets measured at cost: Unit: RMB
Investees
Book value Provision for impairment Equity interest held by the
Company as of the year end
(%)
Cash bonus in 2016 December 31,
2015
Increase during the
year
Decrease during the
year
December 31, 2016
December 31, 2015
Increase during the
year
December 31, 2016
GM Korea Company 494,566,740.00 - - 494,566,740.00 494,566,740.00 - 494,566,740.00 <10.00 - Tianjin Lovol Heavy Industries Co., Ltd. 10,000,000.00 - - 10,000,000.00 - - - <10.00 - Guoqi (Beijing) Lightweight of Automobile Technology Research Institute Co., Ltd. 3,000,000.00 - - 3,000,000.00 - - - <10.00 -
Shanghai International Trust & Investment Co., Ltd. 119,560,000.00 51,000,000.00 - 170,560,000.00 - - - <10.00 -
Jiangsu Zijin Rural Commercial Bank Co., Ltd. 28,984,200.00 - - 28,984,200.00 - - - <1.00 448,208.64
Shanghai Shangguotou Asset Management Co., Ltd. 2,440,000.00 - - 2,440,000.00 - - - <10.00 -
Others 43,060,629.06 15,584,100.00 28,392.00 58,616,337.06 9,932,237.06 9,350,460.00 19,282,697.06 3,115,121.81 Total 701,611,569.06 66,584,100.00 28,392.00 768,167,277.06 504,498,977.06 9,350,460.00 513,849,437.06 3,563,330.45
(4) Impairment loss on available-for-sale financial assets:
Unit: RMB
Available-for-sale equity instruments
Impairment provisions at the beginning of the year 514,256,597.06 Provision 138,101,339.55 Write-off 4,892,400.00 Impairment provisions at the end of the year 647,465,536.61
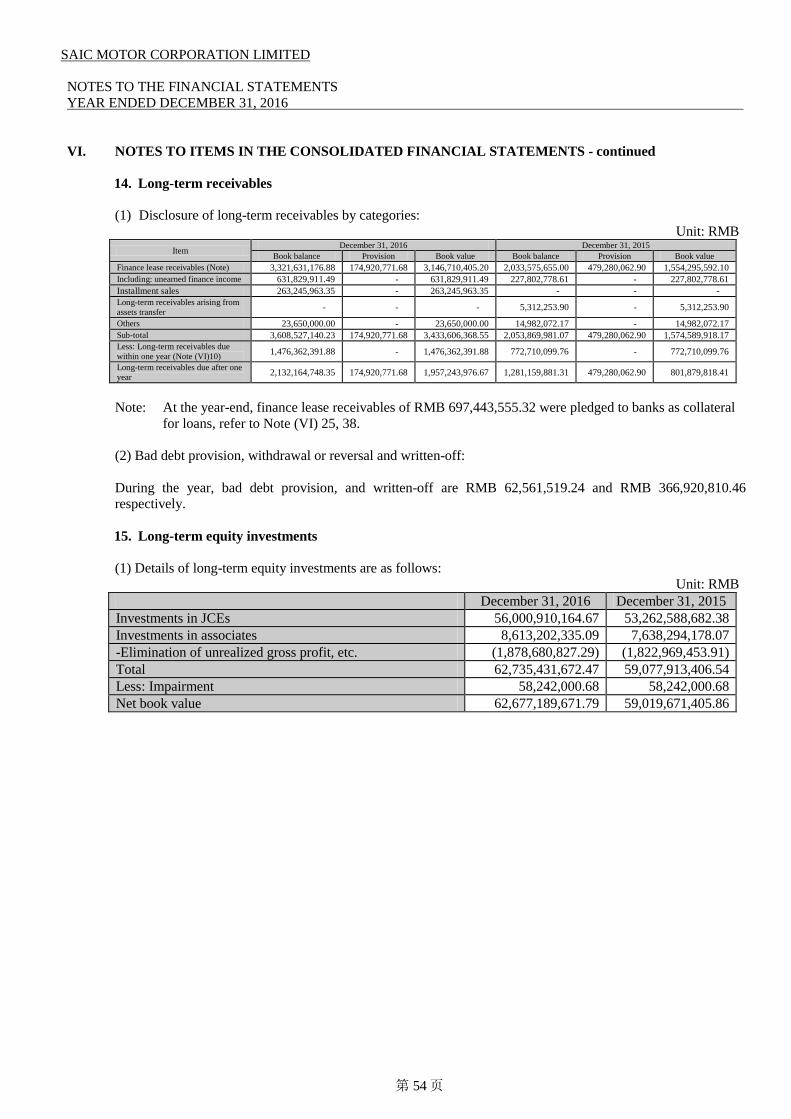
SAIC MOTOR CORPORATION LIMITED NOTES TO THE FINANCIAL STATEMENTS YEAR ENDED DECEMBER 31, 2016
第 54 页
VI. NOTES TO ITEMS IN THE CONSOLIDATED FINANCIAL STATEMENTS - continued
14. Long-term receivables
(1) Disclosure of long-term receivables by categories: Unit: RMB
Item December 31, 2016 December 31, 2015 Book balance Provision Book value Book balance Provision Book value
Finance lease receivables (Note) 3,321,631,176.88 174,920,771.68 3,146,710,405.20 2,033,575,655.00 479,280,062.90 1,554,295,592.10 Including: unearned finance income 631,829,911.49 - 631,829,911.49 227,802,778.61 - 227,802,778.61 Installment sales 263,245,963.35 - 263,245,963.35 - - - Long-term receivables arising from assets transfer - - - 5,312,253.90 - 5,312,253.90
Others 23,650,000.00 - 23,650,000.00 14,982,072.17 - 14,982,072.17 Sub-total 3,608,527,140.23 174,920,771.68 3,433,606,368.55 2,053,869,981.07 479,280,062.90 1,574,589,918.17 Less: Long-term receivables due within one year (Note (VI)10) 1,476,362,391.88 - 1,476,362,391.88 772,710,099.76 - 772,710,099.76
Long-term receivables due after one year 2,132,164,748.35 174,920,771.68 1,957,243,976.67 1,281,159,881.31 479,280,062.90 801,879,818.41
Note: At the year-end, finance lease receivables of RMB 697,443,555.32 were pledged to banks as collateral
for loans, refer to Note (VI) 25, 38. (2) Bad debt provision, withdrawal or reversal and written-off:
During the year, bad debt provision, and written-off are RMB 62,561,519.24 and RMB 366,920,810.46 respectively. 15. Long-term equity investments
(1) Details of long-term equity investments are as follows:
Unit: RMB December 31, 2016 December 31, 2015
Investments in JCEs 56,000,910,164.67 53,262,588,682.38 Investments in associates 8,613,202,335.09 7,638,294,178.07 -Elimination of unrealized gross profit, etc. (1,878,680,827.29) (1,822,969,453.91) Total 62,735,431,672.47 59,077,913,406.54 Less: Impairment 58,242,000.68 58,242,000.68 Net book value 62,677,189,671.79 59,019,671,405.86

SAIC MOTOR CORPORATION LIMITED NOTES TO THE FINANCIAL STATEMENTS YEAR ENDED DECEMBER 31, 2016
第 55 页
VI. NOTES TO ITEMS IN THE CONSOLIDATED FINANCIAL STATEMENTS - continued
15. Long-term equity investments - continued
(2) Details of long-term equity investments are as follows: Unit: RMB
Invested companies December 31, 2015 Increase (decrease) during the year December 31, 2016 Equity interest held by the Company
as of the year-end (%) Impairment at the
year-end
Provision for impairment for the
year Directly Indirectly
JCEs SAIC Volkswagen Automotive Co., Ltd. 20,426,731,263.83 608,334,038.49 21,035,065,302.32 50.00 - - - Pan Asia Technical Automotive Center Co., Ltd. 592,237,413.62 72,909,694.00 665,147,107.62 50.00 - - -
Shanghai Jieneng Automotive Technology Co., Ltd. (Note 3) 19,997,583.22 (323,352.49) 19,674,230.73 - 10.00 - -
Shanghai Advanced Traction Battery Systems Co., Ltd. (Note 3) 23,868,453.68 5,832,218.59 29,700,672.27 - 51.00 - -
SAIC General Motors Co., Ltd. 16,187,811,638.36 (94,735,858.31) 16,093,075,780.05 50.00 - - - SAIC GM Dong Yue Motors Co., Ltd. 569,623,625.35 33,367,430.19 602,991,055.54 25.00 25.00 - - Shanghai GM Dong Yue Powertrain Co., Ltd. 1,588,050,079.37 (32,980,939.40) 1,555,069,139.97 25.00 25.00 - -
Shanghai GM (Shenyang) Norsom Motors Co., Ltd. 700,996,754.53 (46,924,844.20) 654,071,910.33 25.00 25.00 - -
ZF Transmissions Shanghai Co., Ltd. (Note 3) 216,510,080.75 (28,674,621.54) 187,835,459.21 - 49.00 - -
Shanghai SAIC Magneti Marelli Powertrain Co., Ltd 99,065,379.76 19,672,716.59 118,738,096.35 - 50.00 - -
United Automotive Electronic Systems Co., Ltd. (Note 3) 2,963,757,221.03 810,922,683.77 3,774,679,904.80 - 49.00 - -
Nanjing Iveco Automobile Co., Ltd. 1,521,789,847.16 (176,431,029.35) 1,345,358,817.81 - 50.00 - - Shanghai MHI Engine Co., Ltd. 67,458,721.84 (14,538,069.80) 52,920,652.04 - 50.00 - - Shanghai Onstar Telematics Co., Ltd. 81,047,314.52 4,533,628.62 85,580,943.14 - 50.00 - - Nanjing Automotive Forging Co., Ltd. 144,726,144.11 14,691,944.30 159,418,088.41 - 50.00 - - Tianjin Zhongxing Auto Parts Co., Ltd. 25,181,072.10 (132,387.72) 25,048,684.38 - 50.00 - - Contitech Fluid Shanghai Co., Ltd. (Note 3) 26,742,430.63 (1,793,065.11) 24,949,365.52 - 49.00 - - Shanghai Inteva Automotive Parts Co., Ltd. 77,457,501.58 21,465,908.77 98,923,410.35 - 50.00 - - Shanghai TRW Automotive Safety Systems Co., Ltd. 182,422,222.54 (24,475,772.46) 157,946,450.08 - 50.00 - -
Boschi Huayu Steering Systems Co.,Ltd.(Note 3) 1,193,870,889.25 102,518,873.30 1,296,389,762.55 - 49.00 - -
Shanghai Koito Automotive Lamp Co., Ltd. 733,956,617.46 38,602,894.43 772,559,511.89 - 50.00 - -

SAIC MOTOR CORPORATION LIMITED NOTES TO THE FINANCIAL STATEMENTS YEAR ENDED DECEMBER 31, 2016
第 56 页
VI. NOTES TO ITEMS IN THE CONSOLIDATED FINANCIAL STATEMENTS - continued 15. Long-term equity investments - continued
(2) Details of long-term equity investments are as follows - continued:
Unit: RMB
Invested companies December 31, 2015 Increase (decrease) during the year December 31, 2016 Equity interest held by the Company
as of the year-end (%) Impairment at the
year-end
Provision for impairment for the
year
Directly Indirectly JCEs - continued Kolbenschmidt shanghai piston Co., Ltd. 234,797,262.06 33,066,557.79 267,863,819.85 - 50.00 - - Shanghai Valeo Automotive Electrical Systems Co., Ltd. 400,379,003.05 45,989,061.32 446,368,064.37 - 50.00 - - Shanghai Kolbenschmidt Pierburg Shanghai Nonferrous Components Co., Ltd. 427,771,262.70 69,081,159.79 496,852,422.49 - 50.00 - - Shanghai GKN Drive System Co., Ltd. (Note 3) 1,364,379,192.91 111,086,534.88 1,475,465,727.79 - 45.00 - - Dongfeng Yanfeng Automotive Trim Systems Co., Ltd. 91,848,306.00 47,511,578.00 139,359,884.00 - 50.00 - - Shanghai Sachs Powertrain Components Parts System Co., Ltd. 123,988,295.85 938,377.20 124,926,673.05 - 50.00 - - Shanghai Behr Thermal System Co., Ltd. 336,780,695.86 48,447,965.10 385,228,660.96 - 50.00 - - Yan Feng Gabriel (Shanghai) Automotive Safety Systems Co., Ltd.(Note 3) 340,012,345.00 277,542,851.00 617,555,196.00 - 50.10 - - Yanfeng Plastic Omnium Automotive Exterior Trimming System Co., Ltd. (Note 3) 570,961,815.00 43,312,973.00 614,274,788.00 - 50.05 - -
Hua Dong Teksid Automotive Foundry Co., Ltd. 231,084,603.37 (866,181.73) 230,218,421.64 - 50.00 - - Pierburg Huayu Pump Technology Co. Ltd. (Note 6) 7,752,917.76 20,839,008.97 28,591,926.73 - 50.00 - - Founding of Yanfeng Visteon Investment Co., Ltd. 262,570,938.00 55,240,433.00 317,811,371.00 - 50.00 - - Dongfeng Yanfeng Shiyan Automotive Trim Systems Co., Ltd. 182,919,776.00 (9,355,761.00) 173,564,015.00 - 50.00 - - Yanfeng Johnson Controls Automotive Seating Mechanical Parts Co., Ltd. 266,032,610.00 47,091,730.00 313,124,340.00 - 50.00 - - KS HUAYU Alu Tech GmbH 153,179,079.40 41,995,329.60 195,174,409.00 - 50.00 - - CRH Automotive Systems (Shenyang) Co., Ltd. 50,320,715.00 (160,137.00) 50,160,578.00 - 50.00 - - Huayu Continental Brake Systems (Chongqing) Co., Ltd.(Note 6) 33,483,041.86 36,730,113.73 70,213,155.59 - 50.00 - - Shanghai Anji Riyou Vehicle Transportation Co., Ltd. (Note 3) 25,831,518.04 16,923,635.64 42,755,153.68 - 51.00 - - Shanghai Anjie Car Transportation Co., Ltd. 34,202,954.37 6,306,441.58 40,509,395.95 - 50.00 - - Dalian Hai Jia Automobile Harbor Co., Ltd. 200,000,000.00 - 200,000,000.00 - 50.00 - - Nanjing Harbor Jiangsheng Vehicle Dock Co., Ltd. (Note 6) 15,166,621.66 35,015,140.03 50,181,761.69 - 50.00 - - Guangzhou Harbor Haijia Vehicle Dock Co., Ltd. (Note 6) 27,552,842.05 76,435,515.85 103,988,357.90 - 50.00 - - Shanghai Anfu Logistics Co., Ltd.(Note1,3) - 49,666,809.78 49,666,809.78 - 49.00 - - Shanghai Anji Xunda Automobile Transportation Co., Ltd.(Note1,3) - 32,410,398.39 32,410,398.39 - 49.00 - - Tianjin Port Haijia Automotive Terminal Co., Ltd.(Note2,,3) - 97,809,134.96 97,809,134.96 - 49.00 - - Hangzhou Chang'an Minsheng Anji Logistics Co., Ltd.(Note2) - 10,607,906.49 10,607,906.49 - 50.00 - -

SAIC MOTOR CORPORATION LIMITED NOTES TO THE FINANCIAL STATEMENTS YEAR ENDED DECEMBER 31, 2016
第 57 页
VI. NOTES TO ITEMS IN THE CONSOLIDATED FINANCIAL STATEMENTS - continued
15. Long-term equity investments - continued
(2) Details of long-term equity investments are as follows - continued:
Unit: RMB
Invested companies December 31, 2015 Increase (decrease) during the year December 31, 2016 Equity interest held by the Company
as of the year-end (%) Impairment at the
year-end
Provision for impairment for the
year Directly Indirectly
JCEs - continued Anji Car Rental Co., Ltd. 225,508,873.10 (3,153,108.00) 222,355,765.10 - 50.00 - - Beijing Boruiyechuan Car Service Co., Ltd. 66,624,384.38 (11,753,625.57) 54,870,758.81 - 50.00 - - Shanghai Volkswagen Automotive Anting Sales&Service Co., Ltd. (Note2) - 1,737,133.67 1,737,133.67 - 50.00 - -
SAIC Qingdao Clean Energy Bus Co., Ltd.(Note3) 96,759,632.62 (344,759.85) 96,414,872.77 - 51.02 - - Others 49,377,741.65 246,327,175.00 295,704,916.65 Subtotal of joint ventures 53,262,588,682.38 2,738,321,482.29 56,000,910,164.67 Associates Shanghai Volkswagen Powertrain Co., Ltd. 1,919,177,286.87 49,203,526.86 1,968,380,813.73 40.00 - - - Volkswagen Transmission (Shanghai ) Co., Ltd. 254,876,500.79 1,706,724.55 256,583,225.34 20.00 - - - China Automobile Development United Investment Co., Ltd. 28,468,778.51 4,250,241.51 32,719,020.02 - 20.74 - -
Shanghai Huizhong Sachs Shock absorber Co., Ltd 166,230,940.78 (8,880,078.80) 157,350,861.98 - 40.00 - - Shanghai ThyssenKrupp Presta HuiZhong Co., Ltd. 226,152,316.33 3,454,159.44 229,606,475.77 - 40.00 - - Shanghai Benteler Huizhong Automotive Parts Co., Ltd. 154,940,778.90 (33,846,911.53) 121,093,867.37 - 40.00 - - Shanghai Sanli-Huizhong Auto Parts Co., Ltd. 199,375,263.91 2,912,976.36 202,288,240.27 - 40.00 - - Shanghai Mhi Turbocharger Co., Ltd. 237,614,399.16 37,034,451.92 274,648,851.08 - 40.00 - - Shanghai Edscha Machinery Co., Ltd. 94,485,894.59 (5,196,023.15) 89,289,871.44 - 45.00 - - Shanghai Wanzhong Car Service Co., Ltd. 10,569,339.32 232,922.85 10,802,262.17 - 49.00 - - Shanghai Tenneco Exhaust System Co. , Ltd. 151,271,530.70 50,272,210.15 201,543,740.85 - 45.00 - - Shanghai New Holland Agricultural Machinery Co., Ltd. 27,680,080.68 - 27,680,080.68 - 40.00 27,680,080.68 - Federal-Mogul Shanghai Bearing Co., Ltd. 69,843,921.53 6,113,535.09 75,957,456.62 - 40.00 - - Shanghai Federal-Mogul Compound Material Co., Ltd. 26,427,555.38 4,232,504.87 30,660,060.25 - 40.00 - - Yapp Automotive Parts Co., Ltd. 514,585,260.77 133,837,283.01 648,422,543.78 - 33.90 - - Shanghai Aichi Forging Co., Ltd. 166,266,518.08 16,562,900.34 182,829,418.42 - 40.00 - - Shanghai Neturen Co., Ltd. 101,308,865.10 3,311,445.79 104,620,310.89 - 40.00 - -

SAIC MOTOR CORPORATION LIMITED NOTES TO THE FINANCIAL STATEMENTS YEAR ENDED DECEMBER 31, 2016
第 58 页
VI. NOTES TO ITEMS IN THE CONSOLIDATED FINANCIAL STATEMENTS - continued
15. Long-term equity investments - continued
(2) Details of long-term equity investments are as follows - continued:
Unit: RMB
Invested companies December 31, 2015 Increase (decrease) during the year December 31, 2016 Equity interest held by the Company
as of the year-end (%) Impairment at the
year-end
Provision for impairment for the
year Directly Indirectly
Associates - continued Shanghai Meridian Magnesium Products Co., Ltd. 76,642,043.14 22,919,107.66 99,561,150.80 - 40.00 - - Shanghai Xingsheng Gasket Co., Ltd. 30,328,925.49 872,927.60 31,201,853.09 - 40.00 - - Shanghai Boze Auto Parts Co., Ltd. 115,275,367.67 (5,356,032.27) 109,919,335.40 - 40.00 - - Valeo Shanghai Automotive Electric Motors & Wiper System Co., Ltd. 111,960,487.49 17,055,059.73 129,015,547.22 - 27.00 - -
Shanghai Inteva Automotive Door Systems Co., Ltd. 135,808,922.43 16,224,455.79 152,033,378.22 - 40.00 - - Shanghai LEAR STEC Automotive Parts Co., Ltd. 144,158,218.89 6,245,146.22 150,403,365.11 - 45.00 - - Sanden (Suzhou) Precision Parts Co., Ltd. 41,387,965.42 3,181,800.18 44,569,765.60 - 35.00 - - Wuhan TACHI-S Johnson Controls Automotive Seat Co., Ltd. 34,537,614.00 2,668,551.00 37,206,165.00 - 20.00 - -
Continental Brake Systems (Shanghai) Co., Ltd. 46,758,617.19 7,893,845.24 54,652,462.43 - 49.00 - - Beijing Hainachuan Yanfeng Automotive Module System Co., Ltd. 4,691,192.00 (554,882.00) 4,136,310.00 - 40.00 - -
Dongfeng Johnson Controls Automotive Seating Co., Ltd. (Note 9) 73,894,664.00 28,993,866.00 102,888,530.00 - 50.00 - -
Shaanxi Qinghua Automotive Safety System Co., Ltd. (Note2) - 178,631,865.43 178,631,865.43 - 35.00 - -
Nanjing Fata Tooling Co., Ltd. 236,460.00 - 236,460.00 - 30.00 236,460.00 - Avanzar Interior Products LLC 9,905,582.00 17,050,159.00 26,955,741.00 - 48.51 - - SAIC Motor Korea Co.,Ltd. (Note4) - - - - 24.00 - - Easunlux S.A (Note 5) 96,671,822.73 (96,671,822.73) - - - - - Chongqing Henglong Hongyan Automotive Steering Co., Ltd. (Note7) - 13,533,209.52 13,533,209.52 - 30.00 - -
Shanghai Jingcheng Auction Co., Ltd. (Note 5) 3,515,085.46 (3,515,085.46) - - - - - Jiangsu Used Motor Vehicle Market Co., Ltd. 6,200,697.28 2,396,893.48 8,597,590.76 - 35.00 - - Nanjing Auto Parts Factory 3,421,258.87 (89,197.20) 3,332,061.67 - 45.00 - -
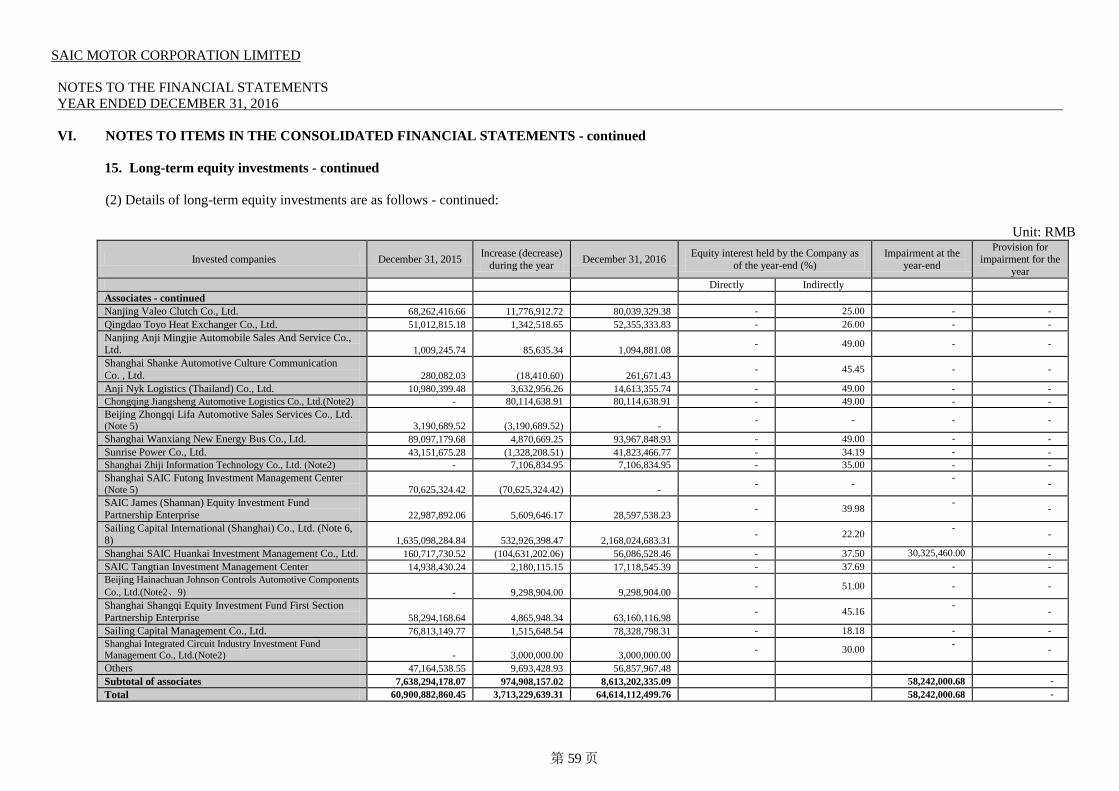
SAIC MOTOR CORPORATION LIMITED NOTES TO THE FINANCIAL STATEMENTS YEAR ENDED DECEMBER 31, 2016
第 59 页
VI. NOTES TO ITEMS IN THE CONSOLIDATED FINANCIAL STATEMENTS - continued
15. Long-term equity investments - continued
(2) Details of long-term equity investments are as follows - continued:
Unit: RMB
Invested companies December 31, 2015 Increase (decrease) during the year December 31, 2016 Equity interest held by the Company as
of the year-end (%) Impairment at the
year-end
Provision for impairment for the
year Directly Indirectly
Associates - continued Nanjing Valeo Clutch Co., Ltd. 68,262,416.66 11,776,912.72 80,039,329.38 - 25.00 - - Qingdao Toyo Heat Exchanger Co., Ltd. 51,012,815.18 1,342,518.65 52,355,333.83 - 26.00 - - Nanjing Anji Mingjie Automobile Sales And Service Co., Ltd. 1,009,245.74 85,635.34 1,094,881.08 - 49.00 - -
Shanghai Shanke Automotive Culture Communication Co. , Ltd. 280,082.03 (18,410.60) 261,671.43 - 45.45 - -
Anji Nyk Logistics (Thailand) Co., Ltd. 10,980,399.48 3,632,956.26 14,613,355.74 - 49.00 - - Chongqing Jiangsheng Automotive Logistics Co., Ltd.(Note2) - 80,114,638.91 80,114,638.91 - 49.00 - - Beijing Zhongqi Lifa Automotive Sales Services Co., Ltd. (Note 5) 3,190,689.52 (3,190,689.52) - - - - -
Shanghai Wanxiang New Energy Bus Co., Ltd. 89,097,179.68 4,870,669.25 93,967,848.93 - 49.00 - - Sunrise Power Co., Ltd. 43,151,675.28 (1,328,208.51) 41,823,466.77 - 34.19 - - Shanghai Zhiji Information Technology Co., Ltd. (Note2) - 7,106,834.95 7,106,834.95 - 35.00 - - Shanghai SAIC Futong Investment Management Center (Note 5) 70,625,324.42 (70,625,324.42) - - - - -
SAIC James (Shannan) Equity Investment Fund Partnership Enterprise 22,987,892.06 5,609,646.17 28,597,538.23 - 39.98 - -
Sailing Capital International (Shanghai) Co., Ltd. (Note 6, 8) 1,635,098,284.84 532,926,398.47 2,168,024,683.31 - 22.20 - -
Shanghai SAIC Huankai Investment Management Co., Ltd. 160,717,730.52 (104,631,202.06) 56,086,528.46 - 37.50 30,325,460.00 - SAIC Tangtian Investment Management Center 14,938,430.24 2,180,115.15 17,118,545.39 - 37.69 - - Beijing Hainachuan Johnson Controls Automotive Components Co., Ltd.(Note2、9) - 9,298,904.00 9,298,904.00 - 51.00 - -
Shanghai Shangqi Equity Investment Fund First Section Partnership Enterprise 58,294,168.64 4,865,948.34 63,160,116.98 - 45.16 - -
Sailing Capital Management Co., Ltd. 76,813,149.77 1,515,648.54 78,328,798.31 - 18.18 - - Shanghai Integrated Circuit Industry Investment Fund Management Co., Ltd.(Note2) - 3,000,000.00 3,000,000.00 - 30.00 - -
Others 47,164,538.55 9,693,428.93 56,857,967.48 Subtotal of associates 7,638,294,178.07 974,908,157.02 8,613,202,335.09 58,242,000.68 - Total 60,900,882,860.45 3,713,229,639.31 64,614,112,499.76 58,242,000.68 -
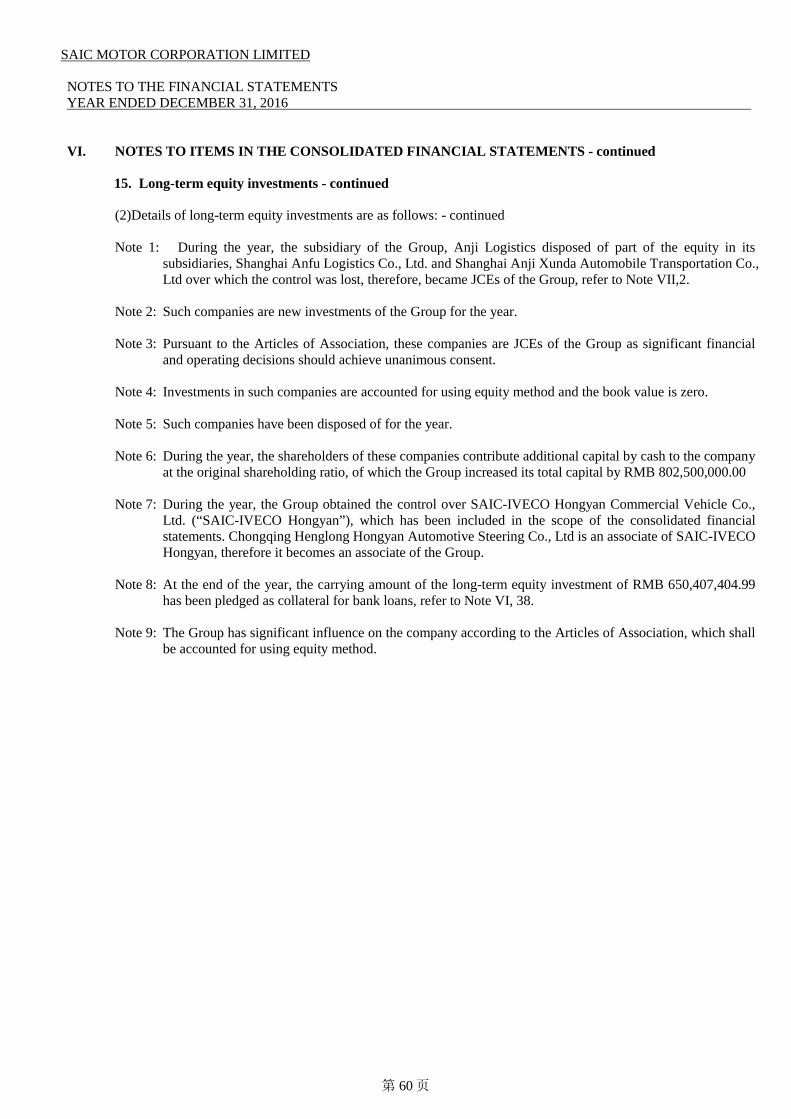
SAIC MOTOR CORPORATION LIMITED NOTES TO THE FINANCIAL STATEMENTS YEAR ENDED DECEMBER 31, 2016
第 60 页
VI. NOTES TO ITEMS IN THE CONSOLIDATED FINANCIAL STATEMENTS - continued 15. Long-term equity investments - continued
(2)Details of long-term equity investments are as follows: - continued
Note 1: During the year, the subsidiary of the Group, Anji Logistics disposed of part of the equity in its
subsidiaries, Shanghai Anfu Logistics Co., Ltd. and Shanghai Anji Xunda Automobile Transportation Co., Ltd over which the control was lost, therefore, became JCEs of the Group, refer to Note VII,2.
Note 2: Such companies are new investments of the Group for the year.
Note 3: Pursuant to the Articles of Association, these companies are JCEs of the Group as significant financial
and operating decisions should achieve unanimous consent.
Note 4: Investments in such companies are accounted for using equity method and the book value is zero.
Note 5: Such companies have been disposed of for the year.
Note 6: During the year, the shareholders of these companies contribute additional capital by cash to the company at the original shareholding ratio, of which the Group increased its total capital by RMB 802,500,000.00
Note 7: During the year, the Group obtained the control over SAIC-IVECO Hongyan Commercial Vehicle Co.,
Ltd. (“SAIC-IVECO Hongyan”), which has been included in the scope of the consolidated financial statements. Chongqing Henglong Hongyan Automotive Steering Co., Ltd is an associate of SAIC-IVECO Hongyan, therefore it becomes an associate of the Group.
Note 8: At the end of the year, the carrying amount of the long-term equity investment of RMB 650,407,404.99
has been pledged as collateral for bank loans, refer to Note VI, 38. Note 9: The Group has significant influence on the company according to the Articles of Association, which shall
be accounted for using equity method.

SAIC MOTOR CORPORATION LIMITED NOTES TO THE FINANCIAL STATEMENTS YEAR ENDED DECEMBER 31, 2016
第 61 页
VI. NOTES TO ITEMS IN THE CONSOLIDATED FINANCIAL STATEMENTS - continued 16. Investment properties
(1) Movements of investment properties measured at cost are as follows:
Unit: RMB Item Buildings Land use right Total
I. Cost December 31, 2015 3,110,629,421.33 749,206,807.71 3,859,836,229.04 Transfer from construction in progress during the year 80,540,193.91 - 80,540,193.91
Transfer from intangible assets during the year - 22,839,030.01 22,839,030.01
Transfer from fixed assets during the year 499,946,288.68 - 499,946,288.68
Disposals during the year 418,445,780.69 59,585,241.17 478,031,021.86 Transfer to intangible assets during the year - 16,870,135.00 16,870,135.00
Transfer to building for self-use during the year 72,669,866.29 - 72,669,866.29
December 31, 2016 3,200,000,256.94 695,590,461.55 3,895,590,718.49 II. Accumulated depreciation and amortization
December 31, 2015 1,033,483,993.26 141,390,882.33 1,174,874,875.59 Provision during the year 117,964,400.30 14,353,737.84 132,318,138.14 Transfer from intangible assets during the year - 92,470.00 92,470.00
Transfer from fixed assets during the year 321,667,576.66 - 321,667,576.66
Disposals during the year 249,390,521.16 16,905,329.99 266,295,851.15 Transfer to intangible assets during the year - 726,486.00 726,486.00
Transfer to building for self-use during the year 13,171,989.14 - 13,171,989.14
December 31, 2016 1,210,553,459.92 138,205,274.18 1,348,758,734.10 III. Net book value December 31, 2016 1,989,446,797.02 557,385,187.37 2,546,831,984.39 December 31, 2015 2,077,145,428.07 607,815,925.38 2,684,961,353.45
(2) Details of the investment properties that have not been obtained the certificates of titles are as follows:
Unit: RMB
Item Book value as at December 31, 2016
Reasons why certificates of title have not been obtained
Buildings 199,173,394.75 In progress

SAIC MOTOR CORPORATION LIMITED NOTES TO THE FINANCIAL STATEMENTS YEAR ENDED DECEMBER 31, 2015
第 62 页
VI. NOTES TO ITEMS IN THE CONSOLIDATED FINANCIAL STATEMENTS - continued
17. Fixed assets
(1) General
Unit: RMB Item Buildings Machinery and equipment Electronic equipment,
furniture and fixtures Transportation vehicles Mold Total
I. Cost December 31, 2015 20,410,955,306.81 42,013,643,946.54 4,109,388,464.39 2,339,542,972.64 5,816,717,605.02 74,690,248,295.40 Purchase during the year 35,438,044.11 461,541,602.54 165,804,891.47 105,961,837.09 37,368,732.42 806,115,107.63 Transfer from construction in progress during the year 2,552,630,543.04 8,551,192,628.59 641,142,312.37 553,540,919.59 1,050,695,730.68 13,349,202,134.27 Transfer from investment properties during the year 72,669,866.29 - - - - 72,669,866.29 Increases due to changes in the scope of consolidation during the year 1,314,135,190.29 1,716,571,770.38 213,262,493.98 398,301,005.45 83,866,679.00 3,726,137,139.10 Increases (decrease) due to changes in the exchange rate during the year 48,848,768.95 140,630,829.12 13,650,736.36 1,248,576.62 11,183,452.27 215,562,363.32 Transfer to construction in progress during the year - 8,149,749.44 39,911.24 34,057.00 - 8,223,717.68 Transfer to investment properties during the year 499,946,288.68 - - - - 499,946,288.68 Decreases due to changes in the scope of consolidation during the year 7,191,232.08 692,901.05 10,203,022.96 231,827,375.31 - 249,914,531.40 Disposals and retirement during the year 431,060,097.57 1,838,514,899.33 285,033,671.14 195,205,017.70 434,521,792.93 3,184,335,478.67 December 31, 2016 23,496,480,101.16 51,036,223,227.35 4,847,972,293.23 2,971,528,861.38 6,565,310,406.46 88,917,514,889.58 II. Accumulated depreciation December 31, 2015 5,350,856,444.16 18,151,045,564.82 2,504,556,893.90 1,335,043,559.07 2,207,431,108.77 29,548,933,570.72 Provision during the year 903,014,833.55 4,190,517,331.53 550,734,779.01 251,976,761.89 704,629,449.31 6,600,873,155.29 Transfer from investment properties during the year 13,171,989.14 - - - - 13,171,989.14 Increases due to changes in the scope of consolidation during the year 373,188,080.09 892,998,282.56 123,930,478.36 92,769,191.69 - 1,482,886,032.70 Increases (decrease) due to changes in the exchange rate during the year 5,141,548.58 38,490,446.99 2,179,112.63 720,429.78 2,159,185.48 48,690,723.46 Transfer to construction in progress during the year - 4,239,015.33 35,920.12 30,651.30 - 4,305,586.75 Transfer to investment properties during the year 321,667,576.66 - - - - 321,667,576.66 Decreases due to changes in the scope of consolidation during the year 3,258,714.97 664,458.23 7,222,725.41 199,846,671.11 - 210,992,569.72 Disposals during the year 146,379,284.72 1,305,117,890.07 203,441,184.62 180,722,099.56 275,994,834.85 2,111,655,293.82 December 31, 2016 6,174,067,319.17 21,963,030,262.27 2,970,701,433.75 1,299,910,520.46 2,638,224,908.71 35,045,934,444.36 III. Impairment December 31, 2015 349,684,358.38 3,553,993,666.22 62,710,744.11 19,381,807.91 2,464,958,225.38 6,450,728,802.00 Provision during the year 5,847,740.96 281,181,118.49 12,926,085.22 126,607.14 432,423,912.89 732,505,464.70 Increases due to changes in the scope of consolidation during the year 9,667,740.59 13,840,744.50 2,425,078.06 30,066.86 - 25,963,630.01 Increases (decrease) due to changes in the exchange rate during the year - (2,188,916.18) - - 11,929,515.70 9,740,599.52 Transfer from investment properties during the year - 38,251,253.89 - - 11,726,495.73 49,977,749.62 Disposals and retirement during the year 21,048,302.59 143,646,128.23 38,621,688.10 290,031.47 247,636,095.90 451,242,246.29 December 31, 2016 344,151,537.34 3,741,431,738.69 39,440,219.29 19,248,450.44 2,673,402,053.80 6,817,673,999.56 IV. Net book value December 31, 2016 16,978,261,244.65 25,331,761,226.39 1,837,830,640.19 1,652,369,890.48 1,253,683,443.95 47,053,906,445.66 December 31, 2015 14,710,414,504.27 20,308,604,715.50 1,542,120,826.38 985,117,605.66 1,144,328,270.87 38,690,585,922.68

SAIC MOTOR CORPORATION LIMITED NOTES TO THE FINANCIAL STATEMENTS YEAR ENDED DECEMBER 31, 2015
第 63 页
VI. NOTES TO ITEMS IN THE CONSOLIDATED FINANCIAL STATEMENTS - continued
17. Fixed assets - continued
(2) Details of fixed assets that the certificates of title were not obtained are as follows:
Unit: RMB
Item December 31, 2016 Reasons why certificates of title have not been obtained
Buildings 3,971,647,084.04 In progress
(3) At the year-end, buildings with net book value of RMB 511,486,206.21 were pledged as collateral for bank borrowings, refer to Note (VI) 38 for more details.
18. Construction in progress
(1) Details of the construction in process are as follows:
Unit: RMB Item December 31, 2016 December 31, 2015
Book balance Impairment Book value Book balance Impairment Book value Dual clutch transmission project and relocation 995,010,222.00 8,076,341.87 986,933,880.13 935,068,153.05 46,327,595.76 888,740,557.29 Project of technology improvement and capacity expansion of SGMW 3,453,995,153.62 - 3,453,995,153.62 4,774,627,248.61 11,726,495.73 4,762,900,752.88 Project of technology improvement and capacity expansion of Huizhong 401,138,655.97 200,000.00 400,938,655.97 451,423,660.72 200,000.00 451,223,660.72 Construction of MG Pukou base phase II of NAGC 664,952,853.30 - 664,952,853.30 258,349,637.10 235,913.07 258,113,724.03 Donghua CP4 logistics supporting project 72,383,091.65 175,469.40 72,207,622.25 107,749,229.11 1,050,329.40 106,698,899.71 Donghua Pukou Qiaolin project 522,294,877.53 - 522,294,877.53 128,163,439.80 - 128,163,439.80 Project of technology improvement and capacity expansion of Shanghai Diesel 82,639,408.11 31,716,626.11 50,922,782.00 142,829,859.15 31,716,626.11 111,113,233.04 Project of technology improvement and capacity expansion of Yanfeng Johnson 3,020,524,412.44 17,925,517.00 3,002,598,895.44 2,228,396,947.62 17,134,493.00 2,211,262,454.62 Project of passenger vehicles of self-owned brands 137,340,667.63 - 137,340,667.63 235,490,387.31 - 235,490,387.31 Project of R&D centre expansion 247,985,602.61 - 247,985,602.61 430,488,863.55 - 430,488,863.55 Project of construction of port of Anji Logistics 1,156,078,551.66 - 1,156,078,551.66 1,179,238,809.66 - 1,179,238,809.66 Project of self-owned brand of Commercial Vehicles 1,383,240,937.23 222,747.30 1,383,018,189.93 714,314,610.92 222,747.30 714,091,863.62 Project of photovoltaic generation of Asset Management 151,945,303.82 - 151,945,303.82 96,354,428.16 - 96,354,428.16 Project of self-owned brand in Thailand 3,930,643.12 - 3,930,643.12 21,689,179.18 - 21,689,179.18 Project of Import and export international distribution center 159,639,795.82 - 159,639,795.82 3,433,220.69 - 3,433,220.69 Project of Global Chexiang periodic lease 172,438,153.50 - 172,438,153.50 10,436,757.06 - 10,436,757.06 Project of Shanghong Real Estate Changfeng 186,223,224.40 - 186,223,224.40 - - - Others 512,612,652.51 - 512,612,652.51 246,828,629.47 - 246,828,629.47 Total 13,324,374,206.92 58,316,701.68 13,266,057,505.24 11,964,883,061.16 108,614,200.37 11,856,268,860.79

SAIC MOTOR CORPORATION LIMITED NOTES TO THE FINANCIAL STATEMENTS YEAR ENDED DECEMBER 31, 2015
第 64 页
VI. NOTES TO ITEMS IN THE CONSOLIDATED FINANCIAL STATEMENTS - continued 18. Construction in progress - continued
(2) Movement of major construction in progress:
Unit: RMB
Name of item Budget December 31, 2015
Increase during the year
Transfer to fixed assets upon completion
Other decreases during this year
December 31, 2016
Proportion of project
investment to the budget
(%)
Project progress Accumulated
interest capitalized
Including: interest
capitalized
Rate of interest
capitalized (%)
Sources of funds
Dual clutch transmission project and relocation 6,623,150,680.28 935,068,153.05 1,218,048,706.86 1,140,954,256.09 17,152,381.82 995,010,222.00 85 Under construction 77,016,066.49 3,943,394.18 5.10
Self-financed and raised
funds Project of technology improvement and capacity expansion of SGMW 21,760,477,524.16 4,774,627,248.61 3,508,207,750.01 4,720,158,555.80 108,681,289.20 3,453,995,153.62 89 Under construction Self-financed
Project of technology improvement and capacity expansion of Huizhong 3,054,529,945.44 451,423,660.72 450,446,128.44 500,731,133.19 - 401,138,655.97 91 Under construction Self-financed
Construction of MG Pukou base phase II of NAGC 5,823,707,927.23 258,349,637.10 1,401,799,893.62 986,699,799.79 8,496,877.63 664,952,853.30 45 Under construction Self-financed
Donghua CP4 logistics supporting project 510,113,744.32 107,749,229.11 173,699,787.15 126,676,705.17 82,389,219.44 72,383,091.65 72 Under construction Self-financed
Donghua Pukou Qiaolin project 2,022,841,151.01 128,163,439.80 394,131,437.73 - - 522,294,877.53 75 Under construction Self-financed Project of technology improvement and capacity expansion of Shanghai Diesel 2,694,897,410.00 142,829,859.15 80,043,947.10 136,624,301.14 3,610,097.00 82,639,408.11 57 Under construction Self-financed
Project of technology improvement and capacity expansion of Yanfeng Johnson 6,082,368,003.15 2,228,396,947.62 4,211,553,150.95 3,021,843,203.57 397,582,482.56 3,020,524,412.44 68 Under construction 38,334,441.02 13,114,009.84 5.98
Self-financed and raised
funds
Project of passenger vehicles of self-owned brands 13,057,086,276.48 235,490,387.31 801,532,212.53 894,225,716.42 5,456,215.79 137,340,667.63 63 Under construction
Self-financed and raised
funds
Project of R&D centre expansion 3,757,673,219.00 430,488,863.55 299,991,216.05 458,803,492.49 23,690,984.50 247,985,602.61 78 Under construction Self-financed
and raised funds
Project of construction of port of Anji Logistics 3,890,571,229.00 1,179,238,809.66 498,588,430.19 496,399,771.63 25,348,916.56 1,156,078,551.66 77 Under construction Self-financed
Project of self-owned brand of Commercial Vehicles 5,666,933,637.00 714,314,610.92 871,230,174.83 197,170,811.72 5,133,036.80 1,383,240,937.23 49 Under construction
Self-financed and raised
funds Project of photovoltaic generation of Asset Management 1,263,310,000.00 96,354,428.16 324,853,591.03 263,276,868.86 5,985,846.51 151,945,303.82 87 Under construction 11,514,032.26 897,071.39 4.90 Self-financed
Project of self-owned brand in Thailand 97,822,756.15 21,689,179.18 92,946,777.79 104,940,470.24 5,764,843.61 3,930,643.12 73 Under construction Self-financed Project of Import and export international distribution center 499,019,875.00 3,433,220.69 156,206,575.13 - - 159,639,795.82 32 Under construction Self-financed
Project of Global Chexiang periodic lease 291,905,000.00 10,436,757.06 212,874,047.45 39,438,367.82 11,434,283.19 172,438,153.50 77 Under construction Self-financed
Project of Shanghong Real Estate Changfeng 2,460,418,777.73 - 186,223,224.40 - - 186,223,224.40 44 Under construction Self-financed
Others 535,973,448.50 246,828,629.47 678,716,304.44 261,258,680.34 151,673,601.06 512,612,652.51 Under construction Self-financed Total 80,092,800,604.45 11,964,883,061.16 15,561,093,355.70 13,349,202,134.27 852,400,075.67 13,324,374,206.92 126,864,539.77 17,954,475.41

SAIC MOTOR CORPORATION LIMITED NOTES TO THE FINANCIAL STATEMENTS YEAR ENDED DECEMBER 31, 2015
第 65 页
VI. NOTES TO ITEMS IN THE CONSOLIDATED FINANCIAL STATEMENTS - continued 18. Construction in progress - continued
(3) Changes of construction in process are as follows:
Unit: RMB Item Amount
December 31, 2015 11,964,883,061.16 Purchase during the year 15,375,554,134.46 Increases due to changes in the scope of consolidation during the year 143,651,447.31 Transfer from fixed assets 3,918,130.93 Increase due to changes in exchange rates during the year 37,969,643.00 Disposal and retirement during the year 126,722,417.51 Transfer to investment properties during the year 80,540,193.91 Transfer to fixed assets upon completion 13,349,202,134.27 Transfer to intangible assets upon completion 505,716,064.87 Transfer to long-term prepaid expenses 139,421,399.38 December 31, 2016 13,324,374,206.92
(4) Impairment of constructions in progress
Unit: RMB Item December 31, 2015 Increase Transfer to fixed
assets Decrease December 31, 2016 Reason for impairment
Transmission and clutch etc. 46,327,595.76 - 38,251,253.89 - 8,076,341.87 Lack of capacity utilization
Dalian Shanghai Diesel product line and plant construction 31,716,626.11 - - - 31,716,626.11 Termination of the
project Yanfeng trim, seat, electronic technology renovation project 17,134,493.00 791,024.00 - - 17,925,517.00 Termination of the
project Project of technology improvement and capacity expansion of SGMW 11,726,495.73 - 11,726,495.73 - - Lack of capacity
utilization
Construction of MG Pukou base 235,913.07 - - 235,913.07 - Changes of products portfolio
Project of technology improvement and capacity expansion of Shanghai Huizhong 200,000.00 - - - 200,000.00 Termination of the
project
Others 1,273,076.70 - - 874,860.00 398,216.70 Termination of the project
Total 108,614,200.37 791,024.00 49,977,749.62 1,110,773.07 58,316,701.68
(5) At the year-end, constructions in progress with net book value of RMB 347,693,524.48 were pledged as collateral for bank borrowings, refer to Note (VI) 38 for more details.

SAIC MOTOR CORPORATION LIMITED NOTES TO THE FINANCIAL STATEMENTS YEAR ENDED DECEMBER 31, 2015
第 66 页
VI. NOTES TO ITEMS IN THE CONSOLIDATED FINANCIAL STATEMENTS - continued 19. Intangible assets
(1) General
Unit: RMB Item Land use right Know-how Royalties Software Patent Trademark right Others Total
I. Cost December 31, 2015 8,151,379,436.22 2,961,774,408.55 58,113,500.00 1,437,845,534.42 1,033,952,252.05 244,174,681.78 929,908,829.30 14,817,148,642.32 Purchase during the year 1,708,638,751.63 36,210,600.00 - 66,993,609.71 - 20,471,698.11 15,100,177.31 1,847,414,836.76 Transfer from construction in progress during the year 169,247,829.62 - - 336,468,235.25 - - - 505,716,064.87 Transfer from investment properties during the year 16,870,135.00 - - - - - - 16,870,135.00 Increases due to changes in the scope of consolidation during the year
741,199,825.01 525,379,939.63 120,453,788.21 76,198,734.47 - - - 1,463,232,287.32
Increases (decrease) due to changes in the exchange rate during the year
44,837,901.49 11,395,374.02 - 5,231,188.35 - - 1,177,872.25 62,642,336.11
Transfer to investment properties during the year 22,839,030.01 - - - - - - 22,839,030.01 Disposals during the year 230,719,786.55 21,621,162.74 - 9,054,825.27 - - - 261,395,774.56 December 31, 2016 10,578,615,062.41 3,513,139,159.46 178,567,288.21 1,913,682,476.93 1,033,952,252.05 264,646,379.89 946,186,878.86 18,428,789,497.81 II. Accumulated amortization December 31, 2015 864,957,244.01 1,870,227,629.34 8,956,883.33 810,783,760.34 952,644,979.29 67,394,047.99 913,049,207.41 5,488,013,751.71 Provision during the year 187,970,594.63 223,891,732.58 19,981,666.71 293,507,027.67 4,848.48 24,331,490.57 1,550,795.31 751,238,155.95 Transfer from investment properties during the year 726,486.00 - - - - - - 726,486.00 Increases due to changes in the scope of consolidation during the year
68,873,603.02 210,358,558.68 120,453,788.21 59,931,042.13 - - - 459,616,992.04
Increases (decrease) due to changes in the exchange rate during the year
238,123.53 186,049.37 - 1,157,198.36 - - 858,050.00 2,439,421.26
Transfer to investment properties during the year 92,470.00 - - - - - - 92,470.00 Disposals during the year 56,940,053.91 21,621,162.74 - 5,628,408.49 - - - 84,189,625.14 December 31, 2016 1,065,733,527.28 2,283,042,807.23 149,392,338.25 1,159,750,620.01 952,649,827.77 91,725,538.56 915,458,052.72 6,617,752,711.82 III. Impairment December 31, 2015 3,612,787.25 867,389,047.72 4,714,950.00 11,249,308.25 81,250,000.00 - - 968,216,093.22 Provision during the year - - - 26,974,186.00 - - - 26,974,186.00 Increases due to changes in the scope of consolidation during the year
- 21,165,563.03 - - - - - 21,165,563.03
Increases (decrease) due to changes in the exchange rate during the year
- 630,279.83 - - - - - 630,279.83
December 31, 2016 3,612,787.25 889,184,890.58 4,714,950.00 38,223,494.25 81,250,000.00 - - 1,016,986,122.08 IV. Net book value December 31, 2016 9,509,268,747.88 340,911,461.65 24,459,999.96 715,708,362.67 52,424.28 172,920,841.33 30,728,826.14 10,794,050,663.91 December 31, 2015 7,282,809,404.96 224,157,731.49 44,441,666.67 615,812,465.83 57,272.76 176,780,633.79 16,859,621.89 8,360,918,797.39

SAIC MOTOR CORPORATION LIMITED NOTES TO THE FINANCIAL STATEMENTS YEAR ENDED DECEMBER 31, 2016
第 67 页
VI. NOTES TO ITEMS IN THE CONSOLIDATED FINANCIAL STATEMENTS - continued
19. Intangible assets - continued
(2) Details of land use right that the certificates of title were not obtained are as follows:
Unit: RMB
Item Book value as at December 31, 2016 Reasons why certificates of title have not been obtained
Land use right 635,945,419.75 In progress
(3) At the year-end, land use right with net book value of RMB 345,554,901.61 was pledged as collateral of bank borrowings, refer to Note (VI) 38 for more details.
20. Development expenditure
Unit: RMB Item December 31, 2015 Increase Recognized in profit
and loss December 31, 2016 Research expenditures - 1,747,582,755.73 1,747,582,755.73 - Development expenditures 4,298,394.04 7,661,128,132.65 7,663,035,228.49 2,391,298.20 Total 4,298,394.04 9,408,710,888.38 9,410,617,984.22 2,391,298.20
Development expenditures accounts for 81.43% of total research and development expenditures during the year.
21. Goodwill
(1) Cost Unit: RMB
Invested company December 31, 2015 Increase December 31, 2016 SAIC-GMAC Automotive Finance Co., Ltd. 333,378,433.68 - 333,378,433.68 Shanghai ANJI-CEVA Automotive Logistics Co., Ltd. 290,248.50 - 290,248.50 Chongqing Yanfeng Johnson Automotive Parts Systems Co., Ltd. 71,566,642.00 - 71,566,642.00
Shanghai Diesel 6,994,594.88 - 6,994,594.88 Nanya Motor 11.11 - 11.11 Shanghai International Auto Operation Service Co., Ltd.(Note) - 142,443,867.15 142,443,867.15
Zhejiang Lishui Yidong New Energy Automobile Operation Service Co., Ltd.(Note) - 2,820,855.59 2,820,855.59
Zhejiang Quzhou Yidong New Energy Automobile Operation Service Co., Ltd.(Note) - 946,936.57 946,936.57
Shanghai Sunwin (Note) - 53,349,858.83 53,349,858.83 Others 54,129,251.07 7,081,712.43 61,210,963.50 Total 466,359,181.24 206,643,230.57 673,002,411.81
Note: Refer to Note (VII) 1 for more details.
(2) Impairment of goodwill Unit: RMB
Invested company December 31, 2015 December 31, 2016 Nanya Motor 11.11 11.11 Others 4,343,874.25 2,900,000.00 Total 4,343,885.36 2,900,011.11

SAIC MOTOR CORPORATION LIMITED NOTES TO THE FINANCIAL STATEMENTS YEAR ENDED DECEMBER 31, 2016
第 68 页
VI. NOTES TO ITEMS IN THE CONSOLIDATED FINANCIAL STATEMENTS - continued
22. Long-term deferred expenses
Unit: RMB
Item December 31, 2016
December 31, 2015
Improvement expenditure of fixed assets under operating lease 1,418,742,827.92 1,119,722,789.23 Mould costs 39,353,782.84 45,272,945.57 Others 84,572,487.33 121,902,176.17 Total 1,542,669,098.09 1,286,897,910.97
23. Deferred tax assets/deferred tax liabilities
(1) Deferred tax assets and corresponding deductible temporary differences:
Unit: RMB
Item
December 31, 2016 December 31, 2015 Deductible temporary differences
Deferred tax assets
Deductible temporary differences
Deferred tax assets
Assets impairment 4,880,915,302.40 1,029,305,854.33 3,755,865,314.72 776,975,236.04 Temporary difference arising from depreciation of fixed assets 268,947,349.62 82,181,535.99 379,489,327.73 74,697,400.62
Temporary difference arising from amortization of intangible assets 34,078,677.95 8,519,669.49 30,374,680.54 6,976,237.08
Deferred income 3,638,031,465.98 810,984,333.00 780,475,628.43 132,784,411.30 Available-for-sale financial assets measured at fair value 11,045,568.75 2,761,392.19 - -
Designated as financial assets at fair value through profit or loss, measured at fair value
38,578,679.20 9,644,669.80 176,754,071.86 44,188,517.97
Liabilities accrued but not deductible before tax 75,062,149,882.14 17,506,538,688.17 63,266,074,034.69 14,898,103,108.92
Unrealized profit elimination 3,776,495,582.93 933,377,928.72 3,062,815,088.07 763,193,843.52 Others 1,996,068,627.30 470,667,109.31 1,289,824,566.60 298,327,587.56 Total 89,706,311,136.27 20,853,981,181.00 72,741,672,712.64 16,995,246,343.01
(2) Deferred tax liabilities that cannot be offset:
Unit: RMB
Item December 31, 2016 December 31, 2015
Taxable temporary differences
Differed tax liabilities
Taxable temporary differences
Differed tax liabilities
Financial assets designated at FVTPL 33,486,499.41 8,371,624.85 4,663,287.47 1,165,821.87 Available-for-sale financial assets measured at fair value 8,283,001,715.22 1,792,619,247.19 10,304,528,728.55 2,279,150,529.28
Fair value adjustment on fixed assets, intangible assets and other assets obtained from business combination not involving enterprises under common control
718,907,732.84 195,320,895.87 1,536,495,456.72 477,025,450.18
Temporary difference of depreciation of fixed assets 585,038,636.84 195,745,017.96 223,973,100.12 65,679,865.78
Others 100,868,421.94 21,260,003.97 56,661,549.97 13,873,875.15 Total 9,721,303,006.25 2,213,316,789.84 12,126,322,122.83 2,836,895,542.26

SAIC MOTOR CORPORATION LIMITED NOTES TO THE FINANCIAL STATEMENTS YEAR ENDED DECEMBER 31, 2016
第 69 页
VI. NOTES TO ITEMS IN THE CONSOLIDATED FINANCIAL STATEMENTS - continued
23. Deferred tax assets/deferred tax liabilities
(3) Deferred tax assets offset by deferred tax liabilities
Unit: RMB
Item Deferred tax assets
offset by deferred tax liabilities at December
31, 2016
Net amount of deferred tax assets (liabilities) at
December 31, 2016
Deferred tax assets offset by deferred tax
liabilities at December 31, 2015
Net amount of deferred tax assets (liabilities) at
December 31, 2015
Differed tax assets 1,736,928.53 20,852,244,252.47 3,640,114.28 16,991,606,228.73 Differed tax liabilities 1,736,928.53 2,211,579,861.31 3,640,114.28 2,833,255,427.98
(4) Details of unrecognized deferred tax assets
Unit: RMB Item December 31, 2016 December 31, 2015
Deductible losses and deductible temporary differences 57,297,306,279.01 51,688,894,332.72
(5) Changes of the net amount of the deferred tax assets (liabilities) during the year were as follows:
Item Unit: RMB December 31, 2015 14,158,350,800.75 Increase due to changes in the scope of consolidation during the year 7,768,735.08 Decrease due to changes in the scope of consolidation during the year (7,632,631.20) Recognized in profit and loss of the year 3,992,884,812.25 Recognized in equity during the year 489,292,674.28 December 31, 2016 18,640,664,391.16
24. Other non-current assets
Unit: RMB Item December 31, 2016 December 31, 2015
Prepayment of long-term assets 1,079,379,099.74 903,330,115.04 Long-term entrust loans 162,500,000.00 212,500,000.00 Receivables investment 20,314,711.46 136,209,997.31 Continuous involvement in the financial assets - 136,209,997.31 Others 354,336,974.63 252,515,115.75 Net book value of other non-current assets 1,616,530,785.83 1,640,765,225.41 Less: Other non-current assets due within one year (Note 1)(Note (VI) 10) - 272,419,994.62
Total 1,616,530,785.83 1,368,345,230.79

SAIC MOTOR CORPORATION LIMITED NOTES TO THE FINANCIAL STATEMENTS YEAR ENDED DECEMBER 31, 2016
第 70 页
VI. NOTES TO ITEMS IN THE CONSOLIDATED FINANCIAL STATEMENTS - continued
25. Short-term borrowings
Unit: RMB Item December 31, 2016 December 31, 2015
Credit loans 8,561,150,675.10 4,744,742,704.38 Guaranteed loans (Note 1) 120,472,000.00 41,014,584.00 Pledge loans (Note 2) 46,527,909.00 122,589,257.59 Total 8,728,150,584.10 4,908,346,545.97
Note1: At the end of the year, guaranteed loans were jointly secured by Shanghai International Automobile
City (Group) Co., Ltd. and Shanghai International Automobile City Anting Cooperative Development Co., Ltd.
Note2: At the end of the year, the pledged loan of RMB29,610,000.00 was pledged on the basis of bank
acceptance of the same amount, refer to Note VI, 3; and the pledged loan of RMB 15,000,000.00 was pledged on the basis of the accounts receivable of book value of RMB 18,750,000.00, refer to Note VI, 4; and the pledged loan of RMB 1,917,909.00 was pledged on the basis of financing leases receivable of the book value of RMB 2,414,688.71, refer to Note VI, 14.
26. Customer deposits and deposits from banks and other financial institutions
Unit: RMB Item December 31, 2016 December 31, 2015
Enterprises’ deposits held by SFC 32,052,974,582.88 35,816,147,988.13 Short-term deposits held by SFC 11,092,613,881.50 8,568,336,270.92 Total 43,145,588,464.38 44,384,484,259.05
27. Loans from banks and other financial institutions
Unit: RMB Item December 31, 2016 December 31, 2015
Loans from banks and other financial institutions 27,400,000,000.00 23,429,657,800.31
28. Financial liabilities at fair value through profit or loss Unit: RMB
Item December 31, 2016 December 31, 2015 Derivative financial liabilities - forward exchange contracts - 7,486,291.00
29. Notes payable
Unit: RMB Item December 31, 2016 December 31, 2015
Bank acceptances 11,282,658,659.61 6,918,482,365.68 Commercial acceptances 458,253,503.31 364,319,865.14 Total 11,740,912,162.92 7,282,802,230.82
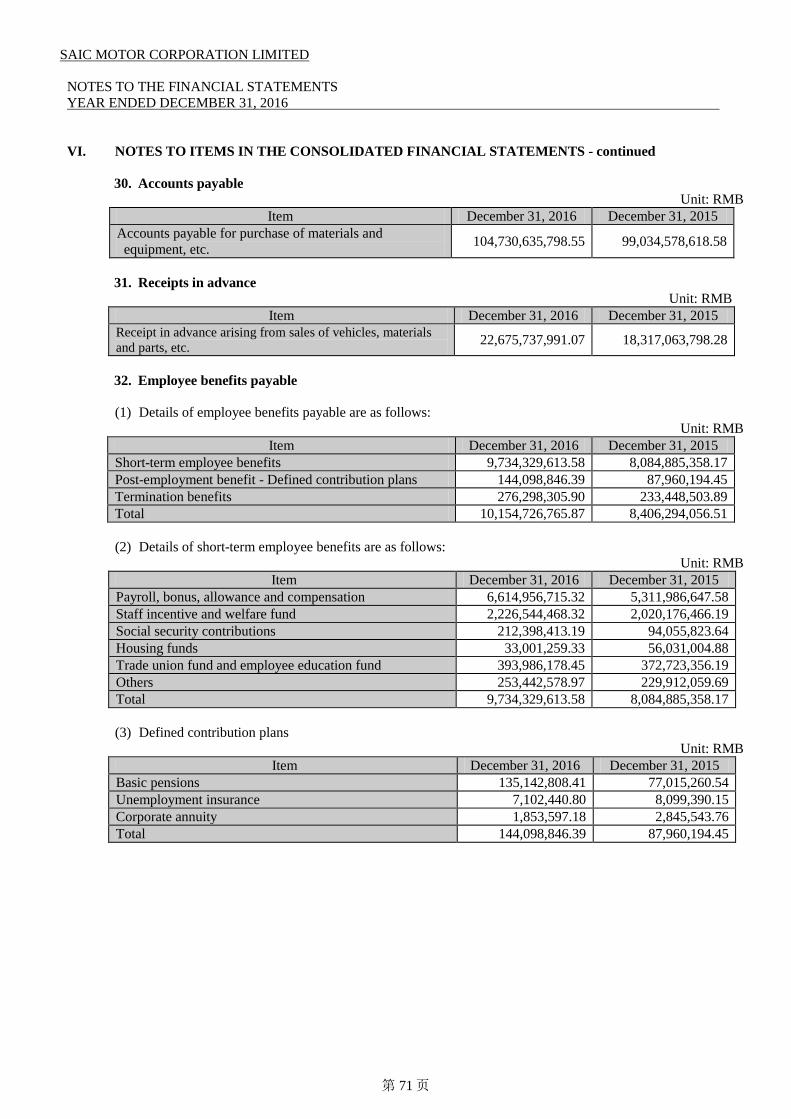
SAIC MOTOR CORPORATION LIMITED NOTES TO THE FINANCIAL STATEMENTS YEAR ENDED DECEMBER 31, 2016
第 71 页
VI. NOTES TO ITEMS IN THE CONSOLIDATED FINANCIAL STATEMENTS - continued
30. Accounts payable Unit: RMB
Item December 31, 2016 December 31, 2015 Accounts payable for purchase of materials and equipment, etc. 104,730,635,798.55 99,034,578,618.58
31. Receipts in advance
Unit: RMB Item December 31, 2016 December 31, 2015
Receipt in advance arising from sales of vehicles, materials and parts, etc. 22,675,737,991.07 18,317,063,798.28
32. Employee benefits payable
(1) Details of employee benefits payable are as follows:
Unit: RMB Item December 31, 2016 December 31, 2015
Short-term employee benefits 9,734,329,613.58 8,084,885,358.17 Post-employment benefit - Defined contribution plans 144,098,846.39 87,960,194.45 Termination benefits 276,298,305.90 233,448,503.89 Total 10,154,726,765.87 8,406,294,056.51
(2) Details of short-term employee benefits are as follows:
Unit: RMB Item December 31, 2016 December 31, 2015
Payroll, bonus, allowance and compensation 6,614,956,715.32 5,311,986,647.58 Staff incentive and welfare fund 2,226,544,468.32 2,020,176,466.19 Social security contributions 212,398,413.19 94,055,823.64 Housing funds 33,001,259.33 56,031,004.88 Trade union fund and employee education fund 393,986,178.45 372,723,356.19 Others 253,442,578.97 229,912,059.69 Total 9,734,329,613.58 8,084,885,358.17
(3) Defined contribution plans
Unit: RMB Item December 31, 2016 December 31, 2015
Basic pensions 135,142,808.41 77,015,260.54 Unemployment insurance 7,102,440.80 8,099,390.15 Corporate annuity 1,853,597.18 2,845,543.76 Total 144,098,846.39 87,960,194.45

SAIC MOTOR CORPORATION LIMITED NOTES TO THE FINANCIAL STATEMENTS YEAR ENDED DECEMBER 31, 2016
第 72 页
VI. NOTES TO ITEMS IN THE CONSOLIDATED FINANCIAL STATEMENTS - continued
33. Taxes payable
Unit: RMB Item December 31, 2016 December 31, 2015
Enterprise income tax 6,700,366,290.81 4,210,331,586.66 Value added tax 5,553,772,308.77 2,983,852,747.41 Consumption tax 512,938,290.10 401,790,235.33 Education surcharge 315,512,578.21 219,747,160.35 City construction and maintenance tax 221,750,110.38 169,296,231.44 Individual income tax 240,924,446.99 176,284,584.98 River management fees 134,312,857.65 126,712,176.29 Land use tax 43,497,267.77 17,355,617.74 Business tax - 291,041,280.21 Others 190,725,735.47 96,035,738.85 Total 13,913,799,886.15 8,692,447,359.26
34. Dividends payable
Unit: RMB Item December 31, 2016 December 31, 2015
Dividends payable of subsidiaries due to minority shareholders 255,265,008.62 448,541,726.94
35. Other payables
Unit: RMB Item December 31, 2016 December 31, 2015
Sales commission and discount 32,719,303,776.85 26,376,122,214.78 Dealers’ deposits and other deposits 2,198,530,633.93 2,385,510,790.82 Others 10,449,875,538.11 9,885,193,457.57 Total 45,367,709,948.89 38,646,826,463.17
36. Non-current liabilities due within one year
Unit: RMB Item December 31, 2016 December 31, 2015
Long-term borrowings due within one year (Note (VI)38) 1,205,031,809.66 564,253,092.71 Bonds payable due within one year (Note (VI)39) 2,162,290,339.13 - Provisions due within one year (Note (VI)42) 5,304,323,337.35 4,409,995,083.67 Long-term payables due within one year 1,975,262.00 - Total 8,673,620,748.14 4,974,248,176.38

SAIC MOTOR CORPORATION LIMITED NOTES TO THE FINANCIAL STATEMENTS YEAR ENDED DECEMBER 31, 2016
第 73 页
VI. NOTES TO ITEMS IN THE CONSOLIDATED FINANCIAL STATEMENTS - continued
36. Non-current liabilities due within one year - continued
(1) Long-term borrowings due within one year
Unit: RMB Item December 31, 2016 December 31, 2015
Credit loans 918,413,043.16 314,087,999.92 Pledged loans 259,713,343.00 200,165,092.79 Mortgaged loans 24,000,000.00 50,000,000.00 Guaranteed loans 2,905,423.50 - Total 1,205,031,809.66 564,253,092.71
(2) Bonds payable due within one year
Unit: RMB Item December 31, 2016 December 31, 2015
Bonds payable 2,162,290,339.13 -
(3) Provisions due within one year Unit: RMB
Item December 31, 2016 December 31, 2015 Products quality warranty 5,275,810,147.35 3,924,402,439.03 Others 28,513,190.00 485,592,644.64 Total 5,304,323,337.35 4,409,995,083.67
(4) Long-term payables due within one year
Unit: RMB
Item December 31, 2016 December 31, 2015 Long-term payables 1,975,262.00 -
37. Other current liabilities
Unit: RMB Item December 31, 2016 December 31, 2015
Accrued expenses 136,154,565.63 205,734,205.76 Pending Output VAT payables 64,000,027.88 24,357,357.92 Total 200,154,593.51 230,091,563.68

SAIC MOTOR CORPORATION LIMITED NOTES TO THE FINANCIAL STATEMENTS YEAR ENDED DECEMBER 31, 2016
第 74 页
VI. NOTES TO ITEMS IN THE CONSOLIDATED FINANCIAL STATEMENTS - continued
38. Long-term borrowings
Unit: RMB Item December 31, 2016 December 31, 2015
Credit loans (Note 1) 2,716,438,075.01 955,312,147.65 Mortgaged loans (Note 2) 1,093,753,513.16 240,676,759.18 Guaranteed loans (Note 3) 1,063,475,674.72 435,675,330.11 Pledged loans (Note 4) 617,356,852.35 331,400,000.00 Sub-total 5,491,024,115.24 1,963,064,236.94 Less: Long-term borrowings due within one year (Note (VI)36) 1,205,031,809.66 564,253,092.71
Total 4,285,992,305.58 1,398,811,144.23
Note 1: At the year-end, the credit loan of RMB 230,000,000.00 was the post-pledged bank loan of SAIC-IVECO Hongyan, a subsidiary of the Group, which was the credit loan in the construction period of the project of Annual Output of 300,000 Axles, and the axle properties and machinery and equipment will be pledged after the Project is completed. As at the year-end, the assets of the project of Annual Output of 300,000 Axles were not qualified for the pledge registration, the SAIC-IVECO Hongyan and the borrower have not yet signed the collateral contract.
Note2: At the year-end, investments of equity instruments with fair value of RMB 150,109,198.93 were
pledged to secure loans of RMB 104,000,000.00, refer to Note VI, 2; financial leases receivable with the book value of RMB 695,028,866.61 was pledged to secure loans of RMB 689,753,515.16 as collateral, refer to Note VI, 14; long-term equity investments with the book value of RMB 650,407,404.99 were pledged to secure loans of RMB 300,000,000.00 as collateral, refer to Note VI, 15.
Note3: At the year-end, the guaranteed loans of RMB 874,656,224.22 were jointly secured by the Company
and CP Motor Holding Co., Ltd.; the guaranteed loans of RMB 180,103,180.00 were jointly secured by Shanghai International Automobile City (Group) Co., Ltd. and Shanghai International Automobile City Xin’anting Union Development Co., Ltd.; the guaranteed loans of RMB 8,716,270.50 were jointly secured by the subsidiary of the Group, HASCO and E.C.I. Group Co., Ltd.
Note4: At the year-end, land use rights with the net book value of RMB 90,612,793.50, fixed assets-buildings
with the net book value of RMB 262,083,530.75 and construction in progress with the net value of RMB 276,751,172.14 were pledged to secure loans of RMB 478,500,000.00, refer to Note VI, 17,18,19; fixed assets-buildings with the net book value of RMB 179,330,483.59 and the net book value of RMB 52,741,782.00 were pledged to secure loans of RMB 28,400,000.00, refer to Note VI, 17, 19; fixed assets- buildings with the net book value of RMB 70,072,191.87 were pledged to secure loans of RMB 50,200,000.00, refer to Note VI, 17; construction in progress with the net book value of RMB 70,942,352.34 and land use rights with the net book value of RMB 202,200,326.11 were pledged as collaterals to secure loans of RMB 60,256,852.35, refer to Note VI, 18,19.
39. Bonds payable
Unit: RMB Category December 31, 2016 December 31, 2015
Corporate bonds of HASCO (Note 1) 2,700,490,000.00 2,700,490,000.00 Non-bank financial institution bonds of GMAC(Note 2) 6,476,807,427.68 1,494,315,403.26 Asset-backed securities of SAIC Finance Co., Ltd. and SAIC GMAC (Note3) 7,145,120,987.95 4,013,303,996.78
Total 16,322,418,415.63 8,208,109,400.04 Less: Bonds payable due within one year( Note (VI) 36) 2,162,290,339.13 - Bonds payable due after one year 14,160,128,076.50 8,208,109,400.04

SAIC MOTOR CORPORATION LIMITED NOTES TO THE FINANCIAL STATEMENTS YEAR ENDED DECEMBER 31, 2016
第 75 页
VI. NOTES TO ITEMS IN THE CONSOLIDATED FINANCIAL STATEMENTS - continued
39. Bonds payable - continued
Note 1: As approved by China Securities Regulatory Commission Zheng Jian Xu Ke [2013] No. 1380, “Approval of HASCO’s Issue of Corporate Bonds”, HASCO, the Company’s subsidiary, issued corporate bonds of RMB 4,000,000,000 on November 21, 2013 at par value of RMB 100 per bond. The bonds were categorized as two types: Type 1 (two-year bond) and Type 2 (five-year bond attached with interest rate adjustment option for the issuer and put option for the bondholders at the end of the third year). Amount of Type 1 bond is RMB 1,200,000,000 and coupon rate is 5.60% per annum. Amount of Type 2 bond is RMB 2,800,000,000 and coupon rate is 5.72% per annum, no compound interest, payable annually and repayable with principal and interest at maturity. There is no guarantee on the corporate bonds issued. Type 1 bond was fully repaid in 2015.
SFC, the Company’s subsidiary, subscribed for RMB 99,510,000.00 of the corporate bonds of HASCO. After inter-group elimination, balance of bonds payable as at the year-end is RMB 2,700,490,000.00.
Note2: GMAC, the Company’s subsidiary, issued a three-year bond with fixed interest rates of RMB
1,500,000,000 on March 3, 2014 in inter-bank bond markets. The coupon rate is 5.95% per annum. Interests of the bond shall be paid annually. Maturity date of the bond is March 4, 2017; a three-year bond with fixed interest rates of RMB 3,000,000,000 was issued on January 20, 2016 in inter-bank bond markets. The coupon rate is 3.25 % per annum. Interests of the bond shall be paid annually. Maturity date of the bond is January 20, 2019; a two-year bond with fixed interest rates of RMB 2,000,000,000 was issued on January 20, 2016 in inter-bank bond markets. The coupon rate is 3.1 % per annum. Interests of the bond shall be paid annually. Maturity date of the bond is January 20, 2018;
Note3: GMAC issued a preferred asset-backed security with floated interest rates at par value of RMB
3,580,000,000.00 on June 10, 2015, which will be due on January 26, 2017; preferred asset-backed security with floated interest rates at par value of RMB 2,700,000,000.00 was issued on September 11, 2015, which was estimated to be due on August 26, 2017; preferred asset-backed security with floated interest rates at par value of RMB 2,710,000,000.00 was issued on February 23, 2016, which was estimated to be due on July, 2018; preferred asset-backed security with floated interest rates at par value of RMB 2,710,000,000.00 was issued on February 23, 2016, which was estimated to be due on July, 2018; preferred asset-backed security with floated interest rates at par value of RMB 3,580,000,000.00 was issued on June 22, 2016, which was estimated to be due on April, 2018; SAIC Finance Co., Ltd. issued asset-backed security with fixed interest rates at par value of RMB 2,984,996,268.00 on November 22, 2016.
40. Long-term employee benefits payable
(1) Details of long-term employee benefits payable
Unit: RMB
Item December 31, 2016
December 31, 2015
Post-employment benefit - net liabilities of defined benefit plan 3,770,581,914.49 3,426,678,193.06 Termination benefits 2,129,743,431.09 2,183,634,952.52 Other long-term benefits 409,295,673.89 408,165,187.47 Total 6,309,621,019.47 6,018,478,333.05

SAIC MOTOR CORPORATION LIMITED NOTES TO THE FINANCIAL STATEMENTS YEAR ENDED DECEMBER 31, 2016
第 76 页
VI. NOTES TO ITEMS IN THE CONSOLIDATED FINANCIAL STATEMENTS - continued
40. Long-term employee benefits payable - continued
(2) Details of defined benefit plans Unit: RMB
Item December 31, 2016 December 31, 2015 December 31, 2015 3,426,678,193.06 3,018,996,758.83 Cost of defined benefit plans recognized in profit or loss 164,947,532.52 241,914,777.31 1. Past service cost 50,306,632.49 98,850,675.47 2. Net value of interests 114,640,900.03 143,064,101.84 Cost of defined benefit plans recognized in other comprehensive income 340,223,217.69 247,303,986.71
1. Actuarial losses 340,223,217.69 247,303,986.71 Other movements (161,267,028.78) (81,537,329.79) 1. Benefits paid (161,267,028.78) (81,537,329.79) December 31, 2016 3,770,581,914.49 3,426,678,193.06
The Group provided retired employees with defined benefit plans of supplementary post-employment benefits. The Group estimated its commitment to employees after retirement by actuarial valuation, and calculated its liabilities resulted from the supplementary post-employment based on estimation. Liabilities of the plan is estimated based on its future cash outflow at certain benefit increase rate and death rate and discounted to its present value at certain discount rate. The discount rate is determined based on the rate of the government bonds with an expected term and currency that are consistent with the expected term of the obligations at the balance sheet date. The Group recognized the liability according to the results from actuarial valuation, and recognized relevant actuarial gains and losses in other comprehensive income that will not be reclassified subsequently to profit or loss. Past service cost is recognized as profit or loss when the defined benefit plan is revised. Net interest is calculated based on net liabilities of defined benefit plans multiplied by discount rate. Defined benefit plans of supplementary post-employment benefits expose the Group to actuarial risks such as: interest rate risk, longevity risk and inflation risk. A decrease in the bond interest rate will increase the plan liability. The present value of the defined benefit plan liability is calculated by reference to the best estimate of the mortality of plan participants. An increase in the life expectancy of the plan participants will increase the plan’s liability. Besides, the present value of the defined benefit plan liability is related to the future payment standards, which is estimated based on inflation rate. Therefore, the increase of inflation rate will increase the plan's liability.
The most recent actuarial valuation of the defined benefit plan liabilities was carried out at December 31, 2016 by professional institution. The present value of the defined benefit obligation and the related service cost were measured using the projected unit credit method. Significant actuary assumptions for the purposes of the actuarial valuations are discount rate, benefit increase rate and death rate. The discount rates used are 3% - 3.75%. The assumption of death rate was based on “China Life Insurance Mortality Table (2010-2013)”. The sensitivity analysis below has been determined based on reasonably possible changes of the respective assumptions occurring at the end of the reporting period, while holding all other assumptions constant: If the discount rate is 25 basis points higher (lower), the present value of defined benefit plan liabilities would decrease by RMB 193 million (increase by RMB 210 million). If the benefit increase rate increases (decreases) by 1%, the present value of defined benefit plan liabilities would increase by RMB 694 million (decrease by RMB 505 million). The sensitivity analysis presented above may not be representative of the actual change in the defined benefit liabilities as it is unlikely that the change in assumptions would occur in isolation of one another as some of the assumptions may be correlated. In the above sensitivity analysis, the present value of defined benefit plan liabilities has been calculated using the same method as that applied in calculating the defined benefit plan liabilities recognized in in the balance sheet.

SAIC MOTOR CORPORATION LIMITED NOTES TO THE FINANCIAL STATEMENTS YEAR ENDED DECEMBER 31, 2016
第 77 页
VI. NOTES TO ITEMS IN THE CONSOLIDATED FINANCIAL STATEMENTS - continued
41. Special payable
Unit: RMB Item December 31, 2016 December 31, 2015
Special reward fund (Note 1) 822,960,091.72 863,767,352.72 Compensation for relocation (Note 2) - 38,358,140.00 Others 1,145,000.00 - Total 824,105,091.72 902,125,492.72
Note 1: Balance of special reward fund was injected by SAIC in 2011 restructuring as stated in Note (I). Such
fund is designated for special purpose of rewarding significant contributions to business developments, completion of strategic development objectives (including key annual goals), completion of significant projects or works. The fund is managed as special payables.
Note2: The compensation for relocation was the compensation received from purchasing and storage of part of
the Group's right to state-owned land due to the Government's overall planning.
42. Provisions Unit: RMB
Item December 31, 2016 December 31, 2015 Products quality warranty 14,879,554,558.69 12,162,897,559.10 Expected compensation expenditure 520,978,547.34 510,107,826.57 Liability due to continuing involvement - 136,209,997.31 Others 2,142,243,400.10 1,469,914,414.50 Sub-total 17,542,776,506.13 14,279,129,797.48 Less: Provisions due within one year (Note (VI) 36) 5,304,323,337.35 4,409,995,083.67 Total 12,238,453,168.78 9,869,134,713.81
43. Deferred income
Unit: RMB Item December 31, 2016 December 31, 2015
Government grants (Note) 11,466,321,272.24 9,773,158,990.87 Interest received in advance by SFC and GMAC 4,974,686,353.72 3,067,536,824.58 Others 1,395,086,960.65 962,962,253.83 Total 17,836,094,586.61 13,803,658,069.28 Note: Details of deferred income - government grants are as follows:
Unit: RMB
Item December 31, 2015 Increase Amount recognized
in non-operating income
December 31, 2016 Related to assets/income
Relocation compensation 6,202,320,567.87 2,238,679,403.41 870,053,865.44 7,570,946,105.84 Assets/Income
Subsidies for purchase of long-term assets 2,407,239,484.57 516,899,384.48 230,136,054.37 2,694,002,814.68 Assets
Technical improvement 403,110,418.90 39,406,113.04 21,913,127.91 420,603,404.03 Assets
Subsidies for project development 760,488,519.53 85,668,173.51 65,387,745.35 780,768,947.69 Income
Total 9,773,158,990.87 2,880,653,074.44 1,187,490,793.07 11,466,321,272.24

SAIC MOTOR CORPORATION LIMITED NOTES TO THE FINANCIAL STATEMENTS YEAR ENDED DECEMBER 31, 2016
第 78 页
VI. NOTES TO ITEMS IN THE CONSOLIDATED FINANCIAL STATEMENTS - continued
44. Share capital
Registered capital and paid-in capital of the Company are RMB 11,025,566,629.00, with a par value of RMB1.00 per share. Categories and composition of the shares are as follows:
Year 2016 January 1, 2016 (shares)
Changes (shares) (Note)
December 31, 2016 (shares)
% of shares held at the year-end
Non-restricted shares Ordinary shares in RMB
-SAIC 8,191,449,931 - 8,191,449,931 74.30 -Yuejin 413,919,141 - 413,919,141 3.75 -SAIC Ltd 334,408,775 (137,396,429) 197,012,346 1.79 -SIG 2,085,788,782 137,396,429 2,223,185,211 20.16 -Others 11,025,566,629 - 11,025,566,629 100.00
Year 2015 January 1, 2015 (shares)
Changes (shares) (Note)
December 31, 2015 (shares)
% of shares held at the year-end
Non-restricted shares Ordinary shares in RMB
-SAIC 8,191,449,931 - 8,191,449,931 74.30 -Yuejin 413,919,141 - 413,919,141 3.75 -SAIC Ltd 334,408,775 (334,408,775) - - -SIG - 334,408,775 334,408,775 3.03 -Others 2,085,788,782 - 2,085,788,782 18.92 Total 11,025,566,629 - 11,025,566,629 100.00
Note: Refer to Note (I).

SAIC MOTOR CORPORATION LIMITED NOTES TO THE FINANCIAL STATEMENTS YEAR ENDED DECEMBER 31, 2016
第 79 页
VI. NOTES TO ITEMS IN THE CONSOLIDATED FINANCIAL STATEMENTS - continued
45. Capital reserve Unit: RMB
Item January 1 Increase December 31 Year 2016 Share premium 37,952,429,864.29 811,774,445.98 38,764,204,310.27 Including: Capital contributed by investors 37,147,780,115.58 - 37,147,780,115.58 Differences arising from business combination involving enterprises under common control
1,454,026,130.62 - 1,454,026,130.62
Effect of changes of investment in subsidiaries (Note 1) (649,376,381.91) 811,774,445.98 162,398,064.07
Other capital reserves 987,339,951.44 55,704,991.19 1,043,044,942.63 Total 38,939,769,815.73 867,479,437.17 39,807,249,252.90 Year 2015 Share premium 37,013,721,153.04 938,708,711.25 37,952,429,864.29 Including: Capital contributed by investors 37,147,780,115.58 - 37,147,780,115.58 Differences arising from business combination involving enterprises under common control
1,454,026,130.62 - 1,454,026,130.62
Effect of changes of investment in subsidiaries (Note 2) (1,588,085,093.16) 938,708,711.25 (649,376,381.91)
Other capital reserves 972,877,968.50 14,461,982.94 987,339,951.44 Total 37,986,599,121.54 953,170,694.19 38,939,769,815.73
Note1: During the year, increase of RMB 779,117,100.34 is resulted from non-public offering events of
HASCO, refer to Note VIII, 1(1). Others are resulted from transactions stated in Note (VIII) 1 (2). Note2: In 2015, increase of RMB 1,118,042,323.57 is resulted from restructuring of interior business of
Yanfeng Automotive Trim Systems Co., Ltd.

SAIC MOTOR CORPORATION LIMITED NOTES TO THE FINANCIAL STATEMENTS YEAR ENDED DECEMBER 31, 2016
第 80 页
VI. NOTES TO ITEMS IN THE CONSOLIDATED FINANCIAL STATEMENTS - continued
46. Other comprehensive income Unit: RMB
Item December 31, 2015
During the year
December 31, 2016 Increase before
income tax
Less: Net amount included in other comprehensive
income in the prior periods that is
transferred to profit or loss of the current period
Less: Income tax expenses
Attributable to shareholders of the
Company after income tax
Attributable to minority
shareholders after income tax
I. Other comprehensive income that will not be reclassified subsequently to profit or loss 713,283,968.08 (342,057,942.69) - - (326,278,439.57) (15,779,503.12) 387,005,528.51 Including: Changes in net liabilities or net assets due to remeasurement of defined benefit plans 713,283,968.08 (340,223,217.69) - - (325,208,427.95) (15,014,789.74) 388,075,540.13
Shares of other comprehensive income that will not be reclassified subsequently to profit or loss of invested entities under equity method - (1,834,725.00) - - (1,070,011.62) (764,713.38) (1,070,011.62)
II. Other comprehensive income that may be reclassified subsequently to profit or loss 10,203,509,265.65 (1,152,014,768.17) - (489,292,674.28) (624,042,081.13) (38,680,012.76) 9,579,467,184.52 Including: Shares of other comprehensive income that may be reclassified subsequently to
profit or loss of invested entities under equity method in future (88,951,389.30) 92,512,148.38 - - 85,449,035.00 7,063,113.38 (3,502,354.30)
Changes in fair value of available-for-sale financial assets 9,813,439,832.45 (2,020,126,506.26) - (489,292,674.28) (1,335,080,324.33) (195,753,507.65) 8,478,359,508.12 Exchange differences on translating foreign operations 479,020,822.50 775,599,589.71 - - 625,589,208.20 150,010,381.51 1,104,610,030.70 Total 10,916,793,233.73 (1,494,072,710.86) - (489,292,674.28) (950,320,520.70) (54,459,515.88) 9,966,472,713.03

SAIC MOTOR CORPORATION LIMITED NOTES TO THE FINANCIAL STATEMENTS YEAR ENDED DECEMBER 31, 2016
第 81 页
VI. NOTES TO ITEMS IN THE CONSOLIDATED FINANCIAL STATEMENTS - continued
47. Surplus reserve Unit: RMB
Item January 1 Provision December 31 Year 2016 Statutory surplus reserve 14,173,232,135.62 2,763,158,914.19 16,936,391,049.81 Discretionary surplus reserve 12,555,029,629.08 2,763,158,914.19 15,318,188,543.27 Total 26,728,261,764.70 5,526,317,828.38 32,254,579,593.08 Year 2015 Statutory surplus reserve 11,727,182,207.14 2,446,049,928.48 14,173,232,135.62 Discretionary surplus reserve 10,108,979,700.60 2,446,049,928.48 12,555,029,629.08 Total 21,836,161,907.74 4,892,099,856.96 26,728,261,764.70
Statutory surplus reserve can be used for making up for losses, expanding operation and increasing the Company’s capital.
48. Retained earnings
Unit: RMB Item 2016 2015
Balance at the beginning of year 86,397,638,086.22 76,085,680,916.97 Add: Net profit attributable to the shareholders of the Company 32,008,610,688.65 29,793,790,723.65 Less: Appropriation to statutory surplus reserve of the Company 2,763,158,914.19 2,446,049,928.48
Appropriation to discretionary surplus reserve of the Company 2,763,158,914.19 2,446,049,928.48
Dividends distribution (Note 1) 14,994,770,615.44 14,333,236,617.70 Appropriation to general reserve of SAIC Finance Co., Ltd. and GMAC-SAIC Automotive Finance 893,872,451.26 -
Appropriation to foreign capital reserve of SFC 691,909.88 1,641,152.55 Appropriation to staff incentive and welfare fund of subsidiaries 197,635,109.48 254,855,927.19
Balance at the end of year 96,792,960,860.43 86,397,638,086.22
Note 1: Prior year’s cash dividends approved by shareholders’ meeting
Pursuant to resolution of 2015 annual general meeting of shareholders on May 26, 2016, the Company distributed cash dividends of RMB13.60 (inclusive of tax) per 10 shares, amounting to RMB 14,994,770,615.44 based on total 11,025,566,629 shares.
Note 2: Profit distribution proposed after the balance sheet date
Pursuant to the proposals made at the 14th meeting of the 6th session of the Board of Directors, the Company planned to distribute cash dividends of RMB 16.50 (inclusive of tax) per 10 shares, based on total 11,683,461,365 shares after appropriation of statutory surplus reserve and discretionary surplus reserve at 10% and 10% of profit after tax of the Company. The dividend distribution plan is yet to be approved by the general meeting of shareholders.

SAIC MOTOR CORPORATION LIMITED NOTES TO THE FINANCIAL STATEMENTS YEAR ENDED DECEMBER 31, 2016
第 82 页
VI. NOTES TO ITEMS IN THE CONSOLIDATED FINANCIAL STATEMENTS - continued
49. Operating income/costs
(1) Operating income/costs
Unit: RMB
Item Year Ended December 31, 2016 Year Ended December 31, 2015 Operating income Operating costs Operating income Operating costs
Primary operations 729,555,823,879.29 635,731,187,989.11 650,377,398,413.60 576,705,258,472.85 Other operations 16,680,917,349.27 14,486,917,947.26 10,996,531,379.05 9,127,624,743.41 Total 746,236,741,228.56 650,218,105,936.37 661,373,929,792.65 585,832,883,216.26
(2) Primary operations
Unit: RMB
Year Ended December 31, 2016 Year Ended December 31, 2015 Operating income Operating costs Operating income Operating costs
Sales of vehicles 564,301,490,751.90 502,515,928,898.24 505,752,823,943.47 458,925,975,996.17 Sales of parts 144,288,509,910.21 114,859,534,193.23 125,733,526,700.70 101,181,521,349.86 Trading 9,708,826,846.79 9,272,742,731.13 9,899,903,807.26 9,489,601,764.09 Service and others 11,256,996,370.39 9,082,982,166.51 8,991,143,962.17 7,108,159,362.73 Total 729,555,823,879.29 635,731,187,989.11 650,377,398,413.60 576,705,258,472.85
(3) Other operations
Unit: RMB
Year Ended December 31, 2016 Year Ended December 31, 2015 Operating income Operating costs Operating income Operating costs
Sales of raw materials 14,282,385,998.00 13,384,730,421.31 8,057,197,176.62 7,396,867,599.02
Rendering services 987,089,138.10 585,222,654.99 1,126,633,165.54 815,296,727.24
Rental 279,878,506.61 140,593,600.49 444,048,152.32 208,485,092.12 Others 1,131,563,706.56 376,371,270.47 1,368,652,884.57 706,975,325.03 Total 16,680,917,349.27 14,486,917,947.26 10,996,531,379.05 9,127,624,743.41
(4) Operating incomes from the top five customers are as follows:
Unit: RMB
Name Operating income Proportion to total
operating income (%)
Company 1 40,650,135,804.62 5.45 Company 2 15,628,164,712.21 2.09 Company 3 10,038,842,703.62 1.35 Company 4 7,372,840,222.70 0.99 Company 5 3,886,172,202.20 0.52 Total 77,576,155,645.35 10.40

SAIC MOTOR CORPORATION LIMITED NOTES TO THE FINANCIAL STATEMENTS YEAR ENDED DECEMBER 31, 2016
第 83 页
VI. NOTES TO ITEMS IN THE CONSOLIDATED FINANCIAL STATEMENTS - continued
50. Interest income/expenses
Unit: RMB
Year Ended December 31, 2016 Year Ended December 31, 2015 Income Expenses Income Expenses
Interest income/expenses of financial companies 9,117,963,901.15 2,118,097,016.20 8,295,161,232.11 2,347,899,980.15
51. Fee and commission income/ expenses
Unit: RMB
Year Ended December 31, 2016 Year Ended December 31, 2015 Income Expenses Income Expenses
Fee and commission income/expenses of financial companies
1,061,459,935.58 67,820,339.84 779,132,114.58 44,605,113.33
52. Taxes and levies
Unit: RMB
Item Year Ended December 31, 2016
Year Ended December 31, 2015
Consumption tax 4,062,336,491.94 3,157,787,805.72 City construction and maintenance tax 1,001,511,455.26 823,336,935.45 Education surcharges 1,000,905,752.24 803,909,886.33 Stamp tax 444,831,309.35 421,094,117.42 Business tax 349,850,843.28 750,494,572.27 Property tax 203,642,103.53 185,840,529.25 River management fees and flood prevention surcharge 150,823,932.83 136,498,138.21 land use tax 129,271,233.35 100,658,691.26 Others 177,544,912.20 164,578,253.55 Total 7,520,718,033.98 6,544,198,929.46
53. Selling expenses
Unit: RMB
Item Year Ended December 31, 2016
Year Ended December 31, 2015
Transportation expenses 13,173,264,244.82 10,241,767,320.73 Advertising expenses 10,821,718,109.03 9,726,993,437.49 After-sales service expenses 5,621,498,130.39 4,649,630,471.12 Others 17,886,936,161.33 10,919,124,279.93 Total 47,503,416,645.57 35,537,515,509.27

SAIC MOTOR CORPORATION LIMITED NOTES TO THE FINANCIAL STATEMENTS YEAR ENDED DECEMBER 31, 2016
第 84 页
VI. NOTES TO ITEMS IN THE CONSOLIDATED FINANCIAL STATEMENTS - continued
54. Administrative expenses
Unit: RMB
Item Year Ended December 31, 2016
Year Ended December 31, 2015
Salaries 10,006,176,188.29 7,490,896,632.56 Depreciation and amortization 1,353,498,997.34 1,173,534,596.81 Research and development expenditures 9,410,617,984.22 8,375,540,573.97 Royalties 68,982,351.95 285,147,079.12 Others 7,419,087,667.83 6,004,366,390.98 Total 28,258,363,189.63 23,329,485,273.44
55. Financial expenses
Unit: RMB
Item Year Ended December 31, 2016
Year Ended December 31, 2015
Interest expenses 757,711,561.89 775,397,924.90 Less: Capitalized expenses (Note (VI) 18) 17,954,475.41 11,173,734.14 Less: Interest income 1,120,812,023.58 1,137,501,519.83 Exchange (gain) loss (60,524,505.06) 97,205,622.17 Others 109,259,900.21 44,879,609.73 Total (332,319,541.95) (231,192,097.17)
56. Impairment losses of assets
Unit: RMB
Item Year Ended December 31, 2016
Year Ended December 31, 2015
Bad debt loss 277,712,226.32 (632,726,573.18) Decline in value of inventories 553,699,759.39 824,528,932.04 Impairment of available-for-sale financial assets 138,101,339.55 - Impairment of fixed assets 732,505,464.70 1,540,198,379.32 Impairment of construction in process 791,024.00 46,327,595.76 Impairment of intangible assets 26,974,186.00 9,650,976.79 Impairment of loans 1,478,243,531.40 1,060,193,157.80 Impairment of good will 1,443,874.25 - Total 3,209,471,405.61 2,848,172,468.53
57. Gain (loss) from changes in fair values
Unit: RMB
Item Year Ended December 31, 2016
Year Ended December 31, 2015
Gain (loss) resulting from: Financial assets at fair value through profit or loss (17,509,759.92) (278,030,579.56) Financial liabilities at fair value through profit or loss 7,486,291.00 (7,486,291.00) Total (10,023,468.92) (285,516,870.56)

SAIC MOTOR CORPORATION LIMITED NOTES TO THE FINANCIAL STATEMENTS YEAR ENDED DECEMBER 31, 2016
第 85 页
VI. NOTES TO ITEMS IN THE CONSOLIDATED FINANCIAL STATEMENTS - continued
58. Investment income
Unit: RMB
Item Year Ended December 31, 2016
Year Ended December 31, 2015
Long-term equity investment income under equity method 27,751,818,831.43 26,632,109,451.86 Amortization of long-term equity investment difference (319,325.10) (827,623.32) Gain from business combination not involving enterprises under common control achieved in stages involving multiple transactions (Note)
5,500,000.00 59,646,443.94
Gain on disposal of long-term equity investments 151,463,940.35 190,831,856.24 Gain from financial assets/liabilities at fair value through profit or loss 5,951,572.66 5,106,257.67
Gain from available-for-sale financial assets 2,550,989,869.42 2,643,398,882.64 Gain from financial assets purchased under resale agreements 43,256,616.11 75,211,380.15
Others 63,601,786.20 57,657,771.79 Total 30,572,263,291.07 29,663,134,420.97
Note: Refer to Note (VII) 1.
59. Non-operating income
(1) Details of non-operating income are as follows:
Unit: RMB
Item Year Ended
December 31, 2016
Year Ended December 31,
2015 Government grants 2,547,141,715.81 3,116,012,280.67 Gain on disposal of non-current assets 369,860,085.83 130,869,909.39 Compensation received for postponed transactions 139,531,490.00 - Discount of equity transactions 22,211,562.00 - Payables waived by creditors 15,705,969.87 4,250,016.80 Acquisition discounts from business combination not involving enterprises under common control (Note) 9,108,139.00 204,657,090.00
Debt restructuring gain 266,280.06 199,000.89 Others 209,939,938.49 210,674,919.18 Total 3,313,765,181.06 3,666,663,216.93
Note: Refer to Note (VII)1(5).
(2) Details of government grants recognized in profit or loss are as follows:
Unit: RMB
Item Year Ended December 31, 2016
Year Ended December 31, 2015 Related To Assets/Income
Relocation compensation 870,053,865.44 1,266,932,057.38 Assets/Income Subsidies for purchase of long-term assets 230,136,054.37 125,901,476.26 Assets
Technical improvement 21,913,127.91 23,112,398.21 Assets Subsidies for project development 91,559,129.31 275,609,807.14 Income Financial subsidies 1,333,479,538.78 1,424,456,541.68 Income Total 2,547,141,715.81 3,116,012,280.67

SAIC MOTOR CORPORATION LIMITED NOTES TO THE FINANCIAL STATEMENTS YEAR ENDED DECEMBER 31, 2016
第 86 页
VI. NOTES TO ITEMS IN THE CONSOLIDATED FINANCIAL STATEMENTS - continued
60. Non-operating expenses
Unit: RMB
Item Year Ended December 31, 2016
Year Ended December 31, 2015
Relocation 579,493,040.64 746,203,843.09 Loss on disposal of non-current assets 216,270,785.25 385,789,730.40 Indemnity loss to suppliers 62,659,273.01 205,908,776.07 Donations 31,664,018.71 8,315,916.55 Others 364,223,560.44 98,798,870.33 Total 1,254,310,678.05 1,445,017,136.44
61. Income tax expenses
Unit: RMB
Item Year Ended December 31, 2016
Year Ended December 31, 2015
Current income tax expenses 10,523,380,576.45 7,627,818,575.58 Deferred income tax expenses (3,992,884,812.25) (1,892,111,312.56) Total 6,530,495,764.20 5,735,707,263.02
Reconciliation of income tax and accounting profit is as follows:
Unit: RMB
Item Year Ended December 31, 2016
Year Ended December 31, 2015
Accounting profit 50,492,457,462.54 45,809,676,486.26 Income tax expenses calculated at 15% (Year 2015: 15%) 7,573,868,619.38 6,871,451,472.94 Effect of costs, expenses and losses that are not deductible for tax purposes 197,153,929.11 129,076,834.10
Effect of using previously unrecognized deductible losses and deductible temporary differences for tax purposes (228,896,690.81) (468,072,541.17)
Effect of unrecognized deductible losses and deductible temporary differences for tax purposes 1,531,777,880.51 1,792,347,042.00
Adjustment on prior year’s income tax according to final settlement
(330,589,044.98) (302,491,645.24)
Effect of non-taxable revenue (4,327,873,391.45) (4,079,148,055.97) Effect of super tax deduction for research and development expenditures (201,406,548.03) (253,475,896.49)
Effect of different tax rates of subsidiaries operating in other jurisdictions 2,316,461,010.47 2,046,020,052.85
Total 6,530,495,764.20 5,735,707,263.02
62. Other comprehensive income (loss), net of tax
Please refer to Note (VI) 46 for more details.

SAIC MOTOR CORPORATION LIMITED NOTES TO THE FINANCIAL STATEMENTS YEAR ENDED DECEMBER 31, 2016
第 87 页
VI. NOTES TO ITEMS IN THE CONSOLIDATED FINANCIAL STATEMENTS - continued
63. Entrusted business off balance sheet of SFC
Unit: RMB December 31, 2016 December 31, 2015
Entrusted loans 630,000,000.00 433,000,000.00 Entrusted investments 155,347,679.10 161,688,371.88 Total 785,347,679.10 594,688,371.88
64. Notes to cash flow statement
Other cash payments relating to financing activities
Unit: RMB Item December 31, 2016 December 31, 2015
Increase of restricted cash (including pledge of bank acceptances, etc.) 996,638,269.11 600,447,044.62
65. Supplementary information to the cash flow statements
(1) Supplementary information to the cash flow statements
Unit: RMB
Supplementary information Year Ended December 31, 2016
Year Ended December 31, 2015
1. Reconciliation of net profit to cash flow from operating activities:
Net profit 43,961,961,698.34 40,073,969,223.24 Add: Provision for impairment loss of assets 3,209,471,405.61 2,848,172,468.53
Depreciation of fixed assets 6,600,873,155.29 5,324,578,684.50 Amortization of intangible assets 751,238,155.95 497,656,651.25 Depreciation and amortization of investment properties 132,318,138.14 129,382,372.97 Amortization of long-term deferred expenses 414,905,258.81 292,087,330.45 Losses on disposal of fixed assets, intangible assets and other long-term assets 425,903,740.06 1,001,123,664.10
Losses on changes in fair values 10,023,468.92 285,516,870.56 Financial expenses 739,757,086.48 764,224,190.76 Investment income (30,572,263,291.07) (29,663,134,420.97) Increase in deferred tax assets (3,855,837,341.92) (1,863,775,778.47) Decrease in deferred tax liabilities (137,047,470.33) (28,335,534.09) Increase in inventories 474,259,074.38 2,185,927,394.69 Net increase in repurchase arrangements (928,112,855.49) - Increase in operating receivables (28,622,254,880.82) (4,454,292,659.35) Increase in operating payables 18,771,738,473.70 8,599,474,458.13 Net cash flow from operating activities 11,376,933,816.05 25,992,574,916.30
2. Net movement of cash and cash equivalents: Balance at the end of the year 94,085,166,952.50 62,107,494,271.45 Less: Balance at the beginning of the year 62,107,494,271.45 72,071,515,299.46 Net increase (decrease) in cash and cash equivalents 31,977,672,681.05 (9,964,021,028.01)

SAIC MOTOR CORPORATION LIMITED NOTES TO THE FINANCIAL STATEMENTS YEAR ENDED DECEMBER 31, 2016
第 88 页
VI. NOTES TO ITEMS IN THE CONSOLIDATED FINANCIAL STATEMENTS - continued
65. Supplementary information to the cash flow statements – continued
(2) Cash and cash equivalents
Unit: RMB Item December 31, 2016 December 31, 2015
Cash 18,824,430.85 4,654,420.65 Bank deposit 93,515,958,759.94 62,027,836,897.57 Other currencies 550,383,761.71 75,002,953.23 Closing balance of cash and cash equivalents 94,085,166,952.50 62,107,494,271.45
66. Assets with restricted ownership or use right
Unit: RMB
Item Book value at December 31, 2016
Reason of restriction (Please refer to)
Cash and bank balance 11,847,368,573.79 Note (VI) 1 Financial assets at FVTPL 150,109,198.93 Note (VI) 2 Notes receivable 821,710,803.00 Note (VI) 3 Accounts receivable 18,750,000.00 Note (VI) 4 Long-term receivables 697,443,555.32 Note (VI) 14 Long-term equity investments 650,407,404.99 Note (VI) 15 Fixed assets 511,486,206.21 Note (VI) 17 Construction in progress 347,693,524.48 Note (VI)18 Intangible assets 345,554,901.61 Note (VI)19 Total 15,390,524,168.33 67. Foreign currency monetary items
Unit: RMB
Item Balance of foreign
currency at December 31, 2016
Exchange rate Balance of RMB at December 31, 2016
Cash and bank balance -USD 1,078,187,734.40 6.9370 7,479,388,313.53 -EUR 122,688,433.05 7.3068 896,459,842.61 -GBP 33,551,252.69 8.5094 285,501,029.64 -THB 1,229,840,808.85 0.1939 238,466,132.84 -HKD 202,746,404.53 0.8945 181,356,658.85 -JPY 265,167,750.28 0.0596 15,803,997.92 -Others 170,280,982.94 Total 9,267,256,958.33 Short-term borrowings -USD 40,000,000.00 6.9370 277,480,000.00 -EUR 4,827,851.26 7.3068 35,276,143.59 -JPY 2,014,562,560.00 0.0596 120,067,928.58 -THB 480,000,000.00 0.1939 93,072,000.00 Total 525,896,072.17 Long-term borrowing -USD 79,000,000.00 6.9370 548,023,000.00 -THB 4,510,862,425.06 0.1939 874,656,224.22 Total 1,422,679,224.22
Note: Majority of the transactions of the Group are incurred domestically, majority of the assets and liabilities
are dominated in RMB. Therefore, there were no significant foreign currency monetary items except cash and borrowings.

SAIC MOTOR CORPORATION LIMITED NOTES TO THE FINANCIAL STATEMENTS YEAR ENDED DECEMBER 31, 2016
第 89 页
VII. CHANGES IN THE SCOPE OF CONSOLIDATION 1. Business combination not involving enterprises under common control
Significant business combination not involving enterprises under common control of the Group during the year:
(1)Acquisition of equity interests in Shanghai Sunwin
Shanghai Sunwin was a joint-venture invested by the Company, VOLVO (China) Investment Bus Co., Ltd. ("VOLVO China") and VOLVO Bus Co., Ltd. ("VOLVO Bus"), holding equity interests of 50.00%, 45.00% and 5.00% respectively. Shanghai Sunwin was a JCE of the Company. In the current year, the Company signed the capital increase agreement with VOLVO China and VOLVO Bus, pursuant to the agreement, the Company unilateral injected the capital of RMB 422,301,294.40 to Shanghai Sunwin. After the capital injection, the Company held 80.50% of the equity in Shanghai Sunwin and obtained majority voting rights on the board. According to the revised Articles of Association of Shanghai Sunwin, the Company has obtained control over Shanghai Sunwin, which became a subsidiary of the Company. Shanghai Sunwin has been included in the scope of the Company’s consolidated financial statements since July, 2016. (2) Acquisition of equity interest of IVECO Hongyan IVECO Hongyan was a subsidiary invested by the joint venture of the Company, SAIC-IVECO Hongyan Commercial Vehicle Investment Company Ltd. ("Commercial Vehicle Investment Company"), holding 67.00% of equity interest in IVECO Hongyan. In the current year, the Company acquired 53.92% of the equity interest in IVECO Hongyan from Commercial Vehicle Investment Company at the consideration of RMB 106,740,393.30. After the transaction, the Company held 53.92% of equity interest in IVECO Hongyan and obtained majority voting rights on the board. According to the revised Articles of Association of IVECO Hongyan, the Company obtained the control over IVECO Hongyan, which became a subsidiary of the Company. IVECO Hongyan has been included in the scope of the Company’s consolidated financial statements since December 2016. (3) Business combination not involving enterprises under common control for Global Rental Global Chexiang Car Leasing Co., Ltd. ("Global Rental") is a company invested by the subsidiary of the Group, Investment Management and Shanghai International Automobile City (Group) Co., Ltd., holding 51.00% and 49.00% of equity interest in Global Rental respectively, Investment Management had control over Global Rental. In the current year, both shareholders of Global Rental made additional capital injection. Shanghai International Automobile City (Group) Co., Ltd. made additional capital injection by transferring it 76.19% equity interest in Shanghai International Auto Operation Service Co., Ltd; its 70.00% equity interest in Zhejiang Quzhou Yidong New Energy Automobile Operation Service Co., Ltd and its 70.00% equity interest in Zhejiang Lishui Yidong New Energy Automobile Operation Service Co., Ltd. to Global Rental. After the transaction, Global Rental obtained the control over aforementioned enterprises, which have been included in the scope of the consolidated financial statements since November 30, 2016. (4) Business acquisition of SAIC Maxus In the current year, SAIC Maxus, a subsidiary of the Group, entered into a business acquisition agreement and assets acquisition agreement with Nanjing Iveco Automobile Co., Ltd., a joint venture of the Group, pursuant to which SAIC Maxus acquired the Yuejin business operated by Nanjing Iveco Automobile Co., Ltd., and the transaction was completed at December 31, 2016.

SAIC MOTOR CORPORATION LIMITED NOTES TO THE FINANCIAL STATEMENTS YEAR ENDED DECEMBER 31, 2016
第 90 页
VII. CHANGES IN THE SCOPE OF CONSOLIDATION - continued 1. Business combination not involving enterprises under common control - continued Significant business combination not involving enterprises under common control of the Group during the year: - continued
Major financial information of the above acquired entities (1) - (4) at the acquisition date
Unit: RMB
Fair value (Note 1) Book value Identifiable assets: Current assets 4,346,129,206.87 4,328,450,294.31 Non-current assets 3,228,457,289.65 2,469,152,627.46 Sub-total of assets 7,574,586,496.52 6,797,602,921.77 Identifiable liabilities: Current liabilities 6,454,071,543.86 6,456,531,965.37 Non-current liabilities 476,250,588.63 471,570,167.12 Sub-total of liabilities 6,930,322,132.49 6,928,102,132.49 Total owners’ equity 644,264,364.03 (130,499,210.72) Less: minority interest 93,853,087.06
Total equity attributable to the shareholders of the Company 550,411,276.97 Add: Goodwill 199,561,518.14 Acquisition consideration (Note 2) 749,972,795.11
Goodwill includes: Goodwill of Shanghai Sunwin arising from capital increase 53,349,858.83 Good will of Global Rental arising from business combination 146,211,659.31
Note1: Fair value of identifiable net assets and all shareholder’s equity of the above acquired entities at the
acquisition date has been valued by appraiser. Note2: Acquisition consideration of Shanghai Sunwin included cash payment of RMB 422,301,294.40 and the
previously held long-term equity investments with fair value of RMB 5,500,000.00 (the book value is RMB 0); acquisition consideration of IVECO Hongyan includes cash payment of RMB 106,740,393.30; Global Rental acquired three subsidiaries by issuing share capital of RMB 137,401,261.25 to Shanghai International Automobile City (Group) Co.,Ltd.; SAIC Maxus acquired the Yuejin business at the consideration of RMB 78,029,846.16.
Net cash outflows of acquired entities due to acquisition of subsidiaries/business for the Group:
Unit: RMB
Amount Cash and cash equivalents held by the acquired subsidiaries /business 43,672,892.03 Less: Cash and cash equivalents paid as acquisition consideration 529,041,687.70 Net cash and cash equivalents outflow for acquisition of subsidiaries/business (485,368,795.67)

SAIC MOTOR CORPORATION LIMITED NOTES TO THE FINANCIAL STATEMENTS YEAR ENDED DECEMBER 31, 2016
第 91 页
VII. CHANGES IN THE SCOPE OF CONSOLIDATION - continued
1. Business combination not involving enterprises under common control - continued
Significant business combination not involving enterprises under common control of the Group during the year: - continued Results of operation and net cash flows of acquired entities during the period from the acquisition date to the end of the year are as follow:
Unit: RMB
Amount Operating income 1,185,083,472.99 Operating costs and expense 1,343,486,226.80 Total profit(loss) (158,402,753.81) Net profit(loss) (160,516,023.69) Cash flow from operating activities 12,058,072.40 Cash flow from investing activities (87,868,676.37) Cash flow from financing activities 93,621,459.59 Effect of foreign exchange rate changes on cash equivalents 1,101,536.44 Net increase in cash and cash equivalents 18,912,392.06 (5) Business combination not involving enterprises under common control of the subsidiary of the Group, HASCO for the current year
In the current year, Yanfeng Automotive Trim Systems Co., Ltd. ("Yanfeng Trim"), a subsidiary of HASCO, acquired 51% equity interest in Beijing Johnson Automotive Trim Co., Ltd. ("Beijing Johnson Trim") from Adient Automotive Interior Investment Co., Limited (formerly known as Johnson Controls Automotive Interior Investment Co., Limited, hereinafter referred as" Adient Interior Investment"). The transaction was completed on October 1, 2016, and Yanfeng Trim obtained control over Beijing Johnson Trim. Major financial information of the above acquired entities:
Unit: RMB
Fair value (Note ) Book value Identifiable assets: Current assets 259,970,837.00 259,970,839.00 Non-current assets 381,451,201.00 377,789,620.00 Sub-total of assets 641,422,038.00 637,760,459.00 Identifiable liabilities: Current liabilities 623,562,940.00 622,647,545.00 Non-current liabilities 623,562,940.00 622,647,545.00 Sub-total of owners’ equity 17,859,098.00 15,112,914.00 Less: minority interest 8,750,958.00
Shareholders' equity attributable to HASCO 9,108,140.00 Less: Amount of where cost of combination is smaller than the portion of fair value of identifiable net assets 9,108,139.00
Acquisition consideration 1.00
Note: Fair value of the above identifiable assets and liabilities are determined based on appraisal report.

SAIC MOTOR CORPORATION LIMITED NOTES TO THE FINANCIAL STATEMENTS YEAR ENDED DECEMBER 31, 2016
第 92 页
VII. CHANGES IN THE SCOPE OF CONSOLIDATION - continued
1. Business combination not involving enterprises under common control - continued
Significant business combination not involving enterprises under common control of the Group during the year: - continued
(5) Business combination not involving enterprises under common control of the subsidiary of the Group, HASCO for the current year - continued
Net cash receipts of the Group due to the acquisition of subsidiaries
Unit: RMB
Amount Cash and cash equivalents held by the acquired entities on acquisition date 11,088,120.00 Less: Acquisition consideration 1.00 Net cash inflow from acquisition of subsidiaries 11,088,119.00 Results of operation and net cash flows of acquired subsidiaries during the period from the acquisition date to the end of the year are as follow:
Unit: RMB Amount
Operating income 146,114,031.00 Net profit 13,042,401.00
2. Disposal of subsidiaries
(1) Partial disposal of subsidiaries that result in losing control but retaining joint control or significant influence - ANJI Logistics
Shanghai Anfu Logistics Co., Ltd. (“Anfu”) was a subsidiary of ANJI Logistics, holding 62.74% of the equity interest. According to the resolution of shareholder meeting of Anfu, ANJI Logistics transferred 13.74% of the equity interest in Anfu to another shareholder, Shanghai West Shanghai Logistics Co., Ltd., therefore, the shareholding of the Group was reduced to 49.00%. According to the revised Article of Association of Anfu, the Group lost control over Anfu but still retains joint control. The consideration payment and equity transfer registration of the transaction was completed on June 30, 2016, since when Anfu has been de-consolidated and accounted for as a JCE. Shanghai Anji Xunda Automobile Transportation Co., Ltd. (“Anji Xunda”) was a subsidiary of ANJI Logistics, holding 56.10% of the equity interest. According to the resolution of shareholder meeting of Anji Xunda, ANJI Logistics unilaterally reduce its capital in Anji Xunda, therefore, the registered capital of Anji Xunda was reduced from RMB 20,500,000.00 to RMB 17,647,059.00, and the shareholding of the Group was reduced to 49.00%. According to the revised Article of Association of Anji Xunda, the Group lost control over Anji Xunda but retains joint control. Anji Logistics received RMB 10,010,700 on June 30, 2016, since when Anji Schindler has been de-consolidated and accounted for as a JCE.

SAIC MOTOR CORPORATION LIMITED NOTES TO THE FINANCIAL STATEMENTS YEAR ENDED DECEMBER 31, 2016
第 93 页
VII. CHANGES IN THE SCOPE OF CONSOLIDATION - continued 2. Disposal of subsidiaries - continued Financial information of the disposed subsidiaries at the disposal date:
Unit: RMB Acquisition date
Assets: Current assets 707,642,881.69 Non-current assets 53,268,359.48 Sub-total of assets 760,911,241.17 Liabilities: Current liabilities 603,716,656.02 Non-current liabilities 603,716,656.02 Sub-total of owners’ equity 157,194,585.15 Less: minority interest 62,363,394.62 Shareholders' equity attributable to Anji Logistics 94,831,190.53 Results of operating and net cash flows of disposed subsidiaries during the period from the start of the year and the disposal date are as follows:
Unit: RMB
From the beginning to the disposal date
Operating income 681,052,510.37 Net profit (loss) (11,956,380.87) Net increase (decrease) in cash and cash equivalents (6,790,280.41) Gains/ (losses) on disposal of subsidiaries:
Unit: RMB Gains
Consideration receipts from disposal of subsidiaries 30,694,300.00 Add: Fair value of the remaining fair value 72,120,103.72 Less: net assets according to the original proportion of ownership interest 94,830,348.58 Income from disposal 7,984,055.14
3. Other changes of the scope of consolidation
SAIC Group Financial Holding Management Co., Ltd. was established by the Group for the current year and was included in the scope of consolidated financial statements since then, refer to Note VIII, 2.
Other than events above, there were no material changes to the scope of consolidated financial statements during the year.

SAIC MOTOR CORPORATION LIMITED NOTES TO THE FINANCIAL STATEMENTS YEAR ENDED DECEMBER 31, 2016
第 94 页
VIII. INTERESTS IN OTHER ENTITIES
1. Major transactions of subsidiaries that shares of equity attributable to shareholders of the Company
changed but the control over subsidiaries unchanged (1) Non-public offering of HASCO On January 6, 2016, HASCO, a subsidiary of the Company, completed the issuance of non-public offering of A shares, totaling 569,523,809 ordinary shares in RMB. The Company subscribed 286,214,858 shares with 100.00% of equity interests it held in Shanghai Huizhong, and other investors subscribed 283,308,951 shares in cash. After the issuance, HASCO has 3,152,723,984 shares in issue, and the proportion of the Company's shareholding in HASCO was reduced from 60.10% to 58.32%. The effect of the transaction on the Group's consolidated financial statements is as follows:
Unit: RMB Amount Shares of the Company in the net assets of HASCO and Shanghai Huizhong after the non-public offering 20,555,458,093.28
Shares of the Company in the net assets of HASCO and Shanghai Huizhong before the non-public offering 19,776,340,992.94
Difference recognized in capital reserve 779,117,100.34
(2) Other changes
(a) In the transaction described in Note (VII) 1 (3), Investment Management contributes to Global Rental with the 100.00% of equity interest it held in Shanghai Saike Car Rental Co., Ltd.("Saike Rental"). Upon completion of the transaction, the effective shareholding ratio of the Group to Saike Rental reduced from 100.00% to 51.00% but still has control over it.
(b) Shanghai Chexiang Automotive Accessary Technology Service Co., Ltd. ("Chexiang Automotive Accessary") is a subsidiary of the Group with an 80.00% shareholding in it. During the year, the Group's subsidiary, Industrial Sales, purchased a 20.00% shareholding in Chexiang Automotive Accessary which held by SAIC. After the transaction, the Group's shareholding in Chexiang Automotive Accessary increased to 100.00%.
(c) Shanghai Jineng Bus Power System Co., Ltd. (" Jineng Bus ") was originally a subsidiary of the Company
with a shareholding ratio of 60.00%. During the year, the Company entered into an equity transfer agreement with Volvo Bus Company to acquire remaining 40.00% of equity interests in Jineng Bus, after which Jineng Bus became a wholly-owned subsidiary of the Company.

SAIC MOTOR CORPORATION LIMITED NOTES TO THE FINANCIAL STATEMENTS YEAR ENDED DECEMBER 31, 2016
第 95 页
VIII. INTERESTS IN OTHER ENTITIES - continued
2. Interests in subsidiaries
(1) Composition of the Group - major subsidiaries
Full name of the subsidiary Place of incorporation
Registered capital Scope of business Equity interest held at
year-end (%) Ways of Acquisition Currency ’ 000 Directly Indirectly
SAIC Motor UK Co., Ltd. Birmingham, UK GBP 3,000 R&D of automobiles 100.00 - Established or acquired through investments
SAIC Motor Transmission Co., Ltd. Shanghai, China RMB 3,990,529 Manufacturing and sales of automobile transmission and spare parts 100.00 - Established or acquired through
investments
SAIC Motor HK Investment Ltd. Hong Kong, China USD 9,900 International trade of auto and critical spare parts, investment, technical and service trade, training and consulting
100.00 - Established or acquired through investments
SAIC Maxus Vehicle Co., Ltd Shanghai, China RMB 3,794,250 Manufacturing of automobiles and components 100.00 - Established or acquired through
investments
SAIC Motor Equity Investment Co., Ltd. Shanghai, China RMB 3,300,000 Equity investment, venture capital
investment, industrial consulting, property management
100.00 - Established or acquired through investments
SAIC General Motors Sales Co., Ltd. Shanghai, China USD 49,000 Sales of automobiles 51.00 - Established or acquired through investments
SAIC Motor - CP Co., Ltd. Bangkok, Thailand THB 4,500,000
Developing, manufacturing and sales of automobiles and spare parts;
Manufacturing and processing of machinery
- 51.00
Established or acquired through investments
Shanghai Jineng Bus Drive System Co., Ltd. Shanghai, China RMB 100,000 Manufacturing of new energy bus drive system and other spare parts 100.00 - Established or acquired through
investments
Shanghai Shanghong Real Estate Co., Ltd. Shanghai, China RMB 1,900,000 Developing and operating real estate, property management 100.00 - Established or acquired through
investments
SAIC International Indonesia PT. West Java, Indonesia USD 118,000 Developing and operating real estate, property management 90.00 - Established or acquired through
investments
SAIC Investment Management Co., Ltd. Shanghai, China RMB 3,000,000 Industrial investment, asset management, investment management, storage service
(except hazardous goods) 100.00 -
Established or acquired through investments
SAIC Group Financial Holding Management Co., Ltd. (Note 1) Shanghai, China RMB 2,000,000
Industrial investment, asset management, investment management, consulting
services, and network technology etc. 100.00
Established or acquired through investments
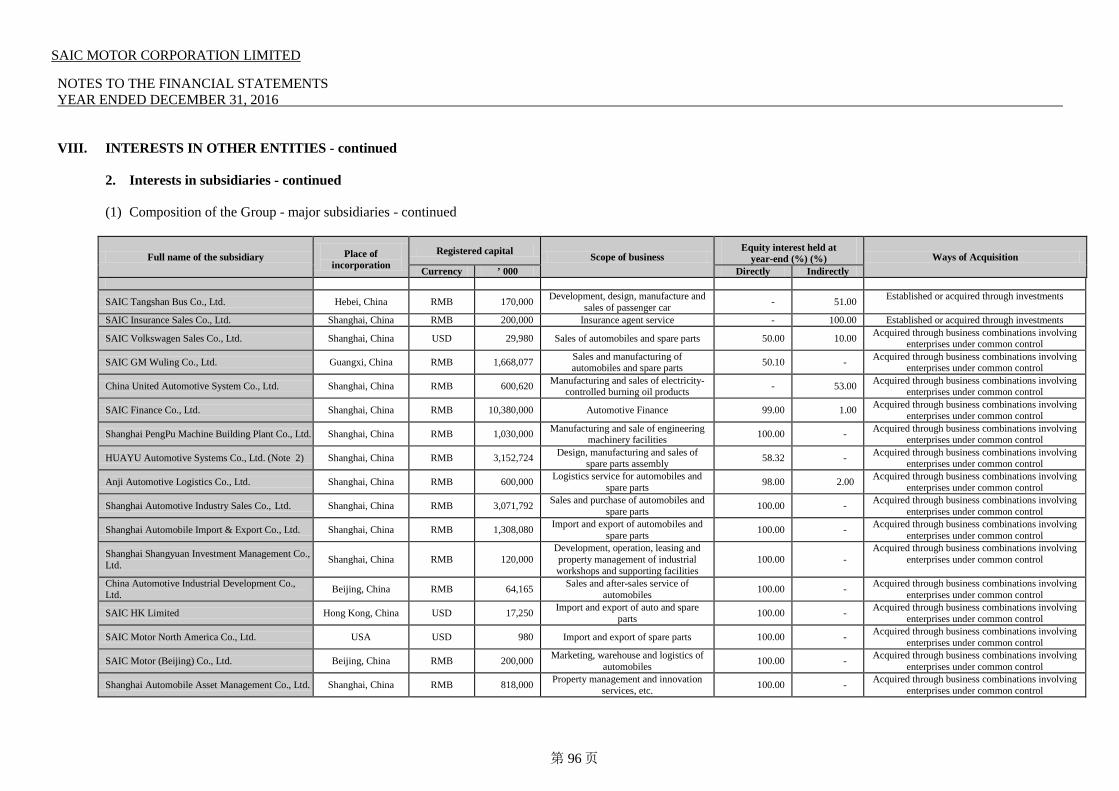
SAIC MOTOR CORPORATION LIMITED NOTES TO THE FINANCIAL STATEMENTS YEAR ENDED DECEMBER 31, 2016
第 96 页
VIII. INTERESTS IN OTHER ENTITIES - continued
2. Interests in subsidiaries - continued
(1) Composition of the Group - major subsidiaries - continued
Full name of the subsidiary Place of incorporation
Registered capital Scope of business Equity interest held at
year-end (%) (%) Ways of Acquisition Currency ’ 000 Directly Indirectly
SAIC Tangshan Bus Co., Ltd. Hebei, China RMB 170,000 Development, design, manufacture and sales of passenger car - 51.00 Established or acquired through investments
SAIC Insurance Sales Co., Ltd. Shanghai, China RMB 200,000 Insurance agent service - 100.00 Established or acquired through investments
SAIC Volkswagen Sales Co., Ltd. Shanghai, China USD 29,980 Sales of automobiles and spare parts 50.00 10.00 Acquired through business combinations involving enterprises under common control
SAIC GM Wuling Co., Ltd. Guangxi, China RMB 1,668,077 Sales and manufacturing of automobiles and spare parts 50.10 - Acquired through business combinations involving
enterprises under common control
China United Automotive System Co., Ltd. Shanghai, China RMB 600,620 Manufacturing and sales of electricity-controlled burning oil products - 53.00 Acquired through business combinations involving
enterprises under common control
SAIC Finance Co., Ltd. Shanghai, China RMB 10,380,000 Automotive Finance 99.00 1.00 Acquired through business combinations involving enterprises under common control
Shanghai PengPu Machine Building Plant Co., Ltd. Shanghai, China RMB 1,030,000 Manufacturing and sale of engineering machinery facilities 100.00 - Acquired through business combinations involving
enterprises under common control
HUAYU Automotive Systems Co., Ltd. (Note 2) Shanghai, China RMB 3,152,724 Design, manufacturing and sales of spare parts assembly 58.32 - Acquired through business combinations involving
enterprises under common control
Anji Automotive Logistics Co., Ltd. Shanghai, China RMB 600,000 Logistics service for automobiles and spare parts 98.00 2.00 Acquired through business combinations involving
enterprises under common control
Shanghai Automotive Industry Sales Co., Ltd. Shanghai, China RMB 3,071,792 Sales and purchase of automobiles and spare parts 100.00 - Acquired through business combinations involving
enterprises under common control
Shanghai Automobile Import & Export Co., Ltd. Shanghai, China RMB 1,308,080 Import and export of automobiles and spare parts 100.00 - Acquired through business combinations involving
enterprises under common control
Shanghai Shangyuan Investment Management Co., Ltd. Shanghai, China RMB 120,000
Development, operation, leasing and property management of industrial workshops and supporting facilities
100.00 - Acquired through business combinations involving
enterprises under common control
China Automotive Industrial Development Co., Ltd. Beijing, China RMB 64,165 Sales and after-sales service of
automobiles 100.00 - Acquired through business combinations involving enterprises under common control
SAIC HK Limited Hong Kong, China USD 17,250 Import and export of auto and spare parts 100.00 - Acquired through business combinations involving
enterprises under common control
SAIC Motor North America Co., Ltd. USA USD 980 Import and export of spare parts 100.00 - Acquired through business combinations involving enterprises under common control
SAIC Motor (Beijing) Co., Ltd. Beijing, China RMB 200,000 Marketing, warehouse and logistics of automobiles 100.00 - Acquired through business combinations involving
enterprises under common control
Shanghai Automobile Asset Management Co., Ltd. Shanghai, China RMB 818,000 Property management and innovation services, etc. 100.00 - Acquired through business combinations involving
enterprises under common control
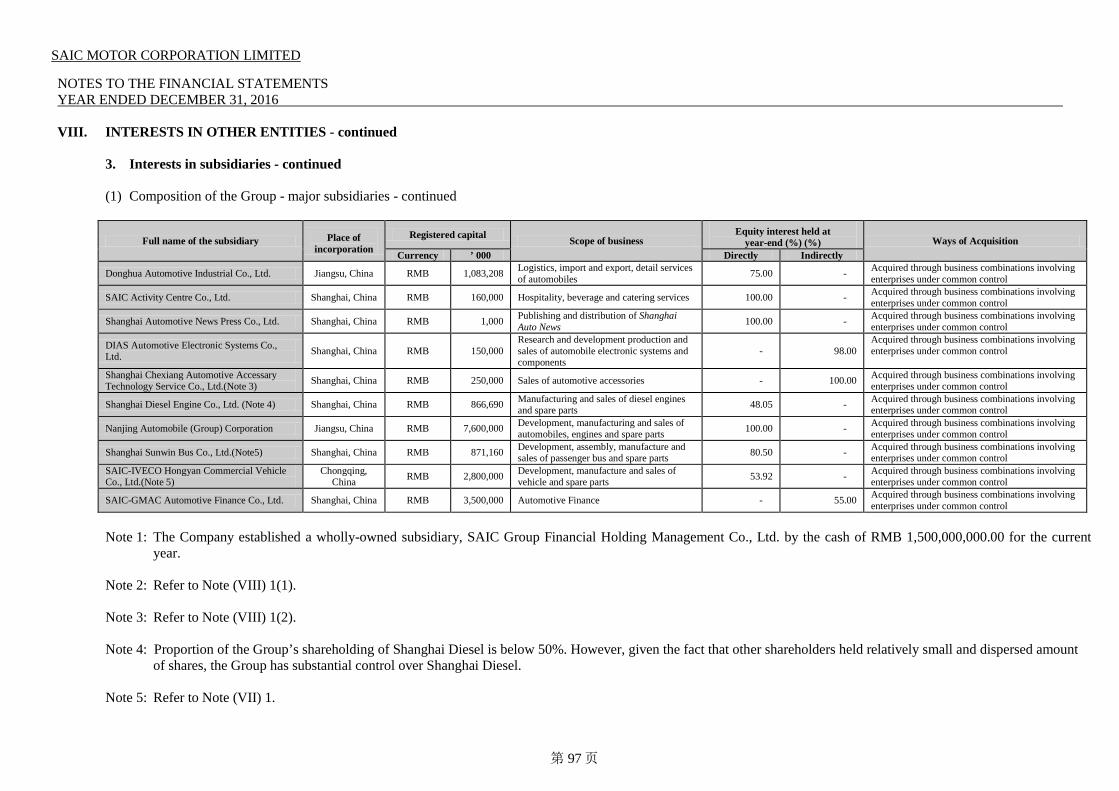
SAIC MOTOR CORPORATION LIMITED NOTES TO THE FINANCIAL STATEMENTS YEAR ENDED DECEMBER 31, 2016
第 97 页
VIII. INTERESTS IN OTHER ENTITIES - continued
3. Interests in subsidiaries - continued
(1) Composition of the Group - major subsidiaries - continued
Full name of the subsidiary Place of incorporation
Registered capital Scope of business Equity interest held at
year-end (%) (%) Ways of Acquisition Currency ’ 000 Directly Indirectly
Donghua Automotive Industrial Co., Ltd. Jiangsu, China RMB 1,083,208 Logistics, import and export, detail services of automobiles 75.00 - Acquired through business combinations involving
enterprises under common control
SAIC Activity Centre Co., Ltd. Shanghai, China RMB 160,000 Hospitality, beverage and catering services 100.00 - Acquired through business combinations involving enterprises under common control
Shanghai Automotive News Press Co., Ltd. Shanghai, China RMB 1,000 Publishing and distribution of Shanghai Auto News 100.00 - Acquired through business combinations involving
enterprises under common control
DIAS Automotive Electronic Systems Co., Ltd. Shanghai, China RMB 150,000
Research and development production and sales of automobile electronic systems and components
- 98.00 Acquired through business combinations involving enterprises under common control
Shanghai Chexiang Automotive Accessary Technology Service Co., Ltd.(Note 3) Shanghai, China RMB 250,000 Sales of automotive accessories - 100.00 Acquired through business combinations involving
enterprises under common control
Shanghai Diesel Engine Co., Ltd. (Note 4) Shanghai, China RMB 866,690 Manufacturing and sales of diesel engines and spare parts 48.05 - Acquired through business combinations involving
enterprises under common control
Nanjing Automobile (Group) Corporation Jiangsu, China RMB 7,600,000 Development, manufacturing and sales of automobiles, engines and spare parts 100.00 - Acquired through business combinations involving
enterprises under common control
Shanghai Sunwin Bus Co., Ltd.(Note5) Shanghai, China RMB 871,160 Development, assembly, manufacture and sales of passenger bus and spare parts 80.50 - Acquired through business combinations involving
enterprises under common control SAIC-IVECO Hongyan Commercial Vehicle Co., Ltd.(Note 5)
Chongqing, China RMB 2,800,000 Development, manufacture and sales of
vehicle and spare parts 53.92 - Acquired through business combinations involving enterprises under common control
SAIC-GMAC Automotive Finance Co., Ltd. Shanghai, China RMB 3,500,000 Automotive Finance - 55.00 Acquired through business combinations involving enterprises under common control
Note 1: The Company established a wholly-owned subsidiary, SAIC Group Financial Holding Management Co., Ltd. by the cash of RMB 1,500,000,000.00 for the current
year. Note 2: Refer to Note (VIII) 1(1). Note 3: Refer to Note (VIII) 1(2). Note 4: Proportion of the Group’s shareholding of Shanghai Diesel is below 50%. However, given the fact that other shareholders held relatively small and dispersed amount
of shares, the Group has substantial control over Shanghai Diesel.
Note 5: Refer to Note (VII) 1.

SAIC MOTOR CORPORATION LIMITED NOTES TO THE FINANCIAL STATEMENTS YEAR ENDED DECEMBER 31, 2016
第 98 页
VIII. INTERESTS IN OTHER ENTITIES - continued
2. Interests in subsidiaries - continued
(2) Significant non-wholly owned subsidiaries
Unit: RMB’000
Name of the subsidiary Equity interest held by minority shareholders(%)
Profit or loss attributable to minority interests during the
year
Dividend declared to minority shareholders during the year
Minority interests at December 31, 2016
HASCO 41.68 4,863,402.82 2,398,077.41 22,745,369.41 SGMW 49.90 2,593,995.88 2,128,495.06 5,096,692.10
(3) Major financial information of significant non-wholly owned subsidiaries
Unit: RMB’000 Name of the subsidiary
December 31, 2016 December 31, 2015
Current assets Non-current assets Total assets Current
liabilities Non-current
liabilities Total liabilities Current assets Non-current assets Total assets Current
liabilities Non-current
liabilities Total liabilities
HASCO 67,832,100.81 39,779,612.67 107,611,713.48 51,728,705.58 10,039,355.77 61,768,061.35 55,057,098.16 35,925,834.40 90,982,932.56 44,794,207.71 9,082,994.08 53,877,201.79 Name of the subsidiary 34,127,705.91 19,865,423.42 53,993,129.33 40,364,507.78 3,065,930.43 43,430,438.21 30,294,091.60 18,346,862.96 48,640,954.56 36,655,633.39 2,361,414.14 39,017,047.53
Unit: RMB’000
Name of the subsidiary
Year ended at December 31, 2016 Year ended at December 31, 2015
Operating income Net profit attributable to shareholders of the Company
Total comprehensive
income Net cash flow from (used
in) operating activities Operating
income Net profit attributable to
shareholders of the Company Total
comprehensive income
Net cash flow from (used in) operating activities
HASCO 124,295,812.98 6,075,758.56 8,296,197.38 11,375,286.83 105,499,406.26 5,232,566.34 6,935,611.75 6,630,854.16 SGMW 104,055,989.16 5,198,180.20 5,305,648.05 12,616,154.79 92,247,637.63 5,015,357.21 5,034,820.58 11,298,547.30

SAIC MOTOR CORPORATION LIMITED NOTES TO THE FINANCIAL STATEMENTS YEAR ENDED DECEMBER 31, 2016
第 99 页
VIII. INTERESTS IN OTHER ENTITIES - continued
3. Interests in JCEs and associates
(1) Significant JCEs
JCE Place of incorporation Nature of operation
Equity interest held at year-end (%) Accounting
method Directly Indirectly SAIC Volkswagen Automotive Co., Ltd. (“SVA”) Shanghai, China Manufacturing and sales of
automobiles and components 50.00 - Equity method
SAIC General Motors Co., Ltd. (“SGM”) Shanghai, China Manufacturing and sales of
automobiles and components 50.00 - Equity method
(2) Major financial information of significant JCEs
Unit: RMB’000 Year ended December 31, 2016 Year ended December 31, 2015
SVA SGM SVA SGM Current assets 54,420,115.80 45,220,715.80 50,210,145.96 41,387,514.13 Non-current assets 63,601,265.95 59,485,430.85 56,071,327.71 52,201,436.91 Total assets 118,021,381.75 104,706,146.65 106,281,473.67 93,588,951.04 Current liabilities 63,972,831.66 64,788,161.61 52,312,447.61 53,763,728.60 Non-current liabilities 11,978,419.49 2,588,044.36 13,115,563.53 2,201,805.96 Total liabilities 75,951,251.15 67,376,205.97 65,428,011.14 55,965,534.56 Non-controlling interests - 5,599,735.49 - 5,703,739.58 Shareholders’ equity attributable to owners of the parent company 42,070,130.60 31,730,205.19 40,853,462.53 31,919,676.90
Share of net assets according to portion of shareholding 21,035,065.30 15,865,102.59 20,426,731.26 15,959,838.45
Reconciliations -Goodwill - 227,973.19 - 227,973.19 Book value of equity investment in JCEs 21,035,065.30 16,093,075.78 20,426,731.26 16,187,811.64
Operating income 228,550,591.35 202,958,782.31 218,408,811.90 177,703,199.09 Net profit attributable to owners of the parent company 25,681,997.57 16,947,692.62 24,903,317.32 16,566,612.50
Other comprehensive income 150,706.91 - 49,005.94 - Total comprehensive income 25,832,704.48 19,519,372.29 24,952,323.26 19,627,636.92
(3) Summarized financial information of insignificant JCEs and associates
Unit: RMB’000
Year ended December 31, 2016
Year ended December 31, 2015
JCEs: Total book value of investments The following items are calculated according to portion of shareholding - Net profit attributable to owners of the parent company 5,682,338.80 4,420,149.48 - Other comprehensive income (1,807.19) (4,055.04) - Total comprehensive income 5,680,531.61 4,416,094.44
Associates: Total book value of investments The following items are calculated according to portion of shareholding - Net profit attributable to owners of the parent company 1,491,055.01 1,637,061.39 - Other comprehensive income 20,088.35 (20,207.09) - Total comprehensive income 1,511,143.36 1,616,854.30

SAIC MOTOR CORPORATION LIMITED NOTES TO THE FINANCIAL STATEMENTS YEAR ENDED DECEMBER 31, 2016
第 100 页
VIII. INTERESTS IN OTHER ENTITIES - continued
4. Interests in structured entities that are not in the scope of the consolidated financial statements
Interests in structured entities that are not in the scope of the consolidated financial statements are those invested by the Group through other institutions, including funds and wealth management products. The Group only holds the shares of investment without control, so these structured entities are not included in the scope of the consolidated financial statements. During the year 2016, the Group did not provide any financial support to any of these structured entities.
The table below illustrates the book value and risk exposure of the interests in structured entities that are not included in the scope of the consolidated financial statements at December 31, 2016.
Unit: RMB Year ended at December 31, 2016
Item Investment amount
Maximum risk exposure Account
Funds 24,026,435,720.59 24,026,435,720.59 Available-for-sale financial assets, financial assets at fair value through profit or loss
Wealth management products
9,641,281,616.75 9,641,281,616.75 Other non-current assets, available-for-sale financial assets
IX. FINANCIAL INSTRUMENTS AND RISK MANAGEMENT The Group’s major financial instruments include cash and bank balances, financial assets at fair value through profit or loss, notes receivable, accounts receivable, loans and advances, available-for-sale financial assets, long-term receivables, borrowings, financial liabilities at fair value through profit or loss, notes payable, accounts payable and bonds payable, etc. Details of these financial instruments are disclosed in Note (VI). The risks associated with these financial instruments and the policies on how to mitigate these risks are set out below. Management manages and monitors these exposures to ensure the risks are monitored at a certain level. The Group conducted sensitivity analysis to analyze the impact of reasonable and possible changes of risk variables on profit or loss and equity of the current period. Any risk variables may not change in isolation, so there might be certain relativity between the variables that will have significant effect on the amount influenced by one variable. Thus, the statements below are based on the assumption that every variable changes in isolation. 1. Risk management objectives and policies
The Group’s risk management objectives are to achieve a proper balance between risks and yield, minimize the adverse impacts of risks on the Group’s operation performance, and maximize the benefits of the shareholders and other stakeholders. Based on these risk management objectives, the Group’s basic risk management strategy is to identify and analyses the Group’s exposure to various risks, establish an appropriate maximum tolerance to risk, implements risk management, and monitors regularly and effectively these exposures to ensure the risks are monitored at a certain level.
1.1 Market risk
1.1.1. Currency risk
Currency risk is the risk that losses will occur because of changes in foreign exchange rates. The Group is closely monitoring effects might have on currency risk due to change in exchange rate. For foreign assets and liabilities on balance sheet remaining unchanged, if the exchange rates of RMB had been 10% higher/lower and other variables were held constant, the equity of the Group would decrease or increase by RMB 743,274,000 (minority interests are not deducted).
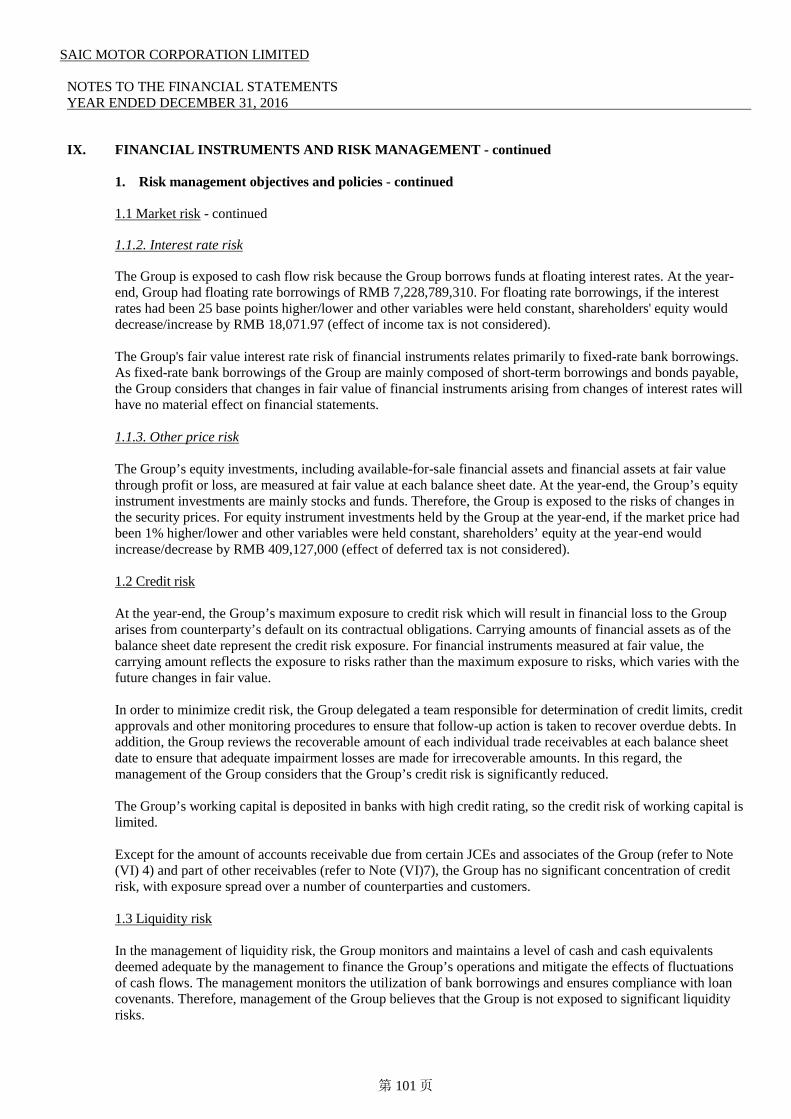
SAIC MOTOR CORPORATION LIMITED NOTES TO THE FINANCIAL STATEMENTS YEAR ENDED DECEMBER 31, 2016
第 101 页
IX. FINANCIAL INSTRUMENTS AND RISK MANAGEMENT - continued
1. Risk management objectives and policies - continued
1.1 Market risk - continued
1.1.2. Interest rate risk
The Group is exposed to cash flow risk because the Group borrows funds at floating interest rates. At the year-end, Group had floating rate borrowings of RMB 7,228,789,310. For floating rate borrowings, if the interest rates had been 25 base points higher/lower and other variables were held constant, shareholders' equity would decrease/increase by RMB 18,071.97 (effect of income tax is not considered). The Group's fair value interest rate risk of financial instruments relates primarily to fixed-rate bank borrowings. As fixed-rate bank borrowings of the Group are mainly composed of short-term borrowings and bonds payable, the Group considers that changes in fair value of financial instruments arising from changes of interest rates will have no material effect on financial statements.
1.1.3. Other price risk
The Group’s equity investments, including available-for-sale financial assets and financial assets at fair value through profit or loss, are measured at fair value at each balance sheet date. At the year-end, the Group’s equity instrument investments are mainly stocks and funds. Therefore, the Group is exposed to the risks of changes in the security prices. For equity instrument investments held by the Group at the year-end, if the market price had been 1% higher/lower and other variables were held constant, shareholders’ equity at the year-end would increase/decrease by RMB 409,127,000 (effect of deferred tax is not considered).
1.2 Credit risk
At the year-end, the Group’s maximum exposure to credit risk which will result in financial loss to the Group arises from counterparty’s default on its contractual obligations. Carrying amounts of financial assets as of the balance sheet date represent the credit risk exposure. For financial instruments measured at fair value, the carrying amount reflects the exposure to risks rather than the maximum exposure to risks, which varies with the future changes in fair value.
In order to minimize credit risk, the Group delegated a team responsible for determination of credit limits, credit approvals and other monitoring procedures to ensure that follow-up action is taken to recover overdue debts. In addition, the Group reviews the recoverable amount of each individual trade receivables at each balance sheet date to ensure that adequate impairment losses are made for irrecoverable amounts. In this regard, the management of the Group considers that the Group’s credit risk is significantly reduced.
The Group’s working capital is deposited in banks with high credit rating, so the credit risk of working capital is limited.
Except for the amount of accounts receivable due from certain JCEs and associates of the Group (refer to Note (VI) 4) and part of other receivables (refer to Note (VI)7), the Group has no significant concentration of credit risk, with exposure spread over a number of counterparties and customers.
1.3 Liquidity risk
In the management of liquidity risk, the Group monitors and maintains a level of cash and cash equivalents deemed adequate by the management to finance the Group’s operations and mitigate the effects of fluctuations of cash flows. The management monitors the utilization of bank borrowings and ensures compliance with loan covenants. Therefore, management of the Group believes that the Group is not exposed to significant liquidity risks.
SAIC MOTOR CORPORATION LIMITED NOTES TO THE FINANCIAL STATEMENTS YEAR ENDED DECEMBER 31, 2016
第 102 页
IX. FINANCIAL INSTRUMENTS AND RISK MANAGEMENT - continued
2. Transfer of financial assets In the transaction of credit assets securitization, the Group did not derecognize this kind of financial assets wholly or partly based on the extent of retained risks and rewards of ownership in the transferred financial assets. During the year, the book value of the securitized credit assets was RMB17 billion before the transfer.
The aforementioned transferred credit assets continue to provide management services by SAIC-GM Finance and SFC. Since the companies held all the subordinated parts of the asset-backed securities, such companies retained substantially all the risks and rewards of ownership of the transferred credit assets, and do not derecognize the transferred credit assets.
3. Capital management
The Group manages its capital by optimizing its structure of liabilities and equity to ensure that entities within the group are able to operate sustainably and to maximize shareholders return of investment. The overall strategy of the Group remains the same during year 2015 and 2016. The capital structure of the Group is made up of the Group’s net liabilities and equity. The Group is not restrained to external mandatory requirements of capital management. The Group’s management regularly reviews the capital structure of the Group.

SAIC MOTOR CORPORATION LIMITED NOTES TO THE FINANCIAL STATEMENTS YEAR ENDED DECEMBER 31, 2016
第 103 页
X. FAIR VALUE MEASUREMENTS
1. Fair value of assets and liabilities measured at fair value
Unit: RMB December 31, 2016 December 31, 2015
Item Level 1 Level 2 Level 3 Total Level 1 Level 2 Level 3 Total Measured at fair value on a recurring basis I. Financial assets at fair value through profit or loss 1. Held-for-trading financial assets -Debt instruments - - - - - - - - -Equity instruments 8,542,400.00 - - 8,542,400.00 111,413,005.47 - - 111,413,005.47 -Derivative financial assets - - - - - - - - 2. Designated as financial assets at fair value through profit or loss
-Equity instruments - - 1,551,210,824.57 1,551,210,824.57 - - 1,109,690,614.18 1,109,690,614.18 II. Available-for-sale financial assets 1. Debt instruments 212,777,936.40 1,683,319,149.98 - 1,896,097,086.38 522,074,000.78 - - 522,074,000.78 2.Equity instruments 39,008,052,954.21 - 9,326,281,616.75 48,334,334,570.96 54,557,250,154.12 - 10,218,572,901.35 64,775,823,055.47 Total assets measured at fair value on a recurring basis 39,229,373,290.61 1,683,319,149.98 10,877,492,441.32 51,790,184,881.91 55,190,737,160.37 - 11,328,263,515.53 66,519,000,675.90 III. Financial liabilities at fair value through profit or loss 1.Held-for-trading financial liabilities -Derivative financial liabilities - - - - - 7,486,291.00 - 7,486,291.00 Total liabilities measured at fair value on a recurring basis - - - - - 7,486,291.00 - 7,486,291.00
2. Determination of levels of fair value hierarchy
Financial assets categorized as Level 1 are mainly publicly stocks, funds and bonds traded at Shanghai Stock Exchange and Shenzhen Stock Exchange. The fair value of these assets is determined according to closing price on the balance sheet date.
Financial assets categorized as Level 2 are mainly bonds traded in the inter-bank market. The fair value of these bonds is determined according to closing price on the balance sheet date in the inter-bank market. Financial assets categorized as Level 3 are mainly unlisted equity investments Group and restricted shares investments and asset management plans held by the Group. The Group used valuation technique of "listed company comparison method" to measure the fair value of shares, based on the stock price of similar securities and the discounts of liquidity

SAIC MOTOR CORPORATION LIMITED NOTES TO THE FINANCIAL STATEMENTS YEAR ENDED DECEMBER 31, 2016
第 104 页
XI. RELATED PARTY RELATIONSHIPS AND TRANSACTIONS 1. Parent of the Company
Unit: RMB Name of
the parent company
Type Places of incorpor
ation
Legal representat
ive Business scope Registered capital
Proportion of the Company’s ownership
interest held by the parent company (%)
Proportion of the Company’s voting
rights held by the parent company (%)
Directly Indirectly Directly Indirectly
SAIC State-owned enterpri
se
Shanghai, China
Mr. Chen Hong
Manufacturing, research, sales, development and investment of automobiles, tractors and motorcycles; operation and management of state-owned assets within the scope of authority; domestic trading (except for specific regulations), advisory services
21,599,175,737.24 74.30 - 74.30 -
2. Major subsidiaries of the Group
Refer to Note (VIII) 2.
3. Major JCEs and associates of the Group
Refer to Note (VI) 15 and Note (VIII) 3.
4. Other related parties which have significant transactions or balances with the Group
Name of related parties Relationship with the Group
Shanghai Automotive Industry Development Co., Ltd. Subsidiary of SAIC SAIC Property Development Co., Ltd. Subsidiary of SAIC SAIC Sodexo Service Co., Ltd. Subsidiary of SAIC Shanghai Shangkai Real Estate Development Co., Ltd. Subsidiary of SAIC Shanghai Automotive Electronics Factory Subsidiary of SAIC Shanghai Internal Combustion Engine Research Institute Subsidiary of SAIC Shanghai Huali Internal Combustion Engine Co., Ltd. Subsidiary of SAIC Shanghai Jieneng Automotive Technology Co., Ltd. Subsidiary of SAIC Shanghai Qiyuan Human Resources Consulting Co., Ltd. Subsidiary of SAIC Shanghai Automotive Industry Real Estate Development Co., Ltd. Subsidiary of SAIC SAIC Property Development Co., Ltd. Subsidiary of SAIC Shanghai Shangqi House Replacement Co., Ltd. Subsidiary of SAIC Shanghai Machinery Industry Gas Engine Checking & Measuring Office Subsidiary of SAIC
Shanghai Yike Green Engineering Co., Ltd. Associate of SAIC Shanghai Volkswagen Automotive Gift Co., Ltd. Associate of SAIC Shanghai ADT Facilities Management Co., Ltd. Associate of SAIC Executive directors and other senior management of the Company Key management personnel
5. Related party transactions (1) Sales and purchases
(a) Sales of goods
Unit: RMB
Related party Year Ended December 31, 2016
Year Ended December 31, 2015
JCEs 69,025,769,781.19 65,551,995,858.04 Associates 4,966,727,844.55 3,959,914,768.73 Subsidiaries of SAIC 241,046.60 2,219,319.93 Total 73,992,738,672.34 69,514,129,946.70

SAIC MOTOR CORPORATION LIMITED NOTES TO THE FINANCIAL STATEMENTS YEAR ENDED DECEMBER 31, 2016
第 105 页
XI. RELATED PARTY RELATIONSHIPS AND TRANSACTIONS - continued 5. Related party transactions - continued (1) Sales and purchases - continued (b) Sales of materials
Unit: RMB Related party Year Ended December 31, 2016 Year Ended December 31, 2015
JCEs 103,312,899.47 18,085,919.14 Associates 14,182,501.16 14,306,972.90 Subsidiaries of SAIC 21,112.72 375,312.78 Total 117,516,513.35 32,768,204.82
(c) Trading income
Unit: RMB Related party Year Ended December 31, 2016 Year Ended December 31, 2015
JCEs 2,101,121,111.65 2,359,374,650.20 Associates 1,010,319.44 2,195,784.21 Total 2,102,131,431.09 2,361,570,434.41
(d) Purchase of goods and materials
Unit: RMB Related party Year Ended December 31, 2016 Year Ended December 31, 2015
JCEs 412,112,888,228.42 379,608,545,546.26 Associates 2,911,036,549.51 2,596,635,572.30 Subsidiaries of SAIC 36,105,990.01 39,648,098.21 Associates of SAIC 60,897,135.42 36,712,839.80 Total 415,120,927,903.36 382,281,542,056.57
(e) Purchase of long-term assets
Unit: RMB Related party Year Ended December 31, 2016 Year Ended December 31, 2015
JCEs 146,249,812.16 55,824,035.59 Associates 2,638,561.01 19,789,661.88 Subsidiaries of SAIC - 2,884,943.65 Associates of SAIC 264,150.94 2,667,982.02 Total 149,152,524.11 81,166,623.14
(f) Acceptance of services - R&D expenditures
Unit: RMB Related party Year Ended December 31, 2016 Year Ended December 31, 2015
JCEs 843,552,030.12 873,114,999.46 Associates 53,888,099.74 48,075,617.63 Subsidiaries of SAIC 337,908.00 401,920.56 Associates of SAIC 2,104,900.01 2,417,361.04 Total 899,882,937.87 924,009,898.69

SAIC MOTOR CORPORATION LIMITED NOTES TO THE FINANCIAL STATEMENTS YEAR ENDED DECEMBER 31, 2016
第 106 页
XI. RELATED PARTY RELATIONSHIPS AND TRANSACTIONS - continued
5. Related party transactions - continued
(2) Rendering of services
(a) Rendering of services Unit: RMB
Related party Year Ended December 31, 2016 Year Ended December 31, 2015 JCEs 4,744,498,517.89 3,353,362,422.19 Associates 85,359,361.07 134,926,158.73 SAIC 389,778,486.42 563,069,585.65 Subsidiaries of SAIC 6,004,660.36 2,662,822.48 Total 5,225,641,025.74 4,054,020,989.05
(b) Rental income
Unit: RMB Related party Year Ended December 31, 2016 Year Ended December 31, 2015
JCEs 287,953,683.82 231,295,142.47 Associates 366,025.23 15,484,278.63 Subsidiaries of SAIC 1,529,560.51 2,909,805.85 Total 289,849,269.56 249,689,226.95 (3) Other expenses
(a) Logistics service expenses, royalties and others
Unit: RMB Related party Year Ended December 31, 2016 Year Ended December 31, 2015
JCEs 79,260,371.32 260,716,206.58 Associates 18,277,881.50 4,521,803.02 SAIC 310,611.42 - Subsidiaries of SAIC 2,668,560.23 13,057,381.65 Total 100,517,424.47 278,295,391.25
(b) Rental expenses
Unit: RMB Related party Year Ended December 31, 2016 Year Ended December 31, 2015
JCEs 94,640,434.19 76,464,620.53 SAIC 7,623,371.43 19,110,810.00 Subsidiaries of SAIC 7,304,280.78 750,000.00 Total 109,568,086.40 96,325,430.53
The prices of transactions in (1) to (3) were determined based on the contracts between both parties.

SAIC MOTOR CORPORATION LIMITED NOTES TO THE FINANCIAL STATEMENTS YEAR ENDED DECEMBER 31, 2016
第 107 页
XI. RELATED PARTY RELATIONSHIPS AND TRANSACTIONS - continued
5. Related party transactions - continued
(4) Financing
Details of financing transactions between the Group and related parties are as follows:
(a) Loans offered by SFC to related parties
①Movements of loans offered by SFC to related parties are as follows: Unit: RMB
JCEs Associates Total December 31, 2015 1,727,435,279.40 165,954,075.19 1,893,389,354.59 Loans offered 2,605,669,534.52 500,631,570.27 3,106,301,104.79 Repayment collected (3,305,451,562.59) (570,653,861.80) (3,876,105,424.39) Decrease due to changes in consolidation scope for the current year (150,000,000.00) - (150,000,000.00)
December 31, 2016 877,653,251.33 95,931,783.66 973,585,034.99
②Balances of loans offered by SFC to related parties were as follows: Unit: RMB
December 31, 2016 December 31, 2015 JCEs- Short-term loans and discounts 875,222,001.33 1,727,435,279.40 Associates-Short-term loans and discounts 95,931,783.66 165,954,075.19 JCEs-Long-term loans 2,431,250.00 - Total 973,585,034.99 1,893,389,354.59 ③Loan interests received by SFC from related parties are as follows:
Unit: RMB Related party December 31, 2016 December 31, 2015
JCEs 56,791,885.39 94,696,975.56 Associates 3,567,020.57 21,036,790.13 Total 60,358,905.96 115,733,765.69 Interest rates for loans offered by SFC to related parties are determined according to interest rates specified by the People’s Bank of China. (b) Related parties’ deposits at SFC and GMAC
①Movements of related parties’ deposits at SFC and GMAC are as follows:
Unit: RMB JCEs Associates SAIC Subsidiaries of
SAIC Associates of
SAIC Total December 31, 2015 14,476,671,330.56 1,308,442,049.41 19,312,715,575.42 486,884,143.70 5,489,547.58 35,590,202,646.67 Receipts (Repayment) (1,488,925,984.17) 778,300,169.75 (3,220,007,067.86) 12,467,071.98 (4,985,016.88) (3,923,150,827.18) December 31, 2016 12,987,745,346.39 2,086,742,219.16 16,092,708,507.56 499,351,215.68 504,530.70 31,667,051,819.49

SAIC MOTOR CORPORATION LIMITED NOTES TO THE FINANCIAL STATEMENTS YEAR ENDED DECEMBER 31, 2016
第 108 页
XI. RELATED PARTY RELATIONSHIPS AND TRANSACTIONS - continued
5. Related party transactions - continued (4) Financing - continued
(b) Related parties’ deposits at SFC and GMAC - continued
②Interest paid by SFC and GMAC to related parties were as follows:
Unit: RMB Related Party Year Ended December 31, 2016 Year Ended December 31, 2015
JCEs 210,781,478.80 386,081,407.10 Associates 33,019,932.71 48,771,693.06 SAIC 262,008,115.24 235,026,779.90 Subsidiaries of SAIC 7,266,072.97 6,297,037.40 Associates of SAIC 12,881.11 75,403.89 Total 513,088,480.83 676,252,321.35
Interest rates for deposits from related parties at SFC is determined according to interest rates specified by the People’s Bank of China. (c) Loans offered by the Group (except SFC) to related parties
①Movement of entrusted loans provided by the Group to related parties is as follows:
Unit: RMB JCEs Associates Total
December 31, 2015 592,500,000.00 109,500,000.00 702,000,000.00 Loans offered 485,152,541.99 121,500,000.00 606,652,541.99 Decrease due to changes in consolidation scope for the year (339,952,541.99) - (339,952,541.99)
Repayments collected (395,000,000.00) (137,000,000.00) (532,000,000.00) December 31, 2016 342,700,000.00 94,000,000.00 436,700,000.00
②Balance of entrusted loans provided by the Group to related parties is as follows:
Unit: RMB Related Party December 31, 2016 December 31, 2015
JCEs - short-term loans 180,200,000.00 380,000,000.00 Associates - short-term loans 94,000,000.00 109,500,000.00 JCEs - long-term loans 162,500,000.00 212,500,000.00 Total 436,700,000.00 702,000,000.00
③Interests received by the Group from related parties are as follows:
Unit: RMB Related Party Year Ended December 31, 2016 Year Ended December 31, 2015
JCEs 21,880,395.39 36,280,764.57 Associates 4,764,946.35 4,002,159.46 Total 26,645,341.74 40,282,924.03
Interest rates for entrusted loans to related parties from the Group are determined according to contract agreements.

SAIC MOTOR CORPORATION LIMITED NOTES TO THE FINANCIAL STATEMENTS YEAR ENDED DECEMBER 31, 2016
第 109 页
XI. RELATED PARTY RELATIONSHIPS AND TRANSACTIONS - continued
5. Related party transactions - continued (4) Financing - continued (d) Entrusted business of SFC
①Entrust business between SFC and related parties (see Note (VI) 63) is disclosed off balance sheet. SFC
received bank charges based on agreements. The bank charges received by SFC from related parties are as follows:
Unit: RMB Related Party Year Ended December 31, 2016 Year Ended December 31, 2015
JCEs 770,570.90 863,415.00 Associates 300,405.00 549,867.10 Total 1,070,975.90 1,413,282.10 ②At the end and the beginning of the year, balance of entrusted business between SFC and related parties are as
follows: Unit: RMB
Entrusting parties Entrusted deposit December 31, 2016 Targets Entrusted loans
December 31, 2016 JCEs 476,000,000.00 JCEs 476,000,000.00 Associates 117,000,000.00 Associates 117,000,000.00 SAIC 20,000,000.00 SAIC 20,000,000.00 Total 613,000,000.00 Total 613,000,000.00
Unit: RMB
Entrusting parties Entrusted deposit December 31, 2015 Targets Entrusted loans
December 31, 2015 JCEs 242,000,000.00 JCEs 242,000,000.00 Associates 144,000,000.00 Associates 144,000,000.00 SAIC 20,000,000.00 SAIC 20,000,000.00 Total 406,000,000.00 Total 406,000,000.00
(5) Guarantees
See Note (XII) 3 for guarantees provided by the Group to related parties.

SAIC MOTOR CORPORATION LIMITED NOTES TO THE FINANCIAL STATEMENTS YEAR ENDED DECEMBER 31, 2016
第 110 页
XI. RELATED PARTY RELATIONSHIPS AND TRANSACTIONS - continued
5. Related party transactions - continued
(6) Remuneration for key management personnel Unit: RMB
Related Party Year Ended December 31, 2016
Year Ended December 31, 2015
Remuneration for key management personnel 13,882,900.00 27,551,500.00
6. Amounts due from/to related parties
(1) Notes receivable Unit: RMB
Related party December 31, 2016 December 31, 2015 JCEs 126,722,000.00 233,969,053.97 Associates - 500,000.00 Total 126,722,000.00 234,469,053.97
(2) Accounts receivable
Unit: RMB Related party December 31, 2016 December 31, 2015
JCEs 12,210,236,716.01 11,244,488,774.17 Associates 1,763,865,098.40 1,389,941,189.51 Subsidiaries of SAIC 3,625,449.67 7,108,156.44 Total 13,977,727,264.08 12,641,538,120.12
(3) Prepayments
Unit: RMB Related party December 31, 2016 December 31, 2015
JCEs 15,562,129,489.95 9,228,641,632.21 Associates 21,363,324.71 56,792,847.62 Total 15,583,492,814.66 9,285,434,479.83
(4) Dividends receivable
Unit: RMB Related party December 31, 2016 December 31, 2015
JCEs 1,456,101,750.12 1,512,344,555.68 Associates 160,904,835.18 85,512,459.59 Total 1,617,006,585.30 1,597,857,015.27
(5) Other receivables
Unit: RMB Related party December 31, 2016 December 31, 2015
JCEs 428,475,124.02 27,131,736.15 Associates 524,028.40 5,936,500.07 Subsidiaries of SAIC 330,350.00 325,000.00 Total 429,329,502.42 33,393,236.22

SAIC MOTOR CORPORATION LIMITED NOTES TO THE FINANCIAL STATEMENTS YEAR ENDED DECEMBER 31, 2016
第 111 页
XI. RELATED PARTY RELATIONSHIPS AND TRANSACTIONS - continued
6. Amounts due from/to related parties - continued
(6) Notes payable Unit: RMB
Related party December 31, 2016 December 31, 2015 JCEs 71,499,346.98 126,385,514.25 Associates 84,160,000.00 42,770,000.00 Total 155,659,346.98 169,155,514.25
(7) Accounts payable
Unit: RMB Related party December 31, 2016 December 31, 2015
JCEs 8,863,721,950.50 15,844,545,276.29 Associates 1,028,136,529.82 808,154,839.93 Subsidiaries of SAIC 19,419,210.54 48,955,705.84 Associates of SAIC 21,199,237.58 9,994,334.44 Total 9,932,476,928.44 16,711,650,156.50
(8) Receipts in advance
Unit: RMB Related party December 31, 2016 December 31, 2015
JCEs 183,952,339.52 93,443,608.31 Associates - 187,931.54 SAIC 1,053,305,821.73 1,189,525,008.63 Total 1,237,258,161.25 1,283,156,548.48
(9) Other payables
Unit: RMB Related party December 31, 2016 December 31, 2015
JCEs 495,138,380.85 34,245,984.43 Associates 1,104,595.00 10,031,930.20 Subsidiaries of SAIC 1,000,000.00 78,860.00 Associates of SAIC 420,350.00 420,350.00 Total 497,663,325.85 44,777,124.63
XII. COMMITMENTS 1. Capital commitments
Unit: RMB’000 Consolidated December 31, 2016 December 31, 2015
Capital commitments that have been signed but have not been recognized in the financial statements:
- Commitment for acquisition of long-term assets 5,128,389 6,442,803 - External investment commitment 149,902 170,000 Total 5,278,291 6,612,803

SAIC MOTOR CORPORATION LIMITED NOTES TO THE FINANCIAL STATEMENTS YEAR ENDED DECEMBER 31, 2016
第 112 页
XII. COMMITMENTS - continued 2. Operating lease commitments
At the balance sheet date, the Group has the following commitments in respect of non-cancellable operating leases:
Unit: RMB’000 Consolidated
December 31, 2016
December 31, 2015
Minimum lease payments under non-cancellable operating lease: 1st year subsequent to the balance sheet date 1,265,906 714,062 2nd year subsequent to the balance sheet date 968,545 532,331 3rd year subsequent to the balance sheet date 870,598 452,154 Subsequent years 6,080,809 1,987,666 Total 9,185,858 3,686,213
3. Contingencies
At the year-end, guarantees provided by the Group to external entities are as follows:
Guarantor Guarantee Relationship
with the Group Category Currency Ceiling amount Debt amount
The Company (Note 1) SAIC Motor-CP Co., Ltd. Subsidiary General guarantee THB 3,570,000,000.00 2,300,539,836.77
HASCO (Note 2) HASCO-CP Co., Ltd. Subsidiary Maximum guarantee THB 229,500,000.00 30,600,000.00
HASCO KS HUAYU AluTech GmbH JCE Letter of guarantee EUR 10,000,000.00 10,000,000.00
HASCO, Donghua (Note 3) Hua Dong Teksid Automotive Foundry Co., Ltd. JCE Joint and several
liability guarantee USD 5,775,000.00 1,873,904.68
Note1: Shareholders of SAIC Motor - CP Co., Ltd. provided maximum guarantee for its loans, in which the
Company provided 51% of the maximum guarantee amount of 3,570,000,000.00 at its shareholding ratio. At the year-end, the actual amount of loans of the Company is THB 2,300,539,836.77 (equivalent to RMB 446,074,674.35).
Note2: Shareholders of HASCO - CP Co., Ltd. provided maximum guarantee for its loans, in which HASCO
provided 51% of the maximum guarantee amount of THB 229,500,000.00 at its shareholding ratio. At the year-end, the actual amount of loans of HASCO - CP Co., Ltd. is THB 30,600,000.00.
Note 3: These loans were jointly guaranteed by HASCO and Donghua jointly and severally.
XIII. EVENTS AFTER THE BALANCE SHEET DATE 1. Refer to Note (VI) 48 for more details on profit distribution after balance sheet date.
2. The Group's non-public issuance of A shares Proposal concerning the Company's non-public issuance of A shares was approved in the 4th meeting of the Board held on November 5, 2015 and the 1st
extraordinary general meeting in 2015 and authorized by Shanghai State-owned Assets Supervision and Administration Commission with "Reply to SAIC Motor Corporation Limited's non-public issuance of A shares " (Hu Guo Zi Wei Chan Quan [2015] No.484) and China Securities Regulatory Commission with “Approval of the Non-public Issuance of Shares of SAIC Motor Corporation Limited.” (Zheng Jian Xu Ke [2016] No. 2977), the Company was approved to issue no more than 1,056,338,028 shares (the "Issuance") of non-public issuance of A shares in RMB. The final price of the Issuance is RMB 22.80 per share at par value of RMB 1 per share which were subscribed by cash. As at January 11, 2017, the Company actually issued ordinary shares in RMB (A Share) of 657,894,736shares at the price of RMB 22.80 per share with par value of RMB 1 per share to raise funds of RMB 14,999,999,980.80 in total. After the non-public issuance of A shares, the Company held a total of 11,683,461,365 shares.

SAIC MOTOR CORPORATION LIMITED NOTES TO THE FINANCIAL STATEMENTS YEAR ENDED DECEMBER 31, 2016
第 113 页
XIIII. OTHER SIGNIFICANT EVENTS
1. Segment report
The disclosure of segment report is based on accounting policies. Based on the Group’s internal organization structure, management requirements and internal reporting system, the operations of the Group are classified into two reporting segments, which are “vehicles and parts” and “financing”. The reporting segments are determined based on the Group’s operating structure. The Group’s management periodically evaluates the operating results of these reporting segments to make decisions about resources to be allocated to the segments and assess their performance. Major products and services delivered or provided by each of the reporting segments are vehicles and parts and financing services.
Segment information is disclosed in accordance with the accounting policies and measurement criteria adopted by each segment when reporting to management.
(1) Segment information
Unit: RMB
Vehicles and parts Finance Elimination Total
Year Ended December 31, 2016
Year Ended December 31, 2015
Year Ended December 31, 2016
Year Ended December 31, 2015
Year Ended December 31, 2016
Year Ended December 31, 2015
Year Ended December 31, 2016
Year Ended December 31, 2015
Total operating income External revenue 746,191,099,847.84 661,349,150,643.18 10,225,065,217.45 9,099,072,496.16 - - 756,416,165,065.29 670,448,223,139.34 Inter-segment revenue - - 1,406,197,252.83 1,404,458,052.30 (1,406,197,252.83) (1,404,458,052.30) - - Total segment operating income 746,191,099,847.84 661,349,150,643.18 11,631,262,470.28 10,503,530,548.46 (1,406,197,252.83) (1,404,458,052.30) 756,416,165,065.29 670,448,223,139.34
Operating costs and expenses 731,502,851,456.63 650,251,596,056.32 8,064,717,642.65 7,641,467,146.79 (1,003,896,074.03) (1,639,494,809.84) 738,563,673,025.25 656,253,568,393.27 Add: Gain(loss)from changes
in fair value 7,484,671.00 (34,699,211.00) (17,508,139.92) (250,817,659.56) - - (10,023,468.92) (285,516,870.56)
Investment income 28,386,728,893.32 27,207,309,315.87 2,185,534,397.75 2,455,825,105.10 - - 30,572,263,291.07 29,663,134,420.97 Exchange gain(loss) - - 18,271,097.34 15,758,109.29 - - 18,271,097.34 15,758,109.29 Profit (loss) 43,082,461,955.53 38,270,164,691.73 5,752,842,182.80 5,082,828,956.50 (402,301,178.80) 235,036,757.54 48,433,002,959.53 43,588,030,405.77 Add: Non-operating income 3,049,265,443.25 3,453,186,765.57 264,499,737.81 213,476,451.36 - - 3,313,765,181.06 3,666,663,216.93 Less: Non-operating expense 1,252,509,227.83 1,444,254,028.28 1,801,450.22 763,108.16 - - 1,254,310,678.05 1,445,017,136.44 Total profit 44,879,218,170.95 40,279,097,429.02 6,015,540,470.39 5,295,542,299.70 (402,301,178.80) 235,036,757.54 50,492,457,462.54 45,809,676,486.26 Less: Income tax expense 5,211,163,710.60 4,616,232,659.97 1,319,332,053.60 1,119,474,603.05 - - 6,530,495,764.20 5,735,707,263.02 Net profit 39,668,054,460.35 35,662,864,769.05 4,696,208,416.79 4,176,067,696.65 (402,301,178.80) 235,036,757.54 43,961,961,698.34 40,073,969,223.24

SAIC MOTOR CORPORATION LIMITED NOTES TO THE FINANCIAL STATEMENTS YEAR ENDED DECEMBER 31, 2016
第 114 页
XIIII. OTHER SIGNIFICANT EVENTS - continued
1. Segment report - continued
(1) Segment information - continued
Unit: RMB Vehicles and parts Finance Elimination Total
2016 2015 2016 2015 2016 2015 2016 2015 Total assets by segment 462,309,760,678.50 416,601,459,526.01 221,713,413,526.49 181,307,270,281.66 (93,395,036,680.94) (84,952,771,691.89) 590,628,137,524.05 512,955,958,115.78 Total liabilities by segment 263,858,460,937.67 228,062,255,403.36 185,397,469,473.72 155,834,719,910.29 (93,724,166,891.10) (81,858,302,918.08) 355,531,763,520.29 302,038,672,395.57 Additional information: Depreciation and amortization 7,863,717,655.42 6,213,756,095.82 35,617,052.77 29,948,943.35 - - 7,899,334,708.19 6,243,705,039.17 Impairment loss recognized in current year 1,668,851,317.45 1,787,979,310.73 1,341,136,858.48 1,176,280,006.38 199,483,229.68 (116,086,848.58) 3,209,471,405.61 2,848,172,468.53
Capital expenditure 17,235,897,227.41 15,394,016,717.16 30,619,747.88 32,887,142.78 - - 17,266,516,975.29 15,426,903,859.94 Including: Expenditure used in
construction in progress 15,301,850,146.19 12,769,706,880.45 1,589,358.03 - - - 15,303,439,504.22 12,769,706,880.45
Expenditure used in purchase of fixed assets 787,048,680.29 620,210,505.87 19,066,427.34 15,515,903.94 - - 806,115,107.63 635,726,409.81
Expenditure used in purchase of intangible assets 456,998,310.17 1,748,984,591.69 9,963,962.51 17,371,238.84 - - 466,962,272.68 1,766,355,830.53
Expenditure used in long-term deferred expenses 690,000,090.76 255,114,739.15 - - - - 690,000,090.76 255,114,739.15
Expenditure used in investment properties - - - - - - - -
(2) The Group's revenue derived from other countries is insignificant and the Group's assets located in other countries are insignificant.

SAIC MOTOR CORPORATION LIMITED NOTES TO THE FINANCIAL STATEMENTS YEAR ENDED DECEMBER 31, 2016
第 115 页
XV. NOTES TO KEY ITEMS IN THE COMPANY’S FINANCIAL STATEMENTS
1. Notes receivable
Unit: RMB Item December 31, 2016 December 31, 2015
Bank acceptances 2,319,351,064.00 1,146,775,037.00 Commercial acceptances 44,049,748.00 918,080,419.00 Total 2,363,400,812.00 2,064,855,456.00
2. Accounts receivable
Disclosure of accounts receivable by categories:
Unit: RMB Item
December 31, 2016 December 31, 2015 Book balance Bad debt provision Book value Book balance Bad debt provision Book value
Amount % Amount % Amount % Amount % Receivables for individually significant items and with individual provision for bad debts
- - - - - - - - - -
Receivables with provisions that were assessed by credit risk characteristics 823,392,904.40 100.00 - - 823,392,904.40 838,938,654.90 100.00 - - 838,938,654.90
Receivables for individually non-significant items but individual provision for bad debts
- - - - - - - - - -
Total 823,392,904.40 100.00 - - 823,392,904.40 838,938,654.90 100.00 - - 838,938,654.90
Aging analysis of accounts receivable is as follows:
Unit: RMB
Aging December 31, 2016 Accounts receivable Proportion (%) Bad debt provision Proportion (%)
Within 1 year 511,951,925.94 62.18 - - 1-2 years 281,449,677.58 34.18 - - 2-3 years 29,991,300.88 3.64 - - Total 823,392,904.40 100.00 - -
3. Other receivables
Disclosure of other receivables by categories:
Unit: RMB Item
December 31, 2016 December 31, 2015 Book balance Bad debt provision Book value Book balance Bad debt provision Book value Amount % Amount % Amount % Amount %
Receivables for individually significant items and with individual provision for bad debts
- - - - - - - - - -
Receivables with provisions that were assessed by credit risk characteristics 1,309,158,264.18 100.00 - - 1,309,158,264.18 1,123,787,791.35 100.00 - - 1,123,787,791.35
Receivables for individually non-significant items but individual provision for bad debts
- - - - - - - - - -
Total 1,309,158,264.18 100.00 - - 1,309,158,264.18 1,123,787,791.35 100.00 - - 1,123,787,791.35
Aging analysis of other receivables is as follows:
Unit: RMB
Aging December 31, 2016 Other receivables Proportion (%) Bad debt provision Proportion (%)
Within 1 year 1,281,749,998.36 97.91 - - 1-2 years 24,880,110.00 1.90 - - 2-3 years 2,415,655.82 0.18 - - Over 3 years 112,500.00 0.01 - - Total 1,309,158,264.18 100.00 - -

SAIC MOTOR CORPORATION LIMITED NOTES TO THE FINANCIAL STATEMENTS YEAR ENDED DECEMBER 31, 2016
第 116 页
XV. NOTES TO KEY ITEMS IN THE COMPANY’S FINANCIAL STATEMENTS - continued
4. Inventories
(1) Categories of inventories Unit: RMB
Item December 31, 2016 December 31, 2015 Book balance Provision Book value Book balance Provision Book value
Raw materials 646,295,461.85 - 646,295,461.85 363,359,810.67 - 363,359,810.67
Work-in- process 16,391,872.78 - 16,391,872.78 8,437,017.04 - 8,437,017.04
Finished goods 1,351,582,249.70 51,238,838.61 1,300,343,411.09 1,482,692,568.63 168,152,372.73 1,314,540,195.90
Total 2,014,269,584.33 51,238,838.61 1,963,030,745.72 1,854,489,396.34 168,152,372.73 1,686,337,023.61
(2) Provision for decline in value of inventories Unit: RMB
Item December 31, 2015 Provision Write-off December 31, 2016 Goods on hand 168,152,372.73 7,199,968.20 124,113,502.32 51,238,838.61
(3) Circumstances of provision for decline in value of inventories
Unit: RMB
Item Basis of provision for decline in value of inventories Reason for reversal of provision
Goods on hand Lower of cost or net realizable value Not applicable
5. Available-for-sale financial assets Unit: RMB
Item December 31, 2016 December 31, 2015 Available-for-sale equity instruments 10,646,215,752.00 7,775,944,851.05 -measured at fair value 10,646,215,752.00 7,775,944,851.05 -measured at cost - - Total 10,646,215,752.00 7,775,944,851.05
6. Long-term equity investments
Details of long-term equity investment are as follows:
Unit: RMB December 31, 2016 December 31, 2015
Investments in subsidiaries 54,594,849,312.15 44,920,418,908.20 Investments in JCEs 40,615,522,957.92 39,881,343,624.22 Investments in associates 2,224,964,039.07 2,245,674,241.45 Total 97,435,336,309.14 87,047,436,773.87

SAIC MOTOR CORPORATION LIMITED NOTES TO THE FINANCIAL STATEMENTS YEAR ENDED DECEMBER 31, 2016
第 117 页
XV. NOTES TO KEY ITEMS IN THE COMPANY’S FINANCIAL STATEMENTS - continued
6. Long-term equity investments - continued
(1) Investments in subsidiaries
Unit: RMB Invested companies December 31, 2015 Increase/Decrease December 31, 2016
SAIC GM Wuling Co., Ltd. 1,126,669,400.01 - 1,126,669,400.01 Shanghai Huizhong Automotive Manufacturing Co., Ltd. (Note 1) 2,866,842,821.53 (2,866,842,821.53) -
SAIC Maxus Vehicle Co., Ltd. (Note 2) 3,209,910,000.00 584,340,000.00 3,794,250,000.00 SAIC Finance Co., Ltd. (Note 3) 3,584,176,933.09 3,000,000,000.00 6,584,176,933.09 SAIC Volkswagen Sales Co., Ltd. 225,339,303.84 - 225,339,303.84 Shanghai PengPu Machine Building Plant Co., Ltd. (Note 4) 655,582,955.01 270,000,000.00 925,582,955.01
DIAS Automotive Electronic Systems Co., Ltd. (Note 5) 90,000,000.00 (90,000,000.00) -
SAIC Motor Transmission Co., Ltd.(Note 6) 3,158,000,000.00 832,529,000.00 3,990,529,000.00 Nanjing Automobile (Group) Corporation 3,423,861,978.39 - 3,423,861,978.39 Shanghai Diesel Engine Co., Ltd. 1,173,419,996.46 - 1,173,419,996.46 SAIC HK Investment Co., Ltd. 67,746,690.00 - 67,746,690.00 SAIC Motor UK Co., Ltd. 46,468,800.00 - 46,468,800.00 SAIC Tangshan Bus Co., Ltd. (Note 5) 86,700,000.00 (86,700,000.00) - SAIC Motor Equity Investment Co., Ltd. 3,300,000,000.00 - 3,300,000,000.00 SAIC General Motors Sales Co., Ltd. 158,319,147.00 - 158,319,147.00 HUAYU Automotive Systems Co., Ltd. (Note 1) 9,956,431,904.22 2,922,286,568.66 12,878,718,472.88 SAIC Motor(Beijing) Co., Ltd. 316,317,252.11 - 316,317,252.11 Shanghai Automobile Asset Management Co., Ltd (Note 7) 672,425,316.32 200,000,000.00 872,425,316.32
Shanghai Chexiang Automotive Accessary Technology Service Co., Ltd. (Note8) 35,103,538.99 (35,103,538.99) -
SAIC General Motors Sales Co., Ltd. 1,627,026,218.48 - 1,627,026,218.48 Shanghai Automotive Industry Sales Co., Ltd (Note 8) 3,437,264,296.95 335,103,538.99 3,772,367,835.94
SAIC HK Limited 590,973,200.76 - 590,973,200.76 SAIC Motor North America Co., Ltd. 172,336,204.50 - 172,336,204.50 Anji Automotive Logistics Co., Ltd. (Note 9) 2,161,316,583.21 (43,226,331.66) 2,118,090,251.55 Donghua Automobile Industrial Co., Ltd. 654,940,453.36 - 654,940,453.36 Shanghai Shangyuan Investment Management Co., Ltd. 115,167,221.39 - 115,167,221.39
China Automotive Industrial Development Co., Ltd. 274,872,910.12 - 274,872,910.12
SAIC Motor Activity Centre Co., Ltd. 163,314,188.68 - 163,314,188.68 Shanghai Automotive News Press Co., Ltd. 9,891,593.78 - 9,891,593.78 Shanghai Jineng Bus Drive System Co., Ltd. (Note 10) 60,000,000.00 39,908,080.00 99,908,080.00
SAIC investment management Co., Ltd. (Note 5) 500,000,000.00 1,197,814,220.78 1,697,814,220.78 Shanghai Shanghong Real Estate Co., Ltd. (Note 11) 1,000,000,000.00 900,000,000.00 1,900,000,000.00
Shanghai Sunwin Bus Co., Ltd.(Note12) - 422,301,294.40 422,301,294.40 SAIC Group Financial Holding Management Co., Ltd. (Note12) - 1,500,000,000.00 1,500,000,000.00
SAIC-IVECO Hongyan Commercial Vehicle Co., Ltd.(Note12) - 592,020,393.30 592,020,393.30
Total 44,920,418,908.20 9,674,430,403.95 54,594,849,312.15

SAIC MOTOR CORPORATION LIMITED NOTES TO THE FINANCIAL STATEMENTS YEAR ENDED DECEMBER 31, 2016
第 118 页
XV. NOTES TO KEY ITEMS IN THE COMPANY’S FINANCIAL STATEMENTS - continued
6. Long-term equity investments - continued
(2) JCEs Unit: RMB
Invested companies December 31, 2015 Increase/Decrease December 31, 2016 SAIC Volkswagen automotive Co., Ltd. 20,426,731,263.83 608,334,038.49 21,035,065,302.32 SAIC General Motors Co., Ltd. 15,959,838,450.62 (94,735,858.31) 15,865,102,592.31 Shanghai GM Dong Yue Motors Co., Ltd. 569,623,625.35 33,367,430.19 602,991,055.54 Shanghai GM Dong Yue Automotive Powertrain Co., Ltd. 1,588,050,079.37 (32,980,939.40) 1,555,069,139.97
Shanghai GM (Shenyang) Norsom Motors Co., Ltd. 700,996,754.53 (46,924,844.20) 654,071,910.33
Pan-Asia Technical Automotive Centre 592,237,413.62 72,909,694.00 665,147,107.62 SAIC Iveco Commercial Vehicle Investment Co., Ltd. - 238,075,849.83 238,075,849.83
Shanghai Jieneng Automotive Technology Co., Ltd. (Note5) 19,997,583.22 (19,997,583.22) -
Shanghai Advanced Traction Battery Systems Co., Ltd. (Note5) 23,868,453.68 (23,868,453.68) -
Total 39,881,343,624.22 734,179,333.70 40,615,522,957.92
(3) Associates Unit: RMB
Invested companies December 31, 2015 Increase/Decrease December 31, 2016 Volkswagen Automotive Powertrain Co., Ltd. 1,919,177,286.87 49,203,526.86 1,968,380,813.73
Volkswagen Transmission (Shanghai) Co., Ltd. 254,876,500.79 1,706,724.55 256,583,225.34
China Automobile Development United Investment Co., Ltd. (Note5) 28,468,778.51 (28,468,778.51) -
Sunrise Power Co., Ltd. (Note5) 43,151,675.28 (43,151,675.28) - Total 2,245,674,241.45 (20,710,202.38) 2,224,964,039.07
Note1: As stated in Note (VIII) 1(1), the Company made additional capital contribution of its 100% of equity
interest in Shanghai Huizhong to HASCO for the year. Note2: During the year, the Company made additional capital contribution of RMB 584,340,000.00 to SAIC
Maxus by cash. Note3: During the year, the Company made additional capital contribution of RMB 3,000,000,000.00 to SFC by
cash, after the capital increase, the investment proportion of the Company in SFC was increased from 98.59% to 99.00%.
Note4: During the year, the Company made additional capital contribution of RMB 270,000,000.00 to Shanghai
PengPu Machine Building Plant Co., Ltd.by cash. Note5: During the year, the Company made additional capital contribution of its 60.00% of equity interest in DIAS
Automotive Electronic Systems Co., Ltd., 51.00% of equity interest in SAIC Tangshan Bus Co., Ltd. and 10% of equity interest in Shanghai Jieneng Automotive Technology Co., Ltd., 51.00% of equity interest in Shanghai Advanced Traction Battery Systems Co., Ltd., 34.19% of equity interest in Sunrise Power Co., Ltd., 20.74% of equity interest in China Automobile Development United Investment Co., Ltd. and RMB 906,000,000.00 in cash to Investment Management.
Note6: During the year, the Company made additional capital contribution of RMB 832,529,000.00 to SAIC Motor
Transmission Co., Ltd. by cash.
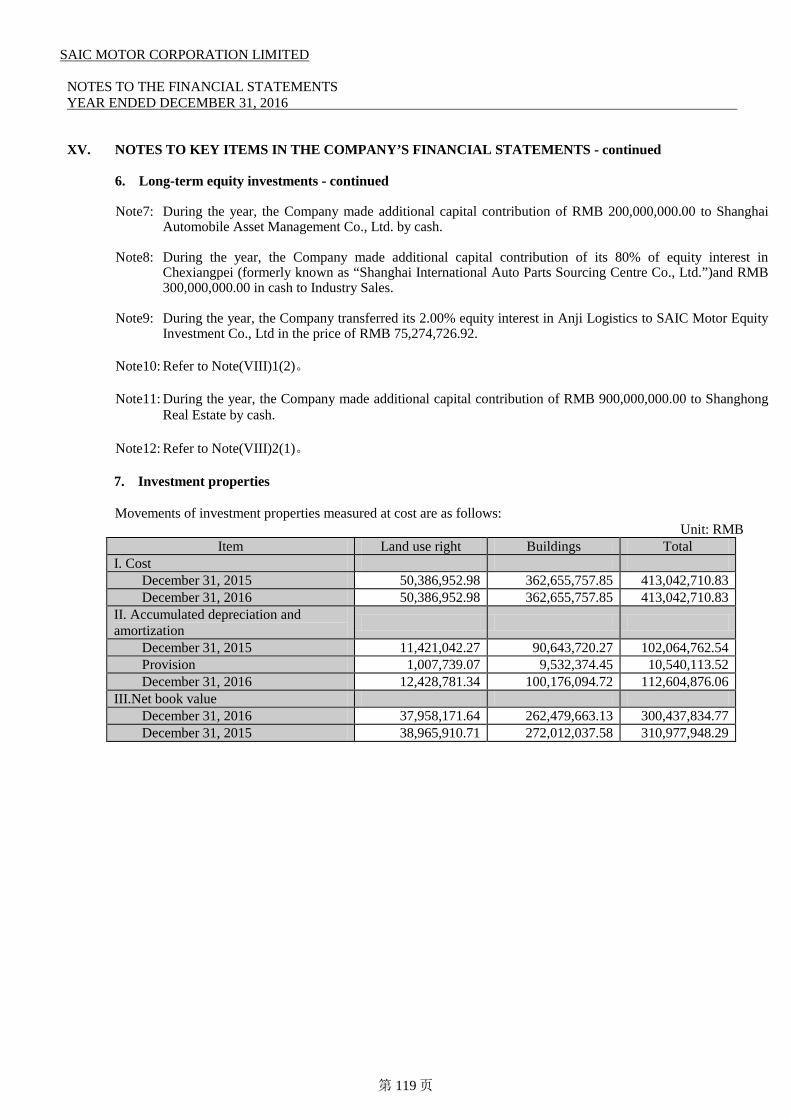
SAIC MOTOR CORPORATION LIMITED NOTES TO THE FINANCIAL STATEMENTS YEAR ENDED DECEMBER 31, 2016
第 119 页
XV. NOTES TO KEY ITEMS IN THE COMPANY’S FINANCIAL STATEMENTS - continued 6. Long-term equity investments - continued Note7: During the year, the Company made additional capital contribution of RMB 200,000,000.00 to Shanghai
Automobile Asset Management Co., Ltd. by cash. Note8: During the year, the Company made additional capital contribution of its 80% of equity interest in
Chexiangpei (formerly known as “Shanghai International Auto Parts Sourcing Centre Co., Ltd.”)and RMB 300,000,000.00 in cash to Industry Sales.
Note9: During the year, the Company transferred its 2.00% equity interest in Anji Logistics to SAIC Motor Equity
Investment Co., Ltd in the price of RMB 75,274,726.92. Note10: Refer to Note(VIII)1(2)。 Note11: During the year, the Company made additional capital contribution of RMB 900,000,000.00 to Shanghong
Real Estate by cash. Note12: Refer to Note(VIII)2(1)。
7. Investment properties
Movements of investment properties measured at cost are as follows:
Unit: RMB Item Land use right Buildings Total
I. Cost December 31, 2015 50,386,952.98 362,655,757.85 413,042,710.83 December 31, 2016 50,386,952.98 362,655,757.85 413,042,710.83 II. Accumulated depreciation and amortization
December 31, 2015 11,421,042.27 90,643,720.27 102,064,762.54 Provision 1,007,739.07 9,532,374.45 10,540,113.52 December 31, 2016 12,428,781.34 100,176,094.72 112,604,876.06 III.Net book value December 31, 2016 37,958,171.64 262,479,663.13 300,437,834.77 December 31, 2015 38,965,910.71 272,012,037.58 310,977,948.29

SAIC MOTOR CORPORATION LIMITED NOTES TO THE FINANCIAL STATEMENTS YEAR ENDED DECEMBER 31, 2016
第 120 页
XV. NOTES TO KEY ITEMS IN THE COMPANY’S FINANCIAL STATEMENTS - continued
8. Fixed assets
(1) General Unit: RMB
Item Buildings Machinery and equipment
Electronic equipment,
furniture and fixtures
Transportation vehicles Mold Total
I. Cost December 31, 2015 2,774,147,772.22 5,005,417,505.82 612,153,482.24 67,804,496.92 2,374,705,540.01 10,834,228,797.21 Purchase during the year - 153,097.26 327,646.15 - - 480,743.41
Transfer from construction in progress during the year
216,734,202.85 594,551,377.60 110,033,806.86 13,254,194.91 492,500,887.57 1,427,074,469.79
Disposals during the year 2,593,847.38 10,186,636.72 3,682,750.25 1,581,821.37 - 18,045,055.72
December 31, 2016 2,988,288,127.69 5,589,935,343.96 718,832,185.00 79,476,870.46 2,867,206,427.58 12,243,738,954.69 II. Accumulated depreciation December 31, 2015 570,194,731.55 1,668,103,733.71 346,931,285.71 35,442,215.18 755,571,382.95 3,376,243,349.10 Provision during the year 110,267,852.70 288,710,942.24 68,959,085.17 9,071,741.84 85,519,579.90 562,529,201.85
Disposals during the year 2,464,155.01 8,375,342.27 3,000,955.08 1,470,668.25 - 15,311,120.61
December 31, 2016 677,998,429.24 1,948,439,333.68 412,889,415.80 43,043,288.77 841,090,962.85 3,923,461,430.34 III. Impairment December 31, 2015 - 1,952,083,201.45 - 97,478.08 1,514,656,722.32 3,466,837,401.85 Provision during the year - - - - 238,809,809.21 238,809,809.21
Disposals during the year - 566,649.43 - - - 566,649.43
December 31, 2016 - 1,951,516,552.02 - 97,478.08 1,753,466,531.53 3,705,080,561.63 IV. Net book value December 31, 2016 2,310,289,698.45 1,689,979,458.26 305,942,769.20 36,336,103.61 272,648,933.20 4,615,196,962.72 December 31, 2015 2,203,953,040.67 1,385,230,570.66 265,222,196.53 32,264,803.66 104,477,434.74 3,991,148,046.26
(2) Details of the certificates of title of fixed assets that were not obtained are as follows:
Unit: RMB Item Book value Reasons for not obtaining certificates of title
Buildings 1,932,017,599.02 In progress
9. Construction in progress Unit: RMB
Item December 31, 2015
Increase during the year
Transfer to fixed assets upon completion
Transfer to intangible assets
Transfer to long-term prepaid
expenses
December 31, 2016
Project of passenger vehicles of self-owned brands
235,490,387.31 801,532,212.53 894,225,716.42 5,456,215.79 - 137,340,667.63
Project of R&D centre expansion 430,488,863.55 299,991,216.05 458,803,492.49 23,690,984.50 - 247,985,602.61
Others 98,054,910.06 192,390,729.90 74,045,260.88 17,371,318.11 72,812,803.48 126,216,257.49 Total 764,034,160.92 1,293,914,158.48 1,427,074,469.79 46,518,518.40 72,812,803.48 511,542,527.73

SAIC MOTOR CORPORATION LIMITED NOTES TO THE FINANCIAL STATEMENTS YEAR ENDED DECEMBER 31, 2016
第 121 页
XV. NOTES TO KEY ITEMS IN THE COMPANY’S FINANCIAL STATEMENTS - continued
10. Intangible assets and development expenditure
(1) General Unit: RMB
Item Land use right Patent Know-how software use right Trademark right Total
I. Cost December 31, 2015 1,316,702,229.71 1,025,962,252.05 2,344,710,403.83 530,495,088.86 11,533,962.26 5,229,403,936.71 Purchase during the year - - - 302,837.43 - 302,837.43 Transfer from construction in progress during the year
94,339.62 - - 46,424,178.78 - 46,518,518.40
Disposal and retirement - - - 605,101.72 - 605,101.72 December 31, 2016 1,316,796,569.33 1,025,962,252.05 2,344,710,403.83 576,617,003.35 11,533,962.26 5,275,620,190.82 II. Accumulated amortization
December 31, 2015 182,182,335.98 944,712,252.05 1,633,503,071.04 275,230,260.17 2,591,972.67 3,038,219,891.91 Amortization during the year 26,315,500.90 - 666,666.73 59,978,357.31 1,181,332.75 88,141,857.69
Disposal and retirement - - - 23,475.24 - 23,475.24
December 31, 2016 208,497,836.88 944,712,252.05 1,634,169,737.77 335,185,142.24 3,773,305.42 3,126,338,274.36 III. Impairment December 31, 2015 and 2016 - 81,250,000.00 710,540,666.06 - - 791,790,666.06
IV. Net book value December 31, 2016 1,108,298,732.45 - - 241,431,861.11 7,760,656.84 1,357,491,250.40 December 31, 2015 1,134,519,893.73 - 666,666.73 255,264,828.69 8,941,989.59 1,399,393,378.74
(2) Land use right of which certificates of title have not been obtained
Unit: RMB
Item Book value Reason for not obtaining certificates of title
Land use right 167,254,061.79 In progress
(3) Details of development expenditures Unit: RMB
Item December 31, 2015
Occurred during the year
Recognized in profit and loss
December 31, 2016
Research expenditures - 1,240,123,494.37 1,240,123,494.37 - Development expenditures - 3,614,385,425.82 3,614,385,425.82 - Total - 4,854,508,920.19 4,854,508,920.19 -
Development expenditures accounts for 74.45% of total research and development expenditures.

SAIC MOTOR CORPORATION LIMITED NOTES TO THE FINANCIAL STATEMENTS YEAR ENDED DECEMBER 31, 2016
第 122 页
XV. NOTES TO KEY ITEMS IN THE COMPANY’S FINANCIAL STATEMENTS - continued
11. Employee benefits payable
(1) Details of employee benefits payable are as follows: Unit: RMB
Item December 31, 2016 December 31, 2015 Short-term employee benefits 2,526,191,281.11 2,036,723,433.58
(2) Details of short-term employee benefits are as follows:
Unit: RMB Item December 31, 2016 December 31, 2015
Payroll, bonus, allowance and compensation 2,279,080,106.63 1,788,456,359.34 Social security contributions 21,554,106.87 12,547,105.89 Housing funds 137,110.00 83,789.00 Trade union fund and employee education fund 225,419,957.61 235,636,179.35 Total 2,526,191,281.11 2,036,723,433.58
12. Non-current liabilities due within one year
Unit: RMB Item December 31, 2016 December 31, 2015
Provisions due within one year (Note (XV) 15) 569,797,570.00 249,019,844.71
13. Long-term employee benefits payable
(1) Details of long-term employee benefits payable Unit: RMB
Item December 31, 2016 December 31, 2015 Post-employment benefit-defined benefit plan net indebtedness 2,761,333,540.00 2,365,672,215.12 Termination benefits 968,050,310.39 974,265,650.57 Total 3,729,383,850.39 3,339,937,865.69
(2) Details of defined benefit plan
Present value of obligation in defined benefit plans:
Unit: RMB Item December 31, 2016 December 31, 2015
December 31, 2015 2,365,672,215.12 2,170,181,223.98 Cost of defined benefit plan recognized in profit or loss 92,896,149.32 112,726,294.05 1. Past service cost 5,018,814.88 21,394,139.45 2. Net value of interests 87,877,334.44 91,332,154.60 Cost of defined benefit plan recognized in other comprehensive income 334,724,093.58 113,665,129.31
1. Actuarial losses 334,724,093.58 113,665,129.31 Including: benefits paid (31,958,918.02) (30,900,432.22) December 31, 2016 2,761,333,540.00 2,365,672,215.12

SAIC MOTOR CORPORATION LIMITED NOTES TO THE FINANCIAL STATEMENTS YEAR ENDED DECEMBER 31, 2016
第 123 页
XV. NOTES TO KEY ITEMS IN THE COMPANY’S FINANCIAL STATEMENTS - continued
14. Special payables Unit: RMB
Item December 31, 2016 December 31, 2015 Special reward fund 822,960,091.72 863,767,352.72
15. Provisions
Unit: RMB Item December 31, 2016 December 31, 2015
Products quality warranty 1,317,279,557.66 942,635,333.43 Others 594,845,523.30 544,783,636.99 Sub-total 1,912,125,080.96 1,487,418,970.42 Less: Provisions due within one year (Note (XV)12) 569,797,570.00 249,019,844.71 Provisions due after one year 1,342,327,510.96 1,238,399,125.71
16. Deferred income
Unit: RMB Item December 31, 2016 December 31, 2015
Government grants 527,301,786.46 486,400,776.62
17. Deferred tax liabilities Unit: RMB
Item
December 31, 2016 December 31, 2015
Taxable temporary differences
Differed tax liabilities
Taxable temporary differences
Differed tax liabilities
Changes in fair value of available-for-sale financial assets 2,682,119,841.63 402,317,976.24 2,809,848,940.68 421,477,341.10
18. Capital reserve
Unit: RMB
Item Closing and opening balance
Year 2016 Share premium 50,170,949,359.63 Including: Capital contributed by investors 49,991,450,022.24
Differences arising from business combination involving enterprises under common control 179,499,337.39
Other capital reserves 753,543,097.35 Total 50,924,492,456.98 Year 2015 Share premium 50,170,949,359.63 Including: Capital contributed by investors 49,991,450,022.24
Differences arising from business combination involving enterprises under common control 179,499,337.39
Other capital reserves 753,543,097.35 Total 50,924,492,456.98

SAIC MOTOR CORPORATION LIMITED NOTES TO THE FINANCIAL STATEMENTS YEAR ENDED DECEMBER 31, 2016
第 124 页
XV. NOTES TO KEY ITEMS IN THE COMPANY’S FINANCIAL STATEMENTS - continued
19. Other comprehensive income Unit: RMB
Item December 31, 2015
Year ended December 31, 2016
December 31, 2016 Increase before income tax
Less: Net amount included in other comprehensive
income in the prior periods that is
transferred to profit or loss for the period
Less: Income tax Total
I. Other comprehensive income that will not be reclassified subsequently to profit or loss 878,873,080.89 (334,724,093.58) - - (334,724,093.58) 544,148,987.31
Including : Changes in net liabilities or net assets due to remeasurement of defined benefit plans
878,873,080.89 (334,724,093.58) - - (334,724,093.58) 544,148,987.31
II. Other comprehensive income that may be reclassified subsequently to profit or loss 2,316,480,672.38 (52,296,253.03) - 19,159,364.86 (33,136,888.17) 2,283,343,784.21
Including :Shares of other comprehensive income that may be reclassified subsequently to profit or loss of invested entities under equity method in future
(71,890,927.20) 75,432,846.02 - - 75,432,846.02 3,541,918.82
Changes in fair value of available-for-sale financial assets 2,388,371,599.58 (127,729,099.05) - 19,159,364.86 (108,569,734.19) 2,279,801,865.39
Total 3,195,353,753.27 (387,020,346.61) - 19,159,364.86 (367,860,981.75) 2,827,492,771.52
20. Operating income/costs
(1) Operating income
Unit: RMB
Item Year Ended December 31, 2016 Year Ended December 31, 2015 Operating income Operating costs Operating income Operating costs
Primary operations 31,713,914,983.91 26,624,132,956.28 15,457,407,123.75 14,542,684,301.40 Other operations 1,810,067,044.31 1,283,888,253.72 1,550,062,196.66 1,095,975,755.38 Total 33,523,982,028.22 27,908,021,210.00 17,007,469,320.41 15,638,660,056.78
(2) Primary operations
Unit: RMB
Item Year Ended December 31, 2016 Year Ended December 31, 2015 Operating income Operating costs Operating income Operating costs
Primary operations 29,259,203,299.34 24,629,568,790.50 13,451,799,423.75 12,853,938,587.57 Other operations 2,454,711,684.57 1,994,564,165.78 2,005,607,700.00 1,688,745,713.83 Total 31,713,914,983.91 26,624,132,956.28 15,457,407,123.75 14,542,684,301.40
(3) Other operations
Unit: RMB
Item Year Ended December 31, 2016 Year Ended December 31, 2015 Operating income Operating costs Operating income Operating costs
Rendering services 798,040,284.27 751,353,211.99 734,970,105.36 653,240,914.17 Sales of raw materials 460,263,385.12 460,001,157.25 408,094,509.28 382,513,654.86 Royalties and transfer of technology 436,175,022.64 - 290,239,284.86 -
Rental 51,758,129.81 17,341,383.70 50,246,069.51 17,929,514.69 Others 63,830,222.47 55,192,500.78 66,512,227.65 42,291,671.66 Total 1,810,067,044.31 1,283,888,253.72 1,550,062,196.66 1,095,975,755.38

SAIC MOTOR CORPORATION LIMITED NOTES TO THE FINANCIAL STATEMENTS YEAR ENDED DECEMBER 31, 2016
第 125 页
XV. NOTES TO KEY ITEMS IN THE COMPANY’S FINANCIAL STATEMENTS - continued
21. Impairment losses of assets Unit: RMB
Item Year Ended December 31, 2016
Year Ended December 31, 2015
Decline in value of inventories 7,199,968.20 146,577,167.04 Impairment on fixed assets 238,809,809.21 973,925,866.64 Total 246,009,777.41 1,120,503,033.68
22. Investment income
Unit: RMB
Item Year Ended December 31, 2016
Year Ended December 31, 2015
Dividends received from subsidiaries 8,919,940,938.58 8,551,586,300.46 Long-term equity investment income under equity method 23,047,260,561.14 22,025,085,445.97 Amortization of long-term equity investment difference (319,325.10) (827,623.32) Gain (loss) on disposal of long-term equity investments 87,492,142.39 (34,225,303.03) Entrust loans investment income 93,960,214.64 88,136,636.55 Gain from available-for-sale financial assets 298,180,991.31 304,563,589.46 Total 32,446,515,522.96 30,934,319,046.09
23. Supplementary information to the cash flow statements
Unit: RMB
Supplementary information Year Ended December 31, 2016
Year Ended December 31, 2015
1. Reconciliation of net profits to cash flow from operating activities:
Net profit 27,631,589,141.92 24,460,499,284.78 Add: Provision for impairment loss of assets 246,009,777.41 1,120,503,033.68
Depreciation of fixed assets 562,529,201.85 440,487,936.86 Amortization of intangible assets 88,141,857.69 93,599,130.48 Depreciation and amortization of investment properties 10,540,113.52 10,874,549.28 Amortization of long-term prepaid expenses 18,318,702.26 8,364,302.34 Losses (gains) on disposal of fixed assets, intangible assets and other long-term assets 1,067,547.86 (178,784,621.68)
Financial expenses (472,995,849.81) (244,180,220.89) Investment income (32,446,515,522.96) (30,934,319,046.09) Increase in inventories (283,893,690.30) (395,471,250.70) Decrease in operating receivables (429,655,676.23) (582,747,178.52) Increase in operating payables 7,279,706,230.18 5,647,415,671.05 Net cash flow from operating activities 2,204,841,833.39 (553,758,409.41)
2.Significant investment and financing activities not involving cash receipts and payments
Investment in subsidiaries by entrusted loans capitalization - 1,000,000,000.00 3. Net movement of cash and cash equivalents: Balance at the end of the year 55,541,206,630.65 53,896,855,196.85 Less: Balance at the beginning of the year 53,896,855,196.85 45,655,207,147.68 Net increase in cash and cash equivalents 1,644,351,433.80 8,241,648,049.17

SAIC MOTOR CORPORATION LIMITED NOTES TO THE FINANCIAL STATEMENTS YEAR ENDED DECEMBER 31, 2016
第 126 页
XV. NOTES TO KEY ITEMS IN THE COMPANY’S FINANCIAL STATEMENTS - continued
24. Related party relationships and transactions
A. Major related parties which have significant transactions or balances with the Company (1) Details of major subsidiaries of the Company refer to Note (VIII) 2.
(2) Details of major JCEs and associates of the Company refer to Note (VI) 15 and Note (VIII) 3. (3) Details of other major related parties which have significant transactions or balances with the Company
refer to Note (XI) 4.
B. Related party transactions
(1) Sales and purchases
(a) Sales of goods Unit: RMB
Related party Year Ended December 31, 2016 Year Ended December 31, 2015 Subsidiaries 1,887,639,398.16 1,276,385,121.59
(b) Sales of materials
Unit: RMB Related party Year Ended December 31, 2016 Year Ended December 31, 2015
Subsidiaries 418,476,418.02 366,930,671.61 Associates 14,182,501.16 14,306,972.90 Subsidiaries of SAIC 21,112.72 375,312.78 Total 432,680,031.90 381,612,957.29
(c) Purchase of goods and materials
Unit: RMB Related party Year Ended December 31, 2016 Year Ended December 31, 2015
Subsidiaries 15,829,045,551.72 8,980,965,738.47 JCEs 2,934,823,043.61 1,935,629,846.43 Associates 813,206,682.40 389,837,726.32 Subsidiaries of SAIC 3,924,896.86 27,138,674.78 Associates of SAIC 24,341,342.76 18,509,937.75 Total 19,605,341,517.35 11,352,081,923.75
(d) Purchase of long-term assets
Unit: RMB Related party Year Ended December 31, 2016 Year Ended December 31, 2015
Subsidiaries 64,565,721.79 44,177,560.56 JCEs 50,437,688.07 55,824,035.59 Associates 2,638,561.01 19,789,661.88 Subsidiaries of SAIC - 2,884,943.65 Associates of SAIC 264,150.94 2,667,982.02 Total 117,906,121.81 125,344,183.70

SAIC MOTOR CORPORATION LIMITED NOTES TO THE FINANCIAL STATEMENTS YEAR ENDED DECEMBER 31, 2016
第 127 页
XV. NOTES TO KEY ITEMS IN THE COMPANY’S FINANCIAL STATEMENTS - continued
24. Related party relationships and transactions - continued
B. Related party transactions - continued
(1) Sales and purchases
(e) Acceptance of services - R&D expenditures
Unit: RMB Related party Year Ended December 31, 2016 Year Ended December 31, 2015
Subsidiaries 600,708,335.41 611,510,172.37 JCEs 795,333,889.99 861,318,701.37 Associates 53,888,099.74 47,319,238.25 Subsidiaries of SAIC 337,908.00 340,081.50 Associates of SAIC 2,104,900.01 2,417,361.04 Total 1,452,373,133.15 1,522,905,554.53
(2) Rendering of services
(a) Rendering of services
Unit: RMB Related party Year Ended December 31, 2016 Year Ended December 31, 2015
Subsidiaries 7,839,758.32 4,974,239.78 JCEs 3,816,588.39 2,903,063.80 Associates 307,790.57 334,700.00 SAIC 248,269,051.92 512,841,167.39 Subsidiaries of SAIC 3,335,494.86 472,166.52 Total 263,568,684.06 521,525,337.49
(b) Rental income
Unit: RMB Related party Year Ended December 31, 2016 Year Ended December 31, 2015
Subsidiaries 26,351,762.62 24,928,867.21 JCEs 21,262,836.03 23,601,748.00 Total 47,614,598.65 48,530,615.21
(c) Royalties for technology
Unit: RMB Related party Year Ended December 31, 2016 Year Ended December 31, 2015
Subsidiaries 436,175,022.64 290,239,284.86
(3) Other expenses
(a) Logistics service expenses, royalties and others Unit: RMB
Related party Year Ended December 31, 2016 Year Ended December 31, 2015 Subsidiaries 655,198,922.29 379,642,991.91 JCEs 1,833,803.39 17,106,630.89 Associates 750,500.00 760,390.67 Total 657,783,225.68 397,510,013.47
The prices of transactions in (1) to (3) were determined based on the contracts between both parties.

SAIC MOTOR CORPORATION LIMITED NOTES TO THE FINANCIAL STATEMENTS YEAR ENDED DECEMBER 31, 2016
第 128 页
XV. NOTES TO KEY ITEMS IN THE COMPANY’S FINANCIAL STATEMENTS - continued
24. Related party relationships and transactions - continued
B. Related party transactions - continued
(4) Financing
(a) Loans to related parties
①Movement of entrusted loans to related parties by the Company are as follows:
Unit: RMB JCEs Subsidiaries Total
December 31, 2015 - 5,074,190,000.00 5,074,190,000.00 Loans offered 339,952,541.99 2,716,000,000.00 3,055,952,541.99 changes in the scope of consolidation (339,952,541.99) 339,952,541.99 - Repayment collected - (2,925,752,541.99) (2,925,752,541.99) December 31, 2016 - 5,204,390,000.00 5,204,390,000.00
②Balances of loans offered directly to subsidiaries are as follows:
Unit: RMB Subsidiaries
December 31, 2015 4,933,837,280.00 Loans offered 3,977,868,360.00 Effect of foreign exchange rate changes 482,114,860.00 December 31, 2016 9,393,820,500.00
③Loan interests received from subsidiaries are as follows:
Unit: RMB Year Ended December 31, 2016 Year Ended December 31, 2015
Subsidiaries 93,377,565.59 88,136,636.55
Interest rates for loans issued to related parties were determined according to the contracts.

SAIC MOTOR CORPORATION LIMITED NOTES TO THE FINANCIAL STATEMENTS YEAR ENDED DECEMBER 31, 2016
第 129 页
XV. NOTES TO KEY ITEMS IN THE COMPANY’S FINANCIAL STATEMENTS - continued
24. Related party relationships and transactions - continued
B. Related party transactions - continued
(4) Financing - continued
(b) Deposits at SFC
①Movement of deposits at SFC is as follows:
Unit: RMB December 31, 2015 Increase Decrease December 31, 2016
Cash and bank balances
39,951,167,924.24 222,389,048,080.44 (222,330,377,553.82) 40,009,838,450.86
②Interest receivable from SFC is as follows:
Unit: RMB December 31, 2016 December 31, 2015
Interest receivable 336,059,208.34 454,804,027.79
③Interest received from SFC is as follows: Unit: RMB
December 31, 2016 December 31, 2015 Interest income 805,224,200.25 911,824,645.59
Interest rates for deposits at SFC were determined according to interest rates specified by the People’s Bank of China.
(c) Financing charges paid to SFC
Unit: RMB December 31, 2016 December 31, 2015
SFC 241,367,085.36 97,177,607.32
Financing charges are paid to SFC based on the contracts between both parties.
(5) Guarantees
At the year-end, guarantees provided by the Company to related parties are as follows:
Guarantee Relationship with the Company Category Currency Ceiling amount Debt amount
SAIC Motor - CP Co., Ltd. (Note) Subsidiaries maximum
guarantee THB 3,570,000,000.00 2,300,539,836.77
Note: The Company and SAIC Motor - CP Co., Ltd. jointly provided maximum guarantee for its loans, of
which the Company provided 51% of the maximum guarantee amount of THB 3,570,000,000.00 at its shareholding ratio. As at the year-end, the actual amount of loans of the Company is THB 2,300,539,836.77 (RMB 446,074,674.35).
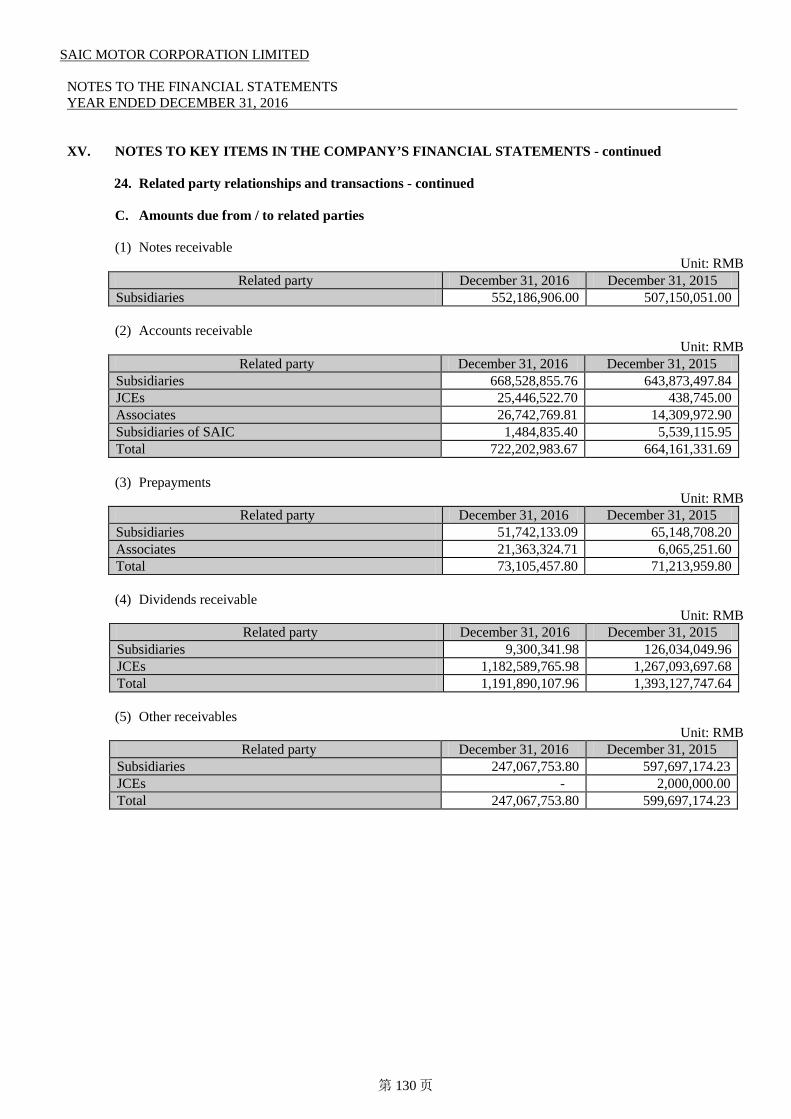
SAIC MOTOR CORPORATION LIMITED NOTES TO THE FINANCIAL STATEMENTS YEAR ENDED DECEMBER 31, 2016
第 130 页
XV. NOTES TO KEY ITEMS IN THE COMPANY’S FINANCIAL STATEMENTS - continued
24. Related party relationships and transactions - continued
C. Amounts due from / to related parties
(1) Notes receivable
Unit: RMB Related party December 31, 2016 December 31, 2015
Subsidiaries 552,186,906.00 507,150,051.00
(2) Accounts receivable Unit: RMB
Related party December 31, 2016 December 31, 2015 Subsidiaries 668,528,855.76 643,873,497.84 JCEs 25,446,522.70 438,745.00 Associates 26,742,769.81 14,309,972.90 Subsidiaries of SAIC 1,484,835.40 5,539,115.95 Total 722,202,983.67 664,161,331.69
(3) Prepayments
Unit: RMB Related party December 31, 2016 December 31, 2015
Subsidiaries 51,742,133.09 65,148,708.20 Associates 21,363,324.71 6,065,251.60 Total 73,105,457.80 71,213,959.80
(4) Dividends receivable
Unit: RMB Related party December 31, 2016 December 31, 2015
Subsidiaries 9,300,341.98 126,034,049.96 JCEs 1,182,589,765.98 1,267,093,697.68 Total 1,191,890,107.96 1,393,127,747.64
(5) Other receivables
Unit: RMB Related party December 31, 2016 December 31, 2015
Subsidiaries 247,067,753.80 597,697,174.23 JCEs - 2,000,000.00 Total 247,067,753.80 599,697,174.23

SAIC MOTOR CORPORATION LIMITED NOTES TO THE FINANCIAL STATEMENTS YEAR ENDED DECEMBER 31, 2016
第 131 页
XV. NOTES TO KEY ITEMS IN THE COMPANY’S FINANCIAL STATEMENTS - continued
24. Related party relationships and transactions - continued
C. Amounts due from / to related parties - continued
(6) Accounts payable
Unit: RMB Related party December 31, 2016 December 31, 2015
Subsidiaries 2,317,281,123.04 1,824,349,641.88 JCEs 2,064,918,436.03 1,508,379,538.59 Associates 312,139,725.55 129,604,207.14 Subsidiaries of SAIC 15,820,488.42 46,374,172.69 Associates of SAIC 3,917,198.35 6,897,002.89 Total 4,714,076,971.39 3,515,604,563.19
(7) Receipts in advance
Unit: RMB Related party December 31, 2016 December 31, 2015
Subsidiaries 86,700,425.70 28,441,315.60 JCEs - 151,487.79 SAIC 1,053,305,821.73 1,189,525,008.63 Total 1,140,006,247.43 1,218,117,812.02
(8) Other payables
Unit: RMB Related party December 31, 2016 December 31, 2015
Subsidiaries 1,326,129.89 993,079.89 JCEs 29,000.00 36,000.00 Associates 10,000.00 12,500.00 Subsidiaries of SAIC - 34,400.00 Associates of SAIC 16,350.00 16,350.00 Total 1,381,479.89 1,092,329.89
XVI. Comparative figures
Pursuant to Notice of Accounting Treatment on VAT (Chai Kuai [2016] No. 22) issued by Ministry of Finance issued on December 3, 2016, the comparative figures of the financial statements have been reclassified in accordance with the presentation of the current year.
XVII. APPROVAL OF THE FINANCIAL STATEMENTS
The consolidated and the Company’s financial statements have been approved by the Board of Directors on March 31, 2017.
***THE END OF THE FINANCIAL STATEMENTS***
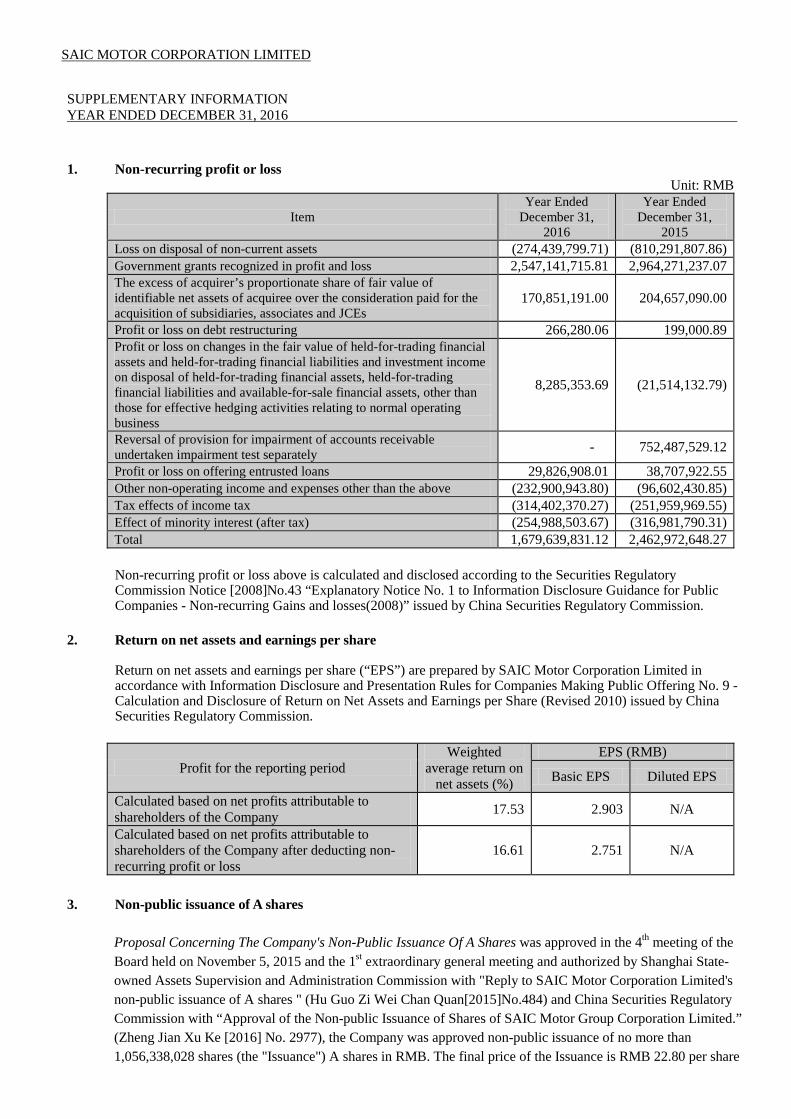
SAIC MOTOR CORPORATION LIMITED SUPPLEMENTARY INFORMATION YEAR ENDED DECEMBER 31, 2016
1. Non-recurring profit or loss Unit: RMB
Item Year Ended
December 31, 2016
Year Ended December 31,
2015 Loss on disposal of non-current assets (274,439,799.71) (810,291,807.86) Government grants recognized in profit and loss 2,547,141,715.81 2,964,271,237.07 The excess of acquirer’s proportionate share of fair value of identifiable net assets of acquiree over the consideration paid for the acquisition of subsidiaries, associates and JCEs
170,851,191.00 204,657,090.00
Profit or loss on debt restructuring 266,280.06 199,000.89 Profit or loss on changes in the fair value of held-for-trading financial assets and held-for-trading financial liabilities and investment income on disposal of held-for-trading financial assets, held-for-trading financial liabilities and available-for-sale financial assets, other than those for effective hedging activities relating to normal operating business
8,285,353.69 (21,514,132.79)
Reversal of provision for impairment of accounts receivable undertaken impairment test separately - 752,487,529.12
Profit or loss on offering entrusted loans 29,826,908.01 38,707,922.55 Other non-operating income and expenses other than the above (232,900,943.80) (96,602,430.85) Tax effects of income tax (314,402,370.27) (251,959,969.55) Effect of minority interest (after tax) (254,988,503.67) (316,981,790.31) Total 1,679,639,831.12 2,462,972,648.27
Non-recurring profit or loss above is calculated and disclosed according to the Securities Regulatory Commission Notice [2008]No.43 “Explanatory Notice No. 1 to Information Disclosure Guidance for Public Companies - Non-recurring Gains and losses(2008)” issued by China Securities Regulatory Commission.
2. Return on net assets and earnings per share
Return on net assets and earnings per share (“EPS”) are prepared by SAIC Motor Corporation Limited in accordance with Information Disclosure and Presentation Rules for Companies Making Public Offering No. 9 - Calculation and Disclosure of Return on Net Assets and Earnings per Share (Revised 2010) issued by China Securities Regulatory Commission.
Profit for the reporting period Weighted
average return on net assets (%)
EPS (RMB)
Basic EPS Diluted EPS
Calculated based on net profits attributable to shareholders of the Company 17.53 2.903 N/A
Calculated based on net profits attributable to shareholders of the Company after deducting non-recurring profit or loss
16.61 2.751 N/A
3. Non-public issuance of A shares
Proposal Concerning The Company's Non-Public Issuance Of A Shares was approved in the 4th meeting of the Board held on November 5, 2015 and the 1st extraordinary general meeting and authorized by Shanghai State-owned Assets Supervision and Administration Commission with "Reply to SAIC Motor Corporation Limited's non-public issuance of A shares " (Hu Guo Zi Wei Chan Quan[2015]No.484) and China Securities Regulatory Commission with “Approval of the Non-public Issuance of Shares of SAIC Motor Group Corporation Limited.” (Zheng Jian Xu Ke [2016] No. 2977), the Company was approved non-public issuance of no more than 1,056,338,028 shares (the "Issuance") A shares in RMB. The final price of the Issuance is RMB 22.80 per share

SAIC MOTOR CORPORATION LIMITED SUPPLEMENTARY INFORMATION YEAR ENDED DECEMBER 31, 2016
at par value of RMB 1 per share which were subscribed by cash. As at January 11, 2017, the Company issued 657,894,736 ordinary shares in RMB (A Share) at the price of RMB 22.80 per share with par value of RMB 1 per share to raise funds of RMB 14,999,999,980.80 in total. After the non-public issuance of A shares, the Company has total of 11,683,461,365 shares in issue.