salaries in the oklahoma state system of higher education, 2014 · pdf file ·...
TRANSCRIPT

Salaries in The Oklahoma State System of Higher Education
2014-2015
Faculty and Selected Administrative Positions
Oklahoma State Regents for Higher Education Research Park, Oklahoma City
*September 2015
*Revised 10/2015

OKLAHOMA STATE REGEN TS FOR HIGHER EDUCATION
Genera l Toney St r icklin Chairman, Lawton
Mar lin “Ike” Glass Michael C. Turpen Newkirk Oklahoma City
J oseph L. Parker J ay Helm Tulsa Tulsa
Ann Holloway J ames “J immy” Harr ell Ardmore Leedey
J ohn Massey Ronald White Durant Oklahoma City
Glen D. J ohnson Chancellor
The Oklahoma Sta te Regents for Higher Educa t ion , in compliance with Tit les VI and VII of the Civil Righ ts Act of 196 4, Execu t ive Order 11246 as amended, Tit le IX of the Educa t ion Amendments of 1972, Amer icans with Disabilit ies Act of 1990 and other federa l laws, do not discr iminate on the basis of race, color , na t iona l or igin , sex, age, religion , handicap, or sta tus as a veteran in any of it s policies, pract ices, or procedures. Th is includes, bu t is not limited to admissions, employment , fina ncia l a id, and educa t ional services.
Th is publica t ion , duplica ted by the Sta te Regents’ cen t ra l services, is issued by the Oklah oma Sta te Regents for Higher Educa t ion as au thor ized by 70 O.S. 1991, Sect ion 3206. Copies have been deposited with the Publica t ions Clear inghouse of the Oklahoma Depar tment of Librar ies.

List of Table s an d Figu res
Table s:
1. Average Sa la r ies Pa id All Full-Time Faculty, 2014-2015 ................................................................................. 3
2. Average Sa la r ies Pa id All Full-Time Faculty, 2012-13 through 2014-2015 ..................................................... 7
3. Average Sa la r ies Pa id All Full-Time Faculty, 25 Oklahoma Sta te Colleges and Universit ies, 2013-2014 through 2014-2015 ........................................................................................ 10
4. Average Sa la r ies Pa id 9-10 Month Full-Time Faculty, 2014-2015 ................................................................. 12
5. Average Sta ff Benefit s Pa id 9-10 Month Full-Time Faculty, 2014-2015 ........................................................ 16
6. Average Sa la r ies Pa id 11-12 Month Full-Time Faculty, 2014-2015 ............................................................... 19
7. Average Sta ff Benefit s Pa id 11-12 Month Full-Time Faculty, 2014-2015 ...................................................... 23
8. Average Tota l Compensa t ion Pa id 9-10 and 11-12 Month Full-Time Faculty, 2014-2015 ............................ 26
9. Range of Sa la r ies Pa id 9-10 and 11-12 Month Academic Deans and Full-Time Faculty, 2014-2015............ 29
10. Addit iona l Income from Ext ra Teaching Assignments and Approved Non-inst itu t iona l Employment , 2014-2015 and 2014-2015 ........................................................................ 32
11. 11-12 Month Average Sa la r ies of Selected Administ ra t ive Posit ions, 2014-2015 ....................................... 35
12. University of Oklahoma Hea lth Sciences Center Average Sa la r ies Pa id All Full-Time Faculty, 11-12 Month Sa la r ies for 2014-2015 ............................................................................ 41
13. Average Sa la r ies Pa id All Full-Time Faculty, All Other Const ituent Agencies, 2014-2015........................ 42
14. Average Fr inge Benefit s Pa id 9-10 Month and 11-12 Month Full-Time Faculty, All Const ituent Agencies, 2014-2015 ........................................................................................................... 44
15. New Faculty Hires, 2014-2015 ........................................................................................................................ 46
16. Faculty Termina t ions, 2014-2015 ................................................................................................................... 47
17. Average Sa la r ies Pa id Full-Time Faculty, by Rank, by Tier , Oklahoma Compared to Nat iona l Public Inst itu t ions, 2004-05 to 2014-2015 ................................................................................... 49

List of Table s an d Figu res
Figu res:
1. Change in Number of Full-Time Faculty, 2013-14 to 2014-15 .......................................................................... 4
2. Change in Sa la r ies of Full-Time Faculty, 2013-14 to 2014-15 .......................................................................... 5
3. Change in Number of 9-10 Month Full-Time Faculty, 11-12 to 2014-15 ........................................................ 13
4. Change in Sa la r ies of 9-10 Month Full-Time Faculty, 11-12 to 2014-15 ........................................................ 14
5. Change In Average Benefit s Pa id to 9-10 Month Full-Time Faculty, All Inst itu t ions, 13-14 to 14-15 ......... 17
6. Change in Number of 11-12 Month Full-Time Faculty, 2013-14 to 2014-15 .................................................. 20
7. Change in Sa la r ies of 11-12 Month Full-Time Faculty, 2013-14 to 2014-15 .................................................. 21
8. Change in Average Benefit s Pa id to 11-12 Month Full-Time Faculty, 2013-14 to 2014-15 .......................... 24
9. Average Tota l Compensa t ion Pa id 9-10 Month and 11-12 Month Full-Time Faculty, 2013-14 Compared to 2014-15 .................................................................................................... 27
10. Addit iona l Income from Ext ra Teaching Assignments and Approved Non-inst itu t iona l Employment , 2013-14 to 2014-15 ................................................................................ 33
11. Presidents’ Sa la r ies & Benefit s, High & Average Sa la ry Compar is ons, FY14 to FY15 ................................ 39
12. Annua l Percentage Increases in Faculty Sa la r ies, Oklahoma Compared to Nat iona l Public Inst itu t ions, by Tier ....................................................................................................... 50
13. Annua l Percentage Increases in Faculty Sa la r ies, Oklahoma Compared to Nat iona l Public Inst itu t ions, by Rank ..................................................................................................... 51
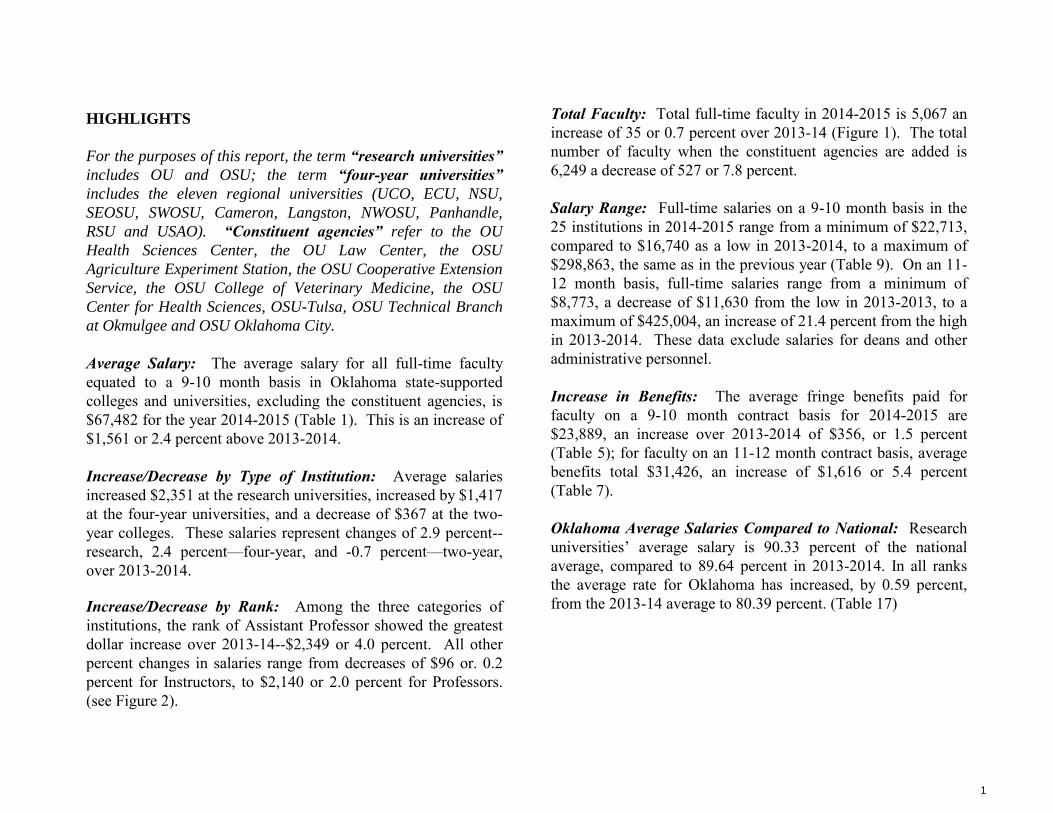
HIGHLIGHTS
For the purposes of this report, the term “research universities” includes OU and OSU; the term “four-year universities” includes the eleven regional universities (UCO, ECU, NSU,
SEOSU, SWOSU, Cameron, Langston, NWOSU, Panhandle,
RSU and USAO). “Constituent agencies” refer to the OU
Health Sciences Center, the OU Law Center, the OSU
Agriculture Experiment Station, the OSU Cooperative Extension
Service, the OSU College of Veterinary Medicine, the OSU
Center for Health Sciences, OSU-Tulsa, OSU Technical Branch
at Okmulgee and OSU Oklahoma City.
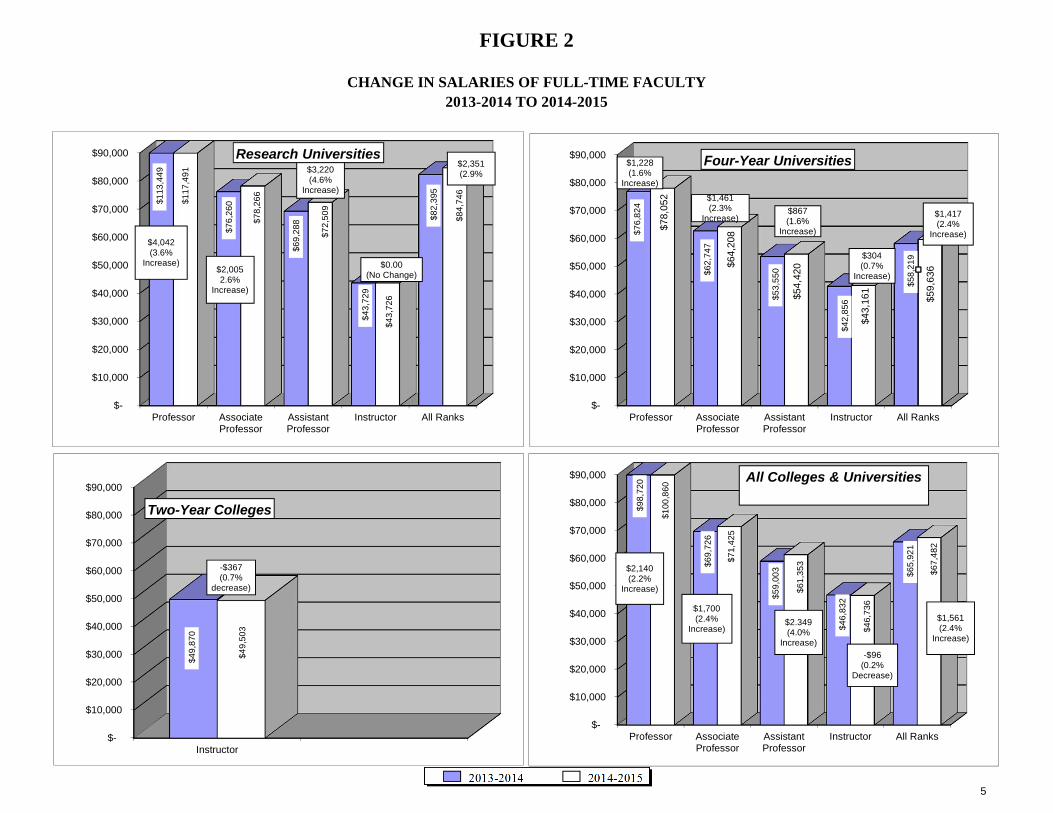
Average Salary: The average salary for all full-time faculty equated to a 9-10 month basis in Oklahoma state-supported colleges and universities, excluding the constituent agencies, is $67,482 for the year 2014-2015 (Table 1). This is an increase of $1,561 or 2.4 percent above 2013-2014.
Increase/Decrease by Type of Institution: Average salaries increased $2,351 at the research universities, increased by $1,417 at the four-year universities, and a decrease of $367 at the two-year colleges. These salaries represent changes of 2.9 percent--research, 2.4 percent—four-year, and -0.7 percent—two-year, over 2013-2014.
Increase/Decrease by Rank: Among the three categories of institutions, the rank of Assistant Professor showed the greatest dollar increase over 2013-14--$2,349 or 4.0 percent. All other percent changes in salaries range from decreases of $96 or. 0.2 percent for Instructors, to $2,140 or 2.0 percent for Professors. (see Figure 2).
Total Faculty: Total full-time faculty in 2014-2015 is 5,067 an increase of 35 or 0.7 percent over 2013-14 (Figure 1). The total number of faculty when the constituent agencies are added is 6,249 a decrease of 527 or 7.8 percent.
Salary Range: Full-time salaries on a 9-10 month basis in the 25 institutions in 2014-2015 range from a minimum of $22,713, compared to $16,740 as a low in 2013-2014, to a maximum of $298,863, the same as in the previous year (Table 9). On an 11-12 month basis, full-time salaries range from a minimum of $8,773, a decrease of $11,630 from the low in 2013-2013, to a maximum of $425,004, an increase of 21.4 percent from the high in 2013-2014. These data exclude salaries for deans and other administrative personnel.
Increase in Benefits: The average fringe benefits paid for faculty on a 9-10 month contract basis for 2014-2015 are $23,889, an increase over 2013-2014 of $356, or 1.5 percent (Table 5); for faculty on an 11-12 month contract basis, average benefits total $31,426, an increase of $1,616 or 5.4 percent (Table 7).
Oklahoma Average Salaries Compared to National: Research universities’ average salary is 90.33 percent of the national average, compared to 89.64 percent in 2013-2014. In all ranks the average rate for Oklahoma has increased, by 0.59 percent, from the 2013-14 average to 80.39 percent. (Table 17)
1

NOTE: The changes in average salaries are only partially related to salary
actions by governing boards. Other factors, such as resignations and
retirements, can have an impact as well, particularly if new junior faculty are
hired at lower salaries to replace departing senior faculty.
TABLE 1
Table 1 presents the 2014-2015 average salaries paid all full-time faculty by rank and by all 25 colleges and universities in The Oklahoma State System of Higher Education. These data include salaries of full-time faculty employed on a 9-10 month contract basis and full-time faculty employed on an 11-12 month contract basis with salaries equated to 9-10 months. Table 1 also includes the number of full-time faculty by rank and by institution.
The average salary equated to a 9-10 month basis paid in the 25 institutions in 2014-2015 is $67,482. This represents an increase over 2013-2014 of $1,561 or 2.4 percent (see Figure 2). The average for research universities is $84,746, for four-year universities, $59,635, and for two-year colleges, $49,503. These salaries represent increases over 2013-2014 of 2.9 percent and 2.4 percent, respectively, for the research and regional universities and a 0.7 percent decrease for the two-year colleges. The 2014-2015 median of all institutions’ average salaries is $51,346.
Average salaries for instructors are highest at the two-year colleges, and lowest at the four-year universities.
Faculty distribution by rank may influence the salary averages of the various faculty ranks within an institution. Table 1 shows a smaller proportion of faculty in the upper two ranks (professor and associate professor) at four-year universities than at the research universities. The research universities’ average salary for all ranks is 28.5 percent higher than the average salary of all ranks for four-year universities. By rank, the research universities’ average salary exceeds the four-year universities’ average salary in the rank of professor by 33.6 percent, associate professor by 18.0 percent, and assistant professor by 20.1 percent. However, in the rank of instructor, the two-year universities’ average salary exceeds the system average salary by 5.6 percent.
The total number of full-time faculty reported in the 25 institutions in 2014-2015 is 5,067—2,109 at research universities, 1,946 at four-year universities, and 1,012 at two-year colleges. These figures compare to a total of 5,032-2,081; 1,895; and 1,041 at the research, four-year and two-year tiers, respectively in 2014.
2

TABLE 1 AVERAGE SALARIES PAID ALL FULL-TIME FACULTY
2014-2015
Institution
Academic Rank Professor Associate Professor Assistant Professor Instructor Average, All Ranks
Number Amount Number Amount Number Amount Number Amount Number Amount
University of Oklahoma Oklahoma State University
422 287
$ 116,482 118,974
298 285
77,111$ 79,472
275 214
71,532$ 73,764
147 181
42,655$ 44,596
1,142 967
85,881$ 83,405
Research Universities 709 $ 117,491 583 78,266$ 489 72,509$ 328 43,726$ 2,109 84,746$ Research Tier Salaries Greater than 4-Yr Tier:
University of Central Oklahoma East Central University Northeastern State University Northwestern Oklahoma State University Southeastern Oklahoma State University Southwestern Oklahoma State University Cameron University Langston University Oklahoma Panhandle State University Rogers State University University of Science & Arts
181 58 73 20 57 38 40 6 3
24 17
33.6%
86,116$ 72,167 75,458 68,122 80,020 82,132 71,810 81,580 40,673 63,182 60,409
89 19 66 10 29 46 34 40 4
23 12
18.0%
73,502$ 56,289 61,280 61,309 71,599 67,296 59,645 57,591 49,941 56,644 50,875
112 45
103 23 28 56 64 55 17 33 14
24.9%
61,750$ 50,416 53,736 54,287 61,923 55,246 50,953 52,146 41,970 49,757 46,480
109 56 79 34 17 73 49 40 19 23 8
42,666$ 43,057 42,219 41,586 42,235 48,415 40,019 48,083 35,520 40,421 41,306
491 178 321 87
131 213 187 141 43
103 51
29.6%
68,626$ 55,815 57,393 53,311 69,384 60,304 54,130 53,790 39,771 52,338 51,346
Regional Four-Year Universities 517 78,052$ 372 64,208$ 550 54,420$ 507 43,161$ 1,946 59,636$ 4-Yr Tier Salaries Greater than Research Tier:
Carl Albert State College Connors State College Eastern Oklahoma State College Murray State College Northeastern Oklahoma A&M College Northern Oklahoma College Oklahoma City Community College Redlands Community College Rose State College Seminole State College Tulsa Community College Western Oklahoma State College
------------
-$ -----------
------------
-$ -----------
------------
-$ -----------
53 46 39 57 61 99
143 27
104 36
306 41
-1.3%
43,252$ 43,450 43,254 45,998 45,078 48,487 49,352 40,481 46,815 43,688 57,285 44,538
53 46 39 57 61 99
143 27
104 36
306 41
43,252$ 43,450 43,254 45,998 45,078 48,487 49,352 40,481 46,815 43,688 57,285 44,538
Two-Year Colleges - -$ - -$ - -$ 1,012 49,503$ 1,012 49,503$ 2-Yr Tier Salaries Greater than System Avg: 5.6%
All Colleges and Universities 1,226 $ 100,860 955 71,425$ 1,039 61,353$ 1,847 46,736$ 5,067 67,482$
FY2015 Median Salary: 51,346$ NOTE: Includes all full-time faculty salaries on a 9-10 month basis. All 11-12 month salaries have been equated to 9-10 month salaries by multiplying the 11-12 month salaries by 9/11.
3

2013-2014 2014-2015
FIGURE 1
CHANGE IN NUMBER OF FULL-TIME FACULTY 2013-2014 TO 2014-2015
-
500
1,000
1,500
Professor Associate Professor
Assistant Professor
Instructor All Ranks
721
600
451 331
2,081
709
583
489 328
2,109
-12 (1.7%
Decrease) -17
(2.8% Decrease)
38 (8.4%
Increase)
-3 (0.9%
Decrease)
28 (1.3%
Increase)
-
500
1,000
1,500
2,000
2,500
Professor Associate Professor
Assistant Professor
Instructor All Ranks
485 390
544 537
1,895
517 372
550 507
1,946
32 (6.6%
Increase) -18
(4.6% Frcrease)
6 (1.1%
Increase) -30 (5.6%
Decrease)
51 (2.7%
-
500
1,000
1,500
2,000
Instructor
1,041
1,012
-29 (2.8%
Decrease)
(500)
500
1,500
2,500
3,500
4,500
5,500
Professor Associate Professor
Assistant Professor
Instructor All Ranks
1,206 990 995
1,909
5,032
1,226 955 1,039
1,847
5,067
20 1.7%
Increase -35 (3.5%
Decrease)
44 (4.4%
Increase)
-62 (3.2%
Decrease)
35 (0.7%
Increase)
Four-Year Universities
Two-Year Colleges All Colleges & Universities
2,000
Research Universities
4
2013-2014 2014-2015
FIGURE 2
CHANGE IN SALARIES OF FULL-TIME FACULTY 2013-2014 TO 2014-2015
$-
$10,000
$20,000
$30,000
$40,000
$50,000
$60,000
$70,000
$80,000
$90,000
Professor Associate Professor
Assistant Professor
Instructor All Ranks
$113
,449
$76,
260
$69,
288
$43,
729
$82,
395
$117
,491
$78,
266
$72,
509
$43,
726
$84,
746
$4,042 (3.6%
Increase) $2,005 2.6%
Increase)
$3,220 (4.6%
Increase)
$0.00 (No Change)
$2,351 (2.9%
$-
$10,000
$20,000
$30,000
$40,000
$50,000
$60,000
$70,000
$80,000
$90,000
Professor Associate Professor
Assistant Professor
Instructor All Ranks
$76,
824
$62,
747
$53,
550
$42,
856
$58,
219
$78,
052
$64,
208
$54,
420
$43,
161
$59,
636
$1,228 (1.6%
Increase)
$1,461 (2.3%
Increase) $867 (1.6%
Increase)
$304 (0.7%
Increase)
$1,417 (2.4%
Increase)
$-
$10,000
$20,000
$30,000
$40,000
$50,000
$60,000
$70,000
$80,000
$90,000
Instructor
$49,
870
$49,
503
-$367 (0.7%
decrease)
$-
$10,000
$20,000
$30,000
$40,000
$50,000
$60,000
$70,000
$80,000
$90,000
Professor Associate Professor
Assistant Professor
Instructor All Ranks
$98,
720
$69,
726
$59,
003
$46,
832
$65,
921
$100
,860
$71,
425
$61,
353
$46,
736
$67,
482
$2,140 (2.2%
Increase)
$1,700 (2.4%
Increase) $2.349 (4.0%
Increase) -$96
(0.2% Decrease)
$1,561 (2.4%
Increase)
Research Universities Four-Year Universities
Two-Year Colleges
All Colleges & Universities
5

TABLE 2
Table 2 presents the 9-10 month average salaries of all full-time faculty members for the three years, 2012-13 through 2014-2015, from which salary trends by institution and by rank may be analyzed.
Certain factors may influence salary averages so that they do not accurately indicate long-term salary trends. For example: a senior full professor receiving a top salary could retire and at the same time an associate professor be promoted to full professor at the bottom of the salary scale for full professors. The net result, with respect to individual faculty still employed, would be that at least one person would be receiving more salary than in the previous year. Yet, the effect upon the average salary for full professors at the institution would show a decline. The average salary for an entire institution could be affected in the same manner. Another factor causing the same effect could occur as a result of hiring new faculty to meet the demands of expanding enrollment; new faculty members would normally be hired at a salary level below the institution’s salary average. Several of the state system institutions are showing a decline in salary due to the aforementioned factors.
Analyses of the data contained in Table 2 may be made in a variety of meaningful ways. No attempt is made here to provide an exhaustive analysis; however, certain observations are noted. The dollar increases in average salaries are not the same between different ranks in the same institution. For example, changes for 2012-13 to 2014-2015 show the University of Oklahoma increased the average of all ranks $ 4,312 or 5.3 percent, while Oklahoma State University increased $4,630 or 5.9 percent. At Oklahoma State University, the salary for the rank of professor increased by $8,160 the increase for associate professors was
$4,934; the increase for assistant professor was $6,403; and the rank of instructor showed an increase of $1,284. At the University of Oklahoma, comparable figures were changes of $5,648 $3,743 $5,321, and $1,558 for professors, associate professors, assistant professors and instructors, respectively. Such differences may result from factors suggested above or could also result from salary administration policy and faculty qualifications. Although Table 2 does not provide specific reasons for observed salary averages and comparisons, the three-year trend of institutions’ average salaries by rank may provide helpful data.
6

TABLE 2 AVERAGE SALARIES PAID ALL FULL-TIME FACULTY
2012-2013 THROUGH 2014-2015
Institution Period Professor Associate Professor
Assistant Professor Instructor
Average, All Ranks
University of Oklahoma 2012-2013 2013-2014 2014-2015
110,834 111,866 116,482
73,368 75,037 77,111
66,211 68,121 71,532
41,096 42,119 42,655
81,569 83,068 85,881
$ Chg, 13-2015 % Chg, 13-2015
5,648 5.1%
3,743 5.1%
5,321 8.0%
1,558 3.8%
4,312 5.3%
Oklahoma State University 2012-2013 2013-2014 2014-2015
110,813 115,801 118,974
74,539 77,551 79,472
67,361 70,651 73,764
43,312 45,129 44,596
78,775 81,603 83,405
$ Chg, 13-2015 % Chg, 13-2015
8,160 7.4%
4,934 6.6%
6,403 9.5%
1,284 3.0%
4,630 5.9%
University of Central Oklahoma 2012-2013 2013-2014 2014-2015
79,927 85,849 86,116
67,099 71,969 73,502
60,108 61,571 61,750
44,509 43,304 42,666
65,501 67,661 68,626
$ Chg, 13-2015 % Chg, 13-2015
6,189 7.7%
6,403 9.5%
1,642 2.7%
(1,843) -4.1%
3,124 4.8%
East Central University 2012-2013 2013-2014 2014-2015
70,250 71,237 72,167
56,203 53,281 56,289
49,986 49,315 50,416
45,401 45,190 43,057
56,004 54,983 55,815
$ Chg, 13-2015 % Chg, 13-2015
1,917 2.7%
85 0.2%
430 0.9%
(2,344) -5.2%
(189) -0.3%
Northeastern State University 2012-2013 2013-2014 2014-2015
73,131 74,151 75,458
58,764 61,183 61,280
51,339 52,203 53,736
42,998 41,787 42,219
55,500 56,093 57,393
$ Chg, 13-2015 % Chg, 13-2015
2,327 3.2%
2,516 4.3%
2,397 4.7%
(779) -1.8%
1,892 3.4%
Northwestern Oklahoma State University 2012-2013 2013-2014 2014-2015
65,803 67,681 68,122
60,431 62,721 61,309
53,447 52,630 54,287
41,931 41,609 41,586
52,555 52,438 53,311
$ Chg, 13-2015 % Chg, 13-2015
2,319 3.5%
878 1.5%
840 1.6%
(345) -0.8%
756 1.4%
Southeastern Oklahoma State University 2012-2013 2013-2014 2014-2015
74,023 75,502 80,020
60,608 60,256 71,599
53,650 56,607 61,923
35,455 37,493 42,235
61,642 62,728 69,384
$ Chg, 13-2015 % Chg, 13-2015
5,996 8.1%
10,991 18.1%
8,273 15.4%
6,780 19.1%
7,742 12.6%
Southwestern Oklahoma State University 2012-2013 2013-2014 2014-2015
78,065 78,300
65,215 65,958
52,489 53,894
46,122 47,097
56,800 57,771
82,132 67,296 55,246 48,415 60,304 $ Chg, 13-2015 % Chg, 13-2015
4,067 5.2%
2,081 3.2%
2,757 5.3%
2,293 5.0%
3,504 6.2%
Cameron University 2012-2013 2013-2014 2014-2015
70,542 72,064 71,810
61,574 60,511 59,645
51,763 50,286 50,953
38,927 38,787 40,019
54,033 53,049 54,130
$ Chg, 13-2015 % Chg, 13-2015
1,268 1.8%
(1,928) -3.1%
(810) -1.6%
1,092 2.8%
97 0.2%
Langston University 2012-2013 2013-2014 2014-2015
67,786 81,580 81,580
56,795 56,518 57,591
49,878 51,958 52,146
44,228 47,121 48,083
51,329 53,190 53,790
$ Chg, 13-2015 % Chg, 13-2015
13,794 20.3%
795 1.4%
2,268 4.5%
3,855 8.7%
2,461 4.8%
Oklahoma Panhandle State University 2012-2013 2013-2014 2014-2015
49,477 48,434 40,673
42,058 49,599 49,941
37,474 49,828 41,970
32,555 31,166 35,520
37,625 43,307 39,771
$ Chg, 13-2015 % Chg, 13-2015
(8,803) -17.8%
7,883 18.7%
4,496 12.0%
2,965 9.1%
2,146 5.7%
Rogers State University 2012-2013 2013-2014 2014-2015
66,574 62,067 63,182
57,095 59,955 56,644
48,405 50,681 49,757
43,805 41,984 40,421
52,835 53,382 52,338
$ Chg, 13-2015 % Chg, 13-2015
(3,392) -5.1%
(451) -0.8%
1,352 2.8%
(3,384) -7.7%
(496) -0.9%
University of Science & Arts of Oklahoma 2012-2013 2013-2014 2014-2015
60,509 60,306 60,409
48,865 51,212 50,875
45,076 46,065 46,480
40,860 40,896 41,306
50,542 51,113 51,346
$ Chg, 13-2015 % Chg, 13-2015
(100) -0.2%
2,010 4.1%
1,404 3.1%
446 1.1%
804 1.6%
7

TABLE 2 (continued) AVERAGE SALARIES PAID ALL FULL-TIME FACULTY
2010-2011 THROUGH 2012-2013
Institution Period Professor Associate Professor
Assistant Professor Instructor
Average, All Ranks
Carl Albert State College 2012-2013 2013-2014 2014-2015
41,906 43,013 43,252
41,906 43,013 43,252
$ Chg, 13-2015 % Chg, 13-2015
1,346 3.2%
1,346 3.2%
Connors State College 2012-2013 2013-2014 2014-2015
45,379 44,866 43,450
45,379 44,866 43,450
$ Chg, 13-2015 % Chg, 13-2015
(1,930) -4.3%
(1,930) -4.3%
Eastern Oklahoma State College 2012-2013 2013-2014 2014-2015
41,757 41,765 43,254
41,757 41,765 43,254
$ Chg, 13-2015 % Chg, 13-2015
1,497 3.6%
1,497 3.6%
Murray State College 2012-2013 2013-2014 2014-2015
45,730 45,577 45,998
45,730 45,577 45,998
$ Chg, 13-2015 % Chg, 13-2015
268 0.6%
268 0.6%
Northeastern Oklahoma A&M College 2012-2013 2013-2014 2014-2015
43,625 45,543 45,078
43,625 45,543 45,078
$ Chg, 13-2015 % Chg, 13-2015
1,453 3.3%
1,453 3.3%
Northern Oklahoma College 2012-2013 2013-2014 2014-2015
45,898 46,760 48,487
45,898 46,760 48,487
$ Chg, 13-2015 % Chg, 13-2015
2,588 5.6%
2,588 5.6%
Oklahoma City Community College 2012-2013 2013-2014 2014-2015
49,676 51,171 49,352
49,676 51,171 49,352
$ Chg, 13-2015 % Chg, 13-2015
(324) -0.7%
(324) -0.7%
Redlands Community College 2012-2013 2013-2014 2014-2015
40,602 41,335 40,481
40,602 41,335 40,481
$ Chg, 13-2015 % Chg, 13-2015
(121) -0.3%
(121) -0.3%
Rose State College 2012-2013 2013-2014 2014-2015
46,865 47,892 46,815
46,865 47,892 46,815
$ Chg, 13-2015 % Chg, 13-2015
(50) -0.1%
(50) -0.1%
Seminole State College 2012-2013 2013-2014 2014-2015
42,841 45,101 43,688
42,841 45,101 43,688
$ Chg, 13-2015 % Chg, 13-2015
847 2.0%
847 2.0%
Tulsa Community College 2012-2013 2013-2014 2014-2015
56,349 57,906 57,285
56,349 57,906 57,285
$ Chg, 13-2015 % Chg, 13-2015
936 1.7%
936 1.7%
Western Oklahoma State College 2012-2013 2013-2014 2014-2015
45,387 44,450 44,538
45,387 44,450 44,538
$ Chg, 13-2015 % Chg, 13-2015
(849) -1.9%
(849) -1.9%
8

This page is intentionally left blank.
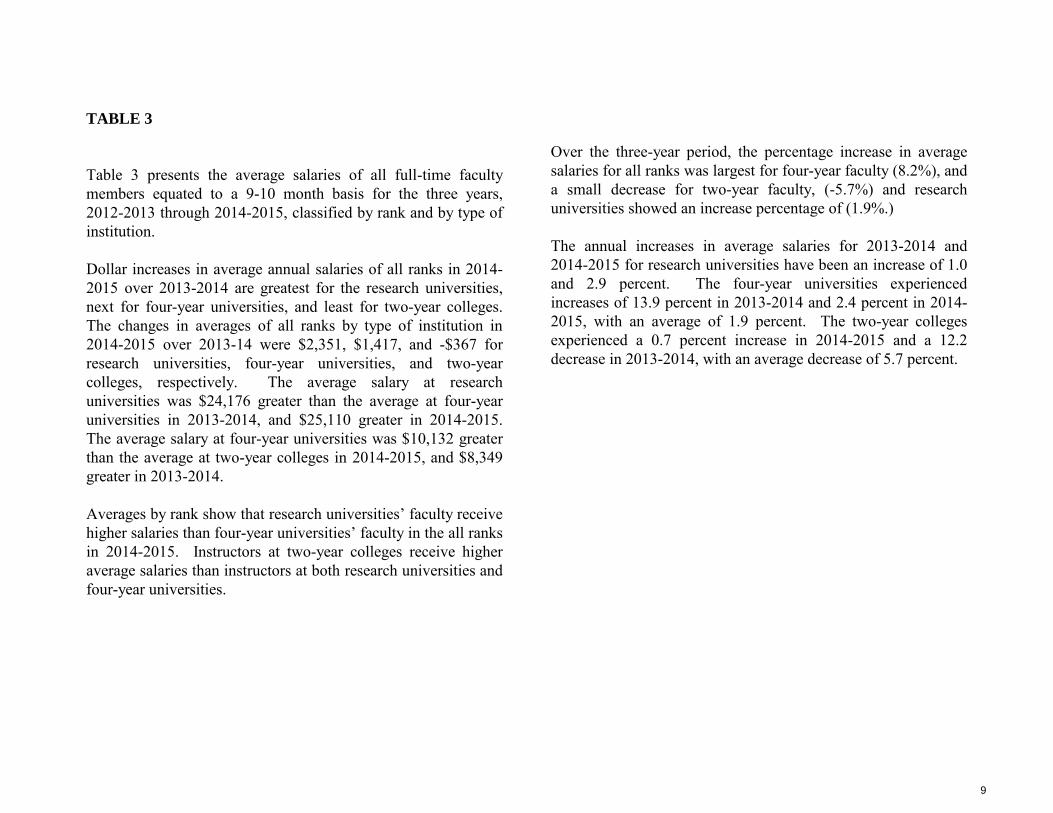
TABLE 3
Table 3 presents the average salaries of all full-time faculty members equated to a 9-10 month basis for the three years, 2012-2013 through 2014-2015, classified by rank and by type of institution.
Dollar increases in average annual salaries of all ranks in 2014-2015 over 2013-2014 are greatest for the research universities, next for four-year universities, and least for two-year colleges. The changes in averages of all ranks by type of institution in 2014-2015 over 2013-14 were $2,351, $1,417, and -$367 for research universities, four-year universities, and two-year colleges, respectively. The average salary at research universities was $24,176 greater than the average at four-year universities in 2013-2014, and $25,110 greater in 2014-2015. The average salary at four-year universities was $10,132 greater than the average at two-year colleges in 2014-2015, and $8,349 greater in 2013-2014.
Averages by rank show that research universities’ faculty receive higher salaries than four-year universities’ faculty in the all ranks in 2014-2015. Instructors at two-year colleges receive higher average salaries than instructors at both research universities and four-year universities.
Over the three-year period, the percentage increase in average salaries for all ranks was largest for four-year faculty (8.2%), and a small decrease for two-year faculty, (-5.7%) and research universities showed an increase percentage of (1.9%.)
The annual increases in average salaries for 2013-2014 and 2014-2015 for research universities have been an increase of 1.0 and 2.9 percent. The four-year universities experienced increases of 13.9 percent in 2013-2014 and 2.4 percent in 2014-2015, with an average of 1.9 percent. The two-year colleges experienced a 0.7 percent increase in 2014-2015 and a 12.2 decrease in 2013-2014, with an average decrease of 5.7 percent.
9

TABLE 3 AVERAGE SALARIES PAID FULL-TIME FACULTY
25 OKLAHOMA STATE COLLEGES AND UNIVERSITIES 2012-2013 THROUGH 2014-2015
Rank
Type of Institution
Research Universities
Research Univ Salary Greater than 4-Yr Univ Salary by:
Four-Year Universities
4-Yr Univ Salary Greater than 2-Yr
Coll Salary by: Two-Year Colleges
Professor 2012-2013 2013-2014 2014-2015
$ $
110,826 113,449
36,623$ 36,625$
74,203$ 76,824$ --
--$ 117,491 39,439$ 78,052$
Associate Professor 2012-2013 2013-2014 2014-2015
$ $ $
73,932 76,260 78,266
13,286$ 13,514$ 14,058$
60,645$ 62,747$ 64,208$
--
----
Assistant Professor 2012-2013 2013-2014 2014-2015
$ $ $
66,743 69,288 72,509
14,289$ 15,738$ 18,089$
52,454$ 53,550$ 54,420$
--
----
Instructor 2012-2013 2013-2014 2014-2015
$ $ $
42,236 43,729 43,726
(867)$ 872$ 565$
43,102$ 42,856$ 43,161$
(5,593)$ (7,014)$ (6,342)$
--
$ $ $
48,696 49,870 49,503
Average, All Ranks 2012-2013 2013-2014 2014-2015
$ $ $
81,603 82,395 84,746
30,490$ 24,176$ 25,110$
51,113$ 58,219$ 59,636$
6,664$ 8,349$
10,133$
$ $ $
44,450 49,870 49,503
Dollar Increase, All Ranks 2013-2014 2014-2015
$ $
791 2,351
7,106$ 1,417$
$ $
5,420 (367)
Percent Increase, All Ranks 2013-2014 1.0% 13.9% -12.2% 2014-2015 2.9% 2.4% 0.7%
Avg Annual % Increase 1.9% 8.2% -5.7%
10

TABLE 4
Table 4 presents the average salaries and the number of full-time faculty employed on a 9-10 month basis only. Faculty who are employed on an 11-12 month basis are not included in this table. Individual faculty members included in Table 4 may or may not be employed by separate contract for summer teaching. The criterion for inclusion in Table 4 is that the basic contract is for a regular 9-10 month academic year. Whereas many interpretations may be made from data in Table 4 alone, depth may be gained by comparing the data with those contained in Tables 1 and 6.
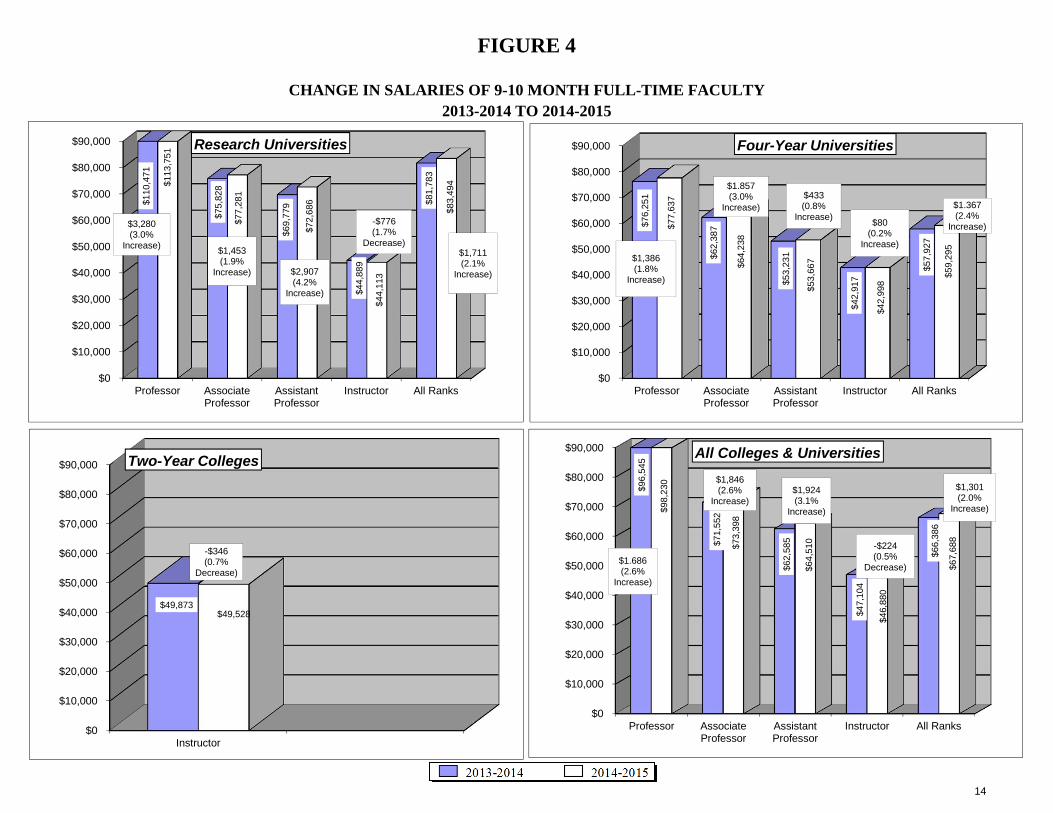
The average salary paid in the 25 institutions in 2014-2015 to 9-10 month employed faculty is $67,688. This represents an increase over 2013-2014 of $1,301 or 2.0%. As is true with other consolidated data in this report, the research universities exert heavy influence on this average, as they claim more than one-third of the faculty and their average is 39.6 percent higher than that of the four-year universities. Likewise, within the two-year tier, Tulsa Community College employs over one quarter of the total faculty and shows an average salary 17.1 percent above the mean. This influence is indicated by observing that the average salary for the research universities is $83,494 the average salary for four-year universities is $59,294, and the average salary for two-year colleges is $49,528. The 2014-2015 median of all institutions’ average salaries is $50,809.
Table 4 reveals that the research universities report a lower average salary for the ranks of professor employed on a 9-10 month contract when compared to the average shown in Table 1. The data for the research universities reflect a higher average monthly rate of pay for 11-12 month contract faculty (Table 6) than average monthly salary rates for 9-10 month contract faculty. The same is true of the data for four-year universities and two-year colleges, which both reflect a higher average monthly salary rate of pay for 11-12 month contract faculty (Table 6) than average monthly salary rates for 9-10 month contract faculty at all ranks.
The number of full-time faculty employed on a 9-10 month contract in 2014-2015 is 4,472. This number represents 88.3percent of the total full-time faculty in the 25 institutions. In 2013-2014, the number was 4,468 or 87.6 percent of the total. In 2014-2015, four-year universities employ 91.2 percent of their full-time faculty on a 9-10 month basis. The two-year colleges employ 91.3 percent on a 9-10 month basis. The two research universities combined employ 84.1 percent of their full-time faculty on a 9-10 month basis.
11

TABLE 4
AVERAGE SALARIES PAID 9-10 MONTH FULL-TIME FACULTY 2014-2015
Institution
Academic Rank No. of 9-10mo. Faculty as %
of Total Faculty Professor Associate Professor Assistant Professor Instructor Average, All Ranks
Number Amount Number Amount Number Amount Number Amount Number Amount University of Oklahoma Oklahoma State University
339 227
112,811$ 115,154
264 247
75,028$ 79,690
263 208
71,694$ 73,940
139 86
41,959$ 47,594
1,005 768
81,930$ 82,146
Research Universities 566 113,751$ 511 77,281$ 471 72,686$ 225 44,113$ 1,773 83,494$ 84.1% University of Central Oklahoma 181 86,116$ 89 73,502$ 112 61,750$ 109 42,666$ 491 68,626 East Central University 56 72,142 18 56,177 44 50,199 48 42,178 156 55,258 Northeastern State University 61 73,723 62 60,209 89 51,504 74 41,456 296 56,160 Northwestern Oklahoma State University 18 66,971 9 59,939 23 54,287 30 41,758 80 53,079 Southeastern Oklahoma State University 52 78,001 29 71,599 25 62,031 13 40,127 118 63,855 Southwestern Oklahoma State University 34 77,902 38 62,716 45 48,801 70 48,545 187 56,824 Cameron University 40 71,810 31 61,067 64 50,953 47 40,158 182 54,466 Langston University 4 66,120 23 57,693 33 53,300 32 49,499 92 53,633 Oklahoma Panhandle State University 2 47,526 2 49,928 16 42,689 17 34,987 47 39,120 Rogers State University 17 64,736 18 58,191 30 50,186 22 40,771 87 52,711 University of Science & Arts 15 59,932 12 50,875 13 46,068 8 41,306 48 50,809 Regional Four-Year Universities 480 77,637$ 331 64,238$ 494 53,667$ 470 42,998$ 1,775 59,295$ 91.2% Carl Albert State College 48 43,190$ 48 43,190 Connors State College 43 43,819 43 43,819 Eastern Oklahoma State College 39 43,254 39 43,254 Murray State College 49 45,858 49 45,858 Northeastern Oklahoma A&M College 61 45,078 61 45,078 Northern Oklahoma College 96 48,536 96 48,536 Oklahoma City Community College 140 49,358 140 49,358 Redlands Community College 23 41,926 23 41,926 Rose State College 98 46,767 98 46,767 Seminole State College 31 43,845 31 43,845 Tulsa Community College 258 57,982 258 57,982 Western Oklahoma State College 38 44,397 38 44,397 Two-Year Colleges - -$ - -$ - -$ 924 49,528$ 924 49,528$ 91.3% All Colleges and Universities 1,046 98,230$ 842 73,398$ 965 64,510$ 1,619 46,880$ 4,472 67,688$ 88.3%
FY14 9-10mo Faculty as % of Total Faculty: 87.6%
Research University Tier Number of 9-10 month Faculty as Percent of Total 9-10 month Faculty: Average Salary Greater than Four-Year Tier by:
39.6% 40.8%
Two-Year College Tier TCC Number of Faculty as Percent of Two-Year: TCC Average Salary Above Mean:
27.9% 17.1%
All Colleges and Universities Median of All Institutions' Average Salaries: $ 50,809
12

2013-2014 2014-2015
FIGURE 3
CHANGE IN NUMBER OF 9-10 MONTH FULL-TIME FACULTY
2013-2014 TO 2014-2015
-
200
400
600
800
1,000
1,200
1,400
1,600
1,800
Professor Associate Professor
Assistant Professor
Instructor All Ranks
579 528 418 229
1,754
566 511
471 225
1,773
-13 (2.2%
Decrease -17
(3.2% Decrease)
53 (12.7%
Increase) -4
(1.7% Decrease)
19 (1.1%
Increase)
-
400
800
1,200
1,600
2,000
Professor Associate Professor
Assistant Professor
Instructor All Ranks
449 344 487
498
1,778
480
331
494 470
1,775
-18 (4.0%
Decrease) 7
(2.0% Increase)
11 (2.3%
Increase) -28 (5.6%
Decrease)
-28 (1.6%
Decrease)
-
200
400
600
800
1,000
Instructor
936 924
-12 (-1.3%
Decrease
-
500
1,000
1,500
2,000
2,500
3,000
3,500
4,000
4,500
Professor Associate Professor
Assistant Professor
Instructor All Ranks
1,028 872 905
1,663
4,468
1,046
842
965
1,619
4,472
-31 (3.0%
Decrease)
-10 (1.1%
Decrease)
64 (7.1%
Increase)
-44 (2.6% Decrease)
-21 (0.5%
Decrease)
Research Universities Four-Year Universities
Two-Year Colleges
All Colleges & Universities
13
2013-2014 2014-2015
FIGURE 4
CHANGE IN SALARIES OF 9-10 MONTH FULL-TIME FACULTY 2013-2014 TO 2014-2015
$0
$10,000
$20,000
$30,000
$40,000
$50,000
$60,000
$70,000
$80,000
$90,000
Professor Associate Professor
Assistant Professor
Instructor All Ranks
$110
,471
$75,
828
$69,
779
$44,
889
$81,
783
$113
,751
$77,
281
$72,
686
$44,
113
$83,
494
$3,280 (3.0%
Increase) $1,453 (1.9%
Increase) $2,907 (4.2%
Increase)
-$776 (1.7%
Decrease) $1,711 (2.1%
Increase)
$0
$10,000
$20,000
$30,000
$40,000
$50,000
$60,000
$70,000
$80,000
$90,000
Professor Associate Professor
Assistant Professor
Instructor All Ranks
$76,
251
$62,
387
$53,
231
$42,
917
$57,
927
$77,
637
$64,
238
$53,
667
$42,
998
$59,
295
$1,386 (1.8%
Increase)
$1.857 (3.0%
Increase) $433 (0.8%
Increase) $80 (0.2%
Increase)
$1.367 (2.4%
Increase)
$0
$10,000
$20,000
$30,000
$40,000
$50,000
$60,000
$70,000
$80,000
$90,000
Instructor
$49,873 $49,528
-$346 (0.7%
Decrease)
$0
$10,000
$20,000
$30,000
$40,000
$50,000
$60,000
$70,000
$80,000
$90,000
Professor Associate Professor
Assistant Professor
Instructor All Ranks
$96,
545
$71,
552
$62,
585
$47,
104
$66,
386
$98,
230
$73,
398
$64,
510
$46,
880
$67,
688
$1.686 (2.6%
Increase)
$1,846 (2.6%
Increase) $1,924 (3.1%
Increase)
-$224 (0.5%
Decrease)
$1,301 (2.0%
Increase)
Research Universities Four-Year Universities
Two-Year Colleges All Colleges & Universities
14

TABLE 5
Table 5 presents the average fringe benefits on a 9-10 month basis paid to or on behalf of all 9-10 month full-time faculty by all 25 colleges and universities in The Oklahoma State System of Higher Education. The average fringe benefits paid for 2014-2015 is $23,889, an increase over 2013-2014 of $356 or 1.5 percent.
Fringe benefits as a percent of average salaries may be computed from the data in Tables 4 and 5. For all institutions, 2014-2015 fringe benefits are 35.1 percent of the average salary; compared to 35.5 percent in 2013-2014. For the research universities, four-year universities, and two-year colleges, the fringe benefits for 2014-2015 as a percent of average salaries are 33.9 percent, 34.2percent, and 44.3 percent, respectively. Comparative percentages for 2013-2014 were 34.0 percent, 34.7 percent, and 44.5 percent, respectively.
Retirement plan payments are the largest fringe benefit for all institutions combined. 2014-2015 payments comprise 50.0 percent of the average total fringe benefits for the State System, a slight decrease from the 50.6 percent in 2013-2014. For the research universities, four-year universities, and two-year colleges, retirement plan payments are 56.1 percent, 42.3 percent, and 48.7 percent, respectively, of the total average fringe benefits. Comparable 2013-2014 figures were 56.8 percent, 42.5 percent, and 49.9 percent, respectively (see Figure 5).
Social security taxes are the second largest fringe benefit paid by institutions and are required by law, as are unemployment compensation and worker’s compensation payments.
All institutions provide medical and life insurance benefits and 20 institutions provide other fringe benefits not specifically identified.
15

TABLE 5
AVERAGE STAFF BENEFITS PAID 9-10 MONTH FULL-TIME FACULTY 2014-2015
Institution Number of
Faculty Retirement Plan Medical
Dental Plan
Social Security
Taxes Unemployment Compensation
Group Life Insurance
Workers' Compensation Other Total
Benefits as % of Salary
FY14 Benefits as % of Salary
OU OSU
1,005 768
$17,668 13,527
$5,327 5,403
$5,974 6,041
$33 57
$111 507
$819 592
$2 29,934 26,127
Research Universities 1,773 $15,874 $5,360 $6,003 $43 $283 $721 $1 $28,285 33.9% 34.0%
UCO 491 $4,865 $5,664 $5,242 $434 $251 $532 $98 17,086 ECU 156 10,084 6,482 4,227 449 18 746 86 22,092 NSU 286 8,890 5,885 4,292 149 348 800 208 20,572 NWOSU 80 10,003 6,366 4,061 170 204 584 177 21,565 SEOSU 118 11,554 6,070 4,893 82 221 888 186 23,894 SWOSU 187 13,187 6,366 4,347 150 218 1,136 627 26,031 Cameron 182 10,234 5,916 4,167 109 577 542 242 21,787 Langston 92 9,670 5,897 3,325 170 379 547 1,019 21,007 OPSU 47 7,743 6,794 2,988 170 318 269 191 18,473 RSU 87 10,159 6,180 2,154 187 245 290 73 19,288 USAO 49 5,744 6,377 3,887 187 163 518 193 17,069 Four-Year Universities 1,775 $8,685 $6,017 $4,371 $251 $278 $666 $246 $20,514 34.6% 34.7%
CASC 48 $8,462 $6,397 $2,992 $170 $198 $69 $69 18,357 CSC 43 8,895 5,896 3,352 131 294 271 214 19,053 EOSC 41 8,864 6,290 3,212 187 304 1,174 20,031 MSC 49 7,534 6,366 3,508 225 177 468 18,278 NEOAMC 61 9,156 6,382 2,795 - 387 625 221 19,566 NOC 96 9,989 6,866 3,713 187 186 259 75 21,275 OCCC 140 10,854 7,695 3,776 79 231 474 173 23,282 REDLANDS 23 8,700 6,866 3,207 419 74 440 166 19,872 ROSE 98 10,993 6,852 3,577 149 112 304 396 22,383 SSC 31 10,827 6,877 3,354 165 168 272 68 21,731 TCC 258 13,130 6,173 4,280 350 192 450 24,575 WOSC 38 9,029 6,256 2,753 101 171 1,100 69 19,479 Two-Year Colleges 926 $10,693 $6,619 $3,654 $102 $250 $383 $239 $21,941 44.3% 44.5%
All Colleges & Universities 4,474 $11,950 $5,881 $4,869 $138 $274 $629 $147 $23,889 35.3% 35.5% FY14 Total Benefits $23,533 FY2015 Dollar and Percent Increase in Total Benefits $356 1.5%
16

FY 2013-2014 FY 2014-2015Other
$147 (0.6%)
Retirement$11,950 (50.0%)
UnemploymentCompensation$138 (0,6%)
Medical/Dental$5,881 (24.6%)
Worker sCompensation$629 (2.6%)
Social Security$4,869 (20.4%)
Group Life$274 (1.1%)
FIGURE 5
CHANGE IN AVERAGE BENEFITS PAID TO 9-10 MONTH FULL-TIME FACULTY ALL INSTITUTIONS
2013-2014 TO 2014-2015
Group Liability Other$289 (1.2%) $162 (0.7%)
Social Security $4,777 (20.3%)
Worker's Compensation $604 (2.+%)
Retirement $11,919 (50.6%)
Medical/Dental $5,595 (24.2%)
Unemploymen t Compensation
$108 (0.5%)
'
RETIREMENT PLAN PAYMENTS - PERCENT OF TOTAL BENEFITS BY TIER FY14 FY15
Research Universities 56.8% 56.1% Four-Year Universities 42.5% 42.3% Two-Year Colleges 49.9% 48.7%
17

This page is intentionally left blank.
TABLE 6
Table 6 presents the average salaries and the number of full-time faculty employed in the 25 institutions on an 11-12 month basis only.
The average salary paid in the 25 institutions in 2014-2015 to 11-12 month employed faculty is $94,143, an increase over 2013-2014 of $5,291 or 6.0 percent. The average 11-12 month salary for research universities is $111,653; the average for four-year universities is $77,215; and the average for two-year colleges is $60,185. The 2014-2015 median of the average salaries for 22 institutions reporting 11-12 month full-time faculty is $62,705.
The number of full-time faculty employed on an 11-12 month contract basis is 595 or 11.8 percent of the total full-time faculty in the 25 institutions. In 2013-2014 the number was 632 or 12.4 percent. The percent of faculty employed on an 11-12 month basis is 15.9 percent at research universities; 8.9 percent at four-year universities, and 18.7 percent at two-year colleges. The number of full-time faculty employed on an 11-12 month basis varies by institution. For example, nine institutions employ five or less faculty on an 11-12 month basis; while over 34.8 percent of Langston University’s faculty (49 out of 141) is employed on an 11-12 month basis.
18

TABLE 6
AVERAGE SALARIES PAID 11-12 MONTH FULL-TIME FACULTY 2014-2015
Institution
Academic Rank No. of 11-12mo. Faculty as %
of Total Faculty Professor Associate Professor Assistant Professor Instructor Average, All Ranks
Number Amount Number Amount Number Amount Number Amount Number Amount
University of Oklahoma Oklahoma State University
83 60
160,693$ 163,074
34 38
114,018$ 95,404
12 6
83,087$ 82,681
8 95
66,905$ 51,189
137 209
137,261$ 94,261
Research Universities 143 161,692$ 72 104,194$ 18 82,952$ 103 52,410$ 336 111,653$ 15.9%
University of Central Oklahoma East Central University Northeastern State University Northwestern Oklahoma State University Southeastern Oklahoma State University Southwestern Oklahoma State University Cameron University Langston University Oklahoma Panhandle State University Rogers State University University of Science & Arts
-2
12 2 5 4
2 1 7 2
89,052 103,007 95,925
123,463 144,329
137,500 32,961 72,610 78,205
-1 4 1
8 3
17 2 5
71,253 95,184 90,000
108,837 54,945 70,219 61,055 62,425
-1
14
3 11
22 1 3 1
73,270 83,022
74,586 99,750
61,618 37,235 55,568 63,360
-8 5 4 4 3 2 8 2 1
59,074 65,395 49,248 59,994 55,463 44,930 51,844 48,950 40,000
-12 35 7
12 26 5
49 6
16 3
66,268 88,746 68,406 90,087
104,294 50,939 66,103 36,040 72,714 73,257
Regional Four-Year Universities 37 101,981$ 41 78,182$ 56 74,634$ 37 55,282$ 171 77,215$ 8.8%
Carl Albert State College Connors State College Eastern Oklahoma State College Murray State College Northeastern Oklahoma A&M College Northern Oklahoma College Oklahoma City Community College Redlands Community College Rose State College Seminole State College Tulsa Community College Western Oklahoma State College
5 3
8
3 3 4 6 5
48 3
53,590$ 46,635
57,271
57,332 59,971 39,323 58,186 52,204 65,439 56,616
5 3
8
3 3 4 6 5
48 3
53,590 46,635
57,271
57,332 59,971 39,323 58,186 52,204 65,439 56,616
Two-Year Colleges - -$ - -$ - -$ 88 60,185$ 88 60,185$ 8.7%
All Colleges and Universities 180 149,418$ 113 94,756$ 74 76,657$ 228 55,877$ 595 94,143$ 11.7% FY14 11-12mo Faculty as % of Total Faculty: 12.4%
All Colleges and Universities Median of All Institutions' Average Salaries: $ 62,705
19

2013-2014 2014-2015
FIGURE 6
CHANGE IN NUMBER OF 11-12 MONTH FULL-TIME FACULTY 2013-2014 TO 2014-2015
-
50
100
150
200
250
300
Professor Associate Professor
Assistant Professor
Instructor All Ranks
142
72
33
102
349
143
72
18
103
336
1 (0.7%
Increase)
(No Change
-15 (45.5%
Decrease)
1 1.0%
Increase
-13 (3.7%
Decrease)
-
25
50
75
100
125
150
175
200
Professor Associate Professor
Assistant Professor
Instructor All Ranks
36 46
57
39
178
37 41
56
37
171
1 (2.8%
Increase)
-5 (10.9%
Decrease)
-1 (1.8%
(Decrease) -2
(5.1% Decrease)
-7 (3.9%
Decrease)
-
20
40
60
80
100
120
Instructor
105
88
-17 (16.2%
Decrease)
-
100
200
300
400
500
Professor Associate Professor
Assistant Professor
Instructor All Ranks
178 118
90
246
632
180
113
74
228
595
2 (1.1%
Increase) -5
(4.2% Decrease -16
(17.8% Decrease)
-18 (7.3%
Decrease)
37 (5.9%
Decrease)
Research Universities Four-Year Universities
Two-Year Colleges All Colleges & Universities
20

2013-2014 2014-2015
FIGURE 7
CHANGE IN SALARIES OF 11-12 MONTH FULL-TIME FACULTY 2013-2014 TO 2014-2015
$0
$20,000
$40,000
$60,000
$80,000
$100,000
$120,000
Professor Associate Professor
Assistant Professor
Instructor All Ranks
$153
,501
$97,
082
$77,
083
$50,
262
$104
,463
$161
,692
$104
,194
$82,
952
$52,
410
$111
,653
$8,191 (5.3%
Increase)
$7,112 (7.3%
Increase) $5,869 7.6%
Increase)
$2,147 (4.3%
Increase) $7,190 (6.9%
Increase)
$0
$20,000
$40,000
$60,000
$80,000
$100,000
$120,000
Professor Associate Professor
Assistant Professor
Instructor All Ranks
$102
,630
$79,
983
$68,
786
$51,
427
$74,
721
$101
,981
$78,
182
$74,
634
$55,
282 $7
7,21
5
-$649 (0.6%
Decrease)
-$1,800 (2.3%
Decrease) $5,847 (8.5%
Increase)
$3,855 (7.5%
Increase)
$2.494 (3.3%
Increase
$0
$20,000
$40,000
$60,000
$80,000
$100,000
$120,000
Instructor
$60,918 $60,185
-$733 (1.2%
Decrease)
$0
$20,000
$40,000
$60,000
$80,000
$100,000
$120,000
Professor Associate Professor
Assistant Professor
Instructor All Ranks
$143
,213
$90,
416
$71,
828
$54,
995
$88,
852
$149
,418
$94,
756
$76,
657
$55,
877
$94,
143
$6,206 (4.3%
Increase) $4,340 (4.8%
Increase) $4,828 (6.7%
Increase) $882 (1.6%
Increase)
$5,291 (6.0%
Increase)
Research Universities Four-Year Universities
Two-Year Colleges All Colleges & Universities
21
Table 7
Table 7 represents the 2014-2015 average fringe benefits on an 11-12 month basis to or on behalf of all 11-12 month full-time faculty by all 25 institutions in The Oklahoma State System of Higher Education. The average fringe benefit paid for 2014-2015 is $31,426 and represents a decrease of $1,616 or 5.4 percent.
Fringe benefits as a percent of average salaries may be computed from the data in Tables 6 and 7. For all institutions, 2014-2015 fringe benefits are 33.4 percent of the average salary, a decrease from 33.6 percent in 2013-2014. For the research universities, four-year universities, and two-year colleges, the fringe benefits as a percent of average salaries are 33.5 percent, 32.9 percent, and 31.9 percent, respectively. Comparable 2013-2014 figures were 33.9 percent, 33.7 percent, and 35.6 percent, respectively.
Retirement plan payments are the largest fringe benefit for all institutions combined. Such payments comprise 57.9 percent of the average total fringe benefits for the State System for 2013-2013 as compared with 57.0 percent for 2013-2014. For the research universities, four-year universities, and two-year colleges, the payments are 57.4 percent, 56.2 percent, and 67.2 percent, respectively, of the total average fringe benefits. Comparable figures for 2013-2014 were 57.3 percent, 51.2 percent, and 61.3 percent respectively (see Figure 8).
Social security taxes are the second largest fringe benefit paid by institutions and are required by law, as are unemployment compensation and worker’s compensation payments.
All 22 institutions reporting 11-12 month full-time faculty provide medical and life insurance benefits. Nineteen institutions provide other fringe benefits not specifically identified.
22
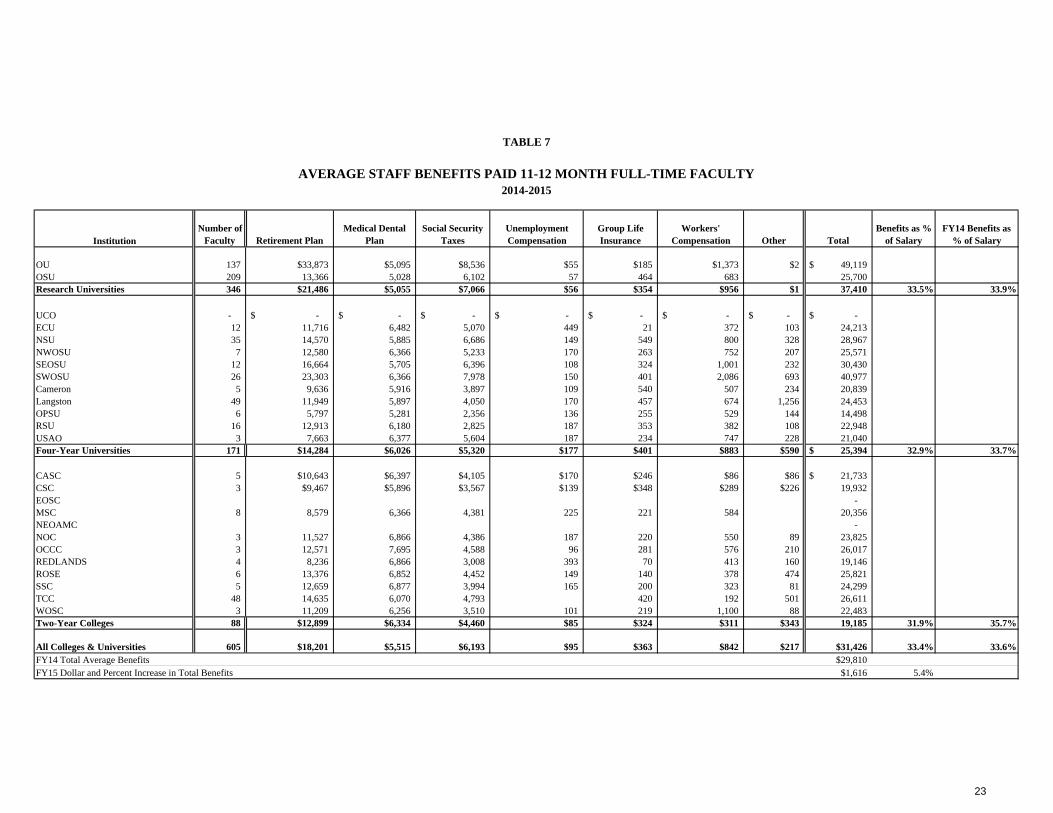
TABLE 7
AVERAGE STAFF BENEFITS PAID 11-12 MONTH FULL-TIME FACULTY 2014-2015
Institution Number of
Faculty Retirement Plan Medical Dental
Plan Social Security
Taxes Unemployment Compensation
Group Life Insurance
Workers' Compensation Other Total
Benefits as % of Salary
FY14 Benefits as % of Salary
OU OSU
137 209
$33,873 13,366
$5,095 5,028
$8,536 6,102
$55 57
$185 464
$1,373 683
$2 49,119$ 25,700
Research Universities 346 $21,486 $5,055 $7,066 $56 $354 $956 $1 37,410 33.5% 33.9%
UCO - -$ -$ -$ -$ -$ -$ -$ -$ ECU 12 11,716 6,482 5,070 449 21 372 103 24,213 NSU 35 14,570 5,885 6,686 149 549 800 328 28,967 NWOSU 7 12,580 6,366 5,233 170 263 752 207 25,571 SEOSU 12 16,664 5,705 6,396 108 324 1,001 232 30,430 SWOSU 26 23,303 6,366 7,978 150 401 2,086 693 40,977 Cameron 5 9,636 5,916 3,897 109 540 507 234 20,839 Langston 49 11,949 5,897 4,050 170 457 674 1,256 24,453 OPSU 6 5,797 5,281 2,356 136 255 529 144 14,498 RSU 16 12,913 6,180 2,825 187 353 382 108 22,948 USAO 3 7,663 6,377 5,604 187 234 747 228 21,040 Four-Year Universities 171 $14,284 $6,026 $5,320 $177 $401 $883 $590 25,394$ 32.9% 33.7%
CASC 5 $10,643 $6,397 $4,105 $170 $246 $86 $86 21,733$ CSC 3 $9,467 $5,896 $3,567 $139 $348 $289 $226 19,932 EOSC -MSC 8 8,579 6,366 4,381 225 221 584 20,356 NEOAMC -NOC 3 11,527 6,866 4,386 187 220 550 89 23,825 OCCC 3 12,571 7,695 4,588 96 281 576 210 26,017 REDLANDS 4 8,236 6,866 3,008 393 70 413 160 19,146 ROSE 6 13,376 6,852 4,452 149 140 378 474 25,821 SSC 5 12,659 6,877 3,994 165 200 323 81 24,299 TCC 48 14,635 6,070 4,793 420 192 501 26,611 WOSC 3 11,209 6,256 3,510 101 219 1,100 88 22,483 Two-Year Colleges 88 $12,899 $6,334 $4,460 $85 $324 $311 $343 19,185 31.9% 35.7%
All Colleges & Universities 605 $18,201 $5,515 $6,193 $95 $363 $842 $217 $31,426 33.4% 33.6% FY14 Total Average Benefits $29,810 FY15 Dollar and Percent Increase in Total Benefits $1,616 5.4%
23

FY 2013-2014 FY 2014-2015
Retirement$17,006(57.0%)
UnemploymentCompensation$125 (0.4%)
Medical/Detal$5,438 (18.2%)
Worker s Compensation$759 (2.5%)
Social Security$5,881 (19.7%)
Group Life$355 (1.2%)
Other$247 (0.8%)
Other$217 (0.7%)
Retirement$18,201(57.9%)
UnemploymentCompensation
$95 (0.3%)
Medical/Dental$5,515 (17.6%)
Worker sCompensation$842 (2.7%)
Social Security$6193 (19.7%)
Group Life$353 (1.2%)
FIGURE 8
CHANGE IN AVERAGE BENEFITS PAID TO 11-12 MONTH FULL-TIME FACULTY ALL INSTITUTIONS
2013-2014 TO 2014-2015
' '
RETIREMENT PLAN PAYMENTS - PERCENT OF TOTAL BENEFITS BY TIER FY14 FY15
Comprehensive Universities 57.3% 57.4% Four-Year Universities 51.2% 56.2% Two-Year Colleges 61.3% 67.2%
24

This page is intentionally left blank.

TABLE 8
Table 8 presents the 2014-2015 average total compensation paid to the full-time faculty on both 9-10 month and 11-12 month contracts by all 25 institutions in The Oklahoma State System of Higher Education.
Average total compensation for 9-10 month faculty in 2014-2015 is $91,577 compared with $89,940 in 2013-2014, and represents an increase of $1,637 or 1.8 percent. The 2014-2015 average for research universities is $111,779, for four-year universities, $79,808, and for two-year colleges, $71,469. The median of the average total compensation for all 25 institutions reporting is $71,999.
Average total compensation for 11-12 month faculty in 2014-2015 is $125,569 compared with $118,662 in 2013-2014, and represents an increase of $6,907 or 5.8 percent. The 2014-2015 average for research universities is $149,062, for four-year universities, $102,608, and for two-year colleges, $79,370. The median of the average total compensation of the 22 institutions reporting 11-12 month faculty is $84,998.
25

TABLE 8 AVERAGE TOTAL COMPENSATION PAID
9-10 MONTH AND 11-12 MONTH FULL-TIME FACULTY 2014-2015
Institution
9-10 Month 11-12 Month AverageSalaries
Average StaffBenefits
Average TotalCompensation
AverageSalaries
Average StaffBenefits
Average TotalCompensation
University of Oklahoma Oklahoma State University
$ 81,930 82,146
29,934$ 26,127
111,864$ 108,273
$ 137,261 94,261
49,119$ 25,700
186,380$ 119,961
Research Universities $ 83,494 28,285$ 111,779$ $ 111,653 37,410$ 149,062$
University of Central Oklahoma East Central University Northeastern State University Northwestern Oklahoma State University Southeastern Oklahoma State University Southwestern Oklahoma State University Cameron University Langston University Oklahoma Panhandle State University Rogers State University University of Science & Arts of Oklahoma
$ 68,626 55,258 56,160 53,079 63,855 56,824 54,466 53,633 39,120 52,711 50,809
17,086$ 22,092 20,572 21,565 23,894 26,031 21,787 21,007 18,473 19,288 17,069
85,712$ 77,350 76,732 74,644 87,749 82,855 76,253 74,640 57,593 71,999 67,878
$ -66,268 88,746 68,406 90,087
104,294 50,939 66,103 36,040 72,714 73,257
-$ 24,213 28,967 25,571 30,430 40,977 20,839 24,453 14,498 22,948 21,040
-$ 90,481
117,713 93,977
120,517 145,271
71,778 90,556 50,538 95,662 94,297
Four-Year Universities $ 59,295 20,514$ 79,809$ $ 77,215 25,394$ 102,608$
Carl Albert State College Connors State College Eastern Oklahoma State College Murray State College Northeastern Oklahoma A&M College Northern Oklahoma College Oklahoma City Community College Redlands Community College Rose State College Seminole State College Tulsa Community College Western Oklahoma State College
$ 43,190 43,819 43,254 45,858 45,078 48,536 49,358 41,926 46,767 43,845 57,982 44,397
18,357$ 19,053 20,031 18,278 19,566 21,275 23,282 19,872 22,383 21,731 24,575 19,479
61,547$ 62,872 63,285 64,136 64,644 69,811 72,640 61,798 69,150 65,576 82,557 63,876
$ 53,590 46,635
-57,271
-57,332 59,971 39,323 58,186 52,204 65,439 56,616
21,733$ 19,932
-20,356
-23,825 26,017 19,146 25,821 24,299 26,611 22,483
75,323$ 66,567
-77,627
-81,157 85,988 58,469 84,007 76,503 92,050 79,099
Two-Year Colleges $ 49,528 21,941$ 71,469$ $ 60,185 19,185$ 79,370$ All Colleges & Universities $ 67,688 23,889$ 91,577$ $ 94,143 31,426$ 125,569$ Median Average Total Compensation: 71,999$ 84,998$
Average Total Compensation, FY14:
FY15 Dollar Increase
89,940$ 1,637$
1.8%
118,662$ 6,907$
5.8% FY15 Percent Increase
26

$83,494
FIGURE 9
AVERAGE TOTAL COMPENSATION PAID 9-10 MONTH & 11-12 MONTH FULL-TIME FACULTY 2013-2014 COMPARED TO 2014-2015
9-10 MONTH FULL-TIME FACULTY
11-12 MONTH FULL-TIME FACULTY
$-
$10,000
$20,000
$30,000
$40,000
$50,000
$60,000
$70,000
$80,000
2013-2014 2014-2015
$76,420
$27,805 $28,285
Total: $111,779
Total: $109,588
$-
$10,000
$20,000
$30,000
$40,000
$50,000
$60,000
$70,000
$80,000
2013-2014 2014-2015
$57,927 $59,295
$20,083 $20,514
Total: $79,808
Total: $78,010
$-
$10,000
$20,000
$30,000
$40,000
$50,000
$60,000
$70,000
$80,000
2013-2014 2014-2015
$49,873 $49,528
$22,179 $21,941
Total: $71,469
Total: $72,052
$-
$10,000
$20,000
$30,000
$40,000
$50,000
$60,000
$70,000
$80,000
2013-2014 2014-2015
$66,386 $67,688
$23,553 $23,889
Total: $91,577
Total: $89,940
$-
$20,000
$40,000
$60,000
$80,000
$100,000
2013-2014 2014-2015
$104,463 $111,653
$33,413 $37,410
Total: $149,062
Total: $136,864
$-
$10,000
$20,000
$30,000
$40,000
$50,000
$60,000
$70,000
$80,000
$90,000
$100,000
2013-2014 2014-2015
$74,721 $77,215
$25,210 $25,394
Salary Benefits
Total: $102,608
Total: $99,931
$-
$10,000
$20,000
$30,000
$40,000
$50,000
$60,000
$70,000
$80,000
$90,000
$100,000
2013-2014 2014-2015
$60,918 $60,185
$21,761 $19,185
Total: $79,370Total:
$82,000
$84,000
$86,000
$88,000
$90,000
$92,000
$94,000
$96,000
$98,000
$100,000
2013-2014 2014-2015
$88,852
$94,143
$29,810
$31,426
Total: $125,569
Total: $118,662
Research Universities Four-Year
Universities Two-Year Colleges
All Colleges & Universities
Research Universities Four-Year
Universities Two-Year Colleges
All Colleges & Universities
27

This page is intentionally left blank.

TABLE 9
Table 9 presents the highest and lowest salaries paid to academic deans and full-time faculty classified both by contract period and by type of institution. The number of individuals and the number of institutions in each classification are also presented.
The average (mean) salaries for academic deans employed on an 11-12 month contract basis in 2014-2015 for the three classifications of institutions are: research universities, $242,173; four-year universities, $113,776; and two-year colleges, $68,352 For 2013-2014 the average salaries were $226,185, $111,442, and $73,292, respectively. Average salaries for academic deans in 2014-2015, increased 7.1 percent at the research universities, and 2.1 percent at the regional universities and decreased by 6.7 at the two-year colleges.
The highest salary paid academic deans in the 25 institutions on an 11-12 month contract basis in 2014-2015 is $378,446 for research universities, $201,900 for four-year universities, and $96,304 for two-year colleges. The highest salary for these categories in 2013-2014 was $371,025, $199,614, and $96.304 for the research universities, four-year universities, and two-year colleges, respectively. The 2014-2015 lowest salary for academic deans is $161,118 for research universities, $55,709 for four-year universities, and $50,140 for two-year colleges. The lowest salaries for these categories in 2013-2014, were $157,959; $68,567; and $55,000, respectively.
For full-time faculty on 9-10 month contracts in the state system, the highest salary paid in 2014-2015 is $298,863, compared to the same in 2013-2014. The lowest salary is $22,713, compared to 16,740 in 2013-2014.
For 2014-2015, the highest salary for a full-time faculty member employed on a 9-10 month contract basis by a four-year university is $129,380, the same as in 2013-2014. The lowest salary for a full-time faculty member employed on a 9-10 month contract basis by a four-year university in 2014-2015 is $15,479, compared to $13,390 in 2013-2014. For two-year colleges, the 2014-2015 high is $86,779 compared to the same in 2013-2014. Finally, the 2014-2015 low two-year college salary is $25,700, compared to the same in 2013-2014.
The highest salary paid an 11-12 month contract full-time faculty member in the 25 institutions in 2014-2015 is $425,004, compared to $350,000 in 2013-2014. The lowest salary in 2014-2015 is $8,773 compared to $20,403 in 2013-2014. For 2014-2015, the highest salary for a full-time faculty member employed on an 11-12 month contract basis by a four-year university is $163,392, the same as in 2013-2014; the lowest salary in 2013-2014 is $32,961, compared to $32,000 in 2013-2014. For 2014-2015, the highest salary for a full-time faculty member employed on an 11-12 month contract basis by a two-year college is $85,971, as compared to the same in 2013-2014; the lowest salary is $30,000 compared to $32,689 in 2013-2014. These data exclude academic deans.
28

TABLE 9
RANGE OF SALARIES PAID 9-10 AND 11-12 MONTH ACADEMIC DEANS AND FULL-TIME FACULTY
2014-2015
Rank
9-10 Month 11-12 Month
Research Universities
Four-Year Universities
Two-Year Colleges
Research Universities
Four-Year Universities
Two-Year Colleges
Academic Deans
Number: Institutions Individuals
Salary: Highest (FY15) FY14 High Lowest (FY15) FY14 Low Average (FY15) FY14 Average
% Change in Avg Salary
1 1
105,975 -
1 1
64,515 64,515
--
57,433
2 21
$378,446 $371,025
10 38
$201,900 $199,614
7 33
$96,304 $96,304
105,975 -
64,515 64,515 50,140
161,118 157,959
55,709 68,566
50,140 55,000
105,975 -
64,515 64,515 53,222
242,173 226,185
113,776 111,442
68,352 73,292
100.0% 0.0% -100.0% 7.1% 2.1% -6.7%
Professor
Number: Institutions 2 11 2 9 Individuals 566 470 145 37
Salary: Highest $298,863 $129,380 $425,004 $163,392 Lowest 52,530 44,880 65,670 32,961 Average 113,751 69,253 161,678 98,576
Associate Professor
Number: Institutions 2 11 2 9 Individuals 511 341 72 44
Salary: Highest $176,175 $121,000 $246,640 $115,796 Lowest 47,322 41,706 47,498 50,715 Average 75,962 59,303 104,194 77,954
29
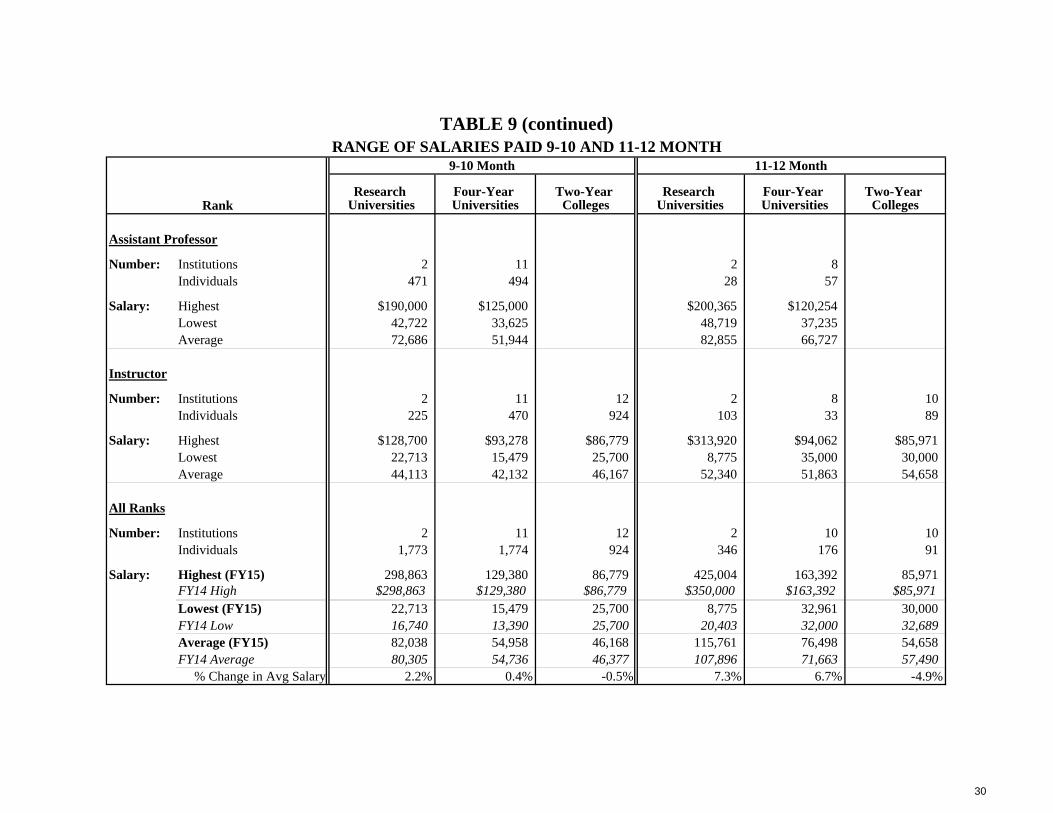
TABLE 9 (continued) RANGE OF SALARIES PAID 9-10 AND 11-12 MONTH
Rank
9-10 Month 11-12 Month
Research Universities
Four-Year Universities
Two-Year Colleges
Research Universities
Four-Year Universities
Two-Year Colleges
Assistant Professor
Number: Institutions 2 11 2 8 Individuals 471 494 28 57
Salary: Highest $190,000 $125,000 $200,365 $120,254 Lowest 42,722 33,625 48,719 37,235 Average 72,686 51,944 82,855 66,727
Instructor
Number: Institutions 2 11 12 2 8 10 Individuals 225 470 924 103 33 89
Salary: Highest $128,700 $93,278 $86,779 $313,920 $94,062 $85,971 Lowest 22,713 15,479 25,700 8,775 35,000 30,000 Average 44,113 42,132 46,167 52,340 51,863 54,658
All Ranks
Number: Institutions Individuals
Salary: Highest (FY15) FY14 High Lowest (FY15) FY14 Low Average (FY15) FY14 Average
% Change in Avg Salary
2 1,773
298,863 $298,863
11 1,774
129,380 $129,380
12 924
86,779 $86,779
2 346
425,004 $350,000
10 176
163,392 $163,392
10 91
85,971 $85,971
22,713 16,740
15,479 13,390
25,700 25,700
8,775 20,403
32,961 32,000
30,000 32,689
82,038 80,305
54,958 54,736
46,168 46,377
115,761 107,896
76,498 71,663
54,658 57,490
2.2% 0.4% -0.5% 7.3% 6.7% -4.9%
30
TABLE 10
Table 10 presents income earned by full-time faculty members from activities that are specifically authorized by the institution in addition to primary employment duties. Income from summer-term employment for faculty employed on a 9-10 month contract basis is excluded from Table 10. These data are presented as “actual” for the completed year of 2013-2014 and “estimated” for the current year, 2014-2015.
The “estimated” average mean income in the 25 institutions from extra teaching assignments and approved non-institutional employment for 2014-2015 is $5,332 for those faculty members earning such income. The “actual” figure for 2013-2014 was $4,854. In 2014-2015, the median of the “estimated” averages is $4,651; in 2014-2015, the median of the “actual” averages was $4,428. In 2014-2015, the highest “estimated” average income from extra assignments is $15,000; in 2013-2014, the highest “actual” average was $13,000.
31

TABLE 10
ADDITIONAL INCOME FROM EXTRA TEACHING ASSIGNMENTS AND APPROVED NONINSTITUTIONAL EMPLOYMENT
2013-2014 AND 2014-2015
Institution
Income from Extra Assignments 2013-2014 ACTUAL 2014-2015 ESTIMATED
Number of Faculty
Average Income
Number of Faculty
Average Income
University of Oklahoma Oklahoma State University
414 141
$8,151 $2,190
415 141
$8,084 $2,190
Research Universities 555 $6,637 556 $6,589 University of Central Oklahoma 523 $1,576 373 $1,863 East Central University 157 2,750 53 539 Northeastern State University 70 2,096 194 8,517 Northwestern Oklahoma State University 71 3,073 64 2,149 Southeastern Oklahoma State University 88 5,001 85 4,891 Southwestern Oklahoma State University 135 5,348 130 5,250 Cameron University 148 2,778 145 2,413 Langston University 56 5,549 63 4,546 Oklahoma Panhandle State University - -Rogers State University 74 3,245 70 3,263 University of Science & Arts of Oklahoma 26 2,743 31 3,180 Four-Year Universities 1,348 $2,491 1,208 $3,484 Carl Albert State College 57 7,446 55 5,161 Connors State College 59 2,800 51 2,600 Eastern Oklahoma State College Murray State College 32 4,330 34 3,748 Northeastern Oklahoma A&M College 85 1,387 80 1,397 Northern Oklahoma College 71 4,495 74 5,144 Oklahoma City Community College 140 12,311 140 15,000 Redlands Community College 23 5,188 23 4,651 Rose State College 113 8,652 105 5,438 Seminole State College 38 5,394 31 6,386 Tulsa Community College 234 8,655 222 8,190 Western Oklahoma State College 28 4,570 28 2,904 Two-Year Colleges 880 $7,348 843 $7,151 All Colleges & Universities 2,783 $4,854 2,607 $5,332
Median of Averages: $ 4,570 $ 4,651 Highest Average: $ 12,311 $ 15,000
32
0
1000
2000
3000
4000
5000
6000
7000
8000
2013-2014 2014-2015 2013-2014 2014-2015 2013-2014 2014-2015 2013-2014 2014-2015
26.4% 26.4% 67.7% 62.9%
84.5% 83.5%
54.6% 51.7%
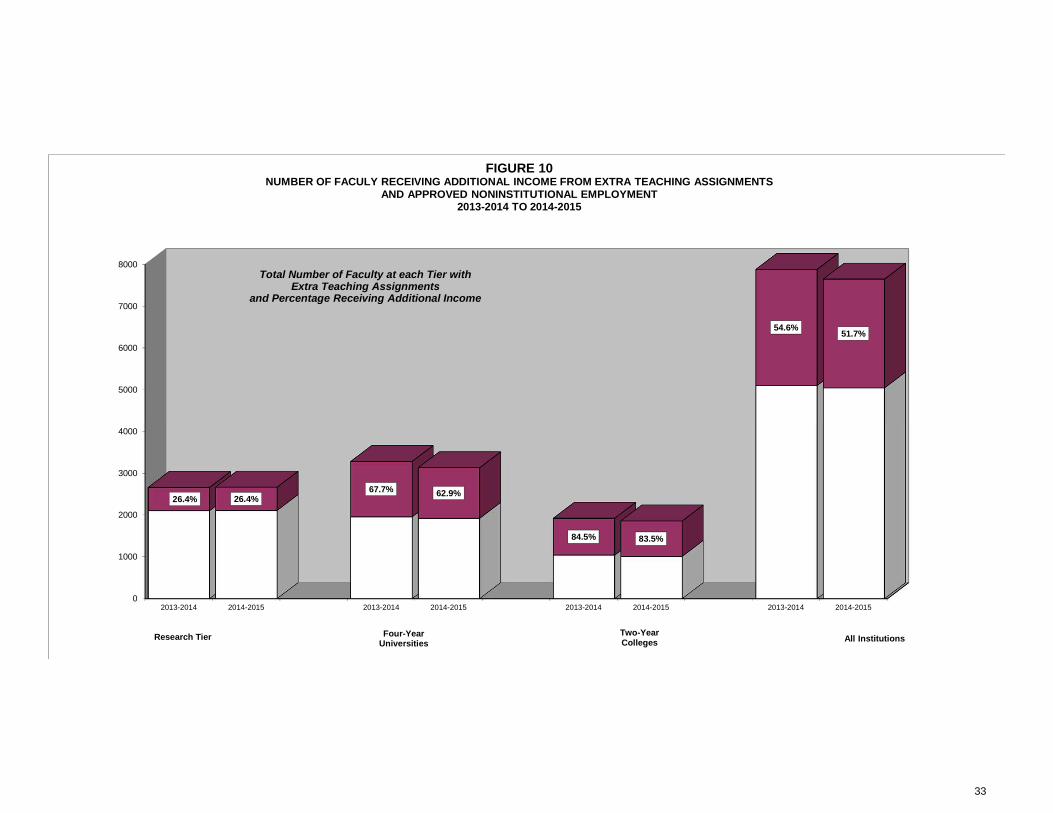
FIGURE 10 NUMBER OF FACULY RECEIVING ADDITIONAL INCOME FROM EXTRA TEACHING ASSIGNMENTS
AND APPROVED NONINSTITUTIONAL EMPLOYMENT 2013-2014 TO 2014-2015
Research Tier Four-Year Universities
Two-Year Colleges All Institutions
Total Number of Faculty at each Tier withExtra Teaching Assignments
and Percentage Receiving Additional Income
33

TABLE 11
Table 11 presents 2014-2015 salary data for selected administrative positions on an 11-12 month employment period by type of institution. The positions selected for inclusion are those most commonly staffed at higher education institutions. The average amount of fringe benefits is also included in the table. In some institutions, one individual may hold two or more administrative titles. In these instances, the salary has been reported under that heading most commonly associated with the highest salary.
Research University presidents’ salaries average $398,604 in 2014-2015, up from $357,453 in 2013-2014. Fringe benefits for the president average $101,996.
Four-year university presidents receive an average salary of $200,780 in 2014-2015, up from $184,177 in 2013-2014 average salary. The highest salary for a four-year university president in 2014-2015 is $279,000, compared to $232,000 in 2013-2014. Fringe benefits average $51,037 or 25.4 percent of the average salary.
Two-year college presidents receive an average salary of $175,861 in 2014-2015, down slightly from the 2013-2014 average salary of $171,012. The highest salary for a two-year college president in 2014-2015 is $270,000, compared to $274,932 in 2013-2014. Fringe benefits average $58,792 or 33.4 percent of the average salary (see Figure 11).
College and university vice presidents’ salary information include those positions surveyed in the Administrative Compensation Survey from the College and University Personnel Association (CUPA). These positions surveyed at the Vice President level are: Chief Academic Officer, Chief Business Officer, Chief Development Officer, and Chief Student Affairs Officer.
34

TABLE 11 11-12 MONTH AVERAGE SALARIES OF SELECTED ADMINISTRATIVE POSITIONS
2014-2015
Position
Type of Institution
Position
Type of Institution
Research Universities
Four-Year Universities
Two-Year Colleges
Research Universities
Four-Year Universities
Two-Year Colleges
President Chief Development Officer
Number: Institutions 2 11 12 Number: Institutions 2 11 12 Individuals 2 11 12 Individuals 1 6 5
Salary: Highest $425,004 $279,000 $270,000 Salary: Highest $233,075 $117,000 $115,000 Lowest 372,203 148,665 125,000 Lowest 233,075 80,000 47,708 Average 398,604 200,780 175,861 Average 233,075 96,281 79,357
Fringe Benefits: Highest $141,728 $71,298 $122,701 Fringe Benefits: Highest $94,012 $34,733 $43,622 Lowest 62,263 34,383 16,944 Lowest 94,012 23,379 20,075 Average 101,996 51,037 58,792 Average 94,012 28,914 31,517
Chief Academic Officer Chief Student Affairs Officer
Number: Institutions 2 11 12 Number: Institutions 2 11 12 Individuals 2 11 11 Individuals 2 9 9
Salary: Highest $320,040 $160,000 $120,821 Salary: Highest $225,000 $132,000 $114,240 Lowest 295,800 109,880 77,500 Lowest 196,392 84,640 59,000 Average 307,920 141,107 98,660 Average 210,696 108,336 85,218
Fringe Benefits: Highest $59,989 $51,912 $48,800 Fringe Benefits: Highest $91,143 $46,297 $47,018 Lowest 50,261 27,522 - Lowest 59,484 - 22,870 Average 55,125 40,514 32,581 Average 75,314 30,369 32,295
Chief Business Officer
Number: Institutions 2 11 12
Director of Institutional Research
2 11 12Number: Institutions Individuals 2 11 12 Individuals 2 7 9
Salary: Highest $311,000 $169,950 $110,824 Salary: Highest $144,780 $97,550 $87,172 Lowest 311,000 75,000 75,500 Lowest 121,631 41,210 35,700 Average 311,000 124,039 95,116 Average 133,206 72,188 59,178
Fringe Benefits: Highest $121,697 $54,347 $44,919 Fringe Benefits: Highest $47,510 $33,353 $37,629 Lowest 121,697 21,450 27,652 Lowest 45,655 15,370 16,642 Average 121,697 37,712 34,695 Average 46,583 25,337 25,260
35

TABLE 11 (cont.)
Position
Type of Institution
Position
Type of Institution
Research Universities
Four-Year Universities
Two-Year Colleges
Research Universities
Four-Year Universities
Two-Year Colleges
Chief Public Relations Officer Chief Admissions Officer
Number: Institutions 2 11 12 Number: Institutions 2 11 12 Individuals 2 10 9 Individuals - 7 2
Salary: Highest $218,840 $107,000 $138,185 Salary: Highest $97,885 $86,000 Lowest 150,720 45,000 31,000 Lowest 64,673 48,203 Average 184,780 73,260 55,889 Average 81,819 71,114
Fringe Benefits: Highest $88,954 $32,006 $49,412 Fringe Benefits: Highest $0 $34,160 $31,904 Lowest 33,999 14,283 15,878 Lowest - 22,709 24,858 Average 61,477 24,268 24,037 Average - 28,492 29,080
Director of Libraries Registrar
Number: Institutions 2 11 12 Number: Institutions 2 11 12 Individuals 2 11 10 Individuals 2 9 9
Salary: Highest $280,500 $89,897 $70,380 Salary: Highest $165,335 $88,987 $62,596 Lowest 168,576 58,710 41,263 Lowest 124,896 53,030 40,000 Average 224,538 74,453 54,193 Average 145,116 67,329 50,922
Fringe Benefits: Highest $81,073 $30,958 $31,392 Fringe Benefits: Highest $70,291 $26,947 $29,576 Lowest 53,031 20,261 18,206 Lowest 42,897 18,906 14,949 Average 67,052 25,729 23,315 Average 56,594 23,801 22,012
Director of Purchasing Chief Physical Plant & Facilities
Number: Institutions 2 11 12 Number: Institutions 2 11 12 Individuals 2 7 4 Individuals 2 10 11
Salary: Highest $166,801 $68,000 $73,536 Salary: Highest $168,972 $90,640 $87,000 Lowest 110,940 40,000 28,909 Lowest 157,820 63,440 35,000 Average 138,871 51,969 48,374 Average 163,396 - 60,221
Fringe Benefits: Highest $58,050 $23,632 $30,140 Fringe Benefits: Highest $55,584 $35,973 $42,262 Lowest 39,283 10,960 13,912 Lowest 36,494 21,513 18,593 Average 48,667 18,956 22,163 Average 46,039 27,526 25,171
36

TABLE 11 (cont.)
Position
Type of Institution
Position
Type of Institution Research
Universities Four-Year Universities
Two-Year Colleges
Research Universities
Four-Year Universities
Two-Year Colleges
Chief Budgeting Officer Director of Campus Security
Number: Institutions 2 11 12 Number: Institutions 2 11 12 Individuals 2 3 4 Individuals 2 9 7
Salary: Highest $153,789 $93,713 $65,867 Salary: Highest $136,800 $83,364 $77,327 Lowest 120,012 74,388 47,000 Lowest 122,377 39,566 30,752 Average 136,901 85,093 58,978 Average 129,589 57,602 49,798
Fringe Benefits: Highest $66,191 $31,892 $30,058 Fringe Benefits: Highest $16,365 $31,684 $41,218 Lowest 41,763 25,327 19,812 Lowest 15,535 18,032 14,821 Average 53,977 29,359 26,000 Average 15,950 22,728 23,260
Chief Personnel/HR Officer Chief Payroll Officer
Number: Institutions 2 11 12 Number: Institutions 2 11 12 Individuals 2 8 11 Individuals 2 5 6
Salary: Highest $218,840 $90,512 $113,367 Salary: Highest $94,801 $60,048 $49,317 Lowest 132,504 50,000 39,900 Lowest 87,812 36,750 23,941 Average 175,672 68,977 57,489 Average 91,307 48,916 33,589
Fringe Benefits: Highest $88,954 $36,179 $42,578 Fringe Benefits: Highest $41,271 $23,728 $23,151 Lowest 39,444 - 18,315 Lowest 34,501 15,620 14,399 Average 64,199 20,244 23,931 Average 37,886 19,170 17,770
Director of Alumni Affairs Director of Telecommunications
Number: Institutions 2 11 12 Number: Institutions 2 11 12 Individuals 1 8 2 Individuals 1 3 2
Salary: Highest $206,917 $82,051 $64,000 Salary: Highest $99,244 $61,089 $0 Lowest 206,917 33,481 41,500 Lowest 99,244 54,320 -Average 206,917 53,491 52,500 Average 99,244 57,705 #DIV/0!
Fringe Benefits: Highest $84,717 $22,670 $30,035 Fringe Benefits: Highest $32,059 $24,779 $0 Lowest 84,717 16,178 19,753 Lowest 32,059 23,260 -Average 84,717 19,424 23,876 Average 32,059 24,020 -
37

TABLE 11 (cont.)
Position
Type of Institution
Position
Type of Institution
Research Universities
Four-Year Universities
Two-Year Colleges
Research Universities
Four-Year Universities
Two-Year Colleges
Comptroller Bursar
Number: Institutions 2 11 12 Number: Institutions 2 11 12 Individuals 2 8 8 Individuals 2 8 7
Salary: Highest $184,248 $103,000 $92,500 Salary: Highest $98,964 $63,984 $64,710 Lowest 180,000 40,500 46,000 Lowest 97,000 38,000 31,000 Average 182,124 73,713 61,231 Average 97,982 50,010 45,626
Fringe Benefits: Highest $75,503 $36,179 $35,069 Fringe Benefits: Highest $45,105 $24,099 $29,013 Lowest 56,667 18,278 19,700 Lowest 35,756 14,105 15,753 Average 66,085 27,032 24,653 Average 40,431 19,602 21,221
Director of Financial Aid Director of Athletics
Number: Institutions 2 11 12 Number: Institutions 2 11 12 Individuals 2 11 11 Individuals 2 9 5
Salary: Highest $102,504 $79,989 $83,780 Salary: Highest $550,608 $120,000 $70,000 Lowest 97,000 48,500 40,750 Lowest 375,000 25,000 55,315 Average 99,752 63,346 53,599 Average 462,804 90,086 63,520
Fringe Benefits: Highest $37,987 $39,994 $33,641 Fringe Benefits: Highest $83,554 $35,986 $29,372 Lowest 36,804 18,247 18,162 Lowest 76,460 13,699 22,674 Average 37,396 23,631 22,859 Average 80,007 29,972 24,819
Chief Legal Counsel
Number: Institutions 2 11 12
Chief Information System Officer
2 11 12Number: Institutions Individuals 2 1 1 Individuals 2 11 8
Salary: Highest $325,000 $0 $106,077 Salary: Highest $239,700 $126,000 $71,790 Lowest 256,250 - 106,077 Lowest 168,564 73,645 50,610 Average 290,625 #DIV/0! 106,077 Average 204,132 89,206 60,047
Fringe Benefits: Highest $58,606 $0 $44,339 Fringe Benefits: Highest $77,706 $37,719 $26,382 Lowest 51,029 - 44,339 Lowest 53,028 21,218 20,938 Average 54,818 #DIV/0! 44,339 Average 65,367 29,566 24,371
38

FIGURE 11
PRESIDENTS' SALARIES AND BENEFITS HIGH AND AVERAGE SALARY COMPARISONS, FY2014 TO FY2015
$0 $50,000 $100,000 $150,000 $200,000 $250,000 $300,000 $350,000 $400,000 $450,000
Fringe Benefits
High
Average
$101,996
$425,004
$398,604
$99,602
$364,905
$357,453
Research University Tier 2014 2015
11.5% increase
25.6% of Average Salary
$0 $50,000 $100,000 $150,000 $200,000 $250,000
Fringe Benefits
High
Average
$51,037
$279,000
$200,780
$47,582
$232,000
$184,177
Four -Year University Tier
9.0% increase
25.4% of Average Salary
$0 $50,000 $100,000 $150,000 $200,000 $250,000
Fringe Benefits
High
Average
$58,792
$270,000
$175,861
$60,545
$274,932
$171,012
Two-Year College Tier
2.8% increase
33.4% of Average Salary
39
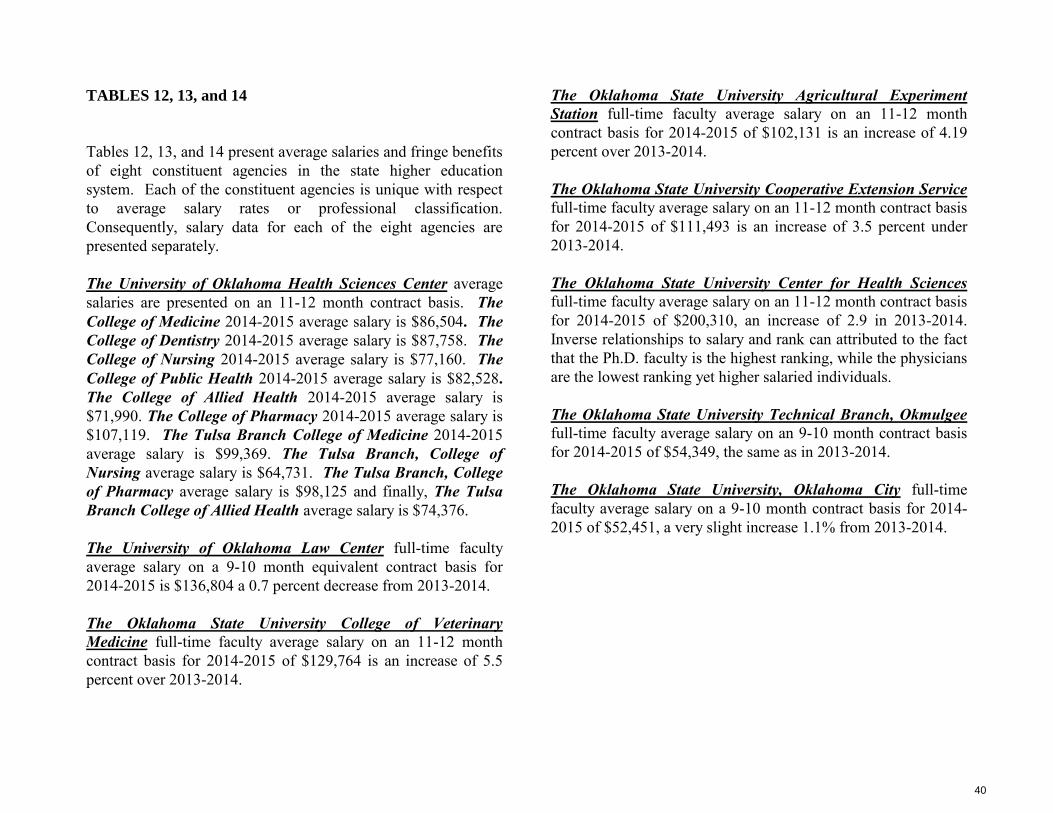
TABLES 12, 13, and 14
Tables 12, 13, and 14 present average salaries and fringe benefits of eight constituent agencies in the state higher education system. Each of the constituent agencies is unique with respect to average salary rates or professional classification. Consequently, salary data for each of the eight agencies are presented separately.
The University of Oklahoma Health Sciences Center average salaries are presented on an 11-12 month contract basis. The College of Medicine 2014-2015 average salary is $86,504. The College of Dentistry 2014-2015 average salary is $87,758. The College of Nursing 2014-2015 average salary is $77,160. The College of Public Health 2014-2015 average salary is $82,528.
The College of Allied Health 2014-2015 average salary is $71,990. The College of Pharmacy 2014-2015 average salary is $107,119. The Tulsa Branch College of Medicine 2014-2015 average salary is $99,369. The Tulsa Branch, College of Nursing average salary is $64,731. The Tulsa Branch, College of Pharmacy average salary is $98,125 and finally, The Tulsa Branch College of Allied Health average salary is $74,376.
The University of Oklahoma Law Center full-time faculty average salary on a 9-10 month equivalent contract basis for 2014-2015 is $136,804 a 0.7 percent decrease from 2013-2014.
The Oklahoma State University College of Veterinary Medicine full-time faculty average salary on an 11-12 month contract basis for 2014-2015 of $129,764 is an increase of 5.5 percent over 2013-2014.
The Oklahoma State University Agricultural Experiment Station full-time faculty average salary on an 11-12 month contract basis for 2014-2015 of $102,131 is an increase of 4.19 percent over 2013-2014.
The Oklahoma State University Cooperative Extension Service full-time faculty average salary on an 11-12 month contract basis for 2014-2015 of $111,493 is an increase of 3.5 percent under 2013-2014.
The Oklahoma State University Center for Health Sciences full-time faculty average salary on an 11-12 month contract basis for 2014-2015 of $200,310, an increase of 2.9 in 2013-2014. Inverse relationships to salary and rank can attributed to the fact that the Ph.D. faculty is the highest ranking, while the physicians are the lowest ranking yet higher salaried individuals.
The Oklahoma State University Technical Branch, Okmulgee full-time faculty average salary on an 9-10 month contract basis for 2014-2015 of $54,349, the same as in 2013-2014.
The Oklahoma State University, Oklahoma City full-time faculty average salary on a 9-10 month contract basis for 2014-2015 of $52,451, a very slight increase 1.1% from 2013-2014.
40

TABLE 12
UNIVERSITY OF OKLAHOMA HEALTH SCIENCES CENTER* AVERAGE SALARIES PAID ALL FULL-TIME FACULTY
11-12-MONTH SALARIES FOR 2014-2015
College
Academic Rank Professor Associate Professor Assistant Professor Instructor Average, All Ranks
Number Amount Number Amount Number Amount Number Amount Number Amount
College of Medicine 168 $159,269 156 $89,725 355 $67,883 104 $59,943 793 $86,504
College of Dentistry 17 $159,260 6 $88,236 15 $80,247 2 $74,250 47 $87,758
College of Nursing 5 $125,166 8 $87,322 21 $75,480 12 $66,055 48 $77,160
College of Nursing - Tulsa Branch 6 $69,366 6 $59,376 12 $64,731
College of Public Health 10 $154,384 14 $96,529 14 $86,000 2 $67,500 49 $82,528
College of Allied Health 7 $109,689 14 $78,099 24 $68,113 1 $43,500 49 $71,990
College of Allied Health - Tulsa Branch - 3 $82,500 5 $69,502 - $0 8 $74,376
College of Pharmacy 11 $139,331 14 $105,777 20 $90,343 45 $107,119
College of Pharmacy - Tulsa Branch 1 $112,000 2 $105,000 9 $95,056 12 $98,125
College of Medicine - Tulsa Branch 14 $166,061 22 $117,567 64 $90,288 16 $71,148 119 $99,369
TOTAL 222 $145,955 242 $79,349 527 $59,216 157 $58,348 1,182 $75,142 *NOTE: Included faculty are those employed full-time for the Health Sciences Center and faculty members who devote a part of their time to the Health Sciences Center and to either the Veterans Administration or to the Medical Research Foundation but whose employment agreement anticipates the amount of income from these sources. Full-time faculty members prorate time among the various divisions. Time allocated to each division has been rounded to the nearest whole number of full-time faculty. All 9-10 month salaries have been equated to 11-12 month basis by multiplying the 9-10 month salaries by 9/11.
41

UNIVERSITY OF OKLAHOMA LAW CENTER9 10 MONTH EQUIVALENT SALARIES FOR
Rank Number AmountProfessor 24 $141,315Associate Professor 4 110,045 Assistant Professor 8 61,262 InstructorAll Ranks 36 $136,804FY14 Average 135,898$ % Change 0.7%
NOTE: All 11-12 month salaries have been equated to 9-10month basis by multiplying the 11-12 month salaries by 9/11.
OSU COLLEGE OF VETERINARY MEDICINE OSU AGRICULTURE EXPERIMENT STATION11 12 MONTH EQUIVALENT SALARIES FOR 11 12 MONTH EQUIVALENT SALARIES FOR
Rank Number Amount Rank Number AmountProfessor 35 $151,387 Professor 49 $149,034Associate Professor 16 114,577 Associate Professor 38 87,632 Assistant Professor 12 113,709 Assistant Professor 2 84,515 Instructor 4 65,401 InstructorAll Ranks 67 $129,764 All Ranks 89 $102,131FY14 Average 123,030$ FY14 Average 98,028$ % Change 5.5% % Change 4.19%
NOTE: All 9-10 month salaries have been equated to 11-12 NOTE: All 9-10 month salaries have been equated to 11-12month basis by multiplying the 9-10 month salaries by 9/11. month basis by multiplying the 9-10 month salaries by 9/11.
TABLE 13
AVERAGE SALARIES PAID ALL FULL-TIME FACULTY All Other Constituent Agencies
2014-2015
-
- -
42
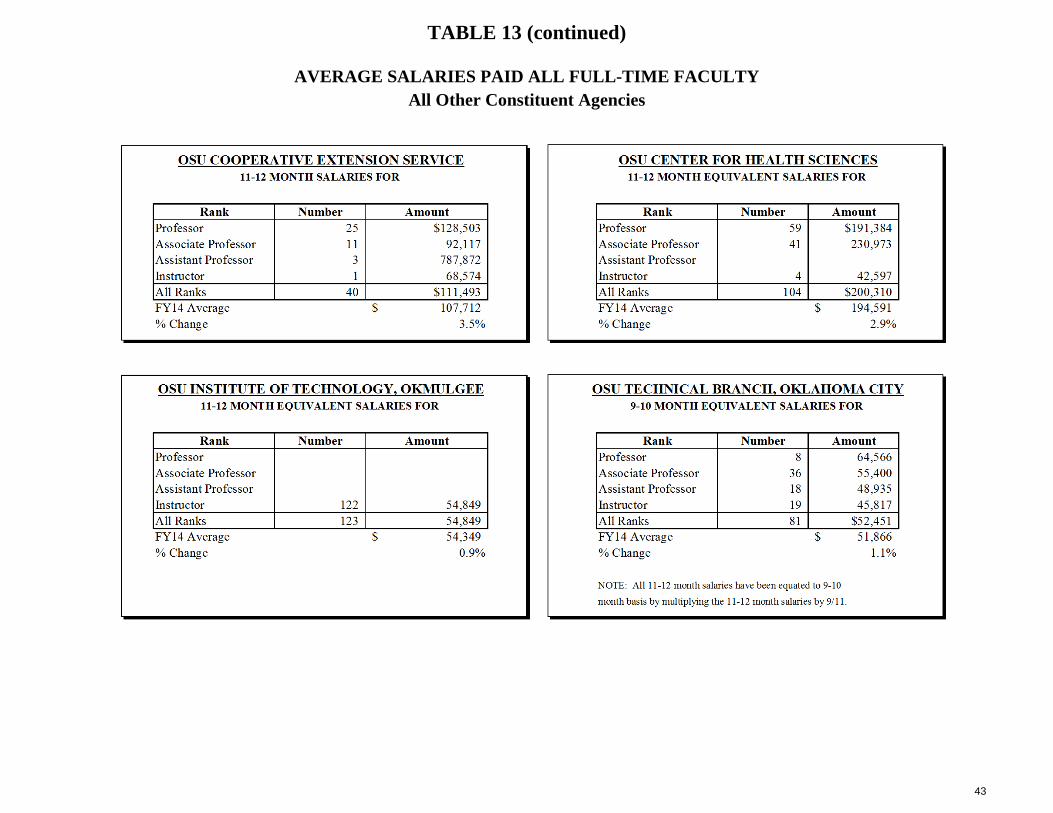
OSU COOPERATIVE EXTENSION SERVICE OSU CENTER FOR HEALTH SCIENCES11 12 MONTH SALARIES FOR 11 12 MONTH EQUIVALENT SALARIES FOR
Rank Number Amount Rank Number AmountProfessor 25 $128,503 Professor 59 $191,384Associate Professor 11 92,117 Associate Professor 41 230,973 Assistant Professor 3 787,872 Assistant ProfessorInstructor 1 68,574 Instructor 4 42,597 All Ranks 40 $111,493 All Ranks 104 $200,310FY14 Average 107,712$ FY14 Average 194,591$ % Change 3.5% % Change 2.9%
OSU INSTITUTE OF TECHNOLOGY, OKMULGEE OSU TECHNICAL BRANCH, OKLAHOMA CITY11 12 MONTH EQUIVALENT SALARIES FOR 9 10 MONTH EQUIVALENT SALARIES FOR
Rank Number Amount Rank Number AmountProfessor Professor 8 64,566 Associate Professor Associate Professor 36 55,400 Assistant Professor Assistant Professor 18 48,935 Instructor 122 54,849 Instructor 19 45,817 All Ranks 123 54,849 All Ranks 81 $52,451FY14 Average 54,349$ FY14 Average 51,866$ % Change 0.9% % Change 1.1%
NOTE: All 11-12 month salaries have been equated to 9-10month basis by multiplying the 11-12 month salaries by 9/11.
TABLE 13 (continued)
AVERAGE SALARIES PAID ALL FULL-TIME FACULTY All Other Constituent Agencies
- -
- -
43

TABLE 14
AVERAGE FRINGE BENEFITS PAID 9-10 MONTH FULL-TIME FACULTY, 2014-2015
Institution No. of Faculty
Retirement Plan
Medical & Dental
Social Security
UnemploymentCompensation
Group LifeInsurance
Workers' Compensation Other Total
OU Health Sciences Center
College of Nursing College of Nursing - TulsaOU Law Center
23 10
31
3,572 5,042
34,886
4,663 5,320
5,103
2,418 2,813
8,541
129 116
55
103 137
185
352 456
1,368
1 2
2
11,23813,886
50,140
OSU Constituent Agencies16 20,131 5,417 8,047 57 642 813 35,107
College of Veterinary Medicine n 3 17,274 5,417 7,878 57 624 865 32,115 Agriculture Experiment Statio 1 23,679 5,417 8,423 57 672 789 39,037 Cooperative Extension Service 56 10,227 5,417 3,932 57 365 388 20,386
Institution No. of Faculty
Retirement Plan
Medical & Dental
Social Security
UnemploymentCompensation
Group LifeInsurance
Workers' Compensation Other Total
OU Health Sciences Center
College of Medicine College of Dentistry College of Nursing College of Nursing - Tulsa Branch College of Public Health College of Allied Health College of Allied Health - Tulsa Branch College of Pharmacy College of Pharmacy - Tulsa Branch
709 38 39
9 43 45
8 44 12
109
6,961 8,688 6,992 5,157 7,442 6,987 8,666 7,011 6,892 6,613
5,384 4,885 5,132 6,465 5,122 4,404 6,893 5,429 3,332 5,307
3,237 3,443 3,949 3,710 3,829 2,933 3,472 3,275 3,165 3,421
198 235 165 123 225 168 164 236 216 230
178 208 178 153 191 174 192 180 178 173
690 809 699 607 753 667 746 696 692 692
2 2 2 2 2 2 2 2 2 2
16,650 18,270 17,117 16,217 17,564 15,335 20,135 16,829 14,477 16,438
28,846College of Medicine - Tulsa BranchOU Law Center 5 15,306 5,239 7,037 43 145 1,074 2
OSU Constituent Agencies41 20,283 5,417 8,296 57 647 834 35,534
College of Veterinary Medicine 97 18,718 5,417 7,501 57 619 732 33,044 Agriculture Experiment Station 39 19,087 5,417 7,963 57 636 801 33,961 Cooperative Extension Service 122 9,933 6,898 4,196 57 367 395 21,846 Technical Branch, Okmulgee 25 10,974 5,417 5,035 57 424 451 22,358 Technical Branch, Oklahoma City 104 27,245 5,417 9,851 57 654 1,436 44,660
Technical Branch, Oklahoma City
AVERAGE FRINGE BENEFITS PAID 11-12 MONTH FULL-TIME FACULTY, 2014-2015
Center for Health Sciences 44
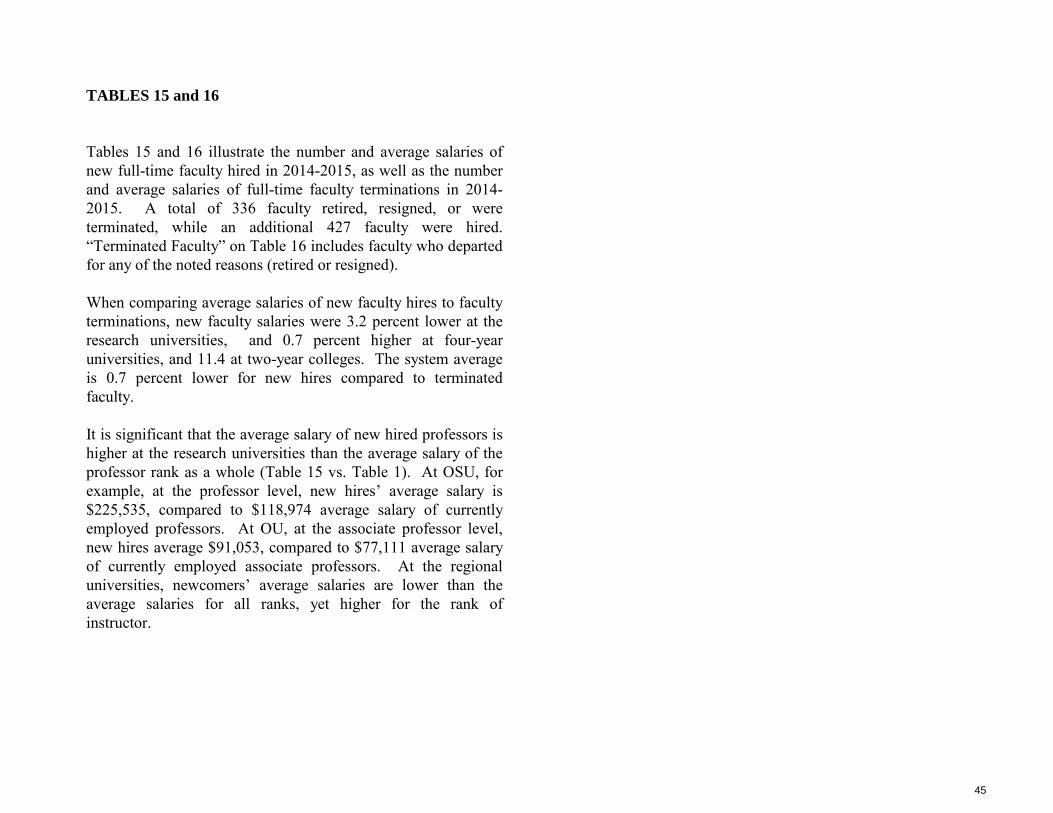
TABLES 15 and 16
Tables 15 and 16 illustrate the number and average salaries of new full-time faculty hired in 2014-2015, as well as the number and average salaries of full-time faculty terminations in 2014-2015. A total of 336 faculty retired, resigned, or were terminated, while an additional 427 faculty were hired. “Terminated Faculty” on Table 16 includes faculty who departed for any of the noted reasons (retired or resigned).
When comparing average salaries of new faculty hires to faculty terminations, new faculty salaries were 3.2 percent lower at the research universities, and 0.7 percent higher at four-year universities, and 11.4 at two-year colleges. The system average is 0.7 percent lower for new hires compared to terminated faculty.
It is significant that the average salary of new hired professors is higher at the research universities than the average salary of the professor rank as a whole (Table 15 vs. Table 1). At OSU, for example, at the professor level, new hires’ average salary is $225,535, compared to $118,974 average salary of currently employed professors. At OU, at the associate professor level, new hires average $91,053, compared to $77,111 average salary of currently employed associate professors. At the regional universities, newcomers’ average salaries are lower than the average salaries for all ranks, yet higher for the rank of instructor.
45

TABLE 15
NEW FACULTY HIRES - 2014-2015
Institution Professor Associate Professor Assistant Professor Instructor Total
Number Avg. Salary Number Avg. Salary Number Avg. Salary Number Avg. Salary Number Avg. Salary
University of Oklahoma Oklahoma State University
4 4
$186,886 $225,535
6 5
$91,053 $100,543
73 68
$73,363 $75,793
83 77
80,113$ 85,179$
Research Universities 8 206,211$ 11 95,367$ 141 74,535$ 0 160 82,551$
University of Central Oklahoma 0 0 23 $66,647 18 $40,598 41 55,211$ East Central University 1 3 $54,539 9 $53,344 12 $47,350 25 48,477$ Northeastern State University 0 0 11 $54,192 15 $43,140 26 47,816$ Northwestern Oklahoma State University 0 1 $52,177 2 $47,518 8 $36,024 11 39,582$ Southeastern Oklahoma State University 1 1 $52,020 10 $59,792 4 $40,789 16 50,818$ Southwestern Oklahoma State University 0 0 13 $51,789 9 $46,417 22 49,591$ Cameron University 0 2 $75,864 9 $44,555 6 $34,833 17 44,807$ Langston University 0 0 11 $56,351 9 $49,212 20 53,139$ Oklahoma Panhandle State University 0 0 1 $43,000 6 $38,250 7 38,929$ Rogers State University 0 0 3 $42,333 0 3 42,333$ University of Science & Arts of Oklahoma 0 0 3 $45,450 1 $46,636 4 45,747$ Regional 4-Year Tier 2 $0 7 $59,934 95 $55,816 88 $42,536 192 49,298$
Carl Albert State College 1 $37,700 1 37,700$ Connors State College 3 $41,610 3 41,610$ Eastern Oklahoma State College 3 $41,893 3 41,893$ Murray State College 10 $42,753 10 42,753$ Northeastern Oklahoma A&M College 3 $42,110 3 42,110$ Northern Oklahoma College 11 $44,653 11 44,653$ Oklahoma City Community College 8 $43,100 8 43,100$ Redlands Community College 7 $38,003 7 38,003$ Rose State College 7 $46,891 7 46,891$ Seminole State College 1 $39,000 1 39,000$ Tulsa Community College 15 $49,378 15 49,378$ Western Oklahoma State College 7 $41,633 7 41,633$ Two-Year Colleges 0 $0 0 $0 0 $0 75 $44,076 75 44,076$
All Institutions 427 60,841$
46

TABLE 16
FACULTY TERMINATIONS - 2014-2015
Institution Professor Associate Professor Assistant Professor Instructor Total
Number Avg. Salary Number Avg. Salary Number Avg. Salary Number Avg. Salary Number Avg. Salary
University of Oklahoma Oklahoma State University Research Universities
33 8
110,789$ 105,899$
23 13
71,023$ 78,588$
24 3
62,683$ 70,237$
--
80 24
84,924$ 86,648$
41 109,835$ 36 73,755$ 27 63,522$ - -$ 104 85,322$
University of Central Oklahoma 8 85,657$ 1 65,182$ 2 73,444$ - 11 81,575$ East Central University 4 71,826$ 1 55,991$ 3 54,875$ 7 43,616$ 15 54,216$ Northeastern State University 6 69,757$ 3 61,287$ 12 46,923$ 9 43,158$ 30 51,796$ Northwestern Oklahoma State University 2 57,602$ - 5 48,805$ 5 39,331$ 12 46,324$ Southeastern Oklahoma State University 3 67,430$ 2 57,071$ 4 52,484$ 2 36,510$ 11 54,490$ Southwestern Oklahoma State University 2 72,611$ 1 54,106$ 7 42,645$ 12 46,796$ 22 48,154$ Cameron University 3 64,345$ 2 58,700$ 7 45,314$ 12 35,616$ 24 43,959$ Langston University - 3 53,714$ 2 66,818$ 3 50,000$ 8 55,597$ Oklahoma Panhandle State University - 1 66,494$ - - 1 66,494$ Rogers State University 3 82,227$ - 4 45,323$ 2 52,998$ 9 59,330$ University of Science & Arts of Oklahoma 1 65,355$ 1 56,405$ 1 45,900$ 1 44,587$ 4 53,062$ 4-year Universities 32 66,006$ 15 53,882$ 47 45,187$ 53 40,508$ 147 48,920$
Carl Albert State College 1 43,272 1 43,272 Connors State College 4 44,257 4 44,257 Eastern Oklahoma State College 4 41,477 4 41,477 Murray State College 8 51,925 8 51,925 Northeastern Oklahoma A&M College 2 48,341 2 48,341 Northern Oklahoma College 9 44,552 9 44,552 Oklahoma City Community College 6 53,513 6 53,513 Redlands Community College 12 42,456 12 42,456 Rose State College 13 48,246 13 48,246 Seminole State College 7 45,107 7 45,107 Tulsa Community College 17 62,284 17 62,284 Western Oklahoma State College 2 47,466 2 47,466 2-year Colleges 85 49,724$ 85 49,724$
All Institutions 73 90,622$ 51 67,910$ 74 51,877$ 138 46,184$ 336 60,390$ NOTE: Includes all full-time faculty salaries on a 9-10 month basis. All 11-12 month salaries have been equated to 9-10 month salaries by multiplying the 11-12 month salaries by 9/11.
47

TABLE 17
Table 17 illustrates average salaries by rank and by tier of Oklahoma institutions compared to national averages.
Oklahoma has made significant strides in bringing faculty salaries up to the national average. Oklahoma professors’ salaries are at 88.1 percent of the national average ($101,811 compared to $115,592), associate professors are 86.8 percent of the national average ($71,429 compared to $82,284), and assistant professors are 89.3 percent of the national average ($63,195 compared to $70,801). Oklahoma instructor’s salaries are lower than the national average. ($46,736 compared to $49,245, or 94.91 percent)
Assistant Professors at Oklahoma’s research universities have seen the largest 10-year growth in average salary, 34.8 percent, just slightly higher than professors, when compared to other ranks and other tiers. Nationally, assistant professors’ salaries at research universities grew by 30.5 percent, by comparison.
Overall, average Oklahoma salaries of all ranks have increased 27.7 percent over the 10-year period compared to 25.6 percent nationally, bringing Oklahoma average faculty salaries to 80.39 percent of the national average.
Figure 12 shows the annual percentage increases in average faculty salaries in Oklahoma and the nation over a 10-year period for each tier of institutions. Research universities have shown the greatest average annual percent increase at 2.8 percent. Overall, Oklahoma’s average annual increase was 2.5 percent, compared to the national average of only 0.1 percent.
Figure 13 shows annual percentage increases in faculty salaries in Oklahoma and the nation over a 10-year period by faculty rank. Assistant professors received the largest average annual increase, 3.3 percent, compared to 2.8 percent nationally. Average annual increases in Oklahoma for professors, associate professors, and instructors were 2.9 percent, 2.6 percent, and 2.4 percent, respectively.
48

TABLE 17 AVERAGE SALARIES PAID FULL-TIME FACULTY, BY RANK, BY TIER
OKLAHOMA COMPARED TO NATIONAL PUBLIC INSTITUTIONS 2004-05 to 2014-2015
Professor 10-Yr % IncSalaries by Tier 2004-05 2005-06 2006-07 2007-08 2008-09 2009-10 2010-11 2011-12 2012-13 2013-14 2014-15
Research Universities: National Oklahoma OK % of Nat'l
97,948 87,860
89.70%
101,620 92,644
91.17%
106,495 100,046 93.94%
109,569 105,959 96.71%
115,509 107,614 93.17%
116,750 106,390 91.13%
118,054 108,998 92.33%
120,955 111,357 92.06%
123,393 110,826 89.82%
126,981 113,449 89.34%
130,039 117,491 90.35%
32.8% 33.7%
Four-Year Universities: National Oklahoma OK % of Nat'l
71,249 62,989
88.41%
73,406 65,502
89.23%
76,745 69,583
90.67%
80,408 71,043
88.35%
84,488 72,228
85.49%
84,537 72,457
85.71%
84,398 72,187
85.53%
84,524 72,143
85.35%
86,427 74,203
85.86%
87,262 76,824
88.04%
87,182 78,057
89.53%
22.4% 23.9%
All Institutions: National Oklahoma OK % of Nat'l
88,457 77,665
87.80%
91,367 81,492
89.19%
95,619 87,607
91.62%
98,314 91,656
93.23%
104,493 93,299
89.29%
105,702 92,940
87.93%
105,780 94,344
89.19%
107,945 95,994
88.93%
110,143 96,380
87.50%
112,897 98,720
87.44%
115,592 101,811 88.08%
30.7% 31.1%
Associate Professor 10-Yr % IncSalaries by Tier 2004-05 2005-06 2006-07 2007-08 2008-09 2009-10 2010-11 2011-12 2012-13 2013-14 2014-15
Research Universities: National Oklahoma OK % of Nat'l
68,576 61,494
89.67%
70,952 64,810
91.34%
74,075 69,817
94.25%
77,033 70,340
91.31%
79,986 72,333
90.43%
80,463 72,221
89.76%
81,266 71,560
88.06%
82,777 73,214
88.45%
84,275 73,932
87.73%
86,567 76,260
88.09%
88,716 78,266
88.22%
29.4% 27.3%
Four-Year Universities: National Oklahoma OK % of Nat'l
57,814 51,980
89.91%
59,913 55,696
92.96%
62,716 49,449
78.85%
65,431 58,656
89.65%
68,193 59,325
87.00%
68,359 59,244
86.67%
68,996 58,826
85.26%
69,021 59,170
85.73%
70,066 60,645
86.55%
70,849 62,747
88.56%
72,526 64,585
89.05%
25.4% 24.2%
All Institutions: National Oklahoma OK % of Nat'l
64,447 57,122
88.63%
66,288 59,963
90.46%
69,195 63,283
91.46%
72,187 64,353
89.15%
75,205 65,866
87.58%
75,678 65,067
85.98%
76,242 64,380
84.44%
77,223 65,620
84.97%
78,529 67,161
85.52%
80,448 69,726
86.67%
82,284 71,429
86.81%
27.7% 25.0%
Assistant Professor 10-Yr % IncSalaries by Tier 2004-05 2005-06 2006-07 2007-08 2008-09 2009-10 2010-11 2011-12 2012-13 2013-14 2014-15
Research Universities: National Oklahoma OK % of Nat'l
58,310 52,651
90.29%
60,440 55,793
92.31%
63,131 60,105
95.21%
65,416 60,183
92.00%
68,048 62,228
91.45%
68,178 62,827
92.15%
69,777 63,039
90.34%
71,465 65,674
91.90%
73,212 66,743
91.16%
75,432 69,288
91.85%
77,445 72,509
93.63%
32.8% 37.7%
Four-Year Universities: National Oklahoma OK % of Nat'l
48,194 45,767
94.96%
49,546 48,099
97.08%
51,584 49,449
95.86%
54,844 50,384
91.87%
56,977 50,836
89.22%
57,001 51,157
89.75%
57,544 51,355
89.24%
57,348 52,106
90.86%
58,591 52,454
89.53%
59,873 53,550
89.44%
61,000 57,939
94.98%
26.6% 26.6%
All Institutions: National Oklahoma OK % of Nat'l
54,271 46,879
86.38%
55,918 49,707
88.89%
58,458 52,671
90.10%
60,802 53,682
88.29%
63,430 54,571
86.03%
64,008 55,361
86.49%
64,711 55,551
85.84%
65,865 57,132
86.74%
67,097 57,501
85.70%
69,100 59,003
85.39%
70,801 63,195
89.26%
30.5% 34.8%
Instructor 10-Yr % IncSalaries by Tier 2004-05 2005-06 2006-07 2007-08 2008-09 2009-10 2010-11 2011-12 2012-13 2013-14 2014-15
Research Universities: National Oklahoma OK % of Nat'l
39,398 34,080
86.50%
40,670 36,111
88.79%
42,541 37,726
88.68%
44,116 38,425
87.10%
45,491 41,251
90.68%
45,805 40,564
88.56%
46,300 41,711
90.09%
47,207 42,052
89.08%
48,359 42,236
87.34%
50,032 43,729
87.40%
50,913 43,726
85.88%
29.2% 28.3%
Four-Year Universities: National Oklahoma OK % of Nat'l
38,662 35,274
91.24%
39,925 36,536
91.51%
41,041 38,087
92.80%
44,349 38,769
87.42%
43,970 39,873
90.68%
44,476 40,246
90.49%
47,282 40,486
85.63%
46,682 41,775
89.49%
48,798 43,102
88.33%
49,297 42,856
86.93%
51,104 43,161
84.46%
32.2% 22.4%
Two Year Colleges: National* Oklahoma OK % of Nat'l
53,084 41,731
78.61%
54,570 43,027
78.85%
54,895 45,151
82.25%
57,772 46,466
80.43%
59,311 47,708
80.44%
59,467 48,290
81.20%
60,532 47,997
79.29%
57,677 47,990
83.20%
62,776 48,696
77.57%
60,401 49,870
82.56%
61,976 49,503
79.87%
16.8% 18.6%
All Institutions: National Oklahoma OK % of Nat'l
43,386 43,139
99.43%
44,716 44,665
99.89%
46,532 44,925
96.55%
45,701 44,886
98.22%
46,291 45,375
98.02%
46,926 46,147
98.34%
48,388 46,832
96.78%
49,245 46,736
94.91%
39,367 41,731
106.01%
40,113 40,209
100.24%
41,848 42,076
100.54%
25.1% 12.0%
All Ranks 10-Yr % IncSalaries by Tier 2004-05 2005-06 2006-07 2007-08 2008-09 2009-10 2010-11 2011-12 2012-13 2013-14 2014-15
Research Universities: National Oklahoma OK % of Nat'l
74,083 64,991
87.73%
76,361 68,050
89.12%
79,448 72,703
91.51%
80,962 74,986
92.62%
84,887 77,301
91.06%
85,704 77,205
90.08%
86,653 77,926
89.93%
88,393 80,243
90.78%
89,657 80,293
89.56%
91,918 82,395
89.64%
93,819 84,746
90.33%
26.6% 30.4%
Four-Year Universities: National Oklahoma OK % of Nat'l
60,074 48,771
81.18%
61,248 50,887
83.08%
63,499 52,697
82.99%
66,107 53,761
81.32%
68,227 54,920
80.50%
69,555 55,103
79.22%
69,620 54,976
78.97%
65,240 55,736
85.43%
66,298 57,177
86.24%
70,683 58,219
82.37%
71,423 60,296
84.42%
18.9% 23.6%
Two Year Colleges: National* Oklahoma OK % of Nat'l
53,084 41,731
78.61%
54,570 43,027
78.85%
54,895 45,151
82.25%
57,772 46,466
80.43%
59,311 47,708
80.44%
59,467 48,290
81.20%
60,532 47,997
79.29%
57,677 47,990
83.20%
62,776 48,696
77.57%
60,401 49,870
82.56%
61,976 49,503
79.87%
16.8% 18.6%
All Institutions: National Oklahoma OK % of Nat'l
66,851 53,089
79.41%
68,440 55,414
80.97%
71,362 58,407
81.85%
73,191 60,255
82.33%
77,009 61,929
80.42%
77,956 62,096
79.66%
78,294 62,288
79.56%
79,507 63,558
79.94%
80,578 64,394
79.92%
82,605 65,921
79.80%
83,939 67,482
80.39%
25.6% 27.1%
SOURCES: Average Faculty Salaries, The Chronicle of Higher Education, April, 2003-2013. Faculty Salaries in the Oklahoma State System of Higher Education, 03-13, State Regents.
*Due to wide variability in faculty rank practices in the Two Year College Tier, this report uses the ALL RANK data from The Chronicle of Higher Education, Average Faculty Salaries Report.
Represents the year that Oklahoma salaries came closest to meeting or exceeded the national average.
49

FIGURE 12 ANNUAL PERCENTAGE INCREASES IN FACULTY SALARIES, BY TIER
OKLAHOMA COMPARED TO NATIONAL PUBLIC INSTITUTIONS (10 Yr Period)
-2.0%
0.0%
2.0%
4.0%
6.0%
8.0%
10.0%
12.0%
04-05 05-06 06-07 07-'08
08-'09
09-'10
10'-11
11'-12
12'-13
13'-14
14'-15'
Research Universities
Average Annual Increase:Oklahoma - 2.8% National - 2.5%
-8.0%
-6.0%
-4.0%
-2.0%
0.0%
2.0%
4.0%
6.0%
8.0%
10.0%
12.0%
04-05 05-06 06-07 07-08 08-09 09-'10
10'-11
11'-12
12'-13
13'-14
14'-15'
Four-Year Universities
Average Annual Increase:Oklahoma - 2.2% National - 1.8%
-6.0%
-4.0%
-2.0%
0.0%
2.0%
4.0%
6.0%
8.0%
10.0%
04-05 05-06 06-07 07-08 08-09 09-'10
10'-11
11'-12
12'-13
13'-14
14'-15'
Two-Year Colleges
Average Annual Increase:
Oklahoma - 2.1% National - 1.5%
-4.0%
-2.0%
0.0%
2.0%
4.0%
6.0%
8.0%
10.0%
12.0%
04-05 05-06 06-07 07-08 08-09 09-'10
10'-11
11'-12
12'-13
13'-14
14'-15'
All Institutions
Average Annual Increase:
Oklahoma - 2.5% National - 0.1%
Oklahoma National
50
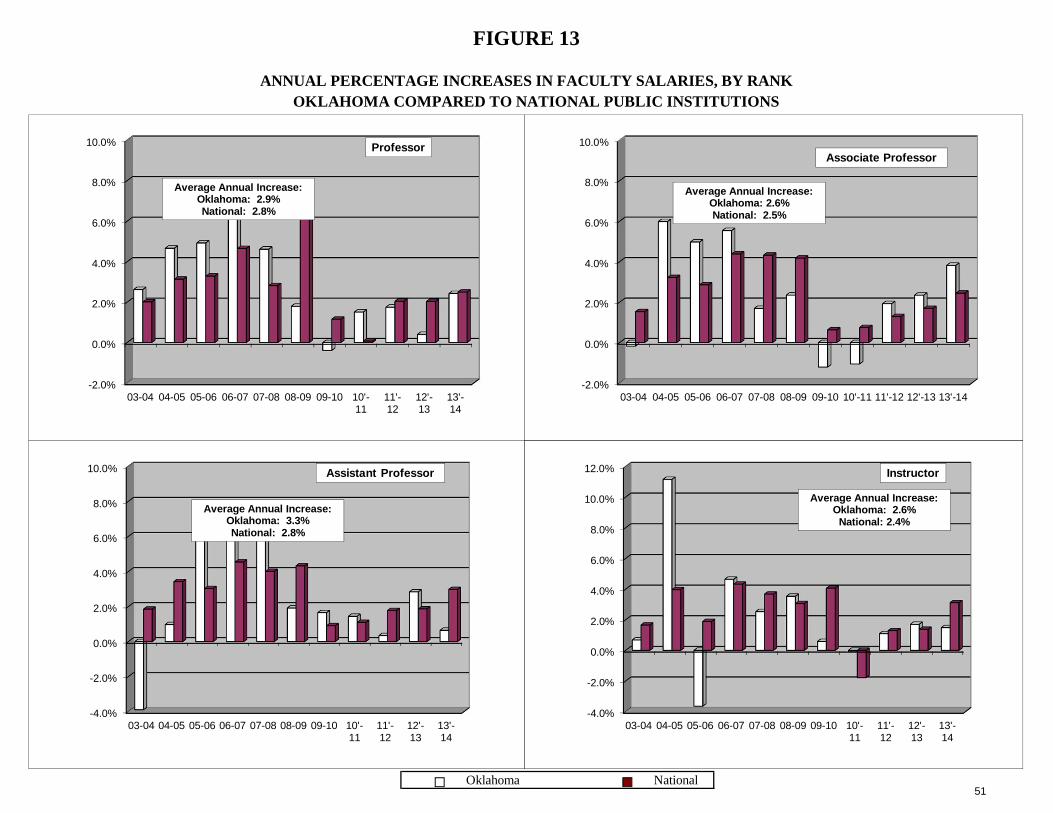
FIGURE 13
ANNUAL PERCENTAGE INCREASES IN FACULTY SALARIES, BY RANK OKLAHOMA COMPARED TO NATIONAL PUBLIC INSTITUTIONS
Oklahoma National
-2.0%
0.0%
2.0%
4.0%
6.0%
8.0%
10.0%
03-04 04-05 05-06 06-07 07-08 08-09 09-10 10'-11
11'-12
12'-13
13'-14
Professor
Average Annual Increase:Oklahoma: 2.9% National: 2.8%
-2.0%
0.0%
2.0%
4.0%
6.0%
8.0%
10.0%
03-04 04-05 05-06 06-07 07-08 08-09 09-10 10'-11 11'-12 12'-13 13'-14
Associate Professor
Average Annual Increase:Oklahoma: 2.6% National: 2.5%
-4.0%
-2.0%
0.0%
2.0%
4.0%
6.0%
8.0%
10.0%
03-04 04-05 05-06 06-07 07-08 08-09 09-10 10'-11
11'-12
12'-13
13'-14
Assistant Professor
Average Annual Increase:Oklahoma: 3.3% National: 2.8%
-4.0%
-2.0%
0.0%
2.0%
4.0%
6.0%
8.0%
10.0%
12.0%
03-04 04-05 05-06 06-07 07-08 08-09 09-10 10'-11
11'-12
12'-13
13'-14
Instructor
Average Annual Increase:Oklahoma: 2.6%
National: 2.4%
51