salary summary and nace 2011-2012
TRANSCRIPT

Summary Range AverageBase Salary – Bachelor’s $30,000 – $123,000 $66,848Base Salary – Master’s $45,000 – $115,000 $73,571Base Salary – PhD $47,000 – $127,000 $96,103
NACE Salary Acceptance by Major – Bachelor’s Range Average Average*Aerospace Engineering $40,000 – $78,000 $63,681 $54,411Agricultural & Biological Engineering $49,000 – $64,320 $59,500 $44,333Bioengineering $42,000 – $67,589 $53,718 $55,197Chemical & Bimolecular Engineering $50,000 – $94,000 $68,460 $66,886Civil & Environmental Engineering $45,000 – $60,000 $54,600 $48,178Computer Engineering $42,500 – $95,000 $71,600 $60,112Computer Science $30,000 – $102,500 $81,118 $63,017Electrical Engineering $48,000 – $105,000 $66,865 $60,646General Engineering (Systems & Technology) $50,000 – $67,000 $60,606 $57,497Industrial Engineering $55,000 – $70,000 $62,644 $58,549Materials Science & Engineering $45,000 – $65,000 $57,750 $60,188Mechanical Engineering/Engineering Mechanics $52,000 – $95,000 $64,507 $60,739Nuclear, Plasma, and Radiological Engineering $48,000 – $80,000 $63,622 $60,679
NACE Salary Acceptance by Discipline – Master’s Range Average Average*Aerospace Engineering $64,068 – $75,000 $71,189 $55,500Civil & Environmental Engineering $45,000 – $79,000 $61,724 $72,478Computer Science $82,000 – $105,000 $91,400 $70,681Electrical Engineering $60,500 – $115,000 $83,455 $72,478Mechanical Engineering $48,000 – $96,400 $71,034 $65,984
NACE Salary Acceptance by Discipline – PhD Range Average Average*Computer Science $49,914 – $125,000 $95,729 $82,542Electrical Engineering $75,000 – $110,000 $95,310 $90,374
Salary information is based on data self-reported to Engineering Career Services by students on a voluntary basis. To maintain confidentiality of the data, information is included only for those disciplines/majors for which adequate reports were received.
*Available NACE average salaries are reprinted from the Spring 2011 Salary Survey with permission of the National Association of Colleges and Employers, copyright holder.
Engineering Employment Summary 2011-2012
U N I V E R S I T Y O F I L L I N O I S A T U R B A N A - C H A M P A I G N
Other Information• Average Signing Bonus for 2011-2012 graduates for full-time hire – $7,239• 34% of students were offered a signing bonus• Average intern salary: $21 per hour
Historical Bachelor’s Salaries Past history of average BS annual salaries:
• 2010-2011 – $64,836• 2009-2010 – $63,148• 2008-2009 – $63,777• 2007-2008 – $61,035
UIUC ‘12Median $65,000$61,000$52,000$69,000$58,000$70,000$90,000$69,500$62,400$63,300$61,000$64,000$62,700
NACE ‘12Median $64,000N/A$41,800$63,000$55,300$67,800$64,400$57,300N/A$58,300N/A$58,600N/A
4255-COE.Salary.Sheet_Layout 1 8/2/12 1:31 PM Page 1
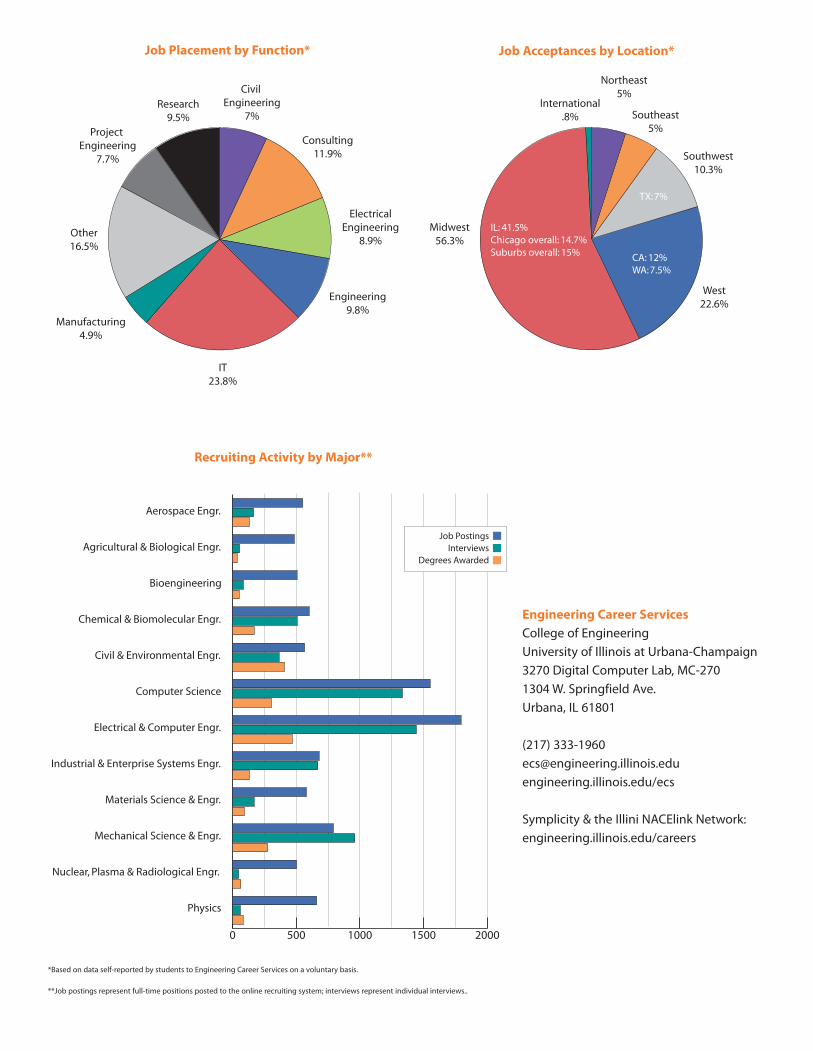
*Based on data self-reported by students to Engineering Career Services on a voluntary basis.
**Job postings represent full-time positions posted to the online recruiting system; interviews represent individual interviews..
Engineering Career ServicesCollege of EngineeringUniversity of Illinois at Urbana-Champaign3270 Digital Computer Lab, MC-2701304 W. Springfield Ave.Urbana, IL 61801
(217) [email protected]/ecs
Symplicity & the Illini NACElink Network:engineering.illinois.edu/careers
Aerospace Engr.
Agricultural & Biological Engr.
Bioengineering
Chemical & Biomolecular Engr.
Civil & Environmental Engr.
Computer Science
Electrical & Computer Engr.
Industrial & Enterprise Systems Engr.
Materials Science & Engr.
Mechanical Science & Engr.
Nuclear, Plasma & Radiological Engr.
Physics
0 500 1000 1500 2000
Job PostingsInterviews
Degrees Awarded
Recruiting Activity by Major**
Other16.5%
Research9.5%
Manufacturing4.9%
Engineering9.8%
IT23.8%
Civil Engineering
7%
ElectricalEngineering
8.9%
Consulting11.9%
Project Engineering
7.7%
International.8%
Southwest10.3%
Southeast5%
West22.6%
Midwest56.3%
IL: 41.5%Chicago overall: 14.7%Suburbs overall: 15% CA: 12%
WA: 7.5%
TX: 7%
Northeast5%
Job Acceptances by Location*Job Placement by Function*
4255-COE.Salary.Sheet_Layout 1 8/2/12 1:31 PM Page 2