sales of drugs and biologicals to large volume purchasers
TRANSCRIPT

Sales of Drugs and Biologicals to Large Volume Purchasers Final Report Contract #500-00-0049 Task Order 1 December 15, 2005 Prepared for Usree Bandyopadhyay Centers for Medicare & Medicaid Services Mail stop c3-20-17 7500 Security Boulevard Baltimore, MD 21244 Prepared by Marian V. Wrobel1 Stephen W. Schondelmeyer2 Susan Jureidini1 Shuchita Agarwal2 Rachel Sayko1 A.C. Doyle 1
Cambridge, MA Lexington, MA Hadley, MA Bethesda, MD Chicago, IL
1Abt Associates Inc. 55 Wheeler Street Cambridge, MA 02138 2PRIME Institute University of Minnesota 308 Harvard Street Minneapolis, MN 55455
Cambridge, MA Lexington, MA Hadley, MA Bethesda, MD Chicago, IL

Abt Associates Inc. Contents i
Contents
Executive Summary................................................................................................................ ES-1
1.0 Introduction........................................................................................................................1
1.1 Motivation for Study .................................................................................................1 1.2 Study Questions ........................................................................................................1
2.0 Methods .............................................................................................................................3
2.1 Overview of the Research Design ...............................................................................3 2.2 Strengths and Limitations of the Research Data...........................................................3 2.3 Selection of Six HCPCs for Primary Data Collection and Focused Review....................5 2.4 Interviews and Primary Data Collection ......................................................................6 2.5 Secondary Data on Drug Prices..................................................................................8
3.0 Results: Interviews............................................................................................................11
3.1 Distribution Process.................................................................................................11 3.2 Access to Special Pricing Terms and Rebates............................................................12 3.3 Variation in Net Acquisition Costs ...........................................................................14
4.0 Results: Secondary Data Analysis .....................................................................................16
4.1 Major Purchasers.....................................................................................................17 4.2 Average Invoice Prices............................................................................................21
5.0 Results: Primary Data on Invoice Prices ............................................................................23
6.0 Summary and Discussion...................................................................................................23
6.1 Summary ................................................................................................................24 6.2 Discussion ..............................................................................................................26
Appendix A: List of Acronyms .................................................................................................A-1
Appendix B: Interview Methods ...............................................................................................B-1
Appendix C: Interview Respondents .........................................................................................C-1
Appendix D: Top 35 Medicare HCPCs, 2003 ............................................................................D-1
Appendix E: Subcategories of IMS’ Classes of Trade .................................................................. E-1
Appendix F: Average Invoice Price per Dose (AIP) by Class of Trade, 25 Study HCPCs ............ F-1
Appendix G: Variation from the All-Class Average Invoice Price per Dose (AIP) by Class of Trade, 25 Study HCPCs....................................................................G-1
Appendix H: Average Invoice Price per Dose (AIP) by Major Class of Trade, Comparison of All-Class Weights and Class of Trade- Specific Weights, 25 Study HCPCs ........................H-1

Abt Associates Inc. Executive Summary ES-1
Executive Summary
Background and Methods
The Medicare Prescription Drug, Improvement, and Modernization Act (MMA) of December 2003 reformed CMS’ payment approach for the prescription drugs covered by Part B of Medicare. As of January 1, 2005, payment for these drugs is a function of “average sales price”(ASP), a manufacturer-reported measure that is based on actual manufacturer revenues. The specific payment amount is 106 percent of the ASP. As part of this reform, the MMA required the Secretary of Health and Human Services (HHS) to submit a report to Congress on the sales of drugs and biologicals to large volume purchasers (LVPs) to determine whether prices paid by LVPs are similar to the prices available to prudent physicians and to assess whether exclusion of LVPs would affect the computation of a manufacturer’s average sales price. The current study is intended to provide background to the Secretary of HHS as a basis for preparing the report to Congress.
For this study, the project team conducted interviews with market participants, analyzed primary invoice data submitted by the purchasers, and analyzed secondary data from the IMS Health’s National Sales Perspectives database (NSP). The project team also requested data on ASP by class of trade from manufacturers, but no manufacturer complied with this request. The project data came from months early in, and, in some cases, preceding the ASP period; the interview and invoice data were collected in the spring of 2005 and the IMS data draws on invoices from the third quarter of 2004.
Study Limitations
In order to undertake any study, one must have access to adequate data. While the project team made a significant effort to acquire the best available data for this report, the available data had significant limitations that prevented the study from drawing conclusions on the primary questions of interest. The data limitations included:
• Sample sizes were small in both the interviews and the primary invoice data, due to a combination of low target numbers of respondents and low response rates. Ultimately, the project relied on 36 interviews and on invoices from six physicians’ offices and twelve hospitals.
• Some interviews were incomplete or difficult to interpret, due to the sensitivity and complexity of the material.
• Data on the net acquisition cost by type of purchaser or average sales price by type of purchaser were not available due to a number of factors discussed below.
• By nature, both the primary and secondary invoice data lacked information on special pricing terms and manufacturer rebates. A provider’s net acquisition cost is its invoice price less any special pricing terms and rebates. A manufacturer’s ASP is its average invoice price less the average of any wholesaler or distributor mark-ups less the average of all purchaser and non- purchaser rebates.
• The secondary invoice data had additional limitations. It was aggregated according to broad classes of trade, many of which contained multiple sub-categories of purchasers believed to

Abt Associates Inc. Executive Summary ES-2
receive differential pricing. It also consisted of average prices only and did not provide measures of price dispersion within classes of trade.
• No manufacturer submitted complete data on ASP by class of trade for a focus drug.
• The study data were collected prior to or very shortly after the implementation of ASP-based payment. The market for the drugs covered by Part B of Medicare is very dynamic and is still adjusting to the new environment created by the MMA.
• Classes of trade were not well defined. The definitions of the various types of classes are not clear and consistent among market participants, and market participants’ working definitions of the classes of trade are not necessarily consistent with the MMA’s implied concepts of prudent physicians and large volume purchasers.
Due to these limitations, this study was not conclusive on the key questions of whether physicians’ net acquisition costs were comparable to large volume purchasers’ net acquisition costs and the effect on ASP of eliminating large volume purchasers from the calculation.
Research Questions and Findings
The study was organized according to seven research questions. These questions and the associated findings follow:
1. What shares of the top drugs covered by Part B of Medicare are purchased by various types of purchasers?
Interview and secondary data concurred that the major purchasers of the top drugs covered by Part B of Medicare were physicians and hospitals, not GPOs, HMOs, or PBMs. The secondary data analysis did offer volumes by class of trade for the categories of purchasers defined in the IMS data. For most of the 25 study HCPCs, the class of trade with the largest share of the market was clinics (including physicians’ offices); hospitals were usually the class of trade with the second largest market share.
2. Do different types of purchasers face the same net acquisition costs for Part B prescription drugs?
The study was unable to obtain data on net acquisition costs by type of purchaser. However, the interviews suggested that different types of purchasers face different net acquisition costs and the primary and secondary invoice data suggested that different purchasers face different invoice prices for the prescription drugs offered by Part B of Medicare examined in this study. Both comments made in interviews and a review of the secondary data indicated that for the sample of drugs examined in this study the main source of variation in net acquisition costs/average invoice prices was different purchasers paying different prices for the same drug (NDC-11) within a molecule, not different purchasers choosing different drug products within that molecule. The interviews also yielded a list of purchaser-level drivers of net acquisition costs, including class of trade, ability to influence market share, volume, and purchaser expertise.
3. Which purchasers face lower and higher net acquisition costs?
While the study found that differences in net acquisition costs/invoice prices existed, we did not find conclusive and consistent evidence concerning whether physicians were disadvantaged relative to large volume purchasers. The primary data collection (both interviews and invoice data) offered some anecdotal information suggesting that physicians paid higher net prices than hospitals for some

Abt Associates Inc. Executive Summary ES-3
drugs. In contrast, the secondary data showed that as a general rule, clinics (the class of trade that included physicians) faced the lowest average invoice prices per dose of all the major classes of trade for most of the study HCPCs.
4. If differences in net acquisition costs exist, do they vary by drug?
Both the interviews and the secondary data analysis clearly indicated that differences in net acquisition costs/average invoice prices varied by drug. The interviews highlighted that the presence of therapeutic or generic competition were critical factors.
5. Would differences in net acquisition costs for different types of purchasers be reflected in ASP if it were calculated by class of trade?
As a conceptual matter, ASP differs from net acquisition cost because it does not account for wholesaler and distributor mark-ups, which are part of net acquisition costs, and because it is reduced by non-purchaser rebates, which are not part of purchasers’ net acquisition costs. Interview respondents suggested that wholesalers’ and distributors’ margins were small, the implication being that ASP, if calculated by class of trade, would be likely to reflect the differences in net acquisition costs by class of trade.1
6. Are there differences in ASP when it is calculated for different types of purchasers?
The study was not conclusive on this point. No manufacturer submitted complete data on ASP by class of trade for a focus drug, and no other market participant was in a position to comment directly on this subject.
7. Does excluding hospitals, HMOs, or other large volume purchasers affect ASP calculations?
Due to the lack of information on ASP by class of trade, the study was not conclusive on this point.
Discussion
The sensitive and confidential nature of prescription drug pricing makes this an extremely challenging topic to research. This study used the best data available at this point in time but was ultimately inconclusive due to data limitations. At this point in time, market participants are not willing to provide price data at a sufficient level of detail to permit a thorough analysis of net acquisition costs and average selling prices by class of trade.
To be successful, future work on net acquisition costs and ASP for the drugs covered by Part B of Medicare must be based on adequate data that overcome some or all of the limitations described above. Any continuing work on this topic must also recognize that the market for prescription drugs, in general, is very dynamic and has just begun to adjust to the new coverage and pricing environment created by the MMA.
1 Respondents at one manufacturer emphasized that, for their product, non-purchaser rebates were large and
drove a wedge between net acquisition costs and ASP.

Abt Associates Inc. Sales of Drugs and Biologicals to Large Volume Purchasers 1
1.0 Introduction
1.1 Motivation for Study
Section 303(c)(2) of the Medicare Prescription Drug, Improvement, and Modernization Act (MMA) of December 2003 reformed CMS’ payment approach for the prescription drugs covered by Part B of Medicare. As of January 1, 2005, payment for these drugs is a function of “average sales price” (ASP), a manufacturer-reported measure that is based on actual manufacturer revenues. The specific payment amount is 106 percent of ASP. Prior to 2005, CMS’ payment approach for these drugs was based on “average wholesale price,” which is a list price as opposed to a transaction price. This change was intended both to yield a payment approach that was a more accurate reflection of providers’ net acquisition costs and to lead to an appropriate reduction in Medicare expenditures.
As its name would suggest, ASP is an average sales price and may not represent individual purchasers’ net acquisition costs to the extent that there is variation in such costs. Some have voiced concern that large volume purchasers might face lower costs than physicians for Part B covered drugs and that, if this were the case, then ASP-based payment might not provide adequate reimbursement to physicians.
To address this concern, the MMA required the Secretary of Health and Human Services (HHS) to submit a report on the sales of drugs and biologicals to large volume purchasers (LVPs).2 The purpose of the required report was to determine whether prices paid by LVPs were similar to the prices available to prudent physicians and to assess the impact of excluding LVPs from the computation of a manufacturer’s average sales price (ASP) for drugs and biologicals covered under Medicare Part B. The current study provides background to the Secretary of HHS as a basis for preparing the report to Congress. The remainder of this chapter presents the study questions; chapter 2 details methods; chapters 3, 4, and 5 describe findings, and chapter 6 concludes.
1.2 Study Questions
The language in the MMA required that the project’s study questions address two related pricing concepts: “prices paid” or “net acquisition costs” and “average sales price” or “ASP.”
For the purposes of this analysis, we considered net acquisition costs to have three components. The first is the invoice price, which is the price shown on the invoice between the purchaser and the supplier. Second are any special pricing terms between the purchaser and supplier that further reduce the purchaser’s acquisition costs but are not shown on the invoice; these might be prompt pay discounts, volume discounts, or economic consideration. The final component is the purchaser rebate, which is a payment from the manufacturer to the purchaser. Typically rebates are not paid at the time of sale but are paid on a periodic basis as a reward for meeting goals related to volume or market share.
While net acquisition costs and ASP are very similar, they are not identical. Roughly speaking, ASP is equal to the manufacturer’s revenue divided by units sold. Thus, ASP differs from net acquisition cost in that it excludes any mark-ups or costs added by wholesalers or other market intermediaries.
2 A list of all acronyms is provided in Appendix A.

Abt Associates Inc. Sales of Drugs and Biologicals to Large Volume Purchasers 2
Also, ASP includes rebates to non-purchasers such as pharmacy benefits managers (PBMs) or health maintenance organizations (HMOs).3
In addition to addressing the pricing concepts of net acquisition costs and ASP, the project’s study questions had to operationalize the concept of “large volume purchasers.” Language in the MMA defined this concept in terms of classes of trade rather than in terms of volume per se; the project followed suit. The MMA specifically mentioned HMOs, and PBMs; these groups were included in our study. In addition, our study included hospitals, because they are major purchasers of Part B drugs and large relative to many physician practices; we also included wholesalers and group purchasing organizations (GPOs), because they are important participants in the markets for the drugs covered by Part B. While the emphasis in the study was on classes of trade, we also sought to explore the contribution of volume to net acquisition costs and average sales price.
In response to the mandate in the MMA and taking these considerations into account, the current study defined seven research questions:
1. What shares of the top drugs covered by Part B of Medicare are purchased by various types of purchasers? The impact of excluding various types of purchasers from the ASP calculation is the product of the excluded group’s share of doses and the difference in ASP between the excluded groups and the remaining purchasers, thus it is important to understand different classes of trade’s share of doses in addition to their ASPs.
2. Do different types of purchasers face the same net acquisition costs for Part B prescription drugs? Net acquisition cost is the first of the pricing concepts mentioned above.
3. Which purchasers face lower and higher net acquisition costs? The MMA called for a focus on the comparison between physicians and large volume purchasers.
4. If differences in net acquisition costs exist, do they vary by drug? The answer to this question has the potential to shed light on the drug-level drivers of variation in acquisition cost as well as to guide future research to account for these differences.
5. Would differences in net acquisition costs for different types of purchasers be reflected in ASP if it were calculated by class of trade? As noted above, ASP excludes mark-ups and includes non-purchaser rebates. The report seeks to understand the magnitude of these components and thus whether addressing discrepancies at the level of ASP would also serve to address discrepancies at the level of net acquisition costs.
6. Are there differences in ASP when it is calculated for different types of purchasers? ASP is the second essential pricing concept defined in the MMA.
7. Does excluding hospitals, HMOs, or other large volume purchasers affect ASP calculations? As a practical matter, including or excluding LVPs when calculating ASPs is much more important if this choice significantly affects the ASP for one or more key drugs.
3 Although there are some exceptions to this rule, PBMs and HMOs typically do not acquire prescription
drugs. However, both PBMs and HMOs influence drug utilization via preferred drugs lists, formularies, and other utilization management tools. As a result, manufacturers are willing to pay rebates to PBMs and HMOs in order to create incentives for PBMs and HMOs to encourage the use of their products.

Abt Associates Inc. Sales of Drugs and Biologicals to Large Volume Purchasers 3
2.0 Methods
2.1 Overview of the Research Design
The project team analyzed these questions using both primary and secondary drug pricing data. The project team conducted interviews with four categories of respondents: (1) experts, (2) manufacturers of the drugs covered by Part B of Medicare, (3) market intermediaries (wholesalers and GPOs), and (4) purchasers of the drugs covered by Part B of Medicare (physicians, hospitals, HMOs and PBMs). We also requested written data on drug pricing from all groups except the experts. The primary data provided market participants’ experience and perspectives on the research questions. The primary data collection effort was also designed to yield qualitative and quantitative information about special pricing terms (such as delayed payment terms and other discounts not listed on the invoice) and manufacturer rebates, neither of which were incorporated into the secondary data, and to focus specifically on Medicare Part B drugs.
The source of secondary data on the acquisition costs of prescription drugs by class of trade was the National Sales Perspectives data (NSP), available from IMS health. The project data is summarized in Exhibit 2.1 below.
Exhibit 2.1: Overview of Project Data
Primary Data: Interviews and Written Data Interviews
Respondent Category N Target N Complete Written Data Requested Experts 8 6 None Manufacturers 9 3 Average selling prices by class of trade Market Intermediaries 14 4
Wholesalers 7 1 Discounts and rebates by class of trade Group Purchasing Organizations 7 3 Discounts and rebates by class of trade
Purchasers 58 23 Independent Physician Offices 36 7 Invoices for focus drugs Hospitals 7 12 Invoices for focus drugs HMOs 8 2 Invoices for focus drugs PBMs 7 2 Invoices for focus drugs
TOTAL: 89 36 Secondary Data
Data Source Notes Average Invoice Prices IMS All drugs.
11 retail and provider categories List Prices (AWP and WAC) MediSpan All drugs HCPC-NDC Crosswalk CMS Most Part B drugs
The primary data collection focused on six HCPCs: J0880 (darbepoetin alfa injection), Q0136 (epoetin alpha injection for non-ESRD use), J9202 (goserelin acetate implant), J9355 (trastuzumab injection), J9217 (leuprolide acetate suspension), and J9265 (paclitaxel injection).
2.2 Strengths and Limitations of the Research Data
In order to undertake any study, one must have access to adequate data. The ideal data set for a study of net acquisition costs would be based on a very large sample of acquisition cost data from a representative sample of purchasers. It would identify each purchaser’s class of trade and each

Abt Associates Inc. Sales of Drugs and Biologicals to Large Volume Purchasers 4
purchaser’s volume, both for the individual sale and on an annual basis; classes of trade would be defined in a manner consistent with the project’s objectives. This ideal data set would include all three components of net acquisition cost: the invoice price, any special pricing terms, and any rebate amount paid to the purchaser. Such data would presumably be collected from physicians and large volume purchasers or from their various suppliers.
Similarly, the ideal data for a study of ASP would contain ASP by class of trade, again with classes of trade defined in a manner that was consistent with project objectives. Such data could only come from manufacturers.
For the components of this study that dealt with net acquisition costs, we relied on a small sample of interviews, a small sample of invoices collected directly from purchasers, and the secondary data on average invoice prices from IMS Health. The strengths of the interviews were that it offered some anecdotal information regarding special pricing terms and rebates and that it offered some context for other findings. The main limitation was that the sample size was small (36 interviews) and not necessarily representative of the population of purchasers as a whole. One cannot generalize from the interview findings; one must view them as anecdotal information. Due to time constraints, the study began with a relatively small number of target interviews. In addition, response rates for some groups were lower than expected, and we did not reach the point of saturation in the interviews, that is, we did not reach the point where we believed we had captured the full potential value of this mode of data collection.
We were also concerned that some interviews were incomplete or difficult to interpret. The interview discussed very sensitive material (prescription drug pricing), and, in many cases, respondents declined to answer questions or answered them vaguely. The interviews were also extremely complex; in a few cases, upon reviewing their notes, interviewers were concerned that they and the respondents had not fully understood each other.4 This was a particular concern since there were so few interviews. Finally, the fact that response rates were very low raises concerns about bias: the respondents that we did talk to may not constitute a representative sample of the underlying population.
The strengths of the primary invoice data were that it offered invoice-level data on acquisition costs and that it offered a point of comparison and confirmation for findings based on the secondary data. It also contributed a sense of the dispersion of invoice prices within a given category of purchaser.
The invoices were collected from interview respondents following the interviews. As a result, the number of invoices was small, too small to support detailed statistical analysis, and not necessarily representative. The analysis of primary price data is based on 23 invoices from six independent physician offices and 38 invoices from 12 hospitals. In addition, this data represented invoice prices only; it did not yield insight into special pricing terms or purchaser rebates.
The main data source available for analysis was the data on average invoice prices from IMS Health. The strengths of this data were that it was based on a large representative sample of all purchasers and available for the full range of Part B drugs. While very useful, this data had several important limitations, the first being that the average invoice price (AIP) differs from average net acquisition cost because AIP does not capture special pricing terms or manufacturer rebates.
Another important limitation was the fact that the AIPs were based on broad classes of trade, many of which contained different sub-categories believed to receive differential pricing. For example, the 4 In order to respect the respondent’s privacy, Abt did not tape interviews so questionable passages could not
be double-checked.
Abt Associates Inc. Sales of Drugs and Biologicals to Large Volume Purchasers 5
hospital category contained both teaching and community hospitals. In the experience of the project team and in the opinion of some interview respondents, these two types of hospitals paid different prices for their Part B drugs. Also, the clinic category contained physician offices, clinics, and some hospital outpatient departments, including some outpatient departments that were eligible for federally-negotiated 340B pricing. Again, the different groups within this category may well pay different prices for their Part B drugs. This is also significant since the sales of drug products to 340B program participants are exempt from the ASP calculation. As a result, the average for the broad class of trade was not equal to the average for each of the sub-categories within it.
A final limitation was that, regardless of whether average invoice prices were available for finer classes of trade, the IMS data reflected average prices and did not provide a measure of price dispersion within a given class of trade. Individual buyers might face prices above or below those averages, and the IMS data that the project received did not contain measures of dispersion that could be used to establish the empirical importance of this phenomenon.
For the component of the study that dealt with ASP, the only potentia l source of data was the primary data collection from manufacturers. Three manufacturers participated in interviews, but no manufacturer submitted complete data on ASP by class of trade for a focus drug. Again, while useful for this component of the study, AIP also differed from ASP because AIP included wholesaler and distributor mark-ups and because it did not capture purchaser or non-purchaser rebates.
There are two other issues that affect the interpretation of the results of this study. The first issue is the time period of the data. The interview and invoice data were collected in the spring of 2005, shortly after the implementation of ASP-based pricing. The IMS data contained invoices from the third quarter of 2004, prior to the ASP implementation. This study provided an analysis of the market for the drug covered by Medicare at a point in time, but this market may well change in response to the new coverage and pricing environment created by the MMA.
The second issue is that classes of trade are not well-defined. The definitions of the various types of classes are not clear and consistent among market participants; several experts explicitly noted that this was a problem. In addition, market participants’ working definitions of the classes of trade are not necessarily consistent with the MMA’s implied concepts of prudent physicians and large volume purchasers.
2.3 Selection of Six HCPCs for Primary Data Collection and Focused Review
The primary data collection and some analyses of secondary data were focused on six HCPCs, presented in Exhibit 2.2. These HCPCs covered drugs typically prescribed by a range of physician specialties and for several different indications (three physician specialties and three indications). The design also featured two HCPCs for each physician type and indication, so that the project team could collect more primary physician data per HCPC than would otherwise be the case. All selected HCPCs were significant in terms of Medicare expenditures.
Four of these six focus HCPCs were used to choose the four physician samples and were the primary drug on which a purchaser interview focused. These four HCPCs are referred to as anchor HCPCs in Exhibit 2.2. A purchaser interview focused on the drugs in one of the four anchor HCPCs; however, primary data were requested for each of the six focus HCPCs.

Abt Associates Inc. Sales of Drugs and Biologicals to Large Volume Purchasers 6
Exhibit 2.2: Six HCPCs for Primary Data Collection and Focused Review
HCPC Description and Code Percent of 2003 Part B Drug
Expenditures Physician Type & Indication Product Names (Manufacturer)
darbepoetin alfa ** (J0880) 5.1 percent
Oncologist/hematologist
Anemia associated with chemotherapy
Aranesp® (Amgen)
erythropoietin alpha (Q0136) 8.9 percent
Oncologist/hematologist
Anemia associated with chemotherapy
Procrit® (Ortho)
goserelin ** (J9202) 4.3 percent
Urologist
Prostatic cancer
Zoladex® (AstraZeneca)
leuprolide acetate (J9217) 6.9 percent
Urologist
Prostatic cancer
Lupron® (TAP) Eligard® (Sanofi) Viadur® (Bayer) generics (Eon Labs, IVAX, Sicor)
paclitaxel ** (J9265) 2.5 percent
Oncologist
Breast cancer
Taxol® (BristolMyers Squibb), Onxol® (IVAX) [branded generic], generics (AmeriNet Choice, UDL, Mayne, Bedford)
trastuzumab ** (J9355) 0.9 percent
Oncologist
Breast cancer
Herceptin® (Genentech)
** These four HCPCs anchored the physician sample frame, i.e., they were used in the physician screening process.
2.4 Interviews and Primary Data Collection
Individual in-depth interviews were conducted by telephone with various groups of respondents, namely: experts, manufacturers, group purchasing organizations (GPOs), wholesalers, physicians, hospitals, HMOs5, and PBMs. All 36 interviews took place between April 1, 2005 and May 13, 2005. Exhibit 2.3 displays the project team’s target numbers of interviews and response rates, by respondent group.
5 HMOs, health maintenance organizations, were found in the 2003 Healthcare Distribution Management
Association (HDMA) Industry Profile and Healthcare Factbook, and were the top managed care firms by HMO enrollment.

Abt Associates Inc. Sales of Drugs and Biologicals to Large Volume Purchasers 7
Exhibit 2.3: Target Numbers of Interviews and Response Rates
Response Rate
Target Letters
Sent Interviews Completed Refused Ineligible
Passive Refusal6
% of Target
% of Letters
Experts 8 14 6 2 6 75% 43%
Manufacturers 9 11 3 5 3 33% 27%
GPOs 7 8 3 3 1 1 43% 38%
Wholesalers 7 20 1 3 3 13 14% 5%
Physicians 36 72 7 25 1 39 19% 10%
Hospitals 7 20 12 2 6 171% 60%
HMOs 8 18 2 2 6 8 25% 11%
PBMs 7 14 2 9 3 29% 14%
TOTAL 89 177 36 42 20 79 40% 20%
Interview procedures were designed to create an objective and accurate documentation of respondent perspectives. For each of the groups, the project team identified an objective and representative source of potential respondents and created an initial sample (Appendix B offers more details about the development of the interview samples and other methodological issues.). Unfortunately, for some groups, we had trouble reaching the target number of interviews because representatives from these organizations were unwilling to participate.
Interviews were conducted using a discussion guide. The interview guides varied for the different respondent groups, with some similar questions for all groups. The discussion guides were comprised of open-ended questions, which asked about drug acquisition processes and pricing patterns for Medicare Part B drugs, as well as specific questions pertaining to the drugs in the six focus HCPCs in our study.
At the end of the interview, all respondents except experts were asked to voluntarily submit drug pricing data. Manufacturers, wholesalers, and GPOs were asked to fill out a data collection form. In the data collection form, manufacturers were asked to provide information regarding ASP at the NDC-11 level by class of trade. Wholesalers and GPOs were asked to provide net invoice prices (relative to the so-called wholesale acquisition cost or WAC) and rebates amounts from manufacturer to purchaser at the NDC-11 level by class of trade. After the interview, the project team would customize the data collection form in light of the interview so that it reflected information gathered about relevant NDC-11s and relevant classes of trade.
Physician purchasing agents, hospitals, HMOs and PBMs were asked to submit pricing data regarding drug products in the six focus HCPCs in the form of a recent invoice. Exhibit 2.4 presents the data received.
6 Our definition of passive refusal was when we left at least five voice messages for a potential respondent
and the person never returned our call to either agree or refuse to participate. Messages clearly stated that the study was being done on behalf of CMS.
Abt Associates Inc. Sales of Drugs and Biologicals to Large Volume Purchasers 8
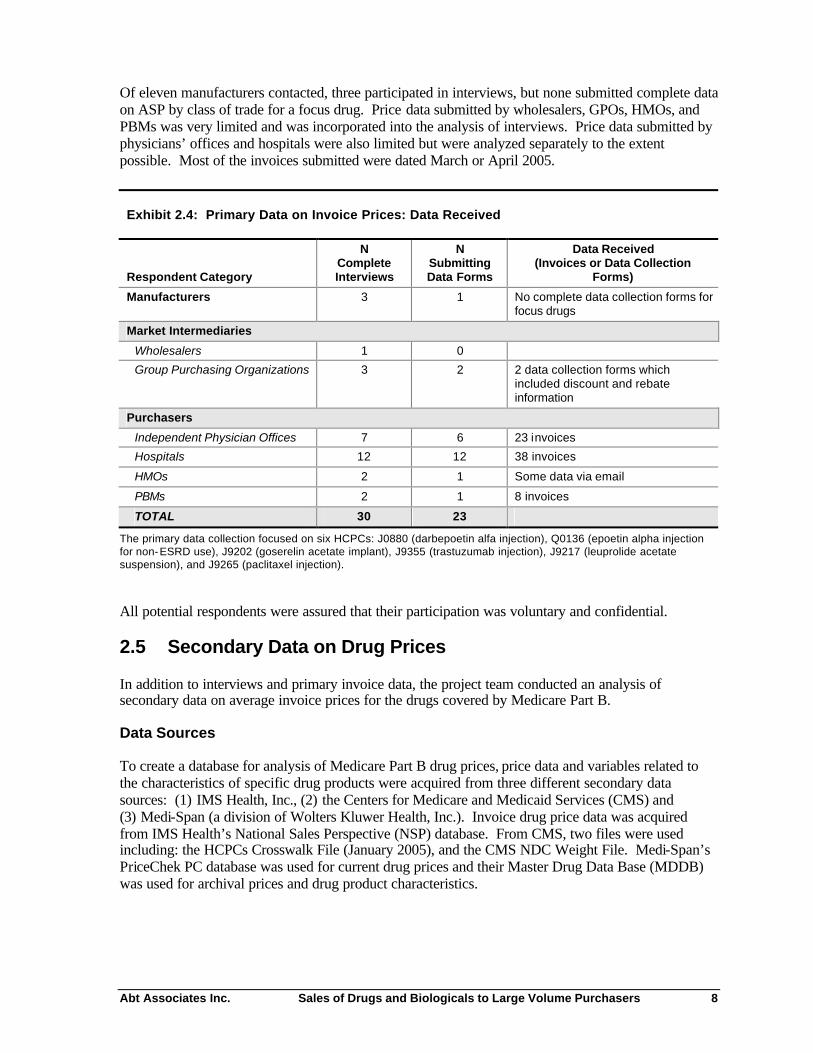
Of eleven manufacturers contacted, three participated in interviews, but none submitted complete data on ASP by class of trade for a focus drug. Price data submitted by wholesalers, GPOs, HMOs, and PBMs was very limited and was incorporated into the analysis of interviews. Price data submitted by physicians’ offices and hospitals were also limited but were analyzed separately to the extent possible. Most of the invoices submitted were dated March or April 2005.
Exhibit 2.4: Primary Data on Invoice Prices: Data Received
Respondent Category
N Complete Interviews
N Submitting Data Forms
Data Received (Invoices or Data Collection
Forms)
Manufacturers 3 1 No complete data collection forms for focus drugs
Market Intermediaries
Wholesalers 1 0
Group Purchasing Organizations 3 2 2 data collection forms which included discount and rebate information
Purchasers
Independent Physician Offices 7 6 23 invoices
Hospitals 12 12 38 invoices
HMOs 2 1 Some data via email
PBMs 2 1 8 invoices
TOTAL 30 23
The primary data collection focused on six HCPCs: J0880 (darbepoetin alfa injection), Q0136 (epoetin alpha injection for non-ESRD use), J9202 (goserelin acetate implant), J9355 (trastuzumab injection), J9217 (leuprolide acetate suspension), and J9265 (paclitaxel injection).
All potential respondents were assured that their participation was voluntary and confidential.
2.5 Secondary Data on Drug Prices
In addition to interviews and primary invoice data, the project team conducted an analysis of secondary data on average invoice prices for the drugs covered by Medicare Part B.
Data Sources
To create a database for analysis of Medicare Part B drug prices, price data and variables related to the characteristics of specific drug products were acquired from three different secondary data sources: (1) IMS Health, Inc., (2) the Centers for Medicare and Medicaid Services (CMS) and (3) Medi-Span (a division of Wolters Kluwer Health, Inc.). Invoice drug price data was acquired from IMS Health’s National Sales Perspective (NSP) database. From CMS, two files were used including: the HCPCs Crosswalk File (January 2005), and the CMS NDC Weight File. Medi-Span’s PriceChek PC database was used for current drug prices and their Master Drug Data Base (MDDB) was used for archival prices and drug product characteristics.
Abt Associates Inc. Sales of Drugs and Biologicals to Large Volume Purchasers 9
IMS Health’s National Sales Perspective Database
IMS Health’s NSP database reports the total sales dollars and number of units that were distributed to purchasers for virtually all prescription drugs on a monthly basis. The data are collected by IMS from electronic and scanned invoices that are generated by manufacturers or wholesalers when drugs are sold to purchasers. As a result, estimates of average invoice price (AIP) based on this data include all on-invoice discounts, such as including bottom line discounts.
Sales data were available from IMS at the 11-digit National Drug Code (NDC-11) level. The NDC-11 level uniquely identifies the active molecule, dosage form, strength, package size, package type, and manufacturer or marketer for each and every prescription drug product on the market. IMS monthly sales and unit volume data for major Medicare Part B drug products by class of trade at the NDC-11 level for the period January 2002 through January 2005 was analyzed for this project, although this report only shows data from the third quarter of 2004 (Q3 2004).
Data related to purchasers are grouped into thirteen broad classes of trade by IMS including: independent pharmacies, chain pharmacies, food stores, mail service pharmacies, HMOs, clinics, home health care, long-term care facilities, non-federal hospitals, federal facilities and miscellaneous (including prisons, universities, and others). Clinics are defined by IMS as an individual physician or a group of physicians located at the same address, which includes oncology clinics, outpatient dialysis facilities, OB-Gyn clinics, orthopedic clinics, outpatient emergency treatment centers, multi-specialty clinics, and other types of outpatient clinics,7 including those that are eligible for federally-negotiated prices on drugs under the 340B program. The breadth of this clinic category is unfortunate for our study because we would like to be able to distinguish among these sub-categories of purchasers.
Data Sources from CMS
The CMS HCPCS-NDC Crosswalk file (January 2005) is publicly available file that was obtained from the CMS website.8 This MS Excel file contains almost all drug HCPCs and identifies the NDCs at the 11-digit level that are related to each specific HCPC. In addition to the HCPCS-NDC crosswalk, the file also contains information for each 11-digit NDC on the labeler name, drug name, package size, package quantity, billable units per package, and billable units per 11-digit NDC.
The CMS NDC Weight File was provided to the project team directly by CMS. This file contains data at the NDC-11 level for each NDC included in the calculation of the ASP for a specific HCPC. The NDC Weight Factor is a value calculated by dividing the billable units of a specific NDC-11 sold during a certain period by the total number of billable units for all NDC-11s that are included within a specific HCPC that were sold during the same time period. The CMS NDC Weight file (Third Quarter 2004) contains NDC Weight Factors for each NDC-11 based on actual sales during the third quarter of 2004. 9 This file also contains a HCPC description and the number of billable units per package at the NDC-11 level.
Data Acquired from Medi-Span
Drug product characteristics and related background information, such as therapeutic category, patent status, and manufacturer, was acquired from the Medi-Span MDDB File. Medi-Span is a division of Wolters Kluwer Health, Inc. 7 DDD Outlet Subcategory Codes, IMS Health, October 2002. More details on IMS’ classes of trade are in
Appendix E. 8 The CMS HCPCS Crosswalk File file named ‘HCPCSCrosswalk0105.xls’ was found at the CMS website
address ‘http://www.cms.hhs.gov/providers/drugs/asp.asp’. 9 CMS provided NDC weight factors, but not ASP prices at the NDC-11 level.

Abt Associates Inc. Sales of Drugs and Biologicals to Large Volume Purchasers 10
Sample Selection
A CMS analysis of Year 2003 Medicare Allowable Charges identified the top 35 HCPCs codes in terms of Medicare expenditures.10 These Top 35 HCPCs accounted for 85 percent of Medicare expenditures for Part B drugs in CY 2003 (See Appendix D). A HCPC is a grouping code for drug products (at the NDC-11 level) that have the same chemical entity and dosage form that can be used to deliver a specific amount of medication. Each unique dosage form, strength, and package size of a drug produced by each manufacturer is assigned a unique NDC-11 number. The project team chose to focus on the 25 HCPCs that were most significant in terms of 2003 Medicare expenditures and that met other project criteria, for example, vaccines, respiratory drugs, and miscellaneous categories were removed at the request of CMS. Two of the HCPCs, adenosine injection (HCPC J0151) and verteporfin injection (HCPC J3395), did not have any NDC-11s attributed to them in the third quarter 2004 weight file and were therefore removed from the analysis. Finally, Hylan G-F 20 injection (HCPC J7320) did not have any IMS data available for the only weighted NDC-11 and was also removed from analysis. The remaining 25 HCPCs were linked with 165 drug products at the NDC-11 level. 11 These HCPCs and their related drug products formed the analytic data set that was the focus for the analysis in this study.
Creation of the Analytic File
Data from the IMS NSP database was selected at the drug molecule level, since the IMS database does not link the drug products (NDC-11) into HCPCs groups. Sales volume (in dollars) and number of package units sold for each of the classes of trade were extracted at the NDC-11 level for each molecule that was described by one of the 25 study HCPCs.12 Data was selected for July, August and September of 2004 which is the same time period as the ASP data submitted by manufacturers to CMS for calculating the third quarter 2004 ASP that will be applied as a payment limit in the first quarter of 2005. The IMS NSP data was extracted and exported from the IMS’ Dataview database into MS Excel. Stata version 8.0 was used to perform calculations with this data set such as calculation of price per billable unit for each NDC-11 and to conduct price analysis for various groupings of NDC-11s or classes of trade.
The IMS NSP data was matched by NDC-11 number to the data found in the CMS HCPCS-NDC Crosswalk and the CMS NDC Weight File to map each NDC-11 into one of the 25 study HCPCs. The IMS NSP sales and package units data were used at the NDC-11 level to calculate a price per package unit. Price per dose was then calculated for each NDC-11 by dividing the IMS price per package unit by the Billable Units Per NDC-11 provided in the CMS NDC Weight File.
Construction of Analytic Variables and Analytic Methods
The final analytic file created in Stata contained an average invoice price per dose (AIP) for each class of trade for each of the NDC-11s that comprise the 25 study HCPCs for each month across the time period January 2002 to December 2004. For each NDC-11 and each class of trade, the project team created a weight (the IMS class-specific weight) that reflected that NDC-11’s share of doses within the HCPC (defined in terms of the set of NDC-11s that the CMS NDC weight file associated
10 This report on CMS Year 2003 Medicare Allowable Charges was provided by CMS. 11 According to the third quarter 2004 CMS NDC Weight File. 12 Units are defined for each NDC-11 in the IMS NSP database as number of packages (equivalent to a stock
keeping unit, e.g., 4 vials of 10 ml each constitute one unit), extended units (equivalent to total package quantity, e.g., 4 vials of 10 ml each constitute 40 ml of extended units) and eaches (equivalent to package quantity, e.g., 4 vials of 10 ml each constitute 4 eaches). In our analysis, IMS units are used.

Abt Associates Inc. Sales of Drugs and Biologicals to Large Volume Purchasers 11
with the HCPCs). The price per dose was then multiplied by the IMS class specific weight and then summed across a whole HCPC to calculate an AIP for the class of trade. AIPs based on these class- specific weights were calculated for each class of trade and for the total market (all classes of trade combined excluding federal facilities). The project team also calculated and analyzed AIPs using the CMS weights, but these analyses are not shown in the report to maintain ASP data confidentiality.13
Invoice prices at the HCPC level may vary by class of trade for two or more reasons. First, purchasers in different classes of trade may pay a different invoice price when purchasing the same NDC-11 drug product from a manufacturer or wholesaler. This first source of variation in invoice prices by class of trade can be isolated by analyzing an alternate AIP that is defined using standardized weights. This method assumes that each class of trade purchases the same mix from the basket of NDC-11s within a HCPC, so that any variation in the alternate AIP that is observed can be attributed solely to variations in price of specific NDC-11s. For this purpose, we constructed an alternate AIP, using weights based on combined volumes for all classes in the IMS data.
Second, purchasers in different classes of trade may acquire different drug products (with different NDC-11s) to deliver the amount of a medication specified by a certain HCPC. To analyze this second source of variation, one can compare the result obtained with the class-specific weights to the result obtained with the all-class weights.
3.0 Results: Interviews
The project team interviewed 36 experts and market participants. Appendix C offers a brief description of the interview respondents.
3.1 Distribution Process
Major Purchaser Types
Interview respondents agreed that the major purchasers of Part B drugs were physicians and hospitals, not GPOs, HMOs or PBMs. The role of GPOs is to negotiate contracts on behalf of purchasers but not to take possession of drugs.
Some HMOs, namely those with staff physicians or who own and operate pharmacies, buy through wholesalers at contract prices. The majority of HMOs, however, are primarily a financial umbrella and may never directly purchase or handle drug products. While eight HMOs initially agreed to be interviewed for this project, only two purchased drugs and qualified for the study. This is direct evidence that most HMOs do not acquire the drugs covered by Part B.
Similarly, the traditional function of the PBM is to negotiate prices between providers and insurers and contract with networks of retail pharmacies, but not to take physical possession of drug products. PBMs with mail order houses or specialty pharmacies may directly purchase and take possession of drug products for distribution through these specialized delivery channels 14. There are also specialty PBMs who focus only on high cost and limited use drug products (such as Medicare Part B covered drugs). While eleven PBMs initially agreed to be interviewed for this project, only two purchased 13 To make the IMS all-class-weighted AIP and the CMS -weighted AIP comparable to the Average Sales
Price, sales to federal facilities were excluded from the AIPs that were calculated for the total market with all classes of trade combined.
14 Most of the largest PBMs do own their own mail service pharmacy.

Abt Associates Inc. Sales of Drugs and Biologicals to Large Volume Purchasers 12
drugs and therefore qualified for this study. Again, this shows that most PBMs do not acquire Part B drugs.
Channels of Distribution
There was consensus in the interviews that physicians often purchased drugs from specialty distributors, specialty wholesalers, or specialty divisions within major wholesalers while hospitals typically purchased via major wholesalers. The view that physicians and hospitals work with different distribution channels was confirmed by respondents’ description of their own distribution and acquisition practices. While the use of different distribution channels is not evidence of differences in net acquisition costs, it may facilitate the persistence of such differences.
In response to questions about distribution channels, each manufacturer reported a different approach to distributing the product under discussion. Two firms shipped to physicians via one or more specialty distributors. The third manufacturer distributed its drug products to physicians through major wholesalers using a charge-back system. In a charge-back system, a wholesaler acquires a drug from a manufacturer at WAC (wholesale acquisition cost, a list price not necessarily reflecting actual acquisition costs), or some other list price. The wholesaler then sells the drug at a different price, often below WAC or the other list price, and then charges the difference back to the manufacturer. All three manufacturers distributed to the hospital class of trade using major wholesalers and charge-backs.
All physicians reported that their clinics purchased most of their drugs from specialty distributors or specialty wholesalers, while every hospital purchased drugs through at least one of the big three wholesalers (McKesson, AmeriSource-Bergen, or Cardinal).
In hospitals, some respondents indicated that they also negotiated directly with manufacturers for price and discounts on certain drugs. This practice was more common among the academic medical centers and large multi-hospital systems than it was for community hospitals. Some of these academic centers suggested that they were able to obtain better direct discounts from manufacturers for a variety of reasons including: size, prestige in a given specialty (e.g., oncology, cardiology, orthopedics, etc.), and ability to influence young physicians’ choices with regard to particular drugs.
Both HMOs and both PBMs worked with a major wholesaler (not necessarily the same wholesaler).
3.2 Access to Special Pricing Terms and Rebates
Access to Special Pricing Terms
In conversations with purchasers, interviewers inquired about the purchasers’ access to special pricing terms from wholesalers and access to rebates. Manufacturers were also invited to comment on rebates. We found that there were two basic types of discounts from wholesalers or distributors – prompt pay discounts and volume or prime vendor discounts.
Prompt Pay Discounts
Prompt pay discounts were discounts for the timely payment of an invoice that reduced actual acquisition costs below the amount listed on the invoice. Purchasers’ comments offered anecdotal evidence that physicians might derive less benefit from prompt pay discounts than hospitals.
Each of the physician respondents indicated that a prompt-pay discount was available if they paid for drugs within a certain time frame. The level of the discount ranged from one to two and one-half percent. One of the two clinics that reported having a two and one-half percent discount had their

Abt Associates Inc. Sales of Drugs and Biologicals to Large Volume Purchasers 13
drug payments directly deducted from their bank account. The other clinic had to pay their invoice within one week in order to receive its discount.
Respondents from two of the clinics reported that their clinic almost always received its prompt-pay discounts. It was unclear whether four of the respondents were able to receive the prompt-pay discount every time they purchased drugs. One office was unable to take advantage of its one percent prompt pay discount. Paying its invoices immediate ly would require that this respondent secure and pay the finance charges on a one million dollar line of credit. Since commercial payers and Medicare generally do not pay this clinic for 45-60 days 15, the clinic was unable to pay their drug invoices immediately.
All hospital respondents reported prompt-pay discounts from their wholesalers, and a few even received a discount for pre-paying drug costs.
One of the two HMOs received prompt-pay discounts; the other did not comment. Both PBMs received these discounts.
Volume Discounts
Wholesaler volume discounts are usually based on two criteria – the total dollar volume of all drugs purchased over time from the same wholesaler and/or the total share of an end purchaser’s volume that is purchased from the wholesaler serving as their ‘prime vendor.’ Like manufacturer rebates, they are paid after-the-fact and do not appear on invoices.
Again, the interviews offered anecdotal evidence that hospitals enjoyed better access to such discounts than physicians. Only two respondents in physicians’ offices indicated that they received volume discounts on the drugs they purchased. Every hospital reported that purchase volume influenced their discounts, both from wholesalers and from manufacturers from whom drugs were directly purchased. Manufacturer-based volume discounts are usually limited to purchases of a specific drug, or sometimes a bundle of specific drugs, from the manufacturer within a certain time period.
Both PBMs negotiated for wholesaler discounts based on volume.
Access to Rebates
When asked to discuss rebates, one manufacturer described them as “performance rewards to end customers,” recognizing sales, growth in sales, market share, and growth in market share. Rebates are typically administered after-the-fact based on performance over some period of time; they are typically paid directly by the manufacturer to the provider. “Market share rebates” reward the use of one drug in a competitive therapeutic class at a particular level; for example, given a choice of two drugs for a condition, a provider might receive a rebate if one of the drugs was used in 80 or 85 percent of cases. “Market basket rebates” recognize a provider’s use of a set of several drugs from the same manufacturer and are paid if the total use of these drugs surpasses a certain market share. No manufacturer was willing to discuss the magnitude of rebates.
The interviews suggested that physicians might have been disadvantaged relative to hospitals in terms of access to manufacturer rebates. Manufacturer rebates were not common at any of the physician clinics interviewed. The respondents who did report such rebates indicated that they were only available for a small number of drugs (generally less than five). Two respondents reported that the
15 It is likely that this respondent relied on a paper process to bill Medicare. Medicare pays electronic claims
within 30 days of receipt.

Abt Associates Inc. Sales of Drugs and Biologicals to Large Volume Purchasers 14
manufacturer rebates their clinics received were tied to either volume or market share. One respondent suggested that rebates were only available on brand name drugs, never on generic drugs. Respondents at one manufacturer emphasized that, for their product, non-purchaser rebates were important.
Each hospital received some direct manufacturer rebates, typically amounting to about one to two percent of their annual purchase volume. At the larger institutions, where total purchases may exceed $100 million, this represented a significant amount. Many hospitals claimed that they were trying to migrate away from rebates, since they are always post hoc, and hence are difficult to incorporate rationally into their financial management and purchase planning. Some multi-hospital systems also mentioned that rebates were difficult to allocate among members.
Both HMOs surveyed received manufacturer rebates on certain drugs based upon formulary placement, volume, market-share, and market-basket performance, but neither received rebates for any of the four anchor Medicare Part B drugs discussed in detail.
The two PBMs that were interviewed had formularies and they each received rebates both for placement of drugs on the formulary and for driving market share movement (increasing the percent of prescriptions in a certain therapeutic class for a specific drug product). Both PBMs also received direct volume discounts from manufacturers, independent of their wholesaler arrangements. One PBM also indicated that it received fees from some manufacturers for administering the rebates that these manufacturers paid directly to the PBM’s customers.
3.3 Variation in Net Acquisition Costs
Existence of Variation
When asked whether prices varied across different classes of purchasers, one respondent replied “Absolutely.” There was widespread agreement among all groups of interview respondents, other than manufacturers, that net acquisition costs varied for different types of purchasers.
Manufacturers were circumspect on this point. Respondents at one manufacturer could not comment on this question; they noted that, because they worked with a distributor, they did not know what prices physicians ultimately paid to acquire their product; that was at the distributor’s discretion. Respondents at the second stated that the pricing distributions for different classes of trade overlapped (contracts were based on size and performance attributes as opposed to class of trade), but that generally smaller customers and the retail class of trade paid more. The third said, without reservation, that physicians and hospitals were eligible for the very same discounts.
Interviewers inquired whether differences in net acquisition costs were due to different purchasers paying different prices for the same drug or whether they were due to different purchasers choosing different drugs (NDC-11s) within a given molecule. Referring the specific drug under discussion, these three manufacturers stated that, to the extent difference in net acquisition costs existed, they stemmed from purchasers buying the same drug product (at the NDC-11 level) at different prices; there were not important differences in which classes of trade acquired different products within a molecule. A few physicians noted that small purchasers might also buy different NDC-11s (e.g., smaller package sizes with fewer doses) within a given molecule, because they needed fewer doses over time.
Interviewers also asked about the role of wholesaler or distributor mark-ups in determining net acquis ition costs and variation in net acquisition cost. Interview respondents agreed that pricing decisions made at the manufacturer level were the drivers of variation in acquisition costs and that

Abt Associates Inc. Sales of Drugs and Biologicals to Large Volume Purchasers 15
wholesalers’ and distributors’ mark-ups were much less important. No respondent emphasized that wholesaler or distributor mark-ups were large; in fact, some emphasized that they were small. No respondent emphasized that these mark-ups varied by class of trade, although, as just noted, there was some evidence of variation in purchasers’ access to special pricing terms from their wholesaler or distributor. While wholesalers and GPOs facilitate drug distribution and price negotiation, all four of these respondents (three GPOs and one wholesaler) were adamant that it is manufacturers who effectively set prices for all brand name drugs.
The implication of this perception is that differences in net acquisition costs would likely be reflected in ASP if it were calculated by class of trade. As noted earlier, one manufacturer emphasized that, for their product, non-purchaser rebates were important.
Drivers of Variation
Respondents cited several interacting drivers of the variation in acquisition costs. Some of these drivers pertained to purchaser characteristics and others to drug product characteristics.
Purchaser Characteristics
Class of trade, such as physician, hospital, or retail pharmacy: Several experts and all intermediaries cited class of trade itself as a driver of differences in pricing. 16 As noted above, both respondents at PBMs (who had both formerly been in specialty pharmacies) noted that their net acquisition costs had risen with the change in class of trade.
Ability to influence market share directly: Five of the six experts and all of the intermedia ries volunteered that the ability to influence market share was a key driver of differences in acquisition costs. Some purchasers, such as PBMs or HMOs with salaried physicians, are able to affect utilization because they establish a formulary or a preferred drug list that influences prescribers’ choices. Perceived status may also create influence; a prominent teaching hospital sets lifelong prescribing patterns for young physicians and influences physicians in the surrounding community. Purchasers with the ability to influence market share are typically compensated after the fact via rebates. Experts indicated that some classes of trade, notably retail pharmacies, typically are ineligible for (or are not offered) market share rebates from brand manufacturers.
Volume: Five of the six experts and three of the four intermediaries stated clearly that volume was a driver of discounts and rebates especially within, as well as sometimes between, classes of trade.
Purchaser expertise: Two respondents pointed out that the market for prescription drugs is very complicated and that more sophisticated purchasers were in a better position to navigate that market and secure the lowest prices.
Drug Characteristics
Therapeutic competition: According to several respondents, unique (patent protected) products are sold at list price (WAC) with little variation. Once a manufacturer is forced to compete for market share against a therapeutic alternative, then the manufacturer may begin to provide discounts and rebates and to do so selectively.
16 The implications of class of trade pricing are described in more detail in a CMS report, Schondelmeyer SW
and MV Wrobel, Medicaid and Medicare Drug Pricing: Strategy to Determine Market Prices, Final Report, Contract #500-00-0049, Task Order 1, August 30, 2004. See pages 16 to 19 and other sections.

Abt Associates Inc. Sales of Drugs and Biologicals to Large Volume Purchasers 16
Generic competition: Similarly, generic competition drives down the price of prescription drugs. Two respondents stated that because the market for generic drugs is so competitive, all purchasers have access to excellent pricing. While generic competition eliminates monopoly-pricing power, it does not necessarily equalize prices among purchasers in different classes of trade. The ability to influence which manufacturer’s drug product is used, when multiple generic drug products are available, often leads to a lower price.
Whether the drug is an oncology drug: Two respondents suggested that markets for oncology drugs are different than the markets for other pharmaceutical products. First, as one respondent noted, oncologists received greater discounts than other physicians. Also, as another respondent noted, unlike most physicians, it is to oncologists’ advantage to work with specialty distributors rather than major wholesalers. Large networks of oncologists existed to serve as an “oncology GPO” or a specialty distributor.
Other Characteristics
Competition among suppliers: Two experts noted that specialty wholesalers and distributors would try to match market prices for particular drugs.
Ranking of Purchaser Types
When asked to rank which classes of trade faced higher net acquisition costs, interviews with four experts suggested that physicians pay more than hospitals while interviews with 2 GPOs and 1 expert suggested a mixed picture across drugs.
Experts were asked to discuss general patterns among all of the drugs covered by Part B of Medicare. In this context, four of the experts clearly stated that physicians faced higher net acquisition costs than hospitals; one stated that results were mixed.
Respondents at GPOs were asked to discuss each of the six focus drugs and provide associated price data. Respondents from two of the three GPOs were willing to discuss discounts and rebates in the interview and to submit data collection forms. Both of these respondents agreed that (1) for two of the six focus drugs physicians and hospitals faced similar net acquisition costs; (2) for two of the six focus drugs, physicians faced higher net acquisition costs than hospitals. In the latter case, both differential invoice prices and differential rebates contributed to the total net difference. There was not a clear consensus regarding the remaining two focus drugs.
The belief among some interview respondents that physicians paid more than hospitals is noteworthy because it differs from the findings on invoice prices in the secondary data analysis. This underscores the need for data on off-invoice price concessions to determine how net acquisition costs compare across provider types.
4.0 Results: Secondary Data Analysis
This chapter discusses results of an analysis of secondary drug price data for the 25 study HCPCs. As emphasized in the methods chapter, it is important to remember the limitations of this data. First, the average invoice price (AIP) was different from the average net acquisition cost because it did not capture special pricing terms or manufacturer rebates. Second, the volumes and average invoice prices presented below were calculated for broad classes of trade, many of which contained different sub-categories believed to receive differential pricing. For example, the “clinic” category contained

Abt Associates Inc. Sales of Drugs and Biologicals to Large Volume Purchasers 17
physician offices, clinics, and some hospital outpatient departments, including some hospital outpatient departments that were eligible for federally-negotiated 340B pricing.
4.1 Major Purchasers
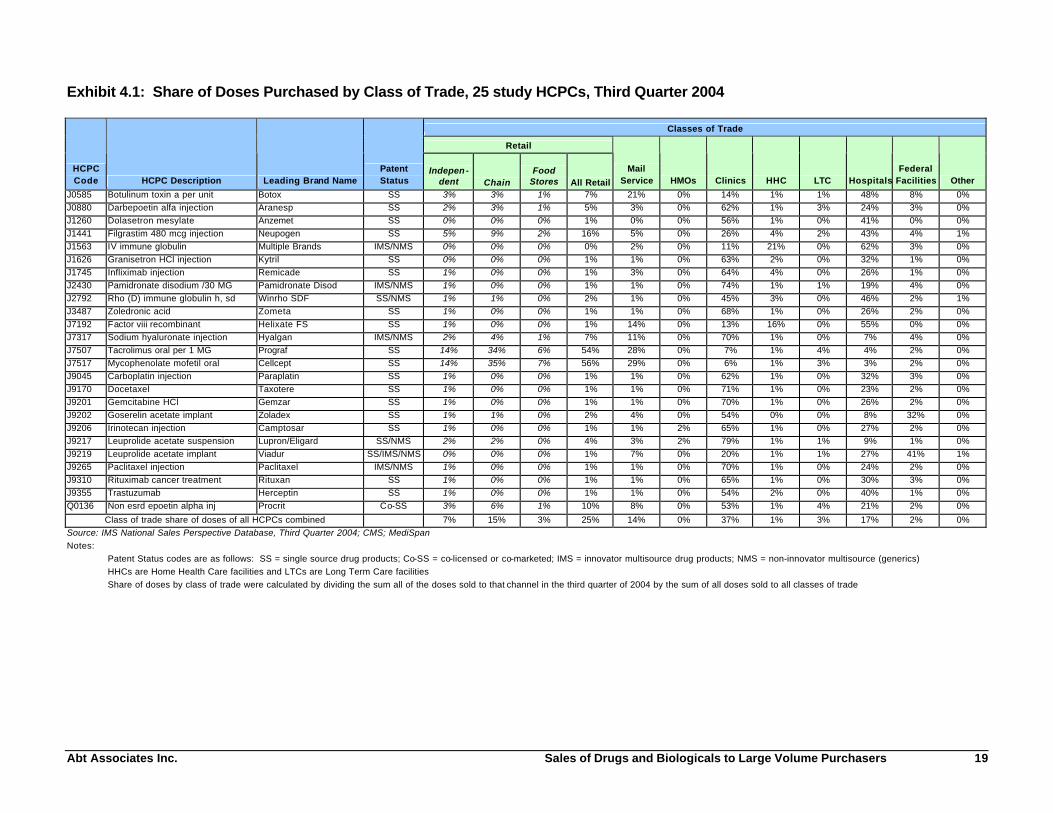
The 25 study HCPCs and related drug products accounted for nearly two-thirds (63 percent) of the Medicare Part B drug expenditures in 2003. The share of doses (Exhibit 4.1) and the share of dollars (Exhibit 4.2) for drug products in each of the 25 study HCPCs was examined for each of the classes of trade.
Clinics or hospitals were the primary purchasers of doses in 22 of the 25 study HCPCs during the third quarter of 2004 (Exhibit 4.1). In addition, sales were typically split between the clinic and the hospital classes of trade. For 20 of the 25 drugs, both the clinic and the hospitals classes of trade each had at least ten percent of total sales.
The retail classes of trade were the primary purchasers of drug products in two of the three remaining HCPCs. Federal facilities were the primary purchaser of drug products in the third remaining HCPC code. Mail service pharmacies, HMOs, home health care and long term care facilities were never primary purchasers for any of these 25 drugs. The following discussion classifies the 25 HCPCs into four groups based on the primary purchaser of doses for the drug products in the HCPC.
Clinics as Primary Purchasers
Clinics were the primary purchasers for 17 of the 25 study HCPCs, purchasing over one-half of the doses for these drugs. For all but two of these 17 HCPCs, hospitals accounted for the second largest share of drug purchases with shares ranging from nine percent to 41 percent of all doses. Combined, clinics and hospitals purchased between 62 and 97 percent of the doses for drug products in these 17 HCPCs. The retail classes of trade accounted for a fairly small proportion of doses in the 17 HCPCs with drug purchases predominantly through clinics. Thirteen of these 17 HCPCs had less than two percent of all doses sold through the retail classes of trade.
All 17 of the HCPCs provided to patients primarily through outpatient clinics or physicians’ offices were injectible drug products. Fifteen of the 17 HCPCs, and related drug products, primarily administered in clinics or physicians’ offices were for treatment of various forms of cancer or symptoms related to chemotherapy. Eleven of these HCPCs were chemotherapy, while four were for treating symptoms of chemotherapy such as anemia or nausea and vomiting. The other two HCPCs administered most often by physicians in their office or a clinic were for arthritis or other inflammatory problems [(J1745) infliximab and (J7317) sodium hyaluronate injection].
Hospitals as Primary Purchasers
Hospitals purchased the largest share of doses in five of the 25 study HCPCs and for two of these HCPCs hospitals accounted for over one-half of the doses. Clinics were also major purchasers of drug products in these five HCPCs, purchasing between 11 and 45 percent of all doses. These two classes of trade (i.e., hospitals and clinics) purchased between 62 and 90 percent of all doses of these five HCPCs. For one HCPC, hospitals and clinics sold a nearly equal proportion of doses with 46 percent to hospitals and 45 percent to clinics.
Four of the five HCPCs that were sold predominately through hospitals were blood products including drugs for support of transplant, or other immuno-suppressed, patients and factor VIII for treatment of hemophiliac patients. The fifth HCPC sold mostly through hospitals was botulinum toxin A used for muscle paralysis, spasm control, and for other purposes.

Abt Associates Inc. Sales of Drugs and Biologicals to Large Volume Purchasers 18
The retail classes of trade did not purchase a substantial volume of doses for drug products in three of these HCPCs (less than two percent), but did purchase seven and 16 percent for the other two HCPCs. Home health care providers did purchase a sizeable proportion for two of these HCPCs (16 and 21 percent). These two HCPCs were also the only HCPCs where home health care providers purchased more than four percent of the total drug doses.
Retail Classes of Trade as Primary Purchasers
The retail classes of trade generally purchased a low proportion of the doses for most of the study HCPCs (less than two percent for 16 of the HCPCs and less than 17 percent for 23 of the HCPCs). However, retail pharmacies did purchase the majority of doses for drug products in two of the HCPCs: mycophenolate mofetil, oral (J7517), and tacrolimus, oral (J7507). Notably, these are the only two HCPCs among the 25 study HCPCs that are for non-injectible dosage forms of drugs (i.e., they are both oral medications). Mail service pharmacies also purchased a substantial share of the doses for mycophenolate mofetil, oral (J7517) and tacrolimus, oral (J7507). Clinics purchased less than seven percent of the doses for each of these two HCPCs for oral medication, while hospitals purchased less than four percent of the doses.
Federal Facilities as Primary Purchasers
Finally, the drugs in one study HCPC had 41 percent of all doses flow through federal facilities with the remainder of the doses divided primarily among hospitals (27 percent), clinics (21 percent), and mail service pharmacies (7 percent). The HCPC (J9219) was for leuprolide acetate implant, which is used primarily for prostate cancer. The treatment of prostate cancer in Veterans Administration hospitals would explain the high percentage of doses purchased for federal facilities.
Other Purchasers
HMOs did not purchase a substantial proportion of doses for any of the 25 HCPCs and purchased more than one percent of all doses for only two HCPCs. This class of trade purchased less than one-half of one percent of all doses for the remaining 23 study HCPCs. The IMS data did not include PBMs as a class of trade, and, as discussed earlier, pharmacy benefit managers (PBMs), in general, do not purchase drug products directly from manufacturers or wholesalers.
Mail service pharmacies, home health care facilities, and long term care facilities were not the primary purchasers of drug products in any of the 25 study HCPCs. Mail service pharmacies purchased less than two percent of all doses for 12 of the 25 study HCPCs and they purchased between two and 29 percent of the doses for the remaining 13 HCPCs. Home health care facilities purchased less than two percent of the doses for 19 of the 25 study HCPCs, and they purchased between two and 21 percent of the doses for the six remaining HCPCs. Long term care facilities purchased less than two percent of all doses for 22 of the 25 study HCPCs and they purchased between two and four percent of the doses for the remaining three HCPCs.
Abt Associates Inc. Sales of Drugs and Biologicals to Large Volume Purchasers 19
Exhibit 4.1: Share of Doses Purchased by Class of Trade, 25 study HCPCs, Third Quarter 2004
Classes of Trade
Retail
HCPC Code HCPC Description Leading Brand Name
Patent Status
Indepen- dent Chain
Food Stores All Retail
Mail Service HMOs Clinics HHC LTC Hospitals
Federal Facilities Other
J0585 Botulinum toxin a per unit Botox SS 3% 3% 1% 7% 21% 0% 14% 1% 1% 48% 8% 0% J0880 Darbepoetin alfa injection Aranesp SS 2% 3% 1% 5% 3% 0% 62% 1% 3% 24% 3% 0% J1260 Dolasetron mesylate Anzemet SS 0% 0% 0% 1% 0% 0% 56% 1% 0% 41% 0% 0% J1441 Filgrastim 480 mcg injection Neupogen SS 5% 9% 2% 16% 5% 0% 26% 4% 2% 43% 4% 1% J1563 IV immune globulin Multiple Brands IMS/NMS 0% 0% 0% 0% 2% 0% 11% 21% 0% 62% 3% 0% J1626 Granisetron HCl injection Kytril SS 0% 0% 0% 1% 1% 0% 63% 2% 0% 32% 1% 0% J1745 Infliximab injection Remicade SS 1% 0% 0% 1% 3% 0% 64% 4% 0% 26% 1% 0% J2430 Pamidronate disodium /30 MG Pamidronate Disod IMS/NMS 1% 0% 0% 1% 1% 0% 74% 1% 1% 19% 4% 0% J2792 Rho (D) immune globulin h, sd Winrho SDF SS/NMS 1% 1% 0% 2% 1% 0% 45% 3% 0% 46% 2% 1% J3487 Zoledronic acid Zometa SS 1% 0% 0% 1% 1% 0% 68% 1% 0% 26% 2% 0% J7192 Factor viii recombinant Helixate FS SS 1% 0% 0% 1% 14% 0% 13% 16% 0% 55% 0% 0% J7317 Sodium hyaluronate injection Hyalgan IMS/NMS 2% 4% 1% 7% 11% 0% 70% 1% 0% 7% 4% 0% J7507 Tacrolimus oral per 1 MG Prograf SS 14% 34% 6% 54% 28% 0% 7% 1% 4% 4% 2% 0% J7517 Mycophenolate mofetil oral Cellcept SS 14% 35% 7% 56% 29% 0% 6% 1% 3% 3% 2% 0% J9045 Carboplatin injection Paraplatin SS 1% 0% 0% 1% 1% 0% 62% 1% 0% 32% 3% 0% J9170 Docetaxel Taxotere SS 1% 0% 0% 1% 1% 0% 71% 1% 0% 23% 2% 0% J9201 Gemcitabine HCl Gemzar SS 1% 0% 0% 1% 1% 0% 70% 1% 0% 26% 2% 0% J9202 Goserelin acetate implant Zoladex SS 1% 1% 0% 2% 4% 0% 54% 0% 0% 8% 32% 0% J9206 Irinotecan injection Camptosar SS 1% 0% 0% 1% 1% 2% 65% 1% 0% 27% 2% 0% J9217 Leuprolide acetate suspension Lupron/Eligard SS/NMS 2% 2% 0% 4% 3% 2% 79% 1% 1% 9% 1% 0% J9219 Leuprolide acetate implant Viadur SS/IMS/NMS 0% 0% 0% 1% 7% 0% 20% 1% 1% 27% 41% 1% J9265 Paclitaxel injection Paclitaxel IMS/NMS 1% 0% 0% 1% 1% 0% 70% 1% 0% 24% 2% 0% J9310 Rituximab cancer treatment Rituxan SS 1% 0% 0% 1% 1% 0% 65% 1% 0% 30% 3% 0% J9355 Trastuzumab Herceptin SS 1% 0% 0% 1% 1% 0% 54% 2% 0% 40% 1% 0% Q0136 Non esrd epoetin alpha inj Procrit Co-SS 3% 6% 1% 10% 8% 0% 53% 1% 4% 21% 2% 0%
Class of trade share of doses of all HCPCs combined 7% 15% 3% 25% 14% 0% 37% 1% 3% 17% 2% 0% Source: IMS National Sales Perspective Database, Third Quarter 2004; CMS; MediSpan Notes: Patent Status codes are as follows: SS = single source drug products; Co-SS = co-licensed or co-marketed; IMS = innovator multisource drug products; NMS = non-innovator multisource (generics) HHCs are Home Health Care facilities and LTCs are Long Term Care facilities Share of doses by class of trade were calculated by dividing the sum all of the doses sold to that channel in the third quarter of 2004 by the sum of all doses sold to all classes of trade

Abt Associates Inc. Sales of Drugs and Biologicals to Large Volume Purchasers 20
Exhibit 4.2: Share of Dollars by Class of Trade, 25 study HCPCs, Third Quarter 2004
Classes of Trade
Retail
HCPC Code HCPC Description Leading Brand Name
Patent Status
Indepen-dent Chain
Food Stores All Retail
Mail Service HMOs Clinics HHC LTC Hospitals
Federal Facilities Other
J0585 Botulinum toxin a per unit Botox SS 3% 4% 1% 8% 21% 0% 12% 2% 1% 51% 5% 0%
J0880 Darbepoetin alfa injection Aranesp SS 2% 3% 1% 6% 3% 0% 64% 1% 4% 20% 2% 0%
J1260 Dolasetron mesylate Anzemet SS 0% 0% 0% 1% 0% 0% 46% 1% 0% 52% 0% 0%
J1441 Filgrastim 480 mcg injection Neupogen SS 6% 11% 2% 19% 5% 0% 25% 4% 2% 43% 3% 1%
J1563 IV immune globulin Multiple brands IMS/NMS 0% 0% 0% 0% 2% 0% 12% 23% 0% 60% 2% 0%
J1626 Granisetron HCl injection Kytril SS 1% 0% 0% 1% 2% 0% 58% 4% 1% 34% 0% 0%
J1745 Infliximab injection Remicade SS 1% 0% 0% 1% 3% 0% 64% 4% 0% 26% 1% 0%
J2430 Pamidronate disodium /30 MG Pamidronate Disod IMS/NMS 1% 1% 0% 2% 1% 0% 70% 2% 1% 20% 3% 0%
J2792 Rho (D) immune globulin h, sd Winrho SDF SS/NMS 1% 1% 0% 2% 1% 0% 44% 3% 0% 47% 2% 1%
J3487 Zoledronic acid Zometa SS 1% 0% 0% 1% 2% 0% 68% 1% 0% 27% 2% 0%
J7192 Factor viii recombinant Helixate FS SS 0% 0% 0% 0% 13% 0% 11% 16% 0% 58% 1% 0%
J7317 Sodium hyaluronate injection Hyalgan IMS/NMS 2% 4% 1% 7% 11% 0% 71% 1% 0% 7% 3% 0%
J7507 Tacrolimus oral per 1 MG Prograf SS 15% 35% 7% 57% 28% 0% 6% 1% 4% 4% 1% 0%
J7517 Mycophenolate mofetil oral Cellcept SS 14% 37% 7% 58% 28% 0% 5% 1% 3% 3% 1% 0%
J9045 Carboplatin injection Paraplatin SS 1% 0% 0% 1% 1% 0% 59% 1% 0% 35% 2% 0%
J9170 Docetaxel Taxotere SS 1% 0% 0% 1% 1% 0% 70% 1% 0% 24% 1% 0%
J9201 Gemcitabine HCl Gemzar SS 1% 0% 0% 1% 1% 0% 70% 1% 0% 26% 1% 0%
J9202 Goserelin acetate implant Zoladex SS 1% 2% 0% 4% 4% 0% 62% 0% 1% 11% 18% 0%
J9206 Irinotecan injection Camptosar SS 1% 0% 0% 1% 1% 2% 65% 1% 0% 27% 2% 0%
J9217 Leuprolide acetate suspension Lupron/Eligard SS/NMS 3% 4% 1% 9% 8% 2% 63% 2% 3% 13% 1% 0%
J9219 Leuprolide acetate implant Viadur SS/IMS/NMS 1% 1% 0% 2% 14% 0% 23% 3% 1% 30% 24% 1%
J9265 Paclitaxel injection Paclitaxel IMS/NMS 1% 0% 0% 2% 2% 1% 65% 2% 1% 27% 1% 0%
J9310 Rituximab cancer treatment Rituxan SS 1% 0% 0% 1% 1% 0% 66% 1% 0% 30% 2% 0%
J9355 Trastuzumab Herceptin SS 1% 0% 0% 1% 1% 0% 54% 2% 0% 41% 1% 0%
Q0136 Non esrd epoetin alpha inj Procrit Co-SS 6% 7% 2% 15% 7% 0% 43% 2% 7% 25% 2% 0% Class of trade share of sales volume of all HCPCs combined 3% 3% 1% 6% 4% 0% 60% 2% 2% 24% 1% 0%
Source: IMS National Sales Perspective Database, Third Quarter 2004; CMS; MediSpan Notes:
Patent Status codes are as follows: SS = single source drug products; Co-SS = co-licensed or co-marketed; IMS = innovator multi-source drug products; NMS = non-innovator multi-source (generics) HHCs are Home Health Care facilities and LTCs are Long Term Care facilities
Abt Associates Inc. Sales of Drugs and Biologicals to Large Volume Purchasers 21
4.2 Average Invoice Prices
Variation in Average Invoice Prices per dose (AIP) by Class of Trade
AIP varied considerably among the three major classes of trade purchasing Part B drugs: clinics, hospitals, and the retail classes of trade (Exhibit 4.3).17 As a general rule, clinics (and physicians) paid the lowest AIP per dose for most of the study HCPCs and the retail classes of trade paid the highest AIP. This finding is not consistent with the findings from the interviews that physicians faced higher net acquisition costs than hospitals; potential explanations will be presented in the “Summary and Discussion” chapter. Also, keep in mind that AIP and net acquisition cost are not exactly the same as previously discussed and that federal and other sales that are excluded from ASP may be reflected in AIP. The comparison of AIP across classes of trade is based on the averages and does not evaluate or measure the degree of dispersion in prices within or across classes of trade.
The retail classes of trade had the lowest AIP for only one of the 25 study HCPCs (J7192, factor viii recombinant). For 19 of the study HCPCs, clinics paid the lowest AIP, while hospitals paid the lowest AIP for five HCPCs.
Average Invoice Price per Dose (AIP) by Class of Trade Versus the All-Class AIP
An AIP for all classes of trade (less the federal facilities) was calculated to approximate the ASP calculated by CMS with sales data that manufacturers are required to provide to CMS for each NDC-11 on a quarterly basis (Exhibit 4.3). The AIP for clinics was higher than the AIP for all classes of trade in the third quarter of 2004 for five of the 25 study HCPCs. Four of these five AIPs were above the all-class AIP by two percent or less. For 20 of the 25 study HCPCs, the clinic AIP was less than the all-class AIP. Ten of these HCPCs had AIPs that were more than 10 percent below the all-class AIP; the extreme value was –27 percent.
Hospitals paid invoice prices that averaged more than the AIP for all classes for 18 of the 25 study HCPCs, although for 11 of these HCPCs the hospital AIP was no more than four percent above the all-class AIP. For the remaining six HCPCs, the average invoice price for hospitals ranged from five percent to 39 percent more than the all-class AIP.
The retail classes of trade had AIPs that were greater than the all-class AIP for 24 of the 25 study HCPCs. Most (18) of these HCPCs had AIPs that were more than five percent above the all-class average with an extreme value of 181 percent higher. Nine of the HCPCs had retail AIPs more than 20 percent above the all-class average. The retail AIP was lower than the all-class average for only one HCPC—factor viii recombinant (J7192).
17 AIPs for major purchasers are in Exhibit 4.2; AIPs for all purchasers are in Appendices F and G.

Abt Associates Inc. Sales of Drugs and Biologicals to Large Volume Purchasers 22
Exhibit 4.3. Average Invoice Price per Dose (AIP) by Major Purchaser Classes of Trade, 25 study HCPCs, Third Quarter 2004
AIP by Major Class of Trade Variation from the All-Class AIP by
Class of Trade
HCPC Code HCPC Description Leading Brand Name Patent Status
All-Class AIP (not including federal
facilities) Retail Clinic Hospital Retail Clinic Hospital
J0585 Botulinum toxin a per unit Botox SS $4.30 $4.52 $3.60 $4.45 5% -16% 3%
J0880 Darbepoetin alfa injection Aranesp SS $16.99 $21.24 $17.31 $14.41 25% 2% -15%
J1260 Dolasetron mesylate Anzemet SS $5.97 $6.36 $4.65 $7.05 7% -22% 18%
J1441 Filgrastim 480 mcg injection Neupogen SS $266.49 $301.54 $247.36 $259.55 13% -7% -3%
J1563 IV immune globulin Multiple brands IMS/NMS $40.74 $42.88 $42.16 $39.47 5% 3% -3%
J1626 Granisetron HCl injection Kytril SS $7.29 $15.07 $6.36 $7.61 107% -13% 4%
J1745 Infliximab injection Remicade SS $51.21 $52.04 $51.04 $51.46 2% 0% 0%
J2430 Pamidronate disodium /30 MG Pamidronate Disod IMS/NMS $65.79 $157.76 $62.84 $67.26 140% -4% 2%
J2792 Rho(D) immune globulin h, sd Winrho SDF SS/NMS $12.23 $12.97 $11.85 $12.45 6% -3% 2%
J3487 Zoledronic acid Zometa SS $187.69 $199.51 $186.37 $189.89 6% -1% 1%
J7192 Factor viii recombinant Helixate FS SS $831.81 $468.45 $742.35 $880.16 -44% -11% 6%
J7317 Sodium hyaluronate injection Hyalgan IMS/NMS $108.84 $115.68 $107.44 $113.74 6% -1% 5%
J7507 Tacrolimus oral per 1 MG Prograf SS $3.08 $3.20 $2.52 $3.12 4% -18% 1%
J7517 Mycophenolate mofetil oral Cellcept SS $2.39 $2.46 $2.10 $2.42 3% -12% 1%
J9045 Carboplatin injection Paraplatin SS $105.36 $128.63 $99.29 $113.68 22% -6% 8%
J9170 Docetaxel Taxotere SS $276.45 $303.95 $272.45 $286.74 10% -1% 4%
J9201 Gemcitabine HCl Gemzar SS $106.28 $109.84 $106.89 $103.99 3% 1% -2%
J9202 Goserelin acetate implant Zoladex SS $192.36 $364.13 $180.79 $228.51 89% -6% 19%
J9206 Irinotecan injection Camptosar SS $117.78 $122.29 $118.01 $116.51 4% 0% -1%
J9217 Leuprolide acetate suspension Lupron/Eligard SS/NMS $245.30 $543.97 $180.15 $341.40 122% -27% 39%
J9219 Leuprolide acetate implant Viadur SS/IMS/NMS $2,534.03 $4,777.50 $2,192.80 $2,213.97 89% -13% -13%
J9265 Paclitaxel injection Paclitaxel IMS/NMS $20.69 $58.20 $18.67 $21.51 181% -10% 4%
J9310 Rituximab cancer treatment Rituxan SS $414.21 $428.07 $415.17 $411.45 3% 0% -1%
J9355 Trastuzumab Herceptin SS $48.84 $53.38 $48.30 $49.29 9% -1% 1%
Q0136 Non esrd epoetin alpha inj Procrit Co-SS $7.18 $10.15 $5.58 $8.43 41% -22% 17%
* The All-Class AIP was calculated using the all-class weights for each drug product in the HCPC.
* The AIP for specific classes of trade was calculated using the class -specific weights for each drug product in the HCPC.
Abt Associates Inc. Sales of Drugs and Biologicals to Large Volume Purchasers 23
Sources of Variation in AIP
The project team used the IMS data to address the question of whether the primary source of variation in net acquisition costs by class of trade was purchasers in different classes of trade paying different invoice prices for the very same drug (NDC-11) or whether purchasers in different classes of trade also acquired different drug products within a given HCPC.
As a general rule, the bulk of the variation in average invoice prices could be attributed to the former issue, but, for three of the 25 HCPCs examined, compositional differences exacerbated the pricing patterns observed within NDC-11. In these three cases (J1260, Dolasetron mesylate; J1626, Granisetron HCl injection; and J9217, leuprolide acetate suspension), the use of class-of-trade specific weights increased the difference between the class-specific AIP and the all-class AIP by at least five percentage points for at least one class of trade.
5.0 Results: Primary Data on Invoice Prices
The second part of the focused review was an examination of the primary invoice data. As previously noted, the sample sizes were small in the primary invoice data due to a combination of low target numbers of respondents and low response rates. This section of the report is based on 23 invoices from six physicians’ offices and 38 invoices from 12 hospitals (a total of 61 invoices), numbers too low to support much statistical analysis.
For two drugs, the limited invoice data showed that physicians paid statistically significantly more than hospitals. For four drugs, the difference in average invoice prices between physicians and hospitals was not statistically significant. Three of the six drugs had more than five physician invoices. Based on these data, the coefficients of variation within the physician class of trades were 1 percent, 4 percent, and 6 percent for the three drugs18. Four of the six drugs had more than five hospital invoices. Based on these data, the coefficients of variation within the hospital class of trade were 2 percent, 16 percent, 18 percent, and 39 percent. These estimated coefficients of variation indicate that within-class variation existed and was substantial in some cases but do not offer precise estimates of its extent because the total numbers of invoices were small. Given the small sample sizes, these results should not be interpreted as conclusive in themselves but rather as suggestive of patterns that might be explored in a more extensive sample of invoice price data, if such data were available.
6.0 Summary and Discussion
This final chapter summarizes the findings in light of the research questions, discusses the significance and limitations of the study, and offers directions for further research.
18 The coefficient of variation measures the typical deviation in the data, expressed as a percentage of the
mean. For example, if the coefficient of variation is six percent and the average invoice price is $100, then the typical invoice prices varies from the average price by $6, either positively ($106) or negatively ($94). We consider coefficients of variation in excess of five percent to be substantial.

Abt Associates Inc. Sales of Drugs and Biologicals to Large Volume Purchasers 24
6.1 Summary
Response Rates
The interviews and primary data collection were conducted in April and May 2005. Pric ing issues appeared to be very sensitive for most participants in the Medicare Part B drug market. Consequently, response rates for our study were lower than expected. Only three of the eleven manufacturers contacted agreed to participate in interviews, and none was willing to submit ASP data by class of trade for a focus drug.
Only one of the 20 wholesalers contacted participated in an interview, and this organization’s contracts with manufacturers prohibited it from disclosing its contract pricing. Three of eight group purchasing organizations (GPOs) contacted participated in interviews; two shared information on their negotiated prices. Contact with 124 purchasers (physicians, hospitals, HMOs, and PBMs) yielded 23 interviews and 69 invoices for focus drugs. These low response rates were themselves a finding. Consistent with the finding of another recent report on a similar topic, we found that “Organizations that buy or sell drugs covered by Medicare are likely to be unwilling to provide price information voluntarily.”19
Significance of the Findings for the Research Questions
In this section, we restate the study questions and describe the extent to which they have been answered by the study’s findings.
1. What shares of the top drugs covered by Part B of Medicare are purchased by various types of purchasers?
Interview and secondary data concurred that the major purchasers of the top drugs covered by Part B of Medicare were physicians and hospitals, not GPOs, HMOs, or PBMs.
The secondary data analysis did offer volumes by class of trade for the categories of purchasers defined in the IMS data. For most of the 25 study HCPCs, the class of trade with the largest share of the market was clinics (including physicians’ offices); hospitals were usually the class of trade with the second largest market share. Combined, these two classes accounted for more than 50 percent of all doses given in all but three of the top 25 HCPCs studied. Retail pharmacies were the class of trade with the third largest market share, and for two of the 25 HCPCs they accounted for more than 50 percent of all doses.
2. Do different types of purchasers face the same net acquisition costs for Part B prescription drugs?
The study was unable to obtain data on net acquisition costs by type of purchaser. However, the interviews suggested that different types of purchasers face different net acquisition costs and the primary and secondary invoice data suggested that different purchasers face different invoice prices for the prescription drugs offered by Medicare Part B examined in this study. In interviews, experts and intermediaries were unanimous in the view that net acquisition costs varied across types of purchasers; two manufacturers equivocated, however, and one disagreed. Comments made in interviews also suggested that different types of purchasers acquired drugs through different
19 Thomas J. Hoerger and John Wittenborn “Assessment of Medicare Prescription Drug Prices,” Final Report,
RTI Project 07964.001 (client: CMS), July 2002.

Abt Associates Inc. Sales of Drugs and Biologicals to Large Volume Purchasers 25
distribution channels, a fact that may facilitate differences in net acquisition cost, and that access to special pricing terms from suppliers and to rebates differed among different types of purchasers.
The primary invoice data showed statistically significant differences in mean invoice prices between physicians and hospitals for two out of the six focus drugs. The primary data also highlighted the fact that invoice prices vary within as well as between the physician and hospital groups; coefficients of variation ranged from 1 to 39 percent. In the secondary data (IMS data), average invoice prices (AIPs) varied considerably among the major classes of trade purchasing Part B drugs.
Both comments made in interviews and a focused review of six HCPCs using secondary data indicated that the main source of variation in net acquisition costs (interviews) or AIP (secondary data) was different purchasers paying different prices for the same NDC-11, not different purchasers choosing different NDC-11s for these drugs.
The interviews also yielded a list of purchaser-level drivers of net acquisition costs, namely class of trade, ability to influence market share, volume, and purchaser expertise.
3. Which purchasers face lower and higher net acquisition costs?
While the study found that differences in net acquisition costs/invoice prices existed, we did not find conclusive and consistent evidence concerning whether physicians were disadvantaged relative to large volume purchasers. Both the interviews and the primary price data offered some anecdotal information suggesting that physicians paid higher net prices than hospitals for some drugs. Comments made in interviews suggested that physicians were at a disadvantage relative to hospitals in terms of prompt pay and volume discounts from suppliers and rebates from manufacturers. In the primary data on invoice prices, the mean invoice price for physicians was statistically significantly higher than the mean invoice price for hospitals for two of the six focus drugs. In contrast, the secondary data showed that as a general rule, clinics (the class that included physicians) faced the lowest average invoice prices per dose of all the major classes of trade for most of the study HCPCs.
This discrepancy is difficult to explain. One part of the explanation may be that the clinic class of trade in IMS Health’s data is broadly defined and includes some hospital outpatient departments (including public health service and disproportionate share clinics, which are not included in the ASP calculation) so the findings for clinics may understate invoice prices for physicians. It is possible that interview respondents talked about pricing patterns over the full universe of drugs rather than specifically about the drugs covered by Part B of Medicare, despite the interviewers’ efforts to focus the conversation of the latter. Finally, it is also possible that interview respondents viewed rebates as the driving force behind hospital’s costs being lower than physicians, a factor which was not captured in the AIP analysis.
Both the primary data and the secondary data suggested that the retail sector faced higher net acquisition costs than the physician (or clinic) and hospital sectors.
4. If differences in net acquisition costs exist, do they vary by drug?
Both the interviews and the secondary data analysis clearly indicated that differences in net acquisition costs/average invoice prices varied by drug. The interviews highlighted that the presence of therapeutic or generic competition was a critical factor. Drugs with little to no competition (i.e., unique patent-protected drugs) rarely, if ever, were sold at a discount or rebated. Drugs with limited competition (i.e., branded, patent-protected drugs with a close therapeutic substitute) offered selective discounting and rebating to certain classes of trade. Drugs with generic competitors in the market had

Abt Associates Inc. Sales of Drugs and Biologicals to Large Volume Purchasers 26
substantial discounts relative to list prices for all purchaser types. Interview respondents also noted that the markets for oncology drugs were unique, even when compared with other Part B drugs.
5. Would differences in net acquisition costs for different types of purchasers be reflected in ASP if it were calculated by class of trade?
As a conceptual matter, ASP differs from net acquisition cost because it does not account for wholesaler and distributor mark-ups, which are part of net acquisition costs, and because it is reduced by non-purchaser rebates, which are not part of purchasers’ net acquisition costs. Interview respondents suggested that wholesalers’ and distributors’ margins were small and that the major determinant of acquisition costs were pricing policies set at the manufacturer level and reflected in ASP. The implication of these comments is that ASP calculated by class of trade would be likely to reflect the differences in net acquisition costs by class of trade.
6. Are there differences in ASP when it is calculated for different types of purchasers?
The study was not conclusive on this point. No manufacturer submitted data on ASP by class of trade, and no other market participant was in a position to comment directly on this subject.
7. Does excluding hospitals, HMOs, or other large volume purchasers affect ASP calculations?
The study was not conclusive on this point. The effect of excluding purchasers is the product of the excluded purchasers’ share of the volume and the difference in ASP between the excluded purchasers and those that remain. Because the study did not attain conclusive evidence on ASP by class of trade, the study also is unable to answer this question.
6.2 Discussion
While this study did yield interesting information, as summarized above, it was not conclusive on the key questions of whether physicians’ net acquisition costs were comparable to large volume purchasers’ net acquisition costs and the effect on ASP of eliminating large volume purchasers from the calculation. On the first point, findings from the interviews and the secondary data analysis were inconsistent, making it difficult to draw conclusions with confidence.
In addition, both sources of data had significant limitations. For the primary data (both interviews and invoices), the ultimate sample sizes were small, due to a combination of low target numbers of respondent and low response rates. Ultimately, the project relied on 36 interviews and invoices from six physicians’ offices and twelve hospitals. One cannot generalize from the interview findings; one must view them as anecdotal and contextual information. Similarly, the sample of invoices did not support much statistical analysis. Also, some interviews were incomplete or difficult to interpret, due to the sensitivity and complexity of the material.
In both the primary and the secondary price data, the invoice price or the average invoice price (AIP) differed from the net acquisition cost or average net acquisition cost because it did not capture special pricing terms or manufacturer rebates.
Another limitation of the secondary data was that the AIPs were based on broad classes of trade, many of which contained multiple sub-categories of purchasers believed to receive differential pricing. For example, the “clinic” category contained physician offices, clinics, and some hospital outpatient departments, including those that are eligible for federally-negotiated 340B pricing and not included in the ASP calculation. Finally, the secondary price data consisted of average prices only and did not provide measures of price dispersion within classes of trade.

Abt Associates Inc. Sales of Drugs and Biologicals to Large Volume Purchasers 27
The study was also unable to estimate the impact of eliminating large volume purchasers from the ASP calculation. Of eleven manufacturers contacted, three participated in interviews, but none submitted data on ASP by class of trade. This lack of primary data combined with the limits of the secondary data made it impossible to draw conclusions. AIP, as measured in the secondary data, diverged from ASP because it included wholesaler and distributor mark-ups (which are not part of ASP) and because it did not capture purchaser or non-purchaser rebates (which are part of ASP as a negative number).
Two other issues affect this study. The study is based on data collected prior to or very shortly after ASP implementation: the interview and invoice data were collected in the Spring of 2005 and the IMS data draws on invoices from the third quarter of 2004. The market for the drugs covered by Part B of Medicare may well change in response to the new environment created by the MMA.
In addition, classes of trade are not well-defined. The definitions of the various types of classes are not clear and consistent among market participants, and market participants’ working definitions of the classes of trade are not necessarily consistent with the MMA’s implied concepts of prudent physicians and large volume purchasers.
The sensitive and confidential nature of prescription drug pricing makes this an extremely challenging topic to research. To be successful, future work on net acquisition costs and ASP for the drugs covered by Part B of Medicare requires adequate data, ideally data that overcomes some or all of the limitations described above. At this point in time, market participants are not willing to provide price data at a sufficient level of detail to permit a thorough analysis of net acquisition costs and average selling prices by class of trade.
One potential source of such data would be IMS Health, which may have the potential to calculate average invoice prices for more granular classes of trade; the experience of this project suggests that IMS would be unlikely to make such data available and the data, even if it were available, would not reflect rebates and other off-invoice price concession. A second potential source would be large-scale primary data collection from purchasers. This would require a very large number of respondents, perhaps 400 per class of trade per drug, and very significant resources; moreover, it would duplicate work that is already done by IMS, albeit not for public purposes. GPOs are a third potential source of data on net acquisition costs. Two of the eight GPOs contacted for this study had information about both invoice prices and rebates and were willing to share it, but it is not clear whether additional GPOs would participate in similar research.20 Furthermore, data collected from GPOs would not reflect the full universe of purchasers. The final source of data is the manufacturers themselves, and this project’s experience suggests that they would be unlikely to share data voluntarily.
In summary, this study provided an analysis, comparing net acquisition costs across purchasers for the drugs covered by Medicare Part B, that was inconclusive and subject to limitations as just described. The potential for future studies to draw conclusions about variation in net acquisition costs across purchasers and the effect of large volume purchasers on ASP would depend almost entirely on whether the substantial challenges concerning the availability of prescription drug pricing data could be overcome.
20 One GPO accepted the interview but shared limited information; four declined actively or passively; and
one was ineligible.

Abt Associates Inc. Sales of Drugs and Biologicals to Large Volume Purchasers A-1
Appendix A: List of Acronyms
AMA American Medical Association
AMCP Academy of Managed Care Pharmacy
ASHP American Society of Health Systems Pharmacists
ASP Average Sales Price AWP Average Wholesale Price
CMS Centers for Medicare and Medicaid Services
DAC Distributor Acquisition Cost
DSH Disproportionate Share Hospital
GPO Group Purchasing Organization
HCPC Healthcare Common Procedure Code
HDMA Healthcare Distribution Management Association
HHC Home Health Care Facility HHS (The Department of) Health and Human Services
HMO Health Maintenance Organization
IRB Institutional Review Board
LTC Long Term Care Facility
LVP Large Volume Purchasers
MCO Managed Care Organization
MDDB Medi-Span Master Drug Database Mfg Manufacturer
MMA Medicare Prescription Drug, Improvement and Modernization Act
MMS Medical Marketing Services
NDC National Drug Code (NDC-11 – 11 digit NDC)
NSP National Sales Perspectives data (from IMS Health)
OTN Oncology Therapeutic Network
PBM Pharmacy Benefit Manager Phys Physician
VHA Veterans Health Administration
WAC Wholesale Acquisition Cost
WS Wholesaler

Abt Associates Inc. Sales of Drugs and Biologicals to Large Volume Purchasers B-1
Appendix B: Interview Methods
Overview
The data acquisition plan was designed to inc lude primary and secondary data collection. In addition, thought leaders or experts in the field were recruited to offer another perspective on the core research questions, as well as to assist us in developing our research design and interview guide.
We set our target for data collection to be:
• Nine manufacturers;
• Seven wholesalers;
• Seven group purchasing organizations;
• Thirty-six independent physicians; and
• Seven or eight of each type of LVP (i.e., hospitals, HMOs, and PBMs).
For this study, these numbers were considered sufficient to acquire an initial perspective on market issues related to ASP and the purchase patterns for covered Medicare Part B drugs.
Sample Sources and Selection Methods
Experts
An initial list of experts was developed using individuals cited in the public and policy media, professional contacts of the project team, and recommendations of CMS. Next, a snowball strategy (asking each respondent for names and qualifications of other potential respondents) generated additional names, thus identifying the most promising candidates. The final list of 14 recruited respondents was selected in a manner that would balance expertise from various types of market participants (i.e., sellers, purchasers, and other observers) with those who were expected to have the ability to speak in an informed and candid way about the purchase of Part B drugs.
Manufacturers
Our design called for interviews with nine manufacturers of Medicare Part B drugs. Eight brand name and eight generic firms manufacture the six HCPCs listed above in Exhibit 2.2. All eight brand name and three of the eight generic firms were included in our sampling frame. CMS provided the names and contact information of the individuals who are responsible for submitting ASP data to CMS on behalf of each manufacturer in our sample.
Wholesalers
Our design called for interviews with seven representatives of wholesalers or distributors. We obtained the sample of wholesalers from the 2004 Healthcare Distribution Management Association (HDMA) Directory. There were over 80 wholesalers on this list. We selected 20 wholesalers that distributed to a wide range of classes of trade, with particular focus on firms that distributed to clinics (which include physicians’ offices), hospitals, and managed care facilities. The HDMA Directory also provided contact names for these wholesalers, who generally were either the President or Vice President of the firm. We mailed invitation letters to 20 wholesalers.

Abt Associates Inc. Sales of Drugs and Biologicals to Large Volume Purchasers B-2
Group Purchasing Organizations (GPOs)
We obtained names of GPOs from the 2003 HDMA Industry Profile and Healthcare Factbook. Our design called for interviews with seven representatives of GPOs. We used public sources, such as websites, to obtain contact names for potential respondents, which generally was for the Director of Pharmacy. Since some GPOs were subsidiaries of other GPOs on our list, we did not include the subsidiary GPOs on our list. We mailed invitation letters to eight GPOs.
Physicians’ Purchasing Agents
Our design called for interviews with 36 physicians’ purchasing agents at independent physician offices. To obtain a sample of physicians’ purchasing agents, we purchased data on 1,000 office-based physicians from Medical Marketing Services (MMS) in February of 2005. According to MMS’ records, all physicians were in a group practice with less than ten total physicians. This list consisted of 750 oncologists and 250 hematologists.21 The list of 1,000 physicians represented physicians from six states – California, Florida, Illinois, Kentucky, Nebraska and New York, thus reflecting both the various geographic regions of the country as well as a mix of urban and rural physician offices.
To gather contact information for the appropriate physicians’ purchasing agents, we used the phone numbers for physicians’ offices provided by MMS and placed phone calls to a random sample of physician’s offices. At that time, we confirmed that at least one physician in the office treated the ailment that one of the four anchor drugs is used for, such as breast cancer for Herceptin. We also confirmed that the office was a stand-alone physicians’ clinic and not associated with a larger hospital. If the physicians’ office met these conditions, we asked for the name of the person who purchases drugs on behalf of the physicians in the office. We mailed invitation letters to 72 physicians’ purchasing agents.
Hospitals
To gather our list for the target goal of interviews with seven representatives of hospitals, we contacted the American Society of Health System Pharmacists (ASHP) to obtain a list of large hospitals. ASHP provided us with a list of the largest 50 hospitals in the country based on the total number of staffed beds. This list included contact information for the pharmacy directors. After removing Veterans’ hospitals and state hospitals from the list, Abt mailed invitation letters to the 20 largest hospitals on the list, with no more than three hospitals from the same state.
HMOs
Our design called for interviews with eight representatives of health maintenance organizations (HMOs). The top 25 top managed care firms by HMO enrollment were found in the 2003 Healthcare Distribution Management Association (HDMA) Industry Profile and Healthcare Factbook. Abt, then, used the 2002 Interstudy list to obtain contact information for the sampled HMOs. In most cases, we selected the largest regional division. However, six of the 25 organizations were from California. To avoid over sampling from this geographic region we selected the second largest regional division of three of these organizations. We mailed invitation letters to 18 HMOs.
21 MMS receives this data from the American Medical Association (AMA). AMA gives MMS contact
information for almost all physicians in the U.S. A physician is excluded from the list only if he or she requests being removed from all AMA mailing lists. AMA and MMS update their physician lists weekly.

Abt Associates Inc. Sales of Drugs and Biologicals to Large Volume Purchasers B-3
PBMs
We obtained the names of the top 20 Pharmacy Benefit Managers (PBMs) by number of covered lives from the 2003 HDMA Industry Profile and Healthcare Factbook. We obtained contact information for the 20 PBMs in our sample from the Academy of Managed Care Pharmacy (AMCP). Our design called for interviews with seven representatives of PBMs and we mailed invitation letters to 14 PBMs.
Recruitment Procedures
All potential respondents were mailed an initial recruitment letter, cosigned by a senior CMS staff member and Abt’s Project Director, as well as a disclosure statement. Recruitment documents were tailored for each respondent group. A member of the project staff followed up with a telephone call to answer questions about the study and to schedule an interview if the respondent was interested in participating. If the point of contact from our sample was not the correct person we followed-up to identify the appropriate person for the interview, at which time we faxed or emailed the recruitment letter and disclosure statement to the new potential respondent.
We placed numerous phone calls to all respondents until the respondent either: scheduled an interview, refused to participate, or fell into the category of ‘passive refusal’ when we left at least five unreturned voice messages for a potential respondent.
Discussion Guide
Abt developed an interview discussion guide in collaboration with the University of Minnesota and CMS, based on CMS’ research questions. The interview guides varied for the different respondent groups with specific questions unique to a respondent group, although certain questions were asked to all respondents. The discussion guides were comprised of open-ended questions, which asked wholesalers and purchasers about the acquisition process and acquisition costs and asked manufacturers, wholesalers, and GPOs about customers and selling prices.
Abt conducted interviews with experts at the beginning of the data collection phase, which allowed the team to increase its understanding of issues and to refine the discussion guide prior to data collection with the other respondent groups.
Interview Procedures
All respondents were promised confidentiality in the report.
The interviews were designed to take 45 minutes. Most interviews with manufacturers, experts and GPOs took approximately one hour. All interviewers and note-takers participated in a one-half-day training session. This training oriented staff to the substantive issues related to the project, data collection and recording processes, and informed consent procedures. Interviewers and note-takers also participated in a second training session focused on interviewing skills, reviewing the interview guide and data collection forms, and recruitment criteria. All interviewers were carefully trained to ensure that they would maintain a neutral position throughout the interview.
Response Rates for Interviews
All interviews included in this report were conducted between April 1, 2005 and May 13, 2005. This study was designed with the goal of conducting interviews with a total of 89 individuals, including industry experts and representatives of manufacturers, wholesalers, GPOs, large volume purchasers

Abt Associates Inc. Sales of Drugs and Biologicals to Large Volume Purchasers B-4
and physicians’ offices. Unfortunately, representatives from these organizations were often unwilling to participate.
• Six of the 14 experts recruited to participate in an interview agreed to participate.
• Five of the 11 manufacturers directly refused to participate in the study and three passively refused; only three manufacturers agreed to take part in an interview.
• Thirteen (65 percent) of the 20 wholesalers in our sample were considered a passive refusal. Three more wholesalers declined to participate and three were ineligible.
• Three of the eight GPOs in our sample participated in an interview, three refused to participate, one was ineligible and one was a passive refusal.
• Out of the 72 physician purchasing agents that we included in our sample, 39 (54 percent), were considered passive refusals; in these instances, we placed five or more calls and did not receive a response. In addition, another 25 (35 percent) physician purchasing agents directly refused to participate in the study with over half of those citing the primary reason as time. These purchasing agents did not have the time to set aside to participate in a research study. Even when we attempted to shorten the interview to 20 minutes rather than 45 minutes, time was still a factor in low participation.
• Over one-half of the hospitals in our sample agreed to participate in the interview, giving us a total of 12 completed interviews.
• While almost one-half of the HMOs in our sample were in the passive refusal category, eight of the 18 did agree to participate in an interview. We only conducted two interviews with representatives of HMOs, however, because six were ineligible.
• Eleven of the 14 PBMs in our sample agreed to participate in an interview, however we only conducted 2 interviews because nine of the 11 were ineligible for the study because they did not directly buy or sell the drugs.
Primary Data on Drug Pricing
At the end of the interviews with all respondent groups, except for experts, we invited respondents to submit drug pricing data. Similar to the interview, this data collection process was completely voluntary. Manufacturers, wholesalers, and GPOs were asked to fill out a data collection form. The manufacturer data collection form requested ASP at the NDC-11 level by class of trade. The data collection forms for wholesalers and GPOs requested list prices, invoice discounts, and rebates, if applicable, at the NDC-11 level by class of trade. These forms were carefully customized in light of information received during the interview.
Physician purchasing agents, hospitals, HMOs and PBMs were asked to submit pricing data regarding drug products in the six focus HCPCs in the form of a recent invoice. At the end of an interview, we asked respondents from these groups if they would be willing to share with us a copy of a recent invoice for the purchase of one or more drug products from the six focus HCPCs. If they agreed, we gave respondents the opportunity to fax, e-mail or mail us the invoices.
Most of the invoices submitted were dated March or April 2005.

Abt Associates Inc. Sales of Drugs and Biologicals to Large Volume Purchasers B-5
Response Rates for Primary Data
As previously mentioned, respondents were asked to provide limited drug pricing data during the interview and to provide documentation of the price (e.g., a copy of a recent invoice) or a completed data collection form. The second column in Exhibit 2.4 (N Submitting Data Forms) details the number of respondents who provided data to Abt upon completion of the interview.
No manufacturer submitted complete data on ASP by class of trade for a focus drug.
The only wholesaler respondent was unable to provide detailed pricing data either during the interview or in a data collection form. This respondent expressed that their contracts with manufacturers prohibit disclosing pricing terms. The respondent did discuss its selling price for one drug when it sold that drug at its own “wholesaler discount” as opposed to at a contract price.
Two of the three group purchasing organizations (GPOs) interviewed completed Abt’s data collection form. Neither of the GPOs disclosed the average prices paid by different types of purchasers, however, they each provided information on the level of discounts and rebates available to each class of trade for each of the six focus drugs they distributed.
Six of the seven physician purchasing agents faxed one or more invoices after completion of the interview.
All 12 of the hospitals interviewed faxed invoices for at least one of the six focus drugs. In many cases, an invoice for more than one of the study drugs was faxed.
Representatives from two HMOs and two PBMs were interviewed. One of each of these two respondents provided data both during the interview and in a follow-up data collection form.
Review of Study Procedures
The Abt Associates Institutional Review Board (IRB) reviewed and approved the study protocol, including the disclosure statement, interview discussion guides, the data collection forms, recruitment strategies and materials, and a data security plan. Respondents were not given any monetary or other compensation for participating.

Abt Associates Inc. Sales of Drugs and Biologicals to Large Volume Purchasers C-1
Appendix C: Interview Respondents
Description of Interview Respondents
Experts: Early in the data collection, the project team interviewed six experts, defined as individuals who were very knowledgeable about pricing practices and variation in acquisition costs. In the majority of cases, these experts were also direct participants in the supply chain, but, in contrast to respondents in other categories, experts were asked about pricing in general as opposed to their own individual situation.
Manufacturers: The project team spoke with senior managers at three pharmaceutical manufacturers, each of which made at least one of the six focus drugs. In two cases, the interview focused on the focus drug; in the third, the manufacturer opted to discuss another major Part B drug that it made. In every case, more than one individual participated in the interview, which we interpret as an indication of the significance and sensitivity of the topics of average selling prices and variation in average selling prices from their point of view. All manufacturers indicated that the study drug was administered in both physicians’ offices and in hospital outpatient departments and that Medicare paid for a significant share of the study drug, defined as at least 35 percent of total units sold. 22
Wholesalers: The project team conducted an interview with one major national wholesaler.
Group Purchasing Organizations (GPOs): Three GPOs were interviewed. Two of these were large national GPOs, which worked on behalf of physicians, hospitals, and clients in other sectors; the third GPO worked with hospitals exclusively.
Physicians: We interviewed seven respondents from independent physician offices who purchase drugs on behalf of their practices. Respondents were responsible for practice administration or finance. Four of the respondents were at stand-alone clinics. The three remaining respondents were affiliated with a group of clinics (ranging from three to 12 clinics) that had centralized drug purchasing. These clinics may have been affiliated with a hospital, but all drug purchasing was conducted independent of the hospital.
Hospitals: The project team spoke with representatives of twelve hospitals, which spanned the country geographically. All but one of the respondents were part of a multi-hospital system and all were not-for-profit (NFP). The responding hospitals ranged from 500 to 1,400 beds. Several were academic medical centers, which represent a distinct class of trade from traditional community hospitals. Two hospitals were 340B-eligible, and hence purchased their Medicare Part B drugs at prices that are exempt from the ASP calculation. We discussed their inpatient purchases instead.
HMOs: Eight representatives of HMOs agreed to partic ipate in interviews; however, only two of the eight HMOs actually purchased drugs directly and were able to complete an interview. Both HMO interviews were with the HMO’s Pharmacy Director.
PBMs: Eleven representatives of PBMs agreed to participate in an interview; however, of those eleven respondents, only two were PBMs that directly purchased prescription drugs from wholesalers or manufacturers. The interviews for one of the PBMs included five high-level executives in
22 The project team promised confidentiality to all interview respondents. Because of the small number of
manufacturers of case study drugs and the small number of respondents (three manufacturers), we provide extremely limited information about the companies we spoke to and the drugs we spoke about.

Abt Associates Inc. Sales of Drugs and Biologicals to Large Volume Purchasers C-2
pharmacy and industry relations, and at the other PBM the interview was with the director of pharmacy and the general manager.

Abt Associates Inc. Sales of Drugs and Biologicals to Large Volume Purchasers D-1
Appendix D: Top 35 Medicare HCPCs, 2003
HCPC Code HCPC Description Rank $
2003 Medicare Exp.
% of 2003 Expenditures Study Drug
Case Study Drug
Q0136 Non ESRD epoetin alpha inj 1 $ 1,035,540,983 9.8% Yes Yes J9217 Leuprolide acetate suspension 2 $ 726,196,566 6.9% Yes Yes J7644 Ipratropium brom inh sol u d 3 $ 725,667,328 6.9% ***
J9310 Rituximab cancer treatment 4 $ 580,936,425 5.5% Yes
J0880 Darbepoetin alfa injection 5 $ 531,892,548 5.1% Yes Yes J1745 Infliximab injection 6 $ 495,570,356 4.7% Yes
J7619 Albuterol inh sol u d 7 $ 490,536,839 4.7% ***
J9202 Goserelin acetate implant 8 $ 449,001,729 4.3% Yes Yes J9170 Docetaxel 9 $ 304,390,915 2.9% Yes
J9045 Carboplatin injection 10 $ 269,251,108 2.6% Yes
J9265 Paclitaxel injection 11 $ 260,448,815 2.5% Yes Yes J3490 Drugs unclassified injection 12 $ 255,856,152 2.4% ***
J3487 Zoledronic acid 13 $ 231,196,491 2.2% Yes
J2792 Rho (D) immune globulin h, sd 14 $ 214,956,245 2.0% Yes J9201 Gemcitabine HCl 15 $ 204,767,764 1.9% Yes
Q4053 Pegfilgrastim 16 $ 201,851,149 1.9% ***
J9206 Irinotecan injection 17 $ 183,148,147 1.7% Yes J1563 IV immune globulin 18 $ 173,525,870 1.6% Yes
J9999 Chemotherapy drug 19 $ 166,208,940 1.6% ***
J3395 Verteporfin injection 20 $ 149,045,921 1.4% ** J1260 Dolasetron mesylate 21 $ 142,912,265 1.4% Yes
J2430 Pamidronate disodium /30 MG 22 $ 122,474,923 1.2% Yes
J7320 Hylan G-F 20 injection 23 $ 112,435,690 1.1% * 90658 Flu vaccine, 3 yrs, im 24 $ 103,591,765 1.0% ***
J7517 Mycophenolate mofetil oral 25 $ 101,528,910 1.0% Yes
J0151 Adenosine injection 26 $ 94,749,452 0.9% ** J9355 Trastuzumab 27 $ 89,053,943 0.8% Yes Yes
J7507 Tacrolimus oral per 1 MG 28 $ 85,081,668 0.8% Yes
J7626 Budesonide inhalation sol 29 $ 84,776,964 0.8% **** J1626 Granisetron HCl injection 30 $ 81,894,280 0.8% Yes
J1441 Filgrastim 480 mcg injection 31 $ 77,830,404 0.7% Yes
J9219 Leuprolide acetate implant 32 $ 76,492,962 0.7% Yes J7317 Sodium hyaluronate injection 33 $ 66,631,851 0.6% Yes
J7192 Factor viii recombinant 34 $ 58,917,219 0.6% Yes
J0585 Botulinum toxin a per unit 35 $ 53,543,597 0.5% Yes Total 2003 Medicare Expenditures, Top 35 HCPCs $ 9,001,906,184 85.6% 25 HCPCs 6 HCPCs
Total 2003 Medicare Expenditures, All HCPCs $ 10,518,929,270 100.0%
Note: Medicare expenditures data was carrier paid amount for Part B drugs provided by CMS for the year 2003. * HCPC code was excluded because HCPC was not assigned NDC-11s in the third quarter 2004 weight file. ** HCPC code was excluded because no IMS data was available for the only NDC-11 assigned to this HCPC in the
third quarter 2004 weight file. *** HCPC code was excluded as a respiratory drug, a vaccine, or because it was impossible to identify NDCs that
were related to the HCPC codes. **** HCPC code was excluded because it is rarely a physician-administered drug.

Abt Associates Inc. Sales of Drugs and Biologicals to Large Volume Purchasers E-1
Appendix E: Subcategories of IMS’ Classes of Trade
Retail Classes of Trade
Class of Trade Subcategory Chain C2 - Mass merchandise/discount store with a pharmacy P2 - Chain pharmacy with 11 or more stores P3 - Chain pharmacy with 4-10 stores R2 - Mass merchandise/discount store without a pharmacy R6 - Chain HBA store without a pharmacy W4 - Drug chains not reporting sales to DDD W6 - Mass merchandise warehouse not reporting sales to DDD Z1 - Zip retail pharmacy Independent C1 - Miscellaneous retail store with a pharmacy P0 - Independent pharmacy located in a hospital P1 - Independent pharmacy R5 - Independent HBA store without a pharmacy S4 - Depot pharmacy Foodstore C3 - Food/convenience store with a pharmacy C4 - Supermarket with a pharmacy W5 - Grocery warehouse (non-reporting) Mail Service G7 - Federal government mail service pharmacy (non-reporting) G8 - Federal government mail service pharmacy (reporting) I0 - Internet Pharmacy (reporting) I5 - Internet Pharmacy (non-reporting) S5 - Mail service pharmacy (non-reporting) Z2 - ZIP mail service pharmacy sales (ZIP of patient) Z6 - ZIP mail service doctor sales (ZIP of physician)
PROVIDER PERSPECTIVE Class of Trade Subcategory Non-Fed Hospitals A2 - Non-reporting hospital/purchasing agent/ city, county, & state agencies A3 - Unit dose, nuclear pharmacy H1 - Non-federal hospitals including pharmacy depts., clinics & doctors at hospital H4 - Special inpatient treatment facility (hospice, drug/alcohol rehabilitation) W8 - Non-reporting hospital/medical/surgical supply warehouse Z4 - Zip hospital sales Federal Facilities A4 - Federal government depot/hospital agent (less than $10,000 per month) F3 - Native American Indian Hospital F4 - Native American Indian Clinic G1 - US Ships G2 - VA hospital G3 - Federal government hospital (non-VA) G4 - Federal government (non-VA) outpatient care facility G6 - VA outpatient clinic/pharmacy S8 - Federal government depot/hospital agent (more than $10,000 per month)
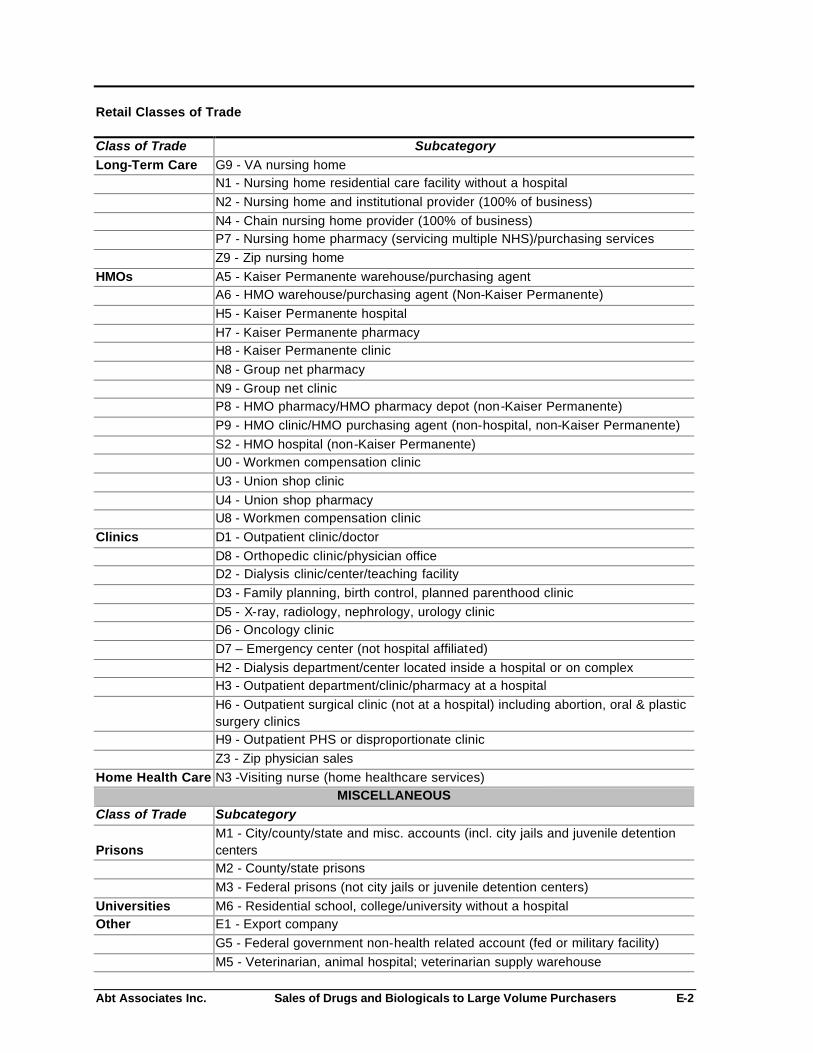
Abt Associates Inc. Sales of Drugs and Biologicals to Large Volume Purchasers E-2
Retail Classes of Trade
Class of Trade Subcategory Long-Term Care G9 - VA nursing home N1 - Nursing home residential care facility without a hospital N2 - Nursing home and institutional provider (100% of business) N4 - Chain nursing home provider (100% of business) P7 - Nursing home pharmacy (servicing multiple NHS)/purchasing services Z9 - Zip nursing home HMOs A5 - Kaiser Permanente warehouse/purchasing agent A6 - HMO warehouse/purchasing agent (Non-Kaiser Permanente) H5 - Kaiser Permanente hospital H7 - Kaiser Permanente pharmacy H8 - Kaiser Permanente clinic N8 - Group net pharmacy N9 - Group net clinic P8 - HMO pharmacy/HMO pharmacy depot (non-Kaiser Permanente) P9 - HMO clinic/HMO purchasing agent (non-hospital, non-Kaiser Permanente) S2 - HMO hospital (non-Kaiser Permanente) U0 - Workmen compensation clinic U3 - Union shop clinic U4 - Union shop pharmacy U8 - Workmen compensation clinic Clinics D1 - Outpatient clinic/doctor D8 - Orthopedic clinic/physician office D2 - Dialysis clinic/center/teaching facility D3 - Family planning, birth control, planned parenthood clinic D5 - X-ray, radiology, nephrology, urology clinic D6 - Oncology clinic D7 – Emergency center (not hospital affiliated) H2 - Dialysis department/center located inside a hospital or on complex H3 - Outpatient department/clinic/pharmacy at a hospital
H6 - Outpatient surgical clinic (not at a hospital) including abortion, oral & plastic surgery clinics
H9 - Outpatient PHS or disproportionate clinic Z3 - Zip physician sales Home Health Care N3 -Visiting nurse (home healthcare services)
MISCELLANEOUS Class of Trade Subcategory
Prisons M1 - City/county/state and misc. accounts (incl. city jails and juvenile detention centers
M2 - County/state prisons M3 - Federal prisons (not city jails or juvenile detention centers) Universities M6 - Residential school, college/university without a hospital Other E1 - Export company G5 - Federal government non-health related account (fed or military facility) M5 - Veterinarian, animal hospital; veterinarian supply warehouse

Abt Associates Inc. Sales of Drugs and Biologicals to Large Volume Purchasers E-3
Retail Classes of Trade
Class of Trade Subcategory R1 - Miscellaneous retail store without a pharmacy R3 - Food/convenience store without a pharmacy R4 - Supermarket without a pharmacy Z5 - ZIP Miscellaneous (one-time or infrequent sales) Z7 - ZIP nursing home patient sales (to ZIP code of patient) Z8 - ZIP nursing home doctor sales (to ZIP code of physician)
Source: DDD Outlet Subcategory Codes, IMS Health, October 2002. Note: IMS defines mail-service pharmacies as a retail class of trade; however, in our analysis of the retail classes of trade combined (in Section 4) we excluded this class. Mail service pharmacies are in a separate class of trade, see different prices and are structured differently from the three retail classes of trade.

Abt Associates Inc. Sales of Drugs and Biologicals to Large Volume Purchasers F-1
Appendix F: Average Invoice Price per Dose (AIP) by Class of Trade, 25 Study HCPCs
Classes of Trade
Retail
HCPC Code HCPC Description
Leading Brand Name Patent Status
All-Class AIP (not including
federal facilities)
Indepen-dent Chain
Food Stores All Retail
Mail Service HMOs Clinics HHC LTC Hospitals
Federal Facilities Other
J0585 Botulinum toxin a per unit Botox SS $4.30 $4.51 $4.50 $4.56 $4.52 $4.35 $4.75 $3.60 $4.44 $4.54 $4.45 $2.85 $5.21 J0880 Darbepoetin alfa injection Aranesp SS $16.99 $21.44 $21.03 $21.60 $21.24 $19.58 $19.31 $17.31 $19.63 $20.01 $14.41 $10.63 $12.84 J1260 Dolasetron mesylate Anzemet SS $5.97 $6.14 $6.40 $7.90 $6.36 $4.01 $5.73 $4.65 $4.60 $7.00 $7.05 $5.90 $6.95 J1441 Filgrastim 480 mcg injection Neupogen SS $266.49 $304.05 $299.07 $306.72 $301.54 $287.59 $297.33 $247.36 $290.22 $290.89 $259.55 $184.33 $269.38 J1563 IV immune globulin Multiple brands IMS/NMS $40.74 $42.20 $55.61 $29.15 $42.88 $42.10 $50.31 $42.16 $43.93 $38.37 $39.47 $29.17 $49.11 J1626 Granisetron HCl injection Kytril SS $7.29 $15.09 $14.79 $15.79 $15.07 $14.32 $13.36 $6.36 $12.63 $15.51 $7.61 $4.94 $8.75 J1745 Infliximab injection Remicade SS $51.21 $51.90 $52.30 $54.16 $52.04 $51.87 $50.69 $51.04 $51.80 $52.20 $51.46 $37.23 $47.46 J2430 Pamidronate disodium /30 MG Pamidronate Disod IMS/NMS $65.79 $140.09 $205.48 $242.55 $157.76 $141.21 $65.11 $62.84 $91.24 $115.60 $67.26 $51.20 $62.12 J2792 Rho(D) immune globulin h, sd Winrho SDF SS/NMS $12.23 $13.10 $12.78 $13.78 $12.97 $10.32 $13.05 $11.85 $13.09 $15.40 $12.45 $10.05 $13.06 J3487 Zoledronic acid Zometa SS $187.69 $198.05 $203.06 $203.16 $199.51 $195.36 $196.05 $186.37 $196.13 $204.22 $189.89 $132.48 $207.31 J7192 Factor viii recombinant Helixate FS SS $831.81 $447.83 $968.37 $0.00 $468.45 $764.14 $1,056.04 $742.35 $801.05 $1,408.50 $880.16 $1,009.12 $1,546.17 J7317 Sodium hyaluronate injection Hyalgan IMS/NMS $108.84 $115.87 $115.51 $116.02 $115.68 $111.85 $102.92 $107.44 $114.92 $115.37 $113.74 $86.67 $115.77 J7507 Tacrolimus oral per 1 MG Prograf SS $3.08 $3.20 $3.19 $3.22 $3.20 $2.97 $3.19 $2.52 $3.17 $3.18 $3.12 $1.86 $2.91 J7517 Mycophenolate mofetil oral Cellcept SS $2.39 $2.48 $2.46 $2.46 $2.46 $2.25 $2.48 $2.10 $2.47 $2.48 $2.42 $1.55 $2.52 J9045 Carboplatin injection Paraplatin SS $105.36 $129.25 $125.25 $141.25 $128.63 $127.32 $130.84 $99.29 $115.72 $131.37 $113.68 $65.83 $122.87 J9170 Docetaxel Taxotere SS $276.45 $304.46 $300.17 $319.31 $303.95 $301.38 $289.89 $272.45 $298.60 $313.47 $286.74 $174.59 $266.54 J9201 Gemcitabine HCl Gemzar SS $106.28 $110.63 $106.15 $111.53 $109.84 $107.88 $111.08 $106.89 $109.76 $112.12 $103.99 $65.09 $116.62 J9202 Goserelin acetate implant Zoladex SS $192.36 $371.79 $354.44 $386.76 $364.13 $173.35 $246.95 $180.79 $346.12 $289.99 $228.51 $87.27 $345.30 J9206 Irinotecan injection Camptosar SS $117.78 $122.33 $121.97 $124.36 $122.29 $119.13 $121.01 $118.01 $121.72 $124.86 $116.51 $83.71 $121.02 J9217 Leuprolide acetate suspension Lupron/Eligard SS/NMS $245.30 $503.40 $565.87 $590.25 $543.97 $548.08 $258.47 $180.15 $568.04 $564.80 $341.40 $197.50 $351.81 J9219 Leuprolide acetate implant Viadur SS/IMS/NMS $2,534.03 $4,735.00 $4,820.00 $0.00 $4,777.50 $4,039.53 $0.00 $2,192.80 $4,689.00 $2,498.00 $2,213.97 $1,155.00 $2,592.00 J9265 Paclitaxel injection Paclitaxel IMS/NMS $20.69 $55.28 $77.92 $57.27 $58.20 $38.86 $47.35 $18.67 $23.32 $41.15 $21.51 $7.14 $24.01 J9310 Rituximab cancer treatment Rituxan SS $414.21 $426.62 $433.31 $431.85 $428.07 $411.25 $432.69 $415.17 $420.67 $433.87 $411.45 $278.32 $428.63 J9355 Trastuzumab Herceptin SS $48.84 $53.04 $54.60 $55.11 $53.38 $49.34 $51.71 $48.30 $51.53 $52.70 $49.29 $33.38 $50.49 Q0136 Non esrd epoetin alpha inj Procrit Co-SS $7.18 $11.77 $8.92 $11.78 $10.15 $5.73 $10.36 $5.58 $10.57 $11.29 $8.43 $5.65 $10.02
Source: IMS National Sales Perspective Database, Third Quarter 2004; CMS; MediSpan Notes: Patent Status codes are as follows: SS = single source drug products; Co-SS = co-licensed or co-marketed; IMS = innovator multi-source drug products; NMS = non-innovator multi-source (generics) HHCs are Home Health Care facilities and LTCs are Long Term Care facilities.

Abt Associates Inc. Sales of Drugs and Biologicals to Large Volume Purchasers G-1
Appendix G: Variation from the All-Class Average Invoice Price per Dose (AIP) by Class of Trade, 25 Study HCPCs
Classes of Trade
Retail HCPC Code HCPC Description Leading Brand Name Patent Status
Indepen- dent Chain
Food Stores All Retail
Mail Service HMOs Clinics HHC LTC Hospitals
Federal Facilities Other
J0585 Botulinum toxin a per unit Botox SS 5% 5% 6% 5% 1% 10% -16% 3% 6% 3% -34% 21% J0880 Darbepoetin alfa injection Aranesp SS 26% 24% 27% 25% 15% 14% 2% 16% 18% -15% -37% -24% J1260 Dolasetron mesylate Anzemet SS 3% 7% 32% 7% -33% -4% -22% -23% 17% 18% -1% 16% J1441 Filgrastim 480 mcg injection Neupogen SS 14% 12% 15% 13% 8% 12% -7% 9% 9% -3% -31% 1% J1563 IV immune globulin Multiple brands IMS/NMS 4% 37% -28% 5% 3% 23% 3% 8% -6% -3% -28% 21% J1626 Graniset ron HCl injection Kytril SS 107% 103% 117% 107% 96% 83% -13% 73% 113% 4% -32% 20% J1745 Infliximab injection Remicade SS 1% 2% 6% 2% 1% -1% 0% 1% 2% 0% -27% -7% J2430 Pamidronate disodium /30 MG Pamidronate Disod IMS/NMS 113% 212% 269% 140% 115% -1% -4% 39% 76% 2% -22% -6% J2792 Rho (D) immune globulin h, sd Winrho SDF SS/NMS 7% 4% 13% 6% -16% 7% -3% 7% 26% 2% -18% 7% J3487 Zoledronic acid Zometa SS 6% 8% 8% 6% 4% 4% -1% 4% 9% 1% -29% 10% J7192 Factor viii recombinant Helixate FS SS -46% 16% -100% -44% -8% 27% -11% -4% 69% 6% 21% 86% J7317 Sodium hyaluronate injection Hyalgan IMS/NMS 6% 6% 7% 6% 3% -5% -1% 6% 6% 5% -20% 6% J7507 Tacrolimus oral per 1 MG Prograf SS 4% 4% 5% 4% -3% 4% -18% 3% 3% 1% -39% -6% J7517 Mycophenolate mofetil oral Cellcept SS 4% 3% 3% 3% -6% 3% -12% 3% 3% 1% -35% 5% J9045 Carboplatin injection Paraplatin SS 23% 19% 34% 22% 21% 24% -6% 10% 25% 8% -38% 17% J9170 Docetaxel Taxotere SS 10% 9% 16% 10% 9% 5% -1% 8% 13% 4% -37% -4% J9201 Gemcitabine HCl Gemzar SS 4% 0% 5% 3% 2% 5% 1% 3% 5% -2% -39% 10% J9202 Goserelin acetate implant Zoladex SS 93% 84% 101% 89% -10% 28% -6% 80% 51% 19% -55% 80% J9206 Irinotecan injection Camptosar SS 4% 4% 6% 4% 1% 3% 0% 3% 6% -1% -29% 3% J9217 Leuprolide acetate suspension Lupron/Eligard SS/NMS 105% 131% 141% 122% 123% 5% -27% 132% 130% 39% -19% 43% J9219 Leuprolide acetate implant Viadur SS/IMS/NMS 87% 90% -100% 89% 59% -100% -13% 85% -1% -13% -54% 2% J9265 Paclitaxel injection Paclitaxel IMS/NMS 167% 277% 177% 181% 88% 129% -10% 13% 99% 4% -66% 16% J9310 Rituximab cancer treatment Rituxan SS 3% 5% 4% 3% -1% 4% 0% 2% 5% -1% -33% 3% J9355 Trastuzumab Herceptin SS 9% 12% 13% 9% 1% 6% -1% 6% 8% 1% -32% 3% Q0136 Non esrd epoetin alpha inj Procrit Co-SS 64% 24% 64% 41% -20% 44% -22% 47% 57% 17% -21% 40%
Source: IMS National Sales Perspective Database, Third Quarter 2004; CMS; MediSpan Notes: Patent Status codes are as follows: SS = single source drug products; Co-SS = co-licensed or co-marketed; IMS = innovator multi-source drug products; NMS = non-innovator multi-source (generics) HHCs are Home Health Care facilities and LTCs are Long Term Care facilities

Abt Associates Inc. Sales of Drugs and Biologicals to Large Volume Purchasers H-1
Appendix H: Average Invoice Price per Dose (AIP) by Major Class of Trade, Comparison of All-Class Weights and Class of Trade- Specific Weights, 25 Study HCPCs
All-Class Weights Class-of-Trade Specific Weights
AIP by Major Class of Trade
Variation from the All-Class AIP by Class of
Trade AIP by Major Class of Trade
Variation from the All-Class AIP by Class of
Trade Results Differ?
HCPC Code HCPC Description
Leading Brand Name
All-Class AIP (not including federal
facilities) Retail Clinic Hospital Retail Clinic Hospital Retail Clinic Hospital Retail Clinic Hospital J0585 Botulinum toxin a per unit Botox $4.30 $4.52 $3.60 $4.45 5% -16% 3% $4.52 $3.60 $4.45 5% -16% 3% J0880 Darbepoetin alfa injection Aranesp $16.99 $21.12 $17.37 $14.46 24% 2% -15% $21.24 $17.31 $14.41 25% 2% -15% J1260 Dolasetron mesylate Anzemet $5.97 $7.34 $5.89 $5.88 23% -1% -1% $6.36 $4.65 $7.05 7% -22% 18% Yes J1441 Filgrastim 480 mcg injection Neupogen $266.49 $292.45 $247.49 $266.03 10% -7% 0% $301.54 $247.36 $259.55 13% -7% -3% J1563 IV immune globulin Multiple Brands $40.74 NA NA NA NA NA NA $42.88 $42.16 $39.47 5% 3% -3% J1626 Granisetron HCl injection Kytril $7.29 $14.28 $6.37 $7.49 96% -13% 3% $15.07 $6.36 $7.61 107% -13% 4% Yes J1745 Infliximab injection Remicade $51.21 $52.04 $51.04 $51.46 2% 0% 0% $52.04 $51.04 $51.46 2% 0% 0% J2430 Pamidronate disodium /30 MG Pamidronate Disod $65.79 NA $66.83 NA NA 2% NA $157.76 $62.84 $67.26 140% -4% 2% J2792 Rho (D) immune globulin h, sdWinrho SDF $12.23 $13.01 $11.77 $12.46 6% -4% 2% $12.97 $11.85 $12.45 6% -3% 2% J3487 Zoledronic acid Zometa $187.69 $199.51 $186.37 $189.89 6% -1% 1% $199.51 $186.37 $189.89 6% -1% 1% J7192 Factor viii recombinant Helixate FS $831.81 NA NA NA NA NA NA $468.45 $742.35 $880.16 -44% -11% 6% J7317 Sodium hyaluronate injection Hyalgan $108.84 $116.13 $107.36 $113.69 7% -1% 4% $115.68 $107.44 $113.74 6% -1% 5% J7507 Tacrolimus oral per 1 MG Prograf $3.08 $3.20 $2.55 $3.00 4% -17% -2% $3.20 $2.52 $3.12 4% -18% 1% J7517 Mycophenolate mofetil oral Cellcept $2.39 $2.46 $2.15 NA 3% -10% NA $2.46 $2.10 $2.42 3% -12% 1% J9045 Carboplatin injection Paraplatin $105.36 NA $98.69 $112.25 NA -6% 7% $128.63 $99.29 $113.68 22% -6% 8% J9170 Docetaxel Taxotere $276.45 $303.95 $272.33 $286.57 10% -1% 4% $303.95 $272.45 $286.74 10% -1% 4% J9201 Gemcitabine HCl Gemzar $106.28 $109.84 $106.80 $104.18 3% 0% -2% $109.84 $106.89 $103.99 3% 1% -2% J9202 Goserelin acetate implant Zoladex $192.36 $358.52 $181.31 $227.42 86% -6% 18% $364.13 $180.79 $228.51 89% -6% 19% J9206 Irinotecan injection Camptosar $117.78 $122.27 $117.95 $116.63 4% 0% -1% $122.29 $118.01 $116.51 4% 0% -1% J9217 Leuprolide acetate suspension Lupron/Eligard $245.30 $492.41 $198.36 $326.97 101% -19% 33% $543.97 $180.15 $341.40 122% -27% 39% Yes J9219 Leuprolide acetate implant Viadur $2,534.03 $4,777.50 $2,192.80 $2,213.97 89% -13% -13% $4,777.50 $2,192.80 $2,213.97 89% -13% -13% J9265 Paclitaxel injection Paclitaxel $20.69 NA $18.74 $22.26 NA -9% 8% $58.20 $18.67 $21.51 181% -10% 4% J9310 Rituximab cancer treatment Rituxan $414.21 $428.93 $415.16 $411.41 4% 0% -1% $428.07 $415.17 $411.45 3% 0% -1% J9355 Trastuzumab Herceptin $48.84 $53.38 $48.30 $49.29 9% -1% 1% $53.38 $48.30 $49.29 9% -1% 1% Q0136 Non esrd epoetin alpha inj Procrit $7.18 $10.06 $5.78 $8.16 40% -20% 14% $10.15 $5.58 $8.43 41% -22% 17% Notes:
Patent Status codes are as follows: SS = single source drug products; Co-SS = co-licensed or co-marketed; IMS = innovator multisource drug products; NMS = non-innovator multisource (generics) The retail classes of trade are independent pharmacies, chain pharmacies and food stores.
The all-class weights reflect the shares of each NDC-11 within the HCPC for all classes of trade combined. The class-of -trade specific weights reflect the shares of each NDC-11 within the HCPC for the individual class of trade.
The indicator for whether the results differ is positive if AIP is defined for all major classes of trade and the use of class-of -trade specific weights increased the absolute value of the difference between the class-of -trade specific AIP and the all-class AIP by at least five percentage points.