salinity management study final report
TRANSCRIPT
SALINITY MANAGEMENT STUDYFinal Report
June 1999
MWDMETROPOLITAN WATER DISTRICT OF SOUTHERN CALIFORNIA
BUREAU OF RECLAMATIONUNITED STATES DEPARTMENT OF THE INTERIOR

METROPOLITAN WATER DISTRICT OF SOUTHERN CALIFORNIAUNITED STATES BUREAU OF RECLAMATION
SALINITY MANAGEMENT STUDYFINAL REPORT
LONG-TERM STRATEGY ANDRECOMMENDED ACTION PLAN
JUNE 1999
BOOKMAN-EDMONSTONE N G I N E E R I N G , I N C .

USBR/MWD SALINITY MANAGEMENT STUDYPHASE II REPORT
BOOKMAN-EDMONSTONE N G I N E E R I N G , I N C .E N G I N E E R I N G , I N C .E N G I N E E R I N G , I N C .E N G I N E E R I N G , I N C . i
TABLE OF CONTENTS
EXECUTIVE SUMMARY______________________ 1
SECTION 1 INTRODUCTION___________________________ 1-1
SECTION 2 SALINITY PROBLEMS, IMPACTS, ANDTECHNOLOGY____________________________ 2-1
SECTION 3 EVALUATION OF POTENTIAL REGIONALSALINITY MANAGEMENT STRATEGIES ________ 3-1
SECTION 4 SALINITY MANAGEMENT POLICY ____________ 4-1
SECTION 5 SALINITY MANAGEMENT ACTION PLAN _______ 5-1
TECHNICAL APPENDICES
1. Colorado River Salinity
2. State Water Project Salinity
3. Total Dissolved Solids and Constituents Characteristics
4. MWD Operations
5. Economic Impacts
6. Water Softeners
7. Regional Brine Lines
8. Salinity Impacts on Water Recycling
9. Salinity Management by Regional Boards
10. Salt Balance in Metropolitan’s Service Area
11. Blending Analysis of Metropolitan’s Water
12. Colorado River Water Total Dissolved Solids RemovalFeasibility Study - Black & Veatch.
13. Impacts of Salinity on Human Health

USBR/MWD SALINITY MANAGEMENT STUDYPHASE II REPORT
BOOKMAN-EDMONSTONE N G I N E E R I N G , I N C .E N G I N E E R I N G , I N C .E N G I N E E R I N G , I N C .E N G I N E E R I N G , I N C . ii Table of Contents
List of Abbreviations
♦ CDHS California Department of Health Services
♦ CRA Colorado River Aqueduct
♦ CRW Colorado River Water
♦ DWR Department of Water Resources
♦ EDR Electrodialysis Reversal
♦ IX Ion Exchange
♦ mg/L Milligrams per Liter
♦ RO Reverse Osmosis
♦ RWQCB Regional Water Quality Control Board
♦ SPW State Project Water
♦ SPW EB State Project Water East Branch
♦ SPW WB State Project Water West Branch
♦ SWP State Water Project
♦ SWP EB State Water Project East Branch
♦ SWP WB State Water Project West Branch
♦ TDS Total Dissolved Solids
♦ USBR United States Bureau of Reclamation

USBR/MWD SALINITY MANAGEMENT STUDYFINAL REPORT
BOOKMAN-EDMONSTON(1* ,1((5 ,1* � � , 1& � ES-1
EXECUTIVE SUMMARY
This report presents the findings and recommendations of a two-and-one-half year technicalinvestigation of the impacts of total dissolved solids or salinity to the coastal plain of SouthernCalifornia. Metropolitan conducted the Salinity Management Study (Study) in closecollaboration with member agencies and numerous other concerned agencies. The United StatesBureau of Reclamation (USBR) was a primary study partner, contributing financial assistanceunder its congressional authority (P.L. 102-575) to develop a regional water recycling plan forSouthern California, because high salinity is a significant constraint to water recycling.
For analytical purposes in developing this report, the Colorado River Aqueduct (CRA) wasconsidered full for the study period, consistent with the objectives of the California 4.4 Plan.
BENEFITS OF REDUCED SALINITY
When salinity levels of imported water are reduced, the region benefits from:
q Improved use of local groundwater and recycled waterq Reduced costs to water consumers and utilities.
Metropolitan estimates that $95 million per year of economic benefits would result if the CRAand State Water Project (SWP) waters were to simultaneously experience a 100 milligram perliter (mg/L) reduction in salt content over their historic average. Conversely, about the samedollar amount of impacts would result if imported water salinity increased by 100 mg/L. Primarysalinity impact categories include residential, commercial, industrial and agricultural water users;groundwater and recycled water resources; and utility distribution systems.
SALT SOURCES
About half of the region’s salt is contributed by imported water, and the other half comes fromlocal sources. The CRA constitutes Metropolitan’s highest source of salinity, averaging about700 mg/L. Hardness comprises about one-half of the CRA salt load and causes troublesomescaling problems to indoor plumbing appliances and equipment at homes, business andindustries.
The SWP provides Metropolitan with lower salinity water (an average of 250 mg/L on the EastBranch and 325 mg/L on the West Branch), which can be used to blend down CRAconcentrations. SWP salinity levels can change rapidly in response to hydrologic conditions, andsuch changes are noticeable and disruptive as compared to the very gradual, almost imperceptiblechanges that occur in local streams, groundwater and wastewater collection systems. ACALFED Bay-Delta solution could lower SWP salinity by 100 mg/L and reduce its short-termvariability.

USBR/MWD SALINITY MANAGEMENT STUDYFINAL REPORT
BOOKMAN-EDMONSTON(1* ,1((5 ,1* � � , 1& � ES-2 Executive Summary
Local salinity sources include naturally occurring salts, salts added by urban water users,infiltration of brackish groundwater into sewers, irrigated agriculture, and confined animal wastemanagement practices. Urban use salt contributions to wastewater range from 250 to 400 mg/Lor more in some locations.
SALINITY MANAGEMENT POLICY STATEMENT AND ACTION PLAN
The proposed salinity management policy (Section 4) and corresponding Action Plan (Section 5)were adopted by Metropolitan in April 1999. The Action Plan consists of four basiccomponents:
q Imported water source control actionsq Distribution system salinity management actionsq Collaborative actions with other agenciesq Local actions to protect groundwater and recycled water supplies
The adopted action plan should be revisited and updated periodically as clarity emerges from anumber of critical areas, including the CALFED Bay-Delta Plan, California’s Colorado RiverWater Supply Plan, wheeling practices, Stage II disinfection by-products rules under the SafeDrinking Water Act Amendments, and operational experience gained through implementation.The first major update is recommended to occur in 2004 when the Inland Feeder becomesoperational, or sooner if a significant unanticipated change occurs in controlling conditions.
RESOURCE LIMITATIONS ON BLENDING COLORADO RIVER WATERSALINITY
The foundation of Metropolitan’s Action Plan is an imported water salinity target of 500 mg/L.Managing imported water through blending would be supplemented by source control in the twoimported water river systems, storage and exchange operations along the CRA, and a CALFEDsolution. Blending in Metropolitan’s system is achieved by curtailing delivery of higher-salinityCRA water and substituting it with comparable amounts of lower-salinity SWP water.
Annual changes in imported water supply availability and salinity concentrations greatly affectMetropolitan’s ability to achieve the target through blending. For example, above-normal runoffin 1998 provided unusually favorable conditions resulting in lower-than-target salinity levels insome months. In contrast, under such conditions as the 1977 drought, Metropolitan would nothave been able to meet the target because SWP water was in short supply and its salinity levelsrose to over 400 mg/L. To meet its blending target, Metropolitan would have had to take less ofits CRA water. Whenever a shortage of SWP supply and high salinity occur concurrently,Metropolitan would have to fully use its CRA water and experience the higher salinity. The keytrade-off in achieving a salinity target is the risk to supply reliability. To achieve the 500 mg/L

USBR/MWD SALINITY MANAGEMENT STUDYFINAL REPORT
BOOKMAN-EDMONSTON(1* ,1((5 ,1* � � , 1& � ES-3 Executive Summary
target under certain adverse conditions, up to several hundred thousand acre-feet of CRA waterwould have to be replaced by SWP water.
On average, the target will be met in about seven of every ten years. In the remaining years,hydrologic conditions constrain primarily the SWP with insufficient and often higher salinitysupplies. The proposed policy includes clear recognition of this resource limitation and callsupon local agencies to develop and manage their local projects and groundwater to accommodatethese inevitable swings in salinity of imported water due to natural hydrologic variation.
Recognizing the significant constraint of resource availability, the action plan calls forachievement of the 500 mg/L salinity objective in two stages. When conditions are favorable,500 mg/L would be pursued year-round. When conditions are less favorable, emphasis is placedon reducing salinity during April through September primarily to support irrigation with recycledwater. The summer period corresponds to the peak irrigation season and requires proportionallyless curtailment of CRA water. Under current conditions, the objective would be achieved inseven out of ten years on average; higher salinity would occur during dry years. A long-termsolution will require success in the CALFED process in reducing the salinity of SWP water on asustained basis. Exchanges for Sierra water south of the Delta offer an additional method ofsignificantly lowering SWP salinity. Furthermore, expanding storage and exchange of CRAwater for SWP water will also be necessary to achieve the year-round salinity objective withinthe constraints of water resource availability.
If the anticipated salinity benefits of a CALFED solution or CRA exchanges and storagefall short of need, then the ultimate method of achieving salinity targets may be desalinationassociated with the CRA. However, given the current state of technology, the costs would behigh and there would be significant resource and environmental concerns associated with largequantities of brine disposal. Hence, the action plan calls for an aggressive program of researchand development (R&D) of a more efficient desalination technology. This R&D effort is alreadybeing initiated by Metropolitan in partnership with interested agencies
INTEGRATION OF QUALITY AND QUANTITY
The Study shows that managing the salinity of imported water is important to the region’soverall supply mix, especially in regards to local groundwater and recycled water. Metropolitanroutinely assesses the pros and cons of quality-to-quantity relationships when planning andnegotiating new facilities and resources, a practice that is an important part of the SalinityManagement Policy and Action Plan.
REGIONAL APPROACH
The region must manage both local and imported sources to achieve a long-term salt balance.About half of the regional salt load is derived from local sources and half from imported water.

USBR/MWD SALINITY MANAGEMENT STUDYFINAL REPORT
BOOKMAN-EDMONSTON(1* ,1((5 ,1* � � , 1& � ES-4 Executive Summary
Other agencies that can influence the salt balance of the coastal plain must participate in thiseffort if the region is to achieve a cohesive strategy. The Action Plan calls for concurrentmanagement of both local and imported sources of salt for the region to achieve a long-term saltbalance.

USBR/MWD SALINITY MANAGEMENT STUDYFINAL REPORT
BOOKMAN-EDMONSTONE N G I N E E R I N G , I N C .E N G I N E E R I N G , I N C .E N G I N E E R I N G , I N C .E N G I N E E R I N G , I N C . 1-1
SECTION 1INTRODUCTION
STUDY PROCESS
Phase I of the Salinity Management Study identified the problems caused by increased salinity,described the sources of salinity, updated some earlier studies on the economic impact of highsalinity water supplies, and identified some possible salinity management strategies. In Phase II,regional salinity management strategies have been formulated that can be implemented both inthe short-term (such as new imported water blending policy) and long-term (such as improvedDelta export salinity to Southern California as a result of CALFED efforts). Figure 1-1 shows thestudy schedule.
Figure 1-1
This comprehensive investigation was conducted with financial assistance from the U.S. Bureauof Reclamation (USBR) and in coordination with numerous, state, local, and member agencies.
Salinity Management Study Schedule

USBR/MWD SALINITY MANAGEMENT STUDYFINAL REPORT
BOOKMAN-EDMONSTON Section 1E N G I N E E R I N G , I N C .E N G I N E E R I N G , I N C .E N G I N E E R I N G , I N C .E N G I N E E R I N G , I N C . 1-2 Introduction
U.S. BUREAU OF RECLAMATION AND METROPOLITAN FUNDING PARTNERSHIP
USBR and Metropolitan agreed in August 1996 to cooperate and jointly fund and support thissalinity management study. Each agency provided funding and significant in-kind services. USBR funding was authorized and budgeted from the Southern California Comprehensive WaterReclamation and Reuse Study Program (Title XVI, P.L. 102-575) since salinity is a majorconstraint to the viability of water reuse projects.
OBJECTIVES
The primary objective of this effort is to develop a functional salinity management strategy forthe region served by Metropolitan.
Goals for the study process included:
1. Assess salinity problems and needs of the region;
2. Formulate and evaluate various salinity management strategies; and
3. Develop regional salinity management policies and an action plan.
OUTREACH
Metropolitan formed a task force of member agencies to interact with the study team and USBRduring the Study. This group established the scope and budget for the Study using existingagency data and "expert opinion." Information was updated and new assessments, modeling, andsurveys were conducted, as needed. The task force coordinated the efforts of the involvedagencies to promote effective communication and support for the development of salinitymanagement strategies. In addition, the task force contacted the individual water/wastewateragencies and associations listed below:
! Member Agencies.
! Retail Water Utilities
! Metropolitan, USBR and Department of Water Resources (DWR) Operating Personnel
! Santa Ana Watershed Project Authority (SAWPA)
! Southern California Alliance of Publicly Owned Treatment Works (SCAP)
! Association of Groundwater Agencies (AGWA)
! Los Angeles, Santa Ana and San Diego Regional Water Quality Control Boards
! WateReuse Association of California
! USBR Southern California Comprehensive Water Reclamation and Reuse StudyExecutive Management Team
! California Department of Water Resources

USBR/MWD SALINITY MANAGEMENT STUDYFINAL REPORT
BOOKMAN-EDMONSTON Section 1E N G I N E E R I N G , I N C .E N G I N E E R I N G , I N C .E N G I N E E R I N G , I N C .E N G I N E E R I N G , I N C . 1-3 Introduction
! State Water Contractors and California Urban Water Agencies
SALINITY SUMMIT
The outreach effort culminated with a Salinity Summit in January 1999 where 100 seniormanagers and technical experts representing 60 agencies discussed practical aspects ofimplementing the regional action plan. Many of the participants concluded that high salinitylevels might be one of the State’s biggest water quality problems going into the twenty-firstcentury.
EARLY ACTIONS
Since the initial phase of the Study, Metropolitan has taken several interim steps to addresssalinity problems:
! Refined the existing blending policy by adopting an interim total dissolved solids (TDS)concentration target of 500 to 550 mg/L for the months of April – September 1998;
! Initiated public-private partnerships on research and development for innovative desalinationtechnologies;
! Initiated efforts with DWR to manage salinity on the State Water Project (SWP) andopportunities to reduce long-term salinity through CALFED.

USBR/MWD SALINITY MANAGEMENT STUDYFINAL REPORT
BOOKMAN-EDMONSTONE N G I N E E R I N G , I N C .E N G I N E E R I N G , I N C .E N G I N E E R I N G , I N C .E N G I N E E R I N G , I N C . 2-1
SECTION 2SALINITY PROBLEMS,
IMPACTS AND TECHNOLOGY
Salinity, or total dissolved solids (TDS), commonly expressed in milligrams per liter (mg/L), is ameasure of mineral salts dissolved in water. Typical constituents include calcium, magnesium,sodium, sulfate, and chloride. Figure 2-1 is a breakdown of TDS components found inMetropolitan's water. At salinity levels of about 1,000 mg/L, potable and recycled water use aresignificantly impaired, and alternate lower salinity supplies are typically sought. TechnicalAppendix 3 provides detailed information on the regulations and physical impacts of salinityconstituents.
Hardness is a component of TDS. It is a measure of specific dissolved salts, principally calciumand magnesium (Table 2-1), which leave deposits in plumbing systems and appliances. Hardnessalso inhibits the solubility of soap, which is noticeable when bathing or laundering clothes. Watersoftening reduces hardness, but adds other salts to the water and wastewater in the process.
Table 2-1 Hardness Quality CharacteristicsHardness Range mg/L (as CaCO 3) Description
0 – 75 Soft
75 – 150 Moderately Hard
150 – 300 Hard
Over 300 Very Hard
Numerous factors contribute to high salinity in Metropolitan's service area. Some are a result ofthe sources of imported Metropolitan water; others result from salts entering the water as ittravels from the foothill areas to the ocean. Imported water from the Colorado River alwayscontains high salinity levels, primarily due to naturally occurring minerals and agriculturalrunoff. In the arid southwestern states, there is little or no surplus water to flush salts from theenvironment.
Salinity levels increase with each cycle of urban use for residential, commercial, or industrialpurposes. Such urban uses typically add 250 to 400 mg/L of salt to wastewater. Salt incrementshigher than the typical 250 to 400 mg/L level indicate higher than normal salinity contributionsfrom industrial and commercial brines, residential water softeners, or brackish groundwaterinfiltration into sewers.

USBR/MWD SALINITY MANAGEMENT STUDYFINAL REPORT
BOOKMAN-EDMONSTON Section 2E N G I N E E R I N G , I N C .E N G I N E E R I N G , I N C .E N G I N E E R I N G , I N C .E N G I N E E R I N G , I N C . 2-2 Salinity Problems, Impacts, & Technology
Figure 2-1
����������������������������������������������������������������������������������������������������������������������������������������������������
������������������������������������������������������������������������������
��������������������������������������������������������������������������
��������������������������������������������������������������������������
������������������������������������������������������������������������������ �������������������������������������
����������������������������������������������������������������������������������������������������������������������������������������������������������������������������������������� ���������������������������������������
������������������������������������������������������������������������������
����������������������������������������������������������������������������������������������������������������������������������������������������
����������������������������������������������������������������������������������������������������������������������������������������������������
���������������������������������������������������������������������������������������������������������������������
��������������������������������������������������������������������������
�����������������������������������������������������������������������������������������������������������������������������������������������������������������������������������������������������������������������������������������������������������������������������������������������������������������������������������������������������������������������������������������������������������������������
���������������������������������������������������������������������������������������������������������������������������������������������������������������������������������������������������
���������������������������������������������������������������������������������������������������������������
����������������������������������������������������������������������������������������������������������������������������������������������������
������������������������������������������������������������������������������������������������������������������������������������������������������������ �������������������������������������
���������������������������������������������������������������������������������������������������������������
TDS Constituents* in Lake Mathews and State Water Project Waters
0
100
200
300
400
500
600
700
LakeMathews
SWP WestBranch
SWP EastBranch
Co
nce
ntr
atio
n (
mg
/L)
Trace**���������������� Chloride��������
Sulfate���������������� Bicarbonate���������������� Sodium��������
Magnesium���������������� Calcium
Silica
* Average Values for 1/1990-1/1998** Trace: Potassium, Carbonate, Nitrate, Fluoride, Boron and Bromide

USBR/MWD SALINITY MANAGEMENT STUDYFINAL REPORT
BOOKMAN-EDMONSTON Section 2E N G I N E E R I N G , I N C .E N G I N E E R I N G , I N C .E N G I N E E R I N G , I N C .E N G I N E E R I N G , I N C . 2-3 Salinity Problems, Impacts, & Technology
Groundwater sources experience increased TDS as a result of agricultural and urban activitiesand groundwater overdraft. Without an ocean outfall or stream discharge, inland areas that reusewastewater encounter a build-up of salt in groundwater (Figure 2-2) as salt continues toaccumulate without being removed. Some inland agencies have access to brine lines to exportsalt and concentrated wastes to a coastal treatment plant and ocean outfall. Other agencies havenot yet found the construction of brine lines to be economically feasible. In previous years,groundwater overdraft along the coastline has led to seawater intrusion into coastal groundwaterbasins and has thus impaired the quality of freshwater aquifers.
Figure 2-2
SALT BALANCE
Salt Storage
ImportedWater
TreatedWastewater
Recharge
Imported &Stream
RechargeFarm
Discharges
UrbanDischarges
UrbanDischarges
OutfallsDischarge
Salts to theOcean
RiverRecharge
Salt StorageOcean
SeawaterIntrusion
The long-term salt imbalance of Southern California is an important management problem. Smaller basins, like the Arlington and Mission groundwater basins in Riverside and San Diegocounties respectively, were abandoned for municipal supply years ago because of high salinitylevels. Only recently have these basins been restored to use through construction of relativelyexpensive demineralization projects. The larger groundwater basins, by virtue of their storagecapacity and geographic extent, function as "shock absorbers" when droughts cause TDS toincrease in imported supplies. However, even these large basins are experiencing progressive

USBR/MWD SALINITY MANAGEMENT STUDYFINAL REPORT
BOOKMAN-EDMONSTON Section 2E N G I N E E R I N G , I N C .E N G I N E E R I N G , I N C .E N G I N E E R I N G , I N C .E N G I N E E R I N G , I N C . 2-4 Salinity Problems, Impacts, & Technology
salt buildup despite the extensive regulatory and management practices in place to controlsalinity increases. Figure 2-3 shows an example of this buildup. Figure 2-4 illustrates thecurrent estimated salt balance for the region. Clearly, there is an adverse trend. Current annualaccumulation of salts within the coastal plain of Southern California is approximately600,000 tons per year, as depicted in Figure 2-4. Technical Appendix 10 provides a moredetailed discussion of the regional salt balance.
Figure 2-3
Groundwater Trends
750
650
550
450
350
250
1501964 1968 1972 1976 1980 1984 1988 1992 1996 2000
TD
S (
mg
/l)
This well is illustrative of increasing salinity in the Santa Ana portion of the Orange CountyGroundwater Basin. Salinity is increasing at a rate of 7.35 mg/L annually.
(OCWD Well No. Sa-16/1)

USBR/MWD SALINITY MANAGEMENT STUDYFINAL REPORT
BOOKMAN-EDMONSTON Section 2E N G I N E E R I N G , I N C .E N G I N E E R I N G , I N C .E N G I N E E R I N G , I N C .E N G I N E E R I N G , I N C . 2-5 Salinity Problems, Impacts, & Technology
Figure 2-4
BACKGROUND AND HISTORY
Salinity has been a concern of water resource managers in Southern California for most of the20th century. Agricultural activities since the 1880s have increased TDS in many groundwaterbasins, and some agricultural and urban areas have been using imported water to blend downhigh TDS levels in their groundwater supplies since the early days of the twentieth century(Figure 2-5, and Table 2-2).
During the 1950s and 1960s, more than 2 million acre-feet of Colorado River Water (CRW) wasspread in the Santa Ana and San Gabriel Rivers to alleviate severe groundwater overdraft. Inaddition, seawater barriers were built and placed into operation to prevent further seawaterintrusion. More than one million acre-feet of imported water has been injected into barriers inthe Central and West Coast Basins. With an average TDS of 700 mg/L, this CRW hascontributed significant quantities of salts to these groundwater basins.
0
0.5
1
1.5
2
2.5
3
3.5
In flow O u tflow
Sa
lt (
Mill
ion
s o
f T
on
s/Y
ea
r)
Im ported
W ater
N atural
U rban and
Agricultural
C ontributions
S torm flow
W astew ater
O utflow
Salt Balance in Southern California Coastal Plain
Inflow Exceeds Outflow

USBR/MWD SALINITY MANAGEMENT STUDYFINAL REPORT
BOOKMAN-EDMONSTON Section 2E N G I N E E R I N G , I N C .E N G I N E E R I N G , I N C .E N G I N E E R I N G , I N C .E N G I N E E R I N G , I N C . 2-6 Salinity Problems, Impacts, & Technology
Figure 2-5
Groundwater with TDS exceeding 1000 mg / L
Groundwater Basins
GROUNDWATER BASINS IN SOUTHERN CALIFORNIA
Table 2-2 TDS of Groundwater WellsTDS Concentration,
(mg/L)Annual Production,
(MAF)Percent
Less Than 500 1.06 78
500 to 1,000 0.15 11
Greater than 1,000 0.15 11
TOTAL 1.36 100
WASTEWATER AND RECYCLING ISSUES
Wastewater managers have addressed salinity management issues since the 1950s. The landmark1964 water reuse plan prepared by the Los Angeles County Sanitation Districts identified a

USBR/MWD SALINITY MANAGEMENT STUDYFINAL REPORT
BOOKMAN-EDMONSTON Section 2E N G I N E E R I N G , I N C .E N G I N E E R I N G , I N C .E N G I N E E R I N G , I N C .E N G I N E E R I N G , I N C . 2-7 Salinity Problems, Impacts, & Technology
blueprint to protect upstream "high quality wastewater" for beneficial reuse, and to divert poorerquality industrial and commercial brine waste streams to the ocean. However, not all inlandwastewater agencies have access to an ocean outfall or connecting brine line. Regional brinelines are expensive and usually require multiple agency cooperation and financing.
Other sources of salts flowing into wastewater collection systems contribute to salinity inwastewater treatment plant discharges. Leaky sewers can be infiltrated by brackish groundwater.Certain types of residential water softeners are controversial sources of salts in wastewater.Industrial and commercial discharge to sewer systems are typically not regulated for TDS bypretreatment programs. Water conservation efforts in recent years have prompted manyindustries to increase internal recycling, thus resulting in higher TDS concentrations in theirwaste streams. Long-term indoor water conservation measures reduce water use and increasesalinity concentrations of residential wastewater by 2 to 5 percent. Figure 2-6 depicts the sourcesof salinity reaching a coastal recycling water facility in Metropolitan's service area.
Figure 2-6
Beginning in the mid-1980s with the expansion of water recycling programs, concerns aboutwastewater TDS have grown significantly. In general, TDS over 1,000 mg/L becomesproblematic for irrigation and industrial reuse customers. In addition to TDS, concentrations of
Sources of TDS at a Water Recycling Plant
1050100
4085340
485
1390
130
60
140
360
700
1260
120
40110
350
640
12008050120
350
600
1500
1000
500
01986
Low TDSWater Supply
1992Drought/Water Conservation
1995Mid YearCondition
1997Anticipated
Levels
TD
S (
mg
/L)
Groundwater InfiltrationIndustrial-Commercial Brines
Residential Water Softeners
ConsumptiveUseIncrement
WaterSupply
Demineralization is needed to meet recycled water quality requirements (TDS <1,000 mg/l) for intended uses.Various sources contribute TDS to sewage collection system. Example is San Diego North City WaterRecycling Plant.

USBR/MWD SALINITY MANAGEMENT STUDYFINAL REPORT
BOOKMAN-EDMONSTON Section 2E N G I N E E R I N G , I N C .E N G I N E E R I N G , I N C .E N G I N E E R I N G , I N C .E N G I N E E R I N G , I N C . 2-8 Salinity Problems, Impacts, & Technology
specific minerals, such as boron, chloride, and sodium, must be within certain limits for somecrops (such as boron for citrus and avocados). A City of Escondido study of avocado crop yieldsdocumented lower crop yields from higher TDS recycled water (Figure 2-7).
Figure 2-7
To protect existing high-quality groundwater basins, the Regional Water Quality Control Boards(RWQCBs) often set groundwater quality objectives well below 1,000 mg/L of TDS. In somecases, chlorides, not TDS, are the controlling parameter affecting reuse potential and basin waterquality objectives. Reclaimed water users that irrigate or recharge groundwater with reclaimedwater containing higher TDS than these objectives must provide expensive solutions such asdesalters, blend with lower TDS potable supplies, or practice less reuse.
COLORADO RIVER
Colorado River water has long been identified as a significant source of salinity. The very highTDS impacts on Mexico in the mid-1960s, and the Federal Water Pollution Control Actamendments, led to Minute 242 of the International Boundary and Water Commission and theColorado River Basin Salinity Control Act in 1973 and 1974, respectively.
Escondido Avocado Study
50
0
100
100
62
78
Potable Recycled 50/50 Recycled/Potable Blend
72
Recycled &40% Leaching
Cro
p Y
ield
(P
erce
nt)

USBR/MWD SALINITY MANAGEMENT STUDYFINAL REPORT
BOOKMAN-EDMONSTON Section 2E N G I N E E R I N G , I N C .E N G I N E E R I N G , I N C .E N G I N E E R I N G , I N C .E N G I N E E R I N G , I N C . 2-9 Salinity Problems, Impacts, & Technology
Below Hoover Dam723 mg/L
CentralArizonaProjectColorado
RiverAqueduct
Below Parker Dam747 mg/L
At Imperial Dam879 mg/L
Colorado RiverNumeric Criteria for Salinity
Gulfof
California
A R I Z O N AM E X I C O
C A L I F O R N I AM E X I C O
NEVADA
CA L I FORN
I A
Colo rad o R i v e r
Figure 2-8In addition, the seven basin statesformed the Colorado River BasinSalinity Control Forum for thepurpose of interstate cooperationand to provide the states with theinformation necessary to complywith Sections 303(a) and (d) ofthe Clean Water Act. Prior to1974, evaluation of the impactsassociated with changing levels ofTDS had not been included in theeconomic analyses of futurewater-related projects. This led todevelopment of economic impactestimates of many hundreds ofmillions of dollars annually fromuse of CRW in the Lower Basin(1978, 1980, and 1988). TheColorado River Basin SalinityControl Program, which ismanaged by the federalgovernment and the basin states,undertakes staged measures tooffset salinity contributions ofnew development to meet theadopted salinity criteria (Figure 2-
8). Technical Appendix 1 provides detailed information on the Colorado River Salinity ControlProgram. The USBR has developed sophisticated modeling to plan the staging of measures toreduce the salt load in the Colorado River.
Starting in the early 1970s with the initial Metropolitan deliveries from the SWP, the blending ofSWP and CRW supplies and the use of relatively low TDS supplies of the SWP for groundwaterreplenishment became a policy objective in some areas. (See Figure 2-9 for the historic SWP andCRW salinity.) The RWQCB developed Basin Plans to address basin-wide salt balance issues. Some of those Basin Plans, however, were based on optimistic assumptions made in the 1970sabout the amount of SWP water available and about expected improvements in the salinity levelsof imported water. During the historic high Colorado River flows (1983-1986), monthly TDS

USBR/MWD SALINITY MANAGEMENT STUDYFINAL REPORT
BOOKMAN-EDMONSTON Section 2E N G I N E E R I N G , I N C .E N G I N E E R I N G , I N C .E N G I N E E R I N G , I N C .E N G I N E E R I N G , I N C . 2-10 Salinity Problems, Impacts, & Technology
levels dropped significantly to a historic low of about 525 mg/L, the lowest sustained salinityconcentrations since the Colorado River Aqueduct was completed (Figure 2-9). This dropalleviated concerns about imported water salinity until concentrations returned to their normalhigher levels in the 1990s. Figure 2-10 is a bell curve illustrating variability in CRW salinity.
Figure 2-9
CRW and SWP salinity levels increased significantly during the 1987-1992 drought. Thecumulative effect was that local potable systems experienced increased TDS, thus making itdifficult for reclaimed water producers and wastewater dischargers to comply with Basin Planobjectives. During an extreme drought, CRA supplies could exceed 900 mg/L (a 5-percentprobability), as illustrated in Figure 2-11.
Imported Water Salinity : 1940-1998 at LakeHavasu and 1973-1998 at Devil Canyon Afterbay
������������������������������������������������������������������������������������������������������������������������������������������������������������������������������������������������������������������������������������������������������������������������������������������������������������������������������������������������������������������������������������������������������������������������������������������������������������������������������������������������������������������������������������������������������������������������������������������������������������������������������������������������������������������������������������������������������������������������������������������������������������������������������������������������������������������������������������������������������������������������������������������������������������������������������������������������������������������������������������������������������������������������������������������������������������������������������������������������������������������������������������������������������������������������������������������������������������������������������������������������������������������������������������������������������������������������������������������������������������������������������������������������������������������������������������������������������������������������������������������������������������������������������������������������������������������������������������������������������������������������������������������������������������������������������������������������������������������������������������������������������������������������������������������������������������������������������������������������������������������������������������������������������������������������������������������������������������������������������������������������������������������������������������������������������������������������������������������������������������������������������������������������������������������������������������������������������������������������������������������������������������������������������������������������������������������������������������������������������������������������������������������������������������������������������������������������������������������������������������������������������������������������������������������������������������������������������������������������������������������������������������������������������������������������������������������������������������������������������������������������������������������������������������������������������������������������������������������������������������������������������������������������������������������������������������������������������������������������������������������������������������������������������������������������������������������������������������������������������������������������������������������������������������������������������������������������������������������������������������������������������������������������������������������������������������������������������������������������������������������������������������������������������������������������������������������������������������������������������������������������������������������������������������������������������������������������������������������������������������������������������������������������������������������������������������������������������������������������������������������������
1940
1941
1942
1943
1944
1945
1946
1947
1948
1949
1950
1951
1952
1953
1954
1955
1956
1957
1958
1959
1960
1961
1962
1963
1964
1965
1966
1967
1968
1969
1970
1971
1972
1973
1974
1975
1976
1977
1978
1979
1980
1981
1982
1983
1984
1985
1986
1987
1988
1989
1990
1991
1992
1993
1994
1995
1996
1997
1998
0
100
200
300
400
500
600
700
800
0
100
200
300
400
500
600
700
800
SilverwoodLake
1940-1949 1950-1959 1960-1969 1970-1979 1980-1989 1990-98
Lake Havas u
TD
S in
mg/
L

USBR/MWD SALINITY MANAGEMENT STUDYFINAL REPORT
BOOKMAN-EDMONSTON Section 2E N G I N E E R I N G , I N C .E N G I N E E R I N G , I N C .E N G I N E E R I N G , I N C .E N G I N E E R I N G , I N C . 2-11 Salinity Problems, Impacts, & Technology
Figure 2-10
Figure 2-11
Salinity at Parker Dam1000
800
600
1995400
2000 2005 2010 2015
Sal
init
y m
g/l
Dry Periods
Wet Periods
Although the TDS criterion at Parker Dam is 747 mg/L, the Colorado River TDS changes from high tolow runoff conditions. The above modeling results, prepared by the U.S. Bureau of Reclamation, showhow salinity would be affected by a repeat of either the wettest or driest years of the record.
CRA TDS (mg/L) Monthly Distribution atLake Mathews, May 1941 to January 1998
2
32
12
20
47
57
86
111 110
64
57
32
21
9
0
20
40
60
80
100
120
55
0 t
o 5
25
52
5 t
o 5
50
55
0 t
o 5
75
57
5 t
o 6
00
60
0 t
o 6
25
62
5 t
o 6
50
65
0 t
o 6
75
67
5 t
o 7
00
70
0 t
o 7
25
72
5 t
o 7
50
75
0 t
o 7
75
77
5 t
o 8
00
80
0 t
o 8
25
82
5 t
o 8
50
Nu
mb
er
of
TD
S V
alu
es
Averag e = 687 m g/L
Median = 694 m g /L

USBR/MWD SALINITY MANAGEMENT STUDYFINAL REPORT
BOOKMAN-EDMONSTON Section 2E N G I N E E R I N G , I N C .E N G I N E E R I N G , I N C .E N G I N E E R I N G , I N C .E N G I N E E R I N G , I N C . 2-12 Salinity Problems, Impacts, & Technology
Urban and agricultural irrigation uses of imported water and recycled water are especiallysensitive to drought events. Wastewater agencies also experience difficulty complying withwaste discharge permit requirements designed to protect groundwater basins and theenvironment. Such an experience during the 1987-1992 drought resulted in the Los AngelesRWQCB adopting a new chloride policy for its region.
Where local groundwater or reservoir water is of good quality, the impacts of these episodicconditions are reduced through blending of local and imported water. However, at locationswhere the changes in imported supplies cannot be mitigated by local supplies, the impact may beacute. Furthermore, agencies using SWP water to blend down high salinity groundwater wouldexperience added blending costs and reduced use of local supplies when SWP salinity is high.
The apparent dilemma for the region is that during droughts when the use of recycled waterprojects and marginal quality groundwater are most important, the use of some of these localsupplies may be constrained by the quality changes in imported supplies. In response to theseconstraints, some agencies are developing demineralization facilities to reduce the salinity in therecycled water supply.
STATE WATER PROJECT
When the SWP was originally planned, it was to deliver 220 mg/L TDS water on average toSouthern California over any ten-year period (DWR, State Water Service Contract, Article 19).In reality, however, salinity averages about 325 mg/L in the West Branch and about 250 mg/L inthe East Branch (Figure 2-13 and 2-14). The Banks Pumping Plant in the Delta averaged about250 mg/L, with considerable and problematic variations on a monthly basis (Figure 2-12). Thedifference in West Branch Salinity is attributable to salt loading from local stream flows,reservoir evaporation and filling patterns at Pyramid and Castaic Lakes on the West Branch. InSeptember 1993, TDS levels at the West Branch reached a high of 470 mg/L. During the 1977drought, TDS in the Delta at the Banks Pumping Plant exceeded 700 mg/L. Compared to theColorado River, the salinity of SWP water changes rapidly, responding to routine seasonalchanges and periodic drought and flood events.

USBR/MWD SALINITY MANAGEMENT STUDYFINAL REPORT
BOOKMAN-EDMONSTON Section 2E N G I N E E R I N G , I N C .E N G I N E E R I N G , I N C .E N G I N E E R I N G , I N C .E N G I N E E R I N G , I N C . 2-13 Salinity Problems, Impacts, & Technology
Figure 2-12
Figure 2-13
SPW West Branch Monthly TDS (mg/L) Distributionat Castaic Lake, May 1972 to January 1998
1
2 6
4 5
3 22 9
3 1
5 1
4 4
3 1
1 1
5
1 2
0
1 0
2 0
3 0
4 0
5 0
6 0
22
0 t
o 2
40
24
0 t
o 2
60
26
0 t
o 2
80
28
0 t
o 3
00
30
0 t
o 3
20
32
0 t
o 3
40
34
0 t
o 3
60
36
0 t
o 3
80
38
0 t
o 4
00
40
0 t
o 4
20
42
0 t
o 4
40
44
0 t
o 4
60
46
0 t
o 4
80
Nu
mb
er
of
TD
S V
alu
es
A vera g e = 3 28 m g /L
Me d ian T D S = 3 33
Historic Monthly TDS at Banks Pumping Plant andSacramento River at Greene’s Landing
0
100
200
300
400
500
600
700
800
900
Jan-
68
Jan-
71
Jan-
74
Jan-
77
Jan-
80
Jan-
83
Jan-
86
Jan-
89
Jan-
92
Jan-
95
TD
S (
mg
/L)
Banks Pumping Plant
Sacramento River at Greene's Landing

USBR/MWD SALINITY MANAGEMENT STUDYFINAL REPORT
BOOKMAN-EDMONSTON Section 2E N G I N E E R I N G , I N C .E N G I N E E R I N G , I N C .E N G I N E E R I N G , I N C .E N G I N E E R I N G , I N C . 2-14 Salinity Problems, Impacts, & Technology
Figure 2-14
Hydrologically driven short-term salinity increases in the Sacramento – San Joaquin Delta areunavoidable. During drought periods, seawater intrusion in the Delta due to tidal actionsignificantly increases TDS, including chloride levels (Figure 2-15, and 2-16). Tidal flow alsobrings in bromide, which may be transformed into bromate when treated at a water filtrationplant with ozone. Bromate is an undesirable disinfection by-product, and regulation of it beganin November 1998. Studies show that depending upon future bromate regulations and watertreatment measures needed at Metropolitan filtration plants to mitigate bromate formation, watertreatment processes could add 30 to 90 mg/L of TDS to Metropolitan's treated water. Incomparison, present TDS contributions from filtration plant processes are less than 10 mg/L.
Reservoir management, groundwater wheeling and storm water inflows change the salinity ofSWP water between the Banks Pumping Plant at the Delta and Metropolitan's point of deliveryon the East Branch at the Devil Canyon Afterbay on a short-term basis as illustrated inFigure 2-17. The changes are favorable in some cases, while in others, they are unfavorable. Ona long-term basis, the TDS at Banks and Devil Canyon have been equal at about 250 mg/L.Figure 2-17 also illustrates the consistently better quality of Sacramento River water.
SPW East Branch Monthly TDS (mg/L) Distributionat Silverwood Lake, June 1973 to January 1998
4
9 10
14
31
55
34
30
14
26
14 13
1917
3
0
10
20
30
40
50
60
65
to
90
90
to
11
5
11
5 t
o 1
40
14
0 t
o 1
65
16
5 t
o 1
90
19
0 t
o 2
15
21
5 t
o 2
40
24
0 t
o 2
65
26
5 t
o 2
90
29
0 t
o 3
15
31
5 t
o 3
40
34
0 t
o 3
65
36
5 t
o 3
90
39
0 t
o 4
15
41
5 t
o 4
40
Nu
mb
er
of
TD
S V
alu
es
Average = 248 m g/L
Median = 229 m g/L

USBR/MWD SALINITY MANAGEMENT STUDYFINAL REPORT
BOOKMAN-EDMONSTON Section 2E N G I N E E R I N G , I N C .E N G I N E E R I N G , I N C .E N G I N E E R I N G , I N C .E N G I N E E R I N G , I N C . 2-15 Salinity Problems, Impacts, & Technology
Figure 2-15
San Pablo
Bay
River
River
San
Joaquin
Suisun
Marsh
SWPPumping
Station
Sacrament
o
Antioch
Berkeley
Pittsburg19
531971
1982 194819841949
19861953
19571979
19641955
19661985
19721947
19901989 1977
1958
1969
1956
1967
1965
1963
1946
1945
,195
119
80
1973
1950
1976 19
78
1960
1954 19
8819
5919
44
1987
,196
8
1981
,196
1
1962
,197
0
1974
,197
5
1952
WETTERDRIER
Lines represent 1,000 mg/L of chloride measured 1 1/2 hours after high tide. Chloride levels in water increases during drought years. Data obtained from State Water Resources Control Board and Department of Water Resources.
CHLORIDE INTRUSION INTO THE DELTA1944 - 1990

USBR/MWD SALINITY MANAGEMENT STUDYFINAL REPORT
BOOKMAN-EDMONSTON Section 2E N G I N E E R I N G , I N C .E N G I N E E R I N G , I N C .E N G I N E E R I N G , I N C .E N G I N E E R I N G , I N C . 2-16 Salinity Problems, Impacts, & Technology
Figure 2-16
Figure 2-17
Chloride Levels in Wastewater
During drought periods, chloride levels in wastewater discharge escalatedrastically, which can create problems to meet discharge requirements.
1985 1990 1996 1985 1990 1996 1985 1990 1996
69
154
108
119
168
129
97
165
130
Los AngelesTillman Plant
Thousand OaksHill Canyon Plant
Las VirgenesTapia Plant
Cl-
mg
/L
Cl-
mg
/L
Cl-
mg
/L
TDS in California Aqueduct at Banks PumpingPlant, Devil Canyon Afterbay and SacramentoRiver at Greene’s Landing
TDS
mg/
L
DEVIL CANYON AFTERBAY
BANKSPUMPINGPLANT
100
0
200
300
400
500
JAN 94 JAN 96JAN 95
SACRAMENTORIVER

USBR/MWD SALINITY MANAGEMENT STUDYFINAL REPORT
BOOKMAN-EDMONSTON Section 2E N G I N E E R I N G , I N C .E N G I N E E R I N G , I N C .E N G I N E E R I N G , I N C .E N G I N E E R I N G , I N C . 2-17 Salinity Problems, Impacts, & Technology
Through the CALFED process and through its role as a SWP contractor, Metropolitan is activelyworking to monitor and support actions that would reduce the salinity content of SWP water. Current TDS objectives cited in the State Water Service Contracts are listed in Table 2-3. Technical Appendix 2 provides additional information regarding SWP salinity.
Table 2-3 Current TDS Objectives for SWPConstituent Monthly Average (mg/L) 10-Year Average (mg/L)
TDS 440 220
Chlorides 110 55
PERCHLORATE
Perchlorate, a salt that has recently been detected in local groundwater and Colorado River water,is presenting an emerging water quality issue. Perchlorate (as ammonium perchlorate) is aninorganic chemical used in the production of solid rocket fuels, munitions, and fireworks. It is acommercial product that does not exist naturally in the environment.
The California Department of Health Services (CDHS) has adopted an action level forperchlorate in drinking water of 18 micrograms per liter. CDHS recommends that utilitiesmonitor their water supplies and take the supply out-of-service if the concentration of perchlorateexceeds the action level. The analytical reporting limit is 5 micrograms per liter. Since 1997,perchlorate has been detected statewide in 110 domestic water wells in areas where aerospacematerial and munitions development, testing, and manufacturing occurred. Thirty-three of thosewells have exceeded the state's action level and twenty-two wells have been closed. Theremaining wells are blended with other sources to comply with the action level criteria of theCDHS.
Perchlorate has been detected in Metropolitan's Colorado River water at concentrations rangingfrom 5 to 9 micrograms per liter. SWP water does not have detectable levels of perchlorate. Thecontamination in Colorado River water has been traced to perchlorate-based manufacturing in theLas Vegas/Henderson, Nevada area (and is discharged into the Las Vegas Wash to Lake Mead). The manufacturers are cooperating with the Nevada Division of Environmental Protection tocharacterize the extent of the contamination and to provide containment and treatment. Ingeneral, because perchlorate is a chemically conservative substance that behaves in watersimilarly to salinity, measures to mitigate TDS in CRA water will serve to reduce perchlorateconcentrations as well.

USBR/MWD SALINITY MANAGEMENT STUDYFINAL REPORT
BOOKMAN-EDMONSTON Section 2E N G I N E E R I N G , I N C .E N G I N E E R I N G , I N C .E N G I N E E R I N G , I N C .E N G I N E E R I N G , I N C . 2-18 Salinity Problems, Impacts, & Technology
ECONOMIC BENEFITS OF SALINITY MANAGEMENT
Reducing the salinity of delivered water and correcting the salt imbalance of the coastal plain,offers the potential for sizeable public benefit. Conversely, degradation of higher saltconcentrations would cause significant impacts to water consumers and local resources.
High salinity is a serious water quality problem. As salinity increases, laundry detergents workless effectively, plumbing fixtures and home appliances wear out faster; and industrial usersincur extra treatment costs for cooling towers, boilers, and manufacturing processes. Atsufficiently high levels of salt, water also begins to have an undesirable taste, resulting inincreased buying of bottled water or home treatment devices. Recycling and compliance withstate and federal wastewater discharge permits becomes difficult to accomplish. Increasedsalinity in groundwater requires blending with less saline sources. Vegetation can experiencerestricted growth and reduced crop yield. Technical Appendix 3 provides additional informationon the physical impacts of high salinity. Technical Appendix 5 addresses details related to theeconomic benefits of reducing high-TDS water supplies.
ECONOMIC ASSESSMENT MODEL
The Salinity Management Study task force worked extensively with USBR and Member Agencystaffs to update the 1988 USBR model for assessing regional impacts of salinity. New data,assessments, surveys and economic factors applicable to the Metropolitan service area wereincorporated into the USBR model to improve the accuracy of the economic impact and benefitestimates.
As a result of extensive peer and expert review, a residential survey, and case study analysis, thetask force concluded that municipal consumers, industry, agriculture, and public water andwastewater systems experience significant costs from sustained levels of high salinity. Thecategories in Table 2-4 were investigated to determine economic relationships:

USBR/MWD SALINITY MANAGEMENT STUDYFINAL REPORT
BOOKMAN-EDMONSTON Section 2E N G I N E E R I N G , I N C .E N G I N E E R I N G , I N C .E N G I N E E R I N G , I N C .E N G I N E E R I N G , I N C . 2-19 Salinity Problems, Impacts, & Technology
Table 2-4 Summary of Economic Benefits of Reduced Salinity
Residential! Increased life of plumbing system and appliances! Reduced use of bottled water and water softeners
! Commercial! Decreased cost of water softening! Decreased use of water for cooling! Increased equipment service life
! Industrial! Decreased cost of water treatment! Decreased water usage! Decreased sewer fees
! Agricultural! Increased crop yield! Decreased water usage for leaching purposes
! Utilities! Increased life of treatment facilities and pipelines
! Groundwater! Improved wastewater discharge requirements for permit compliance! Decreased desalination and brine disposal costs
! Recycled Water! Decreased use of imported water for leaching! Desalination and brine disposal costs
Figure 2-18 shows $95 million of regional benefit if average SWP and CRA salinity were todecrease by 100 mg/L.
Figure 2-19 indicates $64 million of benefits if most local groundwater (about 90 percent) andwastewater (about 80 percent) were to experience a 100 mg/L decrease in salinity. (Good qualitygroundwater, less than 250 mg/L, and low urban salt additions to wastewater, less than 250mg/L, were excluded from this analysis.)

USBR/MWD SALINITY MANAGEMENT STUDYFINAL REPORT
BOOKMAN-EDMONSTON Section 2E N G I N E E R I N G , I N C .E N G I N E E R I N G , I N C .E N G I N E E R I N G , I N C .E N G I N E E R I N G , I N C . 2-20 Salinity Problems, Impacts, & Technology
Figure 2-18
Figure 2-19
Annual Benefits of 100 mg/L Salinity Decrease inGroundwater and Wastewater ($64 Million)
Commercial$7 Million
Industrial$3 Million
Agricultural$4 Million
Utilities$6 Million
Groundwater$14 Million
Residential$21 Million
Recycled Water$9 Million
Annual Benefits of 100 mg/L Salinity Decrease inImported Water Supplies ($95 Million)
Commercial$10 MillionIndustrial
$5 Million
Agricultural$14 Million
Utilities$8 Million
Groundwater$18 Million
Residential$35 Million
Recycled Water$5 Million
USBR/MWD SALINITY MANAGEMENT STUDYFINAL REPORT
BOOKMAN-EDMONSTON Section 2E N G I N E E R I N G , I N C .E N G I N E E R I N G , I N C .E N G I N E E R I N G , I N C .E N G I N E E R I N G , I N C . 2-21 Salinity Problems, Impacts, & Technology
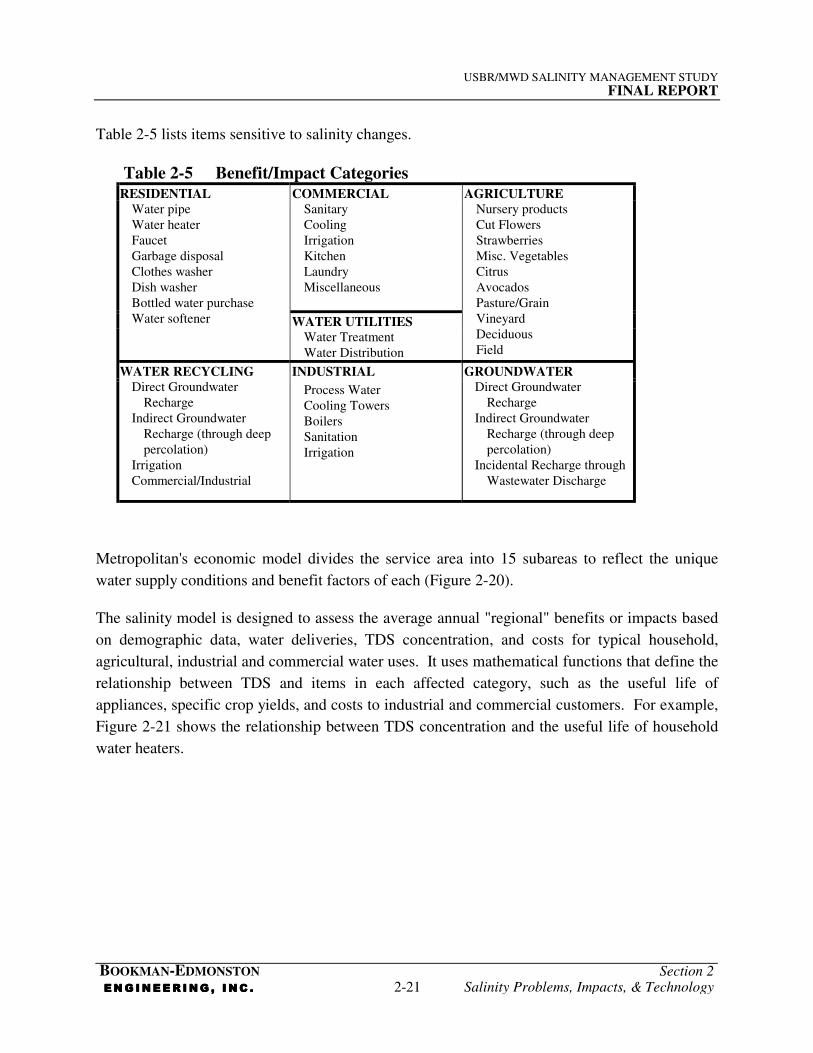
Table 2-5 lists items sensitive to salinity changes.
Table 2-5 Benefit/Impact CategoriesRESIDENTIAL COMMERCIAL AGRICULTURE
SanitaryCoolingIrrigationKitchenLaundryMiscellaneous
WATER UTILITIES
Water pipeWater heaterFaucetGarbage disposalClothes washerDish washerBottled water purchaseWater softener
Water TreatmentWater Distribution
Nursery productsCut FlowersStrawberriesMisc. VegetablesCitrusAvocadosPasture/GrainVineyardDeciduousField
INDUSTRIALWATER RECYCLINGDirect Groundwater
RechargeIndirect Groundwater
Recharge (through deeppercolation)
IrrigationCommercial/Industrial
Process WaterCooling TowersBoilersSanitationIrrigation
GROUNDWATERDirect Groundwater
RechargeIndirect Groundwater
Recharge (through deeppercolation)
Incidental Recharge throughWastewater Discharge
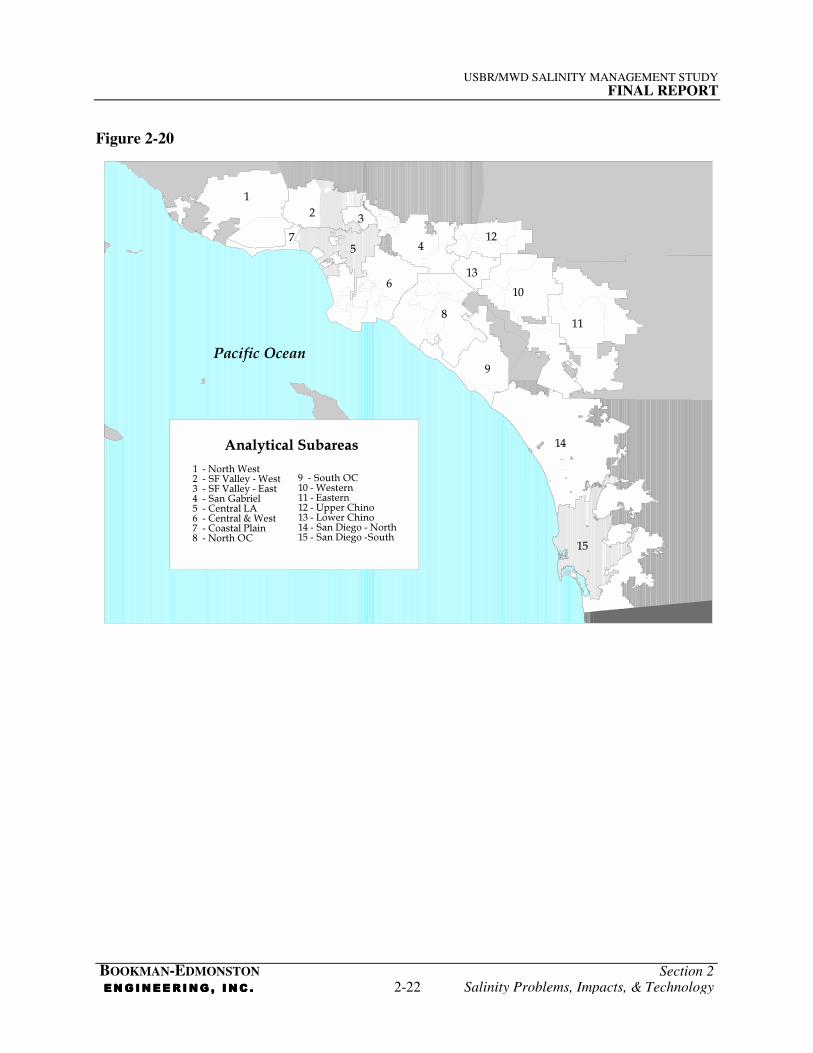
Metropolitan's economic model divides the service area into 15 subareas to reflect the uniquewater supply conditions and benefit factors of each (Figure 2-20).
The salinity model is designed to assess the average annual "regional" benefits or impacts basedon demographic data, water deliveries, TDS concentration, and costs for typical household,agricultural, industrial and commercial water uses. It uses mathematical functions that define therelationship between TDS and items in each affected category, such as the useful life ofappliances, specific crop yields, and costs to industrial and commercial customers. For example,Figure 2-21 shows the relationship between TDS concentration and the useful life of householdwater heaters.
USBR/MWD SALINITY MANAGEMENT STUDYFINAL REPORT
BOOKMAN-EDMONSTON Section 2E N G I N E E R I N G , I N C .E N G I N E E R I N G , I N C .E N G I N E E R I N G , I N C .E N G I N E E R I N G , I N C . 2-22 Salinity Problems, Impacts, & Technology
Figure 2-20
3
10
8
13
11
15
14
9
6
1245
7
12
9 - South OC10 - Western11 - Eastern12 - Upper Chino13 - Lower Chino14 - San Diego - North15 - San Diego -South
1 - North West2 - SF Valley - West3 - SF Valley - East4 - San Gabriel5 - Central LA6 - Central & West7 - Coastal Plain8 - North OC
Analytical Subareas
Pacific Ocean

USBR/MWD SALINITY MANAGEMENT STUDYFINAL REPORT
BOOKMAN-EDMONSTON Section 2E N G I N E E R I N G , I N C .E N G I N E E R I N G , I N C .E N G I N E E R I N G , I N C .E N G I N E E R I N G , I N C . 2-23 Salinity Problems, Impacts, & Technology
Figure 2-21
The economic model calculates the "incremental" benefits or impacts of SWP and CRA salinitychanges compared to a selected baseline condition. The economic impact functions used (suchas the effect of TDS on water heaters, strawberries, or cooling towers, etc.) were developed basedon several approaches including technical studies, consumer surveys, interviews of contractorsand experts, and engineering judgment. All of the cost factors employed (such as the price ofwater heaters, water rates, or reverse osmosis costs, etc.) were obtained from retail stores,warehouses, available reports and publications, engineering cost estimates, and Local ResourcesProgram files.
BENEFITS AND IMPACTS OF THE SWP AND CRA
Figure 2-22 depicts the range of "incremental" economic consequences of SWP salinity changeswhen CRA salinity is fixed at 700 mg/L. While there may be economic benefits when the SWPsalinity is below 100 mg/L, this graph shows the "incremental" impacts of SWP salinitycompared to 100 mg/L. (Historically, the average annual salinity of SWP has never been below100 mg/L.)
Useful Life of Household Water Heaters
0
2
4
6
8
10
12
1410
0
200
300
400
500
600
700
800
900
1000
1100
1200
TDS (mg/L)
Use
ful L
ife
(Yea
rs)

USBR/MWD SALINITY MANAGEMENT STUDYFINAL REPORT
BOOKMAN-EDMONSTON Section 2E N G I N E E R I N G , I N C .E N G I N E E R I N G , I N C .E N G I N E E R I N G , I N C .E N G I N E E R I N G , I N C . 2-24 Salinity Problems, Impacts, & Technology
Figure 2-22
Likewise, Figure 2-23 shows the range of economic consequences of CRA salinity changes whenthe SWP salinity is fixed at 250 mg/L at the O'Neill Forebay. While, there may be economicbenefits when CRA salinity is below 500 mg/L, this graph shows the "incremental" impacts ofCRA salinity compared to 500 mg/L. Historically, the average annual salinity of CRA has neverbeen below 500 mg/L.
Technical Appendix 5 provides additional information on the derivation of salinity economicfunctions. Technical Appendix 6 specifically addresses the high-profile issue of the impacts ofwater softeners.
Incremental Impacts of SWP Salinity *
0
50
100
150
100 200 300 400 500
Salinity (mg/L)
An
nu
al Im
pac
ts($
Mill
ion
)
* Based on CRA salinity at 700 mg/L and baseline deliveries for normal 1998 conditions.

USBR/MWD SALINITY MANAGEMENT STUDYFINAL REPORT
BOOKMAN-EDMONSTON Section 2E N G I N E E R I N G , I N C .E N G I N E E R I N G , I N C .E N G I N E E R I N G , I N C .E N G I N E E R I N G , I N C . 2-25 Salinity Problems, Impacts, & Technology
Figure 2-23
TECHNOLOGY
DESALINATION TECHNOLOGY
Desalination is the ultimate tool to reduce salt accumulation when other methods fail.Desalination can create new potable water supplies from brackish water, thus restoringpreviously abandoned sources. In addition, membrane desalination technology has the capacity toremove organic carbon, viruses, cryptosporidium and other contaminants of health concern.There are more and more full-scale projects that successfully demonstrate the technicalcapabilities of brackish water desalination. Desalination is a proven technology that has longbeen used in the production of high-purity industrial water and domestic bottled water.
When desalination is necessary, the main technological options available include:
" Reverse Osmosis (RO)
" Nanofiltration
" Electrodialysis Reversal (EDR)
" Distillation
Incremental Impacts of CRA Salinity *
0
100
200
300
500 600 700 800 900
Salinity (mg/L)
An
nu
al Im
pac
ts($
Mill
ion
)
* Based on CRA salinity at 250 mg/L at O’Neill Forebay and baseline deliveries for normal 1998 conditions.

USBR/MWD SALINITY MANAGEMENT STUDYFINAL REPORT
BOOKMAN-EDMONSTON Section 2E N G I N E E R I N G , I N C .E N G I N E E R I N G , I N C .E N G I N E E R I N G , I N C .E N G I N E E R I N G , I N C . 2-26 Salinity Problems, Impacts, & Technology
To treat different types of water (reclaimed, brackish, seawater, potable, and industrial), thedesalination technologies most applicable to each are shown in Table 2-6.
Table 2-6 Major Desalination Treatment OptionsSupply RO Nanofiltration EDR Distillation
Reclaimed Water X XBrackish Ground Water X XSeawater X XPotable Water X XIndustrial Supply Water X X
Desalination usually separates the source water into two components:
1. Low-salinity production water to be used by the intended customer, and
2. A high-salinity waste brine that must be disposed of.
Brine, which may constitute up to 25 percent of the treated source water volume, is usuallydisposed of through non-reclaimable brine lines that discharge to the ocean. In some locations,brine is evaporated or injected deep into geologic zones of non-potable water. Inland projectsusually require lengthy brine lines and thus cost more than projects conveniently located near thecoast or existing ocean outfalls.
DESALINATION COSTS
The use of desalination in the past has been limited by cost and environmental constraints onbrine disposal. For those reasons, water supply and sanitation agencies have tended to considerdesalination as an action of last resort. However, technological advances and the need to bettermanage groundwater basins are making desalination of brackish groundwater and recycled watermore common.
In this study, the cost of desalination was considered as an economic impact to water recyclingand groundwater use when salinity exceeds certain thresholds for each subarea in the region. Those thresholds were 900 mg/L for recycled water; for groundwater basins, the threshold wasset by the Regional Water Quality Control Boards. Higher desalination costs were assigned toinland areas because of the extra facilities needed for brine disposal. Existing and proposedprojects were reviewed to establish reasonable costs for local water desalination as presented inTable 2-7.

USBR/MWD SALINITY MANAGEMENT STUDYFINAL REPORT
BOOKMAN-EDMONSTON Section 2E N G I N E E R I N G , I N C .E N G I N E E R I N G , I N C .E N G I N E E R I N G , I N C .E N G I N E E R I N G , I N C . 2-27 Salinity Problems, Impacts, & Technology
Table 2-7 Cost of Local Water Desalination in SouthernCalifornia (in dollars per ton of salt removed)
Location Brackish Groundwater Recycled Water
Coastal Areas $280/ton $557/ton
Inland Areas $490/ton $777/ton

USBR/MWD SALINITY MANAGEMENT STUDYFINAL REPORT
BOOKMAN-EDMONSTONE N G I N E E R I N G , I N C .E N G I N E E R I N G , I N C .E N G I N E E R I N G , I N C .E N G I N E E R I N G , I N C . 3-1
SECTION 3EVALUATION OF POTENTIAL REGIONAL
SALINITY MANAGEMENT STRATEGIES
BACKGROUND
Within the coastal plain of Southern California, approximately one half of the salt input comesfrom imported water and the remainder comes from local sources. Therefore, a comprehensiveapproach to salinity management should focus on both imported and local sources of salinity.Figures 2-18 and 2-19 indicate sizeable benefits from reducing both sources.
Numerous potential salinity management actions were formulated and screened duringdiscussions by Metropolitan staff, member agencies, other concerned agencies and pertinentorganizations. The Metropolitan Board workshop, held on July 25, 1997, also helped identifykey parameters that should be used to assess the potential strategies.
Three distinct time periods related to Metropolitan’s Capital Improvement Program schedule,were identified to guide the staging of potential actions:
1998-1999 This near term period is consistent with the current level of facility development.
2000-2004During this period, the initial filling of the Eastside Reservoir will occur, and Stage IIRegulations under the Safe Drinking Water Act will be promulgated
2005-2015
During this period Metropolitan will likely upgrade the disinfection process at itsblended water filtration plants, the Inland Feeder will become operational, clarity willbe reached on the amounts of water to be exchanged or wheeled through theColorado River Aqueduct, and benefits of a CALFED program may be realized.
Based on the uncertainty of key conditions affecting salinity beyond 2004, the analyses presentedin this report focus on the 1998 to 2004 period. Subsequent studies will be needed in the futureto address the period 2005 and beyond, and they will depend on some stability of the controllingconditions.
Given the long-term recognition of a need for salinity management, Metropolitan and otheragencies need to cooperate in a cohesive regional strategy. Clearly, Metropolitan alone cannotsolve the region’s salinity problems.
Possible salinity management strategies fall into four fundamental categories briefly described as:

USBR/MWD SALINITY MANAGEMENT STUDYFINAL REPORT
BOOKMAN-EDMONSTON Section 3E N G I N E E R I N G , I N C .E N G I N E E R I N G , I N C .E N G I N E E R I N G , I N C .E N G I N E E R I N G , I N C . 3-2 Evaluation of Potential Regional
Salinity Management Strategies
! Imported Water Source Control" Colorado River
" SWP and CALFED Bay-Delta Program
! Metropolitan Distribution System Management" Blend imported water
" CRA desalting
" Integration of Quality and Quantity
! Metropolitan and Other Agency Collaboration" Expand Desert and Coachella water exchange
" Demineralization
! Local Efforts to Protect Groundwater and Recycled Supplies" Groundwater basin management, which considers use of good quality water for
groundwater recharge.
" Wastewater management.
" Reduction of salt usage, which includes reduction in the use of water softeners andindustrial salts where regeneration brines enter wastewater collection systemsdestined for water reclamation plants (rather than ocean discharge).
" Brine lines, which are specially, dedicated pipelines used to carry highly saline waterfor ocean disposal.
For analytical purposes, the CRA was considered full for the study period, consistent with theobjectives of the California 4.4 Plan.
IMPORTED WATER SOURCE CONTROL
ACCELERATE COLORADO RIVER BASIN SALINITY CONTROL ACTIVITIES
The Colorado River Salinity Control Program is based on offsetting salinity impacts of upstreamdevelopment (primarily agriculture) to maintain salinity at or below criteria levels of 723milligrams per liter (mg/L) below Hoover Dam, 747 mg/L below Parker Dam and 879 mg/L atImperial Dam, with average flow conditions (Figure 2-8).

USBR/MWD SALINITY MANAGEMENT STUDYFINAL REPORT
BOOKMAN-EDMONSTON Section 3E N G I N E E R I N G , I N C .E N G I N E E R I N G , I N C .E N G I N E E R I N G , I N C .E N G I N E E R I N G , I N C . 3-3 Evaluation of Potential Regional
Salinity Management Strategies
Figure 3-1
Historical Federal Funding19
88
1989
1990
1991
1992
1993
1994
1995
1996
1997
1998
1999
$0.0
$10.0
$20.0
$30.0
$40.0
$50.0
$60.0
$ M
illio
ns
1988
1989
1990
1991
1992
1993
1994
1995
1996
1997
1998
1999
Fiscal Year
Appropriations for Colorado RiverSalinity Control Program: 1988-1999

USBR/MWD SALINITY MANAGEMENT STUDYFINAL REPORT
BOOKMAN-EDMONSTON Section 3E N G I N E E R I N G , I N C .E N G I N E E R I N G , I N C .E N G I N E E R I N G , I N C .E N G I N E E R I N G , I N C . 3-4 Evaluation of Potential Regional
Salinity Management Strategies
Metropolitan and other CRW users would benefit from a lower salinity objective at Parker Dam.However, significant cost increases would result as indicated in Table 3-1.
Table 3–1Numeric Criterion below
Parker DamAnnual Cost
747 mg/L $25 million
700 mg/L $85 million
650 mg/L $150 million
To reduce the numeric criterion will require consensus among and financial commitments by theseven basin states and three federal agencies now engaged in the Salinity Control Program.
Given the existing standards, additional near-term reductions in salinity could be achieved ifsalinity control measures are accelerated and the corresponding state share (about 30 percent) isprovided. However, annual Federal funding, which supports about 70 percent of the programactivities, has declined from about $50 million in 1992 to $17 million in 1999 (Figure 3-1).
SWP OPERATIONAL CHANGE
DWR could develop the capability to forecast salinity levels for the SWP, which would enableDWR and SWP water users to make better operational decisions regarding salinity. Theseforecasts would provide critical information for Metropolitan’s blending and other salinitymanagement operational decisions. In addition, DWR could also develop the ability toquantitatively assess the salinity impacts of various actions and projects that could affect SWPsalinity levels in the future.
Metropolitan would benefit if DWR placed greater emphasis on salinity outcomes in its SWPoperating decisions. For example, preliminary studies estimate that a 10 to 30 mg/L reduction inSWP salinity levels could be achieved by selective shifting of Central Valley Project (CVP)pumping at the Tracy Pumping Plant to the Banks Pumping Plant to minimize commingling ofCVP water at O’Neill Forebay or San Luis Reservoir. This nonstructural action wouldpotentially reduce the influence of higher salinity CVP water, but may be constrained by orconflict with fish-take, contractual, operational, and water rights issues. It will be important,however, to encourage and promote DWR activity of this nature, when feasible.

USBR/MWD SALINITY MANAGEMENT STUDYFINAL REPORT
BOOKMAN-EDMONSTON Section 3E N G I N E E R I N G , I N C .E N G I N E E R I N G , I N C .E N G I N E E R I N G , I N C .E N G I N E E R I N G , I N C . 3-5 Evaluation of Potential Regional
Salinity Management Strategies
CALFED BAY-DELTA PROGRAM
By providing policy direction and oversight for the CALFED Bay-Delta Program, the CALFEDprocess has the potential to reduce salinity levels in SWP water significantly. It can do this byimproving conveyance capacity to deliver low salinity water from the Sacramento River to theBanks Pumping Plant. Depending on their final decision regarding the conveyance features andoperating criteria, the potential exists to reduce average SWP salinity by 100 mg/L. Figure 3-2shows estimated ranges of monthly averaged TDS values under various alternatives beingconsidered in the recently issued programmatic environmental document.
Figure 3-2
THE CALFED ALTERNATIVES
No Action: 1995 Water Quality Control Board Accord
Alternative 1: Existing Conditions with StorageSome modifications for water conveyance in the vicinity of existing export pumps. Channelsremain largely the same. The main effect is little change.
Alternative 2: Through Delta System with StorageWidens channels and may flood islands. This alternative slows down and freshens Deltawater flows and improves fish habitat. Levees are set back to create shallow habitat for fish.
Salinity of CALFED AlternativesSWP at O’Neill Forebay
(Year 2020)
100 200 300 400 500
No Action
Alternative 1
Alternative 2
Alternative 3
Ranges of TDS Values (mg/L)

USBR/MWD SALINITY MANAGEMENT STUDYFINAL REPORT
BOOKMAN-EDMONSTON Section 3E N G I N E E R I N G , I N C .E N G I N E E R I N G , I N C .E N G I N E E R I N G , I N C .E N G I N E E R I N G , I N C . 3-6 Evaluation of Potential Regional
Salinity Management Strategies
The main effect is the improvement of Delta water quality and fish habitat.
Alternative 3: Dual Plumbing Facility System with StorageAllows export pumps to take water either from a conveyance structure, which bypasses theDelta, or directly from Clifton Court Forebay. The main effect is the improvement of supplyreliability, quality and safety of water being exported south. It minimizes fish loss at pumps.
METROPOLITAN DISTRIBUTION SYSTEM MANAGEMENT
ANALYSIS OF BLENDING OPTIONS
From 1995 to 1997, Metropolitan provided a blend of 25 percent SWP water during Aprilthrough September to mitigate the high salinity of its Colorado River water. This blendingoperation helped support local resource management and reduced consumer impacts. TechnicalAppendix 4 provides more detailed information on Metropolitan's importation and distributionsystem as it relates to salinity management. Technical Appendix 11 specifically addresses thetechnical details of blending operations in Metropolitan's system.
Blending occurs using only two sources of imported water:
1. SWP water from the East Branch near San Bernardino, and
2. CRA water
The blend may be achieved at three filtration plant locations that collectively provide about80 percent of Metropolitan’s delivered water:
# Weymouth Plant
# Diemer Plant
# Skinner Plant and adjacent untreated lines
The remaining 20 percent of delivered water is unblended SWP water. The system cannotdeliver Colorado River supplies directly to some areas because the Jensen Plant on the WestBranch and the Mills Plants and Rialto Feeder on the East Branch receive only SWP supplies. Figure 3-3 identifies the area that received blended water.

USBR/MWD SALINITY MANAGEMENT STUDYFINAL REPORT
BOOKMAN-EDMONSTON Section 3E N G I N E E R I N G , I N C .E N G I N E E R I N G , I N C .E N G I N E E R I N G , I N C .E N G I N E E R I N G , I N C . 3-7 Evaluation of Potential Regional
Salinity Management Strategies
Figure 3-3
1998 INTERIM BLENDING POLICY
In March of 1998, Metropolitan’s Board of Directors adopted an interim one-year blending planthat targets the April through September TDS concentration at 500 to 550 mg/L, contingentupon:
Blending in MWD’s System
WestBranch
StateProject
EastBranch
CRA
Desert-Coachella
Blending PlantsBlended
Area
Plan/Res. Div. 7/9/98
Weymouth
Diemer
Skinner

USBR/MWD SALINITY MANAGEMENT STUDYFINAL REPORT
BOOKMAN-EDMONSTON Section 3E N G I N E E R I N G , I N C .E N G I N E E R I N G , I N C .E N G I N E E R I N G , I N C .E N G I N E E R I N G , I N C . 3-8 Evaluation of Potential Regional
Salinity Management Strategies
1. Maintaining blending costs within $10 million before returning to the Board foradditional authorization,
2. There being sufficient SWP water available for blending, and
3. Compliance with all primary water quality standards.
Additional short-term factors that occasionally limit the ability to meet the TDS target includeflow adjustments to deal with episodes of turbidity and algae blooms, sudden demand changes,and unexpected changes in SWP salinity. SWP salinity has changed as much as 200 mg/L withinone year. The 1998 plan provides a good framework for a long-term salinity management policy:the pursuit of common numeric TDS targets for the three plants over a specified period,contingent upon budget, availability of SWP water and compliance with all water qualitystandards.
The three plants, Weymouth, Skinner and Diemer can be managed to provide consistent salinitywithin distribution system constraints. The plot of historical salinity concentrations in Figure 3-4shows consistent effluent salinity levels.
Figure 3-4
Weighted Average TDS in Filtration Plants Treating Colorado River Water
514
506
513 .
476 .
467
527
482
475
489
478
456
489
622
607
594
566
528
489
490
489
440
449 .
452 .
436 .
497
501
463
507
505
475
497 .
511 .
496 .
555 .
548 .
530 .
620
620
629
619
609
634
642
624
669
662
647
647
616
612
596
609
598
578
564
557
535
551
543
538
All averages are flow weighted.
489
456
478
FINAL POLICY AND ACTION PLAN
In April of 1999, Metropolitan's Board of Directors adopted a Salinity Management Policy, andauthorized its General Manager to carry out the policy by implementing a Salinity ManagementAction Plan (Section 4).

USBR/MWD SALINITY MANAGEMENT STUDYFINAL REPORT
BOOKMAN-EDMONSTON Section 3E N G I N E E R I N G , I N C .E N G I N E E R I N G , I N C .E N G I N E E R I N G , I N C .E N G I N E E R I N G , I N C . 3-9 Evaluation of Potential Regional
Salinity Management Strategies
A key element of the Policy and Action Plan is the pursuit of a 500 mg/L objective on a year-round basis, predicated on several factors including sufficient quantities of SWP water andadequate low salinity content. The 500 mg/L objective is expected to be achieved in two stages.When conditions are favorable, 500 mg/L would be pursued year-round. In less favorableconditions, emphasis is placed on reducing salinity during April through September (Figure 3-5)primarily to support irrigation with recycled water. The Policy and Action Plan are presented inSections 4 and 5, respectively.
Figure 3-5
As demand increases in future years, Metropolitan will have to use more SWP water. Thispractice inherently lowers system TDS levels as SWP water mixes with the full flow of the CRA.However, TDS is expected to increase in Lake Havasu and the CRA at the same time in responseto additional agricultural and urban development upstream in the Colorado River Basin. Evenwith the benefit of the Colorado River Salinity Control Program, average TDS in the CRA isforecasted to approach the established criterion of 747 mg/L by about 2015. Given these twoopposing phenomena, average annual TDS in Metropolitan’s system is expected to increasethrough 2008 and then decline as illustrated in Figure 3-6. This illustration represents "baseline"
Blend ObjectiveUnblended �Supply

USBR/MWD SALINITY MANAGEMENT STUDYFINAL REPORT
BOOKMAN-EDMONSTON Section 3E N G I N E E R I N G , I N C .E N G I N E E R I N G , I N C .E N G I N E E R I N G , I N C .E N G I N E E R I N G , I N C . 3-10 Evaluation of Potential Regional
Salinity Management Strategies
conditions in which SWP water use is limited to just that amount needed to meet demands, andadditional SWP water is not imported specifically for the purpose of blending.
Figure 3-6
VARIABILITY IN IMPORTED WATER QUALITY
Salinity concentrations in SWP and CRA water vary primarily as a result of hydrologicconditions. During droughts, the salinity concentrations increase significantly. The amount ofSWP water needed to blend down CRA water also changes significantly as illustrated in thefollowing three graphs (Figure 3-7).
Although the curves in these graphs show some supply conditions that would require a highpercentage of SWP water, hydraulic constraints in Metropolitan’s system limit practical blendingfrom 45 to 50 percent SWP water during summer peak demand periods.
Average Projected TDS in Blended Area
0
100
200
300
400
500
600
700
800
1997 2005 2015
CRA
SWP-East Branch
Baseline*(January-December)
Baseline* (April-September)
* Applies to Weymouth, Skinner and Diemer Plants

USBR/MWD SALINITY MANAGEMENT STUDYFINAL REPORT
BOOKMAN-EDMONSTON Section 3E N G I N E E R I N G , I N C .E N G I N E E R I N G , I N C .E N G I N E E R I N G , I N C .E N G I N E E R I N G , I N C . 3-11 Evaluation of Potential Regional
Salinity Management Strategies
Figure 3-7
Projected Range of Blend Requirements
Colorado River TDS in mg/L
0
20
40
60
80East Branch SWP at 200 mg/L
450 mg/L Target
500 mg/L Target
550 mg/L Target
600 mg/L Target
0
20
40
60
80East Branch SWP at 300 mg/L 450 mg/L Target
500 mg/L Target
550 mg/L Target
600 mg/L Target
0
20
40
60
80
100
600 650 700 750 800
East Branch SWP at 400 mg/L 450 mg/L Target
500 mg/L Target
550 mg/L Target
600 mg/L Target

USBR/MWD SALINITY MANAGEMENT STUDYFINAL REPORT
BOOKMAN-EDMONSTON Section 3E N G I N E E R I N G , I N C .E N G I N E E R I N G , I N C .E N G I N E E R I N G , I N C .E N G I N E E R I N G , I N C . 3-12 Evaluation of Potential Regional
Salinity Management Strategies
BLENDING COSTS
Metropolitan incurs blending costs when it takes extra SWP water from the East Branch to lowersalinity, instead of taking maximum supplies from the CRA. Metropolitan’s lowest cost water isfrom the CRA. The second lowest cost water is from the West Branch of the SWP at CastaicLake. The most expensive water is delivered through the East Branch of the SWP, which is alsothe source needed for blending. The East Branch costs are higher because more energy is neededfor higher pump lifts to the delivery point in Metropolitan’s distribution system, and because theSWP energy contracts are more costly than those for the CRA. Table 3-2 lists projected energycosts. These projections are based on current forecasts and an average 3 percent inflation peryear. The future values may change due to the expiration of some major SWP power contracts inthe year 2004, changes in power prices with electric restructuring, and/or changes in water supplyconditions.
Table 3–2 Energy CostsWater Source Estimated Marginal Energy Costs
1998 ($/AF) 2000 ($/AF) 2005 ($/AF)CRA 37 39 46
West Branch of SWP 57 60 70
East Branch of SWP 71 75 87
The cost of shifting water deliveries to the East Branch of the SWP from either the West Branchor the CRA is the difference in marginal costs. Metropolitan’s expenses for power have changedsignificantly over the last few years in response to new contracts and market forces. Futurechanges in the power market are uncertain and likely to be volatile.
Under projected year 2000 supply and member agency demand conditions, up to about a10 percent blend can be achieved by shifting water from the West Branch to the East Branch at adifferential cost of $15/AF ($75 - $60). Further blending is achieved by reducing the amount ofCRA water and replacing it with additional East Branch water at a differential cost of $36/AF($75 - $39). An additional cost of about $5/AF is incurred at filtration plants for the extrachemical usage and the sludge removal associated with treating SWP rather than CRA water. The costs and resource impacts to achieve a 500 mg/L salinity target in the year 2000 areillustrated in Figures 3-8 and 3-9.
RESOURCE IMPACT
Figure 3-9 illustrates the relative amounts of CRA deliveries to be curtailed over 6-, 9- and12-month blending periods. The significant increase in CRA layoff for year-round blending

USBR/MWD SALINITY MANAGEMENT STUDYFINAL REPORT
BOOKMAN-EDMONSTON Section 3E N G I N E E R I N G , I N C .E N G I N E E R I N G , I N C .E N G I N E E R I N G , I N C .E N G I N E E R I N G , I N C . 3-13 Evaluation of Potential Regional
Salinity Management Strategies
compared to 6-month blending occurs because Metropolitan would otherwise deliver nearly 100percent CRA water to the blended area in the winter months when demands are low. Conversely,some SWP water is always needed in the blended area to meet the higher summer demandsduring the 6-month April through September blending period. Figure 3-9 raises two significantresource questions:
1. Is there sufficient SWP water to quantitatively make up for the CRA layoff?
2. Is the CRA layoff compatible with efforts to establish a 4.4 million acre-foot per yearCalifornia plan for the Colorado River?
In developing its Colorado River strategy, Metropolitan is considering diverting some of its CRAwater to groundwater storage facilities. Metropolitan is also considering expanded exchangeswith the Coachella Valley Water District and the Desert Water Agency. Such storage orexchange operations could recover beneficial use of the CRA water that Metropolitan wouldotherwise not pump from the Colorado River in order to meet its salinity targets. However, theamount of CRA water that may be placed into storage or exchanged will have limits, dependingupon how these opportunities materialize.
The ability of the SWP to supply water needed for blending is uncertain during the first fewmonths of the year. This ability also varies from year to year in response to hydrologicconditions. Analyses show that on average, a Metropolitan salinity target can be met in about 7of every 10 years; in the other years SWP supply will be insufficient.
Figure 3-9 also shows that Metropolitan’s need for SWP water to meet a salinity target (such as500 mg/L) diminishes when SWP water is of good (low TDS) quality. Success in the CALFEDprocess or Sierra exchanges in reducing the salinity of SWP water on a sustained basis is criticalto the long-term blending practice.
Figure 3-10 illustrates the regional economic benefits of 6-month, 9-month, or year-roundblending. Progress in potential CALFED, Sierra exchanges and CRA storage and exchangearrangements could greatly reduce the resource constraints to a year-round blend policy toachieve 500 mg/L compared to the baseline salinity conditions.

USBR/MWD SALINITY MANAGEMENT STUDYFINAL REPORT
BOOKMAN-EDMONSTON Section 3E N G I N E E R I N G , I N C .E N G I N E E R I N G , I N C .E N G I N E E R I N G , I N C .E N G I N E E R I N G , I N C . 3-14 Evaluation of Potential Regional
Salinity Management Strategies
Figure 3-8
Figure 3-9
Cost of Blending
������������������������������������������������������������������������
������������������������������������������������������������������������������������������������������
������������������������������������������������������������������������������������������������������������
������������������������������������������������������������������������
������������������������������������������������������������������������������������������������������
������������������������������������������������������������������������������������������������������������
T a rg e t: 500 m g /L (Y ear 20 00 )
C R AT D S : 689 m g /L
0
5
10
15
20
6 -m o n th 9 -m o n th 1 2 -m o n th
B le n d in g P e r io d s
$M
illi
on
���������� S W P : 3 0 0 m g /L���������� S W P : 2 5 0 m g /L
S W P : 2 0 0 m g /L
S W P : 1 5 0 m g /L
Colorado River Layoff/Increased SWP Water
��������������������������������������������������������������������������������
����������������������������������������������������������������������������������
������������������������������������������������������������������������������������������������������������������������������
��������������������������������������������������������������������������������
���������������������������������������������������������������������������������������������������������������������������
������������������������������������������������������������������������������������������������������������������������������
T arget: 500 m g/L (Year 2000)
C RAT D S: 689 m g/L
0
100
200
300
400
500
600
6-month 9-month 12-month
Blending Period
Th
ou
sa
nd
AF
������������ SW P : 30 0 m g/L������������ SW P : 25 0 m g/L
SW P : 20 0 m g/L
SW P : 15 0 m g/L

USBR/MWD SALINITY MANAGEMENT STUDYFINAL REPORT
BOOKMAN-EDMONSTON Section 3E N G I N E E R I N G , I N C .E N G I N E E R I N G , I N C .E N G I N E E R I N G , I N C .E N G I N E E R I N G , I N C . 3-15 Evaluation of Potential Regional
Salinity Management Strategies
Figure 3-10
EASTSIDE RESERVOIR STORAGE AND CYCLING OF SWP SUPPLIES
Metropolitan could draw down its reservoirs every summer and refill them in the winter whenthere is generally a surplus flow of low salinity water in the Delta. Likewise, groundwatermanagers could do the same with their groundwater storage. The ability to cycle stored supplieswill greatly increase when the Eastside Reservoir and the Inland Feeder are complete. However,there are risks associated with cycling, including a potential inability to refill the drafted storagebecause of drought conditions, Delta fish-take constraints, or other operational limitations.
Lake Perris water will be needed at times to achieve summer salinity targets at the Skinnerfiltration plant. Since the reservoir surface is subject to nearly six feet of evaporation annually,salinity tends to build up in Lake Perris when water is not exchanged by cycling (Figure 3-11). In February 1998 for example, salinity levels in Lake Perris were about 330 mg/L while the EastBranch of the SWP was providing 200 mg/L water. Achieving low salinity levels in Lake Perrisis constrained by:
1. Inability to cycle storage without conflicting with the desire for stable surface elevationson the part of recreational and fishery interests, and
Benefits are for reduction in salinity of blended area compared to baseline condition
Benefits of Achieving a 500 mg/L Target
0
20
40
60
80
100
6-month 9-month 12-month
Blending Period (Year 2000)

USBR/MWD SALINITY MANAGEMENT STUDYFINAL REPORT
BOOKMAN-EDMONSTON Section 3E N G I N E E R I N G , I N C .E N G I N E E R I N G , I N C .E N G I N E E R I N G , I N C .E N G I N E E R I N G , I N C . 3-16 Evaluation of Potential Regional
Salinity Management Strategies
2. Inability to redirect nearby Santa Ana Valley Pipeline flows through the reservoir,because to do so would bypass the Perris Power Plant and thus lose revenue from powergeneration.
To deal with these problems, a Metropolitan task force is working with concerned recreationaland fishery interests on reservoir cycling operations at Perris. Metropolitan has also implementedsome limited flow-through operations (power plant bypass) to flush salts from the reservoir. Since the Perris Power Plant provides about $1 million in annual revenue, additional assessmentsof the costs and benefits of bypassing the power plant are being incorporated into the discussions.
Figure 3-11
COLORADO RIVER WATER AND AGRICULTURAL DRAINAGE DESALTING
Three options to reduce CRA salinity levels through desalination have been evaluated at theconceptual level. Two of the options desalt aqueduct water; the other option desalts agriculturaldrainage water from the Imperial Valley or Coachella Valley and places the product water intothe CRA to dilute salinity concentrations.
Salinity at Lake Perris
200
300
400
500
19
88
19
89
19
90
19
91
19
92
19
93
19
94
19
95
19
96
19
97
19
98
TD
S (
mg
/L)

USBR/MWD SALINITY MANAGEMENT STUDYFINAL REPORT
BOOKMAN-EDMONSTON Section 3E N G I N E E R I N G , I N C .E N G I N E E R I N G , I N C .E N G I N E E R I N G , I N C .E N G I N E E R I N G , I N C . 3-17 Evaluation of Potential Regional
Salinity Management Strategies
The primary benefit of reducing the salinity of CRA water is that it would reduce dependence onSWP water for salinity management.
In addition, Metropolitan’s total supply of water flowing through the CRA would increase as aresult of desalting irrigation drainage water from the Coachella and Imperial valleys. However,the desalted irrigation drain water would also incur pumping and transportation costs to reach theCRA.
The disadvantage of desalting Colorado River supplies is that a portion of the supply is lost(120,000 acre-feet per year to meet a 500-mg/L target to 240,000 acre-feet per year to meet a200-mg/L target). This lost supply would be the result of rejection of the brine, which amountsto about 20 percent of the flow through the reverse osmosis membranes. Disposal of this brine isa relatively expensive and raises unresolved environmental issues. Technical Appendix 12provides additional information on the CRA desalination option and costs. The brine disposalissue is the same for CRA desalting and irrigation water desalting.
In all of the options considered for this analysis, we made the following assumptions: the salinitylevel for CRA water pumped from Lake Havasu is considered to be 750 mg/L; membranetreatment technology is used; and design and construction would take eight years, with fulloperations starting in 2006. Table 3-3 summarizes the pertinent information regarding theseoptions. Note that the rate impacts in Table 3-3 reflect project costs and water supply changebenefits or costs.
Table 3–3 Potential Desalting Projects
Colorado River Aqueduct (CRA)Colorado River Water/Agricultural Drainage
Water 1
Target TDS in CRA 200 mg/L 500 mg/L 500 mg/LSource Water TDS 750 mg/L 750 mg/L 2,400 mg/LCapital Cost (1997) $2.7 billion $2.4 billion $1.1 billionAnnual Debt Service $264 million $227 million $131 millionRate Impact $186/AF $155/AF $78/AFBrine Disposal 0.24 MAF/Y 0.12 MAF/Y 0.11 MAF/YMWD Supply Changes loses 0.24 MAF/Y loses 0.12 MAF/Y gains 0.35 MAF/Y
1 Costs excludes Salton Sea mitigation.2 MAF/Y – million acre-feet per year.
Metropolitan recently started planning a demonstration project with the Coachella Valley WaterDistrict to assess the practicality of capturing and desalting agricultural drainage.

USBR/MWD SALINITY MANAGEMENT STUDYFINAL REPORT
BOOKMAN-EDMONSTON Section 3E N G I N E E R I N G , I N C .E N G I N E E R I N G , I N C .E N G I N E E R I N G , I N C .E N G I N E E R I N G , I N C . 3-18 Evaluation of Potential Regional
Salinity Management Strategies
METROPOLITAN AND OTHER AGENCY COLLABORATION
EXPAND DESERT-COACHELLA EXCHANGE
The existing exchange with the Desert Water Agency (DWA) and Coachella Valley WaterDistrict (CVWD) improves Metropolitan's blended water salinity at current demand levels byreplacing CRA water with 61,200 acre-feet of East Branch SWP water in most years. If DWAand CVWD obtain additional SWP supplies, the exchange could be expanded. Each 100,000acre-feet per year of exchange would reduce the salinity levels of Metropolitan’s blended waterby about 30 mg/L over a 12-month period. From 1995 through 1998, Metropolitan will haveexchanged about 440,000 acre-feet and experienced significant financial benefit to offset thecosts of its blending operations (Table 3-4).
Table 3–4 Desert Coachella ExchangeYear Desert – Coachella Exchange (AF)
1995 61,000
1996 133,000
1997 114,000
1998 132,000
LOCAL RESOURCES PROGRAM SUPPORT OF DESALTING AND BRINE LINES
Through its Local Resources Programs (LRP) Metropolitan is contractually committed to18 projects expected to remove 144,000 tons per year of salts from Southern Californiagroundwater and recycled water. Metropolitan’s participation also helps support the cost of brinelines needed for the disposal of salts to the ocean.
In June 1998, Metropolitan adopted a new LRP with a competitive request for proposals toidentify groundwater recovery and water recycling projects that it might participate in. Underexisting Integrated Resources Plan goals, additional local production of about 125,000 acre-feetper year will need to be in place by 2020. A number of these new projects will likely includegroundwater and recycled water desalination and attendant brine disposal facilities. Figure 3-12identifies existing LRP agreement project locations.

USBR/MWD SALINITY MANAGEMENT STUDYFINAL REPORT
BOOKMAN-EDMONSTON Section 3E N G I N E E R I N G , I N C .E N G I N E E R I N G , I N C .E N G I N E E R I N G , I N C .E N G I N E E R I N G , I N C . 3-19 Evaluation of Potential Regional
Salinity Management Strategies
Figure 3-12
DEMINERALIZATION R&D
Research and development of new desalination technologies are needed to overcome the energyintensity and expense of current practices. More cost-effective technological developments couldexpand salinity management options in the future. Metropolitan is pursuing such research withother agencies under the proposed Desalination Research and Innovation Partnership (DRIP). Itsorganizational structure is presented in Figure 3-13.
As of May 1999, the Partnership included the University of California, American WaterworksAssociation Research Foundation, California Department of Water Resources, LawrenceLivermore National Laboratory, Electric Power Research Institute, Edison Technologies, OrangeCounty Water District, West Basin Municipal Water District, San Diego County WaterAuthority, and Metropolitan Water District of Southern California.
RECLAMATION
GROUNDWATER RECOVERY
P A C
I F I C O
C E
A N
LOCAL RESOURCES PROGRAMSPROJECTS

USBR/MWD SALINITY MANAGEMENT STUDYFINAL REPORT
BOOKMAN-EDMONSTON Section 3E N G I N E E R I N G , I N C .E N G I N E E R I N G , I N C .E N G I N E E R I N G , I N C .E N G I N E E R I N G , I N C . 3-20 Evaluation of Potential Regional
Salinity Management Strategies
Figure 3-13
Note: Organization is still tentative and subject to change
EXAMPLES OF NEW AND INNOVATIVE METHODS TO REDUCE THE COST THEDESALINATION
Experimental MembranesDuring the reverse osmosis process, salty water, such as brackish surface water is pushedthrough semi-permeable membranes that filter out dissolved solids and salts. This process issimilar to the way plants obtain freshwater from the soil. The partnership will investigateultra-low pressure membranes that operate at one-third less pressure than current membranes. This reduction in pressure would substantially reduce the energy requirements for reverseosmosis treatment.
Carbon Aerogel Capacitive DeionizationCapacitive deionization with carbon aerogel electrodes is a new and promising technology forremoving TDS and impurities from domestic water supplies. Originally developed byLawrence Livermore National Laboratory for hazardous waste clean-up, carbon aerogel is amaterial that enables the successful removal of TDS because of its high surface area,
Desalination Research and Innovation Partnership (DRIP)
Electric Power Research Institute
Edison Technology Solutions
Metropolitan Water District of Southern California
University of California
Orange County Water District
American Water Works Association Research Foundation
West Basin Municipal Water District
San Diego County Water Authority
Steering Committee
Carbon Aerogel Development
Lawrence Livermore National Laboratory
Agricultural Drainage and High Salinity Desalination
University of California RiversideCalifornia Department of Water
Resources
Site Evaluations and Field Testing
San Diego County Water AuthorityMetropolitan Water District of
Southern California
Colorado River Water Desalination
Metropolitan Water Districtof Southern California
San Diego County Water Authority
Reclaimed Water and Groundwater Desalination
Orange County Water DistrictWest Basin Municipal Water
District
Research & Development Project Areas
State
To Be Determined
Federal
To Be Determined
Advocacy Team Funding Partners
California Energy Commission
Department of Water Resources
State Water Resources Control Board
Department of Energy
Department of the Interior
Department of Agriculture
Project Coordination
Metropolitan Water District of
Southern California
Technical Advisors
To be NamedPublic Outreach

USBR/MWD SALINITY MANAGEMENT STUDYFINAL REPORT
BOOKMAN-EDMONSTON Section 3E N G I N E E R I N G , I N C .E N G I N E E R I N G , I N C .E N G I N E E R I N G , I N C .E N G I N E E R I N G , I N C . 3-21 Evaluation of Potential Regional
Salinity Management Strategies
optimum pore size and low electrical resistivity. Unlike other purification methods, carbonaerogels require no membranes, distillation columns or thermal heaters. Consequently, theoverall process is more energy efficient.
Pretreatment OptionsAll desalination technologies require a “pretreatment” step to condition the water.Conventional drinking water treatment plants and microfiltration will be investigated aspossible pretreatment options for desalination. Metropolitan’s conventional treatment plantsproduce water of extremely high quality, and since staff and infrastructure are already inplace, they could be ideal locations for salinity removal facilities. According to in-houseestimates, the use of existing conventional treatment plants for pretreatment could cut overalldesalting costs by 46 percent.
Brine Treatment and DisposalAn unwanted byproduct of desalination is brine, which consists of highly concentrated saltwater and presents a serious disposal problem. For carbon aerogel or membrane technologiesto be viable for Colorado River water desalination, brine volume must be either minimized orreduced to a solid material. The partnership will investigate innovative brine treatment anddisposal options, such as gas-fired distillation, freeze-thaw technology and evaporationponds.
Economies of ScaleMembrane technology is generally reserved for small-scale applications because of theprohibitive costs associated with large membrane plants. Currently, the largest drinkingwater membrane plants treat 10 to 20 million gallons per day (with a few exceptions). Additional research is needed before a 100 to 200 million gallon per day membrane plant willbe practical. The partnership will evaluate different membrane module configurations andnew large-diameter membrane elements to take advantage of economies of scale.
The Future of DesalinationAdvances in TDS removal may help to alleviate the economic problems associated withusing Colorado River water, as well as aid in treating brackish groundwater, reclaimed waterand agricultural drainage. For instance, an estimated 16 million acre-feet of currently non-usable brackish water lies beneath the ground in Southern California. Alone, this water isenough to supply the state’s entire 32 million people with drinking water for roughly fouryears. If successful, technological and economic advances resulting from this partnershipcould fundamentally change the salinity issue for Colorado River water and other watersources.

USBR/MWD SALINITY MANAGEMENT STUDYFINAL REPORT
BOOKMAN-EDMONSTON Section 3E N G I N E E R I N G , I N C .E N G I N E E R I N G , I N C .E N G I N E E R I N G , I N C .E N G I N E E R I N G , I N C . 3-22 Evaluation of Potential Regional
Salinity Management Strategies
LOCAL EFFORTS TO PROTECT GROUNDWATER AND RECYCLEDSUPPLIES
NEED FOR BRINE DISPOSAL
The Santa Ana Watershed Project Authority has demonstrated leadership in developing aregional brine disposal line under a Joint Powers Authority (JPA) arrangement. The Santa AnaRegional Interceptor (SARI) line conveys high salinity municipal wastewater to an ocean outfall. The SARI line helps protect groundwater and recycled water from salt loading. It also providesbrine disposal for groundwater desalination plants recovering previously abandoned localgroundwater resources. Other JPAs could be formed following this model.
USBR is providing valuable financial assistance to water recycling and groundwater desaltingprojects in Southern California. The USBR, along with other agencies, is studying opportunitiesto expand recycling in Southern California. A key constraint to water recycling is the disposal ofbrine (Technical Appendix 8). The USBR study will investigate regional brine disposal facilitiesfor recycling and groundwater desalting projects.
An appraisal-level evaluation was conducted as part of this study to identify potential brinedisposal facilities within the Metropolitan service area. It provided estimates of capital costs thatwould be incurred in the construction of these potential facilities (Technical Appendix 7).
Table 3-5 presents a summary of five potential brine disposal facilities and their respectivecapital costs. Only the capital costs associated with the construction of the potential brinedisposal pipelines are considered. Operation and maintenance costs are negligible unless the lineincludes pumping stations. Treatment facilities and ocean outfalls are not addressed in this studybecause they already exist.
Table 3–5 Summary of Proposed Brine Disposal Pipeline Facilities
Facility Name
VenturaCounty Brine
DisposalPipeline
San FernandoValley/WestBasin Brine
DisposalPipeline
RaymondBasin Brine
DisposalPipeline
TemescalValley
RegionalInterceptorBrine Line
San DiegoIndustrial
Brine ExportSystem
Total
Maximum Flow (mgd) 9.8 17.3 7.8 15.0 2.7 52.6Max. Pipe Diameter (inch) 36 36 21 36 18 --Miles of Pipeline 37.2 32.3 14.1 25.8 23.5 132.9TOTAL CAPITAL COSTS($ MILLION) 41.2 44.3 9.9 39.4 16.0 150.8

USBR/MWD SALINITY MANAGEMENT STUDYFINAL REPORT
BOOKMAN-EDMONSTON Section 3E N G I N E E R I N G , I N C .E N G I N E E R I N G , I N C .E N G I N E E R I N G , I N C .E N G I N E E R I N G , I N C . 3-23 Evaluation of Potential Regional
Salinity Management Strategies
Figure 3-14
WASTEWATER MANAGEMENT
Urban water use in Southern California typically adds 250 to 400 mg/L of salt as measured atwastewater plants. In some cases that salt contribution may be as high as 600 mg/L in coastalzones where seawater may infiltrate into the sewers. This salt loading is problematic for waterrecycling and downstream receiving groundwater basins. Figure 3-14 illustrates influent salinityat wastewater plants representing a cross-section of Southern California's communities.
On a volumetric basis, Metropolitan’s supplies contribute about half of the salt entering thecoastal plain. Other sources of salt include municipal sewage, industry and irrigation (TechnicalAppendix 10). Under a comprehensive regional approach, wastewater agencies should also workto control salinity contributions into their wastewater collection systems. Possible actionsinclude:
! Industrial Waste Discharge Permitting by Sanitary Districts/Cities! More stringent industrial permitting may help protect groundwater and recycled water
from salt loading.
Influent Average TDS at Wastewater Treatment Plants
0
200
400
600
800
1000
1200
TD
S (
mg
/L)
Ch
ino
Re
gio
na
l
Pla
nt
No
. 1
Hill
Ca
ny
on
Sa
n J
os
e C
ree
k
Mic
he
lso
n
Lo
s C
oy
ote
s
Co
ron
a P
lan
t N
o.
1
Hy
pe
rio
n
CS
DO
C P
lan
t N
o.
1
So
. C
oa
st
Wa
ter
Dis
tric
t
Sa
n E
lijo
No
rth
Cit
y

USBR/MWD SALINITY MANAGEMENT STUDYFINAL REPORT
BOOKMAN-EDMONSTON Section 3E N G I N E E R I N G , I N C .E N G I N E E R I N G , I N C .E N G I N E E R I N G , I N C .E N G I N E E R I N G , I N C . 3-24 Evaluation of Potential Regional
Salinity Management Strategies
Control of Brackish Groundwater Infiltration into SewersSanitation districts and cities are responsible for controlling brackish groundwater infiltrationinto sewers that supply water recycling projects. This problem is troublesome in somecoastal areas where seawater intrusion has reached and infiltrated old, deterioratingresidential, commercial and public sewer lines. In some locations, rainfall temporarily raisesthe brackish water table, thus exacerbating the infiltration problem.
Agricultural DischargeThe discharge of waste from pastures and the fertilization of irrigated crop land are localsources of salt that have plagued Southern California groundwater quality for years. Theprincipal vehicle to control agricultural salts is enforcement of basin plan objectives andwaste discharge permits by RWQCBs. Figure 3-15 identifies the high salinity zone of theChino Groundwater Basin where there is a historical presence of dairies. Farmers and localwater districts are working together to develop effective basin management practices thatmight mitigate their legacy of high salinity groundwater.
Figure 3-15
Salinity in Chino Groundwater Basin
SANTA
ANARIVER
10
15
60
71
ONTARIO
NORCO
POMONA
Salinity varies from500 to 1000 mg/L
in Dairy Area
Salinity varies from200 to 500 mg/L

USBR/MWD SALINITY MANAGEMENT STUDYFINAL REPORT
BOOKMAN-EDMONSTON Section 3E N G I N E E R I N G , I N C .E N G I N E E R I N G , I N C .E N G I N E E R I N G , I N C .E N G I N E E R I N G , I N C . 3-25 Evaluation of Potential Regional
Salinity Management Strategies
Water Softeners
Self-regenerating residential water softeners contribute 50 to 100 mg/L of salt to domesticsewage discharged to wastewater collection systems. This added salt may adversely affect waterrecycling and receiving groundwater. Recent attempts to control the use of such water softenershave failed because of legal challenges by the Water Quality Association (a home watertreatment device manufacturers association). New state regulations or legislation could bepursued to provide water and wastewater agencies with greater authority to regulate the use ofwater softeners within their jurisdictional areas, while allowing the public to continue enjoyingthe benefits of water softening. It may be beneficial for water softeners manufacturers and waterutilities to pursue actions of common benefits, such as improved salt use efficiency and otheradvances in technology. (See Technical Appendix 6 for a more thorough discussion of thisissue.)
ECONOMIC BENEFITS OF OPTIONS
To allow for a comparison of the merits of the various options, a benefit assessment wasconducted for year 2000 conditions. For comparative purposes, the study assumed that eachoption was fully in effect under average demand and salinity conditions in the year 2000. Thisapproach, of course, results in moving some options forward in time, such as a CALFED solutionthat would not be fully realized until perhaps 2015. Table 3–6 represents the result of thiscomparative assessment.

USBR/MWD SALINITY MANAGEMENT STUDYFINAL REPORT
BOOKMAN-EDMONSTON Section 3E N G I N E E R I N G , I N C .E N G I N E E R I N G , I N C .E N G I N E E R I N G , I N C .E N G I N E E R I N G , I N C . 3-26 Evaluation of Potential Regional
Salinity Management Strategies
Table 3–6 Benefits of Various Alternatives if Implemented in Year 2000
Benefits of Alternatives if Implemented in Year 2000*
Project
Salinity Reduction Benefits
($ million)
Total Salt Reduction (1000 Tons)
CRA water desalted from 689 to 200 mg/L 289 787
CRA water desalted from 689 to 500 mg/L 144 354
Place desalted agricultural drainage into CRA to lower CRA salinity to 500 mg/L
127 311
CRA salinity control programs to reduce CRA TDS by 100 mg/L (from 689 to 589 mg/L)
70 165
CRA salinity control programs to reduce CRA TDS by 50 mg/L (from 689 to 639 mg/L)
35 82
CALFED alternative that lowers SWP TDS from 250 to 150 mg/L at O'Neill Forebay
41 105
Additional 100,000 AFY of Desert-Coachella exchange (33 mg/L of TDS reduction in blended area)
22 60
6-month 500 mg/L salinity target 57 138
9-month 500 mg/L salinity target 80 193
Year-round 500 mg/L salinity target 97 234
Reduce urban TDS contribution to wastewater by 100 mg/L, but to not less than a 250 mg/L contribution
8 10 **
Reduce groundwater TDS by 100 mg/L, but to not less than about 250 mg/L at the wellhead
66 n/a
* This presentation is for comparative purposes. Some of the alternatives could not be implemented by year 2000. Benefits are for a hypothetical condition where each alternative would be fully implemented by year 2000.** Excludes ocean disposaln/a:Not applicable

USBR/MWD SALINITY MANAGEMENT STUDYFINAL REPORT
BOOKMAN-EDMONSTONE N G I N E E R I N G , I N C .E N G I N E E R I N G , I N C .E N G I N E E R I N G , I N C .E N G I N E E R I N G , I N C . 4-1
SECTION 4SALINITY MANAGEMENT POLICY
The following policy was adopted by the Metroplitan's Board of Directors on April 13, 1999:
MANAGEMENT OF SALINITY BY THE METROPOLITAN DISTRICT OFSOUTHERN CALIFORNIA
Metropolitan, in cooperation with other water and wastewater agencies throughout SouthernCalifornia, is committed to the following long-term policy to control salinity:
Protect Metropolitan’s imported source supplies from additional salinity, and wherefeasible seek reductions.
Achieve, to the extent reasonable and practical, a total dissolved solids (TDS)concentration objective of 500 milligrams per liter (mg/L) in Metropolitan’s distributionsystem.
Recognize that natural events beyond Metropolitan’s control will at times increase thesalinity of imported water supplies, hindering Metropolitan’s ability to continuously meetits 500 mg/L objective.
Optimize the long-term use of Colorado River water in conjunction with State WaterProject supplies in pursuing salinity management objectives and Metropolitan’sIntegrated Resource Plan.
Integrate water quality and quantity objectives in planning facilities and resources.
Support regional regulatory and management actions to minimize salinity contributions togroundwater and recycled water resources.
Make the Salinity Management Action Plan the primary strategy to carry out this policy.Regularly assess the implementation and results of the Action Plan, and make revisionsbased upon experience gained and changing conditions.

USBR/MWD SALINITY MANAGEMENT STUDYFINAL REPORT
BOOKMAN-EDMONSTONE N G I N E E R I N G , I N C .E N G I N E E R I N G , I N C .E N G I N E E R I N G , I N C .E N G I N E E R I N G , I N C . 5-1
SECTION 5SALINITY MANAGEMENT ACTION PLAN
On April 13, 1999, Metropolitan's Board of Directors authorized its General Manager toimplement a comprehensive Action Plan to carry out Metropolitan’s policy for management ofsalinity. The Action Plan focuses on reducing salinity concentrations in Southern California’swater supplies through collaborative actions with pertinent agencies, recognizing that an effectivesolution requires a regional commitment. Actions specifically under Metropolitan’s control willbe predicated on Board-approved funding. Four fundamental categories of action are included:
Imported Water Source Control and Salinity Reduction Actions;
Distribution System Salinity Management Actions;
Collaborative Actions with Other Agencies; and
Local Salinity Management including Actions to Protect Groundwater and RecycledWater Supplies.
IMPORTED WATER SOURCE CONTROL AND SALINITY REDUCTIONACTIONS
(Action Item No. 1) Colorado River
Metropolitan will diligently support funding for the Colorado River Salinity Control Program. Added emphasis will be given to accelerating implementation of program measures. This willentail coordination with the Colorado River Board of California, the Colorado River BasinSalinity Control Forum, participating federal agencies, the proposed Southern California SalinityCoalition and other interested parties.
Metropolitan will provide the U.S. Bureau of Reclamation (Reclamation) with its updatedsalinity impacts model for Reclamation’s use to help develop economic justification for newsalinity control measures and funding.
IMPORTED WATER SOURCE CONTROL/SALINITY REDUCTION ACTIONS
(Action Item No. 2) State Water Project
Metropolitan will work with other State Water Project (SWP) Contractors, and the CaliforniaUrban Water Agencies to encourage the Department of Water Resources (DWR) to engage inoperational and management practices which support Metropolitan’s salinity managementobjectives including:
DWR to provide timely water quality information to aid Metropolitan’s operationaldecisions.

USBR/MWD SALINITY MANAGEMENT STUDYFINAL REPORT
BOOKMAN-EDMONSTON Section 5E N G I N E E R I N G , I N C .E N G I N E E R I N G , I N C .E N G I N E E R I N G , I N C .E N G I N E E R I N G , I N C . 5-2 Salinity Management Action Plan
DWR to develop a TDS assessment methodology to provide routine salinity forecasts andto assess actions that may affect source or delivered water quality.
DWR and Metropolitan to seek mitigation offsets for proposed projects that havepotential to significantly degrade source or delivered water quality.
Metropolitan and DWR to assess the tradeoffs of projects affecting SWP salinity,including economic impacts.
Metropolitan to promote inclusion of salinity control and reduction as a major objectivefor Delta exports as part of CALFED’s long-term Bay-Delta solution.
DWR to conduct water cycling and flow-through operations in its reservoirs to lowersalinity levels without impairing water supply reliability.
CALFED to adopt watershed management activities and water quality programs that reduce salinity to municipal water supplies.
DISTRIBUTION SYSTEM SALINITY MANAGEMENT ACTIONS
(Action Item No. 3) Blending
Metropolitan will operate its system with the objective to maintain an average salinityconcentration equal to the secondary State and federal drinking water standard of 500 mg/L in itsblended water at its Weymouth, Diemer, and Skinner filtration plants, the untreated San Diegopipelines, and the Eastside Reservoir subject to the following:
Compliance with all water quality standards and aesthetic parameters,
Availability of sufficient State Project water to accomplish the blend without usingdrought supplies from special transfer or storage accounts,
Adequate distribution system delivery capacity, and
An annually budgeted amount to cover operational cost,
Actual system concentrations will vary by time and location in response to routine operationalconstraints and practices. The blending objective is estimated to be achievable in 7 out of 10years on average, hindered primarily by periodic episodes of high salinity in Metropolitan’simported water sources caused by drought conditions. Staff will inform Metropolitan’s Boardwhenever constraints will prevent achievement of the objective. Staff will also provide reports tothe Board of the cost incurred and the amount of salinity reduction achieved at the end of eachyear.
Duration of blending operations:
Interim: Through 2004, Metropolitan will plan its operations to meet a 500 mg/Lobjective in a two stage process:

USBR/MWD SALINITY MANAGEMENT STUDYFINAL REPORT
BOOKMAN-EDMONSTON Section 5E N G I N E E R I N G , I N C .E N G I N E E R I N G , I N C .E N G I N E E R I N G , I N C .E N G I N E E R I N G , I N C . 5-3 Salinity Management Action Plan
1. April-September will be the primary time window when water resources are limited,and
2. October - March will be secondary time window when water resource conditions arefavorable.
Long-term: In 2004, Metropolitan will assess changes in resource conditions and revisethe blending duration to the extent that supply improvements permit to achieve the 500mg/L objective on a year-round basis. Success in a CALFED solution; development ofnew storage and exchange arrangements along the Colorado River Aqueduct; andexchanges of lower salinity Sierra Nevada water into the State Water Project will beimportant factors in expanding the blending duration.
(Action Item No. 4) Exchange and Storage and Conveyance
Metropolitan will pursue: (1) storage and exchange arrangements along the Colorado RiverAqueduct to minimize the loss of Colorado River water periodically curtailed and replaced byState Project water when blending to meet salinity targets; (2) exchanges and transfers of Sierrawater that could lower State Project water salinity; and (3) conveyance of low salinitygroundwater in its distribution system.
(Action Item No. 5) Integration of Water Quality and Quantity
Metropolitan will integrate water quality and quantity objectives in conducting its systemoverview planning studies, updating its Integrated Water Resource Plan and in negotiatingresource developments. Metropolitan, in coordination with its member agencies and otherconcerned entities, will periodically review its distribution system and assess the merit of facilityimprovements needed for regional salinity management for all classes of water service.
COLLABORATIVE ACTIONS WITH OTHER AGENCIES
(Action Item No. 6) Local Resources Program Support
Metropolitan will continue its financial support of local recycled water and groundwaterdesalination projects, including associated brine disposal through its Local Resources Programand will encourage protection and enhancement of the quality of those water resources.
(Action Item No. 7) Desalination Research and Development
Metropolitan will continue to pursue research and development partnerships to reduce the costsassociated with removing TDS from the Colorado River Aqueduct and other water supplies,including brackish groundwater, recycled water, and agricultural drainage. The DesalinationResearch and Innovation Partnership (DRIP) is a collaborative effort that will focus ondeveloping new and innovative technologies to reduce the cost of desalting water supplies.

USBR/MWD SALINITY MANAGEMENT STUDYFINAL REPORT
BOOKMAN-EDMONSTON Section 5E N G I N E E R I N G , I N C .E N G I N E E R I N G , I N C .E N G I N E E R I N G , I N C .E N G I N E E R I N G , I N C . 5-4 Salinity Management Action Plan
Practical technologies that may reduce the salinity content of the water supplied to memberagencies will be evaluated. The partnership will also investigate water softener technology andits salinity impacts to the region’s recycled water and groundwater resources.
(Action Item No. 8) Southern California Salinity Coalition
Metropolitan will collaborate with Association of Groundwater Agencies, Southern CaliforniaAlliance of Publicly Owned Treatment Works, member agencies and other concerned agencies inSouthern California to form a coalition that will assess progress in correcting the regional saltimbalance and coordinate needed actions with key agencies that influence regional salinity,including DWR, the Bureau of Reclamation, the State Water Resources Control Board, theRegional Water Quality Control Boards, and CALFED.
Public Education: The coalition will pursue public education and awareness regarding the need tocorrect the region’s salinity problems.
Annual Salinity Report Card: The coalition will prepare an annual report on salt balance to trackkey indicators of the region’s success in managing salinity and assess overall implementation ofthis Action Plan. Metropolitan will consider revisions based on the assessment, the experience itgains and changing conditions.
Statewide Water Softener Study: The coalition will pursue passage of legislation that wouldfund a statewide investigation by the State Water Resources Control Board of the impacts ofwater softeners and other sources of salt in local wastewater affecting recycled water andgroundwater resources.
Advocate Federal Funding: The coalition will support needed funding for the Colorado RiverSalinity Control Program.
LOCAL SALINITY MANAGEMENT ACTIONS
(Action Item No. 9) Local Wastewater Discharge Management
Discharge Permits: Local leadership is needed to reduce the amount of salts enteringgroundwater and recycled water resources from sewer and agricultural discharges. Opportunitiesfor improvement include more stringent industrial permitting, controlling infiltration of brackishgroundwater and seawater, as well as developing dedicated brine or interceptor lines.
Local permitting and design practices need to consider the unavoidable salinity increases thatwill occur in imported water in response to periodic droughts and progressive changes in theColorado River watershed. Normal fluctuations in imported water salinity need to be fully

USBR/MWD SALINITY MANAGEMENT STUDYFINAL REPORT
BOOKMAN-EDMONSTON Section 5E N G I N E E R I N G , I N C .E N G I N E E R I N G , I N C .E N G I N E E R I N G , I N C .E N G I N E E R I N G , I N C . 5-5 Salinity Management Action Plan
recognized in the design of water recycling facilities, when developing groundwater managementplans, and in establishing waste discharge permit standards.
Expand Regional Brine Disposal: Local leadership is needed to develop new dedicated brinedisposal facilities to protect groundwater and recycled water resources. Metropolitan is currentlyworking with a group of local agencies, member agencies, DWR and the Bureau of Reclamationin a regional water recycling planning study for Southern California. Part of that effort includesthe planning of new brine disposal lines that would support water recycling and groundwaterdesalination developments.
Management of Water Softener Brines: Local leadership is needed to rectify existingstatutes that hinder local agencies from managing salt discharges from residential watersofteners. Metropolitan can help organize concerned local agencies to assess the regional scaleof this issue and facilitate an effective outcome among the WateReuse Association, the WaterQuality Association, and State regulators.
(Action Item No. 10) Groundwater Management
Local leadership is needed to pursue groundwater management practices that minimizegroundwater basin salt loading. Where none exist, institutional arrangements for groundwaterquality management should be pursued. Some agencies have the opportunity to selectivelyschedule spreading, injection, or in-lieu replenishment in response to imported water salinityconditions to minimize basin salt loading. Basin managers should address salt loading from localsources with regulatory agencies and pertinent dischargers.

8/25/2000