salinity pattern in semarang coastal city: an overview...
TRANSCRIPT

Indonesian Journal of Geology, Vol. 8 No. 2 June 2013: 107-118
Salinity Pattern in Semarang Coastal City: An Overview
Pola Salinitas di Pesisir Kota Semarang: Suatu Tinjauan
N. Rahmawati1, and m. a. maRfai2
1Master in Planning and Management of Coastal Area and Watershed, Faculty of Geography, Gadjah Mada University, Bulaksumur, Yogyakarta, 55281, Indonesia
2Department of Environmental Geography, Faculty of Geography, Gadjah Mada University, Bulaksumur, Yogyakarta, 55281, Indonesia
AbstrAct
Semarang Coastal City is one of cities in Indonesia which has experienced a long-term salt intrusion. Land subsidence and groundwater exploitation were identified as main factors accelerated salt intrusion in this area. Extended salt intrusion into the land from year to year cannot be neglected. Salinity pattern and land use affected by this intrusion must be identified. Salinity pattern could be identified by electrical conductance content. The purposes of this research are: a) to define spatial electrical conductance map from 1995 to 2008 and b) to identify salinity pattern in each land use. Primary data set of electrical conductance measurement in 2004 and 2008 was performed. Secondary data set of electrical conductance was collected in 1995 and 2000. Electrical conductance mapping was assigned by point interpolation using GIS Environ-ment. Land use classification was interpreted from topographical map and IKONOS using GIS Environment. Field check of land use was also done in the study area. Geologically, the area setting consists of Damar, Kalibiuk, and Breccias Formations, where the Damar Formation is the recharge source for groundwater in Semarang City. Based on the result, it can be concluded that the salinity content in groundwater increased from 1995-2008. In 1995, there was only 2.4% of brackish groundwater in Semarang Coastal City, but in 2008, most of area in that region was classified as saline. Land use conversion into built up area increased from 1998 to 2008. The area intruded by salt water increased within 1995, 2004, and 2008 periods. About 68 % of the area contained brackish water and most of the area were built up area in 1995. In 2004, no fresh groundwater found in Semarang Coastal City and the area of brackish groundwater reached 77% and about 23% was saline groundwater which 82% of the built up area included brackish groundwater. In 2008, ap-proximately 55% of Semarang Coastal City was occupied by saline groundwater. About 51% of groundwater built up area was saline.
Keywords: electrical conductance, land use, salinity pattern, Semarang Coastal City
AbstrAk
Kota Pesisir Semarang adalah salah satu dari kota di Indonesia yang mengalami intrusi air asin dalam kurun waktu yang lama. Amblesan tanah, perubahan iklim, dan eksploitasi airtanah diidentifikasi dapat menjadi salah satu faktor semakin parahnya intrusi air asin di daerah tersebut. Persebaran intrusi air asin ke arah daratan dari tahun ke tahun tidak dapat diabaikan. Pola salinitas dan penggunaan lahan yang terkena dampak intrusi sebaiknya diidentifikasi. Pola salinitas dapat diidentifikasi dari kandungan DHL (Daya Hantar Listrik). Tujuan dari penelitian ini adalah untuk: a) menentukan peta DHL secara spasial dari tahun 1995 sampai 2008 dan b) menentukan pola salinitas pada tiap penggunaan lahan. Data primer berupa pengukuran DHL tahun 2004 dan 2008 telah dilakukan. Data sekunder pengukuran DHL di tahun 2004 dan 2008 telah dikumpulkan. Pemetaan DHL dianalisis melalui interpolasi titik menggunakan software SIG. Klasifikasi penggunaan lahan diinterpretasi dari peta topografi dan IKONOS menggunakan SIG. Cek lapangan untuk penggunaan lahan juga dilakukan di daerah penelitian. Kondisi geologi tersusun oleh Formasi Damar, Kalibiuk, dan Formasi Breksi, sementara Formasi Damar merupakan sumber recharge airtanah di
107
Manuscript received: Pebruary 13, 2013, final acceptance: June 18, 2013Corresponding Author: +62-81328075388/[email protected]

108 Indonesian Journal of Geology, Vol. 8 No. 2 June 2013: 107-118
IntroductIon
BackgroundThere are several basic terms in this paper as a
framework how geology correlates with the geomor-phology and how they control groundwater flow. Landform is a natural asset of geomorphology in the context of geomorphological resources. Land use is an expression of anthropogenic activity that influences geomorphology and geomorphology also effects on land use change (Hugget, 2007). Morpho-metric in geomorphology influences groundwater flow in terms of kinetic energy and hydraulic bound-aries (LaFleur, 1999). Various landforms affect spa-tial and temporal salt pathways (Summerell et al., 2006). Landform can also modify salinity concentra-tion in groundwater, as also paleo-material and slope as geomorphology features influence groundwater’s salt concentration (Bennetts et al., 2006). Perry et al. (2009) presented that fresh-water lens are controlled by geomorphology features (such as fault, and high permeability layer).
However, anthropological influence to ground-water by land use expression can affect groundwa-ter condition. Moreover, land use can affect water recharge, water supply and water quality changes (Lerner and Harris, 2009). While, geological param-eter controls groundwater chemistry and distribution (Hasan et al., 2009).
Another term, hydrogeomorphology, can be defined as the studies of spatial and temporal dimen-sion of hydrologic process and landform or interre-lation between geomorphology process and surface and sub-surface water (Poole, 2010). Lenahan and Bristow (2010) studied about spatial and temporal saline groundwater in floodplain, whilst Baird and Horn (1996) studies groundwater flow in sandy beaches. Then Datema (1989) presents groundwater chemical pattern in Central Java and West Java.
Related to the above terms and basic framework, this paper will discuss the groundwater quality set-ting in Semarang, and how it changes through time. Semarang is one of coastal cities in Central Java that has experienced salt intrusion. Seawater intrusion in Semarang Coastal Area is identified since 1990 (Purnama, 2005). Various landforms in this area must influence the movement and distribution of salt intrusion. Jeong (2001) studies land use effects on hydrogeochemistry condition including electrical conductance in groundwater. Moreover, Cho et al. (2009) had reviewed effect of land use change with groundwater level. Therefore, this research reviewed spatial and temporal saline groundwater and land use in Semarang Coastal Area. Understanding the correlation between salt intrusion and land use is the key to manage groundwater resources in the area.
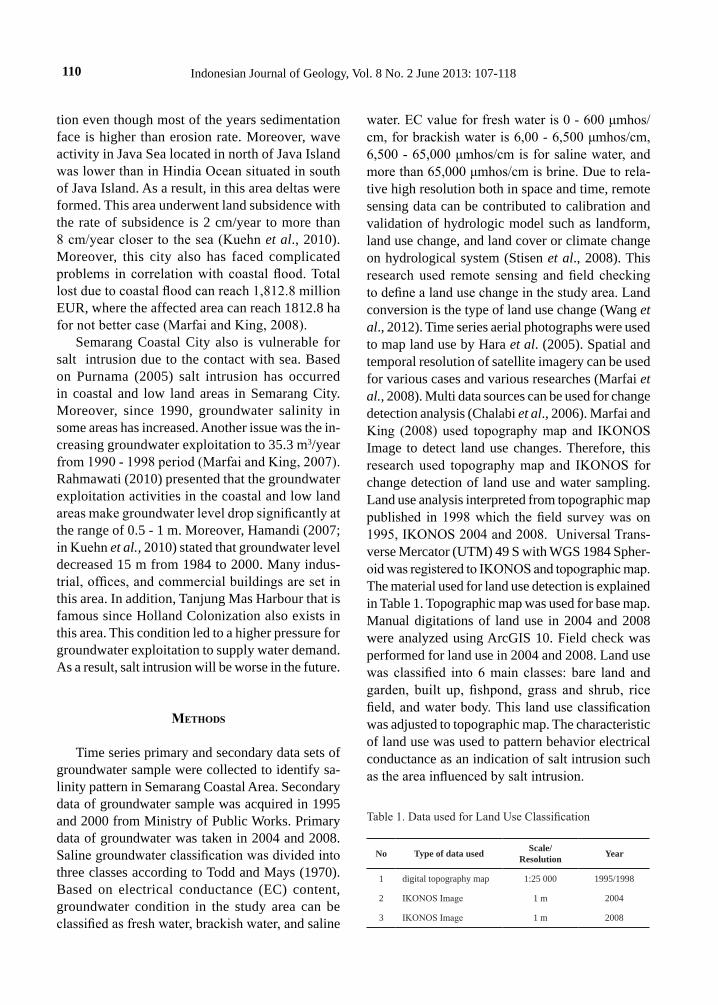
Site DescriptionSemarang is a capital city of Central Java Prov-
ince, Indonesia. This capital city is located in coastal area and lowlands of the Semarang City. Semarang Coastal City comprises 16 subregencies that are Mijen, Gunungpati, Banyumanik, Gadjah Mungkur, Sema-rang Selatan, Candisari, Tembalang, Pendurungan, Genuk, Gayamsari, Semarang Timur, Semarang Utara, Semarang Tengah, Semarang Barat, Tugu, and Ngalian. There are 1,544,358 inhabitants live within the area of 386.51 km2 in Semarang City (BPS Kota Semarang, 2012). Administrative bound-ary of Semarang City can be shown in Figure 1. These are the subregencies included in this discus-sion: Gadjah Mungkur, Semarang Selatan, Genuk, Semarang Timur, Gayamsari, Tembalang, Semarang Utara, Semarang Tengah, Semarang Barat, Tugu, and Ngaliyan.
Relative flat topographies in Semarang City that can reach 225.31 km2 (Rahmawati, 2010) oc-cupying most of the Semarang City is coastal and
Kota Semarang. Berdasarkan hasil penelitian, dapat disimpulkan bahwa pola salinitas pada airtanah meningkat pada 1995-2008. Tahun 1995, hanya 2.4% areal di Kota Pesisir Semarang berair payau, tetapi di tahun 2008, sebagian be-sar Kota Pesisir Semarang termasuk dalam air asin. Konversi penggunaan lahan menjadi lahan terbangun meningkat dari 1998 sampai 2008. Daerah yang terintrusi air asin meningkat selama periode 1995, 2004, dan 2008. Sekitar 68% daerah penelitian merupakan air payau dan sebagian besar daerah tersebut merupakan lahan terbangun di 1995. Di tahun 2004, tidak terdapat air tawar di Kota Pesisir Semarang; dari luasan area air payau yang mencapai 77%, sekitar 23% adalah air asin dengan 82% arealnya adalah berair payau. Tahun 2008, sekitar 55% dari Kota Pesisir Semarang airtanahnya adalah air asin. Sekitar 51% dari lahan terbangun mempunyai airtanah asin.
Kata kunci: Daya Hantar Listrik, land use, pola salinitas, Kota Pesisir Semarang

109Salinity Pattern in Semarang Coastal City: An Overview (N. Rahmawati and M. A. Marfai)
low land areas where the southern border of these areas are folded mountain. Geologically, setting of this coastal area is composed of alluvial sediment with alluvial soil. Alluvial sediment consists of sand, clay, and gravel. The age of this alluvial formation is Pleistocene. Based on Geological Map scale 1:100000, Magelang and Semarang Sheet (Thanden et al.1996), the southern part of Semarang Coastal Area is bordered by fault line and hills. This hill is built by Damar, Kalibiuk and Breccias Formations. The Damar Formation comprises tuffaceous sand-stone, conglomerats, volcanic breccias, and tuffs.
The Kalibiuk Formation consists of claystone, marl, and sandstone. The Breccias Formation is volcanic breccias, lava flows, tuffs, tuffaceous sandstone, and clay stone. According to Purnama (2005), groundwater recharge of Semarang City is from the Damar Formation. Depositional process dominated in this area since sedimentation rate from land was higher rate than from sea. According to Marfai et al. (2008), total sedimentation rate in a specific area of Semarang Coastal Area is 945 m from 1908 - 2003. Various abrasion and sedimentation face occurred in certain areas due to natural condition and reclama-
Figure 1. Locality map of Central Java and Yogyakarta Special Provinces that are focused on the study area in Semarang coastal city.
3
3
92
25
00
0
92
30
00
0
92
30
00
0
92
25
00
0
440000 435000 435000
A
Genuk
Tembalang
Semarang Tengah
Semarang Timur
Gayamsari
Semarang Selatan
CandisariGajahmungkur
Semarang Barat
Semarang Utara
Banjir K
anal Tim
ur
Garang R
iver
N
kilometres
Central Java
E
N
JAVA SEA
DI Yogyakarta
430000 435000 440000
INDIAN OCEAN
kilometres
110 Indonesian Journal of Geology, Vol. 8 No. 2 June 2013: 107-118
tion even though most of the years sedimentation face is higher than erosion rate. Moreover, wave activity in Java Sea located in north of Java Island was lower than in Hindia Ocean situated in south of Java Island. As a result, in this area deltas were formed. This area underwent land subsidence with the rate of subsidence is 2 cm/year to more than 8 cm/year closer to the sea (Kuehn et al., 2010). Moreover, this city also has faced complicated problems in correlation with coastal flood. Total lost due to coastal flood can reach 1,812.8 million EUR, where the affected area can reach 1812.8 ha for not better case (Marfai and King, 2008).
Semarang Coastal City also is vulnerable for salt intrusion due to the contact with sea. Based on Purnama (2005) salt intrusion has occurred in coastal and low land areas in Semarang City. Moreover, since 1990, groundwater salinity in some areas has increased. Another issue was the in-creasing groundwater exploitation to 35.3 m3/year from 1990 - 1998 period (Marfai and King, 2007). Rahmawati (2010) presented that the groundwater exploitation activities in the coastal and low land areas make groundwater level drop significantly at the range of 0.5 - 1 m. Moreover, Hamandi (2007; in Kuehn et al., 2010) stated that groundwater level decreased 15 m from 1984 to 2000. Many indus-trial, offices, and commercial buildings are set in this area. In addition, Tanjung Mas Harbour that is famous since Holland Colonization also exists in this area. This condition led to a higher pressure for groundwater exploitation to supply water demand. As a result, salt intrusion will be worse in the future.
Methods
Time series primary and secondary data sets of groundwater sample were collected to identify sa-linity pattern in Semarang Coastal Area. Secondary data of groundwater sample was acquired in 1995 and 2000 from Ministry of Public Works. Primary data of groundwater was taken in 2004 and 2008. Saline groundwater classification was divided into three classes according to Todd and Mays (1970). Based on electrical conductance (EC) content, groundwater condition in the study area can be classified as fresh water, brackish water, and saline
water. EC value for fresh water is 0 - 600 μmhos/cm, for brackish water is 6,00 - 6,500 μmhos/cm, 6,500 - 65,000 μmhos/cm is for saline water, and more than 65,000 μmhos/cm is brine. Due to rela-tive high resolution both in space and time, remote sensing data can be contributed to calibration and validation of hydrologic model such as landform, land use change, and land cover or climate change on hydrological system (Stisen et al., 2008). This research used remote sensing and field checking to define a land use change in the study area. Land conversion is the type of land use change (Wang et al., 2012). Time series aerial photographs were used to map land use by Hara et al. (2005). Spatial and temporal resolution of satellite imagery can be used for various cases and various researches (Marfai et al., 2008). Multi data sources can be used for change detection analysis (Chalabi et al., 2006). Marfai and King (2008) used topography map and IKONOS Image to detect land use changes. Therefore, this research used topography map and IKONOS for change detection of land use and water sampling. Land use analysis interpreted from topographic map published in 1998 which the field survey was on 1995, IKONOS 2004 and 2008. Universal Trans-verse Mercator (UTM) 49 S with WGS 1984 Spher-oid was registered to IKONOS and topographic map. The material used for land use detection is explained in Table 1. Topographic map was used for base map. Manual digitations of land use in 2004 and 2008 were analyzed using ArcGIS 10. Field check was performed for land use in 2004 and 2008. Land use was classified into 6 main classes: bare land and garden, built up, fishpond, grass and shrub, rice field, and water body. This land use classification was adjusted to topographic map. The characteristic of land use was used to pattern behavior electrical conductance as an indication of salt intrusion such as the area influenced by salt intrusion.
No Type of data used Scale/Resolution Year
1 digital topography map 1:25 000 1995/1998
2 IKONOS Image 1 m 2004
3 IKONOS Image 1 m 2008
Table 1. Data used for Land Use Classification
111Salinity Pattern in Semarang Coastal City: An Overview (N. Rahmawati and M. A. Marfai)
result And dIscussIon
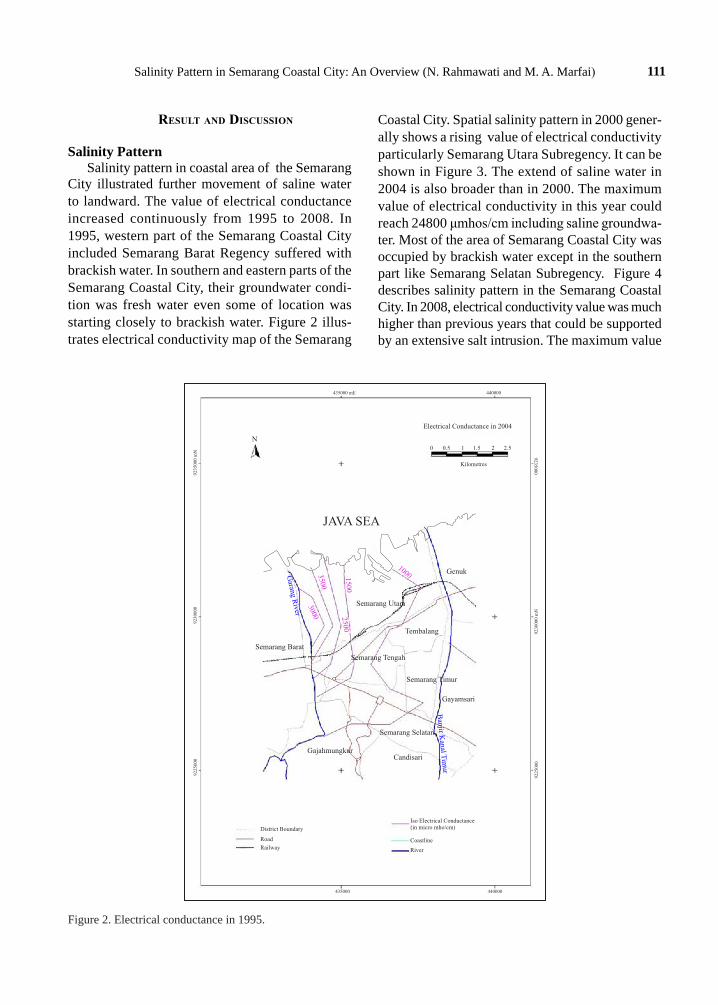
Salinity PatternSalinity pattern in coastal area of the Semarang
City illustrated further movement of saline water to landward. The value of electrical conductance increased continuously from 1995 to 2008. In 1995, western part of the Semarang Coastal City included Semarang Barat Regency suffered with brackish water. In southern and eastern parts of the Semarang Coastal City, their groundwater condi-tion was fresh water even some of location was starting closely to brackish water. Figure 2 illus-trates electrical conductivity map of the Semarang
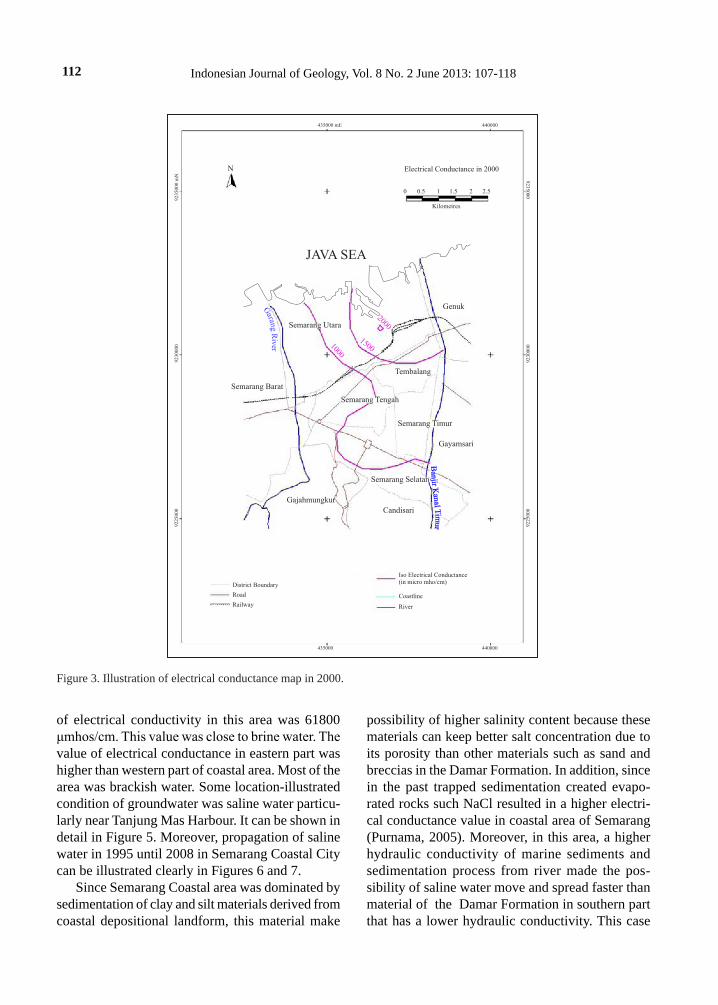
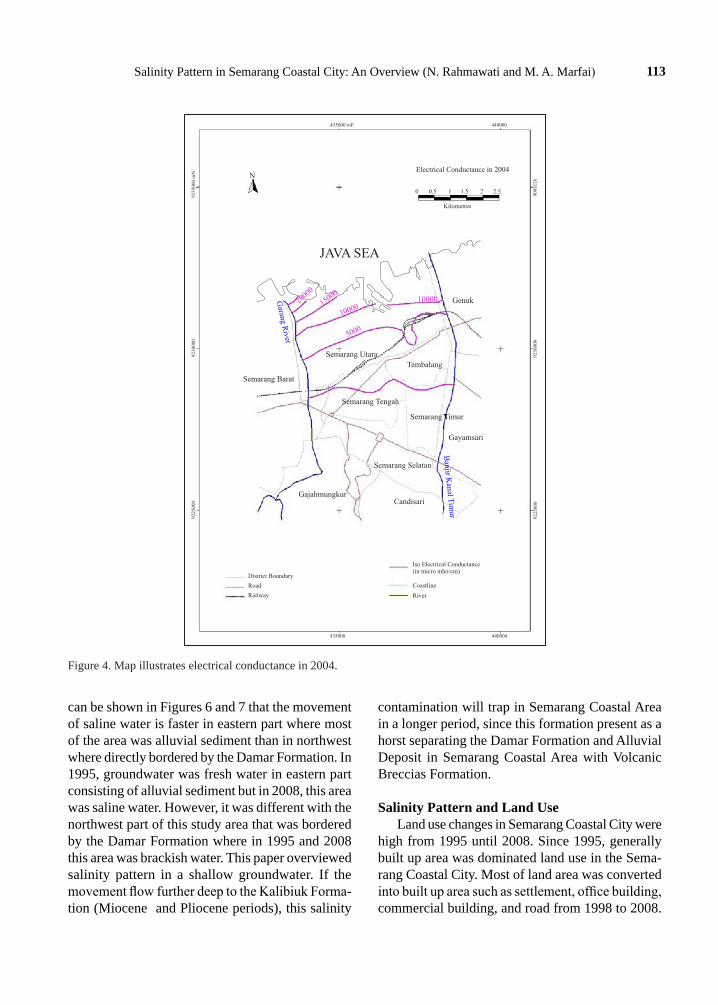
Coastal City. Spatial salinity pattern in 2000 gener-ally shows a rising value of electrical conductivity particularly Semarang Utara Subregency. It can be shown in Figure 3. The extend of saline water in 2004 is also broader than in 2000. The maximum value of electrical conductivity in this year could reach 24800 μmhos/cm including saline groundwa-ter. Most of the area of Semarang Coastal City was occupied by brackish water except in the southern part like Semarang Selatan Subregency. Figure 4 describes salinity pattern in the Semarang Coastal City. In 2008, electrical conductivity value was much higher than previous years that could be supported by an extensive salt intrusion. The maximum value
Figure 2. Electrical conductance in 1995.
Genuk
Electrical Conductance in 2004
0 0.5 1 1.5 2 2.5
Kilometres
Tembalang
Semarang Tengah
Semarang Timur
Gayamsari
Semarang Selatan
Candisari
District Boundary
Road
Railway
435000 440000
435000 mE
9225
000
9230
000
mN
9230
000
922
500
0
9235
000
9235000
mN
440000
Iso Electrical Conductance (in micro mho/cm)
Coastline
River
Gajahmungkur
Semarang Barat
Semarang Utara
JAVA SEA
N
1500
1000
2500
3500
3000
Garang R
iver
Banjir K
anal Tim
ur
112 Indonesian Journal of Geology, Vol. 8 No. 2 June 2013: 107-118
possibility of higher salinity content because these materials can keep better salt concentration due to its porosity than other materials such as sand and breccias in the Damar Formation. In addition, since in the past trapped sedimentation created evapo-rated rocks such NaCl resulted in a higher electri-cal conductance value in coastal area of Semarang (Purnama, 2005). Moreover, in this area, a higher hydraulic conductivity of marine sediments and sedimentation process from river made the pos-sibility of saline water move and spread faster than material of the Damar Formation in southern part that has a lower hydraulic conductivity. This case
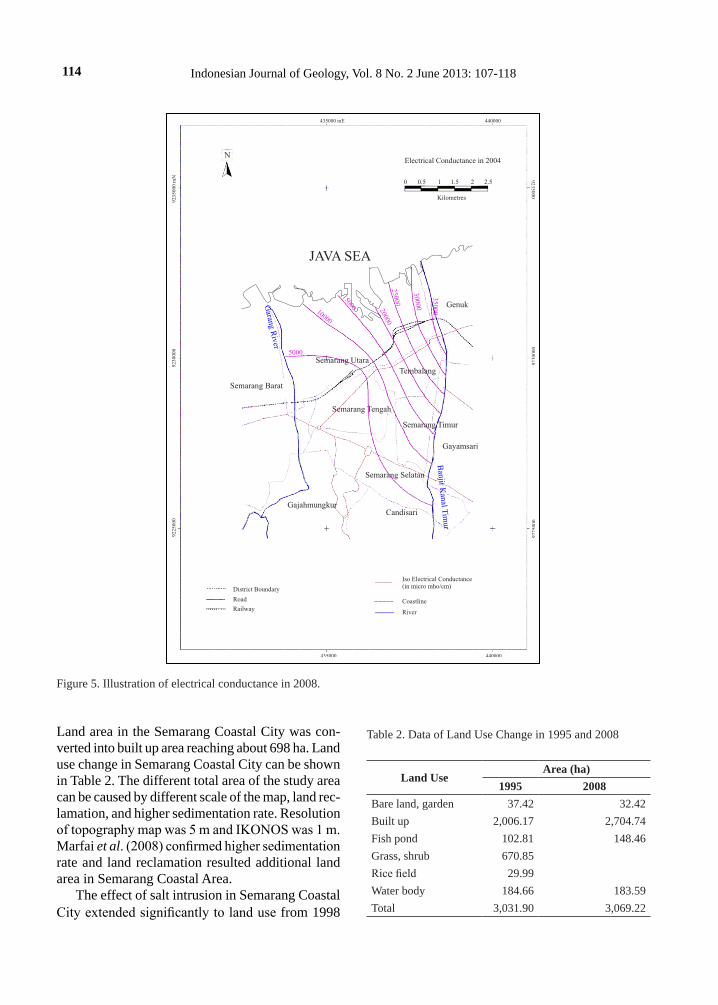
of electrical conductivity in this area was 61800 μmhos/cm. This value was close to brine water. The value of electrical conductance in eastern part was higher than western part of coastal area. Most of the area was brackish water. Some location-illustrated condition of groundwater was saline water particu-larly near Tanjung Mas Harbour. It can be shown in detail in Figure 5. Moreover, propagation of saline water in 1995 until 2008 in Semarang Coastal City can be illustrated clearly in Figures 6 and 7.
Since Semarang Coastal area was dominated by sedimentation of clay and silt materials derived from coastal depositional landform, this material make
Figure 3. Illustration of electrical conductance map in 2000.
Genuk
Electrical Conductance in 2000
0 0.5 1 1.5 2 2.5
Kilometres
Tembalang
Semarang Tengah
Semarang Timur
Gayamsari
Semarang Selatan
Candisari
District Boundary
Road
Railway
435000 440000
435000 mE
9225
000
9230
000
9230
000
9225
000
9235000 9
235000
mN
440000
Iso Electrical Conductance (in micro mho/cm)
Coastline
River
Gajahmungkur
Semarang Barat
Semarang Utara
JAVA SEA
N
1000
15002000
113Salinity Pattern in Semarang Coastal City: An Overview (N. Rahmawati and M. A. Marfai)
can be shown in Figures 6 and 7 that the movement of saline water is faster in eastern part where most of the area was alluvial sediment than in northwest where directly bordered by the Damar Formation. In 1995, groundwater was fresh water in eastern part consisting of alluvial sediment but in 2008, this area was saline water. However, it was different with the northwest part of this study area that was bordered by the Damar Formation where in 1995 and 2008 this area was brackish water. This paper overviewed salinity pattern in a shallow groundwater. If the movement flow further deep to the Kalibiuk Forma-tion (Miocene and Pliocene periods), this salinity
Figure 4. Map illustrates electrical conductance in 2004.
contamination will trap in Semarang Coastal Area in a longer period, since this formation present as a horst separating the Damar Formation and Alluvial Deposit in Semarang Coastal Area with Volcanic Breccias Formation.
Salinity Pattern and Land UseLand use changes in Semarang Coastal City were
high from 1995 until 2008. Since 1995, generally built up area was dominated land use in the Sema-rang Coastal City. Most of land area was converted into built up area such as settlement, office building, commercial building, and road from 1998 to 2008.
Genuk
Electrical Conductance in 2004
0 0.5 1 1.5 2 2.5
Kilometres
Tembalang
Semarang Tengah
Semarang Timur
Gayamsari
Semarang Selatan
Candisari
District Boundary
Road
Railway
435000 440000
435000 mE
9225
000
9230
000
9230
000
9225
000
9235
000
9235000
mN
440000
Iso Electrical Conductance (in micro mho/cm)
Coastline
River
Gajahmungkur
Semarang Barat
Semarang Utara
JAVA SEA
N
1000010000
5000
1500020
000
Garang R
iver
Banjir K
anal Tim
ur
114 Indonesian Journal of Geology, Vol. 8 No. 2 June 2013: 107-118
Land area in the Semarang Coastal City was con-verted into built up area reaching about 698 ha. Land use change in Semarang Coastal City can be shown in Table 2. The different total area of the study area can be caused by different scale of the map, land rec-lamation, and higher sedimentation rate. Resolution of topography map was 5 m and IKONOS was 1 m. Marfai et al. (2008) confirmed higher sedimentation rate and land reclamation resulted additional land area in Semarang Coastal Area.
The effect of salt intrusion in Semarang Coastal City extended significantly to land use from 1998
Figure 5. Illustration of electrical conductance in 2008.
Land UseArea (ha)
1995 2008Bare land, garden 37.42 32.42Built up 2,006.17 2,704.74Fish pond 102.81 148.46Grass, shrub 670.85 Rice field 29.99 Water body 184.66 183.59Total 3,031.90 3,069.22
Table 2. Data of Land Use Change in 1995 and 2008
Genuk
Electrical Conductance in 2004
0 0.5 1 1.5 2 2.5
Kilometres
Tembalang
Semarang Tengah
Semarang Timur
Gayamsari
Semarang Selatan
Candisari
District Boundary
Road
Railway
435000 440000
435000 mE
9225
000
9230
000
9230
000
9225
000
92
35
00
0
92
35
00
0
mN
440000
Iso Electrical Conductance (in micro mho/cm)
Coastline
River
Gajahmungkur
Semarang Barat
Semarang Utara
JAVA SEA
30000
3500010000
5000
15000
25000
20000
Garang R
iver
Banjir K
anal Tim
ur
N

115Salinity Pattern in Semarang Coastal City: An Overview (N. Rahmawati and M. A. Marfai)
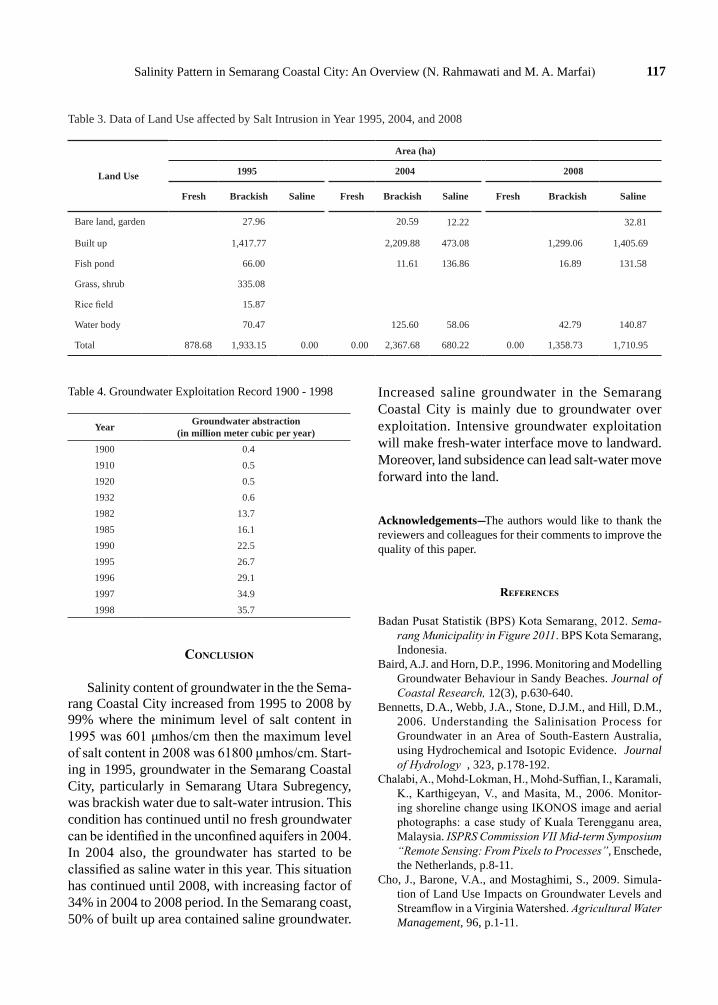
to 2008. In 1998, total area of fresh water reached 878.68 ha and brackish water extended 1,933.15 ha. The area affected by salt intrusion continu-ously 27.96 ha for bare land and garden; 1,417.77 ha for built up; 66 ha for fish pond; 335.08 ha for grass and shrub; 15.87 ha for rice field; and 70.47 ha for water body. Groundwater in these areas was brackish water, no saline water found in Year 1998. Moreover, in 2004, the area affected by salt intrusion increased significantly since in this year saline groundwater was identified and no fresh
groundwater in the Semarang Coastal City. Total area of brackish groundwater was 2,367.68 ha and total area of saline groundwater was 680.22 ha. The area of bare land and garden, built up, fish pond, grass and shrub, rice field, and water body that covered by brackish groundwater continuously was 20.59 ha; 2,209.88 ha; 11.61 ha; and 125.60 ha. Then, the area of saline water occurred in bare land and garden, built up, fish pond, and water body continuously was 12.22 ha; 473.08 ha; 136.86 ha; and 58.06 ha. Groundwater condition in built up
Figure 6. Map showing of salinity in 1995.
Genuk
Salinity in 1995
0 0.5 1 1.5 2 2.5
Kilometres
Tembalang
Semarang Tengah
Semarang Timur
Gayamsari
Semarang Selatan
Candisari
District Boundary
Road
Railway
Coastline
River
Electrical Conductance Class
Fresh Water
Brackish Water
Gajahmungkur
Semarang Barat
Semarang Utara
JAVA SEA
Garang R
iver
Banjir K
anal Tim
ur
N
435000 440000
435000 mE
9225
000
9230
000
9230
000
9225
000
9235
000
9235000
mN
440000

116 Indonesian Journal of Geology, Vol. 8 No. 2 June 2013: 107-118
area including brackish groundwater that reached 80% and 20% of built up area was saline water. Area affected by salt intrusion in the Semarang Coastal City enhanced in 2008, where a half of the City area was occupied by saline groundwater. Groundwater condition in bare land and garden was saline. More than 50% of built up area in Semarang Coastal City was saline groundwater. The saline groundwater in the area of water body such as river and drainage system increased. Total area affected by brackish groundwater was 1,299.06 ha; 16.89 ha; and 42.79
ha continuously for built up, fish pond, and water body. The area affected by saline groundwater for bare land and garden, built up area, fish pond, and water body continuously was 32.81 ha; 1,405.69 ha; 131.58 ha; and 140.87 ha. The area of saline groundwater increased about 1,030.73 ha in 2008. The area affected by salt intrusion in the Semarang Coastal City can be illustrated in Table 3. One of the factors make saline water move forward to the land is groundwater exploitation. Example of groundwater exploitation records can be shown in Table 4.
Figure 7. Illustrates salinity in 2008.
Genuk
Salinity in 2008
0 0.5 1 1.5 2 2.5
Kilometres
Tembalang
Semarang Tengah
Semarang Timur
Gayamsari
Semarang Selatan
Candisari
District Boundary
Road
Railway
Coastline
River
435000 440000
435000 mE
9225
000
9230
000
9230
000
9225
000
9235
000 9235000
mN
440000
Electrical Conductance Class
BrackishWater
Saline Water
Gajahmungkur
Semarang Barat
Semarang Utara
JAVA SEA
Garang R
iver
Banjir K
anal Tim
ur
N
117Salinity Pattern in Semarang Coastal City: An Overview (N. Rahmawati and M. A. Marfai)
Land Use
Area (ha)
1995 2004 2008
Fresh Brackish Saline Fresh Brackish Saline Fresh Brackish Saline
Bare land, garden 27.96 20.59 12.22 32.81
Built up 1,417.77 2,209.88 473.08 1,299.06 1,405.69
Fish pond 66.00 11.61 136.86 16.89 131.58
Grass, shrub 335.08
Rice field 15.87
Water body 70.47 125.60 58.06 42.79 140.87
Total 878.68 1,933.15 0.00 0.00 2,367.68 680.22 0.00 1,358.73 1,710.95
Table 3. Data of Land Use affected by Salt Intrusion in Year 1995, 2004, and 2008
Year Groundwater abstraction (in million meter cubic per year)
1900 0.41910 0.51920 0.51932 0.61982 13.71985 16.11990 22.51995 26.71996 29.11997 34.91998 35.7
Table 4. Groundwater Exploitation Record 1900 - 1998
conclusIon
Salinity content of groundwater in the the Sema-rang Coastal City increased from 1995 to 2008 by 99% where the minimum level of salt content in 1995 was 601 μmhos/cm then the maximum level of salt content in 2008 was 61800 μmhos/cm. Start-ing in 1995, groundwater in the Semarang Coastal City, particularly in Semarang Utara Subregency, was brackish water due to salt-water intrusion. This condition has continued until no fresh groundwater can be identified in the unconfined aquifers in 2004. In 2004 also, the groundwater has started to be classified as saline water in this year. This situation has continued until 2008, with increasing factor of 34% in 2004 to 2008 period. In the Semarang coast, 50% of built up area contained saline groundwater.
Increased saline groundwater in the Semarang Coastal City is mainly due to groundwater over exploitation. Intensive groundwater exploitation will make fresh-water interface move to landward. Moreover, land subsidence can lead salt-water move forward into the land.
Acknowledgements---The authors would like to thank the reviewers and colleagues for their comments to improve the quality of this paper.
references
Badan Pusat Statistik (BPS) Kota Semarang, 2012. Sema-rang Municipality in Figure 2011. BPS Kota Semarang, Indonesia.
Baird, A.J. and Horn, D.P., 1996. Monitoring and Modelling Groundwater Behaviour in Sandy Beaches. Journal of Coastal Research, 12(3), p.630-640.
Bennetts, D.A., Webb, J.A., Stone, D.J.M., and Hill, D.M., 2006. Understanding the Salinisation Process for Groundwater in an Area of South-Eastern Australia, using Hydrochemical and Isotopic Evidence. Journal of Hydrology , 323, p.178-192.
Chalabi, A., Mohd-Lokman, H., Mohd-Suffian, I., Karamali, K., Karthigeyan, V., and Masita, M., 2006. Monitor-ing shoreline change using IKONOS image and aerial photographs: a case study of Kuala Terengganu area, Malaysia. ISPRS Commission VII Mid-term Symposium “Remote Sensing: From Pixels to Processes”, Enschede, the Netherlands, p.8-11.
Cho, J., Barone, V.A., and Mostaghimi, S., 2009. Simula-tion of Land Use Impacts on Groundwater Levels and Streamflow in a Virginia Watershed. Agricultural Water Management, 96, p.1-11.
118 Indonesian Journal of Geology, Vol. 8 No. 2 June 2013: 107-118
Datema, C., 1989. Groundwater Flow Systems in the Northern Coastal Lowlands of West- and Central Java, Indonesia (An Earth-Scientific Approach), Kanisius, Yogyakarta, Indonesia.
Hara, Y., Takeuchi, K., and Okubo, S., 2005. Urbanization Linked with Past Agricultural Land Use Patterns in the Urban Fringe of a Deltaic Asian Mega-city: A Case Study in Bangkok. Landscape and Urban Planning, 73, p.16-28.
Hasan, M.A., Bhattacharya, P., Sracek, O., Ahmed, K.M., von Brömssen, M., and Jacks, G., 2009. Geological Controls on Groundwater Chemistry and Arsenic Mobilization: Hydrogeochemical Study along an E-W Transect in the Meghna Basin, Bangladesh. Journal of Hydrology, 378, p.105-118.
Hugget, R.J., 2007. Fundamentals of Geomorphology. Sec-ond Edition, Routledge, New York, 503pp.
Jeong, C.H., 2001. Effect of Land Use and Urbanization on Hydrogeochemistry and Contamination of Groundwater from Taejon Area, Korea. Journal of Hydrology, 253, p.194-201.
Kuehn, F., Albiol, D., Cooksley, G., Daro, J., Granda, J., Haas, S., Hoffmann, R., and Murdohardono, D., 2010. Detection of Land Subsidence in Semarang, Indonesia, Using Stable Points Network (SPN) Technique. Envi-ronmental Earth Sciences, 60, p.909-921. DOI: 10.1007/s12665-009-0227-x
LaFleur, R.G., 1999. Geomorphic Aspects of Groundwater Flow. Hydrogeology Journal, 7(1), p.78-93.
Lenahan, M.J. and Bristow, K.L., 2010. Understanding Sub-Surface Solute Distributions and Salinization Mechanisms in a Tropical Coastal Floodplain Ground-water System. Journal of Hydrology, 390, p.131-142. DOI:10.1016/j.jhydrol.2010.06.009
Lerner, D.N. and Harris, B., 2009.The relationship be-tween land use and groundwater resources and quality. Land Use Policy, 26(1), p.S265-S273. http://dx.doi.org/10.1016/j.landusepol.2009.09.005
Marfai, M.A. and King, L., 2007. Monitoring Land Subsid-ence in Semarang, Indonesia. Environmental Geology, 53, p.651-659, Springer-Verlag. DOI: 10.1007/s00254-007-0680-3
Marfai, M.A. and King, L., 2008. Potential Vulnerability Implications of Coastal Inundation due to Sea Level Rise for the Coastal Zone of Semarang City, Indonesia. En-vironmental Geology, 54, p.1235–1245. DOI: 10.1007/s00254-007-0906-4
Marfai, M.A., Almohammad, H., Dey, S., Susanto, B., and King, L., 2008, Coastal Dynamic and Shoreline Map-ping: Multi-Sources Spatial Data Analysis in Semarang Indonesia, Environmental Monitoring and Assessment, 142(1-3), p.297-308. DOI: 10.1007/s10661-007-9929-2
Perry, E., Paytan, A., Pedersen, B., and Guadalupe, Velazquez-Oliman, G., 2009. Groundwater Geochem-istry of the Yucatan Peninsula, Mexico: Constraints on Stratigraphy and Hydrogeology. Journal of Hydrology, 367, p.27-40. DOI:10.1016/j.jhydrol.2008.12.026
Poole, G.C., 2010. Stream Hydrogeomorphology as a Physical Science Basis for Advances in Stream Ecology. Journal of the North American Benthological Society, 29(1), p.12-25. The Society for Freshwater Science.
Purnama, Ig. L. S., 2005. Distribusi Air Asin dalam Tanah Dataran Pantai: Studi Kasus di Kota Semarang. PhD Thesis, Faculty of Geography, Universitas Gadjah Mada, Yogyakarta, Indonesia.
Rahmawati, N., 2010. Groundwater Zoning as Spatial Plan-ning in Semarang City. Delta Competition 2010 Report (Innovative Solutions for the Delta: Innovative Ideas for Deltas Cities to Respond to Climate Change Challenges in the Complex Urban Environment). Delta Alliance and Royal Haskoning, Rotterdam, The Netherlands.
Stisen, S., Jensen, K.H., Sandholt, I., and Grimes, D.I.F., 2008. A remote sensing driven distributed hydrological model of the Senegal River basin. Journal of Hydrology, 354, p.131-148.
Summerell, G.K.. Tuteja, N.K., Grayson, R.B., Hairsine, P.B., and Leaney, F., 2006. Contrasting Mechanisms of Salt Delivery to the Stream from Three Different Land-foms in South Eastern Australia. Journal of Hydrology, 330, p.681-697, DOI:10.1016/j.jhydrol.2006.05.002
Thanden, R.E., Sumadirja, H., Richards, P.W., Sutisna, K., and Amin, T.C., 1996. Geological Map of the Magelang and Semarang Sheets, Jawa, scale 1:100:000. Geologi-cal Survey, Bandung.
Todd, D.K. and Mays, L.W., 2005. Groundwater Hydrology. 3rd edition. John Wiley and Sons Inc., 652pp.
Wang, J., Chen, Y., Shao, X., Zhang, Y., and Cao, Y., 2012. Land-use Change and Policy Dimension Driving Forces in China. Present, Trend, and Future, Land use Policy, 29, p.737-749.