salisbury high school
TRANSCRIPT

Salisbury High School
2020 annual report to the communitySalisbury High School Number: 892
Partnership: Orion
School principal: Mrs Sylvia Groves
Governing council chair: Mr Stewart Sparrow
Date of endorsement: 5 March 2021
Signature
Context and highlightsLast year we worked towards achieving a number of goals, individually, in teams and as a whole school providing many opportunities for our students to be successful. Looking at the growth across all year levels, it is clear that our staff make a significant contribution to student learning. SACE completion was well above State average with our school achieving 100% SACE completion for the 8th year in a row. Our A and B grade percentages were high with 71% of our grades falling in this range.The divide between the advantaged and disadvantaged was widened with the covid impact and efforts and results during this time are even more of an achievement. 2020 stands out. It was problematic, challenging and required significant flexibility and adaptability for our staff. The reconfigured Strive Camp was also a huge success and an important part of celebrating the success of our students. We had numerous students receive scholarships in 2019 where Salisbury student representatives flourished in the public arena. These scholarships were strongly supported by the hard work of our teachers. Already we have students who have won scholarships for 2021 and beyond. Our vocational students showed persistence in the challenges this year provided. Access to courses and sites were hampered but final results were strong. 2020 Indicators of success were• Once again, strong Year 12 results – 100% SACE completion – 131 in total, 8 A+, 68 A grades, 207 B grades, an impressive 71.8% of students achieved A and B grades, 6 students achieved ATARs above 90, highest unadjusted score was 94.6. adjusted to 99.3.• 62.6% of our students achieved their SACE using VET.• Every Year 12 student who applied for University gained entry.• High Year 12 retention rate…this showed the strong persistence and commitment of our teachers and is a statistic that we should be very proud of. It highlights our capacity to not give up on our students and help them complete Year 12.• 100% staff involvement in Professional Learning Teams focused on quality task design and explicit lesson planning.• Guided Reading and Levelled Literacy Intervention continued and is supported by an amazing team of English teachers and support staff resulting in significant improvements in reading outcomes for our students.• Successful and much needed Well Being Day• Introduction of an innovative filmed 11th Musical which will premiere early in 2021
2020 has been a year written into the history books for all countries as we have all been impacted by the Corona virus in many different ways. This pandemic provided us with challenges and new opportunities to demonstrate our resilience, strength, unity and ability in continuing to deliver educational excellence resulting in great academic achievements. Our focus to remain student centric has seen us define the meaning of care, compassion and supportive wellbeing with this encompassing our teachers and community to bring everyone together to surround our students for success.
Your Governing Council has working tirelessly via face to face and virtual Zoom meetings to ensure we were doing & considering the best approaches for the school, students and community, all whilst still positioning our school to receive investment as we look forward to the transition of Year 7 into High Schools in 2022. Our partnerships remain strong with the Doorways to Construction and the Northern Adelaide State Secondary School Alliance and we look to leverage our Orion partnerships to refine, develop and enhance our capabilities to meet and exceed the future learning needs of students in the years ahead.
Our school spirit has been outstanding, uplifting and optimistic, with the care and thought for one another shining bright. Our Student Representative Voice continues to provide exciting activities with a respectful balance towards social equality.
The gratitude towards the school throughout this year has been phenomenal, reassuring and well deserved for all teaching professionals as many have gone above & beyond to keep our students engaged, inspired and on task to fulfil their aspirations. For this, we are greatly appreciative of you living our values in the face of uncertainty times and how to rise above when life presents heartache.
Governing council report
2020 Annual Report to the Community1 | Salisbury High School

SACEStage 2 Grades and Percentages 2016 to 2020 A 21.27% 19.41% 16.94% 21.76% 17.76% B 53.72% 48.51% 46.11% 48.84% 54.05% C 23.67% 31.73% 16.53% 29.4% 27.15% D 1.33% 0.37% 1.47% 0% 1.04% E 0% 0% 0% 0% 0% % of Stage 2 A and B grades increased from 70.6% to 71.81%. 8 A+ grades awarded. Highest adjusted ATAR 99.3, highest unadjusted 94.6. 6 students achieved ATAR above 90. Mean ATAR 63.0. 100% SACE completion for 8th successive year. 62.6% of SACE completers participated in VET. Participation in Certificate III courses 44.32%.
Key ActionsFocussed commitment of the whole site agreement around quality teaching and learning. Review Quality Teaching and Learning agreement with staff.Continued focus on collaborative moderation on site and with other schools focussing on consistency and quality task design.Shared and cross marking of common assessments.In Special Education modified SACE is implemented to meet the needs of individual students.PD around CCT utilizing Tactical Teacher critical and creative thinking trainers. LDAM PD for all teaching staff. Intentional targeted lesson planning by all teaching staff using data sets (NAPLAN, PAT, running records, class profiles). Professional Learning with QT Academy to commence establishment of Quality Teaching Rounds. Formation of QTR project team.
Literacy Improvement169 students across year 8 had Running Record Assessments completed. Mean growth 2.2 reading levels.163 students across year 9 had Running Record Assessments completed. Mean growth 1.6 reading levels.
Key ActionsAppoint a cross curriculum literacy leader to work with faculties in relation to developing the capacity of teachers to explicit explicitly teach the text types and academic vocab relevant to their learning areas.Professional learning with Orbis Literacy 7 - 9 for 4 teaching staff.Develop a plan of action for the development of writing across all learning areas.Intentional use of NAPLAN, PAT-R, PAT-M and running records data for development of a class profile to inform cross curriculum classroom practices. Maintain NAPLAN high band reading classes across Years 8-10Running records for all Year 8 and 9 students used to inform guided reading in literacy blocks.All students in Year 8 and 9 below SEA will continue participation in either Levelled Literacy Intervention (LLI) or phonics intervention program.SWD targeted students will participate in a phonics and LLI program dependent on their needs.
Numeracy Improvement
NAPLAN Numeracy Percentage of Students with relative gain 2019 (2020 data not available) 19% low, 62% middle, 19% upperMean 2017 539.7, 2018 536.7, 2019 549.1At or above NMS 2017 90% 2018 77% 2019 89%At or above SEA 2017 51% 2018 48% 2019 47%
Focus on developing teachers’ skills and understanding of the 6 big ideas in number (trusting the count, place value, multiplicative thinking, partitioning, proportional reasoning and generalising)Introduce a numeracy SSO to support teachers during numeracy blocks and manage/prepare resources.Implement weekly Numeracy Blocks using data (PAT Maths and/or NAPLAN Numeracy) to plan for targeted and differentiated numeracy learning.Professional Learning to build the capacity of Maths staff to develop critical problem solving skills in students.
Quality improvement planning
2020 Annual Report to the Community2 | Salisbury High School
2020 was a productive year for Aboriginal Education at SHS, despite the COVID-19 situation. Including: • New Building (received a Kaurna name) • Reconciliation Action Plan (RAP) implemented • 100% SACE completion
COVID did mean that many events did not go ahead (parent teacher night, welcome BBQs, unveiling the new building and RAP, Power Cup and speech day), which impacted on community engagement. Attendance was impacted, however interventions were moved online and the site found ways to continue to support ATSI students.
Data Informed PlanningCurrent achievement level: high bandWork supporting this element: Collect/share data from variety of sources, ATSI learner interventions aligned with SIP, Clear processes with reviewMoving Forward: Data Analysis PD for staff and student, Data Analysis and impact of action shared with whole site, whole site focus on ATSI learners
Tracking and Monitoring of achievementCurrent achievement level: high bandWork supporting this element: Collect/share data from variety of sources, regular review of data at different levels, Snapshots/Report processes, Running Records across 8 and 9, goal setting, RAPMoving Forward: Improve Goal setting, data sharing, improve monitoring goal achievement, sharing with families, AbEd team working collaboratively with teaching staff
Assuring consistent, high quality classroom practiceCurrent achievement level: high bandWork supporting this element: Cultural awareness training, RAP (community engagment expectations), Resourcing for literacyMoving Forward: Greater community engagement, AbEd working with curriculum teams, Line management processes
Apply evidence base learning interventionsCurrent achievement level: high bandWork supporting this element: Regular data collection and anaylsis, Interventions (LLI, ATSI lit, Academic Recovery, Tutoring, Studio, Learning support, CIA) Moving Forward: Numeracy Coaching
Engaging Aboriginal Families as partners in literacy and numeracy learningCurrent achievement level: high bandWork supporting this element: Proactive Communication processes (AbEd mobile, Home Visits, BBQ, Community Events, AbEd support at all meetings, Attendance/Wellbeing follow up, Open Night, SLC night)Moving Forward: Family involvement in literacy development, OP process improvement, quality goal setting
Promoting the continuity of leaningCurrent achievement level: high bandWork supporting this element: Data sharing, AbEd team working with/across site, OP, transitions 7-8 processes, flexibility of learningMoving Forward: Clontarf Implementation, Focus on leaning strategies, Fostering independence, communication with students and families (shifting focus)
Improvement: Aboriginal learners
2020 Annual Report to the Community3 | Salisbury High School

Performance SummaryNAPLAN ProficiencyThe Department for Education Standard of Educational Achievement (SEA) is defined as children and young people progressing and achieving at or above their appropriate year level. For NAPLAN, this is students achieving in proficiency bands 1 or more above the national minimum standard for reading and numeracy. The graph below identifies the percentage of non-exempt students enrolled in the school at the time of NAPLAN testing, who have demonstrated achievement in NAPLAN proficiency bands at or above the SEA for reading and numeracy.
Reading
*NOTE: No NAPLAN testing was conducted in 2020.Data Source: Department for Education special extract from National Assessment Program Literacy and Numeracy (NAPLAN) SA TAA data holdings, August 2020.Reporting of data not provided when less than six students in the respective cohort. A blank graph may imply student count being less than six across all cohorts.
2020 Annual Report to the Community4 | Salisbury High School

*NOTE: No NAPLAN testing was conducted in 2020.Data Source: Department for Education special extract from National Assessment Program Literacy and Numeracy (NAPLAN) SA TAA data holdings, August 2020.*NOTE: Reporting of data not provided when less than six students in the respective cohort. A blank graph may imply student count being less than six across all cohorts.
Numeracy
NAPLAN progressThe data below represents the growth of students from 2017 to 2020 in the NAPLAN test relative to students with the same original score, presented in quartiles.
Reading
Numeracy
NAPLAN progression Year 7-9 State (average)Upper progress group 32% 25%
Middle progress group 52% 50%
Lower progress group 16% 25%
NAPLAN progression Year 7-9 State (average)Upper progress group 19% 25%
Middle progress group 62% 50%
Lower progress group 19% 25%
Data Source: Department for Education special extract from Data Reporting & Analytics Directorate, August 2020.*NOTE: Reporting of data not provided when less than six students in the respective cohort (shown with an asterisk). Due to rounding of percentages, data may not add up to 100%.
Data Source: Department for Education special extract from Data Reporting & Analytics Directorate, August 2020.*NOTE: Reporting of data not provided when less than six students in the respective cohort (shown with an asterisk). Due to rounding of percentages, data may not add up to 100%.
2020 Annual Report to the Community5 | Salisbury High School

No. of students who sat the test^
No. of students achieving in the upper two bands
% of students achieving in the upper two bands**
Reading Numeracy Reading Numeracy Reading NumeracyYear 9 2019 164 164 16 12 10% 7%
Year 9 2017-2019 Average 169.3 169.3 11.7 7.0 7% 4%
This measure shows the number of non-exempt students enrolled at the time of NAPLAN testing who have demonstrated achievement in the relevant NAPLAN higher bands.
*NOTE: No NAPLAN testing was conducted in 2020.
Data Source: Department for Education special extract from NAPLAN SA TAA data holdings, August 2020.^includes absent and withdrawn students.*Reporting of data not provided when less than six students in the respective cohort.**Percentages have been rounded off to the nearest whole number.
NAPLAN upper two bands achievement
2020 Annual Report to the Community6 | Salisbury High School

South Australian Certificate of Education - SACESACE Stage 2 Grades – Percentage of grades that are C- or above for attempted SACE subjects (SEA)
2017 2018 2019 2020 2020100% 99% 100% 99% 99%
Data Source: SACE Schools Data reports, extracted February 2020*NOTE: Reporting of data not provided when less than six students in the respective cohort Data excludes non-A to E and Withdrawn Not Graded subject results.
SACE Stage 2 grade distributionGrade 2017 2018 2019 2020
A+ 1% 4% 3% 3%A 7% 5% 9% 6%A- 12% 8% 10% 12%B+ 13% 12% 11% 13%B 23% 15% 17% 19%B- 13% 19% 21% 21%C+ 15% 20% 18% 11%C 15% 13% 10% 9%C- 2% 3% 2% 3%D+ 0% 1% 0% 1%D 0% 0% 0% 1%D- 0% 0% 0% 0%E+ 0% 0% 0% 0%E 0% 0% 0% 0%E- 0% 0% 0% 0%N 0% 0% 0% 0%
Data Source: SACE Schools Data reports, extracted February 2020*NOTE: Reporting of data not provided when less than six students in the respective cohort. Due to rounding of percentages, data may not add up to 100%.
SACE Completion - Percentage of completers out of those students who had the potential to complete their SACE in October that year
2017 2018 2019 2020 2020100% 100% 100% 100% 100%
Data Source: SACE Schools Data reports, extracted February 2020*NOTE: Reporting of data not provided when less than six students in the respective cohort.
2017 2018 2019 2020Percentage of year 12 students attaining a year 12 certificate or equivalent VET qualification
63% 58% 68% 63%
Percentage of year 12 students undertaking vocational training or trade training
57% 59% 64% 59%
2020 Annual Report to the Community7 | Salisbury High School

SACEStage 2 Grades and Percentages 2016 to 2020 A 21.27% 19.41% 16.94% 21.76% 17.76% B 53.72% 48.51% 46.11% 48.84% 54.05% C 23.67% 31.73% 16.53% 29.4% 27.15% D 1.33% 0.37% 1.47% 0% 1.04% E 0% 0% 0% 0% 0%
% of Stage 2 A and B grades increased from 70.6% to 71.81%. 8 A+ grades awarded. Highest adjusted ATAR 99.3, highest unadjusted 94.6. 6 students achieved ATAR above 90. Mean ATAR 63.0. 100% SACE completion for 8th successive year. 62.6% of SACE completers participated in VET. Participation in Certificate III courses 44.32%.Increase in SACE special provisions for qualifying students to ensure assessment equity and remove disadvantage. Literacy Improvement Year 8169 students had running record assessments completed. Data below shows growth in reading levels across 2020 for the year 8 cohort.
no improvement data available 5.3% 9 no growth 4.1% 7 growth 1 reading level 22.5% 38 growth 2 reading levels 39.6% 67 growth 3 reading levels 13.6% 23 growth 4 reading levels 4.7% 8 growth 5 reading levels 4.7% 8 growth 6 reading levels 3.6% 6 growth 7 reading levels 1.2% 2 growth 13 reading levels 0.6% 1
100.0% 169 students Mean growth of year 8 reading 2020 2.2 levels
Year 9163 students had running record assessments Completed. Independent Readers 21 12.88%No data available 2 1.23%no growth 8 4.91%growth 1 reading level 37 22.70%growth 2 reading levels 68 41.72%growth 3 reading levels 16 9.82%growth 4 reading levels 9 5.52%growth 5 reading levels 2 1.23%
163 100.00%Mean growth of year 9 reading 2020 1.6 levels
School performance comment
2020 Annual Report to the Community8 | Salisbury High School

The Salisbury High School Anti-Bullying Policy is published on the school's website and DayMap. Reports are presented to Governing Council in relation to bullying using feedback from students. The counselling team, consisting of psychologists, social workers and lead teacher counsellors, are involved in this process through counselling and restorative practices.
Parents/student meetings are held to provide supportive structure that reduce the impact of bullying. The school has a strategic direction in developing well-being trough Positive Education Psychology and strategies that are embedded in classroom practice which encourage individuals to flourish. Positive Behaviour for Learning provides an explicit framework for staff and student interactions.
The PD program at Salisbury High School utilises and outsources guest speakers and organisations to further support student wellbeing. Salisbury High School has developed a strong partnership with SAPOL and utilise their services with safe partying and cyber bullying presentations.
Behaviour support comment
Client opinion summaryAt Salisbury High School parents were requested to provide feedback on the school. The feedback was very positive and showed belief and praise for the school operations and the teaching and learning provided by the school. The responses from the surveys provide an opportunity for parents to give feedback which will assist us in reviewing our priorities.Some of the responses are as follows:• 90% of respondents felt that people respect each other at Salisbury High School.• 86% of respondents felt that teachers and students treat each other with respect• 90% of respondents felt their child was important to the school• 84% of respondents felt that school communication as effective• 90% of respondents felt they knew what standard of work the school expected from their child• 80% of respondents felt they had useful discussions about their child’s learning with the school• 98% of respondents talk to their child about what happens at school• 75% of respondents felt they had an opportunity to have input into their child’s learning• 80% of respondents felt their child had a good routine around reading, studying and working at home• 97% of respondents felt that education is important to their child’s future• 81% of respondents felt they were equipped to help their child plan what they will do after they leave school• 56% of respondents felt they would like more help with their child’s learning from the school• 87% of respondents felt the school encourage parents to help their children to learn• 68% of respondents felt the school provided them with useful tips to help students learn from home
Year level 2017 2018 2019 2020
Year 7 10.0% N/A N/A N/A
Year 8 88.8% 91.0% 86.1% 85.0%
Year 9 86.6% 89.1% 86.7% 84.5%
Year 10 86.3% 90.2% 86.2% 83.7%
Year 11 91.1% 91.3% 88.0% 87.3%
Year 12 88.7% 93.0% 89.8% 85.8%
Secondary Other 88.4% 90.4% 86.2% 80.6%
Total 88.2% 90.8% 87.2% 85.0%
Attendance
Data Source: Site Performance Reporting System (SPER), Semester 1 attendance.NOTE: A blank cell indicates there were no students enrolled.
Attendance commentThe school closely monitors student attendance using DayMap, monitoring each student's attendance every lesson. A text message is sent to parents if their child is absent on any given day. Parents can view their child's attendance through the Parent Portal. Attendance concerns are monitored and data on attendance is distributed to care teachers. Rates of attendance are monitored at Snapshots and Student Led Conferences. Chronic absences are reported to the DfE social worker truancy for assistance. Due to the COVID-19 pandemic attendance rates were affected in comparison to previous years. Some parents made the decision to keep their children home and opted for a home-based learning program.
2020 Annual Report to the Community9 | Salisbury High School

Relevant history screeningSalisbury High School maintains criminal history screenings as per DE requirements. Coordinated records, including teacher registrations, are maintained and reviewed in the secure administration drive available to relevant personnel. Volunteers, HPIs and pre-service teachers have been added to the system and are supported by a structured induction process. The on-line application process engages both the requesting organisation and the applicant to complete documentation on-line.
Intended destination
Data Source: Education Department School Administration System (EDSAS) Data extract Term 3 2020.
Leave Reason Number %Employment 22 10.0%Interstate/Overseas 3 1.4%Other 5 2.3%Seeking Employment 9 4.1%Tertiary/TAFE/Training 47 21.4%Transfer to Non-Govt School 7 3.2%Transfer to SA Govt School 34 15.5%Unknown 93 42.3%Unknown (TG - Not Found) 0 NA
2020 Annual Report to the Community10 | Salisbury High School
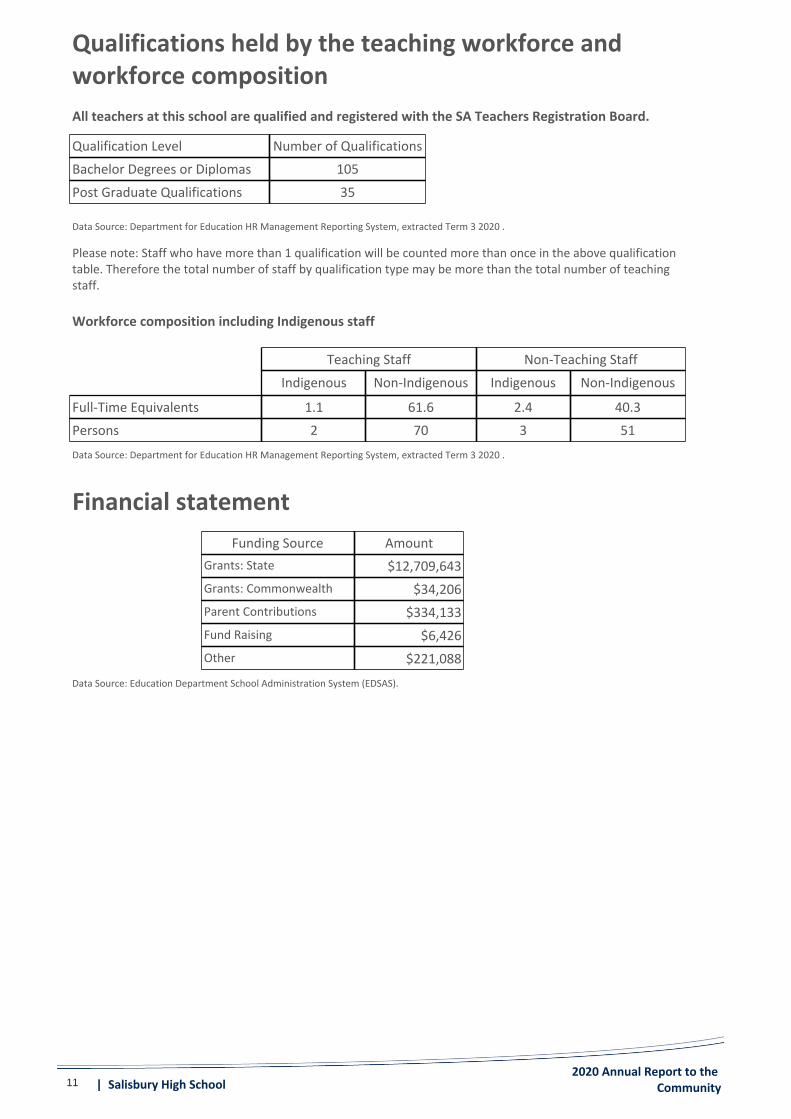
All teachers at this school are qualified and registered with the SA Teachers Registration Board.
Qualification Level Number of QualificationsBachelor Degrees or Diplomas 105Post Graduate Qualifications 35
Please note: Staff who have more than 1 qualification will be counted more than once in the above qualification table. Therefore the total number of staff by qualification type may be more than the total number of teaching staff.
Workforce composition including Indigenous staff
Teaching Staff Non-Teaching StaffIndigenous Non-Indigenous Indigenous Non-Indigenous
Full-Time Equivalents 1.1 61.6 2.4 40.3Persons 2 70 3 51
Data Source: Department for Education HR Management Reporting System, extracted Term 3 2020 .
Data Source: Department for Education HR Management Reporting System, extracted Term 3 2020 .
Qualifications held by the teaching workforce and workforce composition
Funding Source AmountGrants: State $12,709,643Grants: Commonwealth $34,206Parent Contributions $334,133Fund Raising $6,426Other $221,088
Financial statement
Data Source: Education Department School Administration System (EDSAS).
2020 Annual Report to the Community11 | Salisbury High School

2020 School Annual Report: Tier 2 Funding Report*
Tier 2 funding section
Tier 2 category (where applicable to the site)
Briefly describe how the 2020 funding was used to improve the relevant Standard of Educational Achievement (SEA) outcomes
Outcomes achieved or progress made towards these outcomes
Improved wellbeing and engagement Focus on PBL and Positive Education with staffing allocation part of Senior Leader responsibility
Improved engagement and attendance.
Targeted funding for individual students
Improved outcomes for students with an additional language or dialect
Focused LLI support. Sustainment of EAL classes across years 8-12 with expert teachers In-class support provided across curriculum for EAL students below SEA.
Improved literacy levels, NAPLAN, attendance and learner achievement.
Inclusive Education Support Program Student’s. SSO support targeted at literacy in specific classes. Access to targeted learning support timetabled for NEP students
NAPLAN data indicated an improvement in upper levels of growth.
Targeted funding for groups of students
Improved outcomes for - rural & isolated students- Aboriginal students- numeracy and literacy including earlyyears support
First language maintenance & developmentStudents taking alternative pathwaysIESP support
ATSI students were supported through targeted literacy learning intervention program. Reading program implemented 3x weekly for all ATSI Students below SEA focusing on comprehension, fluency and confidence. Implementation of a combined Year 8and 9 literacy class for all ATSI students below SEA in lieu of their language class. The teacher is an expert in teaching literacy. Targeted weekly ATSI numeracy program across Years 8 and 9. Individual ATSI learner achievement review meetings every 5 weeks. ATSI Senior students provided with mentoring and learning support in
100% ATSI students SACE completion. PATR and PATM indicated ATSI improvement 100% ATSI retention at Stage 2. 3 students achieved ATAR and university entry.
Program funding for all students
Australian Curriculum Staffing for Running Records testing for all students across years 8 and 9 in addition to resourcing and release for English teachers and support staff to plan for weekly delivery of Guided Reading and Modelled Reading.
Data from 2020 indicates average growth in year 8 of 2.2 reading levels and in y
Aboriginal languages programs Initiatives
n/a na
Better schools funding Senior school workshops provided during school holidays. Mentoring provided for senior school students. Tuition and learning support provided for students with learning difficulties.
100% SACE completion. Stage 2 retention. 11 Merits across 4 subjects.
Other discretionary funding
Specialist school reporting (as required)
n/a na
Improved outcomes for gifted students n/a na
*Tier 2 funding provides additional resources to support students who are unlikely to obtain the desired outcomes without further support.
