salt deck air !ntakes on jeff (b) hovercraft pressiurized vs ambient deck air !ntakes on jeff (b)...
TRANSCRIPT

N RL Memorandum Report 4368
Salt Survey Comparison ofPressiurized vs Ambient Deck Air !ntakes
on JEFF (B) Hovercraft
R. E. RUSYIN
AAMAInhdustries, Inc.103 Sterren Building, P.O. Box 1100
Columbia, MD 21044
and
F. K. LEPPITE AND R. K. JECK
Environmental Sciences Division
February 2, 1981
This research was sponsored by AALC Program Office, David Taylor Naval ShipResearch and Development Center, Carderock, MD 20034.
,.N.
NAVAL RESEARCH LABORATORYWashington, D.C.
Approved for public receasc; di.iributlkn uninimited,
QI rW 5)"•1

qECUITY CLASSIFICATION OF THIS PAGE (Woen Date Entered)REPOR DOCMENTTIONPAGEEADo INSTRUCTION•SREPORT DOCUMENTATION PAGE BEFORE COMPLETING FORM
T. REPORT NUMBER 12. GOVT ACCESSION NO. S. REClP ENT'S CATALOG NUMBER
NRL Memorandum Report 4368 ý9-4 99'5 d4. TITLE (and Subtit) .. .....- ORT & PERIOD COVEREDFina r ej~~•1• R
( , ALT SURVEY COMPARISON OF PRESSURIZED VYJ -i- prk.oblem
.•MBIENT OECK AIR INTAKES ONJEFF L) 6. PERFORmrNO ORG. REPORT NUMBER__gOVERCRAFT.
_
7, AUTHOR(a) F ....... S. CONTRACT OR GRANT NUMBER(e)
9. PERFORMING ORGANIZATION NAME ANO ADDRESS 10. PROGRAM ELEMENT. PROJECT, TASKAREA & WORK UN:T NUMBERS
Naval Research Laboratory 64567N; WR 0-0103; S0857040;Washington, D.C. 20375 43-1146-B
II. CONTROLLING OFFICE NAME AND %OORESS t2. REPORT OATrF"),
AALC Program Office Fbi~ ,18David Taylor Naval Ship R&D Center, Carderock, MD 2003' 13. NUMBER OF PAGES
5014. MON IT 4,GftN"•-* ',AME & AODSWitt dt.tem, tram Cor.wtJln# Offlc.) "6. SECURITY (rL ASS. (*I Ahe ta"Pat)
('y • t. I. • ! UNCLASSIFIED
. ... OECL ASSI VI CATI ONi DOWN GRAOINOSCHEOULE
16. OISTPIlUTION STATEMENT (of thle Report)
Approved for public release; distribution unlimited.
17. OITRIBVT;ON STATEMENT ( oottec A. nte W u nd 81")t 20, Il t ultse bee Awl)i
1., .kUPPLEMXNTARY NOTE!!
*Presnt address: AMAI" Industries, Inc., 103 Sterrett Building, P.O. Box 1100,Columbia, MD 21044.This research was sponsored by AALC Program Office, David Taylor Naval ShipRcsearch and DevelopmerAt Center, Carderock, NiD 20034.
IS. KCY WORDS (ContlfA.J on 'ewerev* d .i~ too*e~areso *,*fttfr bY W*ch Numer)
Sea salt spray measurementsGa tu'bini air inleL filtersGas turbine walt ingestion
20. ABSTRACT (Ce-Iirwo an #e•v&e* 1414 It a•eceoeay owl Ideflhlt? Nm block ei")
A su•rcy was conducted on AALC JEFF (B) hovercraft to measure salt-spray loadings to anlengine (No. 6) which was pressurized from the bag plenum as compared to the loading to an engine(No. 5) drawing ambient deck air. The average deck ambient salt loading in the small (1-50 pm) sizerange was 2 PPM as compared to 4 PPM in the bag plenum. An average 0.25 PPM salt in air enteredNo. 6. Wash water salinity indicated that the unpressurized engines had 1/10 the loading of the
rmssurized engine on this mission and 2/3 on more "normal" missions (without frequent periods
(Continues)
DD ,Fon 1473 EoiTIo, o, , ov6,SoOS.ETE _ _ >4<54J, 0tOO.LF-O14.4601 ______________________OF __ _______________SECURIITY CLAWPrIlCATIOa OF Th1I1 PAGE (embai Dea tme(

SECURITY CLASSIFICATION OF THIS PAGE (*%on Oata Enteredo
20. Abstract (Continued)
of idling to change salt samplers).
Leakage bypassing the filters had been improved by a factor of 20 since early craft missions,but still dominated over inlet filter design as a source of salt loading to the unpressurized engines.Pressurization eliminated salt due to leakage, but still gave more loading of both salt and sand ascompared to the unpressurized inlets.
The pattern of paint stripping by spray and sand in the lift fan volute provided graphicevidence that proper selection of the source location for lift fan pressurized air could provide muchcie'-.ne engine air. Temperature rise with pressurization was found to be lower than expected. If thepressure loss through the intake filter could also be reduced using cleaner lift fan air (permittingI fewer filto:r elements), then the overall engine performance could be improved over previous pre-'d 1ctions with a pressurized system. With any type of system, agglomerator or barrier type filter pads
j are veqired in order to minimize salt loading by 1-50 pm droplets, but with ambient air these pads-,ould ll be downstream of the spin tubes in order to avoid blockage by sand Drain traps also mustI be desip.:,xi not to plug with sand. A first roughing stage of hook vanes is nee to handle largeq fctuantities of spray 1000 PPM) in drop sizes larger than 50 pm. Final stagd hoo vanes were foundin-ffective.
'RI, C T
INI
ii
ECRT L*PCTIUO -SPG(W. e.tt,(

~L. .........
Accession For
NTIS GTRA&IDTIC AB F71UJ1:2T:'2,2:2ed [i
By-.
/•va?., • * Cod'~s
Dist -
CONTENTS
INTRODUCTION ............................................... 1
SALT SURVEY INSTRUMENTATION ............................... 1
MISSION 085 OPERATIONS ...................................... 2
ENGINE WASH WATER SALINITY DATA ........................... 4
COMPARISON OF PRESSURIZED VS AMBIENT INTAKE AIR ........... 5
SA ND ......................................................... 8
SALT AND SAND SEPARATION BY LIFT FANS ..................... 9
CONCLUSIONS ................................................. 10
LCAC INLET RECOMMENDATIONS ............................... 12
ACKNOWLEDGEMENTS ......................................... 13
APPENDIX A - Instrumentation .................................. A-1
APPENDIX B - Temperature Data: Ambient in Bag Plenum .............. B-1
APPENDIX C - Salt Spray Particle Size Considerations .................. C-1
APPENDIX D - Filter Configurations - Mission 085 .................... D-1
APPENDIX E - Nuclepore and SSCM Salt and Sand Data ................ E-1
APPENDIX F - PMS Deck Data Computer Printouts ... ............... F-1
APPENDIX G( - P1rmission Tuft Tests of Air Flow .................... G-1
iii

LIST OF ILLUSTRATIONS
Page
Figure 1 Plan View Sketch of JEFF (B) 14Figure 2 On Deck Salt Aerosol Instrumentation 15Figure 3 Through the Deck and Duct Probes 15Figure 4 Nuclepore Probe In Intake Plenum 16Figure 5 Plot of Salt Loading for Accel.-Deceleration 17Figure 6 Salt Mass Distribution by Droplet Size 18
Figure 7 Degradation Plot of Engine Nos. 5 and 6 on Mission 085 19Figure 8 Degradation with Various Filters & Pressurization 20Figure 9 Sand Nearly Blocking Agglomerator after 8 Minutes 21Figure 10 Vegetation Collected on Lift Fan Screen 21Figure 11 Paint Stripping in Lift Fan Shows Dirty vs Clean Air 22
APPENDIX FIGURES
Figure A-l Nuclepore Flowmeters and Vacuum Pumps A-3Figure A-2 Electronic Readouts and Onboard Computer A-3Figure C-1 Spray Sizes in the Atmosphere vs PPM and Wind C-2Figure G-1 Tufts Mounted for Air Flow Angle Test G-2
LIST OF TABLES
Table I Summary Mission 085 Sait Survey 23
Table II Engine Comparison-Salt in Wash Water 24Table III No. 5 Ambient vs. No. 6 Pressurized 25
APPENDIX TABLES
Table B-i Temperature Data-Prossurined vs. Ambient U-2Table E-1 Nucle-ore Filter Sea Salt Data F-ITable E-2 Nuclepore Filter Sand DWta F-ITab~le F-) SS•1 Salt Spray Dota E-2
Table E-4 SSCM Sand Data F-2Table F PMS Data for Task 4 F-2Table F PS Data for Task 8 F-4Table F PMS Data for Task 12 F-5Table F rvs Data for Task 20 F-7Table F PMS Data for Task 1$ F-ATable F P! Z DaLa for Task 24 V-9
"iv

SALT SURVEY COMPARISON OF PRESSURIZED vs AMBIENT DECK AIR INTAKESON
JEFF (B) HOVERCRAFT
INTRODUCTION
In the design of the LCAC (Landing Craft Air Cushion), next generationof hovercraft, an important information item is the design of tLe main pro-pulsion gas turbine air intake configuration, particularly the relativemerits of taking air from the inboard deck regions vs taking air from thepressurized region beneath the deck. During April 1980, Salt Survey Measure-ments were conducted by NRL aboard AALC (Amphibious Assault Landing Craft)JEFF (B), to compare the salt loading in the intake air to engine No.6, whichwas pressurized with bag plenum air vs the loading to engine No. 5 whichwas drawing deck air. Additional measurements were made upstream of theNo. 5 intake filter:s for air typical of the deck ambient environment ascompared to the salt loading in the bag plenum near the point of pickup forthe pressurized air being fed to No. 6 engine.
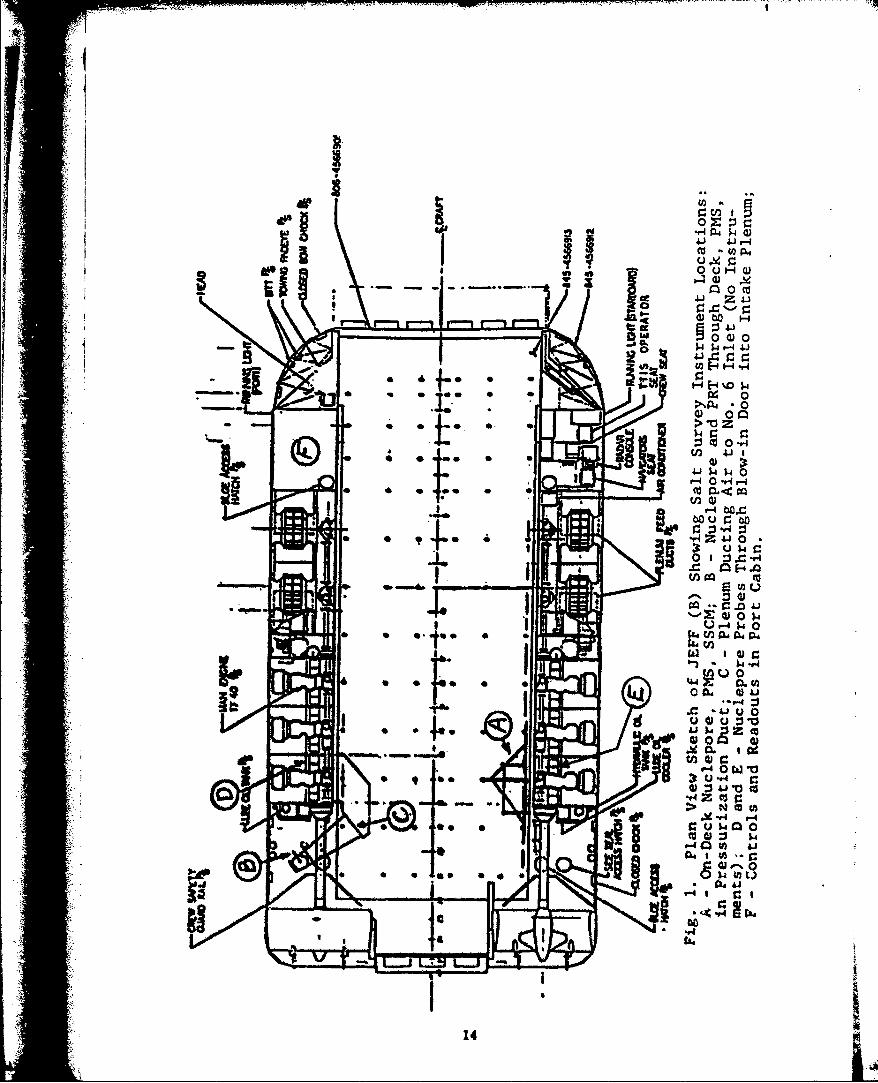
The location of the ambient deck measurements is shown at A in Figure1. Thie bag plenum sampling point is at location B. The pressurized air fromthe bag plenum is fed through the access hatch at B and ducted through"boiler plate" duct work to a plenum at C of Figure I into the intake fil-ters 4 No. 6 engine. Salt spray entering the intake bellmouth of enginesNo.6 and No. 5 are measured with Nuclepore filter probes located througha replawement blow-in door at location D of Figure 1 for No. 6 engine andlocation E for No. 5. (See lnbrumnntation, Appendix A.)
SALT SURVeY INSTRUMEirATION
iThc on-deck instrumentation shown in figi.- ; ,!-its of a Nucleporefilter probe at the top and a Knollenberg (P S, Particle Heasuring iy.t m)electro-optical probe beneath the Nuclepore probe for real time measurementsof the size distribution of salt spray particles in the size range of I to50 ;'^ diameter. All sizes of particles tip to approximately 1 mm are dra-ninto the Instrument wounted below these probes in Figure 2. This instrumentis called the Salt Spray Conductivity Meter (SSCM4). It includes both thesu.Nll droplets wnd the larger quantities of water which are present in drop-lets larger than 50 jim. The water samples collected in the SS(M. can also
*•: he brought t.4. to the laboratory and analyzed for other constituents Inthe sample, particularlr sand. Water collected in this rwinner averaged 72parts per million of salt in air over the entire mission, implying peaks
.3of at leat 1000 parts per million during the heavy loading portions of the
Manuscript Isubrniltc Octobe 277. 19OW.

operations. This infQrmation on the salt content of the large droplets isof value in the design of hook-vane roughing stage and proper drains forthe LCAC intake filtration system. However, in any consideration of filtra-tion of the air going to the engine intakes, the only particles of conse-quence are those smaller than about 50 pm. These are the only particleswhich cause a problem in separating them from the air. They require tight'esh or barrier type filters. All of the instrumentation employed in thissurvey other thane filters Alof to measure the particles generallybetween one and fifty microns diameter. These instruments indicated approxi-mately 2 PPM (parts per million) of salt in the air on deck and 4 PPM inthe bag plenum at location B in sizes smaller than 50 pm.
These instruments at "B" are shown in Figure 3. They consist of aNucleporn pace hextending vertically downward through the deck into the bagplenum space (where the value of 4 PPM was measured) and a PMS probe insertedhorizontally into the elbow of the "boiler plate" duct. This latter probemalfunctioned and did not provide the data hoped for on particles sizes inthis pressurized duct. A Nuclepore probe used through the blow-in doorspace under engine No. 6 at position D of Figure l and engine No. 5 at posi-tion E is shown in Figure 4. This probe is located in the air entering theengine bellmouth directly above the probe shown in Figure 4. When the engineintake plenum is operated unpressurized (as was the case of engines No. 1to 5) leakage can occur either around the edges of the inlet filters so thatsalt may enter the bellmouth near its periphery, missing the instrumentation
i~i probe, or air may leak into the engine intake duct above the bellmouth inthe secondary cooling air space. In either case the leakage salt will not
be registered in the instrumentation probe. The probes will measure onlythe air passing through the intake filters, but will not be representativeof the total air entering the engine. On this mission (085) the probe inNo. 5 engine inlet plenum indicated an average of 0.004 PPM salt in air andthat in the pressurized inlet of No. 6 engine averaged 0.25 PPM. A discus-sion of the effects of leakage and other aspects of these readings willfollow later.
MISSION 085 OPERATIONS
The mission test plan called for obtaining one set of salt survey datain the relatively calm St. Andrews Bay, and passing into the Gk:lf of Mexicoat Lands End. Tle mission then would proceed in the Gulf to Crooked Island,where it would cross the beach and pick up the 'ice Chief of Naval Operations(VCNO) for a demonstration of the craft operations. After off-loading theVCNO, the mission would proceed in the Gulf to a location off Shell Island,
* where the craft would rendezvous with a Surface Effect Ship (SFS) Bli/1lfor joint operations. This rendezvous was not accomplished because BiU/lOwas down for repairs. Interwoven thiroughout the mission test plan were test8for the salt survey, in which the types of operation were, in so far as pos-sible, conducted in 15 minute increments with provision for setting downfor 10 or 15 minutes after each task to permit the NRL scientists to changeNuclepore probes in order to isolate the effects of the various types ofoperations on the salt loading. It hfd been originally planned to cond',ctthe various salt spray tests on four missions wit*h probes located in
2

different locations on the different missions. However, as many as possibleof the types of craft manuever were integrated into this mission in caseit might not be possible to continue missions on following days (as turnedout to be the case). Through the exceptional efforts of the ExperimentalTrials Unit (ETU) most of the more important phases of the test operationswere completed during a 6 1/3 hour mission, one of the longest missionsaccomplished to date. A summary of the operations and measurements takenduring mission 085 are presented in Table I. The times shown in the firstcolumn of Table I indicate the beginning of one-minute time slices in whichthe Bell computer reduced their onboard instrumentation readings to engi-neering unit readouts for use in characterizing the various portions of themission. The particular operation being conducted during each time-intervalblock of Table I started two minutes before the first time shown in eachblock and continued for approximately 15 minutes, ending three minutes afterthe second time shown in each block. The second column labeled "Task Number"identifies the the operational tasks as listed in the test plan and log forthe mission. The next two columns show the wind heading and velocity inknots relative to the craft. The next two columns indicate the craft headingand speed. It had been intended to conduct each phase of the salt surveytest operations at three engine speeds (N2 ). For this mission the minimumand maximum N2 values of 88 and 95 percent of maximum were chosen in orderto minimize the number of tests conducted on this one mission. These valuesof percent of max N2 are shown in the next column of Table I. The next threecolumns present the salt spray measurement data taken on deck. The firstof these columns shows the parts per million of salt in air as measured bythe Knollenberg (PMS) instrument. The second column shows the effectivemass median diameter (MMD) of the particles being measured by this instru-ment in micrometers (pm). The two cases in which Nuclepore data were avail-able from the pressurized bag plenum simultaneously with the deck are shownin the data blocks of time intervals 1030-36 and 1155-1211. In each of thesecases it can be seen that the value in the bag is approximately twice thaton deck. The average of the parts per million (PPM) values measured on
:.ck wa' approximately 2 PPM and in the bag, 4 PPM. The mass mediandiametei: of the particles within the 1 to 50 micron range of these instru--ente fall generally in the ronge of 12 to 40 microns. The next three columnslabeled "Engine Bel•m outh" present the data from the Nuclepore probes mountedunder engines No. 5 A No. 6. The average for the engine No. 5 values is0.004 PPMk and that for No. 6 is 0.25. The third column shows the ratiosof the readings for number 6 to those for nmiber 5 for the various tests.In the lut coiumn is shown the type of operation being conducted under each
* of these tasks.
The hope of cotrparing two engine speeds (K.) for each type of oper-ation succeeded only for the case of proceedinR upwlid at 10 knots. In thiscase the data seem to say that more salt was ingested at the higher engineRPM., both in terms of the readings on deck and that ingested in No. 6 engine.Although one single reading is insufficient to draw any fir* conclusions,these data, on their fac,., indicate that the effect of the higher enginespeed is to increase the salt loading,. However, this period in the testingcoincided with that in which the sea states had increased to so•,P extent,so that the effect of engine RPM (N2) here is not conclusive. The highest
3

loadings were found during the starboard crosswinds and the accel-decel oper-ations. It is reasonable that the starboard crosswinds heading should providemore salt to the starboard side of the deck where this instrumentation waslocated. The increase in salt during acceleration and deceleration has alsobeen documented previously. A typical example of the higher salt loadingsduring acceleration and deceleration compared to normal running is shownin Figure 5. Typical size distribution during acceleration and decelerationare shown in Figure 6. The ordinate indicates the cumulative PPM of saltin particles smaller than each size shown on the abscissa. For example,on the acceleration curve with a total of 10 PPM, the MMD (mass median di-ameter) is 32 pm, meaning that 5 PPM or half of the salt is ia particlessmaller than 32 pm and half is in particles larger than 32 pm. Similarlyduring deceleration the total is 2 PPM and MMD is 19 pm. Detailed Nucleporedata tables are presented in Appendix E and PMS data in F.
ENGINE WASH WATER SALINITY DATA
After each mission each engine is routinely water washed with a "delugewash" of ten gallons of water flushed through in less than one minute whilethe engine is being rotated by the starter. At the end of this first tengallons of deluge wash, a water sample is routinely taken from the combusterdrain valve. This sample's salinity is checked by electrical conductivityto determine whether or not the residual salt in the engine is sufficientlylow so that no additional washing of that engine is required. These dataare tabulated for mission 085 in Table II in the third colunt labeled "Re-sidual in Compressor at End Ten Gallons". For mission 085 an additionalprocedure was carried out whereby a sample was collected during the firstten gallon deluge wash. This procedure was designed to distribute thatsample uniformly throughout the ten gallons in order to me.as-ure the amountof salt removed from the engine in this water. Approximately one half ofthe ten gallons of water introduced was blown out through the exhaust ofeach engine and the remaining portion drained rapidly from the combustordrain valve during approximately one minute. Thib water ejectitn from thedrain valve was collected during several two-second interval-. qpaced approxi-mately five seconds apart throughout this wash cycle "• an atte••pt to obtaina fairly representative sample of the first ten gallon; of :AAh water. Thesalt in these samples is tabulated in the second coluW= of Table II in tertsof the PPMI of salt in the water in the sample averaged over the ten gallnnsof water. Thi three entries in columi two with an ansterlk indicated thosein which the sample was collected fairly undisturbed as compared to thatfrom engiulus 2, 4, end 5 where the water was spla-shing off wire, plpeg, etc.,as it was being collected. The value of 110 PPM shown for enrine No. 2 in-cludes an estimate of the salt lokt by water wash perfornrd during the =is-sion. For this esti=ation the salt was prorated according t, the arcumul-tedrunning tim before and after the underway water w•'sh. The 1 epal salt accum-ulated in each engine is bert represeented by the ;un of that in the firstten galloos of wash water and that remaining at the e-,d of tell goI I"Is(colu= I of Table 1I). Thin total is sh•wn in colum• 5 lab-led "Total byElectrical Conductivity" of salt in the water. The last colu= labeled "Totalby Atomic Absorption" Indicates the anount of salt found bl" a later labora-tory analysis of sodium in the samples using the method of flaae spectroscopy
1,:

called "atomic absoription." This method is less influenced by contaminationin tile sample than is thle electrical conductivity method normally used.it is interesting to note that the two samples from engines No. 4 and No.5 which showed a larger reading by atomic absorption than by electrical con-ductivity are also two of the samples in which thle water was splashing offof the pipes and wires while being collected. This lower reading by conduc-tivity may b*L explained by thle fact that any contamination of a sample byi'ydraulic fluid an~d such being washed off the pipes and wires would tendto conL. iinate the electrodes of the electrical conductivity instrument andcause a reduced reading by the conductivity method, but nbc by atomic absorp-tion.
Since the only wash water salinity data available from most missionsis that such as is shown in column 3 taken at the end of the 10 gallon delugewash, a comparison was made for mission 085 between these readings and thos-eobtained during the first 10 gallons of water wash. The percent of the re-sidual at the end as compared to thle total engine salt :'-ý tabulated in column4 of Table TI. From this column it can be se,-n that the percentage variescons iderably (from approximately 5 to 18%), but the average factor of approx-imately 11.5% can possibly be used as a rough indicato fte mutosalt ingested on other missions where this is the only type of data available.
In order to deter-mine the amount of salt in PPM of air ingested byan engine it is necessary to know not only thle total weight of salt co~lectedin thle wash wAter but also the weight of air drawn into the engine during
th tision for which the wash water sample wos taken. In te nt t the
right-hand side of Table 11 thte average amount of intake air if; shown As22.85 lbs per .second, derived from the computer printouts, of enginveringWi~ts tabulated by Bell. On missioo 085, because of repeated setdow"N for
prbechng h itoa opvrat ltqt t imv inderway wans 3 hours as compared to
idle titw of 3 1/3 hours. Utiring these p4 eriods of idlx the air int. ýV toeach engine wo approximately 1-2 p~ouns per secotW. For thisq mfizsion Yhetotal intakc Air was 190 to.Ns pqr engne. !or this mission tile vAlu! (ifthr- irti" of IPX of 44lt inl water t. I1,,4 ill air isa 5.000. Thevrefore, milti-plying the PPM1-io-.-Oer Value tahula~ed It% Tiblt! 11 by this factor of 5,000
J, ~provides tile data nveded to calculate the average PPM of galt to thv airentelring each eopine.
COVR 01' O PRL ZU SSUr~~T0V AWIM~ INTAKE A1IR
Vje~adte atd$l neto
In "Thhie ill the nvvetarc inigcstcd salt PP~ rc air it the enpgine intakeas c~rulfrd ho Table It im tollulated in colutis 6 anid 7. Since engtincr
"xi. I -3(vl~ich are all llpr~ui id)hve con%1dvrabl, s~pread Inl the dta4shovn in Table 11, the ao'erqrf- of these five enginers war. used whervverportble inl the Cornarisotns rather than corpariog No. 6 presxurized engine
to lik. i alon,. k. exceptlon to thli is for tht, c, .eofteN lpr edigin <Colnvs 8 where therie was no comi'arahle Aana frcnt engines I thru 4 andwhere the Nurlepo)re informat.,on fro= lip. 5 is rt-liable for compariswi tothai from 1114. 6' enpine. 'Me tAtio of silt In No. 6 to thle .,verar- of No%.I thro 5 ttAdicateR app~roximately 8 t., lX higher aalt *oadlng for the

pressurized engine No. 6. It is interesting to note that for the average ofall previous missions in which engine No. 6 was pressurized (shown in column5), there was essentially no difference between the wash water salinity foundin engine No. 6 as compared to the average of engines 1 to 5.
This same pattern is evident in the engine degradation data. In columns2,3, and 4 of Table III are tabulated the engine degradation measured by theloss in the ratio between the intake pressure and discharge pressure of thecompressor. In column 3 the loss rate in percent per hour is shown for mis-sion 085 averaging the degradation over the entire 6.3-hour duration of themission. Since approximately half of this mission was spent at idle whilechanging probes for the salt survey, the total air ingested in the engineswas reduced to the equivalent of a 4.7-hour running time. The total degra-dations for the mission divided by 4.7 hours are shown in column 4. Sincethe degradation in No. 6 engine was probably as great or greater during theidle periods than during the running time, the 6.3-hour values probably shouldbe used for No. 6 engine, wherei.s engines 1 thru 5 had little degradationduring these idle periods so that the values in the 4.7-hour column shouldprobably be used for engines 1 thru 5. On this basis, the ratio of degrada-tion for No. 6 engine to that for No. 5 would be approximately a factor of10 rather than the factor of 14 as shown in Table III. This ratio of ten,possibly fortuitously, is approximately equal to the ratios of Zhd salt in-gested as shown in columns 6 and 7. Engine degradation during the other mis-sions (078-084) in which No. 6 engine was pressurized are shown in column2 of Table III. These values indicate that for those missions in which therewere not repeated setdowns for probe changes (as was the case in mission 085)the degradation in engine No. 6 was only 70Z higher than that for the averageof engines 1 thru 5. This small difference could well be accounted for solelyby the fact that No. 6 engine with its pressurization "boiler plate" couldnot accomodate a second stage agglomerator filter as was used in engines Ithru 5. See Appendix D for filter arrangements. Two possible explanation$for the considerably greater d&gradation of No. 6 engine on mission 085 are(a) that more spray is ingested into the lift fan outboard inlet at lowSspeeds as compared to that at higher speeds, therefore causing a grvateraverage ingestion into the fans and to the pressurized duct of No. 6 Vngineon this mission; or (b) the fact that when the craft stettl-'s down in thewater during idle, water floods the bag plenum where air is blowing hack tothe pressurization duct for No. 6 engine. lurting 1! ft off, when the fanspeeds are increased to raise the craft, this air velocity hecots quite highboth blowing downward onto the water in the bag I=mediately wider tho liftfan and also blowiing along the length of this water surfare until this waterha. ti.. to drain out. In Figure 7 the •ngine degradAtion for cnginev N"o.5 !nd No. 6 are shown throughout mission 085. Here It can be noted that thesgreatest degradation in engine No. 6 occurred at approxirateiy 1314. •cfer-ring back to Table I it should be noted that at approximately t is ticw theingested salt at the engine bellr.)uth in columi 11 Indicates that this isthe first •eriod in which the PPIM ingested into engine No. 6 exceeded the
value of 0.1 PPM, u.hich the original AVCO engine data indicated %as the transi-tion loading for considerably increased degradation of the engine.
6

Effects of Leakage With Unpressurized tntake
It has been found in various wind tunnel tests that what appear to beinsignificant amounts of leakage bypassing a filter can cause more saltloading tban lfte entire salt coming through the filters. An advantage ofthe pressýurized intake system is that any leakage is out into the atmosphererather than into the engine. As mentioned earlier, a cool for determiningthe amount of leakage into the engine intake is piovided by locating theinstrument probes near the center of the engine intake bellmouth, such thatair leaked either around the periphery of the filter or into the engine intakeducting in the secondary cooling air space above the bellmouth is not sampled.Wash water, on the other hand, provides a measure of the total salt ingestedinto the engine during a mission, independent of whether this loading wasthrough the filter or through leaks bypassing a filter. A comparison ofthese two salt loading measurements then provides a measure of leakage presentfor that engine. This comparison in Table III between columns S and 6 or7 indicates that for the pressurized engine No. 6 the Nuclepo:-e probe readessentially the same amount of salt loading as did the salinity of the enginewash water. T'he probable leakage is shown in column 9 as the differencebetween the Nuclepore reading and the wash water salt loading reading. ForFngine No. 5 this probable leakage is 0.009-.011 ppm or a factor of 2 to3 times more salt entering the engine by leak paths than through the filters.This implies that if no leaks had been present, engine No. 5 would have been2 to 3 ti.es cleaner than it was as compared to the No. 6 pressurized engine.This leakage factor of 2 to 3 is a considerable improvement over :he factorsfound by the same Met:hod (comuparison with wash water) during early missionssurveyed in 1978. At that time this ratio was a factor of 30 to 50 timesrx)re leakage than salt through the filters. In othtr words, the loakAge(a7tor has been improved by approxiately a factor of 20.
This factor of 20 improvemmct in lekae iron 1978 to the prese- t tXnts,in corroborated by the -ame f.ctor of! 20 improvment in the engine, dAgrdanzio-ni
between the 1978 missions ind recent inecs, an shown in Figure" 8. It thisfigure it can be nrcti that the original filter% cause a degradattin rateof approxilate 2 1/2 tP 3' per hour. The addittion of air inlet duct ahedsImproved this by apprAsimately •a (ctor or 4. The bottm curves lab-ele107/1058 how approsi~te1y O. iX per hour de-rexartinn rate. While it crahe argrued that this itprovemcnt i% du- to the impreved fllters in the 107/108configurration, it Should be noted hat 4urinr nision 08G5 the port si-de ofthe craft Vas stilM tti enrentltallyV the original bage line' type of filters
on nins2 and 4. The- variiatlio amwong the-egns probab;ly fro= lea4kage,'wan Mufficient to mask 4.4i- iprov-entt on the starhoard Ride using cotnfirura-tilot 107108 ags co•••rrd to the pctrt side wtih the nenrly basic iliter ccm;-figurattin. Thi.s variation fr apparent both In the engine wash water salinity
A - 4dta and in eu-nne degradation data taken orn recent ;-ingionr (078-085).hevereas the forw;ard en-ines I and 2 are expected to he genera)lly cleAer
than the aft engines, 'able T' shovn that on mitsi. n 085 en the starboardside the forward s.RineI aild I tere dirtier thtan the aft engine l. 5.Like•wne, on the port side the forward cngine 2 wag dirtier th4n 4. Ulthport engines 2 aid 14 (using e.nentiailv the original bane line configulrationof filterc) vere cliea-'-r Kan the corresmonding s.tarboard cengInes with the
7

improved filters 107/108. On other missions the order is sometimes similarto this and sometimes totally mixed in other patterns both in the wash watersalinity and in engine degradation. This variability seems to indicate thatvariations in leakage among the engines is a more dominant factor in thesalt loadings than is the difference between the original base line filtersplus a hook-vane stage as compared to the best filter combination which hasbeen tried so far, 107/108. The three conclusions that can be drawn withregard to leakage are (a) that the leakage present in all of the intakesmay not be curable with any reasonable degree of success, particularly duringvariable maintenance, (b) pressurization is a simple solution to the problemof the leaks and (c) if leaks could be totally eliminated the ambient deckair would have been 5 to 8 times cleaner than the pressurized air as usedin missions 078 through 085 (20X on mission 085). See Appendix D, FilterConfigurations.
Bow Ramp Hinge Leakage
Duving previous salt survey missions it was determined that approximatelyhalf of the normal salt loadings to the engines from the ambient deck airis caused by a cloud or fog generated at the hinge of the bow ramp. Watercollects at this low point and is atomized by cushion air leaking up throughthe hinge and through this collected water. The factor by which ambientdeck air through an unpressurized intake is cleaner than the pressurizedsystem as used on missions 078 through 085 would have been approximatelydoubled in favor of the unpressurized engines if the bow ramp hinge leakcould have been sealed. Combining (a) this factor of 2 with (b) the factorof 2 cleaner air already found on deck and (c) the factor of 2 to 3 timescleaner which the unpressurized engine could have been without leaks aroundthe filters, the total advantage of unpressurized deck air vs. pressurizedbag air is approximately a factor of 8 advantage to the unpressurized system(if ideally sealed etc.). For a mission with many setdowns such as 085,
this factor of 8 is probably increased to at least 20. In Table II column8 it was actually a factor of 60 on mission 085.
SAND
During the entire mission 085 approximately one gram of sand was collectedin the SSCM ý.n the deck, probably mainly during the 8 minutes of run overthe sand and beach aieas. This amount of sand averaged over 4.7 hours would4 iddicate 2.5 PPM of sand in the air. if we assume that it was all acquiredduring the 8-minute beach run this would be equivalent to 88 PPM of sandin air for that period. The sizes of this sand were found to be as follows:98% larger than 150 pm diameter, 1.2% between 44 and 150 pm, and 0.5% smallerthan 44 pm. 'Nuch of the sand at the intakes of engines No. 1 thru 5 wasaccumulated in the second stage agglomerator filter. Figure 9 shows a photoof this sand. It appears heaviest near the bottom, but with some distributionall tna way up the face of the filter. Possibly because of the lack of thisfilter stage in engine No.6, sand came through sufficiently so that it wasfound accumulated on the blow-in door and other areas of the intake plenumdownstream of the filters. Tho Nuclepore samplers found an average of 0.09PPM of sand ir. the air to No. 5 engine and 0.23 PPM in No. 6 (2.7 times thatin No. 5). in tasks No. 1 and No. 2 coming off the ramp and In St. Andrews

Bay the deck showed 4.9 times morp sand than that in the bag plenum. In thedesign of inlet filters systems, two important factors to consider are that
(a) an agglomerator or barrier type filter upstream from the spin-tubes may
plug up; and (b) the filter drain system must be designed to handle largequantities of sand without clogging. The exception to these requirementsmay be for the case that the engine inlet air is ducted from a clean areaof the lift fans to be considered below.
SALT AND SAND SEPARATION BY LIFT FANS
Considering the advantages reported here of a pressurized system in
avoiding the problems of leaks bypassing the filters measured against thedisadvantage of the present pressurized inlet having higher salt and sand
loadings, the question naturally follows: Can a pressurized system be de-signed for LCAC which is also cleaner than the ambient deck air inlets?
To answer this question let us consider some of the mechanisms involved in
causing the high salt loadings in the present pressurized air configuration.A visualization of the fog in the present lift fan air can be seen by the
trail of fog exiting from the bow thrusters. When the bow thrusters areturned such that their effluent goes down along the deck, one can visually
see this cloud to be a much more dense spray than is present on the rest
of the deck. On some occasions this cloud can be seen to enter the engine
intakes. At these times the salt loading to the engines is greatly increased.
This same air is being used to pressurize engine No. 6, with the possibleexception that it takes approximately two second for the air to transit from
the lift fans back through the bag to the engine, whereas the bow thruster
air blowing directly down the deck takes about one second to enter on engine
intake. However, any settling of the droplets in going the length of thebag plenum is still negligible for droplets smaller than 50 Jim, the primary
particle size range of interest in causing the problem of salt separationby the intake filters. The settling velocity for the 50pm particles during
the two seconds of traverse through the length of the bag plenum is approxi-mately 5 centimeters per second and for the one micron particles is only
o-.e- hundredth of a centimeter per second. Ten micron droplets are intermediatein settling velocity at approximately 1/2 centimeter per second. All of
these settling velocities are sufficiently slow so that a negligible amountof separation is effected during the two seconds of transit time throughthe bag plenum.
Although some sand and debris are carried over the superstructure and
enter the deck areas, (as evidenced by the sand shown on the second stage
agglomerator pad of Figure 9 and debris collected at the inboard lift faninlets as shown in Figure 10), still. the largest amount of salt, sand, and
debris are entrained from the outboard lift fan inlet as evidenced by thepattern of paint stripping inside the lift fan scroll volute shown in Figure11. In this figure, the paint has been stripped clean from the outboardinlet at the left of the picture to approximately 6 inches inboard of the
center line of the rotor; then the paint is still intact at the right hand
side of the figure and extending beyond the photo for a total distance of
approximately two feet toward the inboard or deck-side lift fan inlet. This
figure graphically demonstrates how much cleaner the lift fan air would be
if it could be ducted from the two feet inboard where the paint is not

4r
stripped or if all lift air were drawn from the inboard side. While it isrecognized that it may be impossible on LCAC craft design to bring air fromthis point, it should be pointed out that on the present JEFF (B) designthere is a passageway approximately 3 by 4 feet ducting this clean air fromthe center line of the lift fans across into the athwart ship stablizer andcushion area (from the location that should be most nearly free of salt andsand loading). A further reduction in loading could undoubtedly be achievedif the fan scrolls and rotation were reversed or the geometry could other-wise be arranged such that the engine inlet air could be ducted from a por-tion of the fan eichaust near the inner radius side of the scroll. Here mostof the salt and sand would have beeTi centrifuged toward the outer radiusand thereby miss the duct pickup point.
If air could be ducted fLom such a location, it is probable that essen-tially all sand and large salt spray droplets would be eliminated beforeentering this duct and the only filtration required might be a single lowpressure drop stage or a Duralife type of filter. This type of configurationwould fairly closely resemble the British Hovercraft SN4 configuratioi, exceptwith the vertical fan shaft rotated to horizontal as in the JEFF (B).
CONCLUSIONS
AALC salt survey conclusions were developed jointly by representativesof NRL DTNSRDC, and ETU based on the conditions: (a) engine No. 6 has oneless barrier (agglomerator) filter than engine No. 5; (b) leakage paths existdownstream of the filters in engine Nos. 1 thru 5 which increase salt loadingsby 2X; (c) a moisture cloud from a bow ramp hinge leak produces salt loadingsir the engine air intakes equivalent to 1/2 that of the total deck loading;and (d) during mission 085, JEFF (B) came off cushion many times during the6-hour mission, thus generating considerably more spray than during themore "norwal" missions 078-084. These conclusions are as follows:
1. Bag air is at least 2X dirtier than ambient air in the 1-5011range. (OPPM vs 2PPN)
2. Engine No. 6 (pressurized) ingested 8X-20X more salt thanengines 1-5.
3. Engine No. 6 compressor pressure ratio degradation is 14Xhigher than engine nos. 1-5.
4. During "Normal" missions 078-084, engine No. 6 compressorpressure ratio degradation was only 702 higher than engineNos. 1-5.
5. Engine Nos. 1-5 still receive 2X more salt through downstreamfilter leaks than through the filters themselves.
6. Lift fan paint degradation patterns con!Irm that ingestionis severe on the outboard side of the volute.
AO

Si ,
7. Potentially, in the JEFF (B) configuration, unpressurizeddeck air would be "cleaner" than bag air by 4-8X if bowhinge leaks and downstream filter leaks could be eliminated.
8. Potentially, in the JEFF (B) configuration, pressurized airv.ould be comparable to deck air in cleanliness only if airfrom the inboard side of the lift fan volute were used.
9. Increasing the number of off-cushion/on-cushion transitionsincreases salt ingestion into the pressurized engine morethan into the unpressurized engine.
10. Engine degradation, when subjected to salt above 0.14 PPM,correlates with AVCO experimental data (TF-35 engine).
11. The pressurized engine data demonstrated that the effectof leakage downst :eam of the filters was eliminated.
12. Leakage downstream of the filters in an unpressurizedsystem may be impossible to reduce below that achievedon JEFF (B) 4ue Lo practical limitations on structuralse~lin,,.
13. Leakage "ppea:-s to dominate over filter design, judgingby tite lower salt loadings in engines 2 and 4 than inNos. 1, 3 and 5 which had tht improved 107/108 filterconfiguration.
14. lArge droplet sizes must be filtered by means of aroughing stage, such as 1 hook-vane filter (for particlesizes greater than ,0 um).
15. Sand ingestion is greater in engine No. 6 than in engine No. 5.
16. Ingestion of debris, sv,ýh as grass, has not yet bei evaluatedrelaive to advantages oO pressurized vs unp-ebsurized engines.
17. Additional tests on JEFF (B) a-u :equired to cimpare engines5 and 6 with identical filters installed in each intake.Future JEFF (M) tests by NAVSSE.. concentrate on improvedcollection of engine w ,tsh vater during first 10 gallons,possibly use one Nuclepote f(.r entire mission in No. 5 andone in No. 6 blow-in door with identical inlet filters inNo. 5 anAl No. 6, and normal missions w/o aet-downs.
18. With a pressurized system se.a-enge fans can be elimiitatedfor the spin tubes.
1Q. During the higher-qea-state portion Gf mission 085 both theNRL bag air thermometer and Pell's TT2 in 06 inlet indicatedthat the temperAtore rise from pressurization was only halfof the AT values which have been used in previous calculations
11
ill ln il ll nl n l lu • i il i iIl! N l~il I I i l~iiln l, nil qll lll•il.. •

of pressurized engine performance. Evaporation of the spraymay cause this cooling. (See Appendix B.)
LCAC INLET RECOMMENDATIONS
1. Use a spray suppression device to reduce the amount of saltspray ingested into the engines.
2. Consider use of a Duralife filter as the final stage in thefilter arrangement.
3. Design consideration must be given to achieving long enginelife in addition to extending the time periods between re-quired water washes.
4. Engine air intakes must be located to minimize spray/sandingestion.
5. Lift tan air intakes must be located to minimize spray/sandingestion; particularly if a pressurized engine air inlet isto be used with air from the plenum.
6. Filter arrangements must provide for easy removal of thevarious filter components to permit daily cleaning.
7. If possible, duct engine int-ake air from deck side of liftfan inner radius (probably low AP single-stage barrier orDuralife would suffice).
8. Tf not possible, then concentrate on sealing against leaksat intake and bow hinge and use unpressurized deck air(predict 5X cleaner on normal mission, 20X with frequentset-downs).
9. If a heavy sand environment is to be handled, hooked vaneand spin tube should be installed ahead of any agglomeratorin order to avoid plugging the agglomerator with sand; drainsmust nlso be designed to avoid plugging with sand.
10. The inlet design should be integrated with the deu1gn ofstructure and propulsion system; e.g.. if lift fan rotationand scrolls were reversed from the Jeff (8), engine airducting could more easily utilize the cleaner air availablefrom the inner radius of the volutes.
11. Previous calculations of pressurizeu engine performanceshould be rechecked taking into account the greater densityof the pressurized air if its temperature rise during thehigher sea state portion of mission 085 is only half of theexpected sAT. (See Conclusion 19 and Appendix B.)
12

ACKNOWLEDGEMENTS
The JEFF (B) officers and crew made exceptional efforts in order toperform during mission 085 most of the salt test tasks which had been sched-uled to be performed over a series of missions. Particular credit is dueLT J. N. Mullican, Officer in Charge of JEFF (B). The Experimental TestUnit (ETU) staff provided support and encouragement under the leadershipof Messrs. Allan Kidd and David Gerzina. All photos are courtesy of Mr.Stuart Bumgardner, ETU. The Bell Aerospace team provided excellent supportin installation of the instrumentation and in engine data computation andprintout - particular thanks to Messrs. Michael Dvornak, Al Coles, LutherCassler, and Chuck Lester. The DTNSRDC program office sponsored the saltsurvey; Mr. James Kordenbrock provided helpful guidance and encouragement.Messrs. Richard Weiss, Joseph Baron and Anthony DiGiovanni of NAVSSES, Phila-delphia, assisted, including late at night, in installing the instrumenta-tion, collecting the engine wash water samples, and performing the atomicabsorption sodium analyses. At NRL Mr. Ron Beattie prepared the PMS instru-mentation and contributed to its installation, including late at night.Mr. David Bressan developed the SSCM instrument. Mrs. Bettie Edger preparedthis report for reproduction.
13
- .- ,-,,--04
n c
U,.)
0)
V) 41 1.
Ur-4
u aJ
ft
144

Fig. 2. Nuclepore (Top), PMS Probe on Antenna Rotor,SSCM (Left) on Deck Plate in Front of No. 5 Inlet.
Fig. 3. Nuclepore Probe Mounted Through Deck (LowerRight of Center); PlC Probe Into PressurizationDuct (Right)
15
II

I •
Fig. 4. Inside Intake Plenum: Nuclepore Probe(Lower Left to Center); Blow-in Door Latched Up(Upper Left); Engine Intake Bellmouth (Top Center);Last-Stage Hook Vane Filter (Right).
16

.II
3 SALT CONCENTRATION ON DECKFOR TYPICAL TEST RUN JEFF(B)TASK #20 MISSION085UPWIND 10 KTS
Deceleration
2
-f. •Incr. N. andS, i _ Acceleration
1325 1328 1332 1336 134U 1344
Time of Day
Fig. 5. Salt Loadings on Deck During Acceleration.on Cushion and Deceleration (PMS Data).
17

BY DROPLET SIZE"CUMULATIVE PPM IN AIRTYPICAL TEST RUN JEFF (B) ACCELEFAT1ON
MISSION 085 AETON DECK
b 0-- /0 DECELERATION-
0
S-0 On Acceleration: Many large droplets
Mr On Deceleration: More small droplets,
'C / fewer large droplets.
0
- Fig. 6. Cumulative Size Distribution ofSpray Particles (3-42 Pm Diameter Range
I Only) during Acceleration and Decelera-, tion; W.", is Shown by + at Top Right
* , Where Half (5 -pm) of Mass is SmaIlerand Half Larger than 32 urm.
S" I s It Il 0 I V IR No
D•IOPLET DIAMETER 'ntI -18

0
00 0nr
11r.0
4) 4490*0
00 000
440 CIO to0
:5~ Ii. -61 > 4o0.0-.-
0 14bw4
19:

73
LEGEND
o HEIL, DONALDSON, ALTAIR~7HEIL* DONALDSON, ALTAIR, INLET DUCTSo CONFIGURATION 107/108
X CONFIGURATION 107/108, 1 HOUR SUB-HUMP PIROUETTES
-!53(P)'
I ~MISSION NUMBER (Port/Stbd)-
43 -'-- A
"-~~ ORIGIt'AL FILTERS -i-01 PLUS HEIL AND AIRjI- - --. -~4 INLET DUCTS
3 2 31
S1v 63EIGXTI - ,1 Suce ef eesae
02

-v A W, . - --.A -"I
Fg10Veeat.ion Deri aolete on LitaScreens.
21~
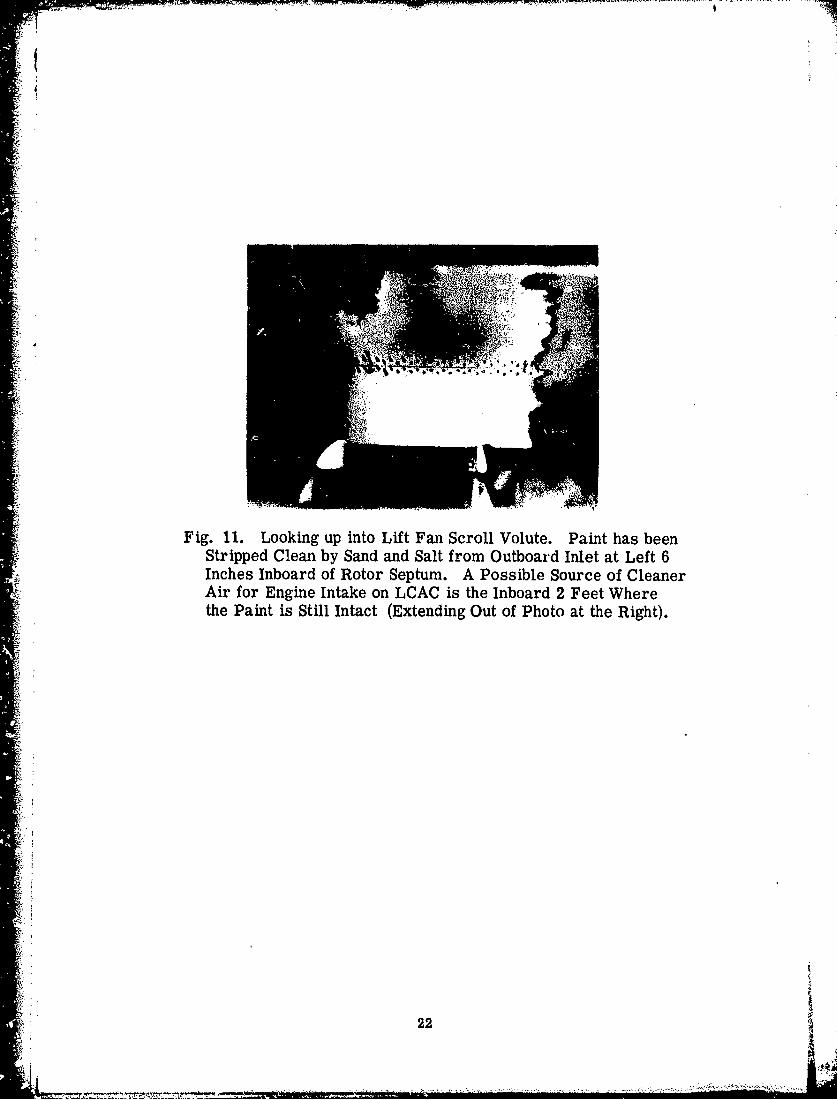
Fig. 11. Looking up into Lift Fan Scroll Volute. Paint has beenStripped Clean by Sand and Salt from Outboard Inlet at Left 6Inches Inboard of Rotor Septum. A Possible Source of CleanerAir for Engine Intake on LCAC is the Inboard 2 Feet Wherethe Paint is Still Intact (Extending Out of Photo at the Right).
22

(00o coo oe 0110 H "0 r-4 J 4.W -r 4-J co A ) -4 C u-4 ( 41 0 .14o r. r. '-4 ' c : 0 0 'W 0 *d -"q C (D4 CL .41 P -04- W44 -r4~ ý:
-W 1040 . ~ cn :3 "0 V r4 u c It Q 1i0'4 ~ ~ 1 (404£.Cl 1~ -~~4
1. 4 t 0 C~0 UR 44 d 4) r4 ý 4-) C -0 a 4) 4)~ ý44)~ ~ 'e 0 Ur44 -40 0 In- z 4J i U-1 -00 '(
0 C 0 4C' :J 4 -4 H 0.-4 0 r4 4j r cn i r4 00- 0) m4 - -D -4 -. D- - -o -- -
-4 tnt-N0100 -W N ~ 0' Ooi 0 - r-4 r-4 V-4 cN r- ri-4
r4) C4 *4 O-C4 4i-i M 00 ~ -4)l C, % r
r-4 %0 ,--i
r- 1- 44 -4 (40~ * C0 0 CI a
PL4 0n C> :1 r 0 0 0
1 LI0 0 01
C4 0\c N 0 C> C N N
P-.'0 U-) ej 00I0 0 -
tg -4 r-4 Z~f 1 ýcO 0 N- 4LC4F-I 9= Z oa4 '
H 4)
w Z~0 0 00j~ C)
E.U~I U) 4 . .
4J OL, uJ ) r c r C 0a N CD' ~* 0 C) t0c~ z 0 C)
in '10 -4 %n. M ~ 04 r-4V-40 4~- Cr(4 I-~
.94~ NN 00 a4 ý4-4 00 ~ -4 P4 N NNý
4)r4 UIt "4 in~ -tn r- Ln ~rtn m'o t 'e4 m -. '4e m
.9-4 U.'- V F-4 V~-. N~V tf4 dN N ~ M -M ~ r 00N
023

Ln V
co 4) 0 0
0 0
0 c00
E-4 V
AL, LL- -4 t- L
PL ~ ~a 0D)nLnto-,0 0O ID mD P-4
E- -
zo Ig u3C
0b CLo 0 t
0" InD
4- d) -4 44to* co 0)0 0ý us*pc - 9' .4
to ID . UI
W Z
24d

14)
0 -d T ~
Coo
00 I
too
L) 0 2
>o
C-44
000
.25

APPENDIX A
INSTRUMENTATION
(1) Nuclepore Filter Probes:
The NRL filter probe consists of a 2" O.D. tube fitted with a filterscreen holder and appropriate inlet cover which permits isokinetic aerosolsampling with a properly adjusted aspiration rate. Air is drawn throughthe filters by vacuum pumps located in the port auxiliary cabin at F inFigure 1. The flow rates are monitored by flow meters also in the portcabin as shown in Figure A-i. The aerosol sample is collected on a 25 mmdiameter Nuclepore filter having a pore size of 0.8 lim diameter. Flow ratesare typically 20-30 liters per minute. Material collected on the filterswas analyzed at NRL by the method of x-ray fluorencence (XRF). The chloridecontent was determined to yield the mass of sea salt present while the sili-con content in each sample was analyzed to estimate the total amount of sandon the filter. Since sea water has a constant ratio of chloride ion to totalsalt, the analytical conversion is straightforward and reliable. Our XRFmethod for Cl has a lower detection limit of approximately 0.5 jig and theprecision at the 0 to 0.5 ppm salt level is * 10% or better. At higher saltloadings the precision drops to ± 20%. Determination of total sand is moredifficult and less accurate. Using silicon, which is the most readily ana-lyzed component in the quartz-type sand found near Panama City, estimatesof sand concentrations may vary as much as 50%. The minerology (and siliconcontent) of beach sand can change drastically in the small size ranges sothat an educated guess has to be made for an "average" factor to scale thesilicon up to the total mass. The precision of the sand concentration valuesfor each engine should be much better than ± 50% since the sizes (and thusminerology) of particles able to penetrate each inlet system should be com-parable. There is no satisfactory way to calibrate the silicon content inthe small-particle fraction of the bulk beach sand since particle densityand shape will effect each mineral type differently. The Nuclepore filterresults are listed in Appendix E.
(2) Sea Spray Conductivity Heter (SSCM):
The deck unit of the SSCM shown in Figure 2 operates by drawing a con-tinuous streau o! "qv.!c air through a seerie of fine mesh screens. Thesemeshes are known to collect 982 of the wet spray and a large percentage ofany drv aerosol particles present in the airstream (871 efficiency for par-ticle's greater than 5 pm diameter). When sufficient spray has been collectedto wet the screens, the collected liquid drains into a small electrical con-ductivity measuring cell. The conductivity is continuously recorded andindicates the rate of accumulation of spray water as well as its salt ccnant.The spray samples are also retained for later chemical analyses and separationof insoluble aerosol components such as sand and dust, The SSCO controller,which was located in the JEFF (B) port cabin, enabled manual or automaticsequencing of distilled water spray bursts into the SSC inlet. These peri-odic washings of the SSC0 meshes with precisely known quantities of distilled
A-1
- - -- S -

777- -r-
water allow measurement of the buildup of dry salt residue on the meshes,even in the absence of heavy spray events.
Based on previous JEFF (B) surveys using the SSCM, during which rela-tively low salt concentrations were recorded on deck, a sensitive conduc-tivity bridge was chosen for this deployment. Unfortunately, during mission085 several direct spray bursts which occurred soon after departure causedover-ranging in the conductivity electronics. As a result, specific corre-lations of salt concentrations with craft operations could not be accom-plished. However, the SSCM did sample wet and dry aerosols throughout themission so that average concentrations of sea salt and sand could be calcu-lated. These results are also listed in Appendix E.
(3) Particle Measuring System (PMS) Axially Scattering Spectrometer Probes(ASSP):
Electrooptical probes (sometimes called Knollenberg probes) are shownin Figures 2 and 3. These probes measure the light forward scattered froman axial laser beam as each particle of salt spray or sand passes throughthe beam. The sizes of the electrical pulses generated by the light pulsesare a function of the individual particle sizes. The pulses are sorted into15 different size bins. These bins represent sizes of 0.3 jim to 7 pm whenthe instrument is operating in one range. Every few seconds the range isautomatically switched to a second range where the 15 bins represent sizesof 1 to 50 pm. The 15 channels of pulses are accumulated usually for 10seconds, then recorded on a digital tape cassette in a Hewlett-Packard 9825Acomputer mounted in the port auxiliary cabin. (See Figure A-2.) This com-puter is programmed to correct the droplet salinity for humidity and printouttables of particle size spectra PPM and mass median diameter (MMOD) as pre-sented in Appendix F.
One PMS probe was mounted in front of the engine No. 5 inlet as shownin Figure 2. In order to align this probe with the air flow along the deckand into the engine inlet, the probe was rotated about its axis by a TV an-tenna rotor. Proper alignment was determined from prior testing with airflow direction tufts as discussed in Appendix G.
Calculation of PPM salt in air requires information on the air flowrate through the probe. This flow was measured by a Thermal Systems Inc.(TSI) hot-wire flowmeter mounted in the probe aft of the luer beam. Cablingfrom this flow sensor was routed with the probe cable through the antennarotor to an electronics box near the probe, then to the port cabin for con-trol and data handling. This equipment is shown in Figure A-2.
(4) Temperature Measurement of Bag Air:
The NRL filter probe which was used to sample salt aerosol In the bagplenum (feeding tir to 06 engine)also contained a digital platinum resistancethermometer (PRT) (Fluke Model 2180) to monitor the temperature of this bagair. The entire PRT was insulated from the stainless steel filter probe.SThe sensing tip was located approximately 18 " below deck level. Temperatureswere displayed in the port cabin and manuall• recorded. The entire systemhad been recently calibrated at NRL to + 0.1 C using a stirred ice/watermixture. I-
A-2

Fig. A-1. Nuclepore Flowineters (on Shelf) andVacuum Pumps Below in Port Cabin.
Fig. A-2. Salt Survey Readouts at Right.Computer Keyboard is Visible at Center.Analog Recorder Below.
A-3

APPENDIX B
TEMPERATURE DATA: AMBIENT IN BAG PLENUM
The NRL temperature measurements are presented in Table B-I along withrelevant data from Bell Aerospace. Bell's estimates of the temperature riseabove ambient by compression through the lift fan to the bag are approxi-mately 13-20°F or 7-110 C. The listed AT's ( C in column 5) for the timeslices 3, 4, 5 and 7 are close to the lower range of these estimates and"are about equal to the theoretical AT for 140 psf pressure. However, thevalues of AT after 1337h decreased by about one-half. Comparing Bell's datafor ambient temperature versus inlet bellmouth temperatures (TT2) for engine#6 also shows the same pattern (of only half as much AT) after 1337h as the
* NRL PRT data. This shift was concurrent with abrupt degradation of #6 engineas shown in Figure 7 and also the start of an -lOX increase in salt loadingto #6 engine. At this time, the craft was operating in the Gulf under highersea state conditions than the previous portion of the mission. An examinationof average TT2 temperatures for engines 1-5 versus ambient does not showthis shift after 1337h.
According to these measurements during the last half of the mission,* computations of pressurized engine efficiencies and power output which assume
a 13-200F rise will generate AT's which are in error by at least a factorof 2. For example, a factor of 1/2 in temperature rise as found in thiscase would increase the air density by approximately 1.32 out of the total5 to 72 density increase from pressurization. The net result is that engineperformance power for the pressurized case is more favorable than previouscomputations would indicate. Ironically, cleaner bag air would reduce thisimprovement.
Considering Bell's TT2 engine inlet bellmouth temperatures as listedin Table B-1, the values for engine 06 during time slices 2-9 average 12.5°F(70C) warmer than the composite average temperatures from engines 1-5. Thisdifference is expected since the air fed into engine #6 has been pressurized.However, the average TTZ's for engine 06 are also 3oC warmer than the NRLbag temperatures; and TT2's for engines 1-5 are approximately 2.20F warmerthan the Bell ambient temperatures. For these 5 engines (non-pressurizedair source), TT2 would be expected to be cooler than ambient due to evapora-tive cooling and possibly cooling due to expansion of air at the filters.We have no ready explanation for this discrepancy. 1he data should be re-examined after determining whether all of the temperature probe readingsare calibrated absolutely or whether all TT2's may be reading 2-3 0 C too high.
* .The engine performance calculations should be restudied to ascertainwhether the apparent jump in degradation of #6 at 1337b may be partiallyan artifact of the method of handling the increased inlet air density bytemperature decrease which occurred at that time.
B-

TABLE B-i
TEMPERATURE MEASUREMENTS - MISSION 085
Temperature °C
Time TT2 ( 3) TT2( 4)Tme Slice Ba() Ambient (2) AT(1)- (2)(im (2) Engine 6 Eng. 1-5
0954 - 38.3 ....1012 - 30.3 ....1015 - 30.2 ....1017 - 30.9 ....1020 - 34.6 ....
1022 (down ramp) 35.0 ....1027 - 31.1 ....1030 3 29.3 21.81 7.5 30.9 23.51035 4 27.2 20.94 6.3 29.6 22.71046 - 25.5 - - -
1052 5 26.8 20.27 6.5 29.0 21.71100 - 27.3 - - -
1155 7 28.7 22.66 6.0 32.4 26.31234 - 27.4 - - -
1305 - 23.4 ....1337 15 23.1 22.53 0.6 26.2 22.4
1417 - 23.7 - - - -
1450 21 23.5 21.29 2.2 26.8 22.71523 - 24.9 - - - -1553 27 24.7 21.66 3.0 28.0 24.51607 28 23.6 20.59 3.0 26.4 23.4
FOOTNOTES:
(1) Temperature measured in bag air by NRL PRT.(2) Ambient air temperature measured near control cabin by Bell.(3) Engine inlet bellmouth temperature (TT2) for engine # 6.(4) Average engine inlet temperatures (TT2) for engine as 1-5.
b-2ii~II

APPENDIX C
SALT SPRAY PARTICLE SIZE CONSIDERATIONS
Two particle size ranges are of importance in hovercraft engine airinlet design. The larger sizes between about 50 pm and 2-3 mn are mist orrain sizes. Only these large drops can be caught in rain gages or "coffeecans" as used by the British in early studies. References to 50 ppm or
.* higher loadings usually refer to this large size range. The smaller sizesbelow 50 pm are invisible to the eye unless in a dense cloud or in an intenselight beam. (A human hair is about 50 pm diameter.) These are the sizesof principal concern in protecting gas turbine engines from salt spray in-gestion. The large size range is primarily of concern in the design of hook-vane roughing stages and drains. The 1-50 Um sizes require a barrier oragglomerator pad or Duralife type of fine filter. Spin tubes are effectivein a mid- to large- size range and for dust and sand.
Instrumentation for mission 085 was chosen to look primarily at the1-50 pm size range, the primary concern in filter design. The only instru-ment which looked also at the larger drops was the Sea Spray ConductivityMeter (SSCM) discussed in Appendix A(2).
The mass median diameter (MO4D) of droplets listed in Appendix F do notinclude the mist-to-rain sizes.
Figure C-I summarizes the MMD found by numerous investigators in theatmosphere, the Naval Air Propulsion Center, Trenton, wind tunnel, and inearlier JEFF (B) measurements,
• -1
LICB......................

WIND -KNOTS 70 am 6010 20 30 50 70
50 II ~/
40- HURRICANEA/
E-* UWSAS DD 9634 (2) JECK 963, HAYES~30 U / c~jJECK SAN NICOLAS
WOODCOCK/~ DURBIN WHITE-'IVBA/ X PHILADELPHIA T454
SLOVETT53HOVERCRAFT
U20 0FFG: 10 KNOT WIND
. .. .. .. .. NAPC PMS OLD CAL.CAE-/
.00 . 0 .. 10 100..
DRY SALT/AIR-471M
Fig.- C-i1. Mass MtedianlDiameters (MMD) of SaiLParticles in Rhe AtmosphereFound by Various Investi-gators Plotted as a Functionof FFM Present W~ind SpeedsTypically Producing theVarious Salt PPM's are Shownat Top.
C-2

IIAPPENDIX D
FILTER CONFIGURATIONS - MISSION 085
Engines No. 1, 3. and 5
5" Peerless Hook VanesAgglomerator Pad (Peerless)Donaldson Cyclone Spin TubeAgglomerator Pad (Peerless)21," Peerless Hook Vanes
Engines No. 2 and 4
5" Peerless Hook VanesAgglomerator Pad (Peerless)Donaldson Cyclone Spin TubeAltair Agglomerator Pad
Engine No. 6
5" Peerless Hook VanesDonaldson Cyclone Spin TubeAgglomerator (Peerless)2½" Peerless Hook Vanes
P..'-

APPENDIX E.
1. Nuclepore Filter Spi Salt Data Mission 085 22 April 1980
PPM SALT
Time No. 5 Engine No. 6 Engine Deck Bag Plenum1023-1032 0.0075 0.1080 2.9391 5.2866
1155-1202 - - 0.7801 1.9817
1234-1243 0.0016 0.0225 - -
1326-1341 - 0.0375 - -
1353-1407 0.0015 0.2922 - -
1414-1429 0.0009 0.2911 - -
1436-1452 0.0011 ....
1509-1523 0.0063 0.6409 - -
1536-1552 0.0063 0.1131 - -
1603-1613 0.0034 0.4815 --
2. Nuclepore Filter Sand Data Mission 085 22 April 1980
PPH SAN?)
Time No. 5 Engine 1o. 6 Engine Deck B4 Plenum
O03-Z 3 0.063 0700.480 0.064
1155-1202 0- .169 0.076
1234-1243 0.139 0.024 - -
1326-1341 - 0.023 - -
1353-1407 0.019 o.006 - -
1414-1429 0.017 0.156 - -
14)6-1452 0.013 - - -
U109-1523 0.028 0.018 - -
1536-1552 0.007 0.033 - -
1603-1613 0.029 0.10? --.
E-1g !.LM

APPENDIX E (CONT'D)
3. SSCH Salt Spray Data
Time Total Salt (mg) Total Air (kg) Avg PPM Salt
1017-1651 37,499 520 72
4. SSC4 Sand Data
Size Ranges (diameter)
Time Total Sand (inm) >150im 150-441im <44ým
1017-1651 0.9253 98.32 1.21 0.51
Sand Concentration - 1.8 ppm @ 6.5 hours total operating time(on deck) 2.5 ppm @ 4.7 hours running time
88 ppm 0 8 •1nutes beach operation
E-2

APPENDIX F
PMS DECK DATA COMPUTER PRINTOUTS
Detailed salt data on the deck are tabulated in this appendix for timeintervals from generally a couple of minutes before to a couple of minutesafter the times tabulated in Table I. The averages of PPM and MMD from thetables of this appendix are tabulated in columns 8 and 9 of Table I labeledDECK PPM (PMS) and MMD, respectively. These computer printouts list 20-second intervals of the PMS probe (ASSP) data. The automatic range switchingalternates between 10 seconds on range 4 (0.3 to 7 pm) and 10 seconds on
SIrange 1 (1 to 50 pm). These two data sets are combined in the computer,using 15 size channels in each range to compute the amcunt of water in drop-lets passing through the probe during each time interval. The last columnlabeled "SWELL", shows the factor by which each liquid droplet diameter isdivided in order to derive the amount of dry salt mass present in eachdroplet. This swell factor is dependent on the salinity of the water in thedroplets, which in turn is dependent on the relative humidity and length oftime the droplets were residing in the atmospher before passing through theinstrument. In the case of hovercraft most of the spray is generated by thecraft about one second before measurement and the humidity is high in thisspray. Therefore the droplets over the deck are assumed to have the salinityof sea water, resulting in a swell factor of 3.5 for all of these runs.
The probe from NAPC, Trenton, was installed in the elbow of the pressur-ization duct to No. 6 engine as shown in Figure 3, but was found to have adead laser which could not be replaced for these runs. Had it provided data,its swell factor would have been reduced to allow for lower humidity in thepressurized air because of adiabatic compressional heating as discussed inAppendix B.
Also required for computation of the PPM of salt in air is the veiocityof the air through the probe. This value is tabulated in column 3 labeledWSPD(M/S) (Wind Speed in Meters per Second).
In columns 5 and 6 are tabulated the mass median diameters of the drysalt and the wet droplets, respectively. The DRY MMD's are used in Table I.
The fourth line of the heading indicates that the calibrAtion curve ofthe NRL probe was that derived from wind tunnel tests at NAPC, Trenton.The fifth line on tasks 28-43 indicates that the NAPC probe caltbraticn wasderived from PMS probe studies previously conducted at SNI (San NicolasIsland) and verified for this probe in the NAPC wind tunnel tests,
I'F-I

TAPE NO.: JEFF-B PROJECT: SFiLT SURVEY
DATE: 22 APR 1980 TASK 1O1. 4, 40KT TD CROOKED I.
DATE PROCESSED: 9/15/80 LI:ING TAPE 102!, TFKI, FILE 5
POST NAPC CALIB. FOR NRL AZSP
RL q P .PT I ME RANGES I.:SPD] ,r,*/S PPM DRY MMD ..IET MMD SWIELL
1049:10 4., 1 23 :. 2 . .. 28r00 9.40 32. 9.0 3.51049:30 4.1 23.-2 0.1704 8.54 29.90 3.51049:50 4,1 2:3.2 0.3:8:13 8.54 29.90 3.51 Bouncy ride1050:10 4, 1 23.2 (.4286 9.40 3".90 3.51 over waves1050:30 45,1 23.2 0.3884 8.54 29.90 3.51 A50: 5 f, 4,1 23.2 0.4949 9.40 32.90 3.51051:i0 4,1 23.2 1.6065 10.26 35.90 3.51051:30 4, 1 2's. 2 1.7424 9.40 32.90 3.51051:50 4 1 23.2 1.3777 9.40 32.90 3.51052:10 4 1 23.2 1.3161 9.40 32.90 3.51052:30 4 1 23.2 1.6005 9.40 S'2.90 3.51052:50 4%1 23.2 1.1793 :.4.40 3 .90 3.51053:10 4,1 23.2 1.6212 9.40 32.90 3.5
1053: 30 4.1 1-.2 9.40 32.9 151053:50 4,1 2*3.2 0.6499 9.40 ?2.90 3.51054:10 4,1 23.2 0.7628 9.40 32.90 3.51054:30 4-,1 2:3.2 (.9676 9.40 32.90 3.51054:50 4,1 23. 2 0. 9434 9.40 32.90 3.5
I059:00 4!.1 23.2 0. E-236 9.40 32.90 3.5I1059: L0 4,1 2S3.2 0.6296 10.26 35.90 3. 51059:40 4!1 23.2 0.7855 9.40 32.90 3.51100:-0 4,1 23.2 0. 6 1.2 35.I I.11 00:.20 4,1 2..2 1.1705 8.54 29.90 3.51100:40 4,1 23.2 O.Q17S- 9.40 32.90 3.51101:00 4.1 23.2 1.2E89 9.40 3.90 3. 5101: 20 4,1 23. 1. 0073 10.26 35.)0 3.51101:4') 4.1 P 3.2 0.8003 9.40 32.90 3.51102: 00 4,1 23.2 1.3671 9.40 22.90 3.51102:20 4,1 C3. 2 0.7404 9.40 3c&.9 . .5
'1102:40 4,1 23. 2 0.9182 9.40 32 .9 0 3.5I IA13:00 4-1 23.2 1.6118 9.40 "M.90 3.5II03:2f! 4i1 I 3.2 c.7346 9.40 32..90 ".5 Spray romtilt103:,40 41.1 23. 2. 3001 9.40 (1 2..910 3, oeVr sitdes
-1104: 00. 4-1E., 3.1215 9.41) 32.9 30 of .0 frt1104-,20 4p1 j.2 2. 4`52'8 9.40 4 2.9i 3.5 onto doi'k.-S104*# :40 4,1 23. a 2.5008 9.40 32.9 0 3.51105:(10 .* 1 C.. 2. 2. 57 I'1• 9i4( 32. 9 (1 : left.S1(15: 0 4.1 1 .1'.2 1.9486 9.40 :32-9,) ýS.5e1105:,40 4t 23.2 (1. 4651 9.40 34.9( 1.5
F-2
, :. . ..... .... ... , . ,,- . .... .. •- •; : x ..•. .... ," i i>

TAPE NO.: JEFF-B PROJECT: SALT SURVEY
DATE: 22 APR ..Pn TASK 10. 4, 40KT TO CROOKED I. Contd.
DATE PROCEESSED: 9.,15/80 USING TAPE 102, TRK1, FILE 5
POST HAPC C:ALIB. FOR NRL FISSP
NRL ASSPTIME RANGES tWPSPt (M/S) PPM DRY MMD WET MMD SWELL
116:0E:0 4,1 23.2 1.3141 9.40 32.90 3.51106:20 4,1 23.2 0.8849 9.40 32.917) 3.51106:40 4,1 23.2 1.5749 9.40 32.90 3.51107:00 4,1 23.2 1.9238 9.40 32.90 3.51107:20 4,1 23.2 3.4141 9.40 32.90 3.51107:40 4,1 23.2 0.5896 9.40 32.90 3.5
1108:00 4,1 23.2 1.5225 10.26 35.90 3.51108:20 4,1 23.2 0.8861 10.26 65.90 3.5 Start
approach1110:10 4,1 19.6 2.1442 9.40 32.90 3. 5 to beach1110:30 4, 1 19.6 1. 0423 9.40 32.90 3.5"1110:50 4,1 19.6 5.9256 9.40 32.90 3.5I11: 1I 4,1 19.6 2.9264 9.40 32.90 3.51111::0 4,1 19.6 1.0:323 9.40 32.90 3.51111:50 4,1 19.6 0..8095 8.54 29.90 3.5111-:10 4,1 19. E. 0.8690 8.54 29.90 3.5
F-3*)

TAPE HO.: JEFF-I:. PR.JECTr SALT SUPIRVEY
DATE: 22 APR 1980 TAS:K 10. 8: .CNO DEMO, G-ULF
DATE PROCESSED: 9/15/80 USIGH TAPE 102` TRK1' FILE 5
POST rAPC: CALIB. FOR NRL ASSP
NRL ASSPTIME RAHGES ,ISFPD ,M'S) PPM DRY MMrr WET MMD SWELL
1155:2,: 4,1 24.7 1.6113 10.26 35.90 3.51155:40 4,1 24.7 0.5189 9.40 32.90 3.51156:00 49 1 24.7 0.4223 9.40 32.90 3.51156:20 4,1 24.7 0.3389 9.40 32.90 3.51156:40 4.,1 24.7 0.4643 9.40 32.90 3.5igh speed 9001157:00 4,1 24.7 0.3280 8.54 29.90 3.5ttirn to left1157:20 4.*1 24.7 0.5253 8.54 29.90 3.9aft sideslip-1157:40 4,1 24.7 0.4625 8.54 29.90 3.pg to left.1158:00 4,1 24.7 1.4810 9.40 32.901158:20 4v1 24.7 0.6896 9.40 32.90 3.51158:40 4•1 24.7 0.2895 8.54 29.90 3.51159:00 4,1 24.7 1.3813 9.40 32.90 3.51159:20 4!11 24.7 1.3860 9.40 32.9(A 3.51159:40 4,1 24.7 0.8208 8.54 29.90 3.5
1208:10 4,1 25.0 0.6005 9.40 32.90 3.51208:30 4,1 25.0 0.9633 9.40 32.90 3.51208:50 4,1 25.0 0.6743 10.26 35.90 3.51209:10 4,1 25.0 1.0773 9.40 32ý90 3.51209:30 4.1 25.0 0.7367 9.40 32.90 3.51209:50 49`1 25.0 0.5034 11.11 38.90 3.51210:10 4,1 25.0 0.7412 9.40 32.90 3.51210:30 4,1 25.0 1.1000 9.40 32.90 3-5High speed run.
1210:50 4,1 25.0 0.5548 9.40 32.90 3.51211:10 4,1 25.0 0.9060 9.40 32.90 3.51211:30 4,1 25.0 1.0937 10.26 35.90 3.51211:50 4.1 25.0 1.6348 9.40 32.90 3.51212:10 4P 1 25.0 1.1234 9.40 32.90 3.51212:30 4ý1 25.0 0.8325 9.40 32.90 3.5S1212:50 4 P1 25.0 0.9860 9.40 32.90•0 3.51213:10 491 25.0 0.4725 9.40 32.90 3.5
F-4
•" • .i. . . • •, • • • • ,..,.•, -. . • .. •,•. .... •• .•• • •., ,. ,'.." - • : . .•'.,-.•. .• , :"'. • .. • :-.. > '-% . . ~...": "s• '. -: : '-":,:-• •' •' ••.. -. .':•? • "T' 7 ? ? " '-';: ' :" • ":"• •; '

TAPE MO.: JEFF-B PROJECT: SALT SURVEY
DATE: 22 APR 1980 TASK NO.12: TO SHELL ISLAND
DATE PROCESSED: 9/15/80 USING TAPE 102, TRKI, FILE 5
POST MAPC CALIB. FOR MRL ASSP NOTE: 40 knot run, rough ride
NRL ASSPTIME RANGES WSPD(M/S) PPM DRY MMD WET MMD SWELL
1236:20 4,1 21.3 0.7166 8.54 29.90 3.51236:40 4w1 21.3 1.4729 8.54 29.90 3.51237:00 4,1 21.3 1.4875 9.40 32.90 3.51237:20 4,1 21.3 1.2443 9.40 32.90 3.51237:40 4,1 21.3 1.1096 9.40 32.90 3.51238:00 4,1 21.3 0.8781 9.40 32.90 3.51238:20 4p1 21.3 3.1293 9.40 32.90 3.51238:40 4,1 21.3 1.8756 9.40 32.90 3.51239:00 4,1 21.3 1.0485 9.40 32.90 3.51239:20 4,1 21.3 1.4151 10.26 35.90 3.51239:40 4,1 21.3 2.0642 9.40 32.90 3.51240:09; 4,1 21.3 1.1578 8.54 29.90 3.51240:20 4,1 21.3 1.4272 8.54 29.90 3.51240:40 4,1 21.3 1.6560 10.26 35.90 3.51241:00 4,1 21.3 2.6970 9.40 32.90 23.51241:20 4,1 21.3 1.6202 10.26 35.90 3.51241:40 4,1 21.3 1.2285 9.40 32.90 3.51242:00 4,1 21.3 1.1249 9.40 32.90 3.51242:20 4,1 21.3 1.8087 9.40 32.90 3.5
1243:20 4,1 21.2 1.4986 10.26 35.90 3.51243:40 4,1 21.2 1.2260 9.40 32.90 3.51244:00 4,1 21.2 1.7597 9.40 32.90 3.51244:20 4,1 21.2 1.0237 9.40 32.90 3.51244:40 4,1 21.2 1.3781 9.40 32.90 3.51245:00 4,1 21.2 1.5127 9.40 32.90 3.51245:20 4.1 21.2 0.9783 9.40 32.90 3.51245:40 4.1 21.2 1.9409 9.40 32.90 3.51246:00 4,1 21.2 1.6725 10.26 35.90 3.51246:20 4,1 21.2 1.9433 9.40 32.90 3.51246:40 4,1 21.2 1.2139 9.40 32.90 3.51247:00 4,1 21.2 1.2689 9.40 32.90 3.51247:20 4,1 21.2 2.0321 9.40 32.90 3.51247:40 4,1 21.2 2.2114 10.26 35.90 3.51248:00 4,1 21.2 1.7342 9.40 32.90 3.514I.20 41l 2t.2 1.3647 9.40 32.90 3.51248:40 4,1 21.2 1.2255 9.40 32.90 3.5
1i49:00 4,1 21.2 1.2988 9.40 32.90 3.5124 9:20 4.1 21.2 2.7665 9.40 32.90 3.5
... .F-.

TAPE NO.: JEFF-B PROJECT:. SALT SURVEY
DATE: 22 APR 1980 TASK NO. 12: TO SHELL ISLAND- Contd.
DATE PROCESSED: 9/15/80 USING TAPE 102, TRK1, FILE 5
POST NRPC CALIB. FOR NRL RSSP NOTE: 40 knot run, rough ride
NRL ASSP
TIME RANGES WSPD(M/S> PPM DRY MMD WET MMD SWELL1249:40 4,1 21.2 1.5141 9.40 32.90 3.51250:00 4,1 21.2 2.3740 9.40 32.90 3.51250:20 4,1 21.2 1.0722 9.40 32.90 3.51250:40 4,1 21.2 1.9821 9.40 32.90 3.51251:00 4,1 21.2 1.9131 9.40 32.90 3.51251:20 4,1 21.2 1.2503 9.40 32.90 3.51251:40 4,1 21.2 1.0536 10.26 35.90 3.51252:00 4,1 21.2 0.9187 9.40 32.90 3.51252:20 4,1 21.2 0.4854 9.40 32.90 3.51252:40 4,1 21.2 0.8868 9.40 32.90 3.5
F-
•--
......................................... ,

TAPE NO.: JEFF-B PROJECT: SALT SURVEY
DATE: 22 APR 1980 TASK NO.20: CRAFT SPEED 10 KT UPWIND
LATE PROCESSED: 9/15/80 USING TAPE 102, TRK1, FILE 5
POST NAPC CRLIB. FOR MRL ASSP NOTE: Craft bounding Cightlyin waves. Sea state 2,
NRL RS:SP occasional white caps.
TIME RANGES IISPD(M/S> PPM DRY MMD WET MMD SWELL1326:40 4,I 10.3 0.0585 7.69 26.90 3.51327:00 4,1 10.3 0.0509 9.40 32.90 3.51327:20 4,1 10.3 0.0426 8.54 29.90 3.51327:40 4,1 10.3 0.0410 11.11 38.90 3.51328:00 4,1 10.3 0.1851 8.54 29.90 3.51328:20 4,1 1('.3 0.1369 9.40 32.90 3.51328:40 4,1 10.3 0.0024 3.41 11.95 3.51329:00 4,1 10.3 0.0235 6.86 24.00 3.51329:20 4,1 10.3 0.0215 8.54 29.90 3.51329:40 4,1 10.3 0.0036 5.17 18.10 3.51330:00 4,1 10.3 0.0415 8.54 29.90 3.51330:20 4,1 10.3 0.0094 7.69 26.90 3.51330:40 4,1 10.3 0.0100 7.69 C. 3.51331:00 4,1 10.3 9.0029 2.54 8.90 3.51331:20 4,1 10.3 0.0452 8.54 29.90 3.51331:40 4,1 10.3 0.0567 8.54 29.90 3.51332:00 4,1 10.3 0.,)455 11.97 41.90 3.51332:20 4,1 10.3 0.0117 7.69 26.S0 3.51332:40 4,1 10.3 0.0140 8.54 29.90 3.51333:00 4,1 10.3 0.0407 11.97 41.90 3.51333:20 4,1 10.3 0.0423 61.03 21.10 3.51333:40 4,1 10.3 0.0074 5.17 18.10 5.5
F-7
7777 77. - .- ", 7!' . '- !"-"

TAPE NO.: JEFF-B PROJECT: SALT SURVEY
DATE: 22 APR 1980 TASK NO.18: CRAFT AT IDLE FACING UPWIND
DATE PROCESSED: 9/15/80 USING TAPE 102, TRK1, FILE 5NOTE: Some spray generated intermit-
POST NRPC CALIB. FOR NRL ASSP tently by water in the bow hinge, andmay ýe the source of some o'r most of
1RL ASSP the 'background spray recorded here.TIME RANGES WSPD(M/S> PPM DRY MMD WET MMD S•1ELL
* 1350:40 4,1 6.2 0.0154 5.17 18.10 3.51 1351:00 4,1 6.2 0.0363 9.40 32.90 3.5
1351:20 4,1 6.2 0.0316 5.17 18.10 3.51351:40 4,l 6.2 0.0184 4.30 15.05 3.51352:00 4,1 6.2 0.0339 4.30 15.05 3.51352:20 4,1 6.2 0.0404 4.30 15.05 3.51352:40 4,1 6.2 0.0080 2.54 8.90 3.51353:00 4,1 6.2 0.0570 5.17 18.10 3.5
1355:00 4,1 6.2 0.0504 6.03 21.10 3.51357:00 4,1 6.2 0.0507 6.86 24.00 3.51359:00 4,1 6.2 0.0196 4.30 15.05 3.51401:00 4,1 6.2 0.0289 5.17 18d10 3.51403:00 4,1 6-.2 0.0295 5.17 18.10 3.51405:00 4,1 6.2 0.0186 6.03 21.10 3.51407:00 4,1 6.2 0.0152 3.41 11.95 3.5
F-8

TAPE NO.: JEFF-B PROJECT: SALT SURVEY
DATE: 22 APR 1980 TASK HO.24: CRAFT SPEED 10 KT UPWIND
DATE PROCESSED: 9/15/80 USING TAPE 102, TRK1, FILE 5
POST NAPC CALIB. FOR NRL ASSP NOTE: Relatively smooth ride,craft bounding only slightly.
NRL RSSPTIME RANGES WSPD(M/S) PPM DRY MMD WET MMD SWELL
1416:00 4,1 9.8 0.4898 10.26 35.90 3.51416:20 4,1 9.8 0.1883 9.40 32.90 3.5
* 1416:40 4,1 9.8 0.2371 9.40 32.90 3.51417:00 4,1 9.8 0.1365 6.86 24.00 3.51417:20 4,1 9.8 0.1338 10.26 35.90 3.51417:40 4,1 9.8 0.2211 8.54 29.90 3.51418:00 4,1 9.8 0.1513 8.54 29.90 3.51418:20 4,1 9.8 0.2150 9.40 32.90 3.51418:40 4,1 9.8 0.2652 8.54 29.90 3.51419:00 4,1 9.8 0.1705 9.40 32.90 3.51419:20 4i1 9.8 0.2331 11.11 38.90 3.51419:40 4,1 9.8 0.1537 8.54 29.90 3.51420:00 4,1 9.8 0.1509 7.69 26.90 3.51420:20 4,1 9.8 0.0778 6.86 24.00 3.51420:40 4.I 9.8 0.1796 8.54 29.90 3.51421:00 4,1 9.8 0.1029 7.69 26.90 3.51421:20 4,1 9.8 3.2121 9.40 32.90 3.5
1421:40 4.1 9.8 0.1114 8.54 29.90 3.51422:00 4.1 9.8 0.1018 7.69 26.90 3.5
1424:00 4.1 10.3 0.0874 9.4A• 32.90 3.51424:20 4.I 10.3 0.0894 7.69 26.90 3.51424:40 4.1 10.3 0.0657 9.40 32.90 3.51425:00 4,1 10.3 0.0747 11.11 38.90 3.5142):20 4*1 10.3 0.1290 10. 2.6 35.90 3.51425:40 4.I 10.3 0.1119 9.40 32.90 3.51426:00 4.1 10.3 0.0937 7.69 26.90 3.51426:20 4,1 10.3 0.1374 10.26 35.90 3.51426:40 4*1 10.3 0.1113 9.40 32.90 3.5"1427:00 4.1 10.3 0.0566 6.03 21.10 3.51427:20 4,1 10.3 0.0501 6.03 21.10 3.5"1427:40 4,1 10.3 0.0Q861 9.40 32.90 3.51428:10 4,1 10.3 0.0372 6.86 24.00 3.514,a8:20 4,1 10.3 0.1013 9.40 32.90 3.5
t148:40 4.1 10.3 0.0118 5.17 18.10 3.51429:*0 4.1 10.3 0.0989 7.69 26.90 3.514Ž9;2 0 4,1 10.3 0.1091 8.54 P9.90 3.51429.40 4*1 10.3 0.0982 .54 9.90
1430:00 4.t1 10.3 0.0547 11.97 41.90 3.5
F-9
APPENDIX G
PREMISSION TUFT TESTS OF AIR FLOW
The instrumentation mount shown in Figure 2 was designed to provideflexibility in adjusting the compound angle for straightest possible airflow through the Nuclepore and PMS probes at a location near the center ofthe aft inlet screen of No. 5 turbine.
The optimum angle for a range of craft operations was determined byinstalling two vertical rows of tufts and recording their angles duringvarious speeds and wind directions on mission 084. These tufts are shownin Figure G-1. One row was located to include the inlet to the SSCM 18inches inboard of the forward inlet screen of No. 5 engine and the secondrow, the inlet to the Nuclepore and PMS probes, 7 inches inboard of the aftinlet screen.
At hover the tuft angles were erratically variable at all craft headingsto the wind. Therefore the hover tasks were omitted from the mission 085high priority tasks.
Underway the tuft angles were generally 5° outboard aft and 5° downwardaft. The instrument mount was then modified to permit this compound anglefor mission 085.
0-1S2.1;

IPSI
Fig. G-l. Tufts Mounted in Front of No. 5 InletScreens for Checking Angles of Air Flow.
G-2