salt intakes in the irish population: estimates and …
TRANSCRIPT

Salt Intakes in the Irish
Population: Estimates and
Trends
Janette Walton PhD
School of Food & Nutritional Sciences, UCC
Irish Universities Nutrition Alliance
(www.iuna.net)
Irish Universities Nutrition Alliance
IUNA (www.iuna.net)
◦ Formal association of nutrition units in:
University College Cork
University College Dublin
University of Ulster
◦ Committed to joint initiatives in education
and research
◦ Jointly carry out dietary surveys

IUNA National Dietary Surveys
Provide databases of habitual food &
beverage consumption in representative
samples of the Irish population:
Data collected at an individual level and
include data on food intake, body weight,
physical activity, socio-demographics,
health & lifestyle, food choice and eating
behaviour
Used for a wide range of applications
relating to both food safety and nutrition

IUNA National Dietary Surveys
Survey Age
Group
Year n
North/South Ireland Food Consumption
Survey (NSIFCS)
18-64 y 1997-1999 1379
National Children’s Food Survey (NCFS) 5-12 y 2003-2004 594
National Teens’ Food Survey (NTFS) 13-17 y 2005-2006 441
National Adult Nutrition Survey (NANS) 18-90 y 2008-2010 1500
National Preschool Nutrition Survey
(NPNS)
1-4 y 2010-2011 500
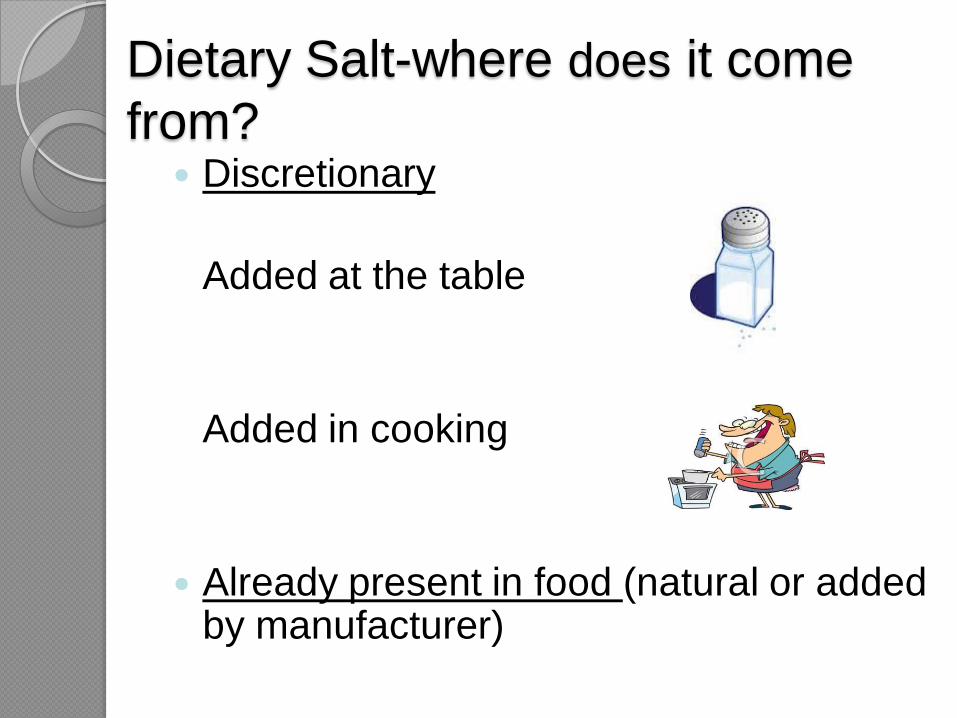
Dietary Salt-where does it come
from? Discretionary
Added at the table
Added in cooking
Already present in food (natural or added by manufacturer)

How do we estimate Salt
Intake? Urinary sodium (Na) excretion- estimation of total salt
intake based on measured Na in urine
Dietary intake (excludes discretionary salt)
Food consumption data converted into nutrient intakes
For IUNA Surveys:
Food Consumption data Food Records
Na content in food Composition tables (UK)
Analytical data from Ireland (FSAI)
Food labels (collected at time of surveys)
◦ Salt (g) calculated by Na (g) X 2.5

Guidelines for Salt Intake
Population targets*
(not regarded as optimal or ideal but an achievable population goal)
Age Salt (g/d)
Population target
0-6 months <1
7-12 months 1
1-3 years 2
4-6 years 3
7-10y 5
>10y 6
(FSAI 2005, SACN 2003)

1997-1999: NSIFCS (18-64y)
8.8
6.2
0
1
2
3
4
5
6
7
8
9
10
Men Women
g/d
Mean daily salt intake (dietary)

1997-1999: NSIFCS (18-64y)
29%
26% 8%
7%
5%
5%
5% 4%
4% 7%
Contribution of food groups to salt intake
Meat/fish
Breads
Milk/milk products
Soups/sauces
Spreading fats
Vegetables/ veg dishes
Breakfast cereals
Biscuits/cakes/pastries
Within the meat/fish category, cured/processed meats contributed
19%

2008-2010: NANS (18-90y)
8.0
6.9
5.9
5.0
0.0
1.0
2.0
3.0
4.0
5.0
6.0
7.0
8.0
9.0
10.0
18-64y >65y
g/d
Mean daily salt intake (dietary)
Men
Women

2008-2010: NANS (18-90y)
30%
22% 9%
9%
3%
7%
4% 6%
5% 5%
Contribution of food groups to salt intake (18-64y)
Meat/fish
Breads
Milk/milk products
Soups/sauces
Spreading fats
Vegetables/processed veg
Breakfast cereals
Within the meat/fish category, cured/processed meats contributed 18%
For those aged 65y and over, similar findings with the exception of breads
and spreading fats contributing more (26% and 6% respectively) and
savouries contributing less (2%) to salt intakes than 18-64y olds

8.1
7.0
0
1
2
3
4
5
6
7
8
9
10
NSIFCS (2001) NANS (2011)
g/d
↓ 1.1g
Salt intake (dietary) in Irish adults between
NSIFCS 2001 and NANS 2011

Contribution of key food groups to salt intake in Irish adults (18-64y)between NSIFCS (2001) and NANS (2011)
Food group NSIFCS
(2001)
NANS
(2011)
Difference
Salt intake (g/d)
Breads 2.10 1.50 ↓ 0.60
Cured/processed meats 1.68 1.33 ↓ 0.35
Spreading fats 0.48 0.23 ↓ 0.25
Ready-to-eat breakfast cereals 0.35 0.23 ↓ 0.10
Milk/milk products 0.68 0.60 ↓ 0.08
Processed vegetables/veg dishes 0.10 0.28 ↑0.18
Savouries including pizza/pasta
dishes
0.24 0.33 ↑0.09
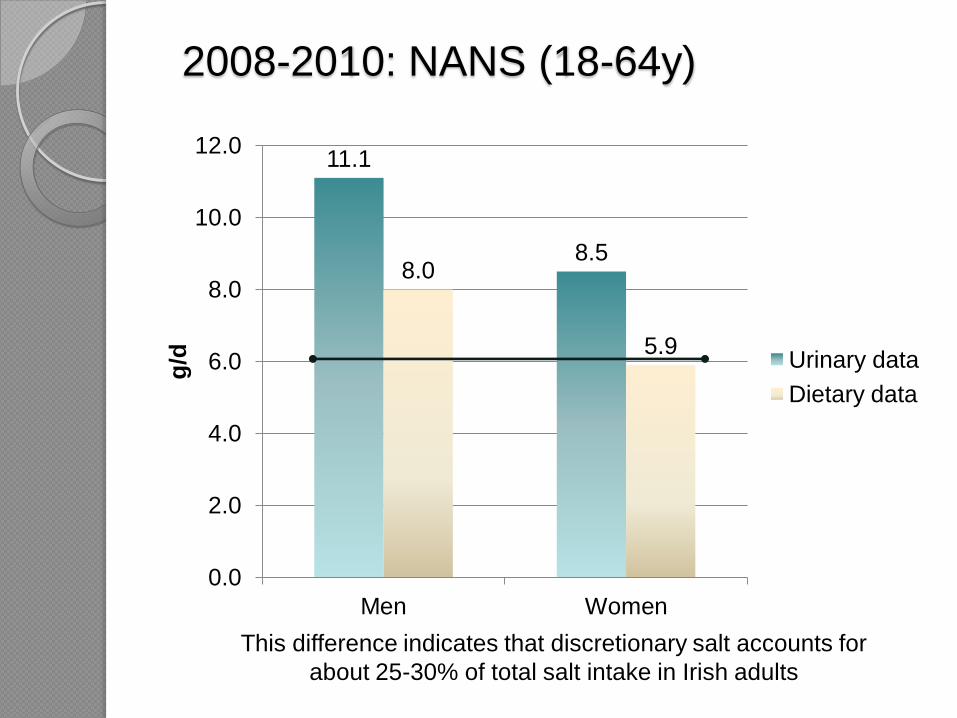
2008-2010: NANS (18-64y)
11.1
8.5 8.0
5.9
0.0
2.0
4.0
6.0
8.0
10.0
12.0
Men Women
g/d
Urinary data
Dietary data
This difference indicates that discretionary salt accounts for
about 25-30% of total salt intake in Irish adults

2005-2006: NTFS (13-17y)
7.2
5.4
0
1
2
3
4
5
6
7
8
9
10
Boys Girls
g/d
Mean daily salt intakes (dietary)

2005-2006: NTFS (13-17y)
28%
20%
8%
9%
3% 3%
7%
9%
9% 4%
Contribution of food groups to mean daily salt intake
Meat/fish
Breads
Milk/milk products
Soups/sauces
Spreading fats
Vegetables/processed veg
Breakfast cereals
Biscuits/cakes/confectionary
Within the meat/fish category, cured/processed meats contributed
20%

2003-2004: NCFS (5-12y)
4.9
6.0 6.6
4.6 5.3
6.3
0
1
2
3
4
5
6
7
8
9
10
5-6y 7-10y 11-12y
g/d
Mean daily salt intakes (dietary)
Boys
Girls

2003-2004: NCFS (5-12y)
25%
21%
11% 6%
3% 3%
8%
10%
6% 7%
Contribution of food-groups to mean daily salt intakes
Meat/fish
Breads
Milk/milk products
Soups/sauces
Spreading fats
Vegetables/ processed veg
Breakfast cereals
Biscuits/cakes/pastries/confectionary Savouries eg. pasta dishes/pizza
Other
Within the meat/fish category, cured/processed meats contributed
17%

2011-2012: NPNS (1-4y)
2.4
3.2 3.4 3.8
0.0
1.0
2.0
3.0
4.0
5.0
6.0
7.0
8.0
9.0
10.0
g/d
Mean daily salt intake (dietary)
1y 2y 3y 4y

2011-2012: NPNS (1-4y)
27%
12%
21%
6% 4%
5%
6%
9%
4% 8%
Contribution of food groups to mean daily salt intake
Meat/fish
Breads
Milk/milk products
Soups/sauces
Spreading fats
Vegetables/processed veg
Breakfast cereals
Biscuits/cakes/confectionary Within the meat/fish category, cured/processed meats contributed
16%

Conclusions
Using dietary data:
Cured/processed meats & breads-two main contributors to salt intakes for most population groups
Mean daily salt intake in adults ↓ by 1.1g between 2001 and 2011
↓ salt intake reflects ↓ in salt content of many foods
(in particular breads, cured/processed meats, spreading fats and breakfast cereals)
Overall:
Salt intakes are higher than targets for the Irish population
Discretionary salt intake in Irish adults is estimated to be about 25-30% of total salt

Acknowledgements
IUNA survey teams in UCC and UCD
led by Prof Albert Flynn and Prof Mike
Gibney
Ms Rachel Moloney
Ms Miriam Giltinan
Department of Agriculture, Food and
the Marine (DAFM)
Food Safety Authority of Ireland