sam - cowen physicscowenphysics.com/wp-content/uploads/2015/04/171761-unit-h156-02... · light...
TRANSCRIPT
© OCR 2014 H156/02
[601/4742/8] DC (…) Turn over
AS Level Physics A H156/02 Depth in physics Sample Question Paper
Date – Morning/Afternoon Time allowed: 1 hour 30 minutes
You must have:
• the Data, Formulae and Relationships Booklet
You may use: • a scientific calculator
* 0 0 0 0 0 0 *
First name
Last name
Centre number
Candidate number
INSTRUCTIONS • Use black ink. You may use an HB pencil for graphs and diagrams. • Complete the boxes above with your name, centre number and candidate number. • Answer all the questions. • Write your answer to each question in the space provided. • Additional paper may be used if required but you must clearly show your candidate
number, centre number and question number(s). • Do not write in the bar codes.
INFORMATION • The total mark for this paper is 70. • The marks for each question are shown in brackets [ ]. • Quality of extended responses will be assessed in questions marked with an asterisk (*). • This document consists of 20 pages.
SPECIMEN

2
© OCR 2014 H156/02
Answer all the questions.
1 Fig. 1.1 shows a sign hanging from a rod fixed to a vertical wall. A metal wire attached between the rod and the wall holds the rod horizontal.
Fig.1.1 The weight W of the sign and rod act through the centre point of the rod. The value W is
120 N. The angle between wire and rod is 30o.
(a) Explain why the vertical force exerted on the rod by the wire is 60 N. ............................................................................................................................................ ............................................................................................................................................ ............................................................................................................................................ ............................................................................................................................................ [2]
(b) Calculate the tension T in the wire. T = ………………… N [2]
SPECIMEN

3
© OCR 2014 H156/02 Turn over
(c) (i) Draw an arrow on Fig. 1.1 to show the direction of the force exerted on the rod by the wall.
[1]
(ii) State how you chose this direction. ............................................................................................................................. ............................................................................................................................. ............................................................................................................................. [1] Question 2 begins on page 4
SPECIMEN
4
© OCR 2014 H156/02
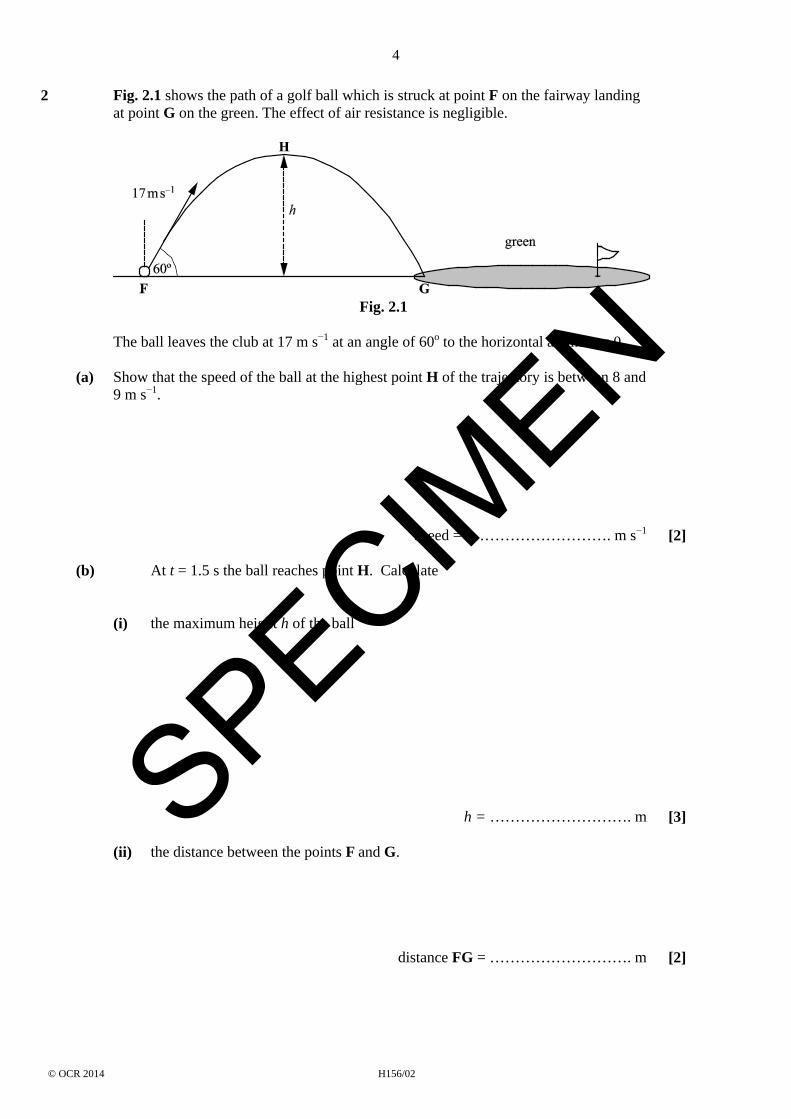
2 Fig. 2.1 shows the path of a golf ball which is struck at point F on the fairway landing at point G on the green. The effect of air resistance is negligible.
Fig. 2.1 The ball leaves the club at 17 m s−1 at an angle of 60o to the horizontal at time t = 0. (a) Show that the speed of the ball at the highest point H of the trajectory is between 8 and
9 m s−1.
speed = .………………………. m s−1 [2]
(b) At t = 1.5 s the ball reaches point H. Calculate (i) the maximum height h of the ball h = ………………………. m [3]
(ii) the distance between the points F and G. distance FG = ………………………. m [2]
SPECIMEN
5
© OCR 2014 H156/02 Turn over
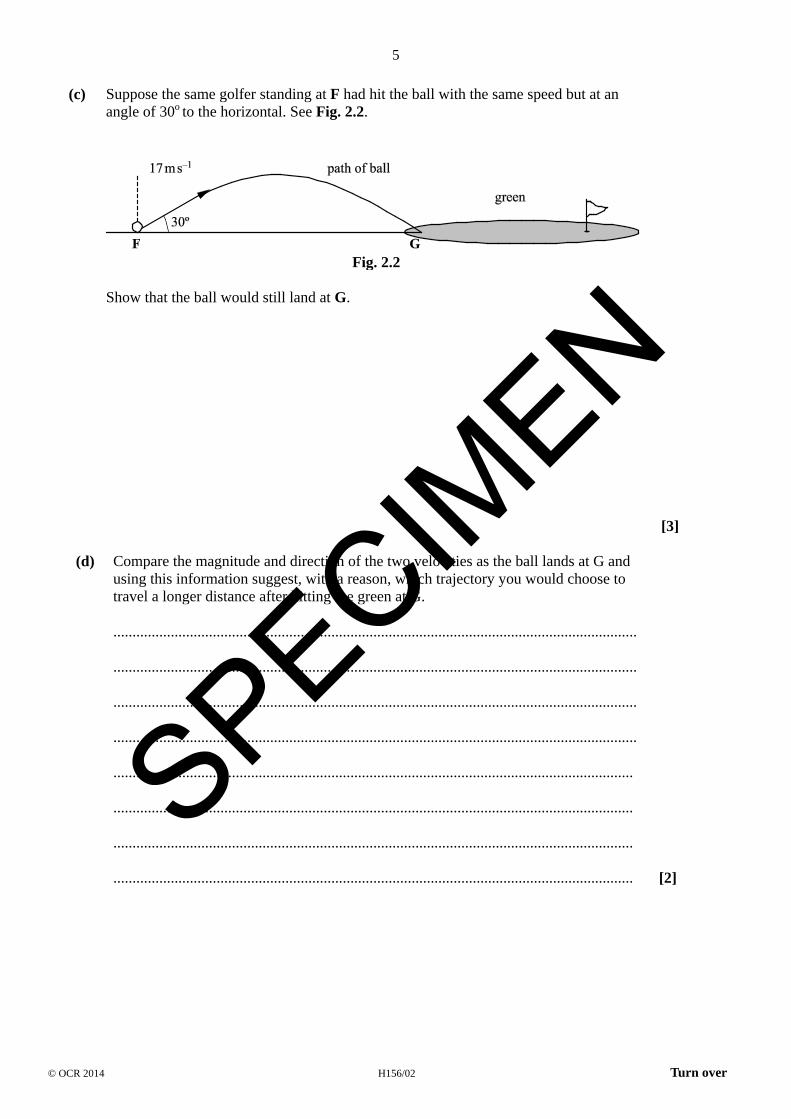
(c) Suppose the same golfer standing at F had hit the ball with the same speed but at an angle of 30o
to the horizontal. See Fig. 2.2.
Fig. 2.2 Show that the ball would still land at G. [3] (d) Compare the magnitude and direction of the two velocities as the ball lands at G and
using this information suggest, with a reason, which trajectory you would choose to travel a longer distance after hitting the green at G.
......................................................................................................................................... ......................................................................................................................................... ......................................................................................................................................... ......................................................................................................................................... ........................................................................................................................................ ........................................................................................................................................ ........................................................................................................................................ ........................................................................................................................................ [2]
SPECIMEN

6
© OCR 2014 H156/02
3 A sports manufacturer is testing the quality of one of their footballs.
(a) Fig. 3.1 shows how the force F applied to a football varies with time t whilst it is being kicked horizontally. The ball is initially at rest.
Fig. 3.1 (i) Use the graph to find:
1 the maximum force applied to the ball …………………. .N 2 the time the boot is in contact with the ball ……………… s.
[1] (ii) The mean force multiplied by the time of contact is called the impulse delivered
to the ball. The impulse delivered to the ball is about 6.5 N s. Explain how you would use the graph to show that the impulse has this value.
............................................................................................................................... ............................................................................................................................... ............................................................................................................................... ............................................................................................................................... [2]
SPECIMEN
7
© OCR 2014 H156/02 Turn over
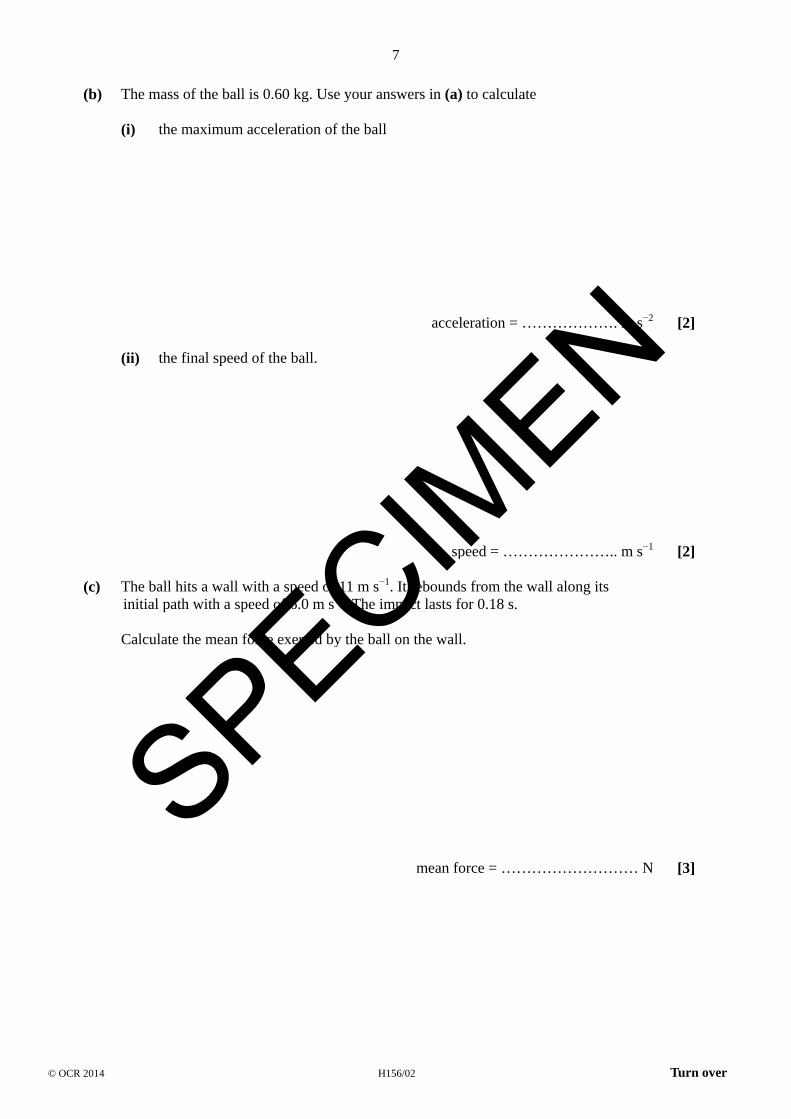
(b) The mass of the ball is 0.60 kg. Use your answers in (a) to calculate (i) the maximum acceleration of the ball acceleration = ………………. m s−2 [2] (ii) the final speed of the ball.
speed = ………………….. m s−1 [2] (c) The ball hits a wall with a speed of 11 m s−1. It rebounds from the wall along its
initial path with a speed of 6.0 m s–1. The impact lasts for 0.18 s. Calculate the mean force exerted by the ball on the wall.
mean force = ……………………… N [3]
SPECIMEN

8
© OCR 2014 H156/02
4 (a) Name the charge carriers responsible for electric current in a metal …………………………………………. and in an electrolyte ……………………………… [1] (b) A copper rod of cross-sectional area 3.0 x 10⁻⁴ m2 is used to transmit large currents.
A charge of 650 C passes along the rod every 5.0 s. Calculate
(i) the current I in the rod I = ………………….. A [1]
(ii) the total number of electrons passing any point in the rod per second number per second = …………………... [1] (iii) the mean drift velocity of the electrons in the rod given that the number density of
free electrons is 1.0 x 1029 m–3.
mean drift velocity = ………………… m s–1 [2]
SPECIMEN

9
© OCR 2014 H156/02 Turn over
(c) The copper rod in (b) labelled X in Fig. 4.1 is connected to a longer thinner copper rod Y.
Fig. 4.1 (i) State why the current in Y must also be I. ............................................................................................................................... ............................................................................................................................... [1] (ii) Rod Y has half the cross-sectional area of rod X. Calculate the mean drift velocity
of electrons in Y.
mean drift velocity = ………………… m s–1 [1]
SPECIMEN

10
© OCR 2014 H156/02
5 (a) The circuit in Fig. 5.1 consists of a d.c. supply of e.m.f. 45 V and negligible internal resistance and three resistors.
Fig. 5.1
Two of the resistors have resistances 1000 Ω and 750 Ω as shown. The current drawn from the supply is 0.030 A. Calculate the resistance of R. resistance = …………………... Ω [4] SPECIM
EN

11
© OCR 2014 H156/02 Turn over
(b)* Students are given a light dependent resistor (LDR) and asked to design a circuit for a light meter to monitor changes in light intensity. The meter reading must rise when the light intensity increases. The incident light may cause the resistance of the LDR to vary between 1500 Ω and 250 Ω. The students are asked to use the d.c. supply and one of the resistors from (a) above and either a voltmeter or ammeter. Draw a suitable circuit.
Explain why the reading on the meter increases with increasing light intensity and which of the three fixed resistors gives the largest scale change on the meter for the change in light intensity.
......................................................................................................................................... ......................................................................................................................................... ......................................................................................................................................... ......................................................................................................................................... ......................................................................................................................................... ......................................................................................................................................... ......................................................................................................................................... ......................................................................................................................................... ......................................................................................................................................... ......................................................................................................................................... [6]
SPECIMEN

12
© OCR 2014 H156/02
6 In an investigation of standing waves, sound waves are sent down a long pipe, with its lower end immersed in water. The waves are reflected by the water surface. The pipe is lowered until a standing wave is set up in the air in the pipe. A loud note is then heard. See Fig. 6.1. Length l1 is measured. The pipe is then lowered further until a loud sound is again obtained from the air in the pipe. Length l2 is measured.
Fig 6.1
(a) A student obtained the following results in the experiment. frequency of sound/Hz l1 /m l2 /m
500 0.506 0.170
Use data from the table to calculate the speed of sound in the pipe.
Show your reasoning. speed = ………………….. m s–1 [4]
SPECIMEN

13
© OCR 2014 H156/02 Turn over
(b) The student repeats the experiment, but sets the frequency of the sound from the speaker at 5000 Hz.
Suggest and explain whether these results are likely to give a more or less accurate value for the speed of sound than those obtained in the first experiment.
........................................................................................................................................... ........................................................................................................................................... ........................................................................................................................................... ........................................................................................................................................... ........................................................................................................................................... ........................................................................................................................................... ........................................................................................................................................... ........................................................................................................................................... [2]
SPECIMEN

14
© OCR 2014 H156/02
(c) The pipe is removed from the water and laid horizontally on a bench as in Fig. 6.2.
The frequency of the sound waves sent down the pipe is adjusted until a standing wave is set up in it. Point P is a distance of λ/4 from point Q at the far end.
Fig. 6.2
Explain how and under what conditions a stationary sound wave is formed in the pipe. Describe and compare the motion of the air molecules at points P and Q.
........................................................................................................................................... ........................................................................................................................................... ........................................................................................................................................... ........................................................................................................................................... ........................................................................................................................................... ........................................................................................................................................... ........................................................................................................................................... ........................................................................................................................................... ........................................................................................................................................... ........................................................................................................................................... ........................................................................................................................................... [6]
SPECIMEN

15
© OCR 2014 H156/02 Turn over
7 (a)* The Planck constant h can be measured in an experiment using light-emitting diodes (LEDs).
Each LED used in the experiment emits monochromatic light. The wavelength λ of the
emitted photons is determined during the manufacturing process and is provided by the manufacturer.
When the p.d. across the LED reaches a specific minimum value Vmin the LED
suddenly switches on emitting photons of light of wavelength λ. Vmin and λ are related by the energy equation eVmin = hc/λ.
Fig. 7.1
LED λ/nm Vmin/V 1 red 627 1.98 2 yellow 590 2.10 3 green 546 2.27 4 blue 468 2.66 5 violet 411 3.02
Discuss how you could use the circuit of Fig. 7.1 to determine accurate values for
Vmin and how data from the table can be used graphically to determine a value for the Planck constant.
.......................................................................................................................................... ........................................................................................................................................... ........................................................................................................................................... ........................................................................................................................................... ........................................................................................................................................... ........................................................................................................................................... ........................................................................................................................................... ........................................................................................................................................... ........................................................................................................................................... ...........................................................................................................................................
SPECIMEN

16
© OCR 2014 H156/02
........................................................................................................................................... ........................................................................................................................................... ........................................................................................................................................... ........................................................................................................................................... ........................................................................................................................................... ........................................................................................................................................... ........................................................................................................................................... ........................................................................................................................................... ........................................................................................................................................... [6]
SPECIMEN

17
© OCR 2014 H156/02 Turn over
(b) A beam of ultraviolet light is incident on a clean metal surface. The graph of Fig. 7.2 shows how the maximum kinetic energy KEmax of the electrons ejected from the surface varies with the frequency f of the incident light.
Fig.7.2 (i) Explain how the graph shown in Fig 7.2 cannot be explained in terms of the
wave-model for electromagnetic waves. [2] (ii) Use data from Fig.7.2 to find a value of
1. the Planck constant Planck constant = ………………… J s [2] 2. the threshold frequency of the metal threshold frequency = ………………… Hz [1]
SPECIMEN

18
© OCR 2014 H156/02
3. the work function of the metal. work function = …………………… J [2] END OF QUESTION PAPER
SPECIMEN

19
© OCR 2014 H156/02
BLANK PAGE
SPECIM
EN

20
© OCR 2014 H156/02
Copyright Information:
OCR is committed to seeking permission to reproduce all third-party content that it uses in the assessment materials. OCR has attempted to identify and contact all copyright holders whose work is used in this paper. To avoid the issue of disclosure of answer-related information to candidates, all copyright acknowledgements are reproduced in the OCR Copyright Acknowledgements booklet. This is produced for each series of examinations and is freely available to download from our public website (www.ocr.org.uk) after the live examination series.
If OCR has unwittingly failed to correctly acknowledge or clear any third-party content in this assessment material, OCR will be happy to correct its mistake at the earliest possible opportunity.
For queries or further information please contact the Copyright Team, First Floor, 9 Hills Road, Cambridge CB2 1GE.
OCR is part of the Cambridge Assessment Group; Cambridge Assessment is the brand name of University of Cambridge Local Examinations Syndicate (UCLES), which is itself a department of the University of Cambridge.
SPECIMEN

…day June 20XX–Morning/Afternoon AS Level Physics A H156/02 Depth in physics SAMPLE MARK SCHEME Duration: 1 hour 30 minutes MAXIMUM MARK 70
This document consists of 16 pages SPECIMEN

H156/02 Mark Scheme June 20XX
2
MARKING INSTRUCTIONS PREPARATION FOR MARKING SCORIS 1. Make sure that you have accessed and completed the relevant training packages for on-screen marking: scoris assessor Online Training;
OCR Essential Guide to Marking. 2. Make sure that you have read and understood the mark scheme and the question paper for this unit. These are posted on the RM Cambridge
Assessment Support Portal http://www.rm.com/support/ca 3. Log-in to scoris and mark the required number of practice responses (“scripts”) and the required number of standardisation responses.
YOU MUST MARK 10 PRACTICE AND 10 STANDARDISATION RESPONSES BEFORE YOU CAN BE APPROVED TO MARK LIVE SCRIPTS.
MARKING 1. Mark strictly to the mark scheme. 2. Marks awarded must relate directly to the marking criteria. 3. The schedule of dates is very important. It is essential that you meet the scoris 50% and 100% (traditional 50% Batch 1 and 100% Batch 2)
deadlines. If you experience problems, you must contact your Team Leader (Supervisor) without delay. 4. If you are in any doubt about applying the mark scheme, consult your Team Leader by telephone, email or via the scoris messaging system.
SPECIMEN
H156/02 Mark Scheme June 20XX
3
5. Work crossed out:
a. where a candidate crosses out an answer and provides an alternative response, the crossed out response is not marked and gains no
marks b. if a candidate crosses out an answer to a whole question and makes no second attempt, and if the inclusion of the answer does not
cause a rubric infringement, the assessor should attempt to mark the crossed out answer and award marks appropriately. 6. Always check the pages (and additional objects if present) at the end of the response in case any answers have been continued there. If the
candidate has continued an answer there then add a tick to confirm that the work has been seen. 7. There is a NR (No Response) option. Award NR (No Response)
- if there is nothing written at all in the answer space - OR if there is a comment which does not in any way relate to the question (e.g. ‘can’t do’, ‘don’t know’)
- OR if there is a mark (e.g. a dash, a question mark) which isn’t an attempt at the question.
Note: Award 0 marks – for an attempt that earns no credit (including copying out the question).
8. The scoris comments box is used by your Team Leader to explain the marking of the practice responses. Please refer to these comments
when checking your practice responses. Do not use the comments box for any other reason. If you have any questions or comments for your Team Leader, use the phone, the scoris messaging system, or e-mail.
9. Assistant Examiners will send a brief report on the performance of candidates to their Team Leader (Supervisor) via email by the end of the marking period. The report should contain notes on particular strengths displayed as well as common errors or weaknesses. Constructive criticism of the question paper/mark scheme is also appreciated.
SPECIM
EN
H156/02 Mark Scheme June 20XX
4
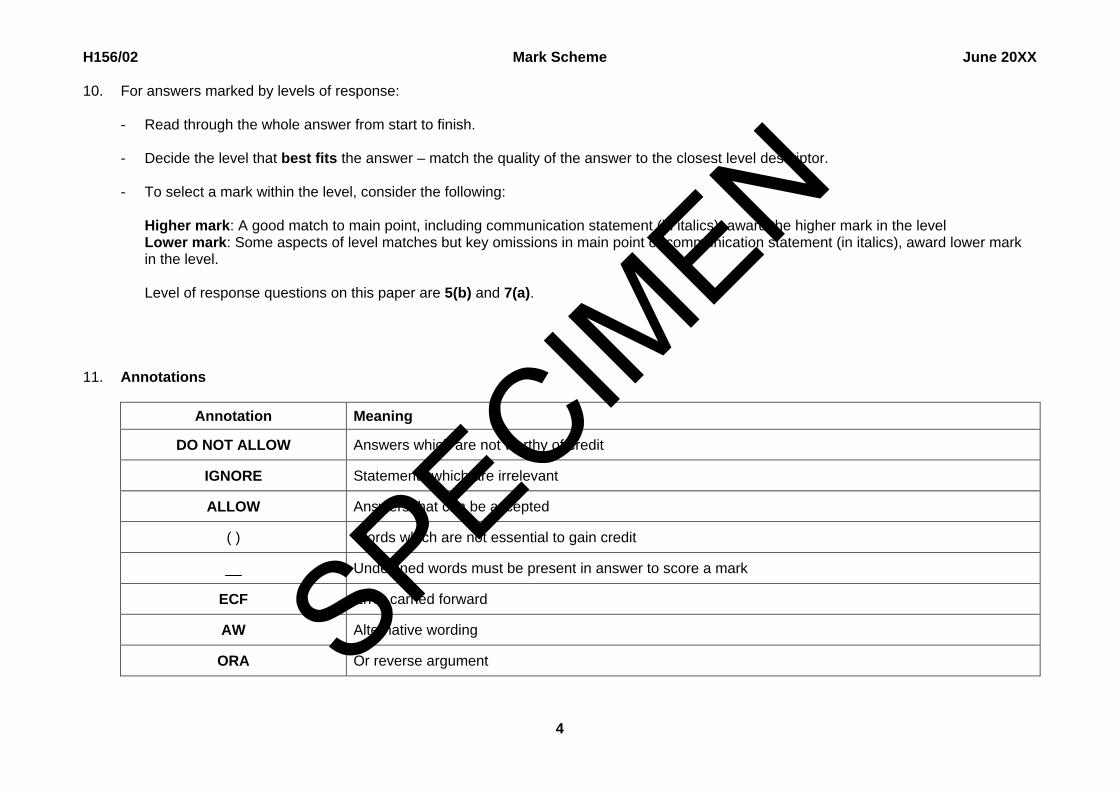
10. For answers marked by levels of response:
- Read through the whole answer from start to finish. - Decide the level that best fits the answer – match the quality of the answer to the closest level descriptor.
- To select a mark within the level, consider the following:
Higher mark: A good match to main point, including communication statement (in italics), award the higher mark in the level Lower mark: Some aspects of level matches but key omissions in main point or communication statement (in italics), award lower mark in the level. Level of response questions on this paper are 5(b) and 7(a).
11. Annotations
Annotation Meaning
DO NOT ALLOW Answers which are not worthy of credit
IGNORE Statements which are irrelevant
ALLOW Answers that can be accepted
( ) Words which are not essential to gain credit
__ Underlined words must be present in answer to score a mark
ECF Error carried forward
AW Alternative wording
ORA Or reverse argument
SPECIMEN

H156/02 Mark Scheme June 20XX
5
12. Subject-specific Marking Instructions
INTRODUCTION Your first task as an Examiner is to become thoroughly familiar with the material on which the examination depends. This material includes: • the specification, especially the assessment objectives
• the question paper • the mark scheme.
You should ensure that you have copies of these materials. You should ensure also that you are familiar with the administrative procedures related to the marking process. These are set out in the OCR booklet Instructions for Examiners. If you are examining for the first time, please read carefully Appendix 5 Introduction to Script Marking: Notes for New Examiners. Please ask for help or guidance whenever you need it. Your first point of contact is your Team Leader.
SPECIMEN
H156/02 Mark Scheme June 20XX
6
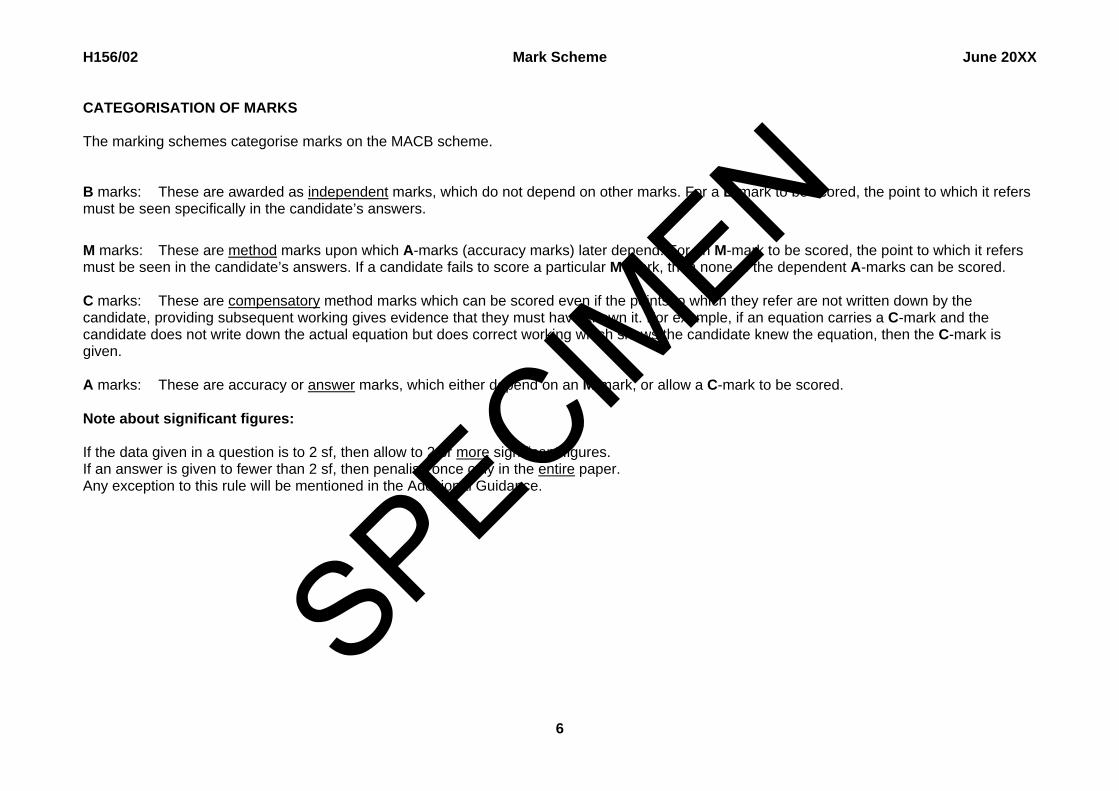
CATEGORISATION OF MARKS The marking schemes categorise marks on the MACB scheme. B marks: These are awarded as independent marks, which do not depend on other marks. For a B-mark to be scored, the point to which it refers must be seen specifically in the candidate’s answers.
M marks: These are method marks upon which A-marks (accuracy marks) later depend. For an M-mark to be scored, the point to which it refers must be seen in the candidate’s answers. If a candidate fails to score a particular M-mark, then none of the dependent A-marks can be scored. C marks: These are compensatory method marks which can be scored even if the points to which they refer are not written down by the candidate, providing subsequent working gives evidence that they must have known it. For example, if an equation carries a C-mark and the candidate does not write down the actual equation but does correct working which shows the candidate knew the equation, then the C-mark is given. A marks: These are accuracy or answer marks, which either depend on an M-mark, or allow a C-mark to be scored. Note about significant figures: If the data given in a question is to 2 sf, then allow to 2 or more significant figures. If an answer is given to fewer than 2 sf, then penalise once only in the entire paper. Any exception to this rule will be mentioned in the Additional Guidance. SPECIM
EN

H156/02 Mark Scheme June 20XX
7
Question Answer Marks Guidance 1 (a) Take moments about contact point of rod and wall (because this
removes the unknown forces in the calculation). W x l/2 = F x l or the vertical force is at a distance twice that for the weight.
B1
B1
(b) T = 60/sin 30 or 60/cos 60 T = 120 (N)
C1
A1
(c) (i) arrow from rod wall junction through point where T and line of W cross.
B1
(ii) require triangle of forces for equilibrium or the forces must pass through a point for equilibrium.
B1
Total 6
SPECIMEN

H156/02 Mark Scheme June 20XX
8
Question Answer Marks Guidance 2 (a) horizontal component = 17 sin 30 or 17 cos 60 = 8.5(m s–1)
at highest point vertical component of velocity is zero.
B1
B1
(b) (i) u = 17 cos 30 = 14.7 (m s–1)
h = ut - ½gt2; = 14.7 x 1.5 - ½ x 9.81 x 1.52
h = 11 (m)
C1
C1
A1
or use v2 = u2 – 2gs or s = (u + v)t/2 note: if g = 10 is used, then maximum score is 2/3
(ii) s = 2 x 8.5 x 1.5 s = 26 (m)
C1
A1
ecf 2a allow 25.5 m
(c) 0 = 17 sin 30 t - ½ x 9.81 x t2
so t = 0 or 17/9.81 = 1.73 s = 14.7 x 1.73 = 25.4 (m)
C1
C1
A1
allow s = 15 x 1.7 = 25.5 (accept 25 or 26 to 2 sf)
(d) the ball has the same speed (of 17 m s–1) but is at different (either at 60o or 30o ) angle to the horizontal. larger horizontal velocity (second trajectory) so travels further or higher bounce (first trajectory) so less drag from grass so travels further.
B1
B1
accept any sensible answer, e.g. steeper bounce loses more energy in impact so slows more.
Total 12 SPECIM
EN

H156/02 Mark Scheme June 20XX
9
Question Answer Marks Guidance 3 (a) (i) 48 (N);0.25 (s)
A1
both values correct; no tolerance
(ii) estimate area under graph by counting squares or method of estimating mean F multiplied by time of contact (0.25 s)
B1 B1
second mark awarded for some detail about how to estimate area. e.g. areas above and below mean under curve are equal.
(b) (i) (F = ma) a = 48/0.6 a = 80 (m s–2)
C1
A1
ecf a(i)
(ii) (Ft = mv) v = 6.5/0.6 v = 11 (m s–1)
C1
A1
ecf a(i) allow 10.8
(c) Ft = mv + mu Ft = 0.6 (6 + 11) = 10(.2) F = 10/0.18 = 57 (N)
C1
C1
A1
award 1 mark out of 3 for mv - mu; = 0.6 (11 - 6) = 3 giving 17 (N).
Total 10
SPECIMEN
H156/02 Mark Scheme June 20XX
10
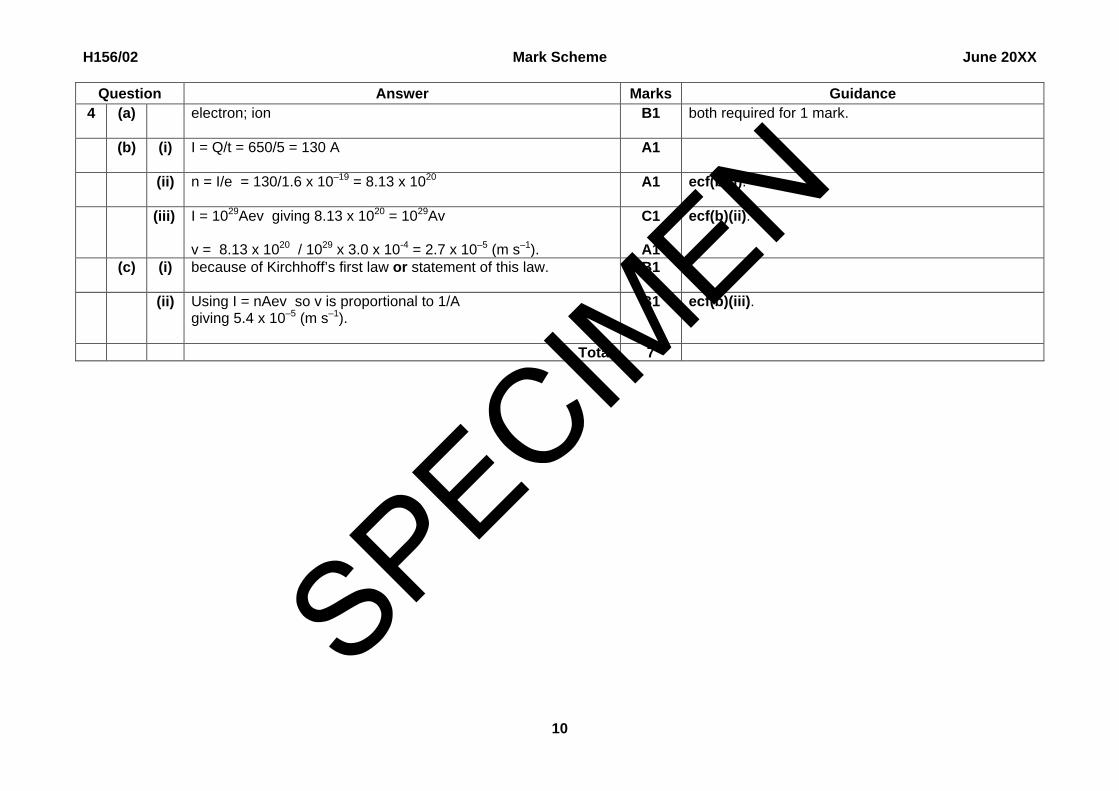
Question Answer Marks Guidance 4 (a) electron; ion
B1 both required for 1 mark.
(b) (i) I = Q/t = 650/5 = 130 A
A1
(ii) n = I/e = 130/1.6 x 10–19 = 8.13 x 10²⁰
A1 ecf(b)(i).
(iii) I = 1029Aev giving 8.13 x 1020 = 1029Av v = 8.13 x 10²⁰ / 1029 x 3.0 x 10-4 = 2.7 x 10⁻⁵ (m s–1).
C1
A1
ecf(b)(ii).
(c) (i) because of Kirchhoff’s first law or statement of this law.
B1
(ii) Using I = nAev so v is proportional to 1/A giving 5.4 x 10⁻⁵ (m s–1).
B1 ecf(b)(iii).
Total 7
SPECIMEN

H156/02 Mark Scheme June 20XX
11
Question Answer Marks Guidance
5 (a) V across 750 Ω = 45 - 0.03 x 1000 = 15 (V) current in 750 Ω = 15/750 = 0.02 (A) current in R = 0.01 (A) R = 15/0.01 = 1500 (Ω)
C1
C1
C1
A1
several methods available, e.g. find the total resistance = 45/0.03 = 1500 (Ω) resistance of parallel pair = 500 (Ω) R=(500–1 – 750–1)–1 = 1500 (Ω) or use potential divider argument.
(b)* Level 3 (5–6 marks) Circuit including meter is correctly drawn. Explanation of action of circuit is correct. Concept of sensitivity understood and 750 Ω justified (6 marks) LDR wrong symbol or value of resistor not fully justified (5 marks). There is a well-developed line of reasoning which is clear and logically structured. The information presented is relevant and substantiated. Level 2 (3–4 marks) Circuit has correct symbol for LDR Action of circuit explanation limited 750 Ω stated but not justified Concept of sensitivity (4 marks) Any point omitted or incorrect (3 marks). There is a line of reasoning presented with some structure. The information presented is in the most-part relevant and supported by some evidence.
B1 x6
circuit diagram 1. resistor and LDR in series 2. ammeter in series or voltmeter in parallel with
resistor 3. correct symbols for LDR, ammeter, voltmeter,
etc. action of circuit
1. when light intensity increases R of LDR falls 2. so I in circuit increases or V across resistor
increases or V across LDR decreases (meter reading increases).
meter and sensitivity
1. need the largest change in current or voltage for a given change in light intensity
2. choose resistor of 750 Ω to give the largest change on the meter or need a meter which can display small changes in value of current or voltage.
SPECIMEN

H156/02 Mark Scheme June 20XX
12
Question Answer Marks Guidance Level 1 (1–2 marks) Correct symbol for LDR (1 mark) Action of circuit only addresses point (1 mark) Sensitivity poorly addressed (1 mark) (Maximum 2 marks) The information is basic and communicated in an unstructured way. The information is supported by limited evidence and the relationship to the evidence may not be clear. 0 marks No response or no response worthy of credit.
Total 10
SPECIMEN

H156/02 Mark Scheme June 20XX
13
Question Answer Marks Guidance 6 (a) tube pushed into water by λ/2
therefore λ/2= 0.506 – 0.170 giving λ = 0.672 (m) using v = fλ v = 500 x 0.672 = 336 (m s–1)
B1
B1 C1 A1
allow any statement about antinode needed at open end and node at water level. A solution worked to 2 SF will score a maximum of 3 marks.
(b) smaller λ means smaller l to measure, so less accurate measurement. added detail or expansion of argument.
B1
B1
(c) the wave reflected at the end of the pipe interferes/superposes with the incident wave . to produce a resultant wave with nodes and antinodes. both ends must be antinodes or the pipe must be nλ/2 in length for this to happen. at Q air molecules oscillate with motion along the axis of the tube or with maximum amplitude. at P no motion/nodal point.
B1
B1
B1
B1
B1
B1
allow vibrate.
Total 12
SPECIMEN
H156/02 Mark Scheme June 20XX
14
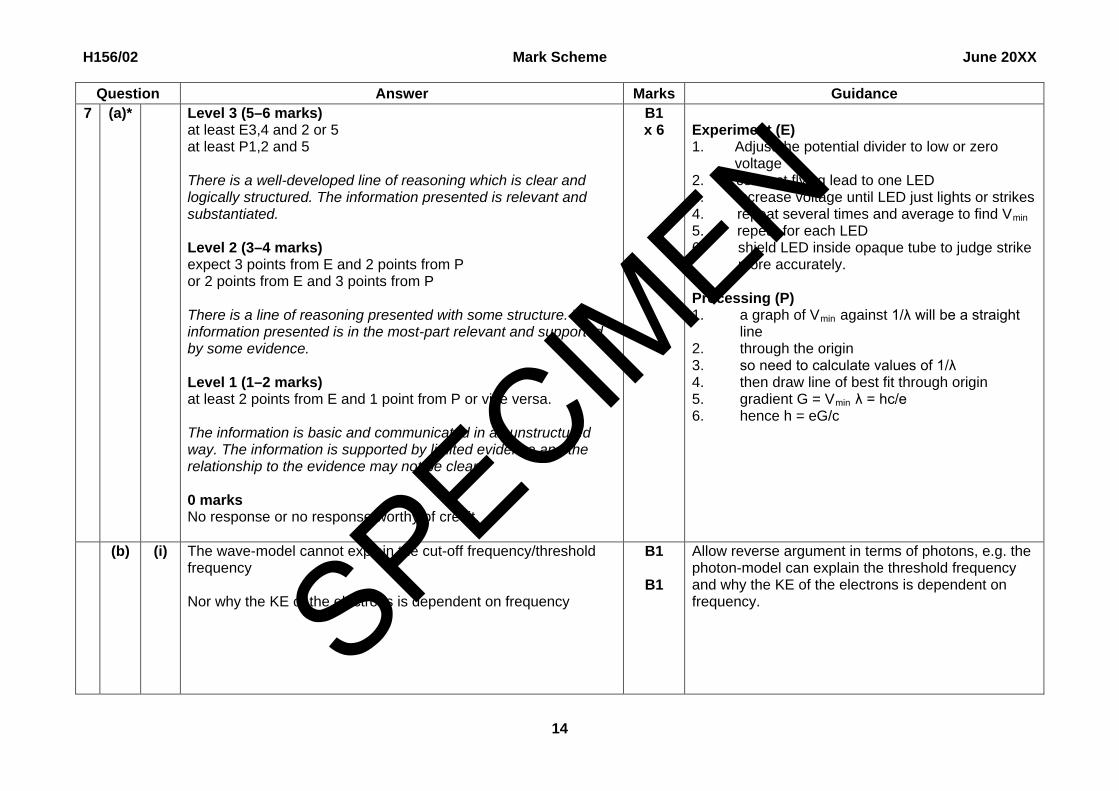
Question Answer Marks Guidance 7 (a)* Level 3 (5–6 marks)
at least E3,4 and 2 or 5 at least P1,2 and 5 There is a well-developed line of reasoning which is clear and logically structured. The information presented is relevant and substantiated. Level 2 (3–4 marks) expect 3 points from E and 2 points from P or 2 points from E and 3 points from P There is a line of reasoning presented with some structure. The information presented is in the most-part relevant and supported by some evidence. Level 1 (1–2 marks) at least 2 points from E and 1 point from P or vice versa. The information is basic and communicated in an unstructured way. The information is supported by limited evidence and the relationship to the evidence may not be clear. 0 marks No response or no response worthy of credit.
B1 x 6
Experiment (E) 1. Adjust the potential divider to low or zero
voltage 2. connect flying lead to one LED 3. increase voltage until LED just lights or strikes 4. repeat several times and average to find Vmin 5. repeat for each LED 6. shield LED inside opaque tube to judge strike
more accurately. Processing (P) 1. a graph of Vmin against 1/λ will be a straight
line 2. through the origin 3. so need to calculate values of 1/λ 4. then draw line of best fit through origin 5. gradient G = Vmin λ = hc/e 6. hence h = eG/c
(b) (i) The wave-model cannot explain the cut-off frequency/threshold frequency Nor why the KE of the electrons is dependent on frequency
B1
B1
Allow reverse argument in terms of photons, e.g. the photon-model can explain the threshold frequency and why the KE of the electrons is dependent on frequency.
SPECIMEN
H156/02 Mark Scheme June 20XX
15
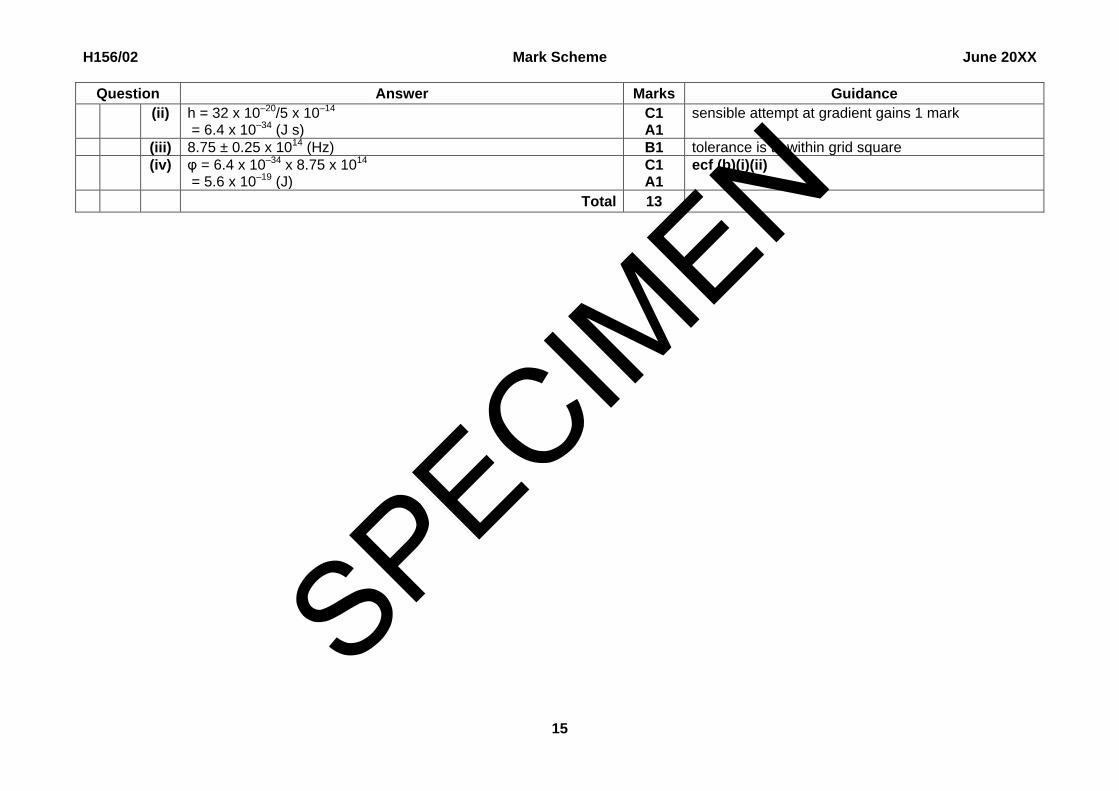
Question Answer Marks Guidance (ii) h = 32 x 10–20/5 x 10–14
= 6.4 x 10⁻³⁴ (J s) C1 A1
sensible attempt at gradient gains 1 mark
(iii) 8.75 ± 0.25 x 10¹⁴ (Hz) B1 tolerance is to within grid square (iv) φ = 6.4 x 10–34 x 8.75 x 1014
= 5.6 x 10⁻¹⁹ (J) C1 A1
ecf (b)(i)(ii)
Total 13
SPECIMEN

H156/02 Mark Scheme June 20XX
16
BLANK PAGE
SPECIMEN