sam samad, chief financial officer barclays global ... · barclays global healthcare conference, 13...
TRANSCRIPT
© 2019 Illumina, Inc. All rights reserved.
IlluminaEnabling the New PossibleSam Samad, Chief Financial Officer
Barclays Global Healthcare Conference, 13 March 2019
2
Safe Harbor Statement
This communication may contain statements that are forward-looking. Forward-looking statements
are subject to known and unknown risks and uncertainties and are based on potentially inaccurate assumptions
that could cause actual results to differ materially from those expected or implied by the forward -looking
statements. Among the important factors that could cause actual results to differ materially from those in any
forward-looking statements are (i) our ability to further develop and commercialize our instruments and
consumables and to deploy new products, services, and applications, and expand the markets, for our
technology platforms; (ii) our ability to manufacture robust instrumentation and consumables; (iii) our ability to
successfully identify and integrate acquired technologies, products, or businesses; (iv) our expectations and
beliefs regarding future conduct and growth of the business and the markets in which we operate; (v)
challenges inherent in developing, manufacturing, and launching new products and services; (vi) our
expectations regarding the pending acquisition of Pacific Biosciences; and (vii) the application of generally
accepted accounting principles, which are highly complex and involve many subjective assumptions, estimates,
and judgments, together with other factors detailed in our filings with the Securities and Exchange Commission,
including our most recent filings on Forms 10-K and 10-Q, or in information disclosed in public conference calls,
the date and time of which are released beforehand. We undertake no obligation, and do not intend, to update
these forward-looking statements, to review or confirm analysts’ expectations, or to provide interim reports or
updates on the progress of the current quarter.
3
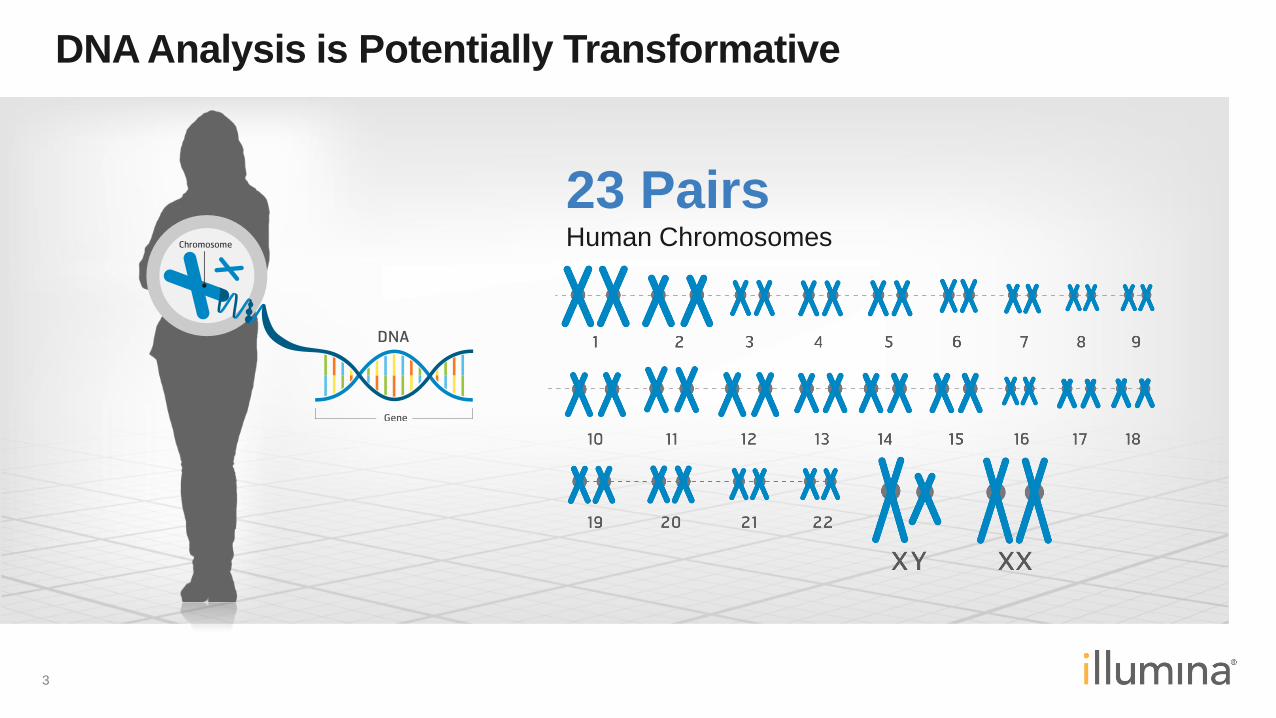
DNA Analysis is Potentially Transformative
23 PairsHuman Chromosomes
4
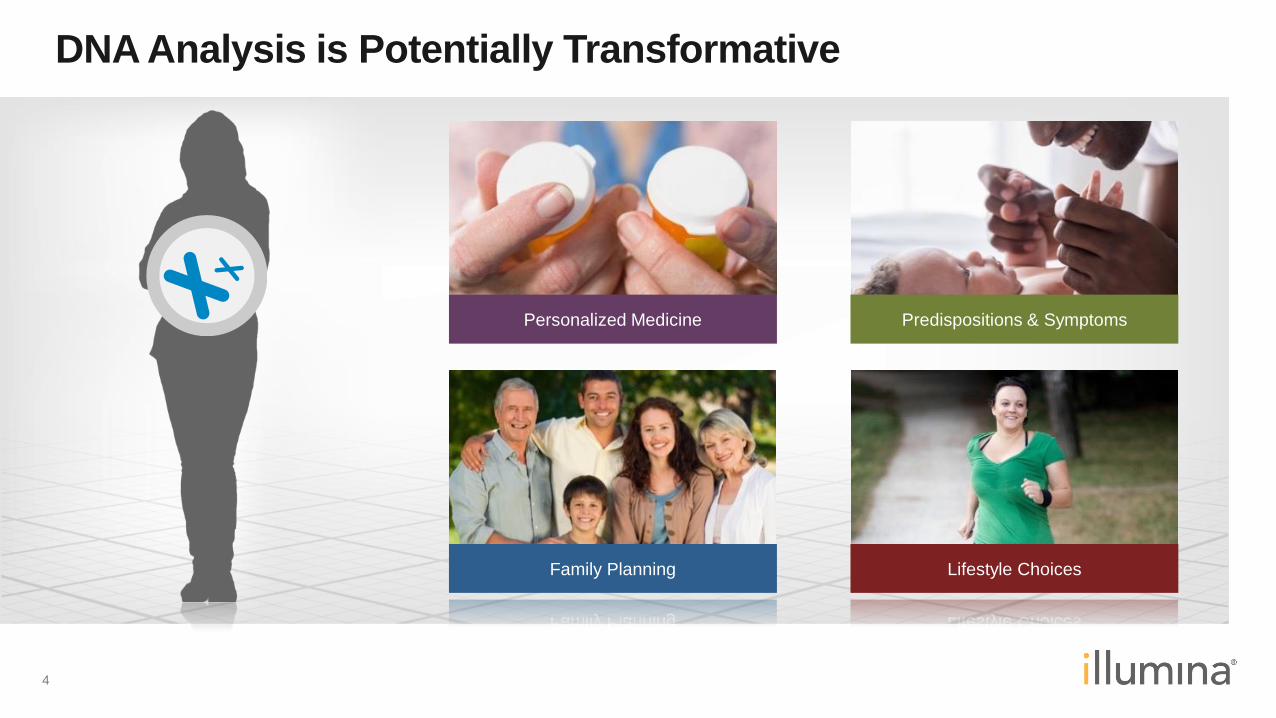
DNA Analysis is Potentially Transformative
Predispositions & SymptomsPersonalized Medicine
Lifestyle ChoicesFamily Planning
5
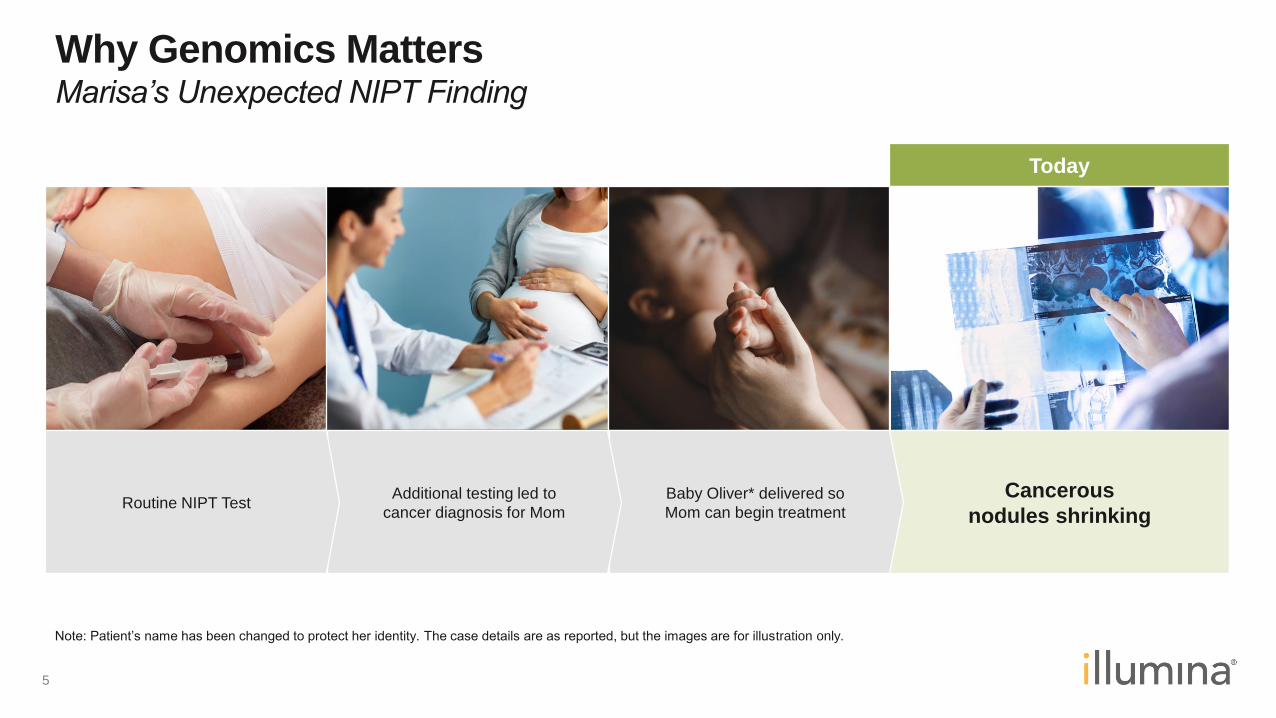
Why Genomics MattersMarisa’s Unexpected NIPT Finding
Cancerous
nodules shrinking
Today
Routine NIPT TestBaby Oliver* delivered so
Mom can begin treatment
Additional testing led to
cancer diagnosis for Mom
Note: Patient’s name has been changed to protect her identity. The case details are as reported, but the images are for illustration only.

6
Why Genomics MattersTwo Brothers’ Rare Disease Diagnosis
WGS ended the diagnostic
odyssey for two brothers and
led to a successful treatment
Today
Note: Case study included with patient approval.
Two brothers presented
with phenotypes of
profound intellectual
disability and seizures
Treatment identified
through GeneMatcher
Results identified
new disease gene in
both brothers
cWGS performed
through iHope
7
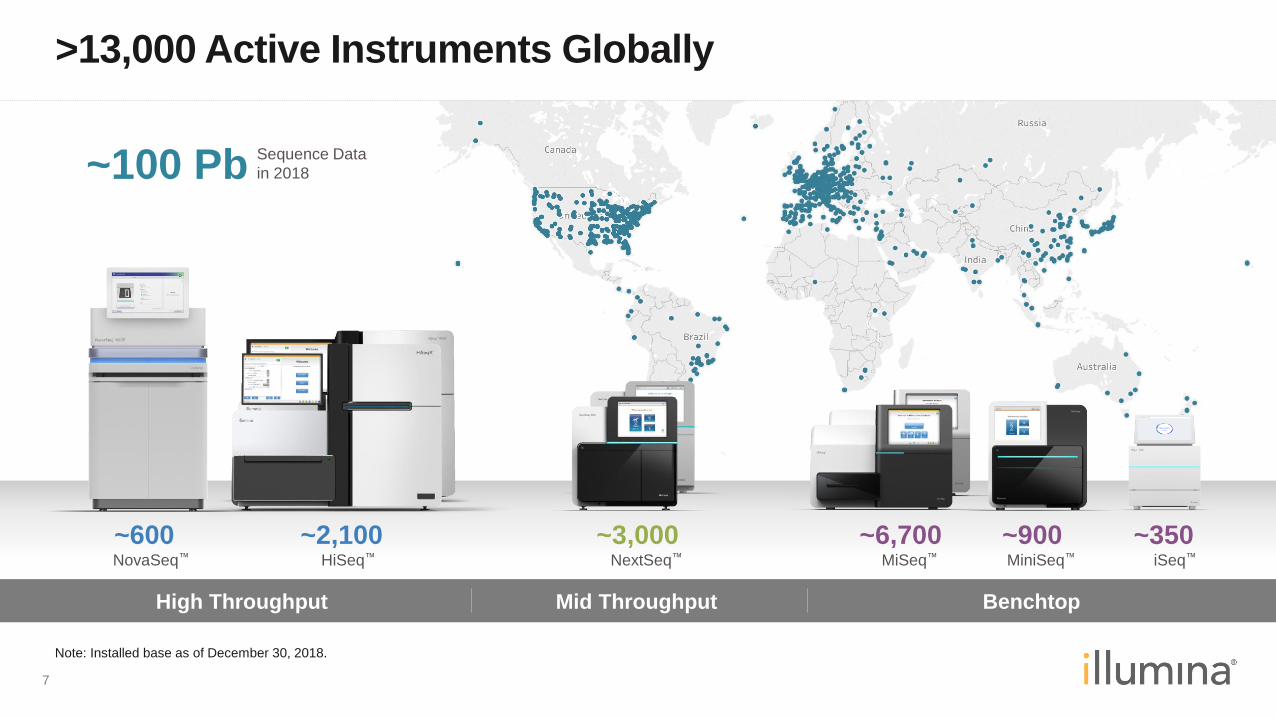
>13,000 Active Instruments Globally
Mid Throughput BenchtopHigh Throughput
~350iSeq™
~900MiniSeq™
~6,700MiSeq™
~3,000NextSeq™
~2,100HiSeq™
~600NovaSeq™
~100 Pb Sequence Data
in 2018
Note: Installed base as of December 30, 2018.

8
Robust Sequencing Consumable Revenue Growth$
Mil
lio
ns
$48$117
$202
$306
$426
$577
$770
$1,034
$1,271
$1,468
$1,806
2008 2009 2010 2011 2012 2013 2014 2015 2016 2017 2018
>20%2019 Guidance
Sequencing Consumable
YoY Growth
9
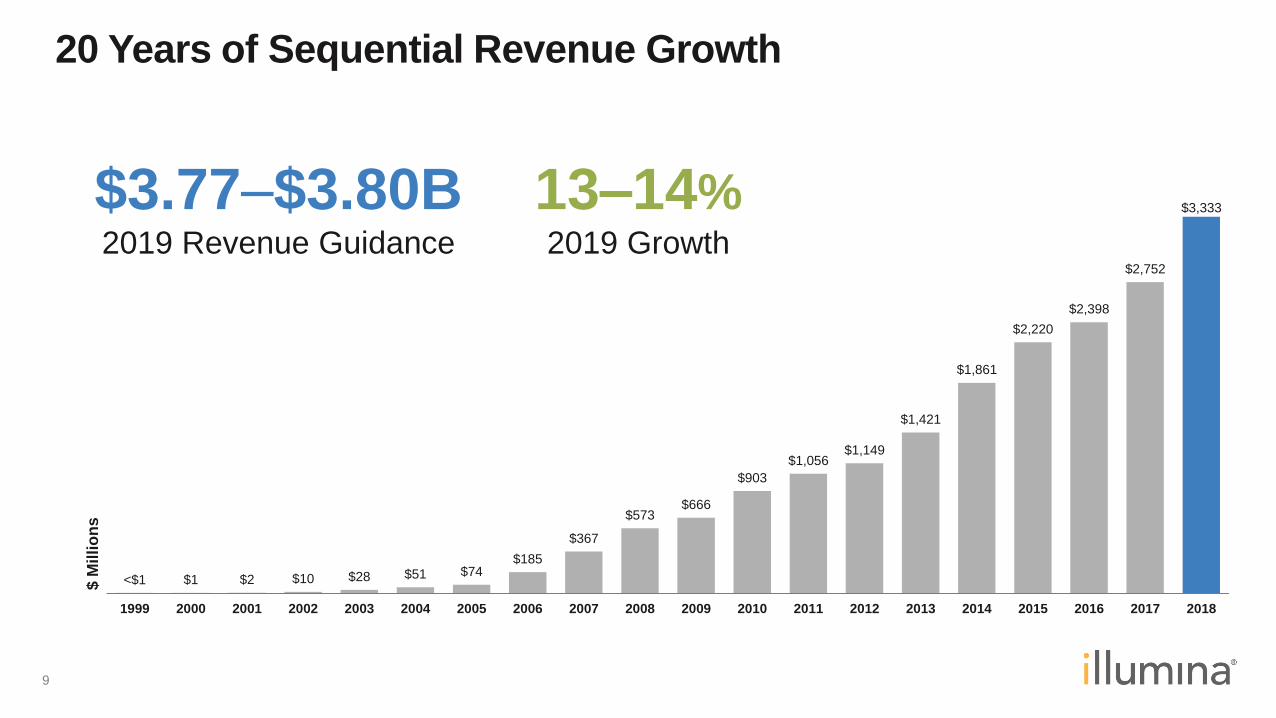
20 Years of Sequential Revenue Growth
<$1 $1 $2 $10 $28 $51 $74$185
$367
$573$666
$903
$1,056$1,149
$1,421
$1,861
$2,220
$2,398
$2,752
$3,333
1999 2000 2001 2002 2003 2004 2005 2006 2007 2008 2009 2010 2011 2012 2013 2014 2015 2016 2017 2018
$ M
illi
on
s
13–14%2019 Growth
$3.77–$3.80B2019 Revenue Guidance

10
Vast, Growing and Emerging Markets
Oncology Consumer
Research and Translational
Population
GenomicsNIPT RUGD
11
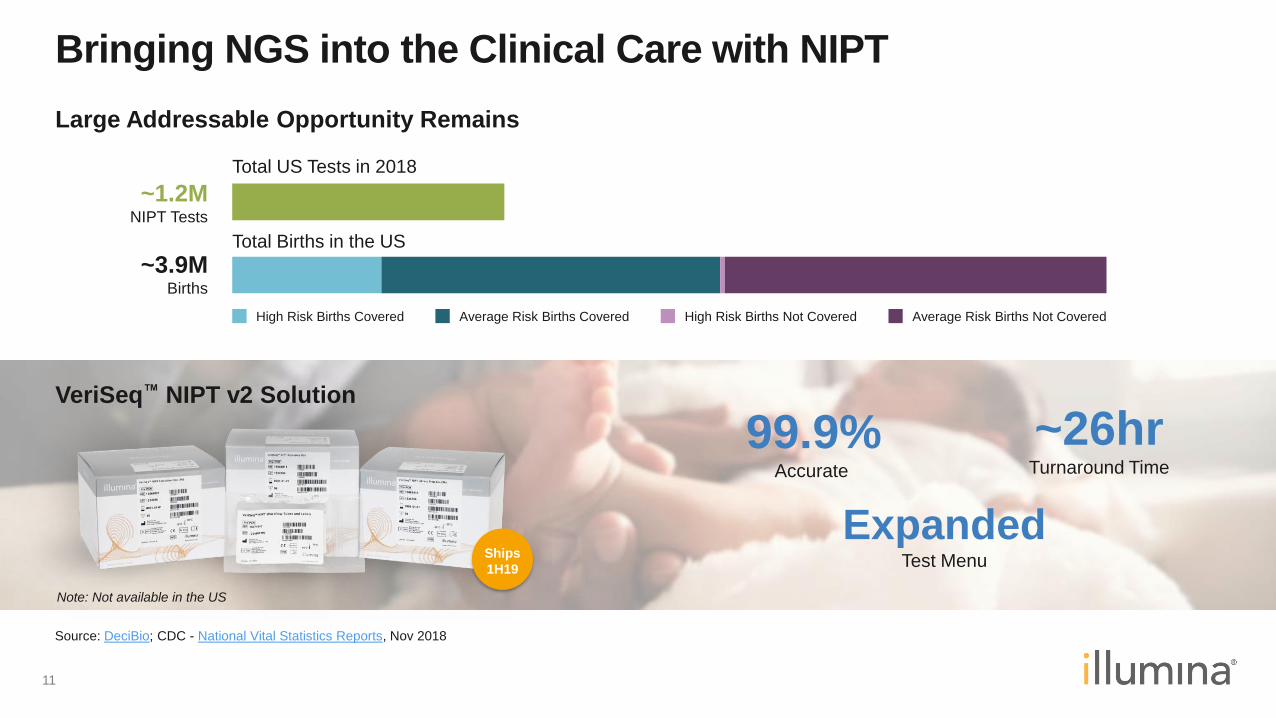
Bringing NGS into the Clinical Care with NIPT
VeriSeq™ NIPT v2 Solution
Ships
1H19
ExpandedTest Menu
99.9%Accurate
~26hrTurnaround Time
Source: DeciBio; CDC - National Vital Statistics Reports, Nov 2018
Total US Tests in 2018
Total Births in the US
~1.2MNIPT Tests
~3.9MBirths
Large Addressable Opportunity Remains
High Risk Births Covered Average Risk Births Covered High Risk Births Not Covered Average Risk Births Not Covered
Note: Not available in the US

12
Ending Diagnostic Odysseys for RUGD Patients
350 MillionRUGD Patients
Average
8 Yearsfor Accurate Diagnosis
Source: Global Genes
50%Patients are Children
30%Toddler Mortality Rate
13
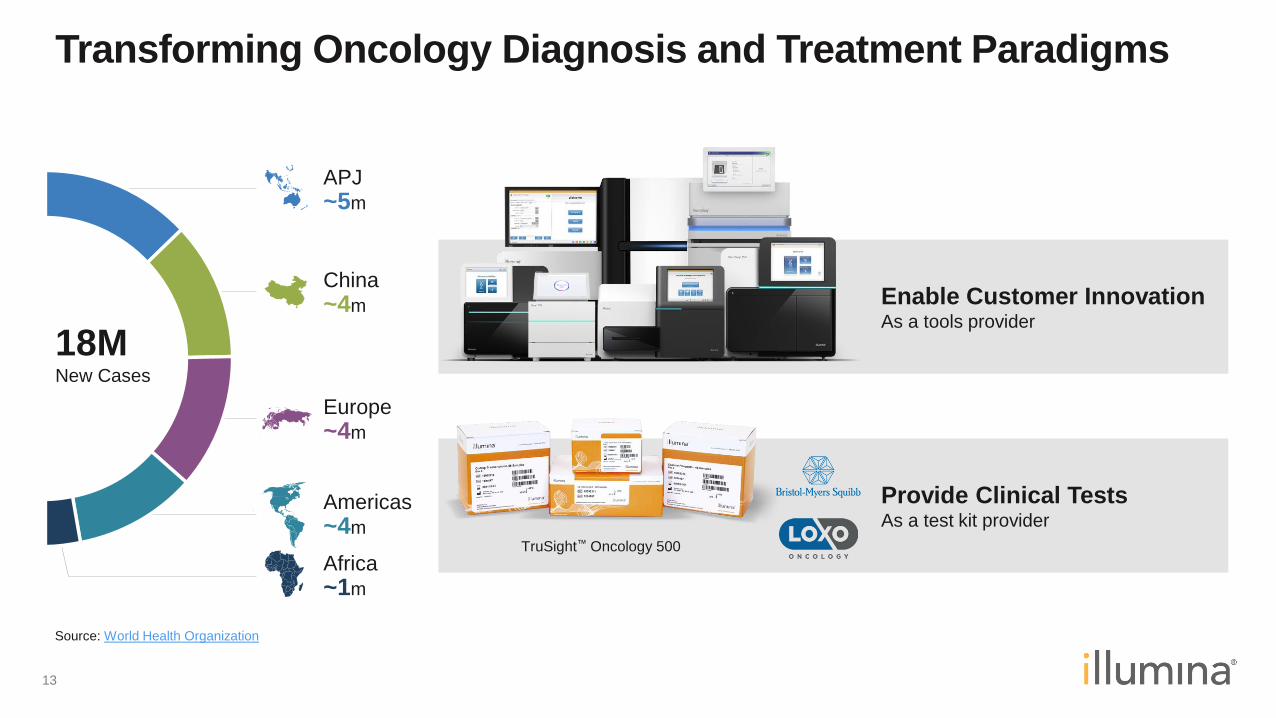
APJ~5m
Europe~4m
Americas~4m
Africa~1m
Transforming Oncology Diagnosis and Treatment Paradigms
Enable Customer InnovationAs a tools provider
Provide Clinical TestsAs a test kit provider
TruSight™ Oncology 500
18MNew Cases
Source: World Health Organization
China~4m

14
Enabling Population Genomics Around the World
● 1 million participants
● $1.5B of funding over 10 years
● >10,000 WGS in 2019
● Three selected genome centers
● Illumina scientific contribution of
1M Global Diversity Arrays
All of Us
Begins 2019
1M samples
Singapore 10k
Continues phase 1 in 2019
1M samples by 2028
GeL & NHS
100k samples
1M WGS in 5 years
France PFMG
Begins 2019
235k samples/yr by 2025
~50 programs
15
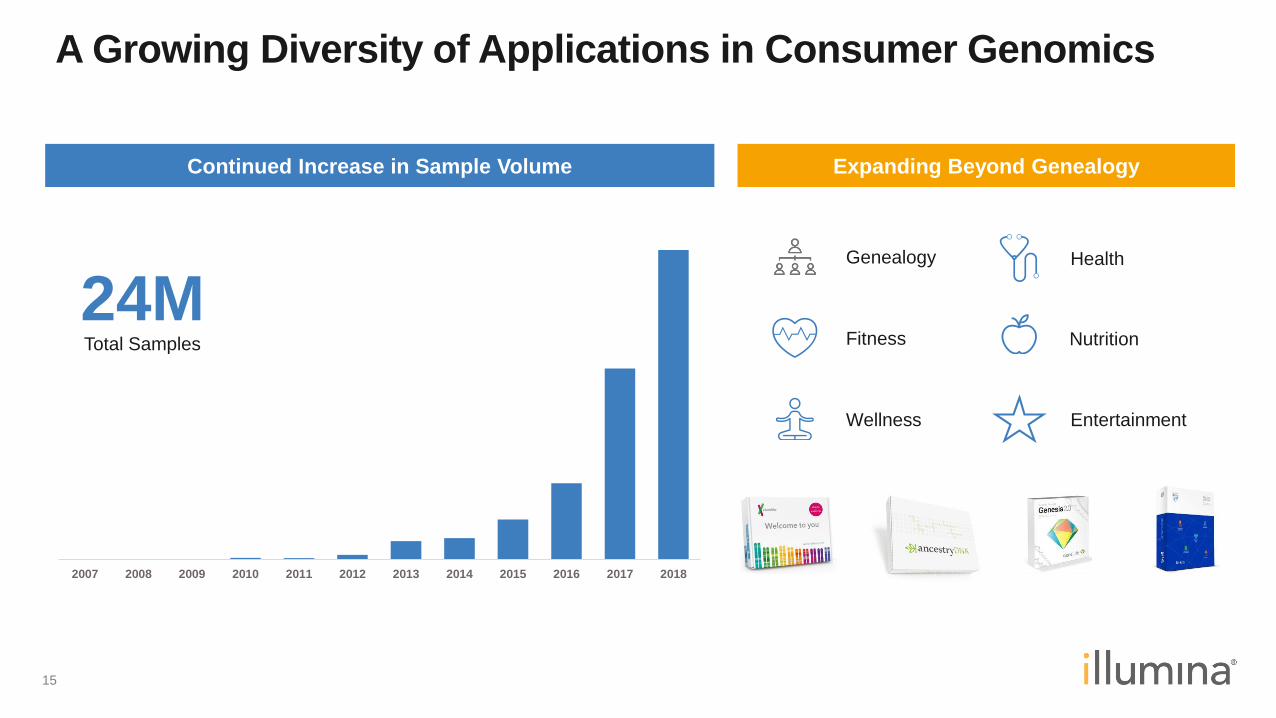
2007 2008 2009 2010 2011 2012 2013 2014 2015 2016 2017 2018
A Growing Diversity of Applications in Consumer Genomics
Expanding Beyond Genealogy
24MTotal Samples
Continued Increase in Sample Volume
Genealogy
Fitness
Wellness
Nutrition
Entertainment
Health
16
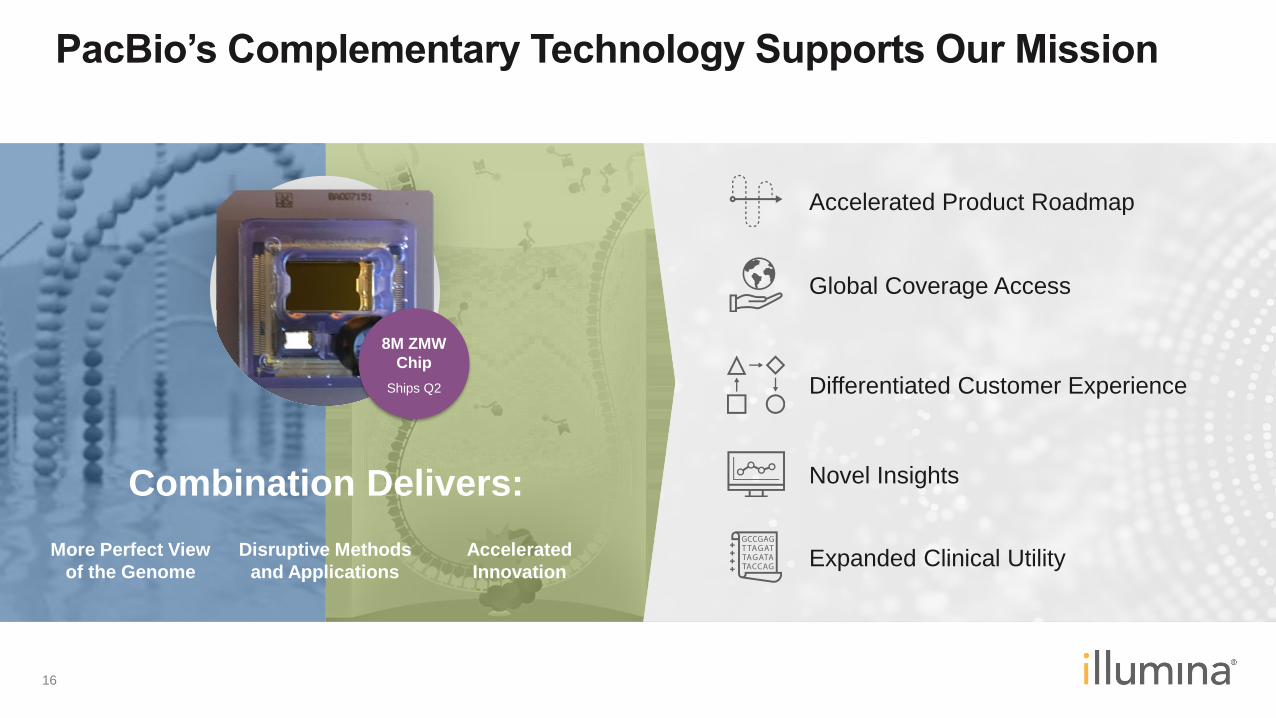
8M ZMW
Chip
Ships Q2
More Perfect View
of the Genome
Disruptive Methods
and Applications
Accelerated
Innovation
Global Coverage Access
Accelerated Product Roadmap
PacBio’s Complementary Technology Supports Our Mission
Expanded Clinical Utility
Novel Insights
Differentiated Customer Experience
Combination Delivers:
17
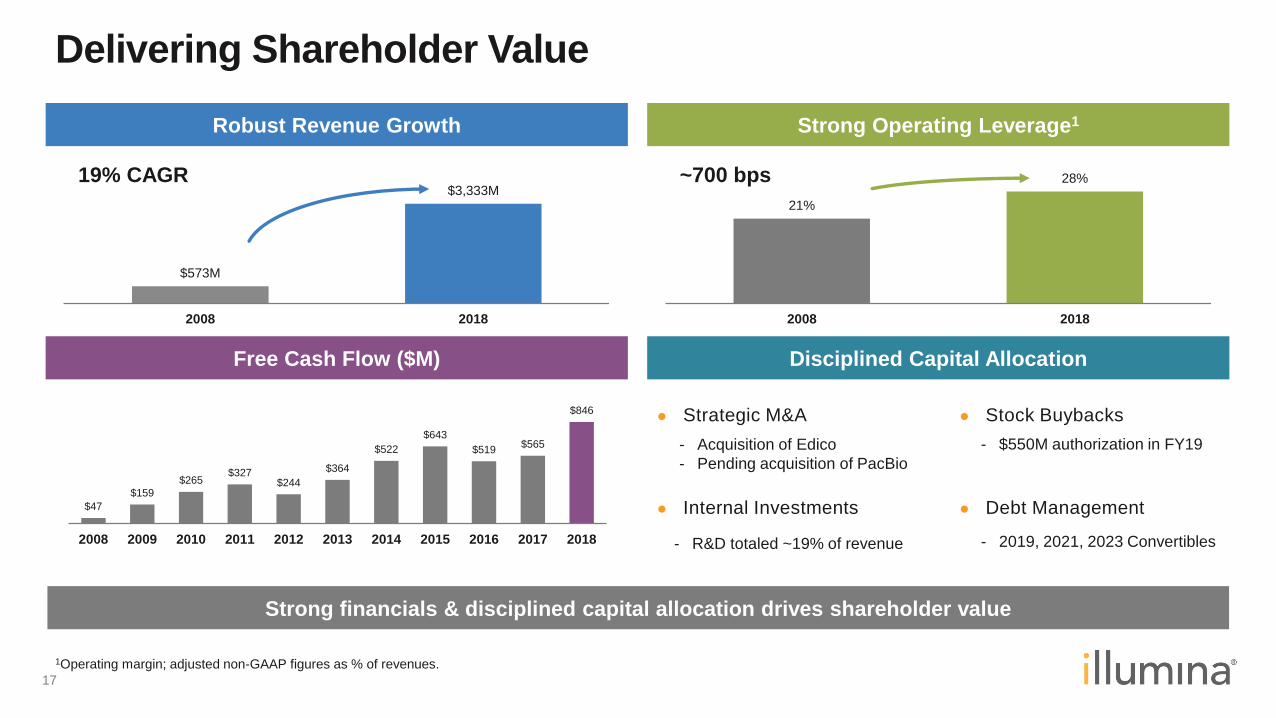
Delivering Shareholder Value
1Operating margin; adjusted non-GAAP figures as % of revenues.
$573M
$3,333M
2008 2018
Robust Revenue Growth
$47
$159
$265$327
$244
$364
$522
$643
$519$565
$846
2008 2009 2010 2011 2012 2013 2014 2015 2016 2017 2018
Free Cash Flow ($M)
21%
28%
2008 2018
Strong Operating Leverage1
Disciplined Capital Allocation
● Strategic M&A
● Internal Investments
● Stock Buybacks
● Debt Management
19% CAGR ~700 bps
Strong financials & disciplined capital allocation drives shareholder value
- Acquisition of Edico
- Pending acquisition of PacBio
- 2019, 2021, 2023 Convertibles
- $550M authorization in FY19
- R&D totaled ~19% of revenue
18
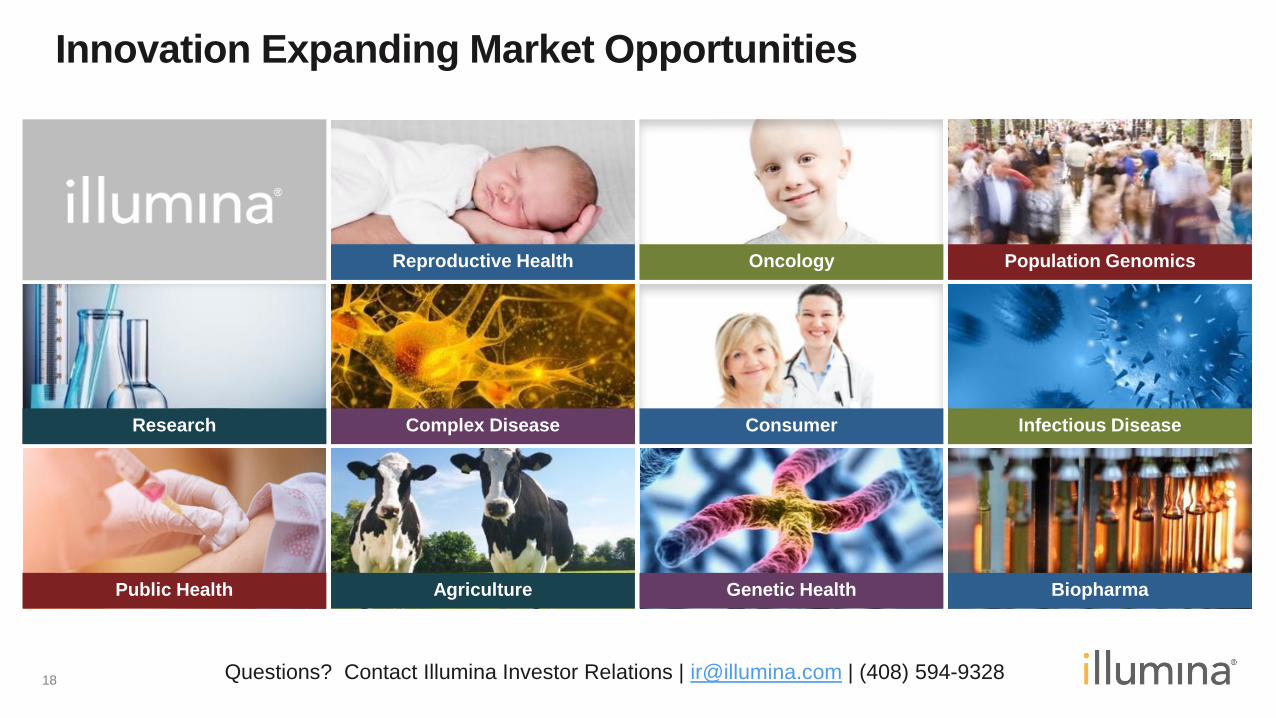
Innovation Expanding Market Opportunities
Research
Public Health Agriculture
Complex Disease
Reproductive Health Oncology
Consumer
Genetic Health Biopharma
Infectious Disease
Population Genomics
Questions? Contact Illumina Investor Relations | [email protected] | (408) 594-9328
19
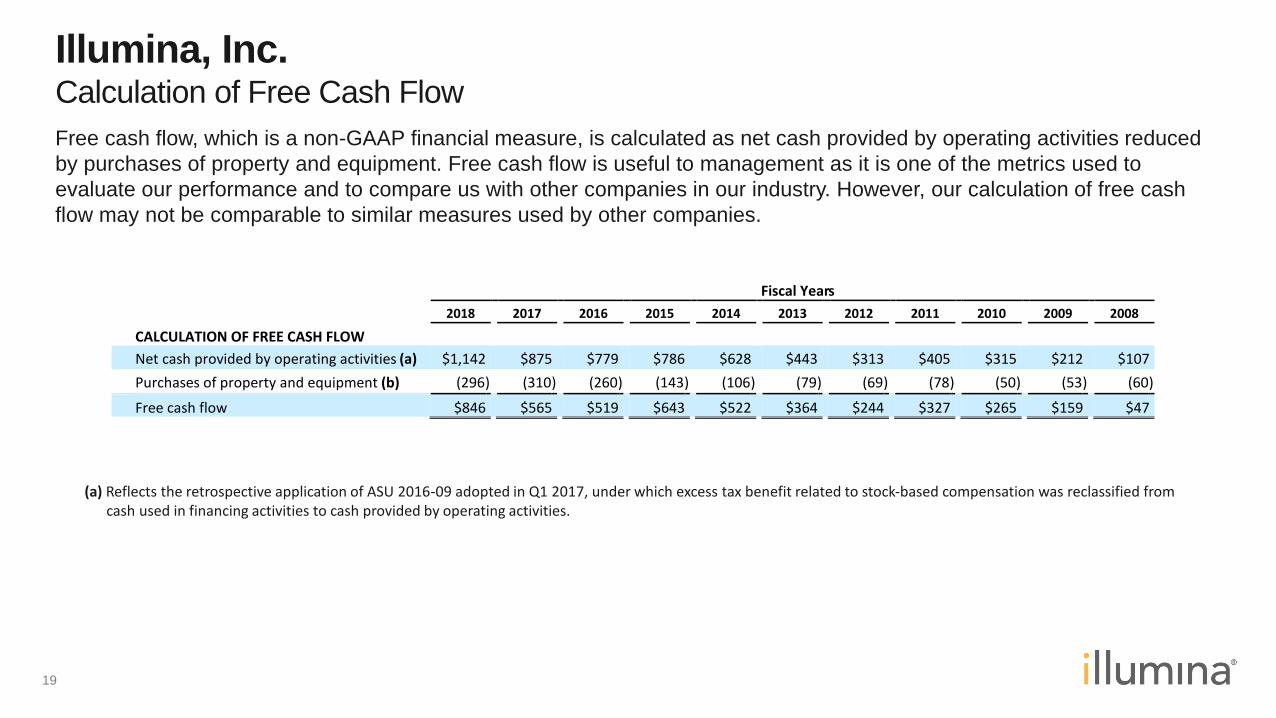
Illumina, Inc.Calculation of Free Cash Flow
Free cash flow, which is a non-GAAP financial measure, is calculated as net cash provided by operating activities reduced
by purchases of property and equipment. Free cash flow is useful to management as it is one of the metrics used to
evaluate our performance and to compare us with other companies in our industry. However, our calculation of free cash
flow may not be comparable to similar measures used by other companies.
(a) Reflects the retrospective application of ASU 2016-09 adopted in Q1 2017, under which excess tax benefit related to stock-based compensation was reclassified from cash used in financing activities to cash provided by operating activities.
Fiscal Years
2018 2017 2016 2015 2014 2013 2012 2011 2010 2009 2008
CALCULATION OF FREE CASH FLOW
Net cash provided by operating activities (a) $1,142 $875 $779 $786 $628 $443 $313 $405 $315 $212 $107
Purchases of property and equipment (b) (296 ) (310 ) (260 ) (143 ) (106 ) (79 ) (69 ) (78 ) (50 ) (53 ) (60 )
Free cash flow $846 $565 $519 $643 $522 $364 $244 $327 $265 $159 $47

20
Illumina, Inc.Reconciliation of Non-GAAP Operating Margin
Non-GAAP operating margin excludes the effect of the pro forma adjustments detailed below. Management has excluded
the effects of these items in these measures to assist investors in analyzing and assessing our past and future core
operating performance.
(a) 2008 non-GAAP results have been restated to include stock-based compensation in order to conform to current period presentation.
(b) Amount consists primarily of employee and lease exit costs related to restructuring that occurred in Q1 2018.
(c) Amount for 2018 consists of acquisition related expenses from the pending Pacific Biosciences acquisition.
(d) Compensation expense represents the contingent consideration due to stockholders of Avantome, Inc. for post-combination services for a three year period contingent upon the primary stockholders’ continued employment. This expense was included within research and development on our statement of operations for FY 2008.
RECONCILIATION BETWEEN GAAP AND NON-GAAP OPERATING MARGIN AS A PERCENT OF REVENUE:
Fiscal Years
2018 2008 (a)
GAAP operating margin 26.5 % 18.3 %
Amortization of acquired intangible assets 1.1 % 1.8 %
Restructuring (b) 0.2 % —
Acquisition related expense (c) 0.1 % —
Impairment of manufacturing equipment — 0.7 %
Compensation expense (d) — 0.3 %
Non-GAAP operating margin 26.5 % 21.1 %