sample costs to produce and harvest fresh market
TRANSCRIPT

University of California Agriculture and Natural Resources Cooperative Extension and Agricultural Issues Center
UC Davis Department of Agricultural and Resource Economics
2018
SAMPLE COSTS TO PRODUCE AND HARVEST FRESH MARKET BLACKBERRIES
Primocane Bearing
Central Coast Region Santa Cruz, Monterey and San Benito Counties
Mark Bolda Farm Advisor, UC Cooperative Extension, Santa Cruz, Monterey and San Benito Counties Laura Tourte Farm Advisor, UC Cooperative Extension, Santa Cruz, Monterey and San Benito Counties Jeremy Murdock Staff Research Associate, Agricultural Issues Center and Department of Agricultural
and Resource Economics, UC Davis Daniel A. Sumner Director, Agricultural Issues Center, Frank H. Buck Jr. Professor,
Department of Agricultural and Resource Economics, UC Davis.

University of California Agriculture and Natural Resources Cooperative Extension and Agricultural Issues Center
UC Davis Department of Agricultural and Natural Resources
SAMPLE COSTS TO PRODUCE AND HARVEST FRESH MARKET BLACKBERRIES Primocane Bearing
Central Coast Region – Santa Cruz, Monterey and San Benito Counties 2018
CONTENTS
INTRODUCTION ............................................................................................................................................. 2 ASSUMPTIONS ................................................................................................................................................ 3 Establishment Year: Cultural Practices and Material Inputs. ............................................................................ 3 Production Year 1 to 4: Cultural Practices and Material Inputs ........................................................................ 5 Labor, Equipment, and Interest Costs ................................................................................................................ 7 Cash Overhead Costs .......................................................................................................................................... 9 Non-Cash Overhead Costs ................................................................................................................................ 10 REFERENCES ................................................................................................................................................. 12 Table 1. Costs per Acre to Establish, Produce and Harvest Blackberries: Summary ...................................... 13 Table 2. Costs per Acre to Establish and Harvest Blackberries ....................................................................... 14 Table 3. Material Costs per Acre to Establish and Harvest Blackberries......................................................... 16 Table 4. Monthly Cast Cost per Acre to Establish and Harvest Blackberries……………………………… .. 18 Table 5. Costs per Acre to Produce and Harvest Blackberries: Production Years 1-4 ................................... 20 Table 6. Costs and Returns per Acre to Produce and Harvest Blackberries: Production Years 1-4 ............... 22 Table 7. Monthly Cash Costs per Acre to Produce and Harvest Blackberries: Production Years 1-4............. 24 Table 8. Ranging Analysis: Production and Harvest Years 1-4 ....................................................................... 26 Table 9. Whole Farm Annual Equipment, Investment, and Business Overhead Costs.................................... 27 Table 10. Hourly Equipment Costs.................................................................................................................... 28
Acknowlegements. Thanks is extended to the growers, suppliers and consultants that provided information and
expertise in the development of this study.
INTRODUCTION
Sample costs to produce and harvest primocane blackberries in Santa Cruz, Monterey and San Benito Counties are presented in this study. The study is intended as a guide only, and can be used to make production decisions, determine potential returns, prepare budgets, and evaluate production loans. The practices described are based on production and harvest procedures considered typical for this crop and area, and may not apply to every farm. Sample costs for labor, materials, equipment, and custom services are based on current figures. A blank column, "Your Cost", is provided to enter your actual costs on Tables 2, 3, 5, and 6.
The hypothetical farm operation, production and harvest practices, overhead, and calculations are described under assumptions. For additional information or explanation of calculations used in the study call the Agricultural Issues Center, University of California, Davis, (530) 752-4651, UC Cooperative Extension Santa Cruz County: Mark Bolda (831) 763-8025 and Laura Tourte (831) 763-8005.
Sample Cost of Production studies for many commodities are available and can be downloaded from the website https://coststudies.ucdavis.edu. Archived studies are also available on the website.
The University of California is an affirmative action/equal opportunity employer.
Blackberry Cost and Return Study – Central Coast – University of California
2
ASSUMPTIONS
The following assumptions refer to calculations in Tables 1 to 10 beginning on page 13 and pertain to sample costs to establish, produce, and harvest primocane blackberries in the Central Coast Region - Santa Cruz, Monterey, and San Benito Counties. Practices described represent methods considered typical for conventional blackberry production in the region. The costs, practices and materials will not be applicable to all situations every production year. Cultural practices, materials and blackberry production and harvest costs vary by grower and region, and differences can be significant. The practices and inputs used in the cost study serve as a guide only. The use of trade names and cultural practices in this report does not constitute an endorsement or recommendation by the University of California nor is any criticism implied by omission of other similar products or cultural practices.
Blackberries are also produced using organic methods along the Central Coast; it is estimated that roughly 20 percent of the crop is produced and marketed as organic. Many of the same practices that are used in conventional blackberry production are also used in organic production. Differences between the two production systems are primarily, though not exclusively, found in approaches to crop fertilization and pest management.
Farm. The farm consists of 30 contiguous acres of rented land. Blackberries are planted on 15 acres. Other berries are planted on 12 acres; roads, the irrigation system and farm buildings account for three acres. The grower rents the land, which includes a small shop, for $2,800 per acre per year, and owns the equipment and machinery.
Establishment Year: Cultural Practices and Material Inputs Tables 1, 2 and 3
Crop Cycle. Blackberries are a perennial crop that, when well-managed, can produce for up to 8 years in this area. For this study, we consider costs and returns associated with the establishment of a primocane bearing blackberry crop, along with four production and harvest cycles. This planting and production cycle is intended to ensure optimal productivity and fruit quality. On farming operations where plants remain healthy and productivity is high, some growers may choose to extend the production and harvest cycle by one or more years beyond the five total cycles described here. By contrast, in operations where crop vigor and health has declined, the crop cycle may be shortened.
Land Preparation. Two soil samples per 15 acres are taken for soil analysis prior to land preparation to help determine fertilization practices. For this study, land is prepared for planting by first disking three times, chiseling (ripping) three feet deep four times and disking three times. Six tons of composted greenwaste is applied and incorporated into the soil at the same time as the disking operations. The field is also chiseled one and one-half feet deep one day prior to soil fumigation for good fumigant penetration. The fumigation is a combination of chloropicrin and 1,3-dichloropropene for pest management purposes. Cost for a solid, tarped fumigation is estimated at $4,400 per acre. After fumigation, the field is disked again and rototilled, if necessary, to break up cloddy soils. The field is prepared (layout) and beds are then listed and shaped.
Plant Stock. This study assumes that a primocane bearing blackberry variety is planted. Primocane blackberries can be managed and pruned such that they are able to produce fruit over an extended period of time each year. The price of tissue cultured plant stock depends on the variety selected, a possible storage charge, and shipping costs. Depending on the source of the plant material, a royalty may be included in the plant cost or be assessed separately. For this study the total cost for each plant is estimated at $1.70.
Blackberry Cost and Return Study – Central Coast – University of California
3

Planting. In this study primocane blackberries are planted by hand in January, but can be planted as early as December and as late as March. Planting density is 2,178 plants per acre, using 8-foot rows spaced 30-inches apart. Labor is estimated at 24 hours per acre to plant.
Trellis System. Each acre of the blackberry production operation is assumed to be 200 feet wide and 218 feet long, with 25 rows per acre using 8-foot row spacing. A trellis system is installed in the establishment year as soon as possible after planting. The total cost is estimated at $3,795 per acre, which includes materials and labor. Material costs include end posts, stakes (also referred to as pickets), and wire system. Because trellis materials can be used for other plantings, the material cost (estimated at roughly $2,300 per acre) is included in the non-cash or investment overhead and amortized accordingly. Installation labor is estimated at 89 hours per acre for a cost of $1,495 per acre.
Irrigation System. A drip irrigation system is installed during the establishment year as soon as possible after planting, with drip lines tied to the lower wire of the trellis system and emitters placed every 6-inches. During the winter, crop growth is generally dependent on seasonal rains. The total number of irrigations varies depending on climatic conditions. Irrigation practices during the establishment year are similar to those in all subsequent production years. Drip irrigations are assumed to be twice per week, usually beginning in April and ending in October. A total of 24 acre-inches per acre per year is applied. Total water use will vary depending upon factors such as irrigation method, soil type, weather, and the time of the year the crop is planted. The cost of water is estimated at $22.50 per acre-inch, for a total of $270 per acre-foot. Water costs vary considerably in the area depending upon the water district or agency, delivery, associated fees, and pumping variables.
Tunnel Installation and Management. Tunnels, also called hoop houses, are constructed over the planted blackberries. Each tunnel is 24 feet wide (covering three rows) and 200 feet long. The structures consist of a line of anchor posts, bridged by a metal frame, and covered with 5 mil thick semi-clear plastic, which is fastened down with a rope. Struts on each side of the tunnel maintain tension down the length of the tunnel. Labor to install tunnels is estimated at 40 hours per acre. Tunnels are actively managed during the establishment and all other production years. This includes managing the plastic cover, which is taken down and secured, and unfurled and put over the structures, as needed to ensure optimal growing conditions each year. Tunnel management takes place from March to October and is estimated at 38 hours per acre. The structures are removed with completion of the cropping cycle and all materials except the plastic can be used for a subsequent crop.
Cane Management. Plants are pruned and trained during the establishment and all subsequent production years. Pruning, also known as “heading back” or “hard pinch” takes place in April and May, to reduce each cane’s growing point to 3 or 4.5 feet tall. The practice stimulates growth of lateral or fruiting canes to ensure optimal yield. In May and June the canes are trained or propped up on the trellis system to support cane growth and help with fruit visibility and harvest efficiency. Labor for both practices combined is estimated at roughly 131 hours per acre for a total cost of $2,201. In December of each year (after harvest), all canes are mowed to ground level with a bladed handheld weed eater. Labor for this practice is estimated at 71 hours per acre for a total cost of $1,193. The canes are placed in row centers, shredded with a flail mower, and disked into the soil. Trellis system repairs, if needed, are also performed during this time.
Fertilization. In addition to the soil samples and composted greenwaste discussed above, an 18-13-16 fertilizer
is applied at 400 pounds per acre and incorporated into the beds when shaped prior to planting. In March, 21-0-
0-24 (ammonium sulfate) is injected through the irrigation system four times at the rate of 20 pounds per acre
per irrigation. From early April to late July, a 3-18-18 fertilizer at 24 pounds per application is injected twice
monthly. Labor hours for injecting the liquid fertilizer are assumed to be included in the irrigation labor.
Blackberry Cost and Return Study – Central Coast – University of California
4

Weed Mats. Weed mats are installed in tunnel anchor rows during the establishment year to assist with weed management, especially around anchor posts, for all five production and harvest cycles.
Pest management and all subsequent practices during the establishment year are similar to those for all
production years. To avoid duplication, text describing these practices and costs are found in the
following section. Tables 1 to 3 also provide more information on establishment practices and costs.
Production Years 1 to 4: Cultural Practices and Material Inputs Tables 1 and 4-10
Fertilization. In each of the four production years two soil samples for each 15 acres are analyzed to assist with fertilizer decisions. Fertilizers are either injected through the drip system and/or applied mechanically, with nitrogen applied early in the season, and supplemented with phosphorus and potassium later in the season. Leaf samples for nutrient analysis are collected mid-season to determine the nutritional needs of the plants. With the exception of the establishment year, ammonium sulfate (21-0-0-24) is band applied twice in February
in equal amounts (75 lbs each application) for a total application rate of 150 pounds per acre. Incorporation is
expected with winter rains. In March, 17-0-0 is injected through the irrigation system four times at the rate of 20
pounds per acre per application. In all years, from early April to late July, 3-18-18 at 24 pounds per acre is
applied twice monthly. Labor for liquid fertilizer practices is included with labor hours for irrigation.
Irrigation. Depending on effective rainfall and available soil moisture, plants are irrigated from April through October twice per week. Total irrigation water use during the season is estimated at two acre-feet per acre per year. The cost of water includes pumping costs and is estimated at $270 per acre-foot or $22.50 per acre-inch. Water costs vary considerably in the area depending upon the water district or agency, delivery, associated fees, and pumping variables. In this study, the lines are flushed and repaired in April prior to the first irrigation.
Tunnel Management. To ensure optimal growing conditions each year the plastic covers are taken down and secured, and unfurled and put over the structures, as needed. Tunnel management takes place from March to October; labor is estimated at 38 hours per acre for a total cost of $638. The structures are removed with completion of the cropping cycle and all materials except the plastic can be used for a subsequent crop.
Pest Management. The pesticides and rates mentioned in this cost study are listed in UC Integrated Pest
Management Guidelines, Caneberries and the UC Fresh Market Caneberry Production Manual. For additional
information on pesticides, pest identification, monitoring, and management visit the UC IPM website at
www.ipm.ucanr.edu or contact your local UCCE farm advisor. Information and pesticide use permits are
available through the local county agricultural commissioner's office. Pesticides discussed in this study are
commonly used in blackberry production and are those used to calculate rates and costs. However, they are not
recommendations, and other pesticides may be available. Spray adjuvants are recommended for use with many
pesticides, but are not shown in this study. Pesticide costs vary by location, brand, and volume purchased.
Pesticide costs in this study are from a single dealer and shown as full retail.
Pest Control Adviser (PCA). A PCA monitors the field for pest problems and nutritional status during the
establishment and all subsequent production years. Growers may hire private consultants on a per acre basis or
as part of an agreement with an agricultural chemical and fertilizer company. In this study costs for a PCA are
included at $125 per acre per year.
Weeds. During the establishment and production years weeds are managed primarily by monthly hand weeding beginning in May and ending in October for a total cost per acre of $588. Some growers report higher hand
Blackberry Cost and Return Study – Central Coast – University of California
5

weeding costs, which are determined by weed pressure and the use of weed mats in anchor rows. Row middles are disked in June and August.
Diseases. Several diseases are found in primocane blackberries, including downy and powdery mildew. In the establishment and all production years, Aliette and Ridomil are each applied once per season in February or March for downy mildew control. Pristine is applied twice per season, once in June and once in July, for powdery mildew control. All applications are made with an air-blast sprayer. Plants should be monitored for potential diseases during the growing season as production conditions will differ from year to year.
Insects/Arthropods. In the establishment and all production years, lepidopterous pests such as Light Brown Apple Moth (LBAM) and other leafrollers are controlled with the use of pheromone twist ties (for LBAM) and two applications of Success in April for LBAM and other leafrollers. Spotted Wing Drosophila (SWD) is managed by one application of Malathion during the first week in July, followed by one application of Mustang Max in August. Broad mites have emerged recently as a pest issue, though in the past were not typically found on blackberry. No treatment thresholds have yet been developed for broad mites. Therefore, control measures are limited. If mite numbers are high and/or increasing, a pesticide application may be warranted. The number of pest management applications and materials will vary depending upon the pest and infestation levels each year.
Physiological disorders. Blackberry fruit are subject to red duplet disorder, also called druplet reversion or reddening, after harvest (Edgley). This disorder is thought to be caused by fruit damage at harvest or during transportation to the cooler, combined with rapid changes in fruit temperature. Strategies to manage this disorder include harvesting during the coolest part of the day, along with quick delivery to the cooler.
Pollination. Bees are necessary for blackberry pollination. Cost for the establishment and all production years is estimated at $375 per acre, or three hives at $125 per hive. The grower contracts with a beekeeper; hives are set in the field in May and remain until September.
Harvest. Harvest in the establishment and each production year begins in late June or early July, and continues through October, optimal weather and production conditions permitting. Blackberries are harvested by hand every few days at an average seasonal cost of $6.25 per tray, which accounts for both hourly and piece rate. Crew size and number of crews may vary through the season depending upon the yield. Harvest rate per person ranges from one to five trays per hour, with the lower rate early and late in the season. The fruit is picked using one-half gallon buckets. It is then field sorted and packed into a tray containing 12 six ounce plastic clam shells. Each tray weighs 4.5 pounds. A packing and sorting wagon/trailer with a stainless steel table-top and a shade structure is pulled by a small tractor to the picking area. The wagon is managed by a supervisor. Harvesters consist of one crew of 36 who hand pick the berries, a crew supervisor and a checker-loader who records the trays picked by each crew member and who also loads the trays on the truck. The truck holds up to two pallets with 144 trays per pallet and takes one hour round trip to deliver the fruit to the cooler. For this study, it is assumed that the truck makes at least one trip per day. To keep fruit at an optimal postharvest temperature, the truck may make deliveries to the cooler with less than full loads. The cooler charges $0.85 per tray for cooling services.
Yields and Returns. This study assumes a yield range of 3,000 to 5,000 trays per acre, with a representative marketable yield of 4,000 trays per acre. The estimated unit price to growers is $14 per tray based on the 2014 to 2018 Salinas-Watsonville shipping point prices from the USDA Agricultural Market Service. Prices range from a low of $11 to a high of $17 depending on market conditions. Estimated net returns to growers for a combination of yields and prices is shown on Table 8, Ranging Analysis.
Blackberry Cost and Return Study – Central Coast – University of California
6

Cane Management. New canes (for the next crop) begin to grow after the older (fruited) canes are mowed postharvest. They are trained or propped up on the trellis system to support cane growth and expose fruit for harvest efficiency. New canes are headed back each year in April and May to stimulate lateral growth or fruiting canes and ensure optimal yield. Labor cost for these two operations is estimated to be roughly $2,201 per acre, or 131 labor hours per acre. In December of each year, all canes are mowed to ground level with a bladed handheld weed eater. Labor for this practice is estimated at 71 hours per acre for a total cost of $1,193. The canes are placed in row centers, shredded with a flail mower, and disked into the soil. Trellis system repairs, if needed, are also performed during this time.
At the end of the fourth production year, blackberry canes are removed from the field, as are the tunnel, trellis and drip systems. Operations to prepare the field for the next new crop also take place during this time. Labor for these operations is estimated at 143 hours per acre for a total of $2,302; a portion of this cost is shown for production years 1-4 on Table 4 under postharvest.
Cover Crop. In December of the Establishment Year and Production Years 1-3, Merced Rye is planted as a cover crop in 4-foot swaths in crop row middles for assistance with weed management and erosion control. Cover crop growth is dependent on fall and winter rains. The cover crop is mowed in March of each production year to reduce the above ground biomass. Seventy-five percent of the cover cropping cost has been included in this study because there is no cover cropping during the last crop cycle, production year 4.
Growing Cost. Some growers along the Central Coast of California prefer to focus on growing costs and therefore separate total harvest costs from total cash costs, equipment depreciation and replacement costs. For this study, growing cost is noted at the bottom of Table 4 and is calculated by subtracting total harvest costs from total costs. Growing cost depend upon many variables including location and grower.
Labor, Equipment, and Interest Costs
Labor. The labor rates used in this study are $22.40 per hour for machine operators and $16.80 for general labor, which includes overhead of 40 percent. The basic hourly wages are $16.00 for machine operators and $12.00 for general labor. The overhead includes the employers’ share of federal and California state payroll taxes, workers' compensation insurance for berry crops (code 0179), and a percentage for other possible benefits. Workers’ compensation insurance costs will vary among growers, but for this study the cost is based upon the average industry rate as of January 1, 2018. Labor for operations involving machinery are 20% higher than the operation time given in Table 1 to account for the extra labor involved in equipment set up, moving, maintenance, work breaks, and field repair.
California Minimum Wage and Overtime Rules. In 2016, The California State Government passed new legislation concerning overtime and minimum wage rates that may affect farm labor costs. The California minimum wage rate for 2018 is $11.00 per hour for companies with more than 25 employees and will rise each year by $1.00 per hour until it reaches $15.00 per hour in 2022. Businesses with 25 or fewer employees are given an additional year to comply with the changes. For businesses with 25 or fewer employees, the minimum wage rate is $10.50 per hour for 2018 and increases to $11.00 per hour in 2019; thereafter, their minimum wage rate increases by $1.00 per hour each year from $11.00 per hour in 2019 to $15.00 per hour in 2023.
Recent California regulations also decrease the overtime threshold—the number of hours required to be worked before overtime benefits are received—for agricultural workers. Beginning January 2019, for businesses with more than 25 employees, the regulations decrease the overtime threshold for agricultural workers from 60 hours per week and 10 hours per day by 5.0 hours per week and 0.5 hours per day each year until it reaches 40 hours per week and 8.0 hours per day in 2022. Businesses with 25 or fewer employees are given an additional three years to comply with the regulation’s changes. By January 1, 2019 (2022 for
Blackberry Cost and Return Study – Central Coast – University of California
7

employers with 25 or fewer employees) employees will also be entitled to overtime for 8 hours on the seventh consecutive day of work.
These regulations may cause increased cost of labor used on farms, whether as direct hires, as farm labor contractor employees or as a component of custom services. For more information and to view the California minimum wage and overtime phase-in schedules visit http://aic.ucdavis.edu/
Federal H-2A Program. Growers may also choose to use H-2A guestworker visa program to employ workers. Rates of pay are determined by the highest applicable wage rates that are in effect at the time work is performed: the adverse effect wage rate (AEWR), the applicable prevailing wage, the agreed-upon collective bargaining rate, or the Federal or State statutory minimum wage (US Department of Labor). Growers also need to comply with other requirements associated with the H-2A program, including those for housing, meals, transportation. Use of this program may result in labor costs that are higher than those shown in this study but may be necessary in order to assure a reliable supply of labor.
Interest on Operating Capital. Interest on operating capital is based on cash operating costs and is calculated monthly until harvest at a nominal rate of 5.00 percent per year. A nominal interest rate is the typical market cost of borrowed funds. The interest cost of post-harvest operations is discounted back to the last harvest month using a negative interest charge. The rate will vary depending upon various factors, but the rate in this study is considered a typical lending rate by a farm lending agency as of January 2018.
Equipment Operating Costs. Repair costs are based on purchase price, annual hours of use, total hours of life, and repair coefficients formulated by American Society of Agricultural and Biological Engineers (ASABE). Fuel and lubrication costs are also determined by ASABE equations based on maximum power takeoff (PTO) horsepower, and fuel type. Prices for on-farm delivery of red dye diesel and gasoline are $3.60 (excludes excise taxes) and $3.20 per gallon, respectively. The cost includes a 2 percent local sales tax on diesel fuel and 8 percent sales tax on gasoline. Gasoline costs also include federal and state excise taxes, which are refundable for on-farm use when filing income taxes. The fuel, lube, and repair cost per acre for each operation in Table 1 is determined by multiplying the total hourly operating cost in Table 6 for each piece of equipment used for the selected operation by the hours per acre. Tractor time is 10 percent higher than implement time for a given operation to account for setup, travel, and down time.
Pickup Truck/ATV. This study includes a cost for the use of a pickup truck and ATV for business purposes.
Risk. The risks associated with producing and marketing blackberries are considered high. While this study makes every effort to model a production system based on typical, real world practices, it cannot fully represent all risk associated with agriculture, including financial, production, market, legal, and human resource risks that ultimately affect the profitability and economic viability of blackberries. In this area invasive pests pose particular regulatory and management challenges and increase production and marketing risks for growers. In addition, labor availability, scheduling and cost is a noteworthy human resource risk. In recent years labor constraints have meant challenges in securing and retaining a sufficient number of workers to ensure timely and effective farm operations. Some growers report paying higher wages to attract and retain workers; others may pay overtime because of labor constraints. Overall profitability of the crop is negatively impacted in either case.
Blackberry Cost and Return Study – Central Coast – University of California
8
Cash Overhead
Cash overhead consists of various cash expenses paid out during the year that are assigned to the whole farm and not to a particular operation. Because overhead costs are farm and ranch specific, costs will vary among growers.
Property Taxes. Counties charge a base property tax rate of 1 percent on the assessed value of the property. In
some counties special assessment districts exist and charge additional taxes on property including equipment,
buildings, and improvements. For this study, county taxes are calculated as 1 percent of the average value of
the property. Average value equals new cost plus salvage value divided by 2 on a per acre basis.
Insurance. Insurance for farm investments vary depending on the assets included and the amount of coverage. Property insurance provides coverage for property loss and is charged at 0.846 percent of the average value of the assets over their useful life. Liability insurance covers accidents on the farm and costs $640 for the entire farm.
Office Expenses. Annual office and business expenses are estimated at $750 per acre. Costs include, but are not limited to, a variety of administration and office supplies, bookkeeping, accounting, road maintenance, utilities and other miscellaneous expenses.
Land Rent. Land rents in the three county area range from $450 to $3,300 per acre per year. In this study, land rent is assumed to be $2,800 per acre per year. Land rent includes developed well(s) and irrigation system. In general, growers are responsible for the portion above ground such as the pump, and the landowner is responsible for what is below ground, such as the well running dry (please see the irrigation section for more information).
Food Safety and Regulatory Programs. To ensure the safety of fresh products, accommodate buyer requests, and comply with regulatory programs such as those for water and air quality, growers now have in house departments and/or staff specially dedicated to supervision and management of these programs. Part of a food safety program is participation in third party (independent) audits. Costs associated with food safety programs vary depending upon the farm and inspection circumstances, administrative costs and personnel training and hygiene needs and are estimated at $100 per acre per year. In addition, a cost of $80 per acre per year is included for management and compliance with regulatory programs.
Field Sanitations. Sanitation services provide a portable toilets and washing stations to the farm. The cost includes double toilets with washbasins, delivery and pickup, and 12 months of servicing. Costs include soap or other suitable cleaning agent, and single use towels. Separate potable water and single use drinking cups are also supplied.
Farm Supervisor. The grower hires a farm supervisor to oversee some of the cultural and harvest operations as well as fill in on some of the operations where temporary assistance is needed. The estimated cost for the supervisor is $1,250 per acre. Larger operations may have multiple supervisory levels; associated costs will therefore differ.
Investment Repair. Repair costs are the annual maintenance costs for investments in non-cash overhead. For this study, annual repairs are calculated as 2 percent of the new cost, with the exception of drip system repairs, which are 5 percent of the total cost and include materials & labor.
Blackberry Cost and Return Study – Central Coast – University of California
9

Non-Cash Overhead
Non-cash overhead, shown on an annual per acre basis, is calculated as the capital recovery cost for equipment and other farm investments.
Capital Recovery Costs. Capital recovery cost is the annual depreciation and interest costs for a capital
investment. It is the amount of money required each year to recover the difference between the purchase price
and salvage value (unrecovered capital). It is equivalent to the annual payment on a loan for the investment
with the down payment equal to the discounted salvage value. This is a more complex method of calculating
ownership costs than straight-line depreciation and opportunity costs, but more accurately represents the annual
costs of ownership because it takes the time value of money into account (Boehlje and Eidman). The formula
for the calculation of the annual capital recovery costs is ((Purchase Price – Salvage Value) x Capital Recovery
Factor) + (Salvage Value x Interest Rate).
Salvage Value. Salvage value is an estimate of the remaining value of an investment at the end of its useful life.
For farm machinery (tractors and implements) the remaining value is a percentage of the new cost of the
investment (Boehlje and Eidman). The percent remaining value is calculated from equations developed by the
American Society of Agricultural and Biological Engineers (ASABE) based on equipment type and years of
life. The life in years is estimated by dividing the wear out life, as given by ASABE by the annual hours of use
in this operation. For other investments including irrigation systems, buildings, and miscellaneous equipment,
the value at the end of its useful life is zero. The salvage value for land is the purchase price because land does
not depreciate. The purchase price and salvage value for equipment and investments are shown in Table 8.
Capital Recovery Factor. Capital recovery factor is the amortization factor or annual payment whose present
value at compound interest is 1. The amortization factor is a table value that corresponds to the interest rate
used and the life of the machine.
Interest Rate. The interest rate of 5.50 percent is used to calculate capital recovery. The rate will vary
depending upon the size of the loan and other lending agency conditions, but is the basic suggested rate by a
farm lending agency as of January 2018.
Tunnels. Some tunnel structure materials are used for more than one complete blackberry cropping cycle. For example, steel parts last for 10 years, while plastic coverings last for only for one cycle. A total of seven 24 feet wide by 200 feet long tunnel structures are constructed per acre. Additional information about tunnels is located in the section Establishment Year: Cultural Practices and Material Inputs.
Trellis. The trellis is installed in the establishment year soon after planting. The trellis is removed at the end of the last production year and can be used on other plantings. The cost includes the materials only, with labor costs found in establishment costs. Additional information about the trellis system is located in the section Establishment Year: Cultural Practices and Material Inputs.
Tools. This includes shop and field and harvest tools used on the farm. The value is estimated and does not represent any specific inventory.
Cane Management Tools. The weed eaters that are used to mow blackberry canes in December each year, and other relevant tools used in cane management are included in this study and shown under investments.
Shade Structure. A shade structure is set up in first year or by early spring of the second year to provide shade for the labor and for a sorting and packing area at harvest. The cost includes the setup labor and materials. A
Blackberry Cost and Return Study – Central Coast – University of California
10

packing and sorting wagon/trailer with a stainless steel table top and a shade structure is pulled by a small tractor to the picking area. The shade structure may also be used for future crops.
Irrigation System. The irrigation system is maintained by the landowner and assumed to be included in the land rental cost. In some cases the grower may be responsible for maintenance. The grower invests in and owns sprinkler pipe and drip system materials sufficient for irrigation needs. The grower also owns a trailer and other equipment needed for moving pipe and irrigation supplies to and from the field. Irrigation water is pumped from a well and delivered to the field through an underground pipe system. Main lines above ground are connected to the underground system to deliver water for the irrigations. Additional information about the drip system is located in the section Production Years 1 to 4: Cultural Practices and Material Inputs.
Establishment. Costs to establish blackberries are used to determine capital recovery expenses, depreciation,
and interest on investment for the production years. Establishment cost is the sum of the costs for land
preparation, trellis system labor, drip tape, planting, plants, cash overhead and expenses for establishing the
canes. The Net Cash Cost on Table 1 represents the establishment cost, which is $16,622 per acre or $249,330
for the 15 acre field after the first harvest.
Equipment Costs. Farm equipment is purchased new or used, but the study shows the current purchase price
for new equipment. The new purchase price is adjusted to 70 percent to indicate a mix of new and used
equipment. Annual ownership costs for equipment and other investments are in the Whole Farm Equipment,
Investment and Business Overhead Tables. Equipment costs are composed of three parts: non-cash overhead,
cash overhead, and operating costs. Both of the overhead factors have been discussed in previous sections. The
operating costs consist of repairs, fuel, and lubrication and are discussed under operating costs.
Table Values. Due to rounding, the totals may be slightly different from the sum of the components.
.
Blackberry Cost and Return Study – Central Coast – University of California
11

REFERENCES
American Society of Agricultural and Biological Engineers. March 2011. American Society of Agricultural Engineers Standards. Agricultural Machinery Management Data. ASAE D497.7. St. Joseph, MI, http://elibrary.asabe.org. Internet accessed February 2013.
Boehlje, Michael D., and Vernon R. Eidman. 1984. Farm Management. John Wiley and Sons. New York, NY.
Bolda, Mark, Mark Gaskell, Elizabeth Mitcham and Michael Cahn. 2012. UC Caneberry Production Manual. University of California Agriculture and Natural Resources. Publication 3525.
Bolda, Mark, Laura Tourte, Karen M .Klonsky and Richard L. De Moura. 2013. Sample Costs to Establish and
Produce Fresh Market Blackberries – Central Coast Region. University of California Cooperative Extension.
Davis, CA.
California Chapter of the American Society of Farm Managers and Rural Appraisers. 2017. Trends in
Agricultural Land and Lease Values. California Chapter of the American Society of Farm Managers and Rural
Appraisers, Inc. Woodbridge, CA.
California State Board of Equalization. Fuel Tax Division Tax Rates. Internet accessed February 2017.
http://www.boe.ca.gov/sptaxprog/spftdrates.htm
Edgley, Max. Managing Red Druplet Disorder. Perennial Horticulture Fact Sheet. Tasmanian Institute of
Agriculture. University of Tasmania. http://www.utas.edu.au/ data/assets/pdf file/0011/978104/Blackberry-
red-drupelet-fact-sheet-2017.pdf. Accessed December 8, 2017.
Energy Information Administration. 2012. Weekly Retail on Highway Diesel and Gasoline Prices. Internet
accessed January 2018. http://tonto.eix.doe.gov/oog/info/wohdp
Santa Cruz County Agricultural Commissioner. 2013-2016. Santa Cruz County Annual Crop and Livestock
Report, Fruits. Santa Cruz County, Watsonville, CA. http://agdept.com
United States Department of Labor – Wage and Hour Division. 2018. Fact Sheet 26: Section H-2A of the Immigration and Nationality Act (INA). https://www.dol.gov/whd/regs/compliance/whdfs26.htm. Accessed August 15, 2018.
University of California Statewide IPM Project. 2015. UC Pest Management Guidelines, Caneberries.
University of California, Davis, CA. http://www.ipm.ucdavis.edu
United States Department of Agriculture, Agricultural Marketing Service. http://www.ams.usda.gov. Accessed
December 6, 2018.
Blackberry Cost and Return Study – Central Coast – University of California
12

UC COOPERATIVE EXTENSION – AGRICULTURAL ISSUES CENTER TABLE 1. COSTS PER ACRE TO ESTABLISH, PRODUCE AND HARVEST
PRIMOCANE BLACKBERRIES - 2018 – SUMMARY
Year: Establish 1st 4.5- Pound Trays Per Acre: 4,000 4,000
Cultural Costs:
Cultural Costs 19,884 6,140 TOTAL CULTURAL COSTS 19,884 6,140 Harvest Costs:
Harvest/Pack/Haul/Cool/Market 44,596 44,596 TOTAL HARVEST COSTS 44,596 44,596 Post Harvest:
Post Harvest Operations 1,235 1,812 TOTAL POSTHARVEST COSTS 1,235 1,812 Interest On Operating Capital @ 5.00% 820 347 TOTAL OPERATING COSTS/ACRE 66,535 52,894 Cash Overhead Costs:
Rent, Insurance, Taxes, etc. 6,087 6,087 TOTAL CASH OVERHEAD COSTS 6,087 6,087 TOTAL CASH COSTS/ACRE 72,622 58,981 INCOME/ACRE FROM PRODUCTION 56,000 56,000 NET CASH COSTS/ACRE FOR THE YEAR 16,622 2,981 PROFIT/ACRE ABOVE CASH COSTS
Non-Cash Overhead (Capital Recovery Cost):
Equipment/Investments 6,623 6,615 TOTAL NON-CASH OVERHEAD COST/ACRE 6,623 6,615 TOTAL COST/ACRE FOR THE YEAR 79,245 65,597 INCOME/ACRE FROM PRODUCTION 56,000 56,000 TOTAL NET COST/ACRE FOR THE YEAR 23,245 9,597 NET PROFIT/ACRE ABOVE TOTAL COST
TOTAL ACCUMULATED NET/ACRE -23,245 -32,842
Blackberry Cost and Return Study – Central Coast – University of California
13

UC COOPERATIVE EXTENSION-AGRICULTURAL ISSUES CENTER Table 2. COSTS PER ACRE TO ESTABLISH AND HARVEST BLACKBERRIES
Central Coast - 2018
Operation Cash and Labor Costs per Acre Time Labor Fuel Lube Material Custom/ Total Your
Operation (Hrs/A) Cost & Repairs Cost Rent Cost Cost Cultural: Soil Samples (2 per 15 Ac) 0 07 2 0 0 0 10 12 Disc 6X 1 03 28 11 5 0 0 44 Chisel/Rip 4X (3 ft. deep) 0 52 14 6 3 0 0 23 Compost Application (Greenwaste) 0 34 9 4 3 246 0 261 Chisel 1X (1.5 ft. deep) 0 13 3 1 1 0 0 6 Fumigation 0 00 0 0 0 0 4,400 4,400 Fumigation Permit 0 00 0 0 0 0 25 25 Tarp Retrieval/Disposal 0 00 0 0 0 0 100 100 Disc 1X 0 17 5 2 1 0 0 7 Layout Field 0 00 17 0 0 0 0 17 List & Shape Beds 0 46 12 5 2 0 0 19 Fertilize at Planting (18-13-16) 0 34 9 4 3 220 0 235 Plant Blackberries 24 00 403 0 0 3,703 0 4,106 Install Trellis (Labor Only) 89 00 1,495 0 0 0 0 1,495 Install Drip System (Tape and Labor) 3 48 59 0 0 385 0 444 Disease Management 3X (Mildew) 1 71 46 18 13 648 0 725 LBAM Management (Pheromones) 0 00 17 0 0 165 0 182 Install & Manage Tunnels (Labor Only) 78 00 1,310 0 0 0 0 1,310 Drip Irrigate- Establishment 3 30 55 0 0 540 0 595 Fertilize 4X (21-0-0-24) 0 00 0 0 0 26 0 26 Insect Management 2X (Leafroller) 1 14 31 12 9 76 0 128 Cane Management 131 00 2,201 0 0 0 0 2,201 Fertilize 2X Monthly (3-18-18) 0 00 0 0 0 156 0 156 Pollination (3 Hives) 0 00 0 0 0 0 375 375 Install Weed Mats in Anchor Rows 14 00 235 0 0 1,800 0 2,035 Hand Weed Cane Rows 36.00 605 0 0 0 0 605 Disc Row Middles 0 43 12 5 2 0 0 18 Insect Management 2X (SWD) 1 14 31 12 9 22 0 73 PCA 0 00 0 0 0 0 125 125 ATV 0 50 13 1 0 0 0 15 Pickup 3 33 90 21 11 0 0 122
TOTAL CULTURAL COSTS 390.09 6,701 102 61 7,985 5,035 19,884 Harvest: Harvest Blackberries 0 00 2,117 0 0 8,400 25,000 35,517 Load/Haul 27 30 734 262 203 0 0 1,199 Cool/Palletize 0 00 0 0 0 3,400 0 3,400 Market/Sales Fee 0 00 0 0 0 4,480 0 4,480
TOTAL HARVEST COSTS 27 30 2,851 262 203 16,280 25,000 44,596 Postharvest: Mow Canes 71 00 1,193 0 0 0 0 1,193 Shred Prunings 0 26 7 3 2 0 0 12 Disc Prunings 0 30 8 3 1 0 0 12 Plant Cover Crop 0 22 6 2 1 9 0 19
TOTAL POSTHARVESTCOSTS 71 78 1,214 8 4 9 0 1,235
Interest on Operating Capital at 5.00% 820 TOTAL OPERATINGCOSTS/ACRE 39 10,766 372 268 24,274 30,035 66,535
Blackberry Cost and Return Study – Central Coast – University of California
14

UC COOPERATIVE EXTENSION-AGRICULTURAL ISSUES CENTER Table 2. CONTINUED
Central Coast – 2018
Operation Cash and Labor Costs per Acre Time Labor Fuel
Operation (Hrs/A) Cost Lube Material Custom/ Total Your
& Repairs Cost Rent Cost Cost CASH OVERHEAD: Food Safety Programs 100 Land Rent 2,800 Office Expense 750 Liability Insurance 22 Regulatory Programs 80 Field Sanitation 44 Farm Manager 1,250 Property Taxes 224 Property Insurance 19 Investment Repairs 798
TOTAL CASH OVERHEAD COSTS/ACRE 6,087 TOTAL CASH COSTS/ACRE 72,622 NON-CASHOVERHEAD: Per Producing Annual Cost
Acre Capital Recovery
Irrigation System 1,400 102 102 Pump and Well 5,556 411 411 Shop Tools 481 46 46 Harvest Supplies 53 12 12 Trellis System 2,300 437 437 Tunnel Plastic Sheeting 4,969 1,842 1,842 Tunnel Metal Support Materials 24,542 3,123 3,123 Sort/Pack Trailer 370 47 47 Shade Structure 78 10 10 Weed Eaters (3) 160 35 35 Equipment 3,809 556 556
TOTAL NON-CASH OVERHEAD COSTS 43,719 6,623 6,623 TOTALCOSTS/ACRE 79,245
Blackberry Cost and Return Study – Central Coast – University of California
15

UC COOPERATIVE EXTENSION-AGRICULTURAL ISSUES CENTER Table 3. MATERIAL COSTS PER ACRE TO ESTABLISH AND HARVEST PRIMOCANE BLACKBERRIES
Central Coast – 2018
Quantity/ Acre Unit
Price or Cost/Unit
Value or Cost/Acre
Your Cost
GROSS RETURNS Establish 4,000 14.00 56,000
TOTAL GROSS RETURNS 4,000 56,000 OPERATINGCOSTS Custom: 30,035
Soil Analysis 0 13 each 75.00 10 Fumigation 1.00 acre 4400.00 4,400 Fumigation Permit 1.00 acre 25.00 25 Tarp Disposal 1.00 acre 100.00 100 Bee Hives 3.00 each 125.00 375 Per Tray Harvest Rate 4000.00 each 6.25 25,000 PCA 1.00 acre 125.00 125
Fertilizer: 647 Composted Greenwaste 6.00 ton 41.00 246 18-13-16 400.00 lb 0 55 220 21-0-0-24 80.00 lb 0.32 26 3-18-18 192.00 lb 0.81 156
Plants/Seed: 3,712 Blackberry Plants 2178.00 each 1.70 3,703 Merced Rye 16.88 lb 0 55 9
Water: 925 Drip Tape 5500.00 foot 0.07 385 Water-Pumped 24.00 acin 22 50 540
Fungicide: 648 Aliette 5.00 lb 18.45 92 Ridomil 3.60 pint 109.95 396 Pristine 46.00 oz 3.47 160
Insecticide: 262 Isomate Pheromones (300 lures per acre) 1.00 acre 165.00 165 Success 10.00 floz 7.58 76 Malathion 5EC 2.00 pint 5.80 12 Mustang Max 4.00 floz 2.49 10
Pest Management: 1,800 Weed Mats and Pins 9.00 roll 200.00 1,800
Harvest: 16,280 Tray & Clamshells 4000.00 each 2.10 8,400 Cool/Palletize 4000.00 each 0.85 3,400 Market/Sales Fee 4000.00 each 1.12 4,480
Labor 10,766 Equipment Operator Labor 47 27 hrs 22.40 1,059 Non-Machine Labor 577.80 hrs 16.80 9,707
Machinery 641 Fuel-Gas 88 95 gal 3 20 285 Fuel-Diesel 24 32 gal 3.60 88 Lube 56 Machinery Repair 213
Interest on Operating Capital @ 5.00% 820
TOTALOPERATINGCOSTS/ACRE 66,535 TOTAL OPERATING COSTS/ 17 NET RETURNS ABOVE OPERATING COSTS -10,535
Blackberry Cost and Return Study – Central Coast – University of California
16

UC COOPERATIVE EXTENSION-AGRICULTURAL ISSUES CENTER Table 3. CONTINUED
Central Coast – 2018
Quantity/ Acre Unit
Price or Cost/Unit
Value or Cost/Acre
Your Cost
CASH OVERHEAD COSTS Food Safety Programs Land Rent Office Expense Liability Insurance Regulatory Programs Field Sanitation
100 2,800
750 22 80 44
Farm Manager Property Taxes Property Insurance Investment Repairs
1,250 224 19
798
TOTAL CASH OVERHEAD COSTS/ACRE 6,087 TOTAL CASH OVERHEAD COSTS/ 2 TOTAL CASH COSTS/ACRE 72,622 TOTAL CASH COSTS/ 18 NET RETURNS ABOVE CASH COSTS -16,622 NON-CASH OVERHEAD COSTS (Capital Recovery) Irrigation System Pump and Well Shop Tools Harvest Supplies Trellis System Tunnel Plastic Sheeting Tunnel Metal Support Materials Sort/Pack Trailer Shade Structure
102 411 46 12
437 1,842 3,123
47 10
Weed Eaters (3) Equipment
35 556
TOTAL NON-CASH OVERHEAD COSTS/ACRE 6,623 TOTAL NON-CASH OVERHEAD COSTS/ 2 TOTALCOST/ACRE 79,245 TOTAL COST/ 20 NET RETURNS ABOVE TOTAL COST -23,245
Blackberry Cost and Return Study – Central Coast – University of California
17
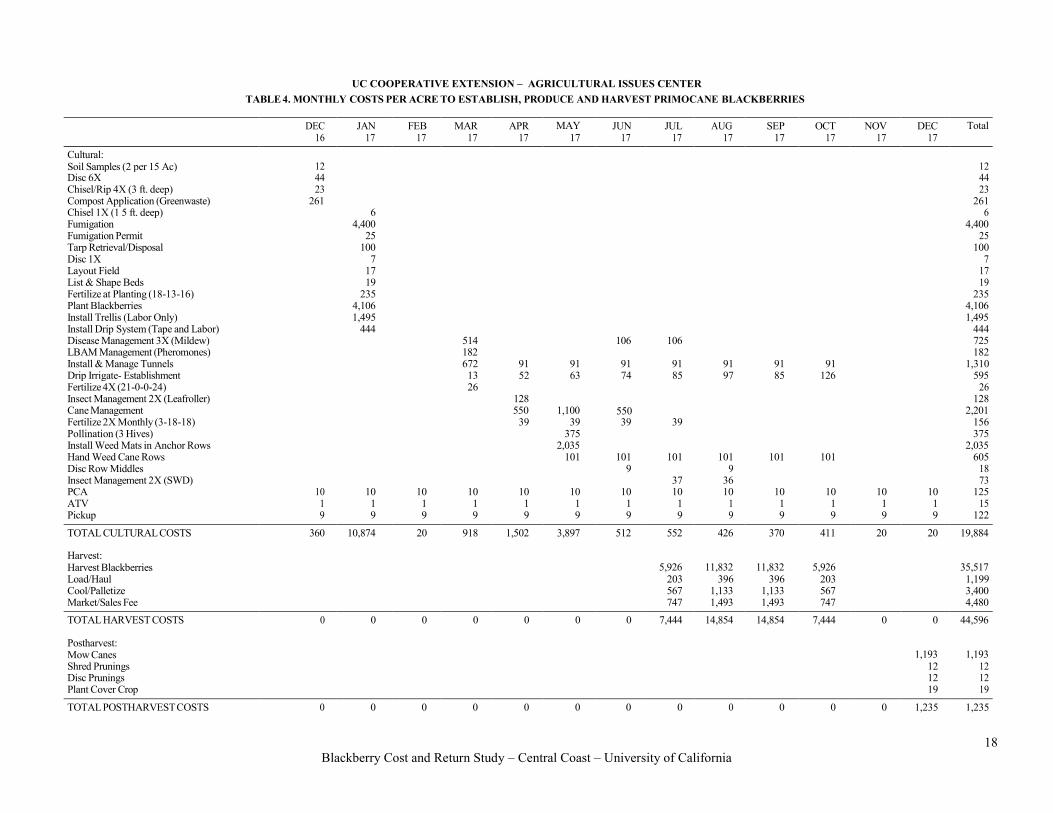
UC COOPERATIVE EXTENSION – AGRICULTURAL ISSUES CENTER TABLE 4. MONTHLY COSTS PER ACRE TO ESTABLISH, PRODUCE AND HARVEST PRIMOCANE BLACKBERRIES
DEC JAN FEB MAR APR MAY JUN JUL AUG SEP OCT NOV DEC Total 16 17 17 17 17 17 17 17 17 17 17 17 17
Cultural: Soil Samples (2 per 15 Ac) Disc 6X
12 44
12 44
Chisel/Rip 4X (3 ft. deep) Compost Application (Greenwaste) Chisel 1X (1 5 ft. deep) Fumigation Fumigation Permit Tarp Retrieval/Disposal Disc 1X
23 261
6 4,400
25 100
7
23 261
6 4,400
25 100
7 Layout Field List & Shape Beds Fertilize at Planting (18-13-16) Plant Blackberries Install Trellis (Labor Only) Install Drip System (Tape and Labor) Disease Management 3X (Mildew) LBAM Management (Pheromones) Install & Manage Tunnels Drip Irrigate- Establishment Fertilize 4X (21-0-0-24) Insect Management 2X (Leafroller) Cane Management Fertilize 2X Monthly (3-18-18) Pollination (3 Hives) Install Weed Mats in Anchor Rows Hand Weed Cane Rows
17 19
235 4,106 1,495
444 514 182 672 13 26
91 52
128 550
39
91 63
1,100 39
375 2,035
101
106
91 74
550 39
101
106
91 85
39
101
91 97
101
91 85
101
91 126
101
17 19
235 4,106 1,495
444 725 182
1,310 595
26 128
2,201 156 375
2,035 605
Disc Row Middles 9 9 18 Insect Management 2X (SWD) PCA 10 10 10 10 10 10 10
37 10
36 10 10 10 10 10
73 125
ATV 1 1 1 1 1 1 1 1 1 1 1 1 1 15 Pickup 9 9 9 9 9 9 9 9 9 9 9 9 9 122
TOTAL CULTURAL COSTS 360 10,874 20 918 1,502 3,897 512 552 426 370 411 20 20 19,884
Harvest: Harvest Blackberries Load/Haul Cool/Palletize Market/Sales Fee
5,926 203 567 747
11,832 396
1,133 1,493
11,832 396
1,133 1,493
5,926 203 567 747
35,517 1,199 3,400 4,480
TOTAL HARVEST COSTS 0 0 0 0 0 0 0 7,444 14,854 14,854 7,444 0 0 44,596
Postharvest: Mow Canes Shred Prunings Disc Prunings Plant Cover Crop
1,193 12 12 19
1,193 12 12 19
TOTAL POSTHARVESTCOSTS 0 0 0 0 0 0 0 0 0 0 0 0 1,235 1,235
18
Blackberry Cost and Return Study – Central Coast – University of California

UC COOPERATIVE EXTENSION – AGRICULTURAL ISSUES CENTER TABLE 4. CONTINUED
DEC 16
JAN 17
FEB 17
MAR 17
APR 17
MAY 17
JUN 17
JUL 17
AUG 17
SEP 17
OCT 17
NOV 17
DEC 17
Total
Interest on Operating Capital @ 5.00% 1 47 47 51 57 73 75 109 172 236 -38 -5 -5 820 TOTAL OPERATINGCOSTS/ACRE 361 10,921 67 969 1,559 3,970 588 8,105 15,453 15,460 7,816 15 1,250 66,535
CASHOVERHEAD Food Safety Programs Land Rent Office Expense Liability Insurance Regulatory Programs Field Sanitation Farm Manager Property Taxes Property Insurance Investment Repairs
8
58
96
61
8
58 22
96
61
8
58
96 112
9 61
8
58
80
96
61
8
58
96
61
8
58
44 96
61
8 2,800
58
96
61
8
58
96 112
9 61
8
58
96
61
8
58
96
61
8
58
96
61
8
58
96
61
8
58
96
61
100 2,800
750 22 80 44
1,250 224
19 798
TOTAL CASH OVERHEAD COSTS 223 245 344 303 223 267 3,023 344 223 223 223 223 223 6,087 TOTAL CASH COSTS/ACRE 584 11,166 411 1,272 1,782 4,238 3,611 8,449 15,675 15,683 8,039 238 1,473 72,622
Blackberry Cost and Return Study – Central Coast – University of California
19

UC COOPERATIVE EXTENSION-AGRICULTURAL ISSUES CENTER Table 5. COSTS PER ACRE TO PRODUCE AND HARVEST BLACKBERRIES: PRODUCTION YEARS 1–4
Central Coast - 2018
Operation Cash and Labor Costs per Acre
Time Labor Fuel Lube Material Custom/ Total Your Operation (Hrs/A) Cost & Repairs Cost Rent Cost Cost Cultural: Soil Sample (2 per 15 Ac) 0 00 0 0 0 0 10 10 Fertilize 2X (21-0-0-24) 0 34 9 4 3 48 0 63 Disease Management 3X (Mildew) 1 71 46 18 13 648 0 725 Flush and Repair Drip System 0 00 7 0 0 13 0 20 Mow Cover Crop 0 26 7 3 2 0 0 12 Fertilize 4X (17-0-0) 0 00 0 0 0 17 0 17 LBAM Management (Pheromones) 0 00 16 0 0 165 0 181 Tunnel Management 38 00 638 0 0 0 0 638 Drip Irrigate-Season 3 30 45 0 0 540 0 585 Fertilize 2X Monthly (3-18-18) 0 00 0 0 0 156 0 156 Insect Management 2X (Leafroller) 1 14 31 12 9 76 0 128 Cane Management 131 00 2,201 0 0 0 0 2,201 Pollination (3 Hives) 0 00 0 0 0 0 375 375 Hand Weed 36 00 588 0 0 0 0 588 Leaf Analysis 0 00 0 0 0 0 10 10 Disc Row Middles 0 69 18 7 2 0 0 28 Insect Management 2X (SWD) 1 14 31 12 9 22 0 73 PCA 0 00 0 0 0 0 125 125 ATV 0 75 20 2 1 0 0 22 Pickup 5 00 134 32 17 0 0 183
TOTAL CULTURAL COSTS 219.33 3,792 90 55 1,683 520 6,140 Harvest: Harvest Blackberries 0 00 2,117 0 0 8,400 25,000 35,517 Load/Haul 27.30 734 262 203 0 0 1,199 Cool/Palletize 0 00 0 0 0 3,400 0 3,400 Market/Sales Fee 0 00 0 0 0 4,480 0 4,480
TOTAL HARVEST COSTS 27.30 2,851 262 203 16,280 25,000 44,596 Postharvest: Mow Canes 71 00 1,193 0 0 0 0 1,193 Shred Prunings 0 26 7 3 2 0 0 12 Disc Prunings 0 30 8 3 1 0 0 12 Plant Cover Crop 0 22 6 2 1 9 0 19 Remove Trellis/Tunnels (4th year 0 00 576 0 0 0 0 576
TOTAL POSTHARVEST COSTS 71 78 1,790 8 4 9 0 1,812
Interest on Operating Capital at 5.00% 347 TOTAL OPERATINGCOSTS/ACRE 39 8,432 360 263 17,973 25,520 52,894
*Growing Costs= Total Costs – Harvest Costs ($64,597 – 44,596 = $20,001)
Blackberry Cost and Return Study – Central Coast – University of California
20
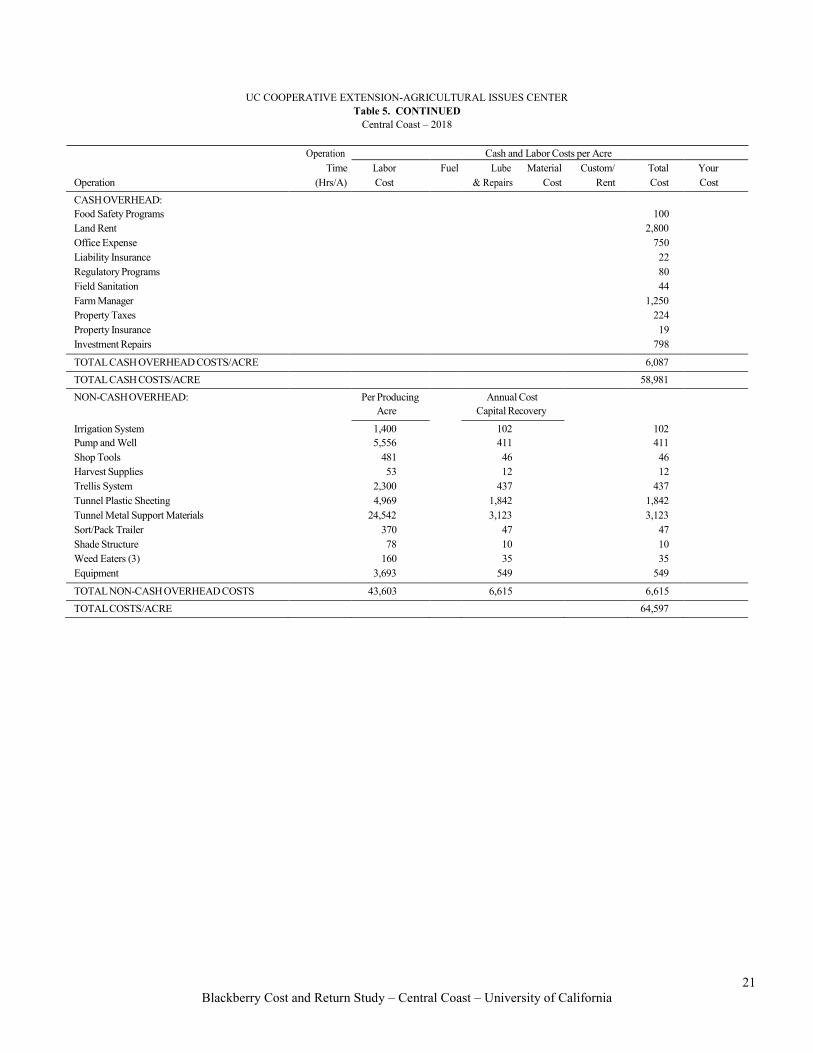
UC COOPERATIVE EXTENSION-AGRICULTURAL ISSUES CENTER Table 5. CONTINUED
Central Coast – 2018
Operation Cash and Labor Costs per Acre Time Labor Fuel
Operation (Hrs/A) Cost Lube Material Custom/ Total Your
& Repairs Cost Rent Cost Cost CASH OVERHEAD: Food Safety Programs 100 Land Rent 2,800 Office Expense 750 Liability Insurance 22 Regulatory Programs 80 Field Sanitation 44 Farm Manager 1,250 Property Taxes 224 Property Insurance 19 Investment Repairs 798
TOTAL CASH OVERHEAD COSTS/ACRE 6,087 TOTAL CASH COSTS/ACRE 58,981 NON-CASHOVERHEAD: Per Producing Annual Cost
Acre Capital Recovery
Irrigation System 1,400 102 102 Pump and Well 5,556 411 411 Shop Tools 481 46 46 Harvest Supplies 53 12 12 Trellis System 2,300 437 437 Tunnel Plastic Sheeting 4,969 1,842 1,842 Tunnel Metal Support Materials 24,542 3,123 3,123 Sort/Pack Trailer 370 47 47 Shade Structure 78 10 10 Weed Eaters (3) 160 35 35 Equipment 3,693 549 549
TOTAL NON-CASH OVERHEAD COSTS 43,603 6,615 6,615 TOTALCOSTS/ACRE 64,597
Blackberry Cost and Return Study – Central Coast – University of California
21

UC COOPERATIVE EXTENSION-AGRICULTURAL ISSUES CENTER Table 6. COSTS AND RETURNS PER ACRE TO PRODUCE AND HARVEST BLACKBERRIES:
PRODUCTION YEARS 1-4 Central Coast – 2018
Quantity/ Acre Unit
Price or Cost/Unit
Value or Cost/Acre
Your Cost
GROSS RETURNS Production 4,000 each 14.00 56,000
TOTAL GROSS RETURNS 4,000 each 56,000 OPERATINGCOSTS Custom: 25,520
Soil Analysis 0 13 each 75.00 10 Bee Hives 3.00 each 125.00 375 Leaf Analysis 0 13 each 75.00 10 Per Tray Harvest Rate 4000.00 each 6.25 25,000 PCA 1.00 acre 125.00 125
Fertilizer: 220 21-0-0-24 150.00 lb 0.32 48 17-0-0 80.00 lb 0.21 17 3-18-18 192.00 lb 0.81 156
Fungicide: 648 Aliette 5.00 lb 18.45 92 Ridomil 3.60 pint 109.95 396 Pristine 46.00 oz 3.47 160
Water: 553 Water-Flush Lines 0 25 acin 22 50 6 Drip Repair Material 1.00 acre 7 50 8 Water-Pumped 24.00 acin 22 50 540
Insecticide: 262 Isomate Pheromones (300 lures per lure) 1.00 acre 165.00 165 Success 10.00 floz 7 58 76 Malathion 5EC 2.00 pint 5.80 12 Mustang Max 4.00 floz 2.49 10
Harvest: 16,280 Tray & Clamshells 4000.00 each 2 10 8,400 Cooling 4000.00 each 0.85 3,400 Market/Sales Fee 4000.00 each 1.12 4,480
Plants/Seed: 9 Merced Rye 16.88 lb 0 55 9
Labor 8,432 Equipment Operator Labor 46 93 hrs 22.40 1,051 Non-Machine Labor 442.00 hrs 16.80 7,381
Machinery 623 Fuel-Gas 92.40 gal 3 20 296 Fuel-Diesel 18.00 gal 3.60 65 Lube 54 Machinery Repair 209
Interest on Operating Capital @ 5.00% 347
TOTALOPERATINGCOSTS/ACRE 52,894 TOTALOPERATINGCOSTS/EACH 13 NET RETURNS ABOVE OPERATING COSTS 3,106
Blackberry Cost and Return Study – Central Coast – University of California
22

UC COOPERATIVE EXTENSION-AGRICULTURAL ISSUES CENTER Table 6. CONTINUED
Central Coast – 2018
Quantity/ Acre Unit
Price or Cost/Unit
Value or Cost/Acre
Your Cost
CASH OVERHEAD COSTS Food Safety Programs Land Rent Office Expense Liability Insurance Regulatory Programs Field Sanitation
100 2,800
750 22 80 44
Farm Manager Property Taxes Property Insurance Investment Repairs
1,250 224 19
798
TOTAL CASH OVERHEAD COSTS/ACRE 6,087 TOTAL CASH OVERHEAD COSTS/EACH 2 TOTAL CASH COSTS/ACRE 58,981 TOTAL CASH COSTS/EACH 15 NET RETURNS ABOVE CASH COSTS -2,981 NON-CASH OVERHEAD COSTS (Capital Recovery) Irrigation System Pump and Well Shop Tools Harvest Supplies Trellis System Tunnel Plastic Sheeting Tunnel Metal Support Materials Sort/Pack Trailer Shade Structure
102 411 46 12
437 1,842 3,123
47 10
Weed Eaters (3) Equipment
35 549
TOTAL NON-CASH OVERHEAD COSTS/ACRE 6,615 TOTAL NON-CASH OVERHEADCOSTS/EACH 2 TOTALCOST/ACRE 65,597 TOTALCOST/EACH 16 NET RETURNS ABOVE TOTAL COST -9,597
Blackberry Cost and Return Study – Central Coast – University of California
23

UC COOPERATIVE EXTENSION-AGRICULTURAL ISSUES CENTER Table 7. MONTHLY CASH COSTS PER ACRE TO PRODUCE AND HARVEST BLACKBERRIES: PRODUCTION YEARS 1-4
Central Coast – 2018 JAN FEB MAR APR MAY JUN JUL AUG SEP OCT NOV DEC Total
18 18 18 18 18 18 18 18 18 18 18 18 Cultural: Soil Sample (2 per 15 Ac) Fertilize 2X (21-0-0-24) Disease Management 3X (Mildew) Flush and Repair Drip System Mow Cover Crop Fertilize 4X (17-0-0) LBAM Management (Pheromones) Tunnel Management Drip Irrigate-Season Fertilize 2X Monthly (3-18-18) Insect Management 2X (Leafroller) Cane Management Pollination (3 Hives) Hand Weed
10 63
514 20 12 17
181 80 80
63 39
128 550
80 85 39
1,100 375 97
106
80 96 39
550
97
106
80 108 39
101
80 96
97
80 85
97
80 51
101
10 63
725 20 12 17
181 638 585 156 128
2,201 375 588
Leaf Analysis Disc Row Middles
10 14 14
10 28
Insect Management 2X (SWD) PCA 10 10 10 10 10 10
37 10
36 10 10 10 10 10
73 125
ATV 2 2 2 2 2 2 2 2 2 2 2 2 22 Pickup 15 15 15 15 15 15 15 15 15 15 15 15 183
TOTAL CULTURAL COSTS 37 91 851 1,437 1,813 459 498 350 289 260 28 28 6,140
Harvest: Harvest Blackberries Load/Haul Cool/Palletize Market/Sales Fee
5,926 203 567 747
11,832 396
1,133 1,493
11,832 396
1,133 1,493
5,926 203 567 747
35,517 1,199 3,400 4,480
TOTAL HARVEST COSTS 0 0 0 0 0 0 7,444 14,854 14,854 7,444 0 0 44,596
Postharvest: Mow Canes Shred Prunings Disc Prunings Plant Cover Crop Remove Trellis/Tunnels (4th year 576
1,193 12 12 19
1,193 12 12 19
576
TOTAL POSTHARVEST COSTS 0 0 0 0 0 0 0 0 0 0 576 1,235 1,812
Interest on Operating Capital @ 5.00% 0 1 4 10 18 20 53 116 179 -40 -8 -5 347
TOTAL OPERATING COSTS/ACRE 37 92 855 1,447 1,831 479 7,994 15,320 15,322 7,664 596 1,258 52,894
Blackberry Cost and Return Study – Central Coast – University of California
24

UC COOPERATIVE EXTENSION-AGRICULTURAL ISSUES CENTER Table 7. CONTINUED
Central Coast - 2018
JAN FEB MAR APR MAY JUN JUL AUG SEP OCT NOV DEC Total 18 18 18 18 18 18 18 18 18 18 18 18
CASHOVERHEAD Food Safety Programs Land Rent Office Expense Liability Insurance Regulatory Programs Field Sanitation
8
63 22
8
63
8
63
80
8
63
8
63
44
8 2,800
63
8
63
8
63
8
63
8
63
8
63
8
63
100 2,800
750 22 80 44
Farm Manager Property Taxes Property Insurance Investment Repairs
104
67
104 112
9 67
104
67
104
67
104
67
104
67
104 112
9 67
104
67
104
67
104
67
104
67
104
67
1,250 224
19 798
TOTAL CASH OVERHEAD COSTS 263 363 322 242 286 3,042 363 242 242 242 242 242 6,087 TOTAL CASH COSTS/ACRE 301 454 1,176 1,688 2,117 3,520 8,357 15,562 15,564 7,905 838 1,499 58,981
Blackberry Cost and Return Study – Central Coast – University of California
25
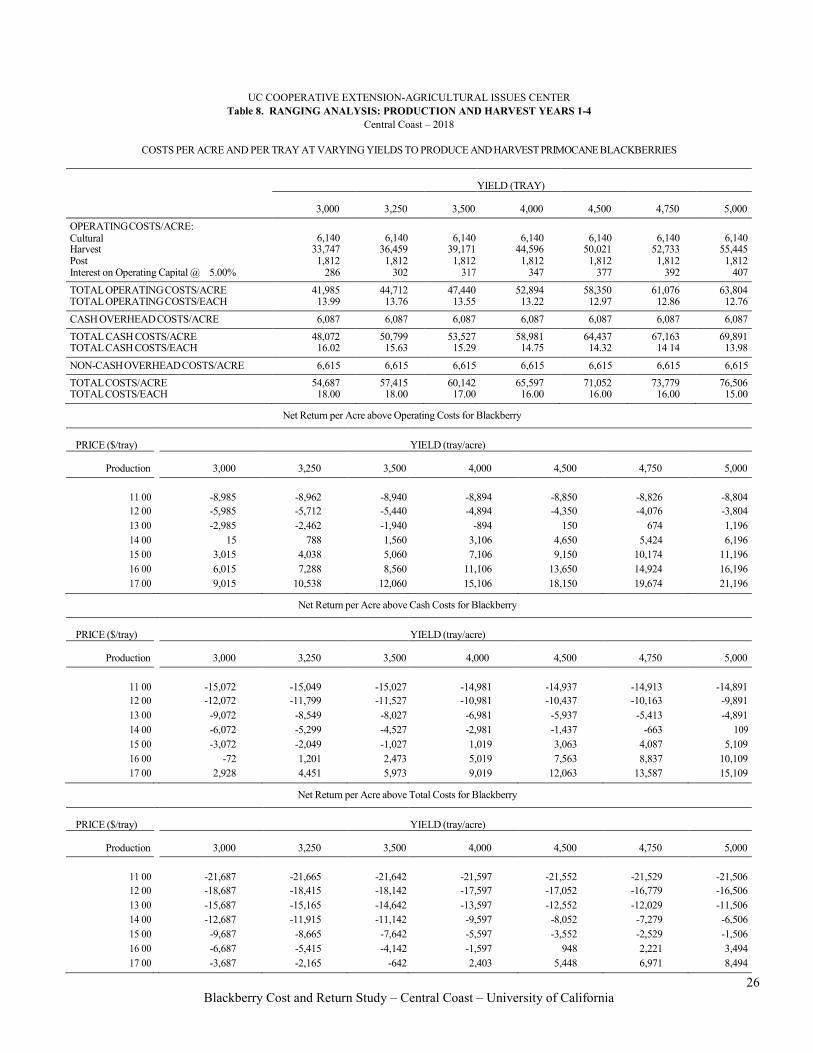
UC COOPERATIVE EXTENSION-AGRICULTURAL ISSUES CENTER Table 8. RANGING ANALYSIS: PRODUCTION AND HARVEST YEARS 1-4
Central Coast – 2018
COSTS PER ACRE AND PER TRAY AT VARYING YIELDS TO PRODUCE AND HARVEST PRIMOCANE BLACKBERRIES
YIELD (TRAY)
3,000 3,250 3,500 4,000 4,500 4,750 5,000 OPERATINGCOSTS/ACRE: Cultural 6,140 6,140 6,140 6,140 6,140 6,140 6,140 Harvest 33,747 36,459 39,171 44,596 50,021 52,733 55,445 Post 1,812 1,812 1,812 1,812 1,812 1,812 1,812 Interest on Operating Capital @ 5.00% 286 302 317 347 377 392 407
TOTAL OPERATINGCOSTS/ACRE 41,985 44,712 47,440 52,894 58,350 61,076 63,804 TOTAL OPERATINGCOSTS/EACH 13.99 13.76 13.55 13.22 12.97 12.86 12.76
CASH OVERHEADCOSTS/ACRE 6,087 6,087 6,087 6,087 6,087 6,087 6,087 TOTAL CASH COSTS/ACRE 48,072 50,799 53,527 58,981 64,437 67,163 69,891 TOTAL CASH COSTS/EACH 16.02 15.63 15.29 14.75 14.32 14 14 13.98
NON-CASHOVERHEADCOSTS/ACRE 6,615 6,615 6,615 6,615 6,615 6,615 6,615 TOTALCOSTS/ACRE 54,687 57,415 60,142 65,597 71,052 73,779 76,506 TOTALCOSTS/EACH 18.00 18.00 17.00 16.00 16.00 16.00 15.00
Net Return per Acre above Operating Costs for Blackberry
PRICE ($/tray) YIELD (tray/acre)
Production 3,000 3,250 3,500 4,000 4,500 4,750 5,000
11 00 -8,985 -8,962 -8,940 -8,894 -8,850 -8,826 -8,804 12 00 -5,985 -5,712 -5,440 -4,894 -4,350 -4,076 -3,804 13 00 -2,985 -2,462 -1,940 -894 150 674 1,196 14 00 15 788 1,560 3,106 4,650 5,424 6,196 15 00 3,015 4,038 5,060 7,106 9,150 10,174 11,196 16 00 6,015 7,288 8,560 11,106 13,650 14,924 16,196 17 00 9,015 10,538 12,060 15,106 18,150 19,674 21,196
Net Return per Acre above Cash Costs for Blackberry
PRICE ($/tray) YIELD (tray/acre)
Production 3,000 3,250 3,500 4,000 4,500 4,750 5,000
11 00 -15,072 -15,049 -15,027 -14,981 -14,937 -14,913 -14,891 12 00 -12,072 -11,799 -11,527 -10,981 -10,437 -10,163 -9,891 13 00 -9,072 -8,549 -8,027 -6,981 -5,937 -5,413 -4,891 14 00 -6,072 -5,299 -4,527 -2,981 -1,437 -663 109 15 00 -3,072 -2,049 -1,027 1,019 3,063 4,087 5,109 16 00 -72 1,201 2,473 5,019 7,563 8,837 10,109 17 00 2,928 4,451 5,973 9,019 12,063 13,587 15,109
Net Return per Acre above Total Costs for Blackberry
PRICE ($/tray) YIELD (tray/acre)
Production 3,000 3,250 3,500 4,000 4,500 4,750 5,000
11 00 -21,687 -21,665 -21,642 -21,597 -21,552 -21,529 -21,506 12 00 -18,687 -18,415 -18,142 -17,597 -17,052 -16,779 -16,506 13 00 -15,687 -15,165 -14,642 -13,597 -12,552 -12,029 -11,506 14 00 -12,687 -11,915 -11,142 -9,597 -8,052 -7,279 -6,506 15 00 -9,687 -8,665 -7,642 -5,597 -3,552 -2,529 -1,506 16 00 -6,687 -5,415 -4,142 -1,597 948 2,221 3,494 17 00 -3,687 -2,165 -642 2,403 5,448 6,971 8,494
26
Blackberry Cost and Return Study – Central Coast – University of California
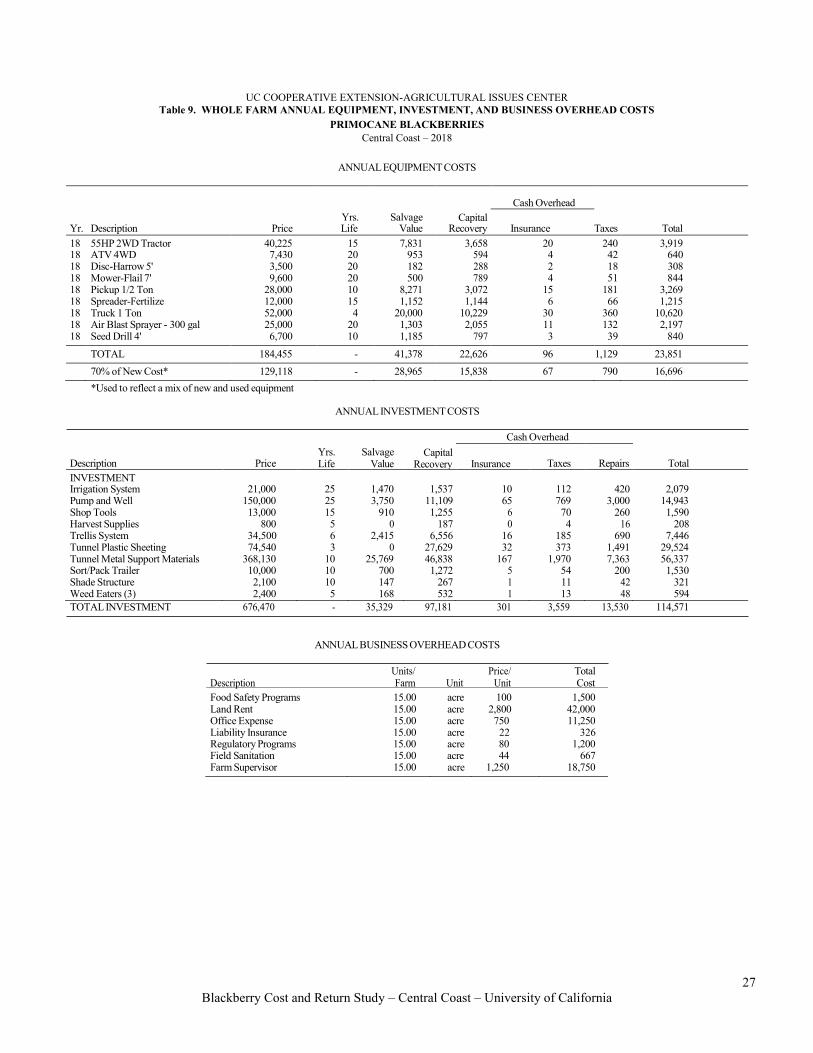
UC COOPERATIVE EXTENSION-AGRICULTURAL ISSUES CENTER Table 9. WHOLE FARM ANNUAL EQUIPMENT, INVESTMENT, AND BUSINESS OVERHEAD COSTS
PRIMOCANE BLACKBERRIES Central Coast – 2018
ANNUALEQUIPMENT COSTS
Cash Overhead
Yr. Description Price Yrs. Life
Salvage Value
Capital Recovery Insurance Taxes Total
18 18 18 18 18 18 18 18 18
55HP 2WD Tractor ATV 4WD Disc-Harrow 5' Mower-Flail 7' Pickup 1/2 Ton Spreader-Fertilize Truck 1 Ton Air Blast Sprayer - 300 gal Seed Drill 4'
40,225 7,430 3,500 9,600
28,000 12,000 52,000 25,000 6,700
15 20 20 20 10 15 4
20 10
7,831 953 182 500
8,271 1,152
20,000 1,303 1,185
3,658 594 288 789
3,072 1,144
10,229 2,055
797
20 4 2 4
15 6
30 11 3
240 42 18 51
181 66
360 132 39
3,919 640 308 844
3,269 1,215
10,620 2,197
840
TOTAL 184,455 - 41,378 22,626 96 1,129 23,851 70% of New Cost* 129,118 - 28,965 15,838 67 790 16,696 *Used to reflect a mix of new and used equipment
ANNUAL INVESTMENT COSTS
Cash Overhead
Description Price Yrs. Life
Salvage Value
Capital Recovery Insurance Taxes Repairs Total
INVESTMENT Irrigation System Pump and Well Shop Tools Harvest Supplies Trellis System Tunnel Plastic Sheeting Tunnel Metal Support Materials Sort/Pack Trailer Shade Structure Weed Eaters (3) TOTAL INVESTMENT
21,000 150,000 13,000
800 34,500 74,540
368,130 10,000 2,100 2,400
676,470
25 25 15 5 6 3
10 10 10 5 -
1,470 3,750
910 0
2,415 0
25,769 700 147 168
35,329
1,537 11,109 1,255
187 6,556
27,629 46,838 1,272
267 532
97,181
10 65
6 0
16 32
167 5 1 1
301
112 769 70 4
185 373
1,970 54 11 13
3,559
420 3,000
260 16
690 1,491 7,363
200 42 48
13,530
2,079 14,943 1,590
208 7,446
29,524 56,337 1,530
321 594
114,571
ANNUALBUSINESS OVERHEAD COSTS
Units/ Price/ Total Description Farm Unit Unit Cost Food Safety Programs 15.00 acre 100 1,500 Land Rent 15.00 acre 2,800 42,000 Office Expense 15.00 acre 750 11,250 Liability Insurance 15.00 acre 22 326 Regulatory Programs 15.00 acre 80 1,200 Field Sanitation 15.00 acre 44 667 Farm Supervisor 15.00 acre 1,250 18,750
Blackberry Cost and Return Study – Central Coast – University of California
27

UC COOPERATIVE EXTENSION-AGRICULTURAL ISSUES CENTER Table 10. HOURLY EQUIPMENT COSTS – PRIMOCANE BLACKBERRIES
Central Coast – 2018
Total Cash Overhead Operating Hours Hours Capital Lube & Total Total
Yr. Description Used Used Recovery Insurance Taxes Repairs Fuel Oper. Costs/Hr. 18 55HP 2WD Tractor 100 500 5.12 0.03 0.34 2.74 9.72 12.47 17.95 18 ATV 4WD 11 100 4.16 0.02 0.29 0 92 2.13 3.05 7.53 18 Disc-Harrow 5' 15 100 2.01 0.01 0.13 0.62 0.00 0.62 2.77 18 Mower-Flail 7' 8 100 5.52 0.03 0.35 4.88 0.00 4.88 10.79 18 Pickup 1/2 Ton 75 200 10.75 0.05 0.63 3 33 6.40 9.73 21.17 18 Spreader-Fertilize 5 80 10.01 0.05 0.58 5.29 0.00 5.29 15.93 18 Truck 1 Ton 410 500 14.32 0.04 0.50 7.44 9.60 17.04 31.91 18 Air Blast Sprayer - 300 gal 60 100 14.38 0.08 0.92 4.65 0.00 4.65 20.03 18 Seed Drill 4' 3 150 3.72 0.02 0.18 2.13 0.00 2.13 6.04
Blackberry Cost and Return Study – Central Coast – University of California
28