sample data analysis_elmaddah
TRANSCRIPT
Dr. Islam Ahmed El-Maddah Ain Shams University,
Faculty of Engineering
Data Analysis
Course Contents
The Basics
Fundamental Statistics
The Power of Excel and MATLAB
Histograms &.Frequency of Occurrence
Probability and Confidence
Frequency Analysis
Regression Analysis and Curve Fitting
Data Comparison
Data Mining and Representation
Quality Control Applications
Reliability Evaluation Applications
10/7/2014 Dr. Islam El-Maddah 2
The Basics
Sources of data, data sampling, data accuracy, data completeness, simple representations, dealing with practical issues.
Workshop using centrifugal pump performance data.
Fundamental Statistics
Mean, average, median, mode, rank, variance, covariance, standard deviation, compensations for small sample sizes, descriptive statistics.
Workshop using production data from a batch fermentation process.
The Power of Excel
Pivot tables, the analytical toolbox, sensitivity analysis, visualization.
Workshop involving step-by-step examples of the advanced capabilities of spreadsheets and the exploitation of ready-written resources.
Day 1
10/7/2014 Dr. Islam El-Maddah 3
Session 1
10/7/2014 Dr. Islam El-Maddah 4

Qualitative and Quantitative Data
Data can be classified as being qualitative or
quantitative.
The statistical analysis that is appropriate
depends on whether the data for the variable
are qualitative or quantitative.
In general, there are more alternatives for
statistical analysis when the data are
quantitative.
10/7/2014 Dr. Islam El-Maddah 5

Qualitative Data
Qualitative data are labels or names used to
identify an attribute of each element.
Qualitative data use either the nominal or
ordinal scale of measurement.
Qualitative data can be either numeric or
nonnumeric.
The statistical analysis for qualitative data are
rather limited.
10/7/2014 Dr. Islam El-Maddah 6

Quantitative Data
Quantitative data indicate either how many
or how much.
Quantitative data that measure how many are
discrete.
Quantitative data that measure how much are
continuous because there is no separation
between the possible values for the data..
Quantitative data are always numeric.
Ordinary arithmetic operations are
meaningful only with quantitative data.
10/7/2014 Dr. Islam El-Maddah 7

Sources of Data
There are different data sources in the engineering
world:
Documents and Internet
Industry associations
Special-interest organizations)
Own Data
Meter Readings
Devices Connected to Computer
(Expert) Human Estimation
10/7/2014 Dr. Islam El-Maddah 8

Data Sampling
Data collected from the different sources needs
to be sampled (select sub-set of them)
Sample rate should be selected carefully in
relation to the rate of data change
time
head
10/7/2014 Dr. Islam El-Maddah 9

Data Accuracy
Is defined by the correctness of the data the difference between the ideal data and the actual data
X is the actual Data Y is the ideal Data
Absolute Error = X –Y
Relative error= (X-Y) / Y
For example, If X =1.3, Y= 1.2
The absolute error is 1.3-1.2 = 0.1
The relative error is 0.1/1.2 = 8.3%
10/7/2014 Dr. Islam El-Maddah 10
Data Accuracy (2)
Is defined by the correctness of the data the difference between the ideal data and the actual data
X is the actual Data Y is the ideal Data
Absolute Error = X –Y
Relative error= (X-Y) / Y
For example, If X =11.3, Y= 11.2
The absolute error is 11.3-11.2 = 0.1
The relative error is 0.1/11.2 = 0.83%
10/7/2014 Dr. Islam El-Maddah 11

Exercise 1
Which is bigger the relative error between 5
and 5.1 or 4 and 4.1.
10/7/2014 Dr. Islam El-Maddah 12
Estimating Errors for dependent Variables
The dependent Variables errors and relative errors can be estimated using the known independent variables errors.
E.g. estimating error in a resistance knowing the maximum error of Current and Voltage
R = V/ I
R + dR = (V + dV) / (I +dI)
dR/R = dV/V + dI/I
The maximum relative error in the resistance is the sum of the maximum relative error in voltage plus the maximum percentage error in current
10/7/2014 Dr. Islam El-Maddah 13
Exercise 2
Find the relative error in calculating the
electric power P= ½ R I2 w.r.t. the relative
error in the current I.
10/7/2014 Dr. Islam El-Maddah 14
Data Precision A Precise process means that the process
produces the same output when supplied with the
same input
Can be measured using standard deviation
E.g. how precise is a process that produces 1.2,
1.1, 1.09 , 1.3, 1.11voltage
We calculate the standard deviation between the 5
voltage values = 0.089722
Note when all values are equal standard deviation
equals zero
A Process can be precise but not accurate but not
the other way around
10/7/2014 Dr. Islam El-Maddah 15
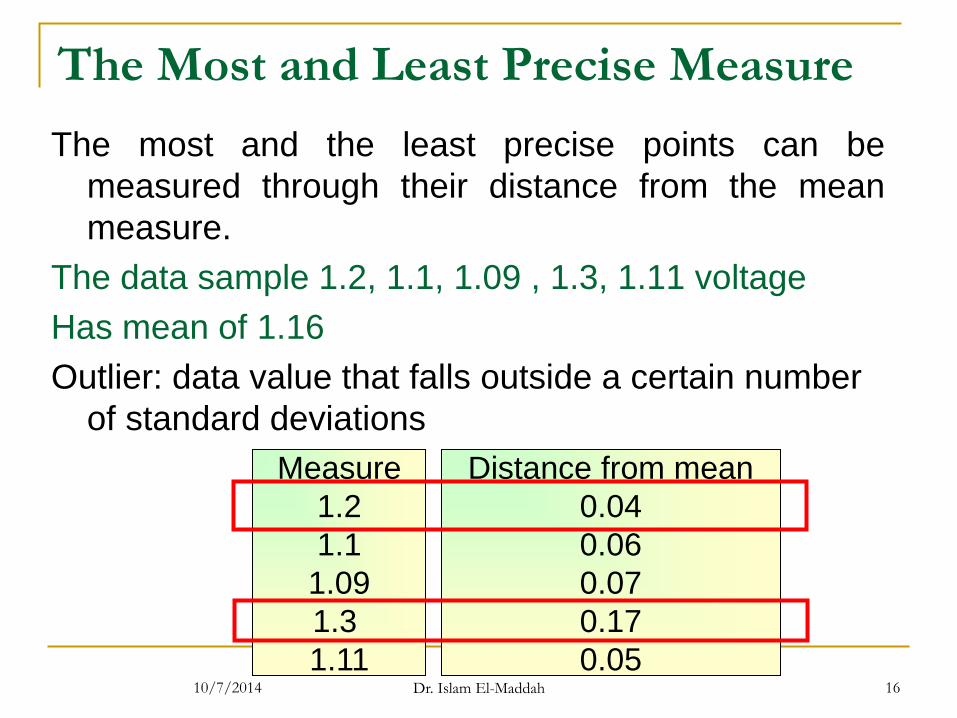
The Most and Least Precise Measure
The most and the least precise points can be
measured through their distance from the mean
measure.
The data sample 1.2, 1.1, 1.09 , 1.3, 1.11 voltage
Has mean of 1.16
Outlier: data value that falls outside a certain number
of standard deviations
Measure
1.2
1.1
1.09
1.3
1.11
Distance from mean
0.04
0.06
0.07
0.17
0.05 10/7/2014 Dr. Islam El-Maddah 16

Exercise 3
Find the most and least precise points in the
following: 1.1, 1.3, 1.01, 1.05, 1.2
10/7/2014 Dr. Islam El-Maddah 17

Completeness of Data
The Sampled Data has to cover all the important/possible situations.
For example, the Head level of the Tank vs. the input charge (Q) data has to be recorded with the valve open and closed
valve Pump
Tank
10/7/2014 Dr. Islam El-Maddah 18

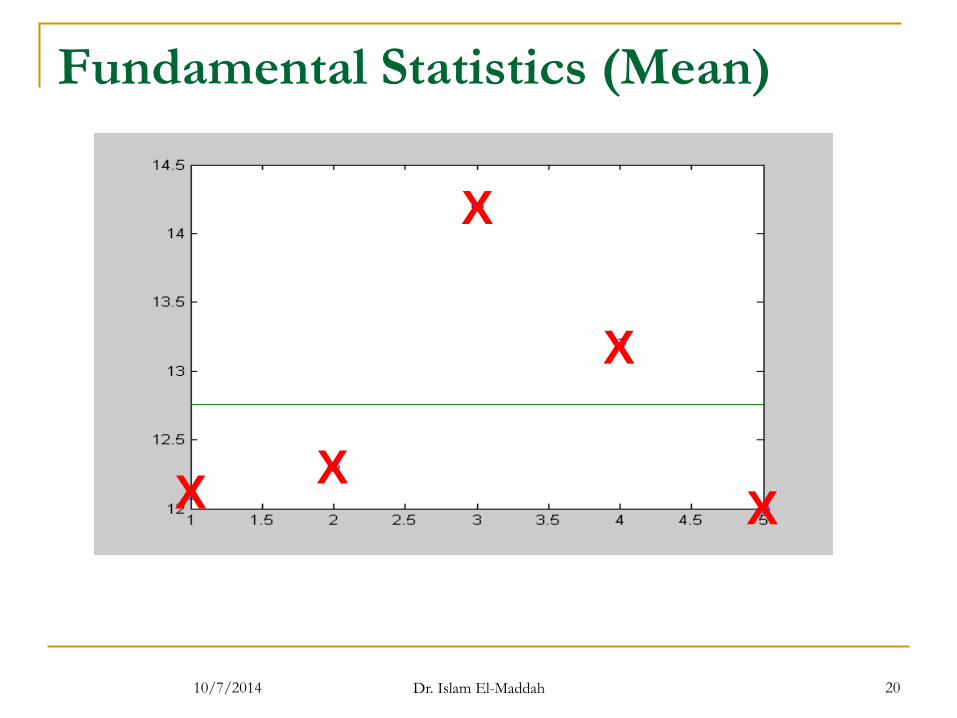
Fundamental Statistics (Mean)
The Mean of a number of values is their average value;
their sum divided by their size
E.g. the values: 12.1, 12.3, 14.2, 13.2, 12.0
have mean equals to = (12.1+12.3+14.2+13.2+12.0) / 5 =
12.76
xx
ni
10/7/2014 Dr. Islam El-Maddah 19
Fundamental Statistics (Mean)
X X
X
X
X
10/7/2014 Dr. Islam El-Maddah 20

Exercise 4
What is the mean of the following two data
sets:
1.2, 1.3, 1.5, 1.6, 1.7
1.1, 1.3, 1.5, 1.6, 1.8
Which of them is more precise
10/7/2014 Dr. Islam El-Maddah 21

Fundamental Statistics (the Expected
Value and the mean)
The Expected Value of some variable with probability
distribution is the similar to the mean; however it is
calculated based on the different values of the
variable and their probabilities
Expected Value of X = )(
1
i
n
i
i p
12 X 14 15 17 30
12 10 8 6 3 Y
Prop 10% 40% 30% 15% 5%
Expected Value of X = 12*10%+ 14*40%+ 15*30%+17*15% + 30*5% = 15.32
10/7/2014 Dr. Islam El-Maddah 22

Exercise 5
What is the expected value of the temperature
if the probability to measure 25 is 70% and the
probability to measure 30 is 30%
10/7/2014 Dr. Islam El-Maddah 23

Fundamental Statistics (Median)
The median value of a number of data points is
the point that stands in the middle when
ascending or descending sorting the data
points
For example, the median of 14.3, 12.3, 12.1,
12.5, 11.4 is 14.3
12.5
12.3
12.1
11.4
14.3
12.3
12.1
12.5
11.4
10/7/2014 Dr. Islam El-Maddah 24

Fundamental Statistics (Median)
A few extremely large or small values can
inflate the mean, but the median is more
tolerable.
For an odd number of observations, the
median is the middle value.
1 , 9, 7, 4, 3 3
For an even number of observations, the
median is the average of the two middle
values.
1 , 2, 3, 9, 7, 4 3.5 10/7/2014 Dr. Islam El-Maddah 25
Fundamental Statistics (Mode)
The mode of a data set is the value that
occurs with greatest frequency.
The greatest frequency can occur at two or
more different values.
If the data have exactly two modes, the data
are bimodal.
If the data have more than two modes, the
data are multimodal.
10/7/2014 Dr. Islam El-Maddah 26

Fundamental Statistics (Mode)
Examples
The mode of (1 , 2, 4, 5, 4, 3, 2, 4) is 4
The mode of (1, 2, 2, 4, 4) is either 4 or 2
There is no mode of (1, 3, 5, 6, 7, 8)
There is no mode of (1, 3.3, 3.5, 3.6, 4.1, 5)
however after rounding the numbers of the
data set it will be (1, 3, 4, 4, 4, 5); i.e. the mode
is 4
10/7/2014 Dr. Islam El-Maddah 27
Fundamental Statistics (Rank)
The rank of a data point means its order within the data points sample
The rank depends on both the data point and the entire sample
Example consider the data points sample (1, 4, 5, 7, 12, 12,
13)
The rank of 13 is 1 assuming descending order
The rank of 7 is 4
10/7/2014 Dr. Islam El-Maddah 28

Fundamental Statistics (Variance)
Variance is a measure of the closeness between the data points
The largest the variance the less precise the data measurement process
Zero variance means perfect precise measurement however it could be not fully accurate
Variance equals to the sum of the squares of the deviation for each point from the mean point
10/7/2014 Dr. Islam El-Maddah 29

Fundamental Statistics (Variance)
Variance equals to the sum of the squares of the
deviation for each point from the mean point
divided by (the number of samples minus one)
For example, the variance of 14.3, 12.3, 12.1,
12.5, 11.4 is
Variance = ((14.3-12.52)2 + (12.3-12.52)2 + (12.1-12.52)2 +
(12.5-12.52)2 + (11.4-12.52)2 ) / 4 = 1.162
12.52 is the mean value
10/7/2014 Dr. Islam El-Maddah 30
Fundamental Statistics (Variance)
Adding or subtracting a constant value from
each data point will result in a new data with
the same variance and standard deviation
If the variance of 14.3, 12.3, 12.1, 12.5, 11.4 is
1.162.
The variance of 14.0, 12.0, 11.8, 12.2, 11.1 is
also 1.162.
As the values get closer to the mean value, the
variance decreases, and vice versa
10/7/2014 Dr. Islam El-Maddah 31

Fundamental Statistics
(Standard Deviation)
Standard deviation is a measure of the
variance between the data points
It used to measure the measuring devices
precision and repeatability of an experiment
It is equal to the square root of the variance
Must be a positive number or zero if no
variance at all
10/7/2014 Dr. Islam El-Maddah 32

Workshop
10/7/2014 Dr. Islam El-Maddah 33