sample design puerto rican elderly: health conditions...
TRANSCRIPT

Sample Design Puerto Rican Elderly: Health Conditions
PREHCO Project
Esther María León Díaz
Principal Investigator and Professor Centre for Population and Development Studies
Havana, Cuba Regional Project Advisor of SABE Pan American Health Organization
January 2004

Sample Design PREHCO Project 1
Sample Design Puerto Rican Elderly: Health Conditions
PREHCO Project
The following technical report describes the sample design for the PREHCO Project, Puerto Rican Elderly: Health Conditions This report is divided into eight sections: 1) introduction; 2) study specifics; 3) the study's population and scope; 4) summary of the study's design characteristics; 5) observation units; 6) units of analysis, 7) description of the sampling strategy and its two components, sample design and estimations utilized, as well as a presentation of the criteria used to evaluate the accuracy of the estimations, and 8) a description of the pilot study sample. The project's entire research team collaborated during the conceptual stage of the sample design and particularly Dr. Hernando Mattei, professor of the University of Puerto Rico in San Juan in the processing and analysis of data from the Population and Housing Census. Dr. Mattei also prepared the programs for selecting the samples, prepared the maps that served as the basis for determining the sample units, and supervised the students who created the framework for the units in the study's second stage. 1. Introduction Puerto Rican Elderly: Health Conditions, known as Project PREHCO, was conceived as a transversal study based on a survey of households through face-to-face interviews with elderly adults, including those who were physically and mentally fit as well as those with cognitive deficits and who required the presence of a proxy to provide information. The study uses a probabilistic sample that, while meeting the study's basic objectives, can also be compared to a regional research project, "Health, Well-being and Aging among the Elderly in the Americas", known by its Spanish acronym, SABE. SABE is being carried out in seven countries, Argentina, Barbados, Brazil, Chile, Cuba, Mexico and Uruguay. It was organized by the Pan American Health Organization in 2000 and represents the first study in the region with these characteristics. SABE is under the direction of Dr. Martha Peláez of the PAHO/WHO with the technical direction of Dr. Alberto Palloni of the University of Wisconsin in the United States. The elaboration of PREHCO's sample design began in August 2001 and was developed using the U.S. Census 2000 Population and Housing data once this information was made public on the Internet (August 8, 2001). This work was developed in phases. The first phase sought the alternatives that would attain a geographic stratification appropriate for the study's objectives; there are no official regional divisions in Puerto Rico and different institutions and entities use their own divisions. From these divisions, the variant was selected that covered the greatest possibilities for analysis of the interior regions of Puerto Rico and that maintained comparability of the capital city with samples from the SABE Regional Project.

Sample Design PREHCO Project 2
The second phase focused on the selection of a socioeconomic stratification using census data that would allow a stratification of the population through the classification of units defined by the census within each geographic stratum. With this analysis, there was an important finding regarding the characteristics of the population distribution in Puerto Rico: heterogeneity of the population predominated according to high, medium and low levels in the block groups as well as homogeneity where middle and high class condominiums are located next to lower class households. It was then necessary to change the strategy of a prior socioeconomic stratification for a post-stratification according to the indicators found in the survey. During the third phase, the units that conformed to the census structure were analyzed to determine which units would allow the application of a sample by areas based on conglomerates with physical limits and for which there was census information. It was determined that the census unit denominated "Block Groups" was most suitable as a sample group for the first stage. The Master Sampling Framework was constructed in the fourth stage based on the selected stratification and the primary sample units with the necessary information extracted from the corresponding files of the U.S. Census Bureau. During the fifth phase, the remaining elements of the sample design were specified and defined in order to integrate them into the study's characteristics as well as into the survey's methodology and organization. A pilot study was considered beneficial and its sample was determined according to the design that had been elaborated for the survey. The pilot was carried out between December 2001 and March 2002, prior to the survey whose field work took place between May 2002 and June 2003. 2. Study Specifics The interviews were carried out by specially trained interviewers. The face-to-face interviews were taped and registered in a computer with a flexible and dynamic program that allowed for different screens according to the specific responses of each interviewee, if s/he lived alone or with other people, if s/he had a spouse, etc. During the interview process, the cognitive state of the interviewee was evaluated by means of a "mini-mental" test such as to determine if a proxy or substitute was needed to provide information. If the proxy was 60 or older s/he had to pass the mini-mental test before being selected as proxy. Anthropometric measurements and flexibility and mobility evaluations of the interviewee and spouse (if 60 or older) were also carried out during the course of the interview.
Sample Design PREHCO Project 3
3. Population and Scope of the Study 3.1 Population
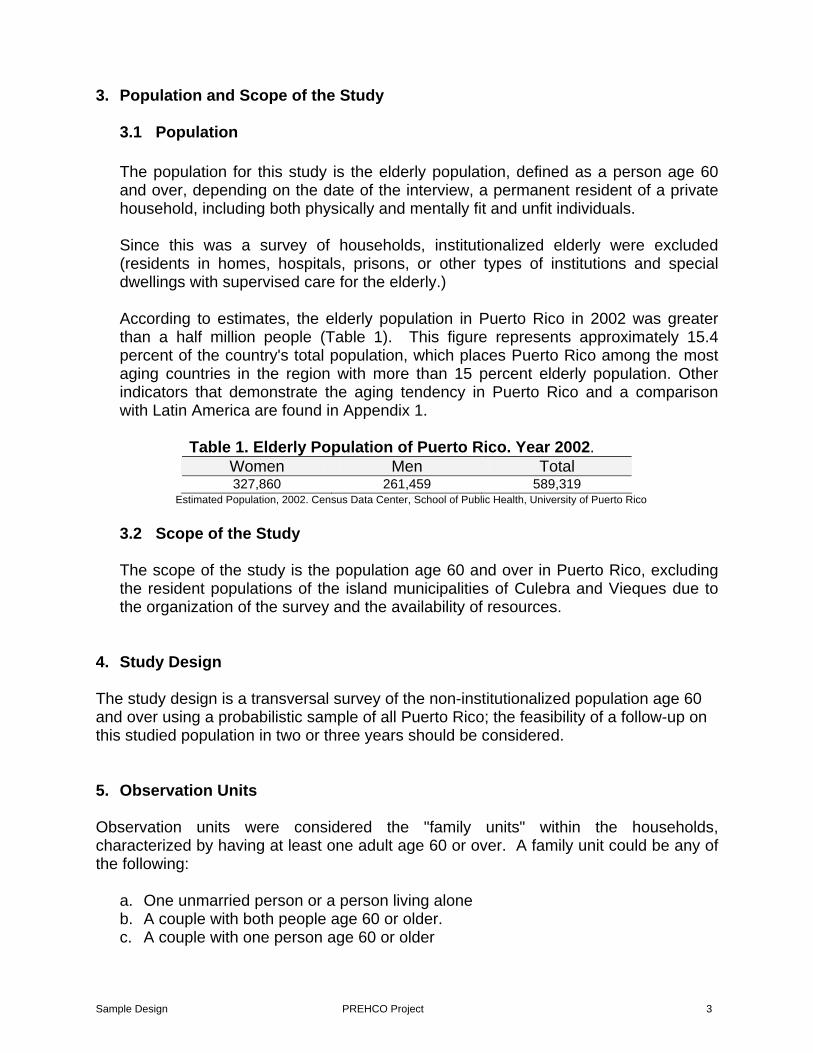
The population for this study is the elderly population, defined as a person age 60 and over, depending on the date of the interview, a permanent resident of a private household, including both physically and mentally fit and unfit individuals. Since this was a survey of households, institutionalized elderly were excluded (residents in homes, hospitals, prisons, or other types of institutions and special dwellings with supervised care for the elderly.) According to estimates, the elderly population in Puerto Rico in 2002 was greater than a half million people (Table 1). This figure represents approximately 15.4 percent of the country's total population, which places Puerto Rico among the most aging countries in the region with more than 15 percent elderly population. Other indicators that demonstrate the aging tendency in Puerto Rico and a comparison with Latin America are found in Appendix 1.
Table 1. Elderly Population of Puerto Rico. Year 2002.
Women Men Total 327,860 261,459 589,319
Estimated Population, 2002. Census Data Center, School of Public Health, University of Puerto Rico
3.2 Scope of the Study The scope of the study is the population age 60 and over in Puerto Rico, excluding the resident populations of the island municipalities of Culebra and Vieques due to the organization of the survey and the availability of resources.
4. Study Design The study design is a transversal survey of the non-institutionalized population age 60 and over using a probabilistic sample of all Puerto Rico; the feasibility of a follow-up on this studied population in two or three years should be considered. 5. Observation Units Observation units were considered the "family units" within the households, characterized by having at least one adult age 60 or over. A family unit could be any of the following:
a. One unmarried person or a person living alone b. A couple with both people age 60 or older. c. A couple with one person age 60 or older

Sample Design PREHCO Project 4
A household could have one or more family unit; all units were included in the survey. When the family unit consisted of two elderly adults, one target or individual participating in the survey was selected from this couple. The study incorporated criteria to underscore the population 80 years or older, that is, to favor adults age 80 and over and within this group, men, when selecting the target in a family unit within each household in a random manner with equal probabilities. Spouses of any age were also interviewed by means of a reduced questionnaire. Those spouses being 60 or older were also measured. 6. Units of Analysis The units of analysis were all elderly adults who lived in the selected households, favoring men age 80 and older as targets and women age 80 and older, when the women were not spouses of men age 80 and older. 7. Sampling Strategy The sampling strategy will be explained through the sample design and the use of estimators.
7.1 Sample Design
7.1.1 Type of sample
The sample design corresponds to a multistage probabilistic sample by clusters.
7.1.2 Sample Units The following sample units were considered:
First Stage Units: A First Stage Unit (UPE for its Spanish acronym) used the Block Groups, a unit corresponding to a geographic division of municipalities, which divide the country for census purposes by the U.S. Census Bureau, Population and Housing. The study used the structure of the U.S. Census 2000 where the Census Tract code is combined with the identification of Block Groups for a unique definition. Second Stage Units: A Second Stage Unit (USE for its Spanish acronym) initially regarded the blocks as the census unit that was mapped and digitalized, allowing for the use of Global Positioning System (GPS) equipment for a geo-referential system and thus facilitating the location of the sample units for the enumerators and interviewers as well as for supervisors in field quality control work.

Sample Design PREHCO Project 5
Finally, due to the large variability in the size of these units, second stage sample units were constructed in some cases by joining blocks and in other units by dividing blocks in order to attain units with physical limits and which had approximately 90 households. A Second Stage Unit was then considered as the unit created to denominate a "Section" for this survey. After several phases of analysis, sections were only created for the Primary Sample Units (UPM for their Spanish acronym) selected for the sample design.
Phase One: Preparation of the framework for the selection of sections An indexing system was prepared with the files from the Master Sampling Framework1 in order to obtain the information corresponding to each selected Block Group about the blocks that were part of the group as well as the total number of households in each block according to the Census 2000. A map (TIGER files) for each selected Block Group was also extracted from the census with its internal division of blocks and its identification. Models were prepared that listed the blocks with the total number of households so that they could be grouped with 90 households and would then become defined as sections. According to the characteristics of the grouping selected, the UPM were divided in two groups. 1st group: the Primary Sample Unit, UPM that remained defined as a selected section after the blocks were grouped. With these units, the households in each section were enumerated to determine their eligibility. 2nd group: the UPM that required an intermediate stage of pre-segmentation before being enumerated and determining the eligibility of the households as in the first group. The intermediate stage consisted of going to the block or blocks that comprised the block group and drawing a diagram of all the houses and structures in this unit, without visiting the households. In this manner, all of the houses were counted and a division was made with identifiable limits on the diagram, which corresponded to two or more sections, depending on the total number of households. Afterwards, it was determined in the office which sections would finally be defined as the Block Group and select one of them. Once selected, the enumerators returned to the field to complete the numbering.
1 For a discussion about the Master Sampling Framework, see Section 7.1.6

Sample Design PREHCO Project 6
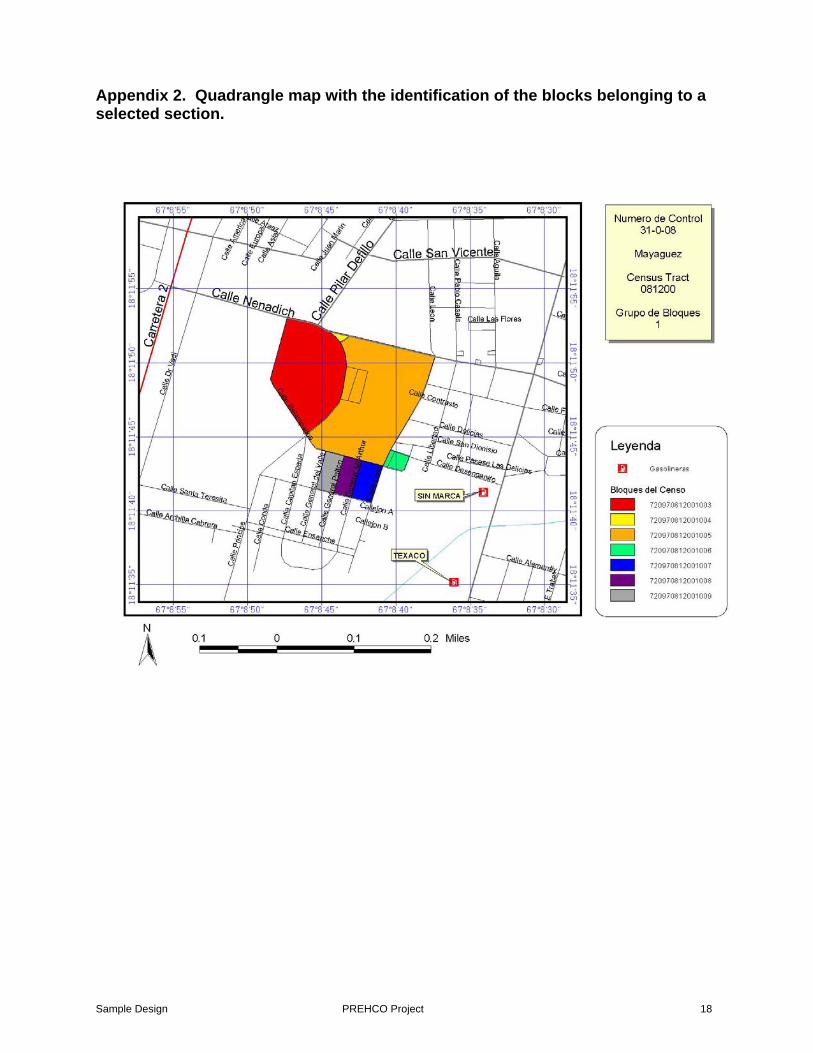
Phase Two: Preparation of records for Primary Sample Units (UPM) The record for each UPM was prepared with a color-coded quadrangle map that identified the blocks that were part of the unit. The record also included the control number, the substratum, the Census Tract and the number of the Block Group, as well as the identification of reference buildings such as schools, gas stations and important apartment buildings in the zone. The quadrangle maps specified longitude and latitude, which allowed the location of other strategic points and the use of GPS for the different sections. Refer to Appendix 2 for an example of a quadrangle map with the identification of the blocks belonging to a selected section. Phase Three: Enumeration In each section all households were listed. The basic data: sex, age and marital status for persons 60 over was compiled. The study expected to find an average of 13 households with elderly adults in each section, all of which would be selected to participate in the study. Delay was avoided from the time of enumeration to the time of the interviews such that the lists remained up-to-date. Phase Four: Determination of Family Units For each household with elderly adults a determination was made in the office regarding the targets to be selected from these family units. 7.1.3 Selection Probabilities The First Stage Units and the Second Stage Units were selected with a proportional probability for size, given that the total number of households was reported in the Census 2000 Population and Housing data. As mentioned above, the average number of households per section expected to have elderly adults was thirteen. Examples of the selection procedure for sections and lists of blocks are presented in Appendices 3 and 4. In those households where both spouses were 60 or older we followed the selection procedure explained on pages 3-4, point 5.

Sample Design PREHCO Project 7
7.1.4 Stratification The initial evaluation of the geographic stratification resulted in five different variants that were submitted to the technical team for analysis and that concluded with the following selection:
Puerto Rico was divided into 5 strata and 12 substrata with the following characteristics:
One (1) stratum corresponded to the postal zone of San Juan
Stratum 1: San Juan o Substrata 11: Municipality of San Juan o Substrata 12: the remaining metropolitan area.
The San Juan metropolitan area is the area which allows a comparison between the SABE study and PREHCO.
Three (3) strata corresponding generally to the principal Puerto Rico
Health Department regions Stratum 2: Ponce
o Substrata 21: Municipality of Ponce o Substrata 22: the remaining urban area
Stratum 3: Mayagüez o Substrata 31: Municipality of Mayagüez o Substrata 32: the remaining urban area
Stratum 4: Arecibo o Substrata 41: Municipality of Arecibo o Substrata 42: the remaining urban area
One (1) stratum corresponding to the rest of the eastern zone of
Puerto Rico identified as Eastern Zone: Stratum 5: Eastern Zone
o Substrata 51: Loiza o Substrata 52: Guayama o Substrata 53: Remaining area of Bayamón o Substrata 54: Remaining area of Eastern Zone
The objective of this stratification and sub-stratification is to obtain estimates for the basic indicators of the principal municipalities in each stratum and compare these indicators to the rest of the population in the stratum. In the case of the stratum of Humacao, the population will also be studied for skin color given the high percentage of Blacks and persons of mixed ancestry. Refer to Appendix 5 Census Data for the PREHCO Sample Design Stratum and Substratum and Appendix 6: Map of Sample sections by Stratum and Substratum.

Sample Design PREHCO Project 8
7.1.4.2 Socioeconomic Stratification
For the socioeconomic stratification, two indicators were considered: the cost of rent and the value of residential property. However, these indicators resulted in a very heterogeneous unit for the block groups, which prevented a unique classification. As a result of this analysis, the socioeconomic stratification will be completed after the survey using a combination of variables selected from the questionnaire (such as the value of residential property or the cost of rent, income, etc.). This will allow the development of an index to determine the classification as low, medium or high. (Refer to the Analysis in Appendix 7).
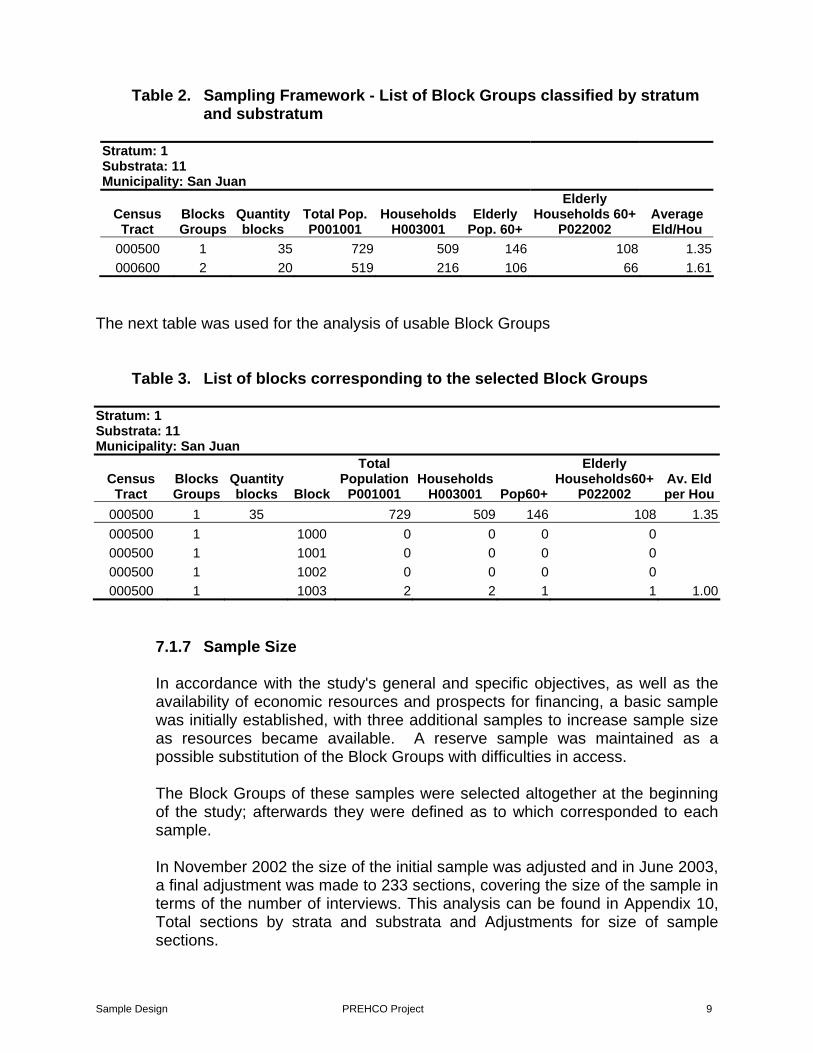
7.1.5 Allocation of sample by stratum and substratum The distribution of the sample was completed by an allocation of the uniform and proportional distributions so as to attain all of the study's anticipated objectives. (Refer to Appendix 8, Distribution of the Sample by Stratum and Substratum). Appendix 9 presents a comparison of the initial sample, the adjusted sample from 2002 and the final sample, including the spouses age 60 and over and all spouses. The anticipated sample size was attained. 7.1.6 Sampling Framework The source of information for the design of the Master Sampling Framework was the information on Puerto Rico from the Census 2000 Population and Housing data from the U.S. Census Bureau, which was made public on August 8, 2001. (Summary File 1; Geographic segments: GEO, 1, 2, 3 y 37) The total number of Block Groups in Puerto Rico was 2,466; these were submitted to an analytical process and 2,390 (96.7%) were considered. Forty-four (44) Block Groups without housing or special zones were then eliminated: two were the island municipalities of Culebra and Vieques, which were not considered in the study and the rest were Block Groups joined with other Block Groups in the same Census Tract because they did not have the minimum required number of household or persons. Also eliminated were blocks in the Block Groups whose average number of elderly adults was extremely high compared to other blocks, signifying that that these blocks were institutions. The following is an example of the Block Groups classified by stratum and substratum
Sample Design PREHCO Project 9
Table 2. Sampling Framework - List of Block Groups classified by stratum and substratum
Stratum: 1 Substrata: 11 Municipality: San Juan
Census Tract
Blocks Groups
Quantity blocks
Total Pop. P001001
HouseholdsH003001
Elderly Pop. 60+
Elderly Households 60+
P022002 Average Eld/Hou
000500 1 35 729 509 146 108 1.35000600 2 20 519 216 106 66 1.61
The next table was used for the analysis of usable Block Groups
Table 3. List of blocks corresponding to the selected Block Groups
Stratum: 1 Substrata: 11 Municipality: San Juan
Census Tract
Blocks Groups
Quantity blocks Block
Total Population
P001001 Households
H003001 Pop60+
Elderly Households60+
P022002 Av. Eld per Hou
000500 1 35 729 509 146 108 1.35000500 1 1000 0 0 0 0 000500 1 1001 0 0 0 0 000500 1 1002 0 0 0 0 000500 1 1003 2 2 1 1 1.00
7.1.7 Sample Size
In accordance with the study's general and specific objectives, as well as the availability of economic resources and prospects for financing, a basic sample was initially established, with three additional samples to increase sample size as resources became available. A reserve sample was maintained as a possible substitution of the Block Groups with difficulties in access. The Block Groups of these samples were selected altogether at the beginning of the study; afterwards they were defined as to which corresponded to each sample. In November 2002 the size of the initial sample was adjusted and in June 2003, a final adjustment was made to 233 sections, covering the size of the sample in terms of the number of interviews. This analysis can be found in Appendix 10, Total sections by strata and substrata and Adjustments for size of sample sections.
Sample Design PREHCO Project 10
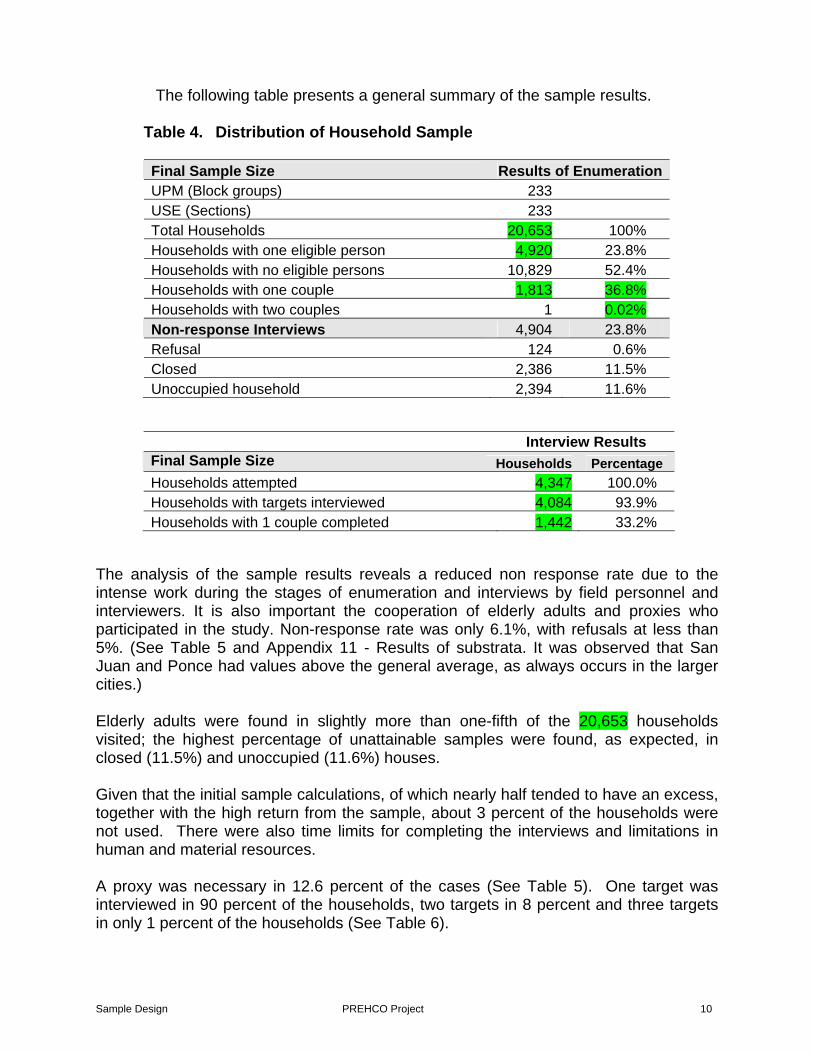
The following table presents a general summary of the sample results.
Table 4. Distribution of Household Sample
Final Sample Size Results of EnumerationUPM (Block groups) 233 USE (Sections) 233 Total Households 20,653 100% Households with one eligible person 4,920 23.8% Households with no eligible persons 10,829 52.4% Households with one couple 1,813 36.8% Households with two couples 1 0.02% Non-response Interviews 4,904 23.8% Refusal 124 0.6% Closed 2,386 11.5% Unoccupied household 2,394 11.6%
Interview Results Final Sample Size Households Percentage Households attempted 4,347 100.0% Households with targets interviewed 4,084 93.9% Households with 1 couple completed 1,442 33.2%
The analysis of the sample results reveals a reduced non response rate due to the intense work during the stages of enumeration and interviews by field personnel and interviewers. It is also important the cooperation of elderly adults and proxies who participated in the study. Non-response rate was only 6.1%, with refusals at less than 5%. (See Table 5 and Appendix 11 - Results of substrata. It was observed that San Juan and Ponce had values above the general average, as always occurs in the larger cities.) Elderly adults were found in slightly more than one-fifth of the 20,653 households visited; the highest percentage of unattainable samples were found, as expected, in closed (11.5%) and unoccupied (11.6%) houses. Given that the initial sample calculations, of which nearly half tended to have an excess, together with the high return from the sample, about 3 percent of the households were not used. There were also time limits for completing the interviews and limitations in human and material resources. A proxy was necessary in 12.6 percent of the cases (See Table 5). One target was interviewed in 90 percent of the households, two targets in 8 percent and three targets in only 1 percent of the households (See Table 6).

Sample Design PREHCO Project 11
Table 5. Final Sample Results
Results by Strata Reasons for Non-Response Interviews
STRATUM 1 2 3 4 5 Total PercentageTARGET Total Targets attempted 1462 781 740 798 790 4571 100.0Target Interviewed 1340 710 716 775 750 4291 93.9Direct Int. 1159 627 631 647 649 3718 (86.5) Proxy Int. 181 83 85 128 101 578 (13.5) Non-response 122 71 24 23 40 280 6.1Refusal 96 53 22 14 32 217 4.7Incomplete Interview 3 2 0 1 1 7 0.1Did not have Proxy 8 5 1 3 4 21 0.5Other reason 5 3 0 1 2 11 0.2Int. not available 13 10 1 5 2 31 0.7SPOUSE Total spouses 563 391 278 326 287 1795Total spouses attempted 511 298 266 314 269 1658 100.0Spouse Interviewed 426 264 251 282 219 1442 86.9Direct Interview 384 260 239 267 204 1354 (93.9) Proxy Interview 42 4 12 15 15 88 ( 6.1) Spouse interviewed 60 and over 341 177 174 196 154 1042 (72.2) Spouse interviewed under 60 85 87 77 86 64 400 (27.8) Non-response 84 34 15 32 51 216 13.0Refusal 48 18 5 16 29 116 7.0Institutionalized or not found 4 1 0 1 4 10 0.6Did not have Proxy 0 0 1 0 1 2 0.1Other reason 4 0 1 0 2 7 0.4Int. not available 29 15 8 15 14 81 4.9

Sample Design PREHCO Project 12
Table 6. Final Sample Results According to Number of Targets per Household
7.2. Estimators A post-stratification was done by sex and age groups, using proportional estimators at the level of substratum. Post-stratification adding the variable of marital status to sex and age is being evaluated. To evaluate the indicators of the survey, ratio estimators combined with the techniques of post-stratification were used. The probabilities of selection used in the sample design were the following: Table 7. Probability of selection of the sample units
Sample Units Spanish Acronym Name Selection probabilities
First Stage Unit UPE Block Groups Probability Proportional to SizeSecond Stage Unit USE Section Probability Proportional to Size
Within the section selected in each Block Group, households with elderly adults were selected and in each household the number of elderly people was enumerated for later determining the family units in the office.
Households attempted Total %
Households with interview
completed %
Total Targets
completed %
Total 4,347 100.0 4,084 100.0 4,291 100.0With one target 4,150 95.47 3,899 95.47 3,899 90.86With two targets 174 4.00 165 4.04 330 7.69With three targets 19 0.44 18 0.44 54 1.26With four targets 4 0.09 2 0.05 8 0.19

Sample Design PREHCO Project 13
The final probability for each element of the population in each substratum is calculated as follows: You have
where g: # of Block Groups in substratum sample Vi: Total households in Block Group i of the substratum V : Total households in substratum population Vij: Total households in section j of Block Group i of the substratum v : Average households with personas age 60 or older in section j of Block Group i of the substratum Data is presented in two databases, the first one with the target’s information and his spouse information in a single record, and the second one with all the persons 60 or older, targets and spouses in independent records. For the targets database a post-stratification was made by sex and six age groups (60-64, 65-69, 70-74, 75-79, 80-84 and 85 or older). For the 60 or older persons database (targets and spouses in independent records) a post-stratification was made by sex, five age groups (60-64, 65-69, 70-74, 75-79, 80 or older) and marital status (two categories: married and not married). Ratio estimators are used with the estimated population information from projections from the Census 2000 Population and Housing data as auxiliary variables and a post-stratification is applied for sex and age groups (60-64, 65-69, 70-74, 75-79, 80-84 and 85 and over), which results in 12 categories in each substrata for the targets database and 20 in each substrata for the targets and spouses, 60 or older, database. Total Estimators
Where Is the value of the variable of interest in the i unit, of the s section, of the g block group, of the
iji
ijiV
vVV
VVg
F
=1
y W hgsih g s i
i ∑ ∑ ∑ ∑=Y ˆ
y hgsi

Sample Design PREHCO Project 14
h substratum. Is the factor of the final weight of the i unit, of the s section, of the g block group, of the h substratum that belongs to category c. Is the weight factor of category c for the h substratum Is the inverse of the Product of the Probabilities of Selection according to the Sample Design of the i unit of the s section, of the g block group, of the h substratum
And is defined using: The Total Population of category c of the h substratum. (Using information from the Population Estimates of the Census Data Center)
Total Estimated Population using survey results of the c category of the h substratum.
Where
1 if the i unit of the s section, of the g block group, of the h substratum belongs to category c 0 other situation
The final weight factor, Wi, for each record was located in a variable called FAC_T (in the targets database) and FAC_TC (in the targets and spouses 60 or older database). Those spouses younger that 60 have no associated weight factor.
Fhc hgsiiW α=
pP
hc
hchc ∧=α
( )Fp hgsig s i
hgsihc c∑ ∑ ∑=∧
γ
( ) =chgsiγ
F hgsi
P hc

Sample Design PREHCO Project 15
Ratio Estimators The proportion is calculated for the two variables as the quotient of the two ratio estimators:
Where X is defined in a manner similar to Y Variance Estimators The method to be used to calculate the variances of the selected indicators corresponds to the "Ultimate Cluster" method, using STATA software2. The tables will be presented with the estimations of the selected indicators with standard deviations, variation coefficients and the design effect, which will allow an analysis of the accuracy of the primary results and calculate the confidence intervals as shown in the following section. Accuracy of the Results The accuracy of the results will be evaluated using the variation coefficient, which is the quotient of the standard deviation and the estimation for each indicator. The Variation Coefficient of the estimations is interpreted in the following way:
Variation Coefficient less than 5%, the estimation of the indicator is Very Good. Variation Coefficient between 5% and 10%, the estimation of the indicator is
Good. Variation Coefficient between 10% and 15%, the estimation of the indicator is
Acceptable. Variation Coefficient between 15% and 20%, one must use the estimation of
the indicator with caution. Variation Coefficient greater than 20%, the estimation of the indicator does not
have good accuracy and will only be used as an indicative number obtained for the analysis of the indicator at certain times.
The variation coefficients allow the calculation of confidence intervals for the estimations. These intervals are calculated using the following formula:
( ) ( )( ) ( )( )( )estestestestestestest YVCYtYYVCYtYYCI ..**;..**.. +−= where, t Is the percentile of the normal distribution that, at a 90 percent confidence level, has the value of 1.96.
2 STATA: Statistics Data Analysis
XY R =

Sample Design PREHCO Project 16
( )estY Represents the value estimated for the survey for the population parameter.
( )( )estYVC .. Is the Estimated Variation Coefficient ( )estYCI .. Is the Confidence Interval
The estimations for the survey do not have exact values; they have values that move within a confidence level as described above. This means that the sample was designed in such a manner that for 100 samples of the same size and design, the true value of the population parameter will be within this interval in 95 of the samples. 8. Pilot Study Sample To undertake the pilot study, a sample with a similar sample design to the survey was selected. The sites selected were in 3 substrata, San Juan, Guayama and Loíza. The pilot was carried out in February 2002. The size of the sample was determined to be 15 blocks within three municipalities and one section for each Block Group. 113 interviews were carried out, 98 directly and 15 with a proxy. The pilot study accomplished its purpose.
Sample Design PREHCO Project 17
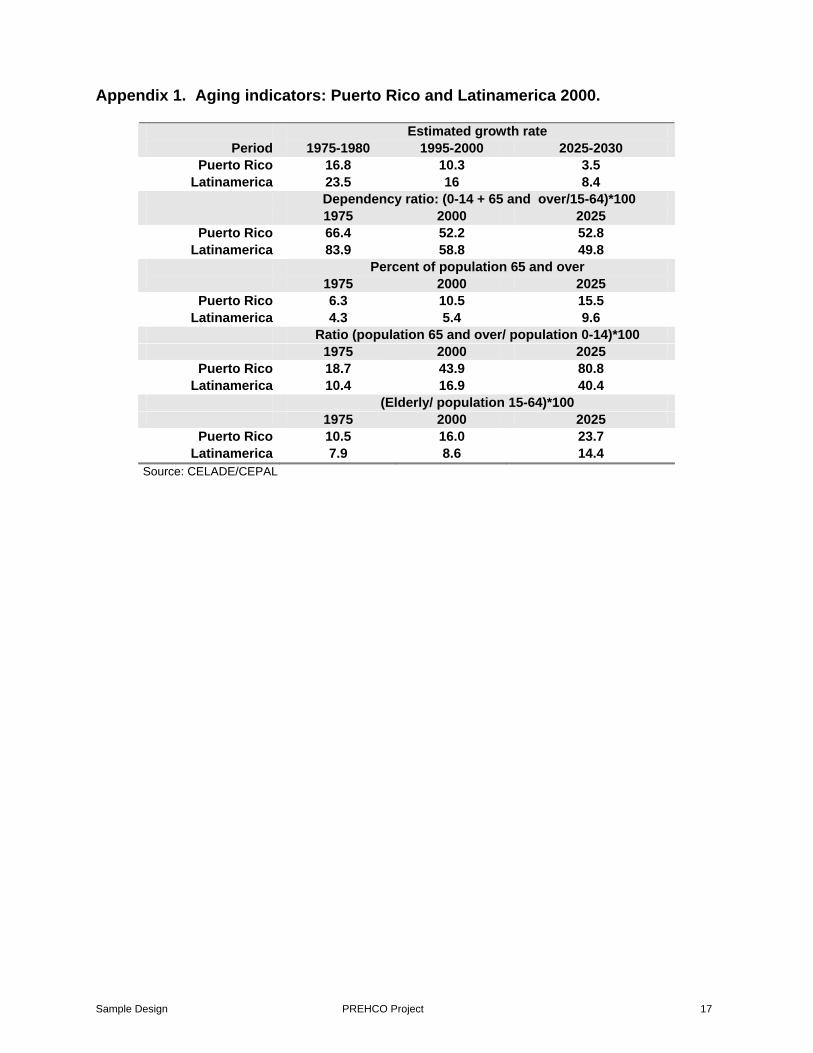
Appendix 1. Aging indicators: Puerto Rico and Latinamerica 2000.
Estimated growth rate Period 1975-1980 1995-2000 2025-2030
Puerto Rico 16.8 10.3 3.5 Latinamerica 23.5 16 8.4
Dependency ratio: (0-14 + 65 and over/15-64)*100 1975 2000 2025
Puerto Rico 66.4 52.2 52.8 Latinamerica 83.9 58.8 49.8
Percent of population 65 and over 1975 2000 2025
Puerto Rico 6.3 10.5 15.5 Latinamerica 4.3 5.4 9.6
Ratio (population 65 and over/ population 0-14)*100 1975 2000 2025
Puerto Rico 18.7 43.9 80.8 Latinamerica 10.4 16.9 40.4
(Elderly/ population 15-64)*100 1975 2000 2025
Puerto Rico 10.5 16.0 23.7 Latinamerica 7.9 8.6 14.4
Source: CELADE/CEPAL
Sample Design PREHCO Project 18
Appendix 2. Quadrangle map with the identification of the blocks belonging to a selected section.
Sample Design PREHCO Project 19
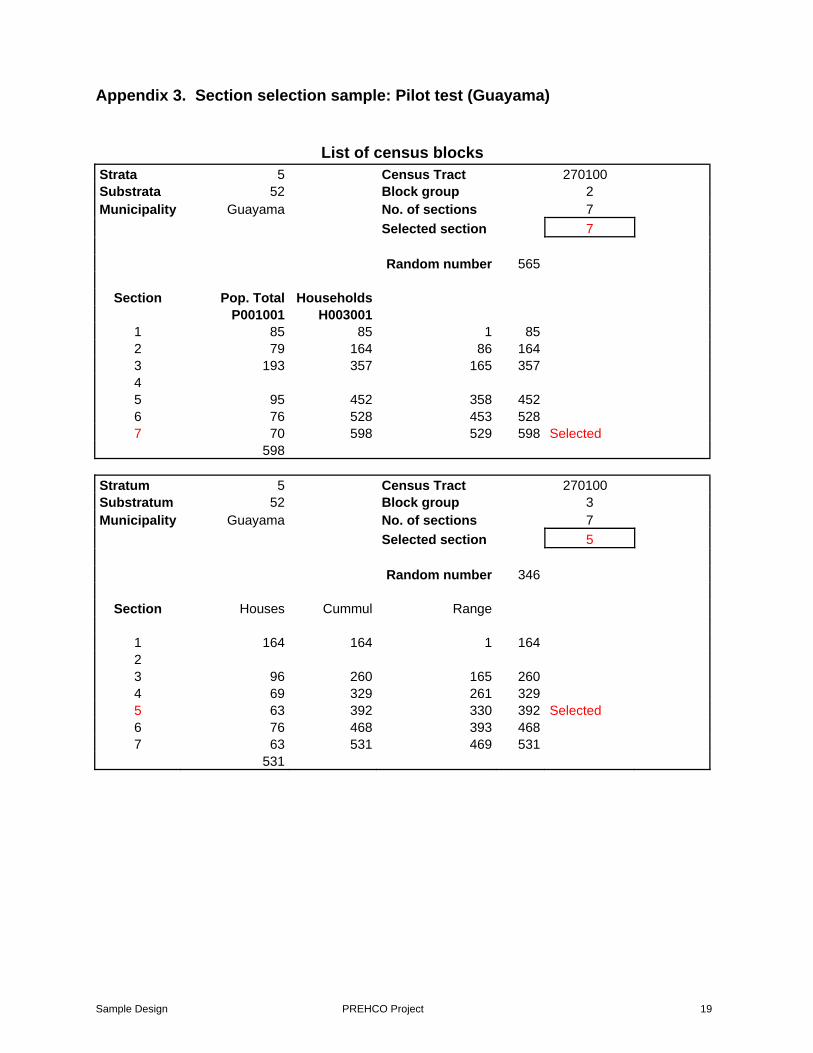
Appendix 3. Section selection sample: Pilot test (Guayama)
List of census blocks Strata 5 Census Tract 270100 Substrata 52 Block group 2 Municipality Guayama No. of sections 7 Selected section 7 Random number 565
Section Pop. Total Households
P001001 H003001 1 85 85 1 85 2 79 164 86 164 3 193 357 165 357 4 5 95 452 358 452 6 76 528 453 528 7 70 598 529 598 Selected
598 Stratum 5 Census Tract 270100 Substratum 52 Block group 3 Municipality Guayama No. of sections 7 Selected section 5 Random number 346
Section Houses Cummul Range 1 164 164 1 164 2 3 96 260 165 260 4 69 329 261 329 5 63 392 330 392 Selected 6 76 468 393 468 7 63 531 469 531
531

Sample Design PREHCO Project 20
Guayama Special sample
Stratum 5 Census Tract 270500 Substratum 52 Block group 2 Block group 270500-2 Random numbe r 238
Section Houses Cummul Range 1 98 98 1 98 2 53 151 99 151 3 55 206 152 206 4 91 297 207 297 Selected 5 76 373 298 373
373 Stratum 5 Census Tract 270600 Subestratum 52 Block group 4 Blocl group 270600-4 Random number 299
Section Houses Cummul Range
1 95 95 1 95 2 89 184 96 184 3 95 279 185 279 4 90 369 280 369 Selected 5 100 469 370 469 6 84 553 470 553
Stratum 5 Census Tract 270200 Substratum 52 Group block 3 Block group 270600-4 270200-3 Random number 1170
Section Houses Cummul. Range
1 189 2 189 1 189 3 86 275 190 275 4 98 373 276 373 5 116 489 374 489 6 74 563 490 563 7 102 665 564 665 8 81 746 666 746 9 79 825 747 825
10 79 904 826 904 11 66 970 905 970 12 88 1058 971 1058 13 60 1118 1059 1118 14 85 1203 1119 1203 Selected 15 74 1277 1204 1277

Sample Design PREHCO Project 21
Stratum 5 Census Tract 270800 Substratum 52 Block group 2 Block group 270600-4 270800-2 Random number 72
Section Houses Cummul. Range
1 76 76 1 76 Selected 2 88 164 77 164 3 75 239 165 239 4 99 338 240 338 5 113 451 339 451 6 105 556 452 556

Sample Design PREHCO Project 22
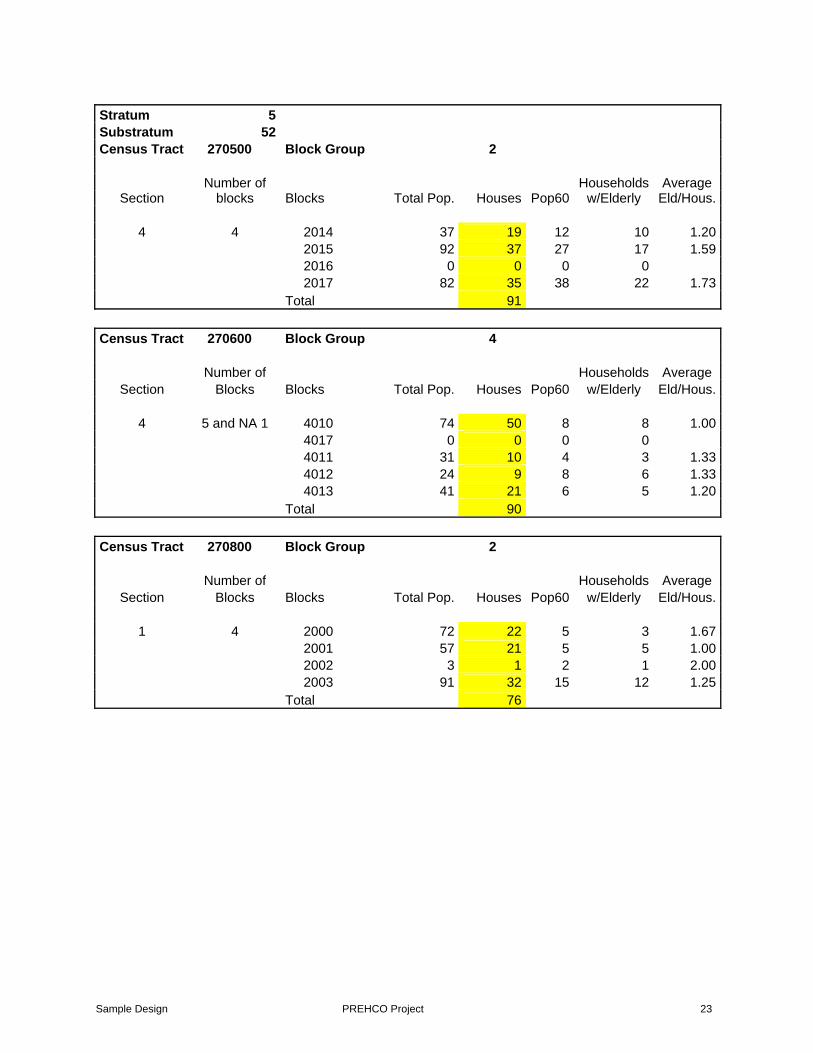
Appendix 4. Example of Block List for Selected Sections
Blocks in each Selected Section by Selected Block Group Guayama
Special Sample Strata 5 Substrata 52 Municipality Guayama Census Tract 270100 Block Group 2
Number of Households Average
Section Blocks Blocks Total Pop. Houses Pop60 w/Elderly Eld/Hous.
7 6 2034 24 8 4 2 2.00 2035 24 7 6 4 1.50 2036 126 46 18 15 1.20 2037 11 5 2 2 1.00 2038 0 0 0 0 2039 9 4 0 0 Total 70
Census Tract 270100 Block Group 3
Number of Households Average
Section Blocks Blocks Total Pop. Houses Pop60 w/Elderly Eld/Hous.
5 1 3011 192 63 29 21 1.38 Total 63
Stratum 5 Substratum 52 Census Tract 270200 Block Group 3
Number of Households Average Section Blocks Block Total Pop Houses Pop60 w/Elderly Eld/Hous.
14 5 3162 127 67 16 13 1.23
3163 0 0 0 0 3166 1 7 1 1 1.00 3181 0 0 0 0 3182 0 0 0 0
Total 74
Sample Design PREHCO Project 23
Stratum 5 Substratum 52 Census Tract 270500 Block Group 2
Number of Households Average Section blocks Blocks Total Pop. Houses Pop60 w/Elderly Eld/Hous.
4 4 2014 37 19 12 10 1.20 2015 92 37 27 17 1.59 2016 0 0 0 0 2017 82 35 38 22 1.73 Total 91
Census Tract 270600 Block Group 4
Number of Households Average
Section Blocks Blocks Total Pop. Houses Pop60 w/Elderly Eld/Hous.
4 5 and NA 1 4010 74 50 8 8 1.00 4017 0 0 0 0 4011 31 10 4 3 1.33 4012 24 9 8 6 1.33 4013 41 21 6 5 1.20 Total 90
Census Tract 270800 Block Group 2
Number of Households Average
Section Blocks Blocks Total Pop. Houses Pop60 w/Elderly Eld/Hous.
1 4 2000 72 22 5 3 1.67 2001 57 21 5 5 1.00 2002 3 1 2 1 2.00 2003 91 32 15 12 1.25 Total 76

Sample Design PREHCO Project 24
Appendix 5. Census Data by Strata and Subestrata for Sample Design – Project PREHCO
Total Pob. % Elderly
Pob. % % Elderly Households % Total
Households % Householdsw/Elderly % % Households
w/Elderly
Puerto Rico Total 3797636 100.0 583603 100.0 15.4 1413064 100.0 1257307 100.0 419592 100.0 33.4
Strata Substrata
San Juan 11 434374 35.9 83118 41.3 19.1 182101 39.5 163462 39.1 59499 41.8 36.4
12 773986 64.1 118111 58.7 15.3 278804 60.5 254978 60.9 82723 58.2 32.4
Total 1208360 100.0 201229 100.0 16.7 460905 100.0 418440 100.0 142222 100.0 34.0
Ponce 21 186475 39.0 29402 42.9 15.8 66471 39.7 59607 40.0 21182 42.3 35.5
22 292230 61.0 39158 57.1 13.4 100872 60.3 89394 60.0 28844 57.7 32.3
Total 478705 100.0 68560 100.0 14.3 167343 100.0 149001 100.0 50026 100.0 33.6
Mayagüez 31 98434 18.0 18025 19.9 18.3 39364 18.2 34742 18.6 13075 19.9 37.6
32 448523 82.0 72493 80.1 16.2 177388 81.8 151996 81.4 52521 80.1 34.6
Total 546957 100.0 90518 100.0 16.5 216752 100.0 186738 100.0 65596 100.0 35.1
Arecibo 41 100131 21.7 17581 25.3 17.6 38974 23.3 34245 22.8 12657 25.2 37.0
42 361173 78.3 51989 74.7 14.4 128288 76.7 115945 77.2 37623 74.8 32.4
Total 461304 100.0 69570 100.0 15.1 167262 100.0 150190 100.0 50280 100.0 33.5
Humacao 51 32537 3.0 3277 2.1 10.1 10927 2.7 9597 2.7 2438 2.2 25.4
52 114683 10.4 16118 10.5 14.1 43208 10.8 37151 10.5 12047 10.8 32.4
53 327874 29.7 43511 28.3 13.3 114946 28.7 102280 29.0 31543 28.3 30.8
54 627216 56.9 90820 59.1 14.5 231721 57.8 203910 57.8 65440 58.7 32.1
Total 1102310 100.0 153726 100.0 13.9 400802 100.0 352938 100.0 111468 100.0 31.6

Sample Design PREHCO Project 25
Appendix 6. Map of Sample sections by Stratum and Substratum
Guayama
Loiza
Mayagüez
Ponce
Arecibo
Zona Este
San Juan
Guayama
Loiza
20 13
23
19
2017
9
10
13
39 3714
Humacao
Bayamón

Sample Design PREHCO Project 26
Simple design PREHCO Proyect 27
Appendix 7. Analysis of the Socioeconomic Stratification of the Primary Sample Units The Sample Units in the First Stage are census Block Groups that are stratified according to predetermined geographic criteria for five strata. Stratum 1. San Juan Postal Zone Stratum 2. Health Region of Ponce (except area of Guayama) Stratum 3. Health Region of Mayagüez. Stratum 4. Health Region of Arecibo Stratum 5. Eastern Region (Caguas, Guayama, sub-region of Fajardo, Barranquitas, Vega Alta, Dorado, Canóvanas and Loíza From the socioeconomic point of view, it is also useful to carry out a stratification of the interior of these geographic regions. Given that the information about the Census 2002 economic variables would only become available in the year 2002, the study decided to value variables from the 1990 census, which had data at the level of block groups, and later assign this criteria to the 2000 block groups through a matching process of the block groups in both census. This took advantage of comparing and guaranteeing the 2000 census in relation to the 1990 census for a large percentage of the census units. As a starting point for the stratification, indicators were sought that allowed discrimination between low, medium and high levels, assigning a value to two of the available indicators: • Poverty indicator. This indicator assigned a value to the families according to their
declared income, family size, if there were elderly adults, and the number of children younger than 18 years of age.
• Value of housing indicator. The ranges for which the census classified residential property values and the cost for rent paid by households were studied.
After studying both indicators, it was concluded that the variable that had the highest correlation between 1990 and 2000 census data was the variable for residential property values and rent and although both had increased, the increases were considered to have been proportionate.
Simple design PREHCO Proyect 28
Analysis of variables at the municipal level and for Puerto Rico 1st indicator - Residential property values There were 21 variables that corresponded to equal ranges of value for residential property, reaching up to $500,000 and over. This was initially reduced to 12 groups, those that had weight in Puerto Rico, grouping from $75,000 and over, since the others were statistically insignificant. The totals for all of the municipalities were then calculated and divided into three groups with approximately one-third of the total households in each group, resulting in the following criteria: Low (Less than 25,000) corresponds to 34.8% of the households Medium (from 25,000 to 49,999) corresponds to 33.3% of the households High (50,000 and over) corresponds to 31.9% of the households The municipalities were analyzed with these divisions. 2nd indicator - Value of rent There were 17 variables that corresponded to equal ranges of value of rent, reaching up to $1,000 and over, plus one variable for households that do not pay rent. This was reduced to three groups, making the cut for the values that represented all of Puerto Rico and resulting in one-third of the households for each group with the following criteria: Low (Less than 100) 32.2% Medium (100 to 199) 30.8% High (200 or more) 37.0% After classifying each household of home owners and renters in one of the three levels, the values were aggregated at the level of the municipality and for all of Puerto Rico for households that corresponded to each level (low medium and high) according to the value of the rent and the value of the residential property. A category was added to the classification for households that do not pay for housing resulting in the following classification for the structure of housing: Do not pay 6.8% Low 31.9% Medium 30.4% High 30.9% With the above results at the level of municipalities and for all of Puerto Rico, the classification appeared adequate and was then applied to the block groups within each municipality.
Simple design PREHCO Proyect 29
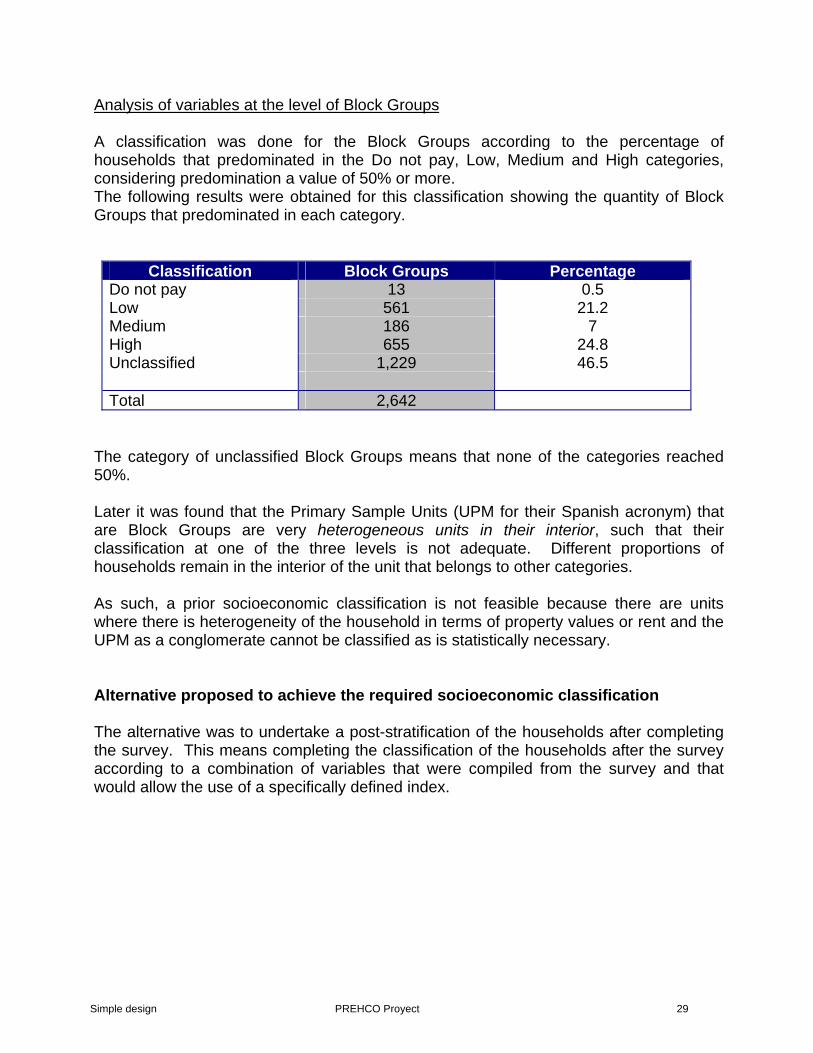
Analysis of variables at the level of Block Groups A classification was done for the Block Groups according to the percentage of households that predominated in the Do not pay, Low, Medium and High categories, considering predomination a value of 50% or more. The following results were obtained for this classification showing the quantity of Block Groups that predominated in each category.
Classification Block Groups Percentage Do not pay 13 0.5 Low 561 21.2 Medium 186 7 High 655 24.8 Unclassified 1,229 46.5 Total 2,642
The category of unclassified Block Groups means that none of the categories reached 50%. Later it was found that the Primary Sample Units (UPM for their Spanish acronym) that are Block Groups are very heterogeneous units in their interior, such that their classification at one of the three levels is not adequate. Different proportions of households remain in the interior of the unit that belongs to other categories. As such, a prior socioeconomic classification is not feasible because there are units where there is heterogeneity of the household in terms of property values or rent and the UPM as a conglomerate cannot be classified as is statistically necessary. Alternative proposed to achieve the required socioeconomic classification The alternative was to undertake a post-stratification of the households after completing the survey. This means completing the classification of the households after the survey according to a combination of variables that were compiled from the survey and that would allow the use of a specifically defined index.

Sample design PREHCO Proyect 30
Appendix 8. Distribution of the Sample by Stratum and Substratum.
(BG x 12.6 average) (A) Total number of
sections
Basic sample BG
Eligible households (GB x 12.6)
Expected targets
Expected Spouses
ReserveSample
Add. Sample 1
Add. Sample 2
Add. Sample 3
Special sample
Strata Substrata
(B) Total block
groups
% A/B
Stratum San Juan 105 1323 1422 754 5 110 835 13.2 1 San Juan 53 668 718 381 3 56 358 15.6 Resto 52 655 704 373 2 54 477 11.3
Stratum Ponce 55 693 745 395 5 5 5 5 75 306 24.5 2 Ponce 28 353 379 201 3 3 3 3 40 130 30.8 Resto 27 340 366 194 2 2 2 2 35 176 19.9
Stratum Mayagüez 55 693 745 395 5 5 5 5 75 348 21.6 3 Mayagüez 28 353 379 201 3 3 3 3 40 72 55.6 Resto 27 340 366 194 2 2 2 2 35 276 12.7
Stratum Arecibo 55 693 745 395 5 5 5 5 75 276 27.2 4 Arecibo 28 353 379 201 3 3 3 3 40 77 51.9 Resto 27 340 366 194 2 2 2 2 35 199 17.6
Stratum Humacao 55 693 745 395 5 5 5 5 7 82 625 13.1 5 Loiza 14 176 190 101 1 2 1 1 19* 19 21 90.5 Guayama 14 176 190 101 1 1 2 1 7 26 73 35.6 ResBayamon 13 164 176 93 1 1 1 2 18 176 10.2 ResHumacao 14 176 190 101 2 1 1 1 19 355 5.4
Puerto Rico 325 4095 4402 2334 25 20 20 20 417 2390 17.4
* The increase of the sample will be made taking 2 sections for each Block Group, since there are 21 and 37 were required. The sample to select is 19, considering the reserve sample and the three additional samples. All the block groups should be taken to have around 475 households with eligible adults.

Sample design PREHCO Proyect 31
Appendix 9. Comparison of size of initial and final samples
Sample Size by Strata and Substrata Initial size and couples anticipated
Adjusted 2002, Real size for age 60 and older, and Totals
Initial Sample Adjusted Sample Final Sample
Elderly Adults
AnticipatedCouples
AnticipatedTotal adults and spouses
Target 2002
Target 2003
Couples >=60 yrs
Total target and couples
Total Couples
Total Sample
Stratum 1 San Juan 1422 754 2176 1200 1340 341 1680 426 1766 San Juan 718 381 1099 600 664 142 806 162 826 Remaining 704 373 1077 600 676 199 874 264 940 Stratum 2 Ponce 745 395 1140 700 710 177 887 264 974 Ponce 379 201 581 350 350 85 435 121 471 Remaining 366 194 559 350 360 92 452 143 503 Stratum 3 Mayagüez 745 395 1140 743 716 174 891 251 967 Mayagüez 379 201 581 393 401 90 492 129 530 Remaining 366 194 559 350 315 84 399 122 437 Stratum 4 Arecibo 745 395 1140 700 775 196 971 282 1057 Arecibo 379 201 581 350 424 105 529 137 561 Remaining 366 194 559 350 351 91 442 145 496 Stratum 5 Humacao 745 395 1140 700 750 154 904 219 969 Loiza 189 100 290 190 204 43 247 60 264 Guayama 189 100 290 190 193 37 230 53 246
Rem Bayamon 176 93 270 160 188 28 216 42 230
Rem Humacao 189 100 290 160 165 46 211 64 229
Puerto Rico 4402 2334 6736 4000 4292 1042 5333 1442 5733

Simple design PREHCO Proyect 32
Appendix 10. Total sections by stratum and substratum. Adjusted size of the sample of sectors Table 1. Number of sections by stratum and substratum according to the initial and adjusted size of the sample
Number of sections Initial Adjusted Final
STRATUM
SUBSTRATUM Total sections (Percentage)
Total sections (Percentage)
Total sections
(Percentage) 11 San Juan 53 41 37
1 12 Remaining San Juan 52 105 (31.9) 39
80 (32.3) 39
76 (32.6)
21 Ponce 28 24 232 22 Remaining
Ponce 27 55
(16.7) 23 47
(18.9) 1942
(18.0)
31 Mayagüez 28 20 203 32 Remaining
Mayagüez 27 55
(16.7) 15 35
(14.1) 1333
(14.2)
41 Arecibo 28 20 204 42 Remaining
Arecibo 27 55
(16.7) 18 38
(15.3) 1737
(15.9)
51 Loíza 18 14 1452 Guayama 14 10 9
53 Remaining Bayamón 13 11 105
54 Remaining Humacao 14
59 (17.9)
13
48 (19.4)
12
45 (19.3)
Total 329 248 233 The adjustment for the size of the sample in terms of the number of sections was completed in November 2002 and had two fundamental aspects: I. Initial theoretical adjustments of the size of the sample of elderly adults from
4402 to 4000. The cost of the interviews was greater than initially projected and the limitation in available resources did not allow this amount of interviews.
II. Adjustments due to the increase in the return of the sample. The return for the
sample in terms of the number of interviews per sector was greater than anticipated. a) Sections were constructed in which nearly 50% had a size of 90 households;
these were conservative calculations in order to avoid risks.

Simple design PREHCO Proyect 33
b) Conservative calculations were made in terms of the number of households anticipated with elderly adults, which was more than 12.6%.
c) The behavior of the sample was better than anticipated in terms of the effectiveness of the work of the field personnel who achieved a non-response percentage for the sample due to refusal or negation of only 0.6%. The anticipated value was 6% while the non-response rate for closed households was 2.6% and the anticipated value was 3.3%.
d) Intense work was done to enumerate households in the field for sections where households had been rejected, were closed, where there was no information about the residents, where information was obtained from a neighbor reporting a person age 60 or older. For the recuperated category, 8.3% more households were achieved than anticipated. See Table 2.
Table 2. Households with completed interview according to enumeration codes Enumeration
Code Situation in the
enumeration Households with
completed interview Percentage
1 Household. with eligible person 3745
Recuperated 341 8.3% 3 Refused 35 4 Closed without information 48
5 Closed, neighbor reports elderly persons 258
Total 4086 100%
The calculation for the reduction of the sample by substratum was completed according to the sample design and based on the following principles:
Maintain the stratum of San Juan that corresponds to the capital at a level comparable to the rest of the countries in SABE
Assimilate the interviews over the quantity anticipated in Mayagüez (substratum 1 of Mayagüez), the municipality that most surpassed the quantity anticipated by 43 interviews and having a very high average of interviews per sector in relation to the rest of the substrata.
Maintain the size of the sample anticipated in the original plan for Loíza and Guayama, at the cost of reducing the size of the other two substrata that correspond to the regions of Bayamón and Humacao. This guarantees the anticipated analysis of the subpopulations of Blacks and agricultural workers in these two zones.
The selection of sections to be eliminated was done in a random manner and the final adjustment took place in June 2003 for 233 sections, which resolved the sizes of the samples in every stratum and substratum.

Appendix 11. Targets sample results by strata. Distribution of non-response.
Stratum Results 1 2 3 4 5
Total
Interviews 1340 710 716 775 750 4292 Target 1159 627 631 647 649 3713 Proxy 181 83 85 128 101 578 Non-response 122 71 24 23 40 280 Refusals 96 53 22 14 32 217 No proxy available 8 5 1 3 4 21 Other reason 5 3 0 1 2 11 Target not available 13 10 1 5 2 31 TOTAL 1462 781 740 798 790 4571
Targets sample results by strata. Percent distribution of non-response.
Stratum Results 1 2 3 4 5
Total
Interviews 91.7 90.9 96.8 97.1 94.9 93.9Target 79.3 80.3 85.3 81.1 82.2 81.2Proxy 12.4 10.6 11.5 16.0 12.8 12.6Non-response 8.3 9.1 3.2 2.9 5.1 6.1Refusals 6.6 6.8 3.0 1.8 4.0 4.7No proxy available 0.5 0.6 0.1 0.4 0.5 0.5Other reason 0.3 0.4 0.0 0.1 0.3 0.2Target not available 0.9 1.3 0.1 0.6 0.3 0.7

Targets sample results by substrata. Distribution of non-response.
Substratum Results 11 12 21 22 31 32 41 42 51 52 53 54
Total
Interviews 664 676 350 360 401 315 424 351 204 193 188 165 4291 Target 571 588 320 307 356 275 354 293 185 172 154 138 3713 Proxy 93 88 30 53 45 40 70 58 19 21 34 27 578 Non-response 56 66 51 20 21 3 14 9 8 14 5 13 280 Refusals 43 53 38 15 19 3 6 8 3 13 5 11 217 No proxy available 4 4 4 1 1 0 2 1 3 0 0 1 21 Other reason 4 1 2 1 0 0 1 0 0 1 0 1 11 Target not available 5 8 7 3 1 0 5 0 2 0 0 0 31
Total 720 742 401 380 422 318 438 360 212 207 193 178 4571 Targets sample results by substrata. Percent distribution of non-response.
Substratum Results 11 12 21 22 31 32 41 42 51 52 53 54
Total
Interviews 92.2 91.1 87.3 94.7 95.0 99.1 96.8 97.5 96.2 93.2 97.4 92.7 93.9 Target 79.3 79.2 79.8 80.8 84.4 86.5 80.8 81.4 87.3 83.1 79.8 77.5 81.2 Proxy 12.9 11.9 7.5 13.9 10.7 12.6 16.0 16.1 9.0 10.1 17.6 15.2 12.6 Non-response 7.8 8.9 12.7 5.3 5.0 0.9 3.2 2.5 3.8 6.8 2.6 7.3 6.1 Refusals 6.0 7.1 9.5 3.9 4.5 0.9 1.4 2.2 1.4 6.3 2.6 6.1 4.7 No proxy available 0.6 0.5 1.0 0.3 0.2 0.0 0.5 0.3 1.4 0.0 0.0 0.6 0.5 Other reason 0.6 0.1 0.5 0.3 0.0 0.0 0.2 0.0 0.0 0.5 0.0 0.6 0.2 Target not available 0.7 1.1 1.7 0.8 0.2 0.0 1.1 0.0 0.9 0.0 0.0 0.0 0.7