sample question paper date –...
TRANSCRIPT

© OCR 2016 [601/5122/5] H567/01 Turn over
Oxford Cambridge and RSA
A Level Psychology H567/01 Research methods
Sample Question Paper Date – Morning/Afternoon
Time allowed: 2 hours
You must have: • A scientific or graphical calculator • No additional materials are required for this Question Paper
* 0 0 0 0 0 0 *
First name
Last name
Centre number
Candidate number
INSTRUCTIONS • Use black ink. • Answer all the questions. • Write your answer to each question in the space provided. • Do not write in the bar codes.
INFORMATION • The total mark for this paper is 90. • The marks for each question are shown in brackets [ ]. • Quality of extended responses will be assessed in questions marked with an asterisk (*). • This document consists of 24 pages.
SPECIMEN
PMT

2
© OCR 2016 H567/01
SECTION A: Multiple choice
Answer all the questions.
1 Which is the name of a type of interview?
A closed
B likert
C quasi
D structured Your answer
[1]
2 Look at the following academic reference:
Piliavin, I.M., Rodin, J.A. & Piliavin, J. (1969) Good Samaritanism: An underground phenomenon? Journal of Personality and Social Psychology 13.
What is the error in this Harvard style reference?
A the date of the study should be at the end of the reference
B the page numbers are missing
C the surnames of the researchers should be listed in alphabetical order
D the title should give the aim of the investigation Your answer
[1]
3 Which two groups were compared in Chaney et al.’s (2004) study into operant conditioning?
A children being praised for using their inhaler and children being ignored when using their inhaler
B children using a standard inhaler and children using a modified inhaler
C children using an inhaler and children using no inhaler
D children with asthma and children without asthma Your answer
[1]
SPECIMEN
PMT

3
© OCR 2016 H567/01 Turn over
4 Look at the following data set from a condition where participants were timed (in seconds) completing a task in a crisis situation.
{36 45 51 67 54 19 50 45 27 76 54 45}
What is the range of this data set?
A 45
B 47.5
C 58
D 76 Your answer
[1]
5 Read the following hypothesis.
H1: “Women who earn above average salaries will score significantly higher on a confidence test than women who earn below average salaries.”
What is the independent variable in this hypothesis?
A earnings above or below average salaries
B high or low average salary
C high or low score on a confidence test
D women or men Your answer
[1]
6 Which group of people were included as participants for Maguire’s (2000) study into the hippocampi of taxi-drivers?
A females
B left-handed people
C people above 32 years of age
D people with health problems Your answer
[1]
SPECIMEN
PMT

4
© OCR 2016 H567/01
7 What is meant by the term ‘socially desirable responses’ in psychological research?
A responses which are personal even if they are subjective
B responses which are reliable even if they are invalid
C responses which reflect the participants’ wishes even if they are unacceptable to others
D responses which the participants think they ought to give even if they are not true Your answer
[1]
8 Which is an example of qualitative data?
A the diary entries of six patients suffering from schizophrenia
B the length of time each participant spent reading a list of words
C the modal colour chosen by extroverts
D the percentage of respondents who agreed with capital punishment Your answer
[1]
9 What is the probability of a significant result occurring by chance where the significance level is p≤0.025?
A 2.5% or less
B 25% or less
C at least 97.5%
D less than 2.5% Your answer
[1]
10 Which inferential test should a researcher use to decide whether a correlation is significant?
A Binomial Sign test
B Mann–Whitney U test
C Spearman’s Rho test
D Wilcoxon Signed Ranks test Your answer
[1]
SPECIMEN
PMT

5
© OCR 2016 H567/01 Turn over
11 Which one of the following is a feature of all experiments?
A direct manipulation of the independent variable
B measurement of a dependent variable
C random allocation of participants to conditions
D use of controlled environment Your answer
[1]
12 How was one of the dependent variables measured in Grant et al.’s (1998) study into context-dependent memory?
A the amount of time taken to recall ten key details from a written passage
B the number of details recalled from a commentary played through headphones
C the number of written words recognised from a commentary played through headphones
D the score from multiple-choice questions based on a written passage Your answer
[1]
SPECIMEN
PMT

6
© OCR 2016 H567/01
13 Look at the following scatter diagram:
Which is the best estimate of the correlation coefficient for the above data?
A 0.7
B 0.4
C 0.3
D 0.8 Your answer
[1]
14 What is a weakness of using a mode as a measure of central tendency?
A it can generate a number not in the data set
B it is easily affected by outliers
C it is not suitable for nominal data
D it relies on a score occurring more than once Your answer
[1]
0
1
2
3
4
5
6
7
8
9
0 2 4 6 8 10
Par
kin
g sc
ore
Map reading score
A graph to show the relationship between participants' map reading score and parking score.
SPECIMEN
PMT

7
© OCR 2016 H567/01 Turn over
15 Which is a requirement of a parametric test?
A data is at least ordinal level
B mean scores are significantly different
C sample is drawn from a skewed population
D standard deviations are not significantly different Your answer
[1]
16 In Bandura’s (1961) Bobo doll study, the participants were pre-tested to assess their aggression levels.
What was the main purpose of his procedure?
A to allow for a matched pairs design
B to exclude children who were especially aggressive
C to help to decide on the sex of the role model for each participant
D to measure the change in aggression before and after the experiment Your answer
[1]
17 Which feature of science refers to the importance of being able to refute a psychologist’s claim?
A deduction
B face validity
C falsification
D verification Your answer
[1]
SPECIMEN
PMT
8
© OCR 2016 H567/01
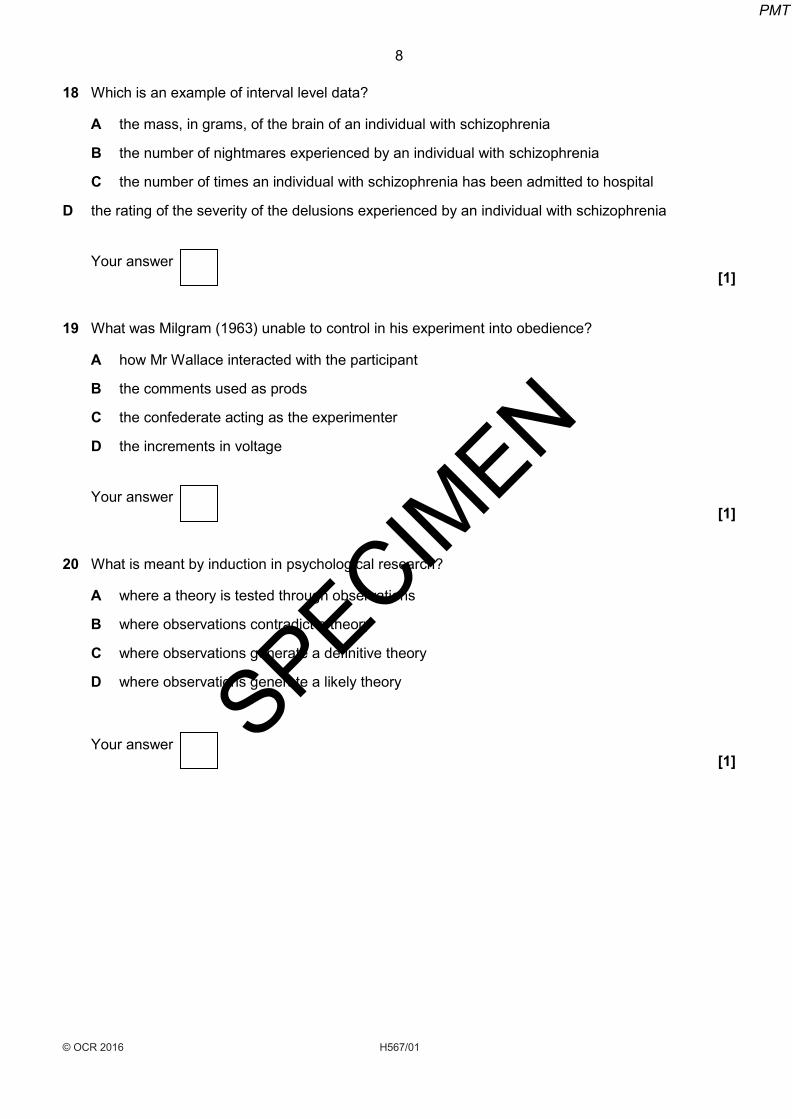
18 Which is an example of interval level data?
A the mass, in grams, of the brain of an individual with schizophrenia
B the number of nightmares experienced by an individual with schizophrenia
C the number of times an individual with schizophrenia has been admitted to hospital
D the rating of the severity of the delusions experienced by an individual with schizophrenia Your answer
[1]
19 What was Milgram (1963) unable to control in his experiment into obedience?
A how Mr Wallace interacted with the participant
B the comments used as prods
C the confederate acting as the experimenter
D the increments in voltage Your answer
[1]
20 What is meant by induction in psychological research?
A where a theory is tested through observations
B where observations contradict a theory
C where observations generate a definitive theory
D where observations generate a likely theory
Your answer
[1]
SPECIM
EN
PMT

9
© OCR 2016 H567/01 Turn over
SECTION B: Research design and response
Answer all the questions in Section B. A psychologist used an observation to investigate the effect of environment on individuals’ need for personal
space. They decided to carry out a covert observation in three settings: a nightclub, a college library and the
changing room in a leisure centre. Members of the public using the facilities made up the sample. The
psychologist observed key behaviours, such as reduced eye contact, defensive body posture and movement
away from people.
21 Outline one strength of using an observation compared to self-report.
…………………………………………………………………………………………………………………... …………………………………………………………………………………………………………………… …………………………………………………………………………………………………………………… ……….………………………………………………………………………………………………………..[2]
22 Identify three ethical issues that would need to be considered when carrying out this observation.
…………………………………………………………………………………………………………………... …………………………………………………………………………………………………………………… …………………………………………………………………………………………………………………... …………………………………………………………………………………………………………………… …………………………………………………………………………………………………………………… ……….………………………………………………………………………………………………………..[3]
23 The psychologist used an opportunity sample for their research.
(a) Explain one strength and one weakness of using an opportunity sample for this study. [6]
…………………………………………………………………………………………………….………….
……….………………………………………………………………………………………….……………
SPECIMEN
PMT

10
© OCR 2016 H567/01
…………………………………………………………………………………………………….…………
……….………………………………………………………………………………………….…………...
…………………………………………………………………………………………………….…………
……….………………………………………………………………………………………….……………
…………………………………………………………………………………………………….………….
……….………………………………………………………………………………………….……………
…………………………………………………………………………………………………….………….
……….………………………………………………………………………………………….……………
…………………………………………………………………………………………………….………….
……….………………………………………………………………………………………….……………
(b) Name and outline one other sampling technique for selecting participants.
………………………………………………………………………………………………….………….
…….………………………………………………………………………………………….……………
………………………………………………………………………………………………….………….
………………………………………….…………………………………………………….………...[2]
(c) Describe one strength and one weakness of the sampling technique you have chosen in question 23(b). [4]
………………………………………………………………………………………………….………….
………………………………………………………………………………………………….………….
………………………………………………………………………………………………….………….
………………………………………………………………………………………………….………….
………………………………………………………………………………………………….………….
………………………………………………………………………………………………….………….
………………………………………………………………………………………………….………….
SPECIMEN
PMT

11
© OCR 2016 H567/01 Turn over
………………………………………………………………………………………………….………….
You have been asked to carry out a further observational study to investigate the differences in use of personal
space between rural and urban environments. This will be part of a quasi experiment using one village and one
city.
24 Write an alternative hypothesis for your investigation.
………………………………………………………………….…………………………………….………….
…….………………………………………………………….…………………………………….……………
………………………………………………………………….…………………………………….………….
……………………………………………………………….……………………………………….………….
……………………………………………………………….……………………………………….………….
………………………………………….…………………….…………………………………….………...[3]
25* Explain how you would carry out an observation to investigate the differences in use of personal space between rural and urban environments. Justify your decisions as part of your explanation.
[15]
You must refer to:
structured or unstructured observations participant or non-participant observations time or event sampling collection of data.
You should use your own experience of carrying out an observation to inform your response.
……………………………………………………………….……………………………………….………….
……………………………………………………………….……………………………………….………….
……………………………………………………………….……………………………………….………….
……………………………………………………………….……………………………………….………….
SPECIMEN
PMT

12
© OCR 2016 H567/01
……………………………………………………………….……………………………………….………….
……………………………………………………………….……………………………………….………….
……………………………………………………………….……………………………………….………….
……………………………………………………………….……………………………………….………….
……………………………………………………………….……………………………………….………….
……………………………………………………………….……………………………………….………….
……………………………………………………………….……………………………………….………….
……………………………………………………………….……………………………………….………….
……………………………………………………………….……………………………………….………….
……………………………………………………………….……………………………………….………….
……………………………………………………………….……………………………………….………….
……………………………………………………………….……………………………………….………….
……………………………………………………………….……………………………………….………….
……………………………………………………………….……………………………………….………….
……………………………………………………………….……………………………………….………….
……………………………………………………………….……………………………………….………….
……………………………………………………………….……………………………………….………….
……………………………………………………………….……………………………………….………….
……………………………………………………………….……………………………………….………….
……………………………………………………………….……………………………………….………….
……………………………………………………………….……………………………………….………….
……………………………………………………………….……………………………………….………….
……………………………………………………………….……………………………………….………….
……………………………………………………………….……………………………………….………….
SPECIMEN
PMT

13
© OCR 2016 H567/01 Turn over
……………………………………………………………….……………………………………….………….
……………………………………………………………….……………………………………….………….
Turn over for the next question
SPECIMEN
PMT

14
© OCR 2016 H567/01
SECTION C: Data analysis and interpretation
Answer all of the questions in Section C.
A psychologist tested the effects of expectations on people’s perceptions by carrying out the following
experiment. The test item was an ambiguous image – an image that had been purposefully drawn to be
perceived in one of two ways – either as a monkey or as a teapot. Participants had to say what they saw after
they had viewed the image for one second.
Before carrying out the experiment, the psychologist had checked that the ambiguous image could be perceived
in one of two ways. His findings, from this check, are presented in the bar chart below:
26 (a) Identify two findings from the bar chart.
………………………………………………………………….……..…………………………….………….
…………………………………………………………………...………………………………….………….
…………………………………………………………………...………………………………….………….
…………………………………………………………………………...………………………….………[2]
0
1
2
3
4
5
6
7
8
9
10
Monkey Teapot Other
Fre
qu
en
cy
Image perceived
A bar chart to show the frequency of the different ways in which the ambiguous image was perceived
SPECIMEN
PMT

15
© OCR 2016 H567/01 Turn over
(b) Explain why a bar chart is appropriate for presenting this data.
[2] ………………………………………………………………….……..…………………………….………….
…………………………………………………………………...………………………………….………….
…………………………………………………………………...………………………………….………….
…………………………………………………………………………...………………………….………….
(c) Calculate the percentage number of times that the image was identified as neither a monkey nor a teapot. Show your workings.
…………………………………………………………………...………………………………….………….
…………………………………………………………………...………………………………….………….
…………………………………………………………………………...………………………….………….
…………………………………………………………………...………………………………….......….[2]
Fifty participants were recruited and then randomly allocated into two groups. In one condition, five drawings of
other animals were presented, one after the other, before the ambiguous image. Participants had to name each
one of these. In the second condition, the set up was the same but five images of kitchen items were used.
27 (a) Name and briefly describe the experimental design used in this study.
…………………………………………………………………...………………………………….………….
…………………………………………………………………...………………………………….………….
…………………………………………………………………………...………………………….………….
…………………………………………………………………...………………………………….......…[2]
(b) Explain how the psychologist would have randomly allocated participants to each group [2]
…………………………………………………………………...………………………………….………….
SPECIMEN
PMT

16
© OCR 2016 H567/01
…………………………………………………………………...………………………………….………….
…………………………………………………………………………...………………………….………….
…………………………………………………………………...…………………………………...........….
(c) Discuss why this experimental design was appropriate for this study.
…………………………………………………………………...………………………………….………….
…………………………………………………………………...………………………………….………….
…………………………………………………………………………...………………………….………….
…………………………………………………………………...………………………………….......…….
…………………………………………………………………...………………………………….………….
…………………………………………………………………...………………………………….………….
…………………………………………………………………………...………………………….………….
…………………………………………………………………...………………………………….......……..
…………………………………………………………………...………………………………….………….
…………………………………………………………………...………………………………….………[5]
28. Identify and simplify the ratio of number of participants who perceived a monkey in the first condition and the number who perceived a monkey in the second condition. (2)
28 (a) Identify and simplify the ratio of the number of participants who perceived a monkey in the first condition and the number who perceived a monkey in the second condition. [2]
…………………………………………………………………...………………………………….………….
The findings from the study are presented below:
A table to show the number of participants who perceived the ambiguous image as a monkey or as a teapot
from both conditions: image presented with animals and image presented with kitchen items
Perceived as monkey Perceived as teapot
Presented with animals 15
10
Presented with kitchen items 5
12
SPECIMEN
PMT

17
© OCR 2016 H567/01 Turn over
…………………………………………………………………...………………………………….………….
…………………………………………………………………………...………………………….………….
…………………………………………………………………...………………………………….......……..
(b) Identify and simplify the ratio of the number of participants who perceived a teapot in the first condition and the number who perceived a teapot in the second condition.
…………………………………………………………………...………………………………….………….
…………………………………………………………………...………………………………….………….
…………………………………………………………………………...………………………….………….
…………………………………………………………………...………………………………….......….[2]
29 The psychologist analysed the data using the Chi Squared test. Give two reasons for this choice of test with reference to the study.
……………………………………………………………….……………………………………….………….
……………………………………………………………….……………………………………….………….
……………………………………………………………….……………………………………….………….
……………………………………………………………….……………………………………….………….
……………………………………………………………….……………………………………….………….
……………………………………………………………….……………………………………….………….
……………………………………………………………….……………………………………….………….
……………………………………………………………….……………………………………….………[4]
SPECIMEN
PMT

18
© OCR 2016 H567/01
30 Explain how the psychologist would determine the appropriate degrees of freedom (df) for this test.
……………………………………………………………….……………………………………….………….
……………………………………………………………….……………………………………….………….
……………………………………………………………….……………………………………….………….
……………………………………………………………….……………………………………….…….…[2]
The Chi Squared gave an observed (calculated) value of 3.80
Levels of significance for a one–tailed test
Significance Level
0.05 0.025 0.01
Critical Value 2.71 3.84 5.41
31 Using the above critical values, explain whether the psychologist has found a significant difference or not.
……………………………………………………………….……………………………………….………….
……………………………………………………………….……………………………………….………….
……………………………………………………………….……………………………………….………….
……………………………………………………………….……………………………………….…………..
……………………………………………………………….……………………………………….………….
……………………………………………………………….……………………………………….………….
……………………………………………………………….……………………………………….………….
……………………………………………………………….……………………………………….………[4]
SPECIMEN
PMT

19
© OCR 2016 H567/01
32 Outline what is meant by each of the following features of science and state how they apply to this experiment into perception.
(a) Cause and effect
………………………………………………………………...………………………………….………….
………………………………………………………………...………………………………….………….
………………………………………………………………………...………………………….………….
………………………………………………………………...………………………………….......……..
………………………………………………………………...………………………………….………….
…………………………………………………………………...……………………………….………[3]
(b) Objectivity
…………………………………….…………………………...………………………………….………….
………………………………….……………………………...………………………………….………….
……………………………….………………………………………...………………………….………….
………………………………..………………………………...…………………………………............…
………………………………………………………………...………………………………….………….
………………………….……………………………………...………………………………….......….[3]
END OF QUESTION PAPER
SPECIMEN
PMT

20
© OCR 2016 H567/01
Copyright Information:
OCR is committed to seeking permission to reproduce all third-party content that it uses in the assessment materials. OCR has attempted to identify and contact all copyright holders whose work is used in this paper. To avoid the issue of disclosure of answer-related information to candidates, all copyright acknowledgements are reproduced in the OCR Copyright Acknowledgements booklet. This is produced for each series of examinations and is freely available to download from our public website (www.ocr.org.uk) after the live examination series.
If OCR has unwittingly failed to correctly acknowledge or clear any third-party content in this assessment material, OCR will be happy to correct its mistake at the earliest possible opportunity.
For queries or further information please contact the Copyright Team, First Floor, 9 Hills Road, Cambridge CB2 1GE.
OCR is part of the Cambridge Assessment Group; Cambridge Assessment is the brand name of University of Cambridge Local Examinations Syndicate (UCLES), which is itself a department of the University of Cambridge.
SPECIMEN
PMT