sample rigid pavement design tables based on … on version 0.8 of the mechanistic empirical...
TRANSCRIPT

Stage 5 Distribution
June 2006Technical Memorandum: UCPRC-TM-2006-04
SSSaaammmpppllleee RRRiiigggiiiddd PPPaaavvveeemmmeeennnttt DDDeeesssiiigggnnn TTTaaabbbllleeesss BBBaaassseeeddd ooonnn VVVeeerrrsssiiiooonnn 000...888 ooofff ttthhheee
MMMeeeccchhhaaannniiissstttiiiccc EEEmmmpppiiirrriiicccaaalll PPPaaavvveeemmmeeennnttt DDDeeesssiiigggnnn GGGuuuiiidddeee
Authors: Venkata Kannekanti and John Harvey
Partnered Pavement Research Program (PPRC) Contract Strategic Plan Element 4.1:
“Development of the first version of a Mechanistic Empirical Pavement Rehabilitation, Reconstruction and New Pavement Design Procedure for
Rigid and Flexible Pavements”
PREPARED FOR: California Department of Transportation Division of Research and Innovation Office of Roadway Research
PREPARED BY:
University of California Pavement Research Center
UC Davis, UC Berkeley

Stage 5 Distribution
UCPRC-TM-2006-04
ii
DOCUMENT RETRIEVAL
PAGE Tech Memo: UCPRC-TM-2006-04
Title: Sample Rigid Pavement Design Tables Based on Version 0.8 of the Mechanistic Empirical Pavement Design Guide
Authors: Venkata Kannekanti & John Harvey
Prepared for: Caltrans
FHWA No.: S/CA/RI-2006/26
Date: June 2006
Strategic Plan No: 4.1
Status: Final
Version No: Stage 5, Caltrans approved
Abstract: This Technical Memorandum describes a design of a sample catalog for rigid pavement as requested by the Caltrans Division of Design in 2005. This task is part of a larger project, begun in 1999, to help Caltrans implement mechanistic empirical (ME) procedures. Before implementing the Mechanistic Empirical Pavement Design Guide (MEPDG) software from the NCHRP 1-37a project, Caltrans has adopted a three-step process for evaluating it including: sensitivity analysis or bench testing, validation using data from accelerated pavement testing, and validation (and possibly recalibration) using field data. Upon Caltrans request, the University of California Pavement Research Center (UCPRC) has done a sensitivity study to check the reasonableness of the model predictions. Limited work was done to evaluate the models using APT data due to the closed architecture of the software. Evaluation using field data is underway. For reasons described in this Memorandum, Caltrans has decided to use simple design tables developed from the software for routine use and to use the actual software will be used only for special projects. Simple design tools based on the software, such as the catalog for jointed plain concrete pavement (JPCP), produce some of the benefits of ME design procedures and serve as a starting point to understand the needs for full scale implementation of ME procedures in the future. In addition to describing development of the design catalog, this Memorandum presents limitations about the catalog and observations about version 0.8 of the MEPDG software. Key variables to be included in the catalog were selected based on results from sensitivity analyses. A factorial produced 2,160 cases that were loaded into a database. For each combination of inputs (climate, traffic volume, load transfer efficiency, base type, subgrade type, spectra), the least thickness resulting in distresses that fall within the failure criteria is designated as the design thickness. Results were then compiled into the design tables that are contained in this Memorandum.
Keywords: NCHRP 1-37a, MEPDG, Rigid Pavement Design
Proposals for implementation: The catalog will be modified by Caltrans and is to be incorporated in the Highway Design Manual
Related documents: UCPRC-DG-2006-01
Signatures:
Venkata Kannekanti 1st Author
Bill Nokes Erwin Kohler Technical Review
D Spinner Editor
J Harvey Principal Investigator
Michael Samadian Caltrans Contract Manager

Stage 5 Distribution
UCPRC-TM-2006-04
iii
DISCLAIMER
The contents of this report reflect the views of the authors who are responsible for the facts and accuracy
of the data presented herein. The contents do not necessarily reflect the official views or policies of the
State of California or the Federal Highway Administration. This report does not constitute a standard,
specification, or regulation.
ACKNOWLEDGEMENTS The authors would like to thank the Caltrans Division of Research and Innovation which sponsored the
work on this project. The authors would also like to thank Bill Farnbach and other members of Division of
Design for their advice and constant feedback in generating the design tables.

Stage 5 Distribution
UCPRC-TM-2006-04
iv

Stage 5 Distribution
UCPRC-TM-2006-04
v
TABLE OF CONTENTS
LIST OF TABLES ..................................................................................................................................... vi LIST OF FIGURES .................................................................................................................................. vii EXECUTIVE SUMMARY........................................................................................................................ ix 1. INTRODUCTION.......................................................................................................................... 1
1.1. Objective.............................................................................................................................. 1 1.2. Background.......................................................................................................................... 1
2. TRANSITION FROM EMPIRICAL DESIGN TO MECHANISTIC EMPIRICAL
DESIGNS ..................................................................................................................................................... 3 2.1. New Challenges................................................................................................................... 3
2.1.1 Design Life and Failure Criteria............................................................................. 3 2.1.2 Defining Climate Regions ....................................................................................... 4
3. CATALOG DEVELOPMENT ..................................................................................................... 9 3.1. The Factorial........................................................................................................................ 9 3.2. Rationale behind the Factorial Selection ............................................................................. 9
3.2.1 Soil Type ................................................................................................................ 10 3.2.2 Base Types............................................................................................................. 10 3.2.3 Unbound Layers Design ........................................................................................ 10 3.2.4 Spectra................................................................................................................... 11 3.2.5 Shoulder Types ...................................................................................................... 11 3.2.6 PCC Thickness ...................................................................................................... 11 3.2.7 Traffic Volume....................................................................................................... 13 3.2.8 Key Assumptions ................................................................................................... 13
3.3. The Catalog........................................................................................................................ 15 4. LIMITATIONS OF THE CATALOG....................................................................................... 17
4.1. Use of Granular Bases at High TIs .................................................................................... 17 4.2. Limitations of the Catalog ................................................................................................. 17 4.3. Observations ...................................................................................................................... 18
5. REFERENCES............................................................................................................................. 19 6. APPENDIX A (INPUTS USED) ................................................................................................. 21 7. APPENDIX B (THE CATALOG) .............................................................................................. 29

Stage 5 Distribution
UCPRC-TM-2006-04
vi
LIST OF TABLES
Table 1(a) Factorial for climate region analysis............................................................................................ 6
Table 1(b) Climate data for the different climate regions ............................................................................. 6
Table 2 Rationale for factorial inputs (a) Soil Type (b) Shoulder type and (c) base and subbase thicknesses
for CH subgrade.................................................................................................................................. 12
Table 3. Examples of Structures with granular bases at a high TI .............................................................. 17
Table A-1 Traffic Inputs.............................................................................................................................. 21
Table A-2 AADT for different TIs.............................................................................................................. 21
Table A-3 Vehicle class distribution for rural and urban areas................................................................... 22
Table A-4 Hourly distribution for rural and urban areas............................................................................. 22
Table A-5 Number of Axle Types per Truck Class (both Urban and Rural) .............................................. 23
Table A-6 Rural Monthly Adjustment Factors............................................................................................ 24
Table A-7 Urban Monthly Adjustment Factors........................................................................................... 24
Table A-8 Climate Inputs ............................................................................................................................ 25
Table A-9 Design Features Used................................................................................................................. 25
Table A-10 Surface property inputs ............................................................................................................ 25
Table A-11 Material property inputs for all the layers................................................................................ 26
Table B-1 Catalog Index ............................................................................................................................. 29

Stage 5 Distribution
UCPRC-TM-2006-04
vii
LIST OF FIGURES
Figure 1 Climate regions in California.......................................................................................................... 5
Figure 2(a) Mean transverse cracking in different climate regions............................................................... 7
Figure 2(b) Mean faulting in different climate regions. ................................................................................ 8
Figure 3 CTE of cores sampled from California LTPP pavements as of 04-26-2005 ................................ 14

Stage 5 Distribution
UCPRC-TM-2006-04
viii

Stage 5 Distribution
UCPRC-TM-2006-04
ix
EXECUTIVE SUMMARY
This Technical Memorandum describes a sample design catalog for rigid pavement as requested by the
Caltrans Division of Design in 2005. This task is part of a larger project, begun in 1999, to help Caltrans
implement mechanistic empirical (ME) procedures. Facilitated by the release of NCHRP 1-37a software,
Mechanistic Empirical Pavement Design Guide (MEPDG), Caltrans decided formally in 2005 to adopt
ME design procedures for designing pavements in the state. Because the MEPDG is nationally calibrated
with very few sections from California, Caltrans has adopted a three-step process for evaluating the
software before implementing it. The three steps in the evaluation process are:
1. Bench testing or sensitivity analysis of the software
2. Validation of the software using Accelerated Pavement Test data
3. Validation and possibly recalibration of the software using field data.
At Caltrans request, the UCPRC has done a sensitivity study to check the reasonableness of the model
predictions. Limited work was done to evaluate the models using APT data due to the closed architecture
of the software. Evaluation using field data is underway. The sensitivity study showed that even though
the model predictions are generally reasonable, there are some anomalies and issues with the software that
need to be addressed before it be used for routine design. Also, the huge amount of input information
required to run the software requires large institutional changes within Caltrans and a vast amount of
personnel training. For these reasons, Caltrans has decided to use simple design tables developed from the
software for routine projects and to use the actual software only for special projects. Simple design tools
based on the software, such as a catalog, produce some of the benefits of ME design procedures and serve
as a starting point to understand the needs for a full-scale implementation of ME procedures in future. For
development of these design tables, Caltrans Division of Design asked for the development of a sample
catalog to determine the variability, accuracy, and reasonableness of the tables. Caltrans did not want to
wait for upgrades to the current version (version 0.8) of the software and for local calibration to be
completed. Caltrans requested UCPRC to generate a sample catalog containing design tables using the
locally uncalibrated 0.8 version of the software for select sites in different climate regions.
This tech memo explains the need for using simple design tools such as a catalog instead of the actual
software, the issues that had to be addressed to transition from current empirical design procedures to
design tables based on ME principles, and the procedure adopted for developing these design tables. Key
variables to be included in the catalog were selected based on results from sensitivity analyses. Various
combinations of different factor levels of these variables were run and the results synthesized into design
tables based on a set of failure criteria.

Stage 5 Distribution
UCPRC-TM-2006-04
x

Stage 5 Distribution
UCPRC-TM-2006-04
1
1. INTRODUCTION
1.1. Objective
The objective of this study is to generate a sample catalog of simple design tables based on Mechanistic
Empirical Pavement Design Guide (MEPDG) software developed as part of the NCHRP 1-37a project for
rigid pavement design in California. In 2005 Caltrans Division of Design asked the University of
California Pavement Research Center (UCPRC) to develop to develop these design tables as part of the
Partnered Pavement Research Program’s Strategic Plan, Item Number 4.1: “Development of the first
version of a Mechanistic Empirical Pavement Rehabilitation, Reconstruction and New Pavement Design
Procedure for Rigid and Flexible Pavements”.
1.2. Background
Caltrans has decided to adopt Mechanistic Empirical (ME) design procedures. A white paper signed by
senior Caltrans management in 2005 formally established the Department’s objective to implement ME
design. At the current time Caltrans is considering the use of the NCHRP 1-37a software for new
concrete pavements. However, since the models in the NCHRP 1-37a software are nationally calibrated
with very few sections from California, Caltrans decided to evaluate the software prior to implementing it
and the Division of Design adopted the following three-stage process:
1. Sensitivity analysis or bench testing of the software
2. Validation using Accelerated Pavement Test (APT) data
3. Validation and, if necessary, recalibration using field data
The first step, sensitivity analysis, was finished by Kannekanti and Harvey (2005, 2006) using the 0.8
version of the software. APT data has been used to verify the reasonableness of deflection calculations
using finite element analysis that were the basis for the stress calculations in the 1-37a software. Neither
this work nor the ongoing work on model validation in the field is discussed in this paper.
Sensitivity analysis of the models showed that the model predictions are generally reasonable. The
cracking model was found to be extremely sensitive to surface absorptivity and coefficient of thermal
expansion (CTE) of the concrete. It was found that the subgrade type and the use of granular subbase did

Stage 5 Distribution
UCPRC-TM-2006-04
2
not substantially affect the rigid pavement distresses. The main conclusion from the sensitivity analysis
was that even though model predictions are reasonable, predictions from the software should be coupled
with local experience, especially while designing the unbound layers.
One of the observations from the sensitivity study was that the models require about 100 inputs to run the
software and most of these inputs are not currently being measured by Caltrans. Details can be found in a
report by Kannekanti and Harvey (2005) and a gap analysis performed by Rambach (2005). To begin
measuring these inputs and eventually considering them in specifications will require resources and
institutional changes within Caltrans and the contracting industry. It can be argued that the default values
could be used where there is no data but most of the current pavement designers (and, for some variables,
even the researchers!) in California are not in a position to judge the reasonableness of many default
values. Inappropriate use of default inputs or blindly using the models could result in major errors and
unreasonable designs (Kannekanti and Harvey, 2005). A couple of example observations of the use of the
0.8 version of the software that results in bad designs are:
1. The software indicates that portland cement concrete (PCC) and cement-treated base (CTB) can be
placed directly over soft clay subgrades.
2. Inappropriate values of coefficient of thermal expansion (CTE) and/or surface absorptivity may be
selected that reduce the initial cost of the design, but cannot be achieved with available materials
(currently Caltrans has no specifications for CTE and surface absorptivity).
These conclusions were further corroborated by workshops conducted internally by Caltrans in early
2005. The workshops indicated that the I-37a software is too complicated for routine use and requires
substantial training, large resource commitments, and institutional changes for Caltrans to adopt it as a
desktop tool for routine design. The fact that about 80 percent of the projects built by Caltrans cost less
than $5 million raised questions about the economical feasibility of using NCHRP 1-37a software for all
projects. The Department’s current plan is that 1-37a will be used by a core group of about twenty to
thirty pavement designers trained at a high level and dedicated to design or to review designs, for
expensive large scale projects. All routine and small-scale projects would still use ME but in the form of
simple design tools that can be easily used. Caltrans Division of Design decided that the simple design
tool for jointed plain concrete pavement (JPCP) designs would be a catalog with design tables generated
by running the ME design software. Use of the catalog will introduce the concepts of ME and the
variables required for ME.

Stage 5 Distribution
UCPRC-TM-2006-04
3
2. TRANSITION FROM EMPIRICAL DESIGN TO MECHANISTIC
EMPIRICAL DESIGNS
Once the sensitivity analysis was completed and the findings were found to be reasonable, in 2005
Caltrans Division of Design decided to try using the 0.8 version software to create a sample catalog to test
the procedures and reasonableness of the approach. The catalog was developed by running a factorial
using the 1-37a software and synthesizing the results into simple design tables. In order to make the
transition as smooth and simple as possible, the format of the design tables in the catalog was kept similar
to the existing tables. A key advantage of using a catalog is that it provides the power of the models
without the designers actually having to run the 1-37a software. Other major advantages of the sample
tables developed from ME analysis are: consideration of climate region and shoulder types, explicit
consideration of CTE, consideration of reliability, and the ability to set design life based on failure criteria
tied to explicit levels of distress (transverse cracking and faulting).
2.1. New Challenges
Owing to the empirical nature of the past and existing design procedures, some issues had to be addressed
for the first time in developing a catalog based on 1-37a runs.
2.1.1 Design Life and Failure Criteria
Structures from the existing design tables were originally designed for twenty years only without a clear
definition of failure. Many of these pavements have provided service lives greater than twenty years.
Because of the power of ME concepts Caltrans Division of Design decided to develop the catalog for
pavement service life longer than twenty years. The structures will be designed based on a forty-year
design life. The use of ME also brought a need to define failure criteria. Previously, distress criteria were
defined only for assessing pavement condition and for triggering maintenance activities. The failure
criteria set by Caltrans for developing the catalog are:
1. Transverse Cracking: 10 percent slabs cracked
2. Faulting: 0.1 in
3. IRI: 160 in/mi

Stage 5 Distribution
UCPRC-TM-2006-04
4
All the failure criteria include a reliability level of 90 percent. Criteria for spalling were not set due to
doubts about the spalling model in the 1-37a software. At the end of design life the pavements should
require only minor repair such as diamond grinding and 1 percent slab replacement.
2.1.2 Defining Climate Regions
California was classified into nine distinct climate regions (as shown in Figure 1) based on the
temperature and precipitation data. A small sensitivity study showed some of the nine different climate
regions could be grouped together. The factorial used for this is described in Table 1(a). The factorial
resulted in 1,758 cases. For the exercise, weather stations were selected from different climate regions.
The weather stations used for each of the climate regions are shown in Table 1(b). Finding weather
stations with good data in some of these climate regions was very laborious and none in the 1-37a
software’s climate database had more than five years’ data. Some of the major weather stations in
California had little or no data included in the software’s climate database. For this reason, the weather
stations may not necessarily represent the typical conditions in the overall climate region, and the results
are to be viewed in this light. Two plots showing the mean faulting and cracking for all the climate zones
are shown in Figures 2(a) and 2(b).
In the factorial, San Francisco, Dagget, and Santa Rosa were used as representative weather stations for
Coastal (including North, Central, and South Coast), Desert and Low/South Mountain climate regions,
respectively. No sample design tables were developed for the High Mountain and High Desert climate
regions because very few concrete pavements are built in these locations. It is hoped that future versions
of the software will enable use of climate data from other databases that have much more comprehensive
data — such as the CDIM climate database software developed for Caltrans from initial FHWA work
(PaveSys, 2004).

Stage 5 Distribution
UCPRC-TM-2006-04
5
Figure 1. Climate regions in California.

Stage 5 Distribution
UCPRC-TM-2006-04
6
Table 1(a). Factorial for Climate Region Analysis Variable Factor Levels Factors
Spectra 2 Urban, Rural
PCC Thickness 2 8”, 12”
Load Transfer Efficiency 2 Dowels, No Dowels
Shoulder Type 3 Asphalt, Tied and Widened Truck Lane
Joint Spacing 2 15’ and 19’
Surface Absorptivity 2 0.65 and 0.95
Coefficient of Thermal Expansion 2 4x10e-6 /F and 7x10e-6 /F
Climate Regions 9 See table 1(b)
Traffic 1 Traffic Index of 16 (126 million ESALs)
Base Type 1 Cement-treated Base
Subgrade 1 Poorly graded sand (SP)
Table 1(b). Climate Data for the Different Climate Regions
Sta.
No.
Climate
Zone
Weather Station
City
Months of
Data
Available
Lowest Air
Temp. (C)
Highest air
Temp. (C)
1 Central
Coast San Francisco 63 0.1 35.2
2 Inland
Valley Sacramento 44 -3.3 41.4
3 Desert Dagget 17 -6.4 44.7
4 High Desert Alturas 43 -23.8 37.7
5 High
Mountain Blue Canyon 66 -9.7 31.7
6 Low
Mountain Santa Rosa 43 -3.8 38.7
7 North Coast Crescent City 16 -1.8 29.6
8 South Coast Long Beach 64 1 39.5
9 South
Mountain Sandberg 66 -6.9 35.7

Stage 5 Distribution
UCPRC-TM-2006-04
7
3035
4045
5055
60
Mea
n of
% s
labs
Cra
cked
Factors
Central_Coast(SFO)
Desert
High_Desert(Alturas) Low_Mtn(Santa_Rosa)
Mountain(Blue_Canyon)
North_Coast(Crescent_City)
South_Coast(Long_Beach)
South_Mtn(Sandberg)
Valley(Sacramento)
Climate
Transverse Cracking in Different Climate Zones
All Cases
Figure 2(a). Mean transverse cracking in different climate regions.

Stage 5 Distribution
UCPRC-TM-2006-04
8
0.10
0.12
0.14
Mea
n of
Fau
lt(in
)
Factors
Central_Coast(SFO)
Desert
High_Desert(Alturas)
Low_Mtn(Santa_Rosa)
Mountain(Blue_Canyon)
North_Coast(Crescent_City)
South_Coast(Long_Beach)
South_Mtn(Sandberg)
Valley(Sacramento)
Climate
Faulting in Different Climate Zones
Figure 2(b). Mean faulting in different climate regions.

Stage 5 Distribution
UCPRC-TM-2006-04
9
3. CATALOG DEVELOPMENT
3.1. The Factorial
The factorial was based on the sensitivity analysis results. The factors and the factor levels used were:
1. Climate: Central Coast, Desert, Low Mountain
2. Traffic Index (TI): 9, 11, 13, and 17 ( 1, 6, 20, and 210 million ESALs, respectively)
3. Spectra: Urban and Rural
4. PCC thickness: ∗
7, 8, 9 inches for TI of 9
8, 9, 10, 12 inches for TI of 11
9, 10, 12, 14 inches for TI of 13 and 17
5. Base Type : Cement-treated base (CTB), asphalt concrete base (ACB) and granular base (for TI less
than 11)
6. Subgrade: CH and SP
7. Load Transfer: Dowels, No Dowels
8. Shoulder Type: Asphalt, Wide, Tied shoulders
9. Granular subbase: Yes for CH subgrade, No for SP subgrade
3.2. Rationale behind the Factorial Selection
This section explains the rationale used in determining the factors and the factor levels used for the
generation of the catalog.
∗ Due to a traffic miscalculation AADTTs used for running the software did not match the TI values mentioned here. The difference is very marginal and is accounted for in the analysis (traffic interpolations).

Stage 5 Distribution
UCPRC-TM-2006-04
10
3.2.1 Soil Type
According to the existing design process, soil type is a key variable and is classified based on its
California R-value (determined by test method CTM 301), as follows:
a. Soils with R-value between 10 and 40, and
b. Soils with R-value greater than 40.
In California, soils with R-value less than 10 must be treated to achieve an R-value of 10 before placing
concrete pavement. The 1-37a software requires the soil to be classified by either the AASHTO or
Unified Soil Classification (USC) system. A small sensitivity study was done to identify the soil
classifications that should be used for running the factorial. The results from this sensitivity study
matched the results from previous studies by Kannekanti and Harvey (2005) that subgrade type did not
have much effect on the distresses, as shown in Table 2(a). However, CH (High Plasticity Clay) subgrade
was chosen to represent all soils that have R-values between 10 and 40. SP (Poorly graded sand) subgrade
was chosen to represent all soils with R-value greater than 40. Subgrade type was primarily used to
determine granular layer requirements.
3.2.2 Base Types
Since 1983 Caltrans has used lean concrete base (LCB), with limited use of asphalt concrete (hot mixed
asphalt) base (ACB). However, because the software did not have the option of lean concrete base,
cement-treated base (CTB) was used instead. Though the existing design tables do not provide designs for
granular bases this option was explored for lower traffic volumes. It was expected that there would not
have been enough calibration data for PCC slabs over granular bases at high traffic volumes, so this
option was used for only lower traffic volumes ( 11≤TI ). This expectation proved to be correct as some
cases run at higher traffic volumes showed granular bases to be better than— or at least as good as —
stabilized bases for typical Caltrans pavements, which did not seem reasonable. This will be discussed
later in this memo.
3.2.3 Unbound Layers Design
According to the 1-37a software results granular subbase under stabilized bases did not have any affect on
the distresses (Kannekanti and Harvey, 2005). Also, the thickness of the base layers did not have a big
effect on the model predictions. These predictions did not seem reasonable, so the current Caltrans
practice of base and subbase layer design was retained for the catalog. The current Caltrans tables call for
the use of granular subbase only for subgrades with R-values between 10 and 40. Table 2(c) shows the

Stage 5 Distribution
UCPRC-TM-2006-04
11
thickness of the base and subbase for CH subgrades. SP subgrades use the same values but without
subbase. Subbase is not required when granular base is used.
3.2.4 Spectra
California has more than 100 Weigh-in-Motion (WIM) stations distributed throughout the state. These
enable Caltrans to have a very comprehensive traffic database (Lu and Harvey, 2006). Two extreme axle
load distributions found in the database were used for catalog runs and designated as “rural” and “urban”
(Kannekanti and Harvey, 2005).
3.2.5 Shoulder Types
The thicknesses are designed for the weaker of the two longitudinal joints [see Table 2(b)]. Even when a
widened lane is used the pavement structures have to be designed as either tied or untied shoulder because
the inner longitudinal joint is weaker. Lane delineation is often moved for traffic reasons, particularly in
urban areas. The widened truck lane was not used in the catalog calculations, but it can be used for the
outside shoulder.
3.2.6 PCC Thickness
To reduce software run time, the PCC thicknesses evaluated were chosen based on the traffic volume.
Very thick slabs were not chosen for lower traffic volume and vice versa. The maximum slab thickness
analyzed was 14 inches.

Stage 5 Distribution
UCPRC-TM-2006-04
12
Table 2. Rationale for Factorial Inputs (a) Soil Type (b) Shoulder Type and (c) Base and Subbase Thicknesses for CH Subgrade
(a)
No Dowels Dowels Subgrade
Type Faulting
(in)
Cracking
(%)
IRI
(in/mile)
Faulting
(in)
Cracking
(%)
IRI
(in/mile)
GW 0.519 97.6 416.1 0.022 97.6 155.7
SP 0.478 96.7 394.1 0.022 96.7 155.5
CL 0.402 92.6 350.9 0.055 92.6 169.2
CH 0.372 89 332.3 0.061 89 169.7
(b)
Inside Longitudinal
Joint
Outside Longitudinal
Joint
Critical Shoulder Type to be Used for
Selection
Untied Untied
Tied Untied Untied
Wide Truck Lane Untied
Untied Untied
Tied Tied Tied
Wide Truck Lane Tied
(c)
CTB ACB GB TI
Base (in) Subbase (in) Base (in) Subbase (in) Base (in)
<9 4.2 6 4.2 6 12
9.5 to 10 4.2 6 4.2 6 12
10.5 to 11 4.8 7.2 4.8 7.2 12
11.5 to 12 4.8 7.2 4.8 7.2 12
12.5 to 13 6 8.4 6 8.4 12
13.5 to 14 6 8.4 6 8.4 12
14.5 to 15 6 8.4 6 8.4 12
15.5 to 16 6 8.4 6 8.4 12
16.5 to 17 6 8.4 6 8.4 12

Stage 5 Distribution
UCPRC-TM-2006-04
13
3.2.7 Traffic Volume
Traffic Index (TI) related to ESALs as follows:
( ) 119.0
6100.9 ESALTI ×=
Even though TI is not a direct input to the 1-37a software, it is still used in the catalog to provide
continuity with current practice and because axle load spectra, even considering the two extreme cases
used for the catalog calculations, did not show a substantial effect for a given TI. Axle load spectra, TI,
and other site-specific traffic data in the Caltrans WIM data base were used to calculate Average Annual
Daily Truck Traffic (AADTT), which is a direct input to the software.
3.2.8 Key Assumptions
All the inputs used for running the factorial are shown in Appendix A. Key assumptions were made for
the catalog, some of which have a significant effect on the thicknesses, follow:
1. 90 percent reliability level.
2. Forty-year design life.
3. Default value of 0.85 for surface absorptivity; chosen because the models were calibrated with this
value.
4. Coefficient of thermal expansion of concrete was chosen to be slightly conservative ( Fo/100.6 6−× )
based on test results of a limited number of existing pavements. The results from CTE testing by the
Federal Highway Administration Turner-Fairbank Highway Research Center (FHWA-TFHRC) of
seventy-seven cores as part of the Long Term Pavement Performance (LTPP) program is shown in
Figure 3. The box plots shows that about 75 percent of California’s aggregate would be at or below
Fo/100.6 6−× and the median value is slightly less than Fo/105.5 6−× . More extensive testing is
currently being done as part of the field calibration.
5. Concrete 28-day flexural strength of 626 psi.

Stage 5 Distribution
UCPRC-TM-2006-04
14
6. Dowel diameter was chosen to be 1.25 inches for PCC slabs less than 8.5 inches and 1.5 inches for
slabs greater than 8.5 inches.
7. Erodibility Index for base is assumed as one for CTB, two for ACB, and three for granular base.
8. Joint spacing was fixed at a value of 13.5 feet. The current Caltrans specification requires joints to be
placed at successive repeated intervals of 12, 15, 13, and 14 feet. The option of random joint spacing
was not functional in the software, so an average joint spacing of 13.5 feet was used for the catalog
runs.
9. It is assumed that the base and surface layers are unbonded, which is standard Caltrans practice.
10. Default values were used for the material properties of stabilized bases and unbound layers.
3
4
5
6
7
8
CTE
(x10
^-6
/F)
Figure 3. CTE of cores sampled from California LTPP pavements as of 04-26-2005.

Stage 5 Distribution
UCPRC-TM-2006-04
15
3.3. The Catalog
The factorial mentioned in the previous section resulted in 2,160 cases that were loaded into a database.
For each combination of inputs (climate, traffic volume, load transfer efficiency, base type, subgrade
type, spectra), the least thickness resulting in distresses that are within the failure criteria (10 percent
cracking, 0.1 in faulting, or roughness of 160 in/mi) is designated as design thickness. In many cases the
design thickness had to be interpolated from thicknesses that had distresses on either side of the failure
criteria. When cracking was the critical distress, exponential interpolation of the thicknesses yielded good
results. When faulting was the critical distress, linear interpolation gave satisfactory results. For
roughness, exponential interpolation was preferred. Design thickness was linearly interpolated for TIs
between 9 and 17 that were not considered in the factorial. Pavement structures resulting from all the
combinations of inputs were compiled in design tables. All the design tables in the catalog are shown in
Appendix B.

Stage 5 Distribution
UCPRC-TM-2006-04
16

Stage 5 Distribution
UCPRC-TM-2006-04
17
4. LIMITATIONS OF THE CATALOG
4.1. Use of Granular Bases at High TIs
Cases were run to check if selecting granular bases instead of stabilized bases could be provided as an
option in the catalog. Cases were run for a traffic index of 17, urban spectra for Coastal areas, and rural
spectra in Desert climate regions. The cases were run for both tied and untied shoulders and for CH
subgrade. The results showed that in some cases, especially in Desert climate, structures with granular
bases are thinner than structures with cement-treated bases. A couple of examples are shown in Table 3.
Results from rest of the cases are included in the catalog shown in Appendix B. The results suggest that
the models were not calibrated with granular base sections at high traffic volumes.
Table 3. Examples of Structures with Granular Bases at a High TI Key Inputs PCC Thickness
when AC Base is
Used (in)
PCC Thickness
when CTB is
Used (in)
PCC thickness
when Granular Base
is Used (in)
TI:17, Desert Climate, Rural Spectra,
Dowels, Tied Shoulders
13.31 12.98 12.81
TI:17, Desert Climate, Rural Spectra,
Dowels, Untied Shoulders
13.58 13.3 13.27
4.2. Limitations of the Catalog
Following are some of the issues that were known or discovered during the development of the catalog.
1. The catalog was developed using models that are not yet locally calibrated with California field data.
2. The catalog was generated with limited climate data available at the time of the study.
3. Few structures in the catalog failed by the IRI criterion, suggesting that IRI is being underpredicted.
This will be checked during field validation.
4. The catalog does not provide the option of granular base at higher TI values. When granular bases are
used at higher TI values, they proved to be better alternatives than stabilized base. This did not seem
reasonable and suggests that the models may not be well calibrated at higher traffic volumes,
especially for granular bases.

Stage 5 Distribution
UCPRC-TM-2006-04
18
5. There was very little difference in results for rural versus urban load spectra.
6. Thick slabs without dowels had double the predicted faulting of the corresponding doweled
pavement, but still relatively low faulting levels. It is uncertain whether 12- to 14-inch thick
undoweled slabs were included in the calibration of the models. Personal communication with one of
the developers of the models revealed that very little data from California’s undoweled pavements
had gone into the calibration database.
7. Some software problems were found in version 0.8 used for the development of the catalog. For
example, this version of the software predicts thinner sections that supposedly perform better than
thicker sections and asphalt shoulders that perform better than tied shoulders and a widened truck
lane. Operationally, when a file is saved with a different name, the climate data is internally saved as
zero in some cases. In order to prevent such errors from affecting the catalog, the results and the
intermediate climate files for all the cases were checked manually for the abovementioned problems.
More details about these problems can be found in a report by Kannekanti and Harvey (2005).
4.3. Observations
1. Though MEPDG is a powerful tool, it is not economical to use it for all projects. Implementing the
1-37a software requires a large amount of personnel training and institutional changes.
2. One approach to tackle potential barriers to implementation of ME is to generate a catalog using the
1-37a software. This can produce some of the benefits of ME design procedures and serve as a
starting point to understand the needs for full-scale implementation of ME procedures in future.
3. The catalog has many advantages over the existing design tables. It takes into account climatic
effects, shoulder types, base types, and subgrade types on pavement performance. It is considered to
be a first step to ME implementation.

Stage 5 Distribution
UCPRC-TM-2006-04
19
5. REFERENCES
Kannekanti, V. and Harvey, J.T (2005). “Sensitivity Analysis of 2002 Design Guide Rigid Pavement Distress Prediction Models” Draft Report prepared for California Department of Transportation. Pavement Research Center, University of California Davis, Pavement Research Center, June 2005
Kannekanti, V. and Harvey, J.T (2006). “Sensitivity Analysis of 2002 Design Guide Jointed Plain Concrete Pavement Distress Prediction Models.” To be published in 2006 Transportation Research Records. Transportation Research Board 85th annual meeting, Washington D.C.
Lu, Q. and Harvey, J.T (2006). “Characterization of Truck Traffic in California for Mechanistic Empirical Design” To be published in 2006 Transportation Research Records. Transportation Research Board 85th annual meeting, Washington D.C.
Pavesys (2004). “Climate Database for Integrated Climatic Model.” Visual basic application developed for California Department of Transportation. Pavement Systems LLC, Maryland.
Rambach, A. (2005). “Rigid ME Gap Analysis”. Internal California Department of Transportation document.

Stage 5 Distribution
UCPRC-TM-2006-04
20

Stage 5 Distribution
UCPRC-TM-2006-04
21
6. APPENDIX A (INPUTS USED)
Table A-1 Traffic Inputs Traffic Value SourceNumber of lanes in design direction 2 % trucks in design direction 50 % trucks in design lane 100 Operational speed 57.6 WIM Number of lanes in design direction 2 Mean wheel location(in) 18 default Traffic wander standard deviation(in) 10 default Design lane width (ft) 12 default Average axle width (ft) 8.5 default Dual tire spacing(in) 12 default Singe Tire 120 default Dual tire 120 default Tandem axle 51.6 default Tridem axle 49.2 default Quad axle 49.2 default Short (ft) 12 default Medium (ft) 15 default Long (ft) 18 default Short (%) 49.4 WIM Medium (%) 24.3 WIM Long (%) 26.3 WIM
Table A-2 AADT for Different TIs∗
TI Rural Spectra
Urban Spectra
9 66 117 11 357 629 13 1454 2561 17 13860 24402
∗ ∗ Due to a traffic miscalculation AADTTs used for running the software did not match the TI values mentioned here. The difference is very marginal and is accounted for in the analysis (traffic interpolations).

Stage 5 Distribution
UCPRC-TM-2006-04
22
Table A-3 Vehicle Class Distribution for Rural and Urban Areas
Vehicle Class
Rural Vehicle Class Distribution
Urban Vehicle Class Distribution
Type 4 (%) 0.6 1 Type 5 (%) 11.9 39 Type 6 (%) 2.8 7.4 Type 7 (%) 0.1 1.1 Type 8 (%) 4.2 8 Type 9 (%) 62.3 18.9 Type 10 (%) 2.2 0.1 Type 11 (%) 8.4 13.9 Type 12 (%) 5.8 0.7 Type 13 (%) 1.7 0.2
Table A-4 Hourly Distribution for Rural and Urban Areas
Hour
Rural Hourly Distribution
Urban Hourly Distribution
MIDNIGHT 2.8 1.56 1 2.2 1.19 2 1.9 1.13 3 1.8 1.11 4 1.9 1.54 5 2.0 2.54 6 2.4 3.66 7 3.0 5.51 8 3.9 5.95 9 4.7 6.74 10 5.4 6.54 11 5.7 6.54 12 5.9 6.80 13(NOON) 6.0 6.73 14 6.0 6.66 15 6.1 6.45 16 6.0 6.22 17 5.8 5.60 18 5.5 4.93 19 5.2 3.73 20 4.6 2.89 21 4.3 2.30 22 3.7 1.97 23 3.3 1.72

Stage 5 Distribution
UCPRC-TM-2006-04
23
Table A-5 Number of Axle Types per Truck Class (both Urban and Rural) TruckType Single Tandem Tridem 4 1.342 0.649 0 5 2 0 0 6 1 1 0 7 1.893 0.893 0.107 8 2.583 0.494 0 9 1 2 0 10 1 1 1 11 5 0 0 12 4 1 0 13 2.6 2.4 0.2
Axle Load Spectra for both rural and urban areas are not reported here because it is not practical to
show them in a Microsoft Word document.

Stage 5 Distribution
UCPRC-TM-2006-04
24
Table A-6 Rural Monthly Adjustment Factors
MONTH CLASS 4
CLASS 5
CLASS 6
CLASS 7
CLASS 8
CLASS 9
CLASS 10
CLASS 11
CLASS 12
CLASS 13
JANUARY 0.85 0.74 0.68 0.26 0.76 0.9 0.89 0.76 0.91 0.73 FEBRUARY 0.81 0.74 0.67 0.37 0.73 0.95 0.96 0.82 0.99 0.42 MARCH 0.93 0.91 0.7 0.76 0.96 0.98 1.07 0.86 0.97 2.47 APRIL 1.08 1.04 0.95 0.82 0.99 1.03 1.06 0.92 0.94 0.41 MAY 1.17 0.94 1.02 1.19 0.97 1.02 1.02 0.91 0.94 1.03 JUNE 1.04 1.06 1.16 1.09 1.18 1 0.92 1.04 1.07 1.36 JULY 1.16 1.37 1.29 1.33 1.3 1.02 1.03 1.11 0.96 0.69 AUGUST 0.98 1.17 1.17 1.35 1.44 0.99 1.07 1.16 1.07 1.43 SEPTEMBER 1.01 1.08 1.23 1.23 1.17 0.97 0.93 1.16 1.06 1.56 OCTOBER 1.06 1.18 1.26 1.72 0.94 1.02 0.97 1.32 0.98 0.44 NOVEMBER 1.01 0.94 0.9 0.43 0.82 1.05 1.01 0.97 1.02 1.01 DECEMBER 0.9 0.82 0.97 1.44 0.74 1.06 1.04 0.96 1.08 0.47
Table A-7 Urban Monthly Adjustment Factors
MONTH CLASS 4
CLASS 5
CLASS 6
CLASS 7
CLASS 8
CLASS 9
CLASS 10
CLASS 11
CLASS 12
CLASS 13
JANUARY 1.16 0.91 0.89 0.6 0.95 0.96 0.99 0.45 0.58 0.86 FEBRUARY 1.19 0.93 0.94 0.96 1.1 0.98 1 0.77 1.09 0.86 MARCH 1.32 1.1 1.18 1.46 1.36 1.13 1.35 1.8 1.92 1.15 APRIL 0.95 1.16 1.15 1.18 1.19 1.07 1.16 2.18 2.37 0.99 MAY 1.02 1.1 1.03 0.98 1.13 1.1 1.23 1.8 1.85 1.02 JUNE 0.99 1.16 1.05 1.36 1.04 1.02 0.96 1.47 1.05 1.38 JULY 0.86 1.04 1.07 1.07 0.9 0.99 0.85 0.76 0.53 0.89 AUGUST 0.82 1.01 1.1 1.32 0.89 0.98 0.84 0.6 0.5 0.88 SEPTEMBER 0.89 0.89 0.83 0.76 0.9 0.9 0.71 0.47 0.42 1.11 OCTOBER 1.03 0.93 0.94 0.64 0.85 0.89 0.84 0.56 0.47 0.81 NOVEMBER 0.86 0.89 0.94 1.06 0.9 0.99 1.03 0.64 0.55 1.31 DECEMBER 0.92 0.88 0.88 0.6 0.8 0.99 1.05 0.5 0.66 0.72

Stage 5 Distribution
UCPRC-TM-2006-04
25
Table A-8 Climate Inputs Climate Data Inputs Value Source Annual average depth of water table (ft) 30
Default value
Climate data file SFO for coastal CT decision Santa Rosa for mountain CT decision Dagget for valley CT decision
Table A-9 Design Features Used
Design Features Inputs Value Source Permanent curl/ warp effective temperature difference (F) -10 Default Joint spacing (ft) 13.5 CT decision Sealent type Silicone assumed CT practice
Dowel diameter (in)
1.25" for slabs < 8.5" and 1.5” for slabs > 8.5” CT decision
Dowel spacing (in) 12 Default Tied PCC shoulder LTE (%) 40 Default Widened slab width (ft) 14 Default PCC - Base interface Unbonded CT practice
Erodibility Index
1 for LCB 2 for ACB 3 for granular base Software recommendation
Table A-10 Surface Property Inputs
Drianage Properties Value SourceSurface shortwave absorptivity 0.85 default
Infiltration Minor (10%) default
Drainage path length (ft) 12 default Pavement cross slope (%) 2 default

Stage 5 Distribution
UCPRC-TM-2006-04
26
Table A-11 Material Property Inputs for All the Layers Material Properties Value Source Level∗ PCC General properties Unit weight (pcf) 150 default Poisson's ratio 0.2 default PCC thermal properties Coefficient of thermal expansion ( /F x 10 -6) 6 Decision by CT Thermal conductivity 1.25 default Heat Capacity 0.28 default PCC mix properties Cement type Type II from UCB mix Cementitious material content (lb/yd^3) 657 from UCB mix Water/cement ratio 0.42 from UCB mix PCC zero stress temperature (F) 101 default Ultimate shrinkage at 40% RH (micro strain) 537 default Reversible shrinkage (% of ultimate shrinkage) 50 default Time to develop 50% of ultimate shrinkage (days) 35 default curing method Curing compound CT practice PCC strength properties 28 day PCC modulus of rupture (psi) 626 from UCB mix Level 3 Cement stabilized material properties Unit weight (pcf) 150 default Poisson's ratio 0.2 default Elastic / Resilient modulus (psi) 2000000 default Thermal conductivity (BTU/hr-ft-F) 1.25 default Heat capacity (BTU/lb-F) 0.28 default Asphalt concrete Base properties Asphalt Mix Properties Cumulative % retained 3/4 inch sieve 0 from UCB mix Level 2 Cumulative % retained 3/8 inch sieve 32 from UCB mix Level 2 Cumulative % retained # 4 sieve 52 from UCB mix Level 2 % Passing #200 sieve 5.5 from UCB mix Level 2
Asphalt Binder Property
Conventional Viscosity grade of AC 10 Level 3
General Asphalt Properties Reference Temperature (F) 70 default Level 1 Poisson's Ratio 0.35 default Level 1 Thermal conductivity asphalt (BTU/hr- 0.67 default Level 1
∗ Level is reported for only those inputs that had the option of entering inputs at different levels. Level 3 is the simplest level with little or no testing required; level 2 and level 1 require more comprehensive inputs.

Stage 5 Distribution
UCPRC-TM-2006-04
27
ft-F) Heat capacity asphalt (BTU /lb-F) 0.23 default Level 1 Effective Binder Content 11.662 from UCB mix Level 1 Air Void (%) 8 from UCB mix Level 1 Total unit weight (pcf) 148 from UCB mix Level 1 Granular Base Properties Soil Classification A-1-a Poisson's ratio 0.35 default Coefficient of lateral pressure, Ko 0.5 default Resilient Modulus (psi) 40000 default Level 3 ICM properties (granular base) Plasticity Index 1 default Passing # 200 sieve (%) 3 default Passing # 4 sieve (%) 20 default D60 (mm) 8 default Compacted unbound material Yes Granular Subbase when used with stabilized bases Soil Classification A-1-a Poisson's ratio 0.35 default Coefficient of lateral pressure, Ko 0.5 default Resilient Modulus (psi) 40000 default Level 3 ICM properties (granular subbase) Plasticity Index 1 default Passing # 200 sieve (%) 3 default Passing # 4 sieve (%) 20 default D60 (mm) 8 default Compacted unbound material Yes SP subgrade Poisson's ratio 0.35 default Coefficient of lateral pressure, Ko 0.5 default Resilient Modulus (psi) 28000 default Level 3 ICM properties (SP subgrade) Plasticity Index 0 default Passing # 200 sieve (%) 10 default Passing # 4 sieve (%) 80 default D60 (mm) 1 default Compacted unbound material Yes CH subgrade Poisson's ratio 0.35 default Coefficient of lateral pressure, Ko 0.5 default Resilient Modulus (psi) 5000 UCB judgment Level 3 ICM properties (CH subgrade) Plasticity Index 35 default Passing # 200 sieve (%) 75 default Passing # 4 sieve (%) 95 default D60 (mm) 0.01 default Compacted unbound material Yes

Stage 5 Distribution
UCPRC-TM-2006-04
28

Stage 5 Distribution
UCPRC-TM-2006-04
29
7. APPENDIX B (THE CATALOG)∗
Table B-1 Catalog Index
∗ Thicknesses appear as inches in this Appendix.
Climate Subgrade Spectra Shoulder Type Page Number San Francisco CH Rural Untied 30 Tied 31 Urban Untied 32 Tied 33 SP Rural Untied 34 Tied 35 Urban Untied 36 Tied 37 Dagget CH Rural Untied 38 Tied 39 Urban Untied 40 Tied 41 SP Rural Untied 42 Tied 43 Urban Untied 44 Tied 45 Santa Rosa CH Rural Untied 46 Tied 47 Urban Untied 48 Tied 49 SP Rural Untied 50 Tied 51 Urban Untied 52 Tied 53

Stage 5 Distribution
UCPRC-TM-2006-04
30
Weather Station: San Francisco Climate Region: Central Coast Subgrade: CH (10 < R < 40)Spectra: Rural Shoulder: Untied
No Dowels with base type Dowels with base type TI Structure CTB ACB GB CTB ACB GB
PCC 7.22 7.35 7.75 7.21 7.21 7.21 Base 5.00 5.00 12.00 5.00 5.00 12.00
9 Gran Subbase 6.00 6.00 0.00 6.00 6.00 0.00
PCC 7.76 8.21 9.61 7.74 7.74 7.74 Base 5.00 5.00 12.00 5.00 5.00 12.00
10 Gran Subbase 6.00 6.00 0.00 6.00 6.00 0.00
PCC 8.68 9.27 11.47 8.26 8.26 8.26 Base 5.00 5.00 8.00 5.00 5.00 8.00
11 Gran Subbase 7.20 7.20 7.20 7.20 7.20 7.20
PCC 9.97 10.54 -- 8.79 8.79 -- Base 6.00 6.00 -- 6.00 6.00 --
12 Gran Subbase 7.20 7.20 -- 7.20 7.20 --
PCC 11.01 11.49 -- 9.17 9.32 -- Base 6.00 6.00 -- 6.00 6.00 --
13 Gran Subbase 8.50 8.50 -- 8.50 8.50 --
PCC 11.89 12.23 -- 9.44 9.85 -- Base 6.00 6.00 -- 6.00 6.00 --
14 Gran Subbase 8.50 8.50 -- 8.50 8.50 --
PCC 12.77 12.97 -- 9.72 10.37 -- Base 6.00 6.00 -- 6.00 6.00 --
15 Gran Subbase 8.50 8.50 -- 8.50 8.50 --
PCC 13.69 13.70 -- 10.00 10.90 -- Base 6.00 6.00 -- 6.00 6.00 --
16 Gran Subbase 8.50 8.50 -- 8.50 8.50 --
PCC NA∗ NA∗ -- 10.28 11.43 -- Base -- 6.00 6.00 --
17 Gran Subbase -- 8.50 8.50 --
∗ Required slab thickness greater than 14 inches according to the models.

Stage 5 Distribution
UCPRC-TM-2006-04
31
Weather Station: San Francisco Climate Region: Central Coast Subgrade: CH (10 < R < 40)Spectra: Rural Shoulder: Tied
No Dowels with base type Dowels with base type TI Structure CTB ACB GB CTB ACB GB
PCC 7.21 7.28 7.65 7.21 7.21 7.21 Base 5.00 5.00 12.00 5.00 5.00 12.00
9 Gran Subbase 6.00 6.00 0.00 6.00 6.00 0.00
PCC 7.74 7.96 9.27 7.74 7.74 7.74 Base 5.00 5.00 12.00 5.00 5.00 12.00
10 Gran Subbase 6.00 6.00 0.00 6.00 6.00 0.00
PCC 8.57 8.95 10.89 8.26 8.26 8.26 Base 5.00 5.00 8.00 5.00 5.00 8.00
11 Gran Subbase 7.20 7.20 7.20 7.20 7.20 7.20
PCC 9.70 10.24 -- 8.79 8.79 -- Base 6.00 6.00 -- 6.00 6.00 --
12 Gran Subbase 7.20 7.20 -- 7.20 7.20 --
PCC 10.70 11.24 -- 9.07 9.15 -- Base 6.00 6.00 -- 6.00 6.00 --
13 Gran Subbase 8.50 8.50 -- 8.50 8.50 --
PCC 11.62 12.05 -- 9.20 9.39 -- Base 6.00 6.00 -- 6.00 6.00 --
14 Gran Subbase 8.50 8.50 -- 8.50 8.50 --
PCC 12.53 12.87 -- 9.32 9.63 -- Base 6.00 6.00 -- 6.00 6.00 --
15 Gran Subbase 8.50 8.50 -- 8.50 8.50 --
PCC 13.45 13.68 -- 9.45 9.88 -- Base 6.00 6.00 -- 6.00 6.00 --
16 Gran Subbase 8.50 8.50 -- 8.50 8.50 --
PCC 14.00 NA∗ -- 9.57 10.12 -- Base 6.00 -- 6.00 6.00 --
17 Gran Subbase 8.50 -- 8.50 8.50 --
∗ Required slab thickness greater than 14 inches according to the models.

Stage 5 Distribution
UCPRC-TM-2006-04
32
Weather Station: San Francisco Climate Region: Central Coast Subgrade: CH (10 < R < 40)Spectra: Urban Shoulder: Untied
No Dowels with base type Dowels with base type TI Structure CTB ACB GB CTB ACB GB
PCC 7.43 7.06 7.29 7.44 7.16 7.53 Base 5.00 5.00 12.00 5.00 5.00 12.00
9 Gran Subbase 6.00 6.00 0.00 6.00 6.00 0.00
PCC 7.91 7.95 8.96 7.89 7.56 7.98 Base 5.00 5.00 12.00 5.00 5.00 12.00
10 Gran Subbase 6.00 6.00 0.00 6.00 6.00 0.00
PCC 8.25 8.79 10.64 8.38 7.93 8.42 Base 5.00 5.00 8.00 5.00 5.00 8.00
11 Gran Subbase 7.20 7.20 7.20 7.20 7.20 7.20
PCC 9.42 9.95 -- 8.66 8.42 -- Base 6.00 6.00 -- 6.00 6.00 --
12 Gran Subbase 7.20 7.20 -- 7.20 7.20 --
PCC 10.70 11.22 -- 8.91 8.90 -- Base 6.00 6.00 -- 6.00 6.00 --
13 Gran Subbase 8.50 8.50 -- 8.50 8.50 --
PCC 11.35 11.79 -- 9.36 9.41 -- Base 6.00 6.00 -- 6.00 6.00 --
14 Gran Subbase 8.50 8.50 -- 8.50 8.50 --
PCC 11.99 12.36 -- 9.82 9.92 -- Base 6.00 6.00 -- 6.00 6.00 --
15 Gran Subbase 8.50 8.50 -- 8.50 8.50 --
PCC 12.63 12.92 -- 10.28 10.44 -- Base 6.00 6.00 -- 6.00 6.00 --
16 Gran Subbase 8.50 8.50 -- 8.50 8.50 --
PCC 13.28 13.49 -- 10.73 10.95 -- Base 6.00 6.00 -- 6.00 6.00 --
17 Gran Subbase 8.50 8.50 -- 8.50 8.50 --
Stage 5 Distribution
UCPRC-TM-2006-04
33
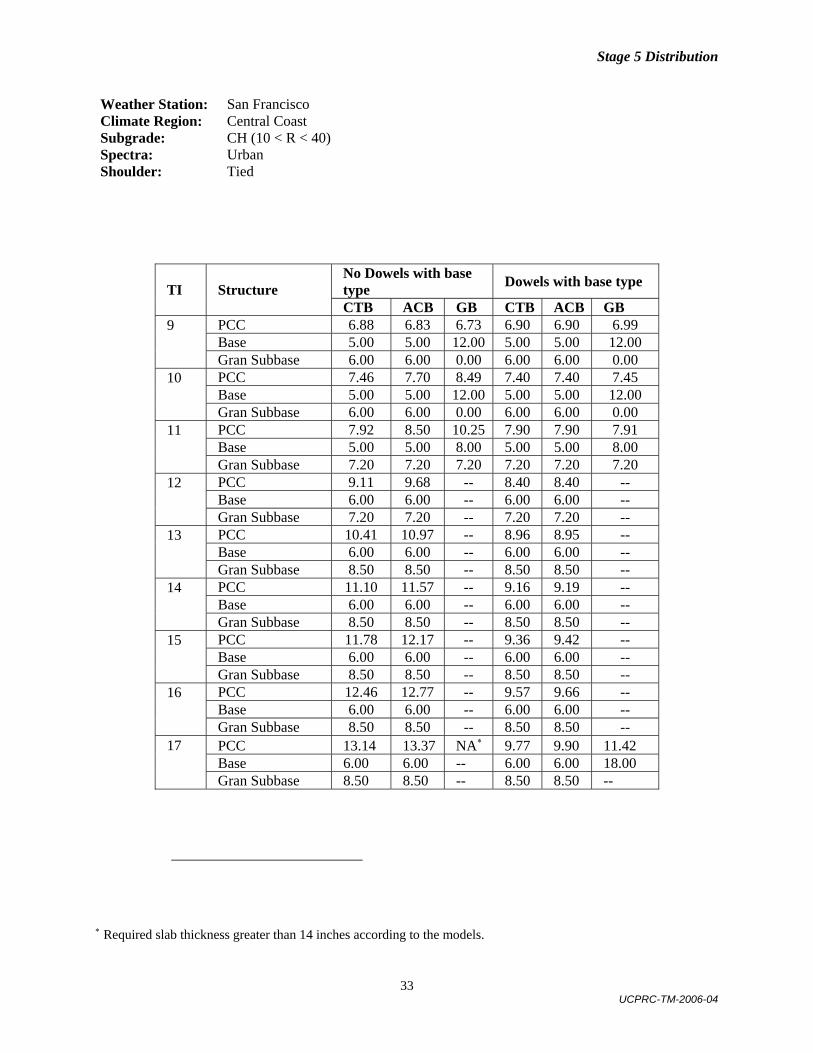
Weather Station: San Francisco Climate Region: Central Coast Subgrade: CH (10 < R < 40)Spectra: Urban Shoulder: Tied
No Dowels with base type Dowels with base type TI Structure CTB ACB GB CTB ACB GB
PCC 6.88 6.83 6.73 6.90 6.90 6.99 Base 5.00 5.00 12.00 5.00 5.00 12.00
9 Gran Subbase 6.00 6.00 0.00 6.00 6.00 0.00
PCC 7.46 7.70 8.49 7.40 7.40 7.45 Base 5.00 5.00 12.00 5.00 5.00 12.00
10 Gran Subbase 6.00 6.00 0.00 6.00 6.00 0.00
PCC 7.92 8.50 10.25 7.90 7.90 7.91 Base 5.00 5.00 8.00 5.00 5.00 8.00
11 Gran Subbase 7.20 7.20 7.20 7.20 7.20 7.20
PCC 9.11 9.68 -- 8.40 8.40 -- Base 6.00 6.00 -- 6.00 6.00 --
12 Gran Subbase 7.20 7.20 -- 7.20 7.20 --
PCC 10.41 10.97 -- 8.96 8.95 -- Base 6.00 6.00 -- 6.00 6.00 --
13 Gran Subbase 8.50 8.50 -- 8.50 8.50 --
PCC 11.10 11.57 -- 9.16 9.19 -- Base 6.00 6.00 -- 6.00 6.00 --
14 Gran Subbase 8.50 8.50 -- 8.50 8.50 --
PCC 11.78 12.17 -- 9.36 9.42 -- Base 6.00 6.00 -- 6.00 6.00 --
15 Gran Subbase 8.50 8.50 -- 8.50 8.50 --
PCC 12.46 12.77 -- 9.57 9.66 -- Base 6.00 6.00 -- 6.00 6.00 --
16 Gran Subbase 8.50 8.50 -- 8.50 8.50 --
PCC 13.14 13.37 NA∗ 9.77 9.90 11.42 Base 6.00 6.00 -- 6.00 6.00 18.00
17 Gran Subbase 8.50 8.50 -- 8.50 8.50 --
∗ Required slab thickness greater than 14 inches according to the models.

Stage 5 Distribution
UCPRC-TM-2006-04
34
Weather Station: San Francisco Climate Region: Central Coast Subgrade: SP (R > 40) Spectra: Rural Shoulder: Untied
No Dowels with base type Dowels with base type TI Structure CTB ACB GB CTB ACB GB
PCC 7.92 7.33 8.41 7.92 7.32 7.81 Base 5.00 5.00 12.00 5.00 5.00 12.00
9 Gran Subbase 0.00 0.00 0.00 0.00 0.00 0.00
PCC 8.51 8.14 9.86 8.51 8.11 8.43 Base 5.00 5.00 12.00 5.00 5.00 12.00
10 Gran Subbase 0.00 0.00 0.00 0.00 0.00 0.00
PCC 9.21 9.17 11.31 9.04 8.78 9.06 Base 5.00 5.00 8.00 5.00 5.00 8.00
11 Gran Subbase 0.00 0.00 0.00 0.00 0.00 0.00
PCC 10.01 10.43 -- 9.52 9.33 -- Base 6.00 6.00 -- 6.00 6.00 --
12 Gran Subbase 0.00 0.00 -- 0.00 0.00 --
PCC 10.83 11.38 -- 10.00 9.89 -- Base 6.00 6.00 -- 6.00 6.00 --
13 Gran Subbase 0.00 0.00 -- 0.00 0.00 --
PCC 11.66 12.14 -- 10.49 10.48 -- Base 6.00 6.00 -- 6.00 6.00 --
14 Gran Subbase 0.00 0.00 -- 0.00 0.00 --
PCC 12.50 12.90 -- 10.98 11.06 -- Base 6.00 6.00 -- 6.00 6.00 --
15 Gran Subbase 0.00 0.00 -- 0.00 0.00 --
PCC 13.34 13.66 -- 11.47 11.64 -- Base 6.00 6.00 -- 6.00 6.00 --
16 Gran Subbase 0.00 0.00 -- 0.00 0.00 --
PCC 14.00 NA∗ -- 11.95 12.22 -- Base 6.00 -- 6.00 6.00 --
17 Gran Subbase 0.00 -- 0.00 0.00 --
∗ Required slab thickness greater than 14 inches according to the models.

Stage 5 Distribution
UCPRC-TM-2006-04
35
Weather Station: San Francisco Climate Region: Central Coast Subgrade: SP (R > 40) Spectra: Rural Shoulder: Tied
No Dowels with base type Dowels with base type TI Structure CTB ACB GB CTB ACB GB
PCC 7.44 7.21 8.07 7.44 7.21 7.26 Base 5.00 5.00 12.00 5.00 5.00 12.00
9 Gran Subbase 0.00 0.00 0.00 0.00 0.00 0.00
PCC 8.16 7.74 9.41 8.16 7.74 7.93 Base 5.00 5.00 12.00 5.00 5.00 12.00
10 Gran Subbase 0.00 0.00 0.00 0.00 0.00 0.00
PCC 8.89 8.68 10.74 8.70 8.26 8.59 Base 5.00 5.00 8.00 5.00 5.00 8.00
11 Gran Subbase 0.00 0.00 0.00 0.00 0.00 0.00
PCC 9.61 10.03 -- 9.07 8.79 -- Base 6.00 6.00 -- 6.00 6.00 --
12 Gran Subbase 0.00 0.00 -- 0.00 0.00 --
PCC 10.43 11.04 -- 9.46 9.29 -- Base 6.00 6.00 -- 6.00 6.00 --
13 Gran Subbase 0.00 0.00 -- 0.00 0.00 --
PCC 11.30 11.83 -- 9.87 9.78 -- Base 6.00 6.00 -- 6.00 6.00 --
14 Gran Subbase 0.00 0.00 -- 0.00 0.00 --
PCC 12.17 12.61 -- 10.28 10.27 -- Base 6.00 6.00 -- 6.00 6.00 --
15 Gran Subbase 0.00 0.00 -- 0.00 0.00 --
PCC 13.04 13.40 -- 10.69 10.76 -- Base 6.00 6.00 -- 6.00 6.00 --
16 Gran Subbase 0.00 0.00 -- 0.00 0.00 --
PCC 13.92 14.00 -- 11.10 11.25 -- Base 6.00 6.00 -- 6.00 6.00 --
17 Gran Subbase 0.00 0.00 -- 0.00 0.00 --

Stage 5 Distribution
UCPRC-TM-2006-04
36
Weather Station: San Francisco Climate Region: Central Coast Subgrade: SP (R > 40) Spectra: Urban Shoulder: Untied
No Dowels with base type Dowels with base type TI Structure CTB ACB GB CTB ACB GB
PCC 8.17 7.52 7.85 8.17 7.54 7.94 Base 5.00 5.00 12.00 5.00 5.00 12.00
9 Gran Subbase 0.00 0.00 0.00 0.00 0.00 0.00
PCC 8.69 8.19 9.30 8.69 8.11 8.40 Base 5.00 5.00 12.00 5.00 5.00 12.00
10 Gran Subbase 0.00 0.00 0.00 0.00 0.00 0.00
PCC 9.17 8.78 10.75 9.24 8.72 8.87 Base 5.00 5.00 8.00 5.00 5.00 8.00
11 Gran Subbase 0.00 0.00 0.00 0.00 0.00 0.00
PCC 9.87 9.90 -- 9.57 9.18 -- Base 6.00 6.00 -- 6.00 6.00 --
12 Gran Subbase 0.00 0.00 -- 0.00 0.00 --
PCC 10.56 11.12 -- 9.88 9.62 -- Base 6.00 6.00 -- 6.00 6.00 --
13 Gran Subbase 0.00 0.00 -- 0.00 0.00 --
PCC 11.33 11.79 -- 10.32 10.15 -- Base 6.00 6.00 -- 6.00 6.00 --
14 Gran Subbase 0.00 0.00 -- 0.00 0.00 --
PCC 12.11 12.46 -- 10.76 10.67 -- Base 6.00 6.00 -- 6.00 6.00 --
15 Gran Subbase 0.00 0.00 -- 0.00 0.00 --
PCC 12.88 13.13 -- 11.20 11.19 -- Base 6.00 6.00 -- 6.00 6.00 --
16 Gran Subbase 0.00 0.00 -- 0.00 0.00 --
PCC 13.65 13.80 -- 11.64 11.72 -- Base 6.00 6.00 -- 6.00 6.00 --
17 Gran Subbase 0.00 0.00 -- 0.00 0.00 --

Stage 5 Distribution
UCPRC-TM-2006-04
37
Weather Station: San Francisco Climate Region: Central Coast Subgrade: SP (R > 40) Spectra: Urban Shoulder: Tied
No Dowels with base type Dowels with base type TI Structure CTB ACB GB CTB ACB GB
PCC 7.62 6.85 7.53 7.62 6.86 7.50 Base 5.00 5.00 12.00 5.00 5.00 12.00
9 Gran Subbase 0.00 0.00 0.00 0.00 0.00 0.00
PCC 8.17 7.61 8.93 8.17 7.58 8.05 Base 5.00 5.00 12.00 5.00 5.00 12.00
10 Gran Subbase 0.00 0.00 0.00 0.00 0.00 0.00
PCC 8.68 8.29 10.33 8.74 8.38 8.60 Base 5.00 5.00 8.00 5.00 5.00 8.00
11 Gran Subbase 0.00 0.00 0.00 0.00 0.00 0.00
PCC 9.44 9.49 -- 9.19 8.69 -- Base 6.00 6.00 -- 6.00 6.00 --
12 Gran Subbase 0.00 0.00 -- 0.00 0.00 --
PCC 10.19 10.80 -- 9.64 8.96 -- Base 6.00 6.00 -- 6.00 6.00 --
13 Gran Subbase 0.00 0.00 -- 0.00 0.00 --
PCC 11.00 11.53 -- 10.06 9.44 -- Base 6.00 6.00 -- 6.00 6.00 --
14 Gran Subbase 0.00 0.00 -- 0.00 0.00 --
PCC 11.81 12.26 -- 10.49 9.92 -- Base 6.00 6.00 -- 6.00 6.00 --
15 Gran Subbase 0.00 0.00 -- 0.00 0.00 --
PCC 12.62 13.00 -- 10.92 10.40 -- Base 6.00 6.00 -- 6.00 6.00 --
16 Gran Subbase 0.00 0.00 -- 0.00 0.00 --
PCC 13.43 13.73 -- 11.35 10.88 -- Base 6.00 6.00 -- 6.00 6.00 --
17 Gran Subbase 0.00 0.00 -- 0.00 0.00 --

Stage 5 Distribution
UCPRC-TM-2006-04
38
Weather Station: Dagget Climate Region: Desert / Valley Subgrade: CH (10 < R < 40)Spectra: Rural Shoulder: Untied
No Dowels with base type Dowels with base type TI Structure CTB ACB GB CTB ACB GB
PCC 7.92 8.17 8.55 7.92 8.17 8.14 Base 5.00 5.00 12.00 5.00 5.00 12.00
9 Gran Subbase 6.00 6.00 0.00 6.00 6.00 0.00
PCC 8.60 9.11 10.25 8.60 9.11 8.93 Base 5.00 5.00 12.00 5.00 5.00 12.00
10 Gran Subbase 6.00 6.00 0.00 6.00 6.00 0.00
PCC 9.47 10.07 11.95 9.39 10.03 9.72 Base 5.00 5.00 8.00 5.00 5.00 8.00
11 Gran Subbase 7.20 7.20 7.20 7.20 7.20 7.20
PCC 10.53 11.05 -- 10.30 10.93 -- Base 6.00 6.00 -- 6.00 6.00 --
12 Gran Subbase 7.20 7.20 -- 7.20 7.20 --
PCC 11.41 11.82 -- 11.05 11.63 -- Base 6.00 6.00 -- 6.00 6.00 --
13 Gran Subbase 8.50 8.50 -- 8.50 8.50 --
PCC 12.17 12.46 -- 11.71 12.20 -- Base 6.00 6.00 -- 6.00 6.00 --
14 Gran Subbase 8.50 8.50 -- 8.50 8.50 --
PCC 12.93 13.10 -- 12.37 12.78 -- Base 6.00 6.00 -- 6.00 6.00 --
15 Gran Subbase 8.50 8.50 -- 8.50 8.50 --
PCC 13.69 13.74 -- 13.03 13.35 -- Base 6.00 6.00 -- 6.00 6.00 --
16 Gran Subbase 8.50 8.50 -- 8.50 8.50 --
PCC NA∗ NA∗ NA∗ 13.69 13.92 13.27 Base 6.00 6.00 18.00
17 Gran Subbase 8.50 8.50 --
∗ Required slab thickness greater than 14 inches according to the models.

Stage 5 Distribution
UCPRC-TM-2006-04
39
Weather Station: Dagget Climate Region: Desert / Valley Subgrade: CH (10 < R < 40)Spectra: Rural Shoulder: Tied
No Dowels with base type Dowels with base type TI Structure CTB ACB GB CTB ACB GB
PCC 7.32 7.42 8.21 7.29 7.41 7.66 Base 5.00 5.00 12.00 5.00 5.00 12.00
9 Gran Subbase 6.00 6.00 0.00 6.00 6.00 0.00
PCC 8.13 8.45 9.91 8.01 8.45 8.39 Base 5.00 5.00 12.00 5.00 5.00 12.00
10 Gran Subbase 6.00 6.00 0.00 6.00 6.00 0.00
PCC 9.09 9.55 11.62 8.71 9.34 9.13 Base 5.00 5.00 8.00 5.00 5.00 8.00
11 Gran Subbase 7.20 7.20 7.20 7.20 7.20 7.20
PCC 10.21 10.72 -- 9.40 10.11 -- Base 6.00 6.00 -- 6.00 6.00 --
12 Gran Subbase 7.20 7.20 -- 7.20 7.20 --
PCC 11.16 11.60 -- 10.17 10.85 -- Base 6.00 6.00 -- 6.00 6.00 --
13 Gran Subbase 8.50 8.50 -- 8.50 8.50 --
PCC 11.99 12.31 -- 11.00 11.57 -- Base 6.00 6.00 -- 6.00 6.00 --
14 Gran Subbase 8.50 8.50 -- 8.50 8.50 --
PCC 12.83 13.01 -- 11.82 12.29 -- Base 6.00 6.00 -- 6.00 6.00 --
15 Gran Subbase 8.50 8.50 -- 8.50 8.50 --
PCC 13.66 13.72 -- 12.65 13.02 -- Base 6.00 6.00 -- 6.00 6.00 --
16 Gran Subbase 8.50 8.50 -- 8.50 8.50 --
PCC NA∗ NA∗ NA∗ 13.48 13.74 12.81 Base 6.00 6.00 18.00
17 Gran Subbase 8.50 8.50 --
∗ Required slab thickness greater than 14 inches according to the models.

Stage 5 Distribution
UCPRC-TM-2006-04
40
Weather Station: Dagget Climate Region: Desert / Valley Subgrade: CH (10 < R < 40)Spectra: Urban Shoulder: Untied
No Dowels with base type Dowels with base type TI Structure CTB ACB GB CTB ACB GB
PCC 8.13 7.80 8.07 8.13 7.82 8.27 Base 5.00 5.00 12.00 5.00 5.00 12.00
9 Gran Subbase 6.00 6.00 0.00 6.00 6.00 0.00
PCC 8.59 8.61 9.58 8.59 8.53 8.76 Base 5.00 5.00 12.00 5.00 5.00 12.00
10 Gran Subbase 6.00 6.00 0.00 6.00 6.00 0.00
PCC 8.93 9.37 11.09 9.00 9.21 9.24 Base 5.00 5.00 8.00 5.00 5.00 8.00
11 Gran Subbase 7.20 7.20 7.20 7.20 7.20 7.20
PCC 9.97 10.40 -- 9.66 10.08 -- Base 6.00 6.00 -- 6.00 6.00 --
12 Gran Subbase 7.20 7.20 -- 7.20 7.20 --
PCC 11.05 11.47 -- 10.30 11.00 -- Base 6.00 6.00 -- 6.00 6.00 --
13 Gran Subbase 8.50 8.50 -- 8.50 8.50 --
PCC 11.79 12.31 -- 11.01 11.61 -- Base 6.00 6.00 -- 6.00 6.00 --
14 Gran Subbase 8.50 8.50 -- 8.50 8.50 --
PCC 12.53 13.16 -- 11.72 12.23 -- Base 6.00 6.00 -- 6.00 6.00 --
15 Gran Subbase 8.50 8.50 -- 8.50 8.50 --
PCC 13.26 14.00 -- 12.43 12.85 -- Base 6.00 6.00 -- 6.00 6.00 --
16 Gran Subbase 8.50 8.50 -- 8.50 8.50 --
PCC 14.00 NA∗ -- 13.14 13.46 -- Base 6.00 -- 6.00 6.00 --
17 Gran Subbase 8.50 -- 8.50 8.50 --
∗ Required slab thickness greater than 14 inches according to the models.

Stage 5 Distribution
UCPRC-TM-2006-04
41
Weather Station: Dagget Climate Region: Desert / Valley Subgrade: CH (10 < R < 40)Spectra: Urban Shoulder: Tied
No Dowels with base type Dowels with base type TI Structure CTB ACB GB CTB ACB GB
PCC 7.69 7.52 7.63 7.70 7.57 7.76 Base 5.00 5.00 12.00 5.00 5.00 12.00
9 Gran Subbase 6.00 6.00 0.00 6.00 6.00 0.00
PCC 8.23 8.34 9.22 8.19 8.14 8.25 Base 5.00 5.00 12.00 5.00 5.00 12.00
10 Gran Subbase 6.00 6.00 0.00 6.00 6.00 0.00
PCC 8.66 9.11 10.80 8.68 8.72 8.74 Base 5.00 5.00 8.00 5.00 5.00 8.00
11 Gran Subbase 7.20 7.20 7.20 7.20 7.20 7.20
PCC 9.70 10.16 -- 9.13 9.29 -- Base 6.00 6.00 -- 6.00 6.00 --
12 Gran Subbase 7.20 7.20 -- 7.20 7.20 --
PCC 10.79 11.23 -- 9.50 9.81 -- Base 6.00 6.00 -- 6.00 6.00 --
13 Gran Subbase 8.50 8.50 -- 8.50 8.50 --
PCC 11.59 12.15 -- 10.33 10.64 -- Base 6.00 6.00 -- 6.00 6.00 --
14 Gran Subbase 8.50 8.50 -- 8.50 8.50 --
PCC 12.39 13.08 -- 11.16 11.46 -- Base 6.00 6.00 -- 6.00 6.00 --
15 Gran Subbase 8.50 8.50 -- 8.50 8.50 --
PCC 13.20 14.00 -- 11.99 12.29 -- Base 6.00 6.00 -- 6.00 6.00 --
16 Gran Subbase 8.50 8.50 -- 8.50 8.50 --
PCC 14.00 NA∗ -- 12.81 13.12 -- Base 6.00 -- 6.00 6.00 --
17 Gran Subbase 8.50 -- 8.50 8.50 --
∗ Required slab thickness greater than 14 inches according to the models.

Stage 5 Distribution
UCPRC-TM-2006-04
42
Weather Station: Dagget Climate Region: Desert / Valley Subgrade: SP (R > 40) Spectra: Rural Shoulder: Untied
No Dowels with base type Dowels with base type TI Structure CTB ACB GB CTB ACB GB
PCC 8.88 9.04 9.10 8.88 9.05 9.10 Base 5.00 5.00 12.00 5.00 5.00 12.00
9 Gran Subbase 0.00 0.00 0.00 0.00 0.00 0.00
PCC 9.59 10.18 10.02 9.59 10.19 10.02 Base 5.00 5.00 12.00 5.00 5.00 12.00
10 Gran Subbase 0.00 0.00 0.00 0.00 0.00 0.00
PCC 10.37 11.07 10.94 10.37 11.07 10.94 Base 5.00 5.00 8.00 5.00 5.00 8.00
11 Gran Subbase 0.00 0.00 0.00 0.00 0.00 0.00
PCC 11.24 11.68 -- 11.24 11.68 -- Base 6.00 6.00 -- 6.00 6.00 --
12 Gran Subbase 0.00 0.00 -- 0.00 0.00 --
PCC 11.93 12.24 -- 11.93 12.24 -- Base 6.00 6.00 -- 6.00 6.00 --
13 Gran Subbase 0.00 0.00 -- 0.00 0.00 --
PCC 12.51 12.76 -- 12.51 12.76 -- Base 6.00 6.00 -- 6.00 6.00 --
14 Gran Subbase 0.00 0.00 -- 0.00 0.00 --
PCC 13.09 13.28 -- 13.09 13.28 -- Base 6.00 6.00 -- 6.00 6.00 --
15 Gran Subbase 0.00 0.00 -- 0.00 0.00 --
PCC 13.67 13.79 -- 13.67 13.79 -- Base 6.00 6.00 -- 6.00 6.00 --
16 Gran Subbase 0.00 0.00 -- 0.00 0.00 --
PCC 14.00 NA∗ -- 14.00 NA∗ -- Base 6.00 -- 6.00 6.00 --
17 Gran Subbase 0.00 -- 0.00 0.00 --
∗ Required slab thickness greater than 14 inches according to the models.

Stage 5 Distribution
UCPRC-TM-2006-04
43
Weather Station: Dagget Climate Region: Desert / Valley Subgrade: SP (R > 40) Spectra: Rural Shoulder: Tied
No Dowels with base type Dowels with base type TI Structure CTB ACB GB CTB ACB GB
PCC 8.16 7.66 8.31 8.16 7.66 8.15 Base 5.00 5.00 12.00 5.00 5.00 12.00
9 Gran Subbase 0.00 0.00 0.00 0.00 0.00 0.00
PCC 8.70 8.55 9.28 8.70 8.55 8.71 Base 5.00 5.00 12.00 5.00 5.00 12.00
10 Gran Subbase 0.00 0.00 0.00 0.00 0.00 0.00
PCC 9.24 9.54 10.25 9.24 9.54 9.27 Base 5.00 5.00 8.00 5.00 5.00 8.00
11 Gran Subbase 0.00 0.00 0.00 0.00 0.00 0.00
PCC 9.79 10.61 -- 9.79 10.61 -- Base 6.00 6.00 -- 6.00 6.00 --
12 Gran Subbase 0.00 0.00 -- 0.00 0.00 --
PCC 10.50 11.44 -- 10.47 11.40 -- Base 6.00 6.00 -- 6.00 6.00 --
13 Gran Subbase 0.00 0.00 -- 0.00 0.00 --
PCC 11.32 12.10 -- 11.24 12.01 -- Base 6.00 6.00 -- 6.00 6.00 --
14 Gran Subbase 0.00 0.00 -- 0.00 0.00 --
PCC 12.14 12.76 -- 12.01 12.61 -- Base 6.00 6.00 -- 6.00 6.00 --
15 Gran Subbase 0.00 0.00 -- 0.00 0.00 --
PCC 12.96 13.43 -- 12.79 13.21 -- Base 6.00 6.00 -- 6.00 6.00 --
16 Gran Subbase 0.00 0.00 -- 0.00 0.00 --
PCC 13.79 14.00 -- 13.56 13.81 -- Base 6.00 6.00 -- 6.00 6.00 --
17 Gran Subbase 0.00 0.00 -- 0.00 0.00 --

Stage 5 Distribution
UCPRC-TM-2006-04
44
Weather Station: Dagget Climate Region: Desert / Valley Subgrade: SP (R > 40) Spectra: Urban Shoulder: Untied
No Dowels with base type Dowels with base type TI Structure CTB ACB GB CTB ACB GB
PCC 8.85 8.53 8.75 8.85 8.53 8.80 Base 5.00 5.00 12.00 5.00 5.00 12.00
9 Gran Subbase 0.00 0.00 0.00 0.00 0.00 0.00
PCC 9.36 9.30 9.54 9.36 9.30 9.35 Base 5.00 5.00 12.00 5.00 5.00 12.00
10 Gran Subbase 0.00 0.00 0.00 0.00 0.00 0.00
PCC 9.81 10.05 10.33 9.81 10.05 9.89 Base 5.00 5.00 8.00 5.00 5.00 8.00
11 Gran Subbase 0.00 0.00 0.00 0.00 0.00 0.00
PCC 10.63 10.87 -- 10.63 10.87 -- Base 6.00 6.00 -- 6.00 6.00 --
12 Gran Subbase 0.00 0.00 -- 0.00 0.00 --
PCC 11.51 11.74 -- 11.51 11.73 -- Base 6.00 6.00 -- 6.00 6.00 --
13 Gran Subbase 0.00 0.00 -- 0.00 0.00 --
PCC 12.08 12.26 -- 12.08 12.30 -- Base 6.00 6.00 -- 6.00 6.00 --
14 Gran Subbase 0.00 0.00 -- 0.00 0.00 --
PCC 12.64 12.79 -- 12.64 12.86 -- Base 6.00 6.00 -- 6.00 6.00 --
15 Gran Subbase 0.00 0.00 -- 0.00 0.00 --
PCC 13.20 13.32 -- 13.20 13.43 -- Base 6.00 6.00 -- 6.00 6.00 --
16 Gran Subbase 0.00 0.00 -- 0.00 0.00 --
PCC 13.76 13.84 -- 13.76 14.00 -- Base 6.00 6.00 -- 6.00 6.00 --
17 Gran Subbase 0.00 0.00 -- 0.00 0.00 --

Stage 5 Distribution
UCPRC-TM-2006-04
45
Weather Station: Dagget Climate Region: Desert / Valley Subgrade: SP (R > 40) Spectra: Urban Shoulder: Tied
No Dowels with base type Dowels with base type TI Structure CTB ACB GB CTB ACB GB
PCC 8.52 7.80 8.42 8.52 7.80 8.48 Base 5.00 5.00 12.00 5.00 5.00 12.00
9 Gran Subbase 0.00 0.00 0.00 0.00 0.00 0.00
PCC 9.02 8.38 9.16 9.02 8.38 8.94 Base 5.00 5.00 12.00 5.00 5.00 12.00
10 Gran Subbase 0.00 0.00 0.00 0.00 0.00 0.00
PCC 9.51 8.90 9.90 9.51 8.90 9.40 Base 5.00 5.00 8.00 5.00 5.00 8.00
11 Gran Subbase 0.00 0.00 0.00 0.00 0.00 0.00
PCC 10.07 9.74 -- 10.07 9.74 -- Base 6.00 6.00 -- 6.00 6.00 --
12 Gran Subbase 0.00 0.00 -- 0.00 0.00 --
PCC 10.61 10.61 -- 10.63 10.63 -- Base 6.00 6.00 -- 6.00 6.00 --
13 Gran Subbase 0.00 0.00 -- 0.00 0.00 --
PCC 11.27 11.35 -- 11.19 11.28 -- Base 6.00 6.00 -- 6.00 6.00 --
14 Gran Subbase 0.00 0.00 -- 0.00 0.00 --
PCC 11.94 12.09 -- 11.75 11.93 -- Base 6.00 6.00 -- 6.00 6.00 --
15 Gran Subbase 0.00 0.00 -- 0.00 0.00 --
PCC 12.60 12.83 -- 12.32 12.58 -- Base 6.00 6.00 -- 6.00 6.00 --
16 Gran Subbase 0.00 0.00 -- 0.00 0.00 --
PCC 13.26 13.57 -- 12.88 13.23 -- Base 6.00 6.00 -- 6.00 6.00 --
17 Gran Subbase 0.00 0.00 -- 0.00 0.00 --

Stage 5 Distribution
UCPRC-TM-2006-04
46
Weather Station: Santa Rosa Climate Region: Low Mountain Subgrade: CH (10 < R < 40)Spectra: Rural Shoulder: Untied
No Dowels with base type Dowels with base type TI Structure CTB ACB GB CTB ACB GB
PCC 7.76 8.15 8.80 7.76 8.15 8.07 Base 5.00 5.00 12.00 5.00 5.00 12.00
9 Gran Subbase 6.00 6.00 0.00 6.00 6.00 0.00
PCC 8.59 9.08 10.61 8.59 9.08 8.93 Base 5.00 5.00 12.00 5.00 5.00 12.00
10 Gran Subbase 6.00 6.00 0.00 6.00 6.00 0.00
PCC 9.56 10.08 12.43 9.44 10.00 9.80 Base 5.00 5.00 8.00 5.00 5.00 8.00
11 Gran Subbase 7.20 7.20 7.20 7.20 7.20 7.20
PCC 10.67 11.15 -- 10.33 10.90 -- Base 6.00 6.00 -- 6.00 6.00 --
12 Gran Subbase 7.20 7.20 -- 7.20 7.20 --
PCC 11.55 11.95 -- 11.12 11.63 -- Base 6.00 6.00 -- 6.00 6.00 --
13 Gran Subbase 8.50 8.50 -- 8.50 8.50 --
PCC 12.27 12.55 -- 11.86 12.26 -- Base 6.00 6.00 -- 6.00 6.00 --
14 Gran Subbase 8.50 8.50 -- 8.50 8.50 --
PCC 13.00 13.15 -- 12.59 12.89 -- Base 6.00 6.00 -- 6.00 6.00 --
15 Gran Subbase 8.50 8.50 -- 8.50 8.50 --
PCC 13.71 13.76 -- 13.33 13.51 -- Base 6.00 6.00 -- 6.00 6.00 --
16 Gran Subbase 8.50 8.50 -- 8.50 8.50 --
PCC NA∗ NA∗ -- 14.00 14.00 -- Base -- 6.00 6.00 --
17 Gran Subbase -- 8.50 8.50 --
∗ Required slab thickness greater than 14 inches according to the models.

Stage 5 Distribution
UCPRC-TM-2006-04
47
Weather Station: Santa Rosa Climate Region: Low Mountain Subgrade: CH (10 < R < 40)Spectra: Rural Shoulder: Tied
No Dowels with base type Dowels with base type TI Structure CTB ACB GB CTB ACB GB
PCC 7.36 7.47 8.44 7.29 7.40 7.41 Base 5.00 5.00 12.00 5.00 5.00 12.00
9 Gran Subbase 6.00 6.00 0.00 6.00 6.00 0.00
PCC 8.27 8.64 10.28 8.02 8.38 8.35 Base 5.00 5.00 12.00 5.00 5.00 12.00
10 Gran Subbase 6.00 6.00 0.00 6.00 6.00 0.00
PCC 9.28 9.79 12.12 8.80 9.38 9.28 Base 5.00 5.00 8.00 5.00 5.00 8.00
11 Gran Subbase 7.20 7.20 7.20 7.20 7.20 7.20
PCC 10.41 10.91 -- 9.63 10.40 -- Base 6.00 6.00 -- 6.00 6.00 --
12 Gran Subbase 7.20 7.20 -- 7.20 7.20 --
PCC 11.33 11.75 -- 10.48 11.21 -- Base 6.00 6.00 -- 6.00 6.00 --
13 Gran Subbase 8.50 8.50 -- 8.50 8.50 --
PCC 12.11 12.41 -- 11.32 11.89 -- Base 6.00 6.00 -- 6.00 6.00 --
14 Gran Subbase 8.50 8.50 -- 8.50 8.50 --
PCC 12.90 13.08 -- 12.16 12.57 -- Base 6.00 6.00 -- 6.00 6.00 --
15 Gran Subbase 8.50 8.50 -- 8.50 8.50 --
PCC 13.68 13.74 -- 13.01 13.24 -- Base 6.00 6.00 -- 6.00 6.00 --
16 Gran Subbase 8.50 8.50 -- 8.50 8.50 --
PCC NA∗ NA∗ -- 13.85 13.92 -- Base -- 6.00 6.00 --
17 Gran Subbase -- 8.50 8.50 --
∗ Required slab thickness greater than 14 inches according to the models.

Stage 5 Distribution
UCPRC-TM-2006-04
48
Weather Station: Santa Rosa Climate Region: Low Mountain Subgrade: CH (10 < R < 40)Spectra: Urban Shoulder: Untied
No Dowels with base type Dowels with base type TI Structure CTB ACB GB CTB ACB GB
PCC 7.76 7.67 8.22 7.79 7.71 7.85 Base 5.00 5.00 12.00 5.00 5.00 12.00
9 Gran Subbase 6.00 6.00 0.00 6.00 6.00 0.00
PCC 8.49 8.64 9.85 8.33 8.45 8.48 Base 5.00 5.00 12.00 5.00 5.00 12.00
10 Gran Subbase 6.00 6.00 0.00 6.00 6.00 0.00
PCC 9.16 9.61 11.48 8.84 9.17 9.11 Base 5.00 5.00 8.00 5.00 5.00 8.00
11 Gran Subbase 7.20 7.20 7.20 7.20 7.20 7.20
PCC 10.16 10.60 -- 9.54 10.03 -- Base 6.00 6.00 -- 6.00 6.00 --
12 Gran Subbase 7.20 7.20 -- 7.20 7.20 --
PCC 11.22 11.63 -- 10.21 10.93 -- Base 6.00 6.00 -- 6.00 6.00 --
13 Gran Subbase 8.50 8.50 -- 8.50 8.50 --
PCC 11.87 12.42 -- 11.02 11.61 -- Base 6.00 6.00 -- 6.00 6.00 --
14 Gran Subbase 8.50 8.50 -- 8.50 8.50 --
PCC 12.52 13.21 -- 11.83 12.28 -- Base 6.00 6.00 -- 6.00 6.00 --
15 Gran Subbase 8.50 8.50 -- 8.50 8.50 --
PCC 13.16 14.00 -- 12.64 12.95 -- Base 6.00 6.00 -- 6.00 6.00 --
16 Gran Subbase 8.50 8.50 -- 8.50 8.50 --
PCC 13.81 NA∗ -- 13.45 13.63 -- Base 6.00 -- 6.00 6.00 --
17 Gran Subbase 8.50 -- 8.50 8.50 --
∗ Required slab thickness greater than 14 inches according to the models.

Stage 5 Distribution
UCPRC-TM-2006-04
49
Weather Station: Santa Rosa Climate Region: Low Mountain Subgrade: CH (10 < R < 40)Spectra: Urban Shoulder: Tied
No Dowels with base type Dowels with base type TI Structure CTB ACB GB CTB ACB GB
PCC 7.47 7.30 7.86 7.52 7.38 7.62 Base 5.00 5.00 12.00 5.00 5.00 12.00
9 Gran Subbase 6.00 6.00 0.00 6.00 6.00 0.00
PCC 8.20 8.33 9.53 8.02 8.00 8.15 Base 5.00 5.00 12.00 5.00 5.00 12.00
10 Gran Subbase 6.00 6.00 0.00 6.00 6.00 0.00
PCC 8.88 9.37 11.20 8.51 8.56 8.68 Base 5.00 5.00 8.00 5.00 5.00 8.00
11 Gran Subbase 7.20 7.20 7.20 7.20 7.20 7.20
PCC 9.91 10.38 -- 9.09 9.43 -- Base 6.00 6.00 -- 6.00 6.00 --
12 Gran Subbase 7.20 7.20 -- 7.20 7.20 --
PCC 11.00 11.47 -- 9.62 10.33 -- Base 6.00 6.00 -- 6.00 6.00 --
13 Gran Subbase 8.50 8.50 -- 8.50 8.50 --
PCC 11.70 12.06 -- 10.50 11.09 -- Base 6.00 6.00 -- 6.00 6.00 --
14 Gran Subbase 8.50 8.50 -- 8.50 8.50 --
PCC 12.39 12.65 -- 11.39 11.85 -- Base 6.00 6.00 -- 6.00 6.00 --
15 Gran Subbase 8.50 8.50 -- 8.50 8.50 --
PCC 13.09 13.24 -- 12.27 12.61 -- Base 6.00 6.00 -- 6.00 6.00 --
16 Gran Subbase 8.50 8.50 -- 8.50 8.50 --
PCC 13.79 13.82 -- 13.16 13.37 -- Base 6.00 6.00 -- 6.00 6.00 --
17 Gran Subbase 8.50 8.50 -- 8.50 8.50 --

Stage 5 Distribution
UCPRC-TM-2006-04
50
Weather Station: Santa Rosa Climate Region: Low Mountain Subgrade: SP (R > 40) Spectra: Rural Shoulder: Untied
No Dowels with base type Dowels with base type TI Structure CTB ACB GB CTB ACB GB
PCC 8.51 8.83 9.56 8.51 8.83 8.91 Base 5.00 5.00 12.00 5.00 5.00 12.00
9 Gran Subbase 0.00 0.00 0.00 0.00 0.00 0.00
PCC 9.35 9.85 11.00 9.35 9.85 9.71 Base 5.00 5.00 12.00 5.00 5.00 12.00
10 Gran Subbase 0.00 0.00 0.00 0.00 0.00 0.00
PCC 10.19 10.70 12.45 10.19 10.70 10.51 Base 5.00 5.00 8.00 5.00 5.00 8.00
11 Gran Subbase 0.00 0.00 0.00 0.00 0.00 0.00
PCC 11.02 11.38 -- 11.02 11.38 -- Base 6.00 6.00 -- 6.00 6.00 --
12 Gran Subbase 0.00 0.00 -- 0.00 0.00 --
PCC 11.75 12.01 -- 11.71 11.98 -- Base 6.00 6.00 -- 6.00 6.00 --
13 Gran Subbase 0.00 0.00 -- 0.00 0.00 --
PCC 12.42 12.59 -- 12.28 12.52 -- Base 6.00 6.00 -- 6.00 6.00 --
14 Gran Subbase 0.00 0.00 -- 0.00 0.00 --
PCC 13.07 13.18 -- 12.86 13.05 -- Base 6.00 6.00 -- 6.00 6.00 --
15 Gran Subbase 0.00 0.00 -- 0.00 0.00 --
PCC 13.73 13.77 -- 13.44 13.59 -- Base 6.00 6.00 -- 6.00 6.00 --
16 Gran Subbase 0.00 0.00 -- 0.00 0.00 --
PCC NA∗ NA∗ -- 14.00 14.00 -- Base -- 6.00 6.00 --
17 Gran Subbase -- 0.00 0.00 --
∗ Required slab thickness greater than 14 inches according to the models.
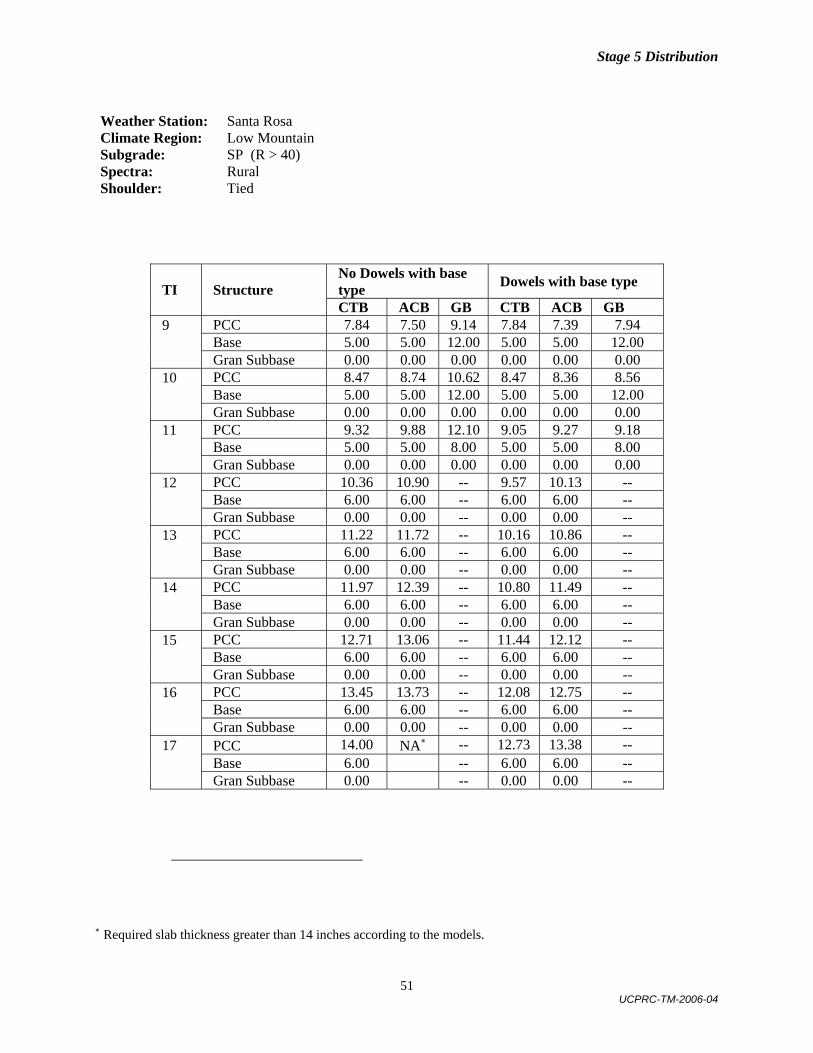
Stage 5 Distribution
UCPRC-TM-2006-04
51
Weather Station: Santa Rosa Climate Region: Low Mountain Subgrade: SP (R > 40) Spectra: Rural Shoulder: Tied
No Dowels with base type Dowels with base type TI Structure CTB ACB GB CTB ACB GB
PCC 7.84 7.50 9.14 7.84 7.39 7.94 Base 5.00 5.00 12.00 5.00 5.00 12.00
9 Gran Subbase 0.00 0.00 0.00 0.00 0.00 0.00
PCC 8.47 8.74 10.62 8.47 8.36 8.56 Base 5.00 5.00 12.00 5.00 5.00 12.00
10 Gran Subbase 0.00 0.00 0.00 0.00 0.00 0.00
PCC 9.32 9.88 12.10 9.05 9.27 9.18 Base 5.00 5.00 8.00 5.00 5.00 8.00
11 Gran Subbase 0.00 0.00 0.00 0.00 0.00 0.00
PCC 10.36 10.90 -- 9.57 10.13 -- Base 6.00 6.00 -- 6.00 6.00 --
12 Gran Subbase 0.00 0.00 -- 0.00 0.00 --
PCC 11.22 11.72 -- 10.16 10.86 -- Base 6.00 6.00 -- 6.00 6.00 --
13 Gran Subbase 0.00 0.00 -- 0.00 0.00 --
PCC 11.97 12.39 -- 10.80 11.49 -- Base 6.00 6.00 -- 6.00 6.00 --
14 Gran Subbase 0.00 0.00 -- 0.00 0.00 --
PCC 12.71 13.06 -- 11.44 12.12 -- Base 6.00 6.00 -- 6.00 6.00 --
15 Gran Subbase 0.00 0.00 -- 0.00 0.00 --
PCC 13.45 13.73 -- 12.08 12.75 -- Base 6.00 6.00 -- 6.00 6.00 --
16 Gran Subbase 0.00 0.00 -- 0.00 0.00 --
PCC 14.00 NA∗ -- 12.73 13.38 -- Base 6.00 -- 6.00 6.00 --
17 Gran Subbase 0.00 -- 0.00 0.00 --
∗ Required slab thickness greater than 14 inches according to the models.

Stage 5 Distribution
UCPRC-TM-2006-04
52
Weather Station: Santa Rosa Climate Region: Low Mountain Subgrade: SP (R > 40) Spectra: Urban Shoulder: Untied
No Dowels with base type Dowels with base type TI Structure CTB ACB GB CTB ACB GB
PCC 8.58 8.24 8.70 8.58 8.25 8.61 Base 5.00 5.00 12.00 5.00 5.00 12.00
9 Gran Subbase 0.00 0.00 0.00 0.00 0.00 0.00
PCC 9.14 9.05 10.20 9.14 9.00 9.19 Base 5.00 5.00 12.00 5.00 5.00 12.00
10 Gran Subbase 0.00 0.00 0.00 0.00 0.00 0.00
PCC 9.65 9.86 11.70 9.65 9.72 9.77 Base 5.00 5.00 8.00 5.00 5.00 8.00
11 Gran Subbase 0.00 0.00 0.00 0.00 0.00 0.00
PCC 10.42 10.75 -- 10.41 10.56 -- Base 6.00 6.00 -- 6.00 6.00 --
12 Gran Subbase 0.00 0.00 -- 0.00 0.00 --
PCC 11.23 11.72 -- 11.22 11.47 -- Base 6.00 6.00 -- 6.00 6.00 --
13 Gran Subbase 0.00 0.00 -- 0.00 0.00 --
PCC 11.87 12.22 -- 11.79 11.94 -- Base 6.00 6.00 -- 6.00 6.00 --
14 Gran Subbase 0.00 0.00 -- 0.00 0.00 --
PCC 12.52 12.72 -- 12.36 12.41 -- Base 6.00 6.00 -- 6.00 6.00 --
15 Gran Subbase 0.00 0.00 -- 0.00 0.00 --
PCC 13.16 13.22 -- 12.93 12.88 -- Base 6.00 6.00 -- 6.00 6.00 --
16 Gran Subbase 0.00 0.00 -- 0.00 0.00 --
PCC 13.81 13.73 -- 13.50 13.35 -- Base 6.00 6.00 -- 6.00 6.00 --
17 Gran Subbase 0.00 0.00 -- 0.00 0.00 --

Stage 5 Distribution
UCPRC-TM-2006-04
53
Weather Station: Santa Rosa Climate Region: Low Mountain Subgrade: SP (R > 40) Spectra: Urban Shoulder: Tied
No Dowels with base type Dowels with base type TI Structure CTB ACB GB CTB ACB GB
PCC 8.05 7.42 8.64 8.05 7.51 8.02 Base 5.00 5.00 12.00 5.00 5.00 12.00
9 Gran Subbase 0.00 0.00 0.00 0.00 0.00 0.00
PCC 8.56 8.45 10.03 8.55 8.11 8.46 Base 5.00 5.00 12.00 5.00 5.00 12.00
10 Gran Subbase 0.00 0.00 0.00 0.00 0.00 0.00
PCC 8.97 9.51 11.42 9.07 8.72 8.90 Base 5.00 5.00 8.00 5.00 5.00 8.00
11 Gran Subbase 0.00 0.00 0.00 0.00 0.00 0.00
PCC 9.92 10.44 -- 9.46 9.30 -- Base 6.00 6.00 -- 6.00 6.00 --
12 Gran Subbase 0.00 0.00 -- 0.00 0.00 --
PCC 10.93 11.45 -- 9.82 9.85 -- Base 6.00 6.00 -- 6.00 6.00 --
13 Gran Subbase 0.00 0.00 -- 0.00 0.00 --
PCC 11.62 11.97 -- 10.36 10.54 -- Base 6.00 6.00 -- 6.00 6.00 --
14 Gran Subbase 0.00 0.00 -- 0.00 0.00 --
PCC 12.31 12.49 -- 10.91 11.24 -- Base 6.00 6.00 -- 6.00 6.00 --
15 Gran Subbase 0.00 0.00 -- 0.00 0.00 --
PCC 13.01 13.01 -- 11.46 11.94 -- Base 6.00 6.00 -- 6.00 6.00 --
16 Gran Subbase 0.00 0.00 -- 0.00 0.00 --
PCC 13.70 13.54 -- 12.00 12.64 -- Base 6.00 6.00 -- 6.00 6.00 --
17 Gran Subbase 0.00 0.00 -- 0.00 0.00 --