sample workv1 - eco
DESCRIPTION
Current Interactive Customer Brochure Design and DistributionTRANSCRIPT

Crystal Cove advisorsDefensive Credit Strategy
1101 Dove Street #120 | Newport Beach, CA 92660 | www.crystalcoveadvisors.comCrystal Cove Advisors offers securities through LPL Financial Member FINRA/SIPIC

Disclosures
The periods displayed in this brochure are hypothetical (back tested). Please note the following cautions based on SEC requirements: a) Back tested performance does not represent actual performance and should not be interpreted as an indication of such performance; b) there is no assurance that these back tested results could, or would have been achieved by Crystal Cove during the years presented: c) the back tested performance data does not represent the impact that material economic and market factors might have on the investment advisor’s decision making if the advisor were actually managing client’s money; d) the SEC mandates that we state: The investment strategy that the back tested results were based upon can (theoretically) be changed at any time with the benefit of hindsight in order to show better back tested performance and (theoretically) the strategy can continue to be tested and adjusted until the desired results are achieved. Please note at Crystal Cove Advisors, no such “data fitting” adjustments have in fact been made.
Although the strategy can invest in a wide rage of fixed income investment the charts and data are only based off of a high yield fixed income mutual fund. The strategies performance could vary based on fund selection and asset class. Risks in investing in fixed income investment include: Credit risk, interest rate risk, default risk, inflation risk, call risk, prepayment risk and reinvestment risk. You should carefully consider investment objectives, risks, and charges and expenses before investing.
Performance results included in this brochure reflect a Crystal Cove management fee of 1%. Fees are higher for accounts under $5 million and range from 1% to 2%. Please inquire for more details on management fees.
Crystal Cove Advisors offers securities through LPL Financial Member FINRA/SIPIC
1
Dear Investor,
Over the last 11 years, I have worked with investors in achieving their strategic investment objectives and discovered a unique method to produce solid results while minimizing risk. We call this method the “Crystal Cove Defensive Credit Strategy.” I believe in the adage that “what you keep is more important that what you make” and I have dedicated my career to becoming an expert in investment methodologies that produce impressive results while maintaining low volatility and risk. Crystal Cove Advisors is unique in the manner that we analyze risk. We focus our research on analyzing fixed income markets to expose risk so that we can mitigate that risk and implement asset growth strategies to benefit our clients. Our goal is to deliver favorable returns while giving clients the peace of mind that comes with a capital preservation strategy.
The objective of our Credit Strategy is to outperform money market funds and 90-day Treasury Bills by 6-7% and produce total annual returns of 8-12%, exposing our client’s portfolios to cyclical losses of no more than 3-4%.
Over the past decade, the Defensive Credit Strategy has produced an annualized return of +13.22% with less than a 2.6% peak to trough volatility. During this period the model beat the Vanguard Money Market index fund by over 10% annually and significantly outperformed the S&P 500 which was nearly flat during the decade.
The Crystal Cove Defensive Credit Strategy is ideally suited for clients looking for a low volatility and risk adverse investment that has an absolute return philosophy as well as the advantage of daily liquidity. We have a strict defensive mandate and are committed to staying disciplined to minimize risk. We invite you to explore our firm and strategy and look forward to meeting with you to answer any questions you may have.
Sincerely,
Elias HakimianPresidentCrystal Cove Advisors
Crystal Cove Advisors
Crystal Cove Advisors offers securities through LPL Financial Member FINRA/SIPIC
2
Crystal Cove Advisors is an investment management firm located in Newport Beach California. Crystal Cove is committed to providing clients with investment strategies that focus on limiting risk while producing impressive results. We realize that our clients have worked hard to create their wealth and we want to help them safely grow their assets. Our goal is simple: produce meaningful asset growth with a defensive strategy that focuses on minimizing risk.
Investment Philosophy In today’s ever changing financial market-place, the importance of implementing risk-limiting strategies has become increasingly necessary. We believe that monitoring risk and protecting our clients from excessive loss is the most sensible approach in today’s volatile times. We believe that if we can minimize our client’s downside volatility in a negative market, we will be in an ideal position to capture significant gains during up market cycles and produce solid an-nualized returns.
Investment Strategy The Crystal Cove Advisors Defensive Credit Strategy carefully tracks a variety of data to manage fixed income mutual fund investments. We utilize fixed income mutual funds for four main reasons:
Our defensive strategy focuses on the utilization of risk limiting indicators. These indicators prompt us to move in and out of cash or short-term fixed income funds as a defensive mechanism to maintain and protect principal during times of negative market volatility. We are typically either 100% invested in fixed income mutual funds or 100% in a defensive position such as cash. When our indicators predict negative market volatility, our system prompts us to be defensive and move into cash or other protective instruments. We monitor our indicators on a intraday basis to determine our risk exposure as well as to expose any opportunities that the market presents.
aboutCrystal Cove advisors
1. Diversification 2. Daily accrual of interest and dividends 3. Daily pricing of bonds 4. Liquidity
Crystal Cove Advisors offers securities through LPL Financial Member FINRA/SIPIC
3
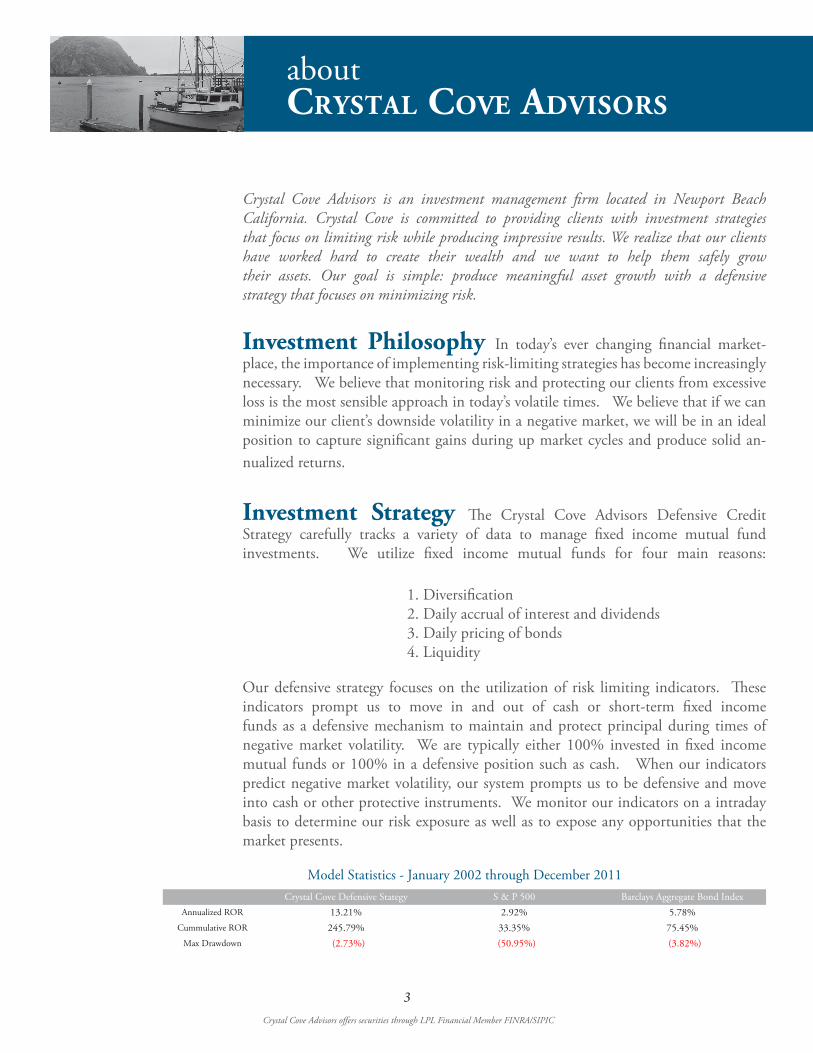
Crystal Cove Defensive Stategy S & P 500 Barclays Aggregate Bond IndexAnnualized ROR 13.21% 2.92% 5.78%
Cummulative ROR 245.79% 33.35% 75.45%Max Drawdown (2.73%) (50.95%) (3.82%)
Model Statistics - January 2002 through December 2011

investment overview
Goals and Objectives Crystal Cove’s objective is to outperform 90 day treasuries and money market index funds by 6-7% which historically would represent an 8-12% annualized return. We target this return while seeking to limit our client’s portfolios to maximum drawdowns of no more then 3-4%. Asset protection is our primary focus.
Safety Crystal Cove’s strategy allows investment in a broad range of fixed income as-set classes. However, we predominately invest in high yield corporate bonds funds which can be one of the most risky bond assets classes if not managed properly. Crystal Cove utilizes an algorithm-based methodology to harvest the benefits of high-yield bonds while minimizing the inherent risks of this asset class.
Fixed income mutual funds historically move more slowly than most other investment asset classes which allows Crystal Cove to take defensive positions before any significant losses occur. Below is a performance chart that shows monthly movements over the last ten years. The largest monthly drawdown for the time period displayed was -2.58%.
Crystal Cove Advisors offers securities through LPL Financial Member FINRA/SIPIC
4
-4.00%
-2.00%
0.00%
2.00%
4.00%
6.00%
8.00%
10.00%
12.00%
2002 2003 2004 2005 2006 2007 2008 2009 2010 2011
Crystal Cove Defensive Strategy | Monthly Performance 2002-2011

investment overview
Growth - Although safety is our primary goal, absolute return and long-term growth is a focus. Protecting from downside volatility adds to overall growth. Active management and the utilization of a strict sell disci-plines are key components of an effective growth strategy. Over the last de-cade, the S&P 500 was nearly flat and peak losses during the market cycle were over 50%. During the same period, the Crystal Cove Advisors Defensive Credit Strategy enjoyed an annualized return of over 13% while experiencing maximum peak to trough losses of less than 3%.
Liquidity - Liquidity is a key component of the Crystal Cove strategy. We believe that ready access to your money without any fees or penalties is essential. Because we utilize mutual funds, our model gives us the liquidity we desire without the limitations of individual bonds issues. Once we sell our positions, funds are available immediately after settlement.
Security - Safety is extremely important and a key focus of our strategy. In today’s marketplace, many investments comingle multiple client’s assets into one fund and manage the pool together. At Crystal Cove we do not manage a fund or collective pool. We manage separately held individual client accounts. Furthermore Crystal Cove does not custody our investor’s accounts. Our cli-ents maintain complete control. Each account is held in the investor’s name at LPL Financial, one of the top brokerage firms in the U.S. This allows our cli-ents to not only have direct access and control over their assets but to also have assess to real time balances and the activity in their account.
About LPL - LPL Financial is the largest independent brokerage firm in the U.S. servicing 4.2 million accounts with $340.8 billion in advisory and/or brokerage assets. LPL is also recognized as one of the top ranked full service investment firms in the U.S. according to by J.D. Power and Associates, placing higher than Morgan Stanley, Smith Barney, Fidelity, Wells Fargo or Charles Schwab.
Crystal Cove Advisors offers securities through LPL Financial Member FINRA/SIPIC
5

Red and Green Line (Active Management)Represents the Crystal Cove Defensive Credit Strategy. The red portion of the chart represents the time period when Crystal Cove was fully invested in high yield bond funds and the green portion of the chart represents the time periods that the strategy was in a defensive position such as cash or short term bonds. During this period, the strategy’s performance was +13.22% annualized with a cumulative return of 232% with a maximum drawdown of -2.58%.
The Red Line (Buy and Hold)Represents the traditional buy and hold strategy of high yield bond funds. During this period, the high yield bond fund performance was +6.46% annualized with a 154% cumulative return and a maximum drawdown of -33.07%.
The Blue Line (Buy & Hold)Represents the traditional buy and hold strategy of the S&P 500. During this period, the S&P 500 performance was +1.41% annualized with a cumulative return of 15.08% and a maximum drawdown of -50.95%.
Crystal Cove Advisors offers securities through LPL Financial Member FINRA/SIPIC
Buy & Hold vs. Active Management
6
Year Jan Feb Mar Apr May Jun Jul Aug Sep Oct Nov Dec Year S&P 500
2002 0.38% 0.39% (1.23%) 1.10% 0.12% 0.48% 1.10% 1.10% (1.12%) (0.36%) 2.99% 0.00% 5.00% (22.10%)
2003 2.16% 0.10% 2.09% 4.79% 1.30% 3.23% (1.24%) 0.13% 3.15% 1.83% 0.60% 2.98% 23.10% 28.69%
2004 1.74% (0.78%) 0.36% (1.40%) (0.24%) (0.24%) 1.74% 1.72% 1.68% 2.21% 0.56% 1.61% 9.23% 10.88%
2005 (0.29%) 1.06% (0.92%) 0.72% 0.48% 1.59% 1.56% 0.52% (0.39%) (0.24%) 0.12% 1.02% 5.32% 4.91%
2006 1.02% 1.50% 0.50% 0.49% 0.23% 0.23% 0.93% 1.46% 0.96% 1.43% 1.41% 0.93% 11.68% 15.79%
2007 1.83% 1.35% 0.45% 1.33% 0.87% 0.01% 0.88% 0.99% 1.33% 0.87% 0.38% 0.52% 11.36% 5.49%
2008 1.86% 0.61% 0.49% 2.45% 0.91% 0.83% 0.32% 0.52% 0.21% 0.01% 1.62% 2.30% 12.78% (37.00%)
2009 0.84% (1.11%) (0.47%) 10.06% 7.69% 3.34% 5.51% 0.88% 4.34% 1.66% 0.42% 2.84% 41.75% 26.46%
2010 0.80% (0.50%) 2.04% 1.14% (2.37%) 0.82% 1.82% (0.01%) 2.24% 2.91% (0.43%) 0.54% 9.25% 15.06%
2011 2.36% 1.27% (0.25%) 1.64% 0.23% 0.00% 0.18% (1.34%) 0.00% 2.82% (2.73%) 2.82% 7.07% 2.11%
Crystal Cove Defensive Credit Strategy | Monthly Performance
Cum
ulat
ive R
etur
n
Crystal Cove S&P 500 TR Barclays Aggregate Bond Index
250%
200%
150%
100%
50%
0%
-50%
Annual ROR 7.18% 5.00% 23.10% 9.23% 5.32% 11.68% 11.36% 12.78% 41.75% 9.25% 7.07%
Crystal Cove
Advisors
Barclays High Yeild
Fund
S & P 500

Potential for Growth in all Markets The Crystal Cove strategy is unique in its ability to perform in different types of markets: bull markets, bear markets, flat markets, and dur-ing periods of rising or falling interest rates. For instance, when most stocks and mutual funds were clobbered in 2008 and the S&P was down 37%, the model was up over 12%. In 2002, the S&P was down 22% and Crystal Cove strategy was up 5%. Even when interest rates rose from 2006-2008 the strategy performed and produced annual results during that four year period of 10.93 annualized.
Crystal Cove is proud of the results we have produced for our clients over the last decade. Arguably, the last 10 years has been the most challenging investment time of our generation and many individu-als lost a significant amount of their wealth over this period. We are pleased that we have succeeded in the difficult markets where many managers struggled and lost. We are very pleased with the 13% plus annualized return that our Defensive Credit model generated from 2001 through 2010. We remain vigilant to our defensive positioning yet poised to continue to harvest the upside returns that result from our unique strategy.
Crystal Cove Advisors offers securities through LPL Financial Member FINRA/SIPIC
Major Events Affecting Stock Market - 2001 through 2010
$0
$500
$1,000
$1,500
$2,000
$2,500
$3,000
$3,500
$4,000
High Yield Fund S&P 500CCA Defensive Strategy
Burst of dot.com bubble
September 11 Terrorist Attacks
Enron: emergence of Corp Fraud/Governance
Stock Market Crash of 2002
Burst of Housing Bubble
Subprime Housing Crisis
Growth in Developing Countries:
China/India
Federal Fund Rate rises from1.00% to 5.25%
between Jun 04 and Aug 08
Global Recession & Collapse of Wall
Street
CCA Defensive Strategy$3,462 Cumulative Growth13.22% Annualized ROR
High Yield Fund$1,984 Cumulative Growth7.09% Annualized ROR
S&P 500$1,151 Cumulative Growth1.41% Annualized ROR
7

Crystal Cove Advisors offers securities through LPL Financial Member FINRA/SIPIC
NOTES:
8

Crystal Cove Advisors offers securities through LPL Financial Member FINRA/SIPIC
NOTES:
9

Crystal Cove Advisors offers securities through LPL Financial Member FINRA/SIPIC
NOTES:
9

1101 Dove Street, Ste. 120Newport Beach, CA 92660
Phone (949) 387-0010 Fax (949) 387-0009
www.crystalcoveadvisors.com
Crystal Cove Advisors offers securities through LPL Financial Member FINRA/SIPIC