sampling. fair sampling produces a sample which represents the population in all important ways
TRANSCRIPT

Sampling

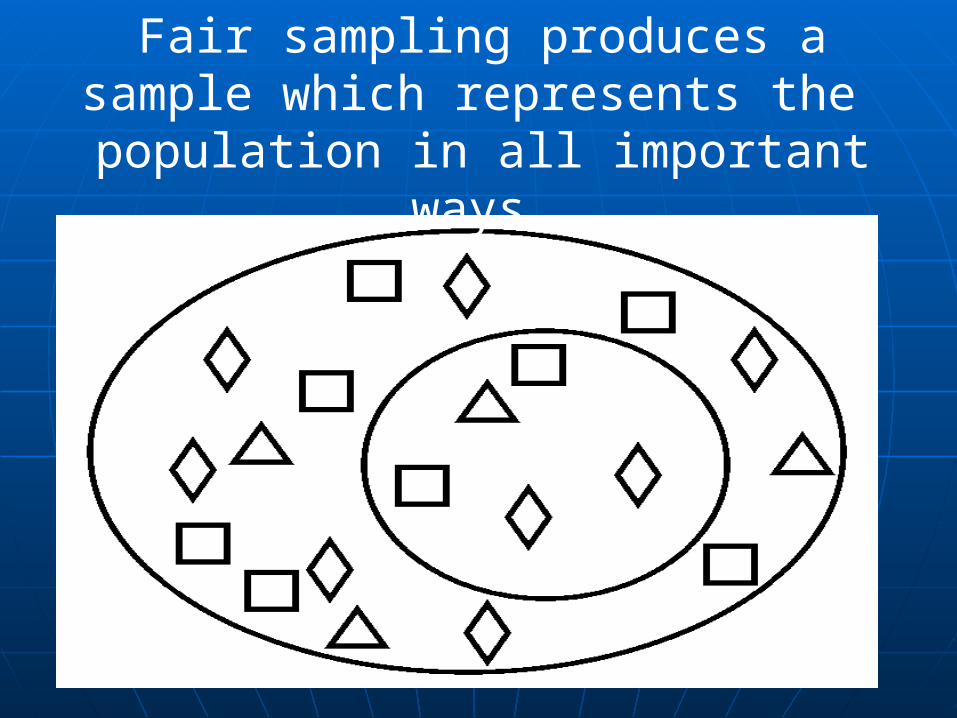
Fair sampling produces a sample which represents the
population in all important ways.
Fair sampling produces a sample which represents the
population in all important ways.

Constructing a Sample

Constructing a Sample
1. Define the general universe.

Constructing a Sample
1. Define the general universe.
2. Identify an observable working universe.

Constructing a Sample
1. Define the general universe.
2. Identify an observable working universe.
3. Choose the sampling unit.

Constructing a Sample
1. Define the general universe.
2. Identify an observable working universe.
3. Choose the sampling unit.
4. Develop or find a sampling frame.

Constructing a Sample1.Define the general universe.

Constructing a Sample1.Define the general universe.
U.S. school teachers

Constructing a Sample1.Define the general universe.
U.S. school teachers
2. Identify an observable working universe.

Constructing a Sample1.Define the general universe.
U.S. school teachers
2. Identify an observable working universe.
teachers who belong to national teacher associations

Constructing a Sample1.Define the general universe.
U.S. school teachers
2. Identify an observable working universe.
teachers who belong to national teacher associations
3. Choose the sampling unit.

Constructing a Sample1.Define the general universe.
U.S. school teachers
2. Identify an observable working universe.
teachers who belong to national teacher associations
3. Choose the sampling unit.
a single teacher

Constructing a Sample1.Define the general universe.
U.S. school teachers
2. Identify an observable working universe.
teachers who belong to national teacher associations
3. Choose the sampling unit.
a single teacher
4. Develop or find a sampling frame.
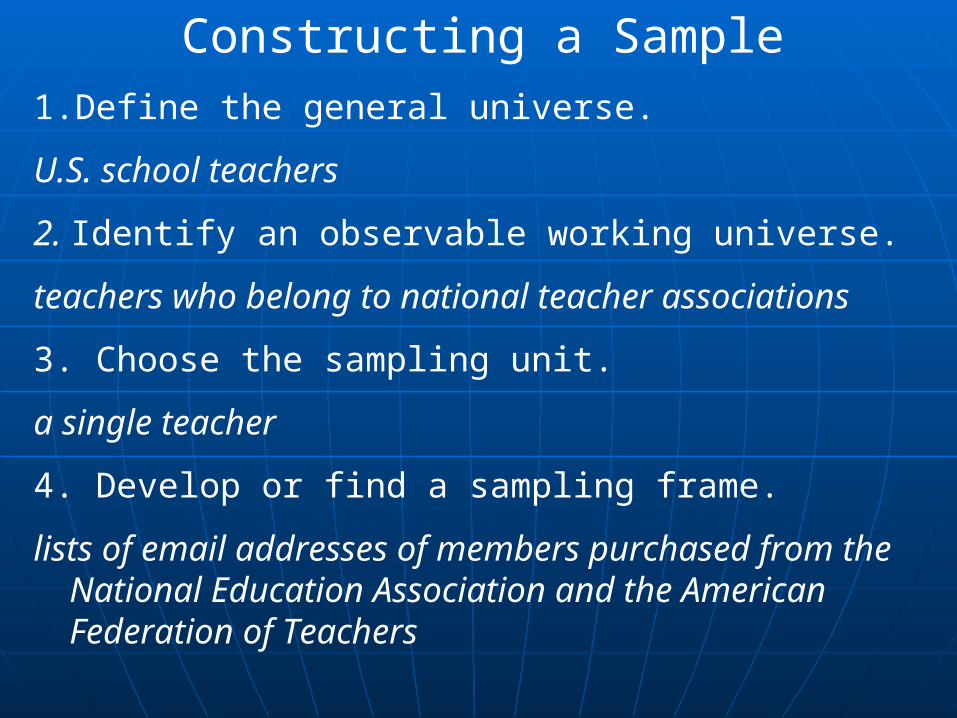
Constructing a Sample1.Define the general universe.
U.S. school teachers
2. Identify an observable working universe.
teachers who belong to national teacher associations
3. Choose the sampling unit.
a single teacher
4. Develop or find a sampling frame.
lists of email addresses of members purchased from the National Education Association and the American Federation of Teachers

Survey Jargon
From the sampling frame, you choose who to solicit for participation.
You ask these people to participate in your study or reply to your survey.
Of those you contact and solicit for participation, some will participate and some will not.
Those who choose to participate are respondents.
Of all those who were solicited, the percentage who became respondents is your response rate.
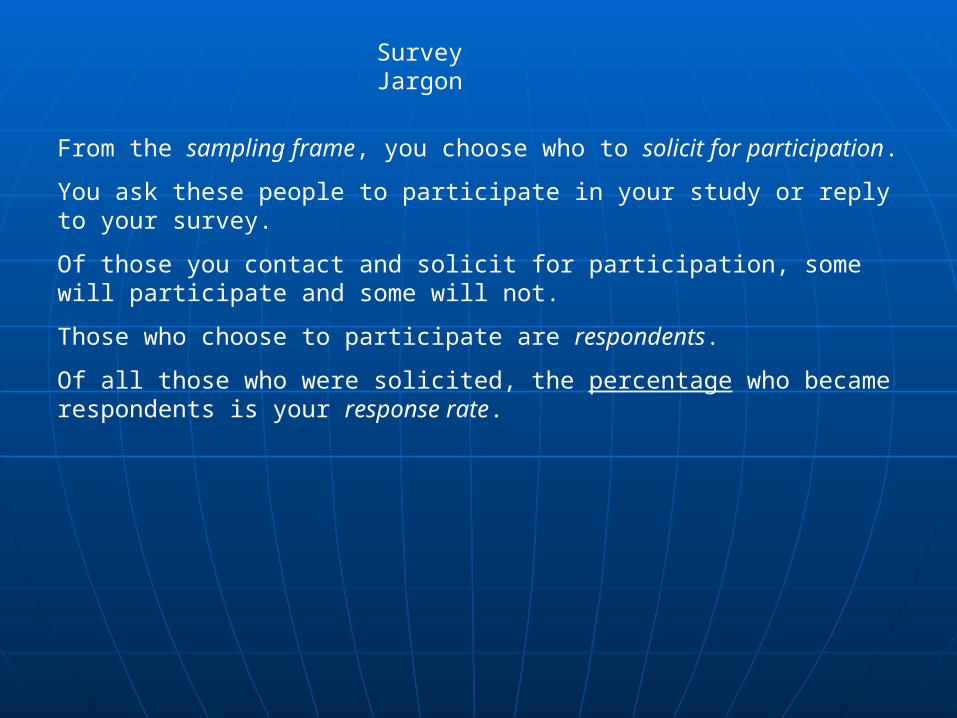
Survey Jargon

From the sampling frame, you choose who to solicit for participation.
You ask these people to participate in your study or reply to your survey.
Of those you contact and solicit for participation, some will participate and some will not.
Those who choose to participate are respondents.
Of all those who were solicited, the percentage who became respondents is your response rate.
Number responding to survey
Number solicited for participation
Survey Jargon
Response Rate =

Sampling Strategies

Sampling Strategiesrandom
systematic
stratified random
cluster
judgment
convenience
Sampling Strategiesrandom
Number all email addresses and randomly produce numbers
systematic
stratified random
cluster
judgment
convenience

Sampling Strategiesrandom
Number all email addresses and randomly produce numbers
systematic
Pick every 50th email address.
stratified random
cluster
judgment
convenience

Sampling Strategiesrandom
Number all email addresses and randomly produce numbers
systematic
Pick every 50th email address.
stratified random
Group teachers by teaching level- elementary & secondary.Randomly select from each group.
cluster
judgment
convenience

Sampling Strategiesrandom
Number all email addresses and randomly produce numbers
systematic
Pick every 50th email address.
stratified random
Group teachers by teaching level- elementary & secondary.Randomly select from each group.
cluster
Start with a working universe of all schools.Randomly select schools and survey all teachers in that school.
judgment
convenience

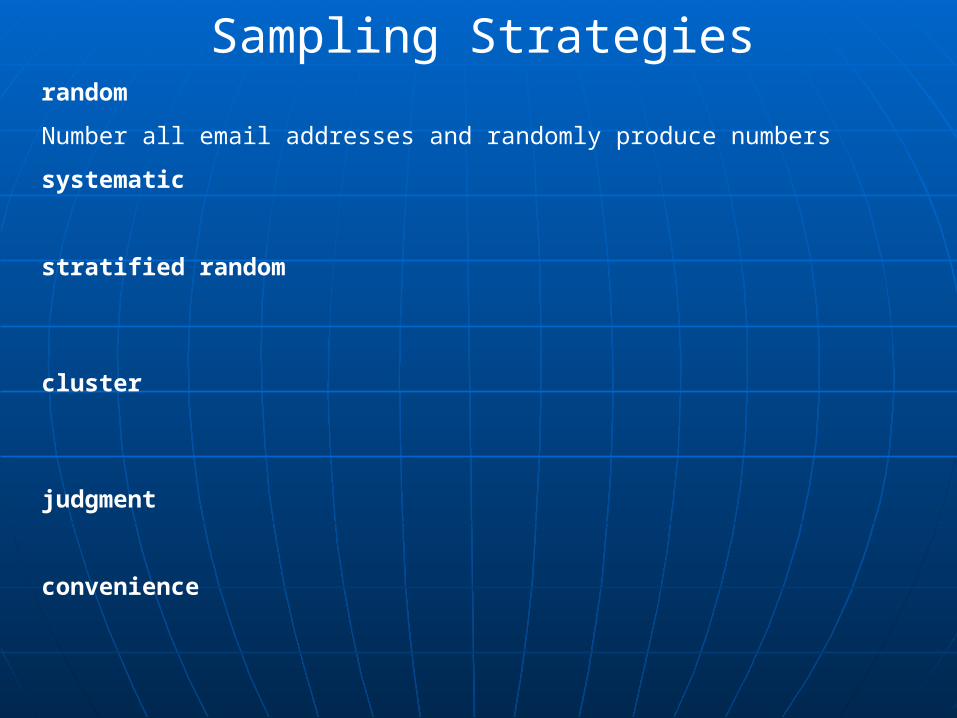
Sampling Strategiesrandom
Number all email addresses and randomly produce numbers
systematic
Pick every 50th email address.
stratified random
Group teachers by teaching level- elementary & secondary.Randomly select from each group.
cluster
Start with a working universe of all schools.Randomly select schools and survey all teachers in that school.
judgment
Recruit the teachers who appear to be in touch with today’s issues.
convenience
Recruit the teachers in your school.

Sample Size

Sample Size
If the research goal is to describe a population, the primary concern when determining a sample size is describing the population with precision.

Sample Size
If the research goal is to describe a population, the primary concern when determining a sample size is describing the population with precision.
The primary concern when determining a sample size is sampling error.

Sample Size
The larger the sample, the closer the sample values are to the true population values.

Sample Size
The larger the sample, the closer the sample values are to the true population values.
The larger the sample, the smaller the sampling error.

Sample Size
The larger the sample, the closer the sample values are to the true population values.
The larger the sample, the smaller the sampling error.
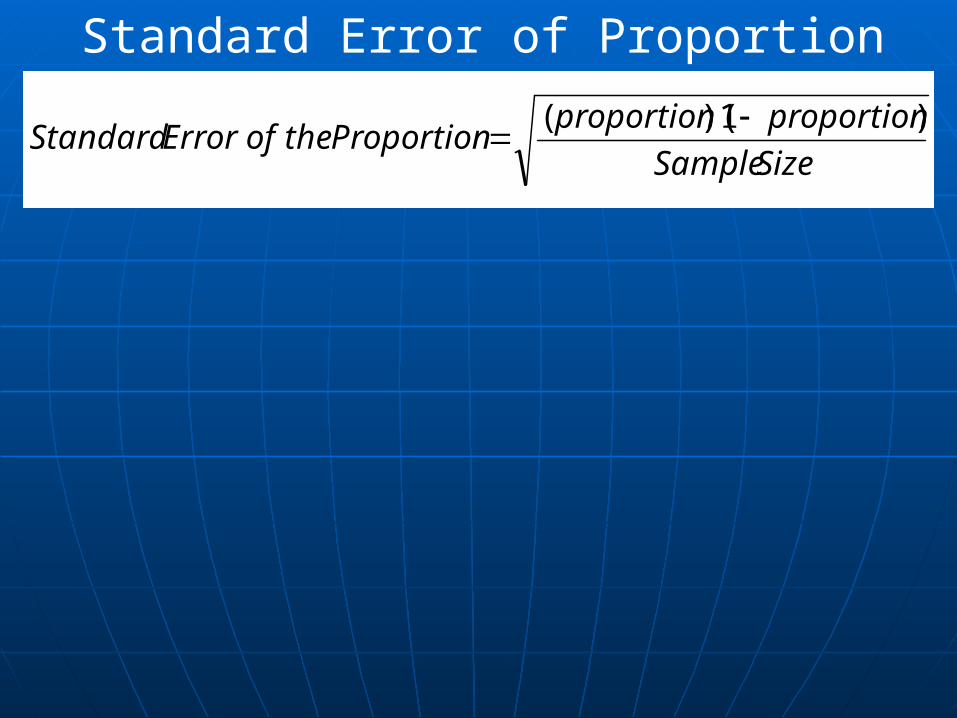
A common formula for calculating sampling error for surveys is the standard error of proportion.

Standard Error of Proportion
Standard Error of Proportion
SizeSample
proportionproportionProportionthe of Error Standard
)1)((

Standard Error of Proportion
SizeSample
proportionproportionProportionthe of Error Standard
)1)((
Sample FindingSample Finding Sample Sample SizeSize
ProportionProportion 1-Proportion1-Proportion Standard Standard ErrorError
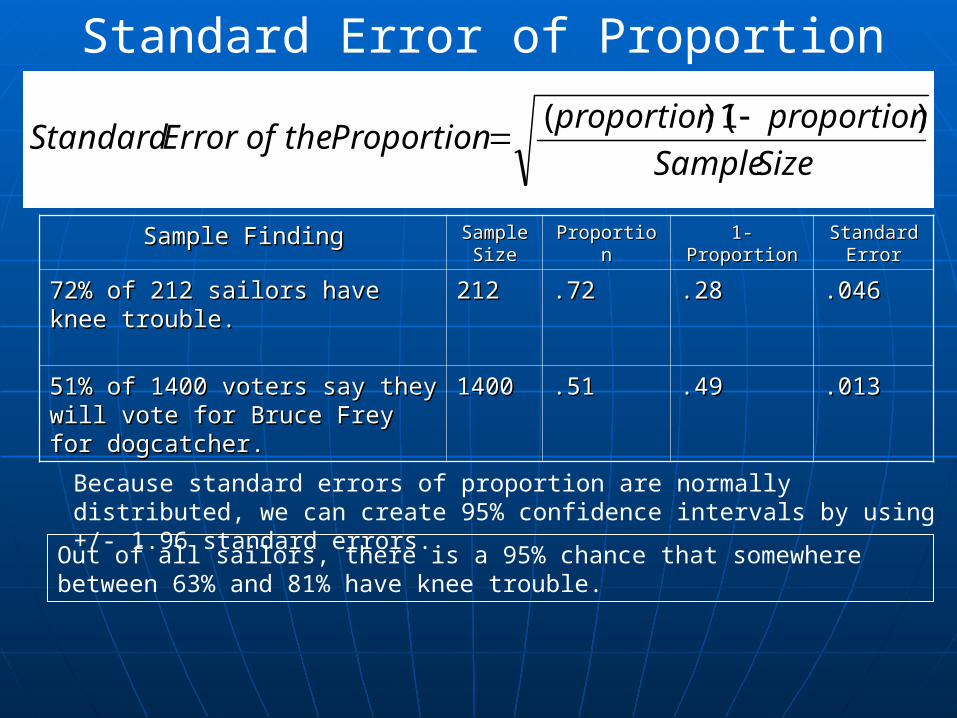
72% of 212 sailors have knee 72% of 212 sailors have knee trouble.trouble.
212212 .72.72 .28.28 .046.046

Standard Error of Proportion
SizeSample
proportionproportionProportionthe of Error Standard
)1)((
Sample FindingSample Finding Sample Sample SizeSize
ProportionProportion 1-Proportion1-Proportion Standard Standard ErrorError
72% of 212 sailors have knee 72% of 212 sailors have knee trouble.trouble.
212212 .72.72 .28.28 .046.046
51% of 1400 voters say they 51% of 1400 voters say they will vote for Bruce Frey for will vote for Bruce Frey for dogcatcher.dogcatcher.
14001400 .51.51 .49.49 .013.013
Because standard errors of proportion are normally distributed, we can create 95% confidence intervals by using +/- 1.96 standard errors.
Out of all sailors, there is a 95% chance that somewhere between 63% and 81% have knee trouble.
I am 95% confident, that if we had surveyed all voters, somewhere between 48% and 54% would say they plan to vote for Frey.
“Margin of Error: +/- 2.5%”

Sampling Problem

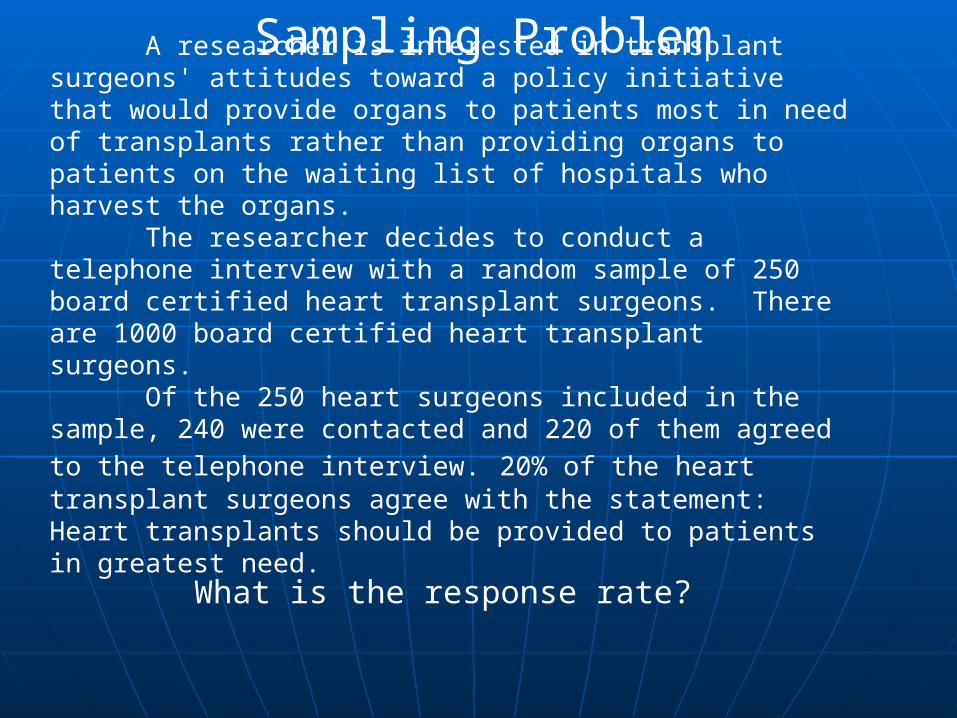
Sampling ProblemA researcher is interested in transplant surgeons'
attitudes toward a policy initiative that would provide organs to patients most in need of transplants rather than providing organs to patients on the waiting list of hospitals who harvest the organs.
The researcher decides to conduct a telephone interview with a random sample of 250 board certified heart transplant surgeons. There are 1000 board certified heart transplant surgeons.
Of the 250 heart surgeons included in the sample, 240 were contacted and 220 of them agreed to the telephone interview. 20% of the heart transplant surgeons agree with the statement: Heart transplants should be provided to patients in greatest need.
What is the sampling frame?
Sampling ProblemA researcher is interested in transplant surgeons'
attitudes toward a policy initiative that would provide organs to patients most in need of transplants rather than providing organs to patients on the waiting list of hospitals who harvest the organs.
The researcher decides to conduct a telephone interview with a random sample of 250 board certified heart transplant surgeons. There are 1000 board certified heart transplant surgeons.
Of the 250 heart surgeons included in the sample, 240 were contacted and 220 of them agreed to the telephone interview. 20% of the heart transplant surgeons agree with the statement: Heart transplants should be provided to patients in greatest need.
What is the response rate?
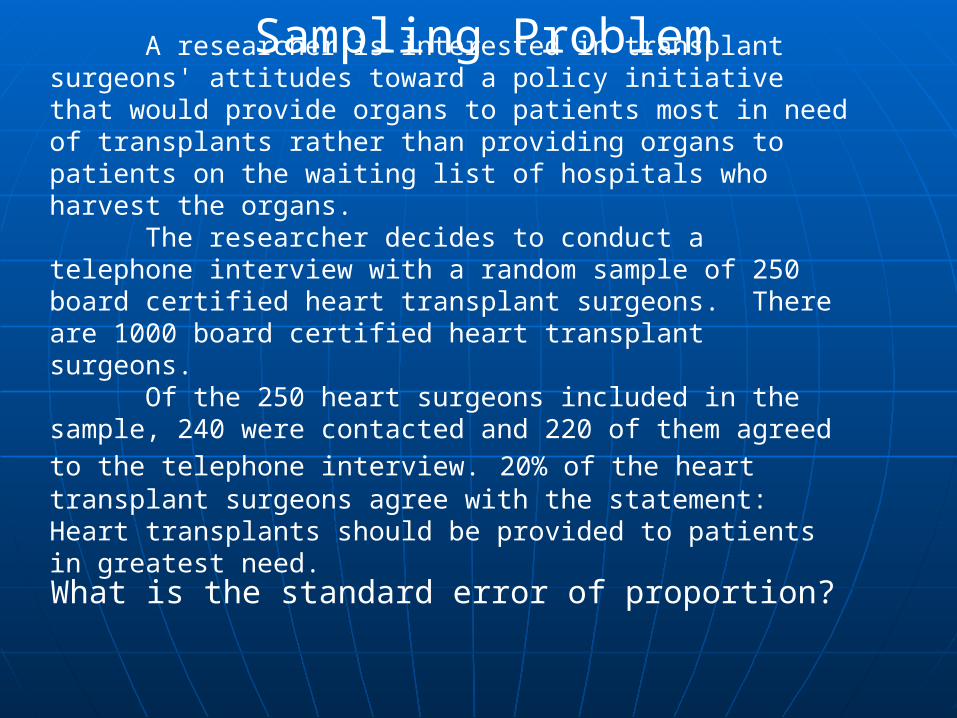
Sampling ProblemA researcher is interested in transplant surgeons'
attitudes toward a policy initiative that would provide organs to patients most in need of transplants rather than providing organs to patients on the waiting list of hospitals who harvest the organs.
The researcher decides to conduct a telephone interview with a random sample of 250 board certified heart transplant surgeons. There are 1000 board certified heart transplant surgeons.
Of the 250 heart surgeons included in the sample, 240 were contacted and 220 of them agreed to the telephone interview. 20% of the heart transplant surgeons agree with the statement: Heart transplants should be provided to patients in greatest need.
What is the standard error of proportion?
Sampling Problem

Sampling Problem
A school district wishes to conduct a survey to assess alcohol use by its students. A random sample of all students (equal numbers of boys and girls) will be solicited for participation and asked if they drink beer on the week-ends. The evaluators consult with you to determine an adequate total sample size. Assume you wish to have a margin of error of +/- 5%. What sample size would you suggest?
Use the default assumption of 50% (Yes’s or No’s) for your estimates.

Sampling Problem
Assume you wish to have a margin of error of +/- 5%. What sample size would you suggest?
Use the default assumption of 50% (Yes’s or No’s) for your estimates.
Sample Sample SizeSize
ProportionProportion 1-Proportion1-Proportion Proportion * Proportion * 1-Proportion1-Proportion
Standard Standard ErrorError
Margin of Error Margin of Error (1.96* SE)(1.96* SE)
100100 .50.50 .50.50 .25.25 .05.05 .098.098
200200 .50.50 .50.50 .25.25 .0353.0353 .069.069
300300 .50.50 .50.50 .25.25 .029.029 .057.057
400400 .50.50 .50.50 .25.25 .025.025 .049.049
390390 .50.50 .50.50 .25.25 .0253.0253 .05.05
Margin of error = .05.05/1.96 = .0255, so I want a Standard Error of around .0255

Sampling Problem
Assume you wish to have a margin of error of +/- 5%. What sample size would you suggest?
Use the default assumption of 50% (Yes’s or No’s) for your estimates.
Margin of error = .05.05/1.96 = .0255, so I want a Standard Error of around .0255

Sampling Problem
Assume you wish to have a margin of error of +/- 5%. What sample size would you suggest?
Use the default assumption of 50% (Yes’s or No’s) for your estimates.
Sample Sample SizeSize
ProportionProportion 1-Proportion1-Proportion Proportion * Proportion * 1-Proportion1-Proportion
Standard Standard ErrorError
Margin of Error Margin of Error (1.96* SE)(1.96* SE)
100100 .50.50 .50.50 .25.25 .05.05 .098.098
200200 .50.50 .50.50 .25.25 .0353.0353 .069.069
300300 .50.50 .50.50 .25.25 .029.029 .057.057
400400 .50.50 .50.50 .25.25 .025.025 .049.049
390390 .50.50 .50.50 .25.25 .0253.0253 .05.05
Margin of error = .05.05/1.96 = .0255, so I want a Standard Error of around .0255

Sampling Problem
SizeSample
proportionproportionProportionthe of Error Standard
)1)((

Sampling Problem
SizeSample
proportionproportionProportionthe of Error Standard
)1)((
2)()1)((
Proportion of Error StandardChosenproportionproportionSizeSampleMinimum