sampling sources: -epiet introductory course, thomas grein, denis coulombier, philippe sudre, mike...
TRANSCRIPT

Sampling
Sources: -EPIET Introductory course, Thomas Grein, Denis Coulombier, Philippe Sudre, Mike Catchpole-IDEA Brigitte Helynck, Philippe Malfait, Institut de veille sanitaire
Modified: Denise Antona, EPIET 2003
Objectives of presentation
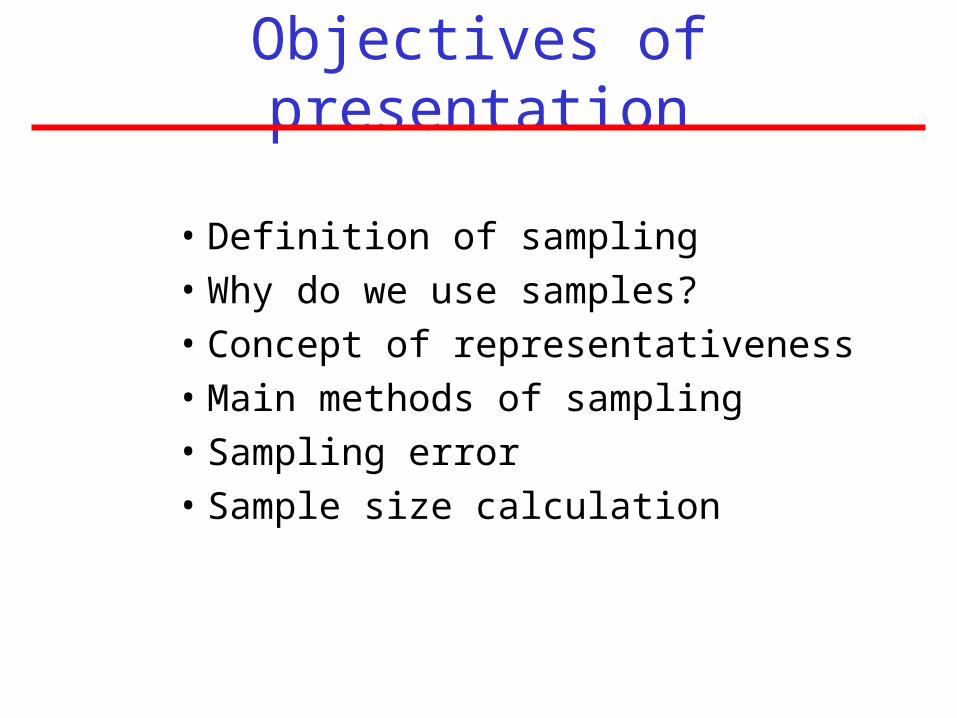
• Definition of sampling• Why do we use samples?• Concept of representativeness• Main methods of sampling• Sampling error• Sample size calculation

Definition of sampling
Procedure by which some members
of a given population are selected as representatives of the entire population

Definition of sampling terms
• Sampling unit– Subject under observation on which information is
collected
• Sampling fraction– Ratio between the sample size and the population
size
• Sampling frame – Any list of all the sampling units in the population
• Sampling scheme– Method of selecting sampling units from sampling
frame

Why do we use samples ?
Get information from large populations
– At minimal cost
– At maximum speed
– At increased accuracy
– Using enhanced tools

Sampling
PrecisionCost

What we need to know
• Concepts
– Representativeness
– Sampling methods
– Choice of the right design
• Calculations
– Sampling error
– Design effect
– Sample size
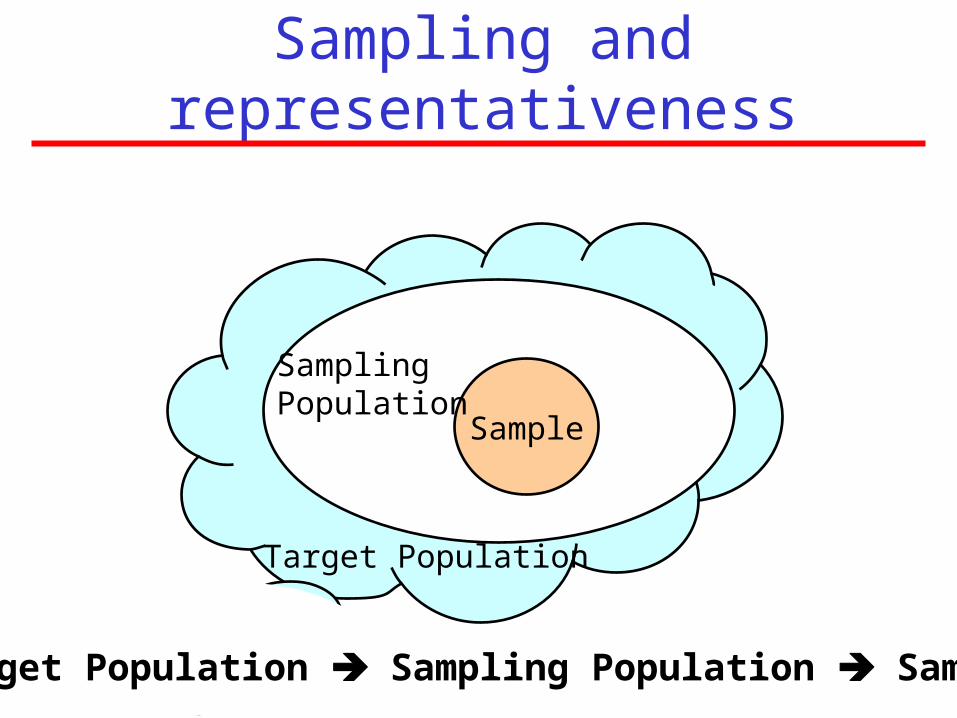
Sampling and representativeness
Sample
Target Population
SamplingPopulation
Target Population Sampling Population Sample

Representativeness
• Person• Demographic characteristics (age, sex…)• Exposure/susceptibility
• Place (ex : urban vs. rural)• Time
• Seasonality• Day of the week• Time of the day
Ensure representativeness before starting, confirm once completed !!!!!!

Types of samples
• Non-probability samples
• Probability samples

Non probability samples
• Quotas • Sample reflects population structure• Time/resources constraints
• Convenience samples (purposive units)• Biased• Best or worst scenario
Probability of being chosen : unknown

Probability samples
• Random sampling
• Each subject has a known probability of being chosen
• Reduces possibility of selection bias
• Allows application of statistical theory to results

Sampling error
• No sample is the exact mirror image of the population
• Magnitude of error can be measured in probability samples
• Expressed by standard error– of mean, proportion, differences, etc
• Function of– amount of variability in measuring factor of interest– sample size

Methods used in probability samples
• Simple random sampling• Systematic sampling• Stratified sampling• Multistage sampling• Multiphase sampling• Cluster sampling

Quality of an estimate
Precision & validity
No precision
Random error !
Precision butno validity
Systematicerror (Bias) !

Simple random sampling
• Principle–Equal chance of drawing each unit
• Procedure–Number all units–Randomly draw units

Simple random sampling
• Advantages–Simple–Sampling error easily measured
• Disadvantages–Need complete list of units–Does not always achieve best representativeness–Units may be scattered

Example: evaluate the prevalence of tooth decay among the 1200 children attending a school
• List of children attending the school• Children numerated from 1 to 1200• Sample size = 100 children• Random sampling of 100 numbers between 1
and 1200
How to randomly select?
Simple random sampling

Simple random sampling

57172 42088 70098 11333 26902 29959 43909 4960733883 87680 28923 15659 09839 45817 89405 7074377950 67344 10609 87119 15859 74577 42791 7588911607 11596 01796 24498 17009 67119 00614 4952956149 55678 38169 47228 49931 94303 67448 3128680719 65101 77729 83949 83358 75230 56624 2754993809 19505 82000 79068 45552 86776 48980 5668440950 86216 48161 17646 24164 35513 94057 5183412182 59744 65695 83710 41125 14291 74773 6639113382 48076 73151 48724 35670 38453 63154 5811638629 94576 48859 75654 17152 66516 78796 7309960728 32063 12431 23898 23683 10853 04038 7524601881 99056 46747 08846 01331 88163 74462 1455123094 29831 95387 23917 07421 97869 88092 7220115243 21100 48125 05243 16181 39641 36970 9952253501 58431 68149 25405 23463 49168 02048 3152207698 24181 01161 01527 17046 31460 91507 1605022921 25930 79579 43488 13211 71120 91715 4988168127 00501 37484 99278 28751 80855 02035 1091055309 10713 36439 65660 72554 77021 46279 2270592034 90892 69853 06175 61221 76825 18239 4768750612 84077 41387 54107 09190 74305 68196 7563481415 98504 32168 17822 49946 37545 47201 8522438461 44528 30953 08633 08049 68698 08759 4561107556 24587 88753 71626 64864 54986 38964 8353460557 50031 75829 05622 30237 77795 41870 26300
Table of random numbers

EPITABLE: random number listing

EPITABLE: random number listing

Systematic sampling
• N = 1200, and n = 60 sampling fraction = 1200/60 = 20
• List persons from 1 to 1200• Randomly select a number between 1 and
20 (ex : 8)
1st person selected = the 8th on the list 2nd person = 8 + 20 = the 28th
etc .....

Systematic sampling

1 2 3 4 5 6 7 8 9 10 11 12 13 14 15
31 32 33 34 35 36 37 38 39 40 41 42 43 44 45
16 17 18 19 20 21 22 23 24 25 26 27 28 29 30
46 47 48 49 50 51 52 53 54 55 ……..

Systematic samplingExample: systematic sampling

Stratified sampling
• Principle :
–Classify population into internally homogeneous subgroups (strata)
–Draw sample in each strata–Combine results of all strata

Stratified sampling
• Advantages– More precise if variable associated with
strata– All subgroups represented, allowing
separate conclusions about each of them
• Disadvantages– Sampling error difficult to measure– Loss of precision if very small numbers
sampled in individual strata

Example: Stratified sampling
• Determine vaccination coverage in a country
• One sample drawn in each region
• Estimates calculated for each stratum
• Each stratum weighted to obtain estimate for country (average)

Multiple stage sampling
Principle
• = consecutive samplings
• example : sampling unit = household
– 1rst stage : drawing areas or blocks – 2nd stage : drawing buildings, houses – 3rd stage : drawing households
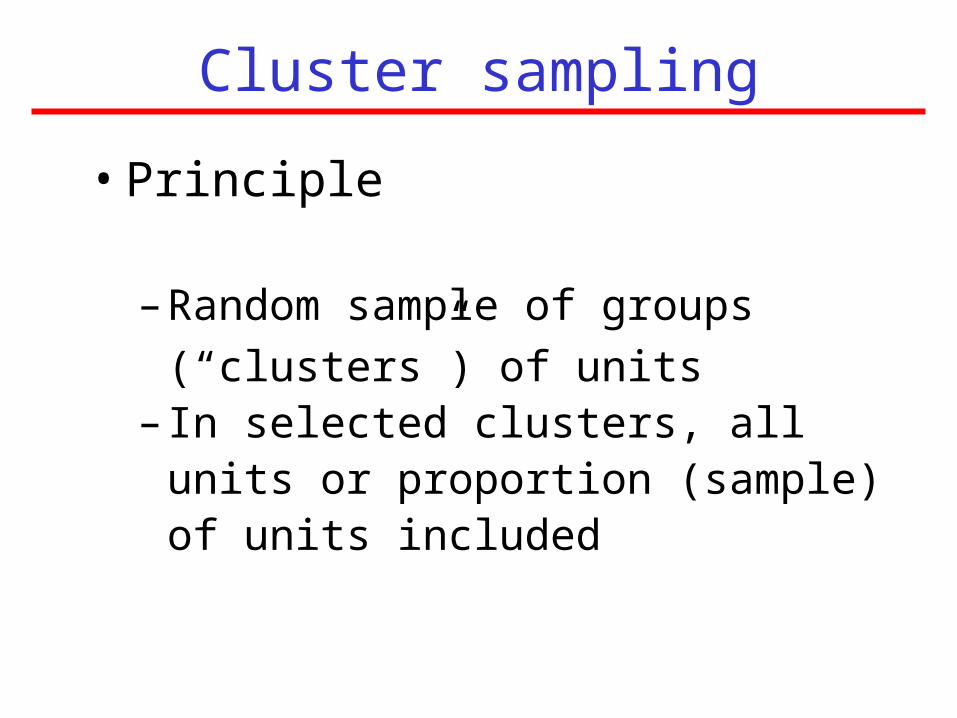
Cluster sampling
• Principle
– Random sample of groups (“clusters”)
of units– In selected clusters, all units or
proportion (sample) of units included

Example: Cluster sampling
Section 4
Section 5
Section 3
Section 2Section 1

Cluster sampling
• Advantages– Simple as complete list of sampling units
within population not required– Less travel/resources required
• Disadvantages– Imprecise if clusters homogeneous and
therefore sample variation greater than population variation (large design effect)
– Sampling error difficult to measure

EPI cluster sampling
To evaluate vaccination coverage:
• Without list of persons
• Total population of villages
• Randomly choose 30 clusters
• 30 cluster of 7 children each= 210 children

Drawing the clusters
You need :– Map of the region– Distribution of population (by villages or area)– Age distribution (population 12-23 m :3%)
1600
220
3200
400
800
200
1200
200
1600
400
53000
7300
106000
13000
26500
6600
40000
6600
53000
13200
A
B
C
D
E
F
G
H
I
J
12-23Pop.Village

Distribution of the clusters
ABCDEFGHI
J
1600220
3200400800200
1200200
1600400
1600182050205420622064207620782094209820
Total population = 9820
Compute cumulated population

Distribution of the clusters
Then compute sampling fraction :
K= = 327
Draw a random number (between 1 and 327)
Example: 62
Start from the village including “62” and draw the clusters adding the sampling fraction
982030
A
B
C
D
E
F
G
H
I
J
1600
1820
5020
5420
6220
6420
7620
7820
9420
9820
I I I I
I
I I I I I I I I I I
I
I I
I
I I I I
I
I I I I I
I

Drawing households and children
On the spot
Go to the center of the village , choose direction (random)
Number the houses in this direction Ex: 21
Draw random number (between 1 and 21) to identify the first house to visit
From this house progress until finding the 7 children ( itinerary rules fixed beforehand)
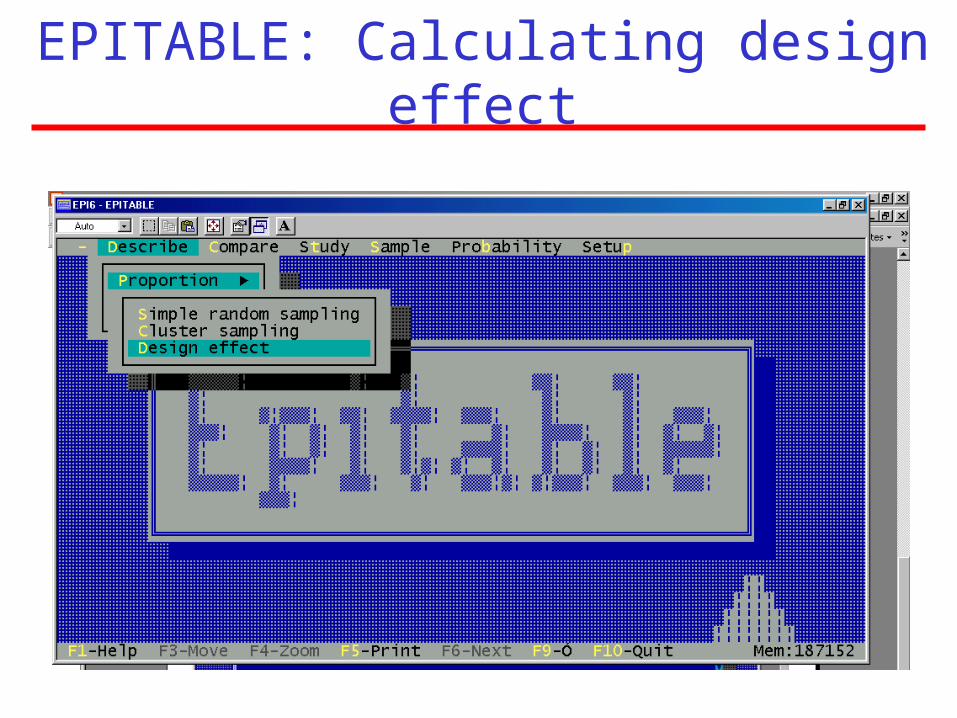
EPITABLE: Calculating design effect

Selecting a sampling method
• Population to be studied– Size/geographical distribution– Heterogeneity with respect to variable
• Level of precision required
• Resources available
• Importance of having a precise estimate of the sampling error

Steps in estimating sample size
• Identify major study variable• Determine type of estimate (%, mean, ratio,...) • Indicate expected frequency of factor of interest• Decide on desired precision of the estimate• Decide on acceptable risk that estimate will fall outside its
real population value• Adjust for estimated design effect• Adjust for expected response rate• (Adjust for population size? In case of small size population
only)

Sample size formula indescriptive survey
z: alpha risk express in z-score
p: expected prevalence
q: 1 - p
d: absolute precision
g: design effect
z² * p * q 1.96²*0.15*0.85n = -------------- ---------------------- = 544
d² 0.03²
Cluster sampling
z² * p * q 2*1.96²*0.15*0.85n = g* -------------- ------------------------ = 1088d² 0.03²
Simple random / systematic sampling

EPITABLE: cluster sample size calculation

Place of sampling in descriptive surveys
• Define objectives• Define resources available• Identify study population• Identify variables to study• Define precision required• Establish plan of analysis (questionnaire)• Create sampling frame• Select sample• Pilot data collection• Collect data• Analyse data• Communicate results• Use results

Conclusions
• Probability samples are the best
• Beware of …– refusals– absentees– “do not know”

Conclusions
• If in doubt…
Call a statistician !!!!