samsonite international s.a. - lux... · samsonite international s.a. 13–15 avenue de la...
TRANSCRIPT
SAMSONITE INTERNATIONAL S.A.13–15 Avenue de la Liberté, L-1931, Luxembourg
RCS Luxembourg: B159469(Incorporated under the laws of Luxembourg with limited liability)
Consolidated fi nancial statements for the year ended December 31, 2012

— 1 —
Directors’ Report
Principal activities
Samsonite International S.A. (together with its consolidated subsidiaries, the “Company”) is the world’s largest travel luggage company, with a heritage dating back more than 100 years. The Company is principally engaged in the design, manufacture, sourcing and distribution of luggage, business and computer bags, outdoor and casual bags, and travel accessories throughout the world, primarily under the Samsonite®, American Tourister®, High Sierra® and Hartmann® brand names as well as other owned and licensed brand names. The Company’s core brand, Samsonite, is one of the most well known travel luggage brands in the world.
The Company sells its products through a variety of wholesale distribution channels and through its company operated retail stores. Its principal luggage wholesale distribution customers are department and specialty retail stores, mass merchants, catalog showrooms and warehouse clubs. The Company sells its products in Asia, Europe, North America and Latin America. As of December 31, 2012, the Company’s products were sold in more than 45,000 points of sale in over 100 countries.
The report of the directors should be read in conjunction with the Company’s audited consolidated fi nancial statements, which have been prepared in accordance with International Financial Reporting Standards as adopted by the European Union (“IFRS as adopted by the EU”). Certain comparative amounts have been reclassifi ed to conform with the presentation adopted in the current year. None of the changes impacts the Company’s previously reported consolidated net sales, gross profi t, operating profi t, income tax expense, profi t for the year, earnings per share, or statement of fi nancial position.
1. Review of the Financial Year 2012
Net Sales
The following table sets forth a breakdown of net sales by region for the years ended December 31, 2012 and December 31, 2011, both in absolute terms and as a percentage of total net sales.
Year ended December 31,
2012 vs 20112012 2011
US$’000Percentage of net sales US$’000
Percentage of net sales
Percentageincrease
(decrease)
Percentageincrease
(decrease) excl. foreign
currency effects
Net sales by region: Asia 684,154 38.6% 578,316 37.0% 18.3% 21.0% Europe 465,383 26.3% 479,089 30.6% (2.9)% 4.9% North America 499,924 28.2% 388,190 24.8% 28.8% 28.9% Latin America 112,556 6.4% 108,601 6.9% 3.6% 7.5%Corporate 9,709 0.5% 10,951 0.7% (11.3)% (11.3)%
Net sales 1,771,726 100.0% 1,565,147 100.0% 13.2% 16.8%

— 2 —
Directors’ Report
Net sales increased by US$206.6 million, or 13.2%, to US$1,771.7 million for the year ended December 31, 2012, from US$1,565.1 million for the year ended December 31, 2011. Excluding foreign currency effects, net sales increased by 16.8%. The Company continues to benefi t from the worldwide increase in travel. Per the World Tourism Organization (UNWTO), International tourist arrivals grew by 4% in 2012 to over one billion for the fi rst time ever.
The Company’s US Dollar reported net sales during 2012 were negatively impacted by the strengthening of the US Dollar, most notably against the Euro and the Indian Rupee. Euro denominated net sales were translated to US dollars at an average foreign exchange rate of US$1.29 for the year ended December 31, 2012 compared to US$1.40 for the year ended December 31, 2011, which negatively impacted reported net sales by approximately US$28.0 million. Net sales denominated in Indian Rupees were translated to US dollars at an average foreign exchange rate of US$0.019 for the year ended December 31, 2012 compared to US$0.022 for the year ended December 31, 2011, which negatively impacted reported net sales by approximately US$14.8 million.
Brands
The following table sets forth a breakdown of net sales by brand for the years ended December 31, 2012 and December 31, 2011, both in absolute terms and as a percentage of total net sales.
Year ended December 31,
2012 vs 20112012 2011
US$’000Percentage of net sales US$’000
Percentage of net sales
Percentageincrease
(decrease)
Percentageincrease
(decrease) excl. foreign
currency effects
Net sales by brand: Samsonite 1,295,706 73.1% 1,223,353 78.2% 5.9% 9.7% American Tourister 354,563 20.0% 249,873 16.0% 41.9% 47.4% High Sierra(1)/Hartmann(2) 29,623 1.7% 3,630 0.2% 716.1% 716.1% Other(3) 91,834 5.2% 88,291 5.6% 4.0% 6.4%
Net sales 1,771,726 100.0% 1,565,147 100.0% 13.2% 16.8%
Notes
(1) The High Sierra brand was acquired on July 31, 2012. Prior to the acquisition, Samsonite Australia was a distributor of High
Sierra products. Net sales under this distribution arrangement were US$3.6 million during 2011 and were US$2.1 million during the portion of the year ended December 31, 2012 that preceded the acquisition.
(2) The Hartmann brand was acquired on August 2, 2012.
(3) Other includes local brands Saxoline, Xtrem and others.
Net sales of the Samsonite brand increased by US$72.4 million, or 5.9%, for the year ended December 31, 2012 compared to the previous year. Excluding foreign currency effects, net sales of the Samsonite brand increased by 9.7%. Net sales of the American Tourister brand increased by US$104.7 million, or 41.9%, for the year ended December 31, 2012 compared to the previous year. Excluding foreign currency effects, net sales of the American Tourister brand increased by 47.4%. Asia accounted for US$85.7 million, or 81.8%, of the US$104.7 million increase in American Tourister brand sales for the year. These increases were attributable to expanded product offerings and further penetration of existing markets, which were all supported by the Company’s targeted advertising activities.

— 3 —
Directors’ Report
Product Categories
The Company sells products in four principal product categories: travel, business, casual and accessories. The travel category is the Company’s largest category and has been its traditional strength. The following table sets forth a breakdown of net sales by product category for the years ended December 31, 2012 and December 31, 2011, both in absolute terms and as a percentage of total net sales.
Year ended December 31,
2012 vs 20112012 2011
US$’000Percentage of net sales US$’000
Percentage of net sales
Percentageincrease
(decrease)
Percentageincrease
(decrease) excl. foreign
currency effects
Net sales by product category: Travel 1,357,054 76.6% 1,186,683 75.8% 14.4% 18.5% Business 189,561 10.7% 189,582 12.1% 0.0% 2.4% Casual 109,743 6.2% 81,849 5.2% 34.1% 36.6% Accessories 79,662 4.5% 70,786 4.5% 12.5% 17.2% Other 35,706 2.0% 36,247 2.4% (1.5)% 4.2%
Net sales 1,771,726 100.0% 1,565,147 100.0% 13.2% 16.8%
The US$206.6 million increase in net sales for the year ended December 31, 2012 compared to the previous year was largely driven by an increase in net sales in the travel product category, which increased by US$170.4 million, or 14.4%. Country-specifi c product designs, locally relevant marketing strategies and expanded points of sale were the key factors contributing to this increase. Net sales in the business product category remained consistent year-on-year, and increased by 2.4% excluding foreign currency effects. The slight constant currency increase in business product category net sales was driven by a 20.8% increase in North America, a 6.7% increase in Latin America and a 5.9% increase in Asia due to additional product placements and expanded offerings. These increases were marginally offset by a 19.3% decrease in Europe resulting from the economic challenges within the region, as well as the timing of product introductions, a strong competitive environment and stock reductions at key retailers limiting sell-in. Net sales in the casual product category increased by US$27.9 million, or 34.1%, partly attributable to the acquisition of High Sierra and as a result of the Company’s strategic focus on the expansion of its casual product offerings. Net sales in the accessories product category increased by US$8.9 million, or 12.5%, for the year ended December 31, 2012 compared to the previous year, refl ecting expanded product offerings in this category. Net sales in the other product category decreased by US$0.5 million, or 1.5%, for the year ended December 31, 2012 compared to the previous year, refl ecting the Company’s focus on its core product offerings.

— 4 —
Directors’ Report
Distribution Channels
The Company sells products through two primary distribution channels: wholesale and retail. The following table sets forth a breakdown of net sales by distribution channel for the years ended December 31, 2012 and December 31, 2011, both in absolute terms and as a percentage of total net sales.
Year ended December 31,
2012 vs 20112012 2011
US$’000Percentage of net sales US$’000
Percentage of net sales
Percentageincrease
(decrease)
Percentageincrease
(decrease) excl. foreign
currency effects
Net sales by distribution channel: Wholesale 1,425,537 80.5% 1,252,893 80.0% 13.8% 17.9% Retail 336,417 19.0% 301,301 19.3% 11.7% 15.1% Other(1) 9,772 0.5% 10,953 0.7% (10.8)% (10.8)%
Net sales 1,771,726 100.0% 1,565,147 100.0% 13.2% 16.8%
Notes
(1) Other primarily consists of licensing income.
During the year ended December 31, 2012, the Company expanded its points of sale by approximately 5,000 to a total of more than 45,000 points of sale worldwide as of December 31, 2012.
The wholesale channel accounted for US$172.6 million, or 83.6%, of the US$206.6 million increase in net sales for the year ended December 31, 2012 compared to the previous year. Net sales in the retail channel increased by US$35.1 million, or 11.7%, over the same period. These increases are primarily due to points of sale expansion and targeted product offerings. On a same store constant currency basis, net sales in the retail channel increased by 7.1%.
Regions
Asia
Net sales for the Asian region increased by US$105.8 million, or 18.3%, to US$684.2 million for the year ended December 31, 2012, from US$578.3 million for the year ended December 31, 2011. Excluding foreign currency effects, net sales increased by 21.0%.

— 5 —
Directors’ Report
The strong growth in Asia continues to be driven by the American Tourister brand, which accounted for US$85.7 million, or 81.0%, of the increase in net sales for the Asian region for the year ended December 31, 2012 compared to the previous year. American Tourister now comprises 39.2% of the net sales in the Asian region compared to 31.6% for 2011. Net sales of the Samsonite brand, which accounted for 59.0% of net sales in Asia during 2012, increased by US$21.7 million, or 5.7%, from the previous year and by 6.7% excluding foreign currency effects.
Net sales in the travel product category increased by US$87.0 million, or 20.2%, for the year ended December 31, 2012 compared to the previous year. Net sales in the business product category increased by US$5.0 million, or 4.9%, compared to the previous year. Net sales in the casual product category increased by US$12.6 million, or 50.4%. Net sales in the accessories product category increased by US$3.8 million, or 25.9%, compared to the previous year.
Net sales in the wholesale channel increased by US$96.0 million, or 19.2%, for the year ended December 31, 2012 compared to the previous year. Net sales in the retail channel increased by US$9.8 million, or 12.5%, compared to the previous year. On a same store constant currency basis, net sales in the retail channel increased by 9.0%. Over 700 points of sale were added in Asia during 2012, for a total of more than 6,350 in Asia at December 31, 2012.
Along with additional product offerings and points of sale expansion, the Company’s success has been bolstered by its continued focus on country-specifi c product and marketing strategies within Asia to drive increased awareness of and demand for its products. On a constant currency basis, net sales increased in all countries in the Asian region for the year ended December 31, 2012 compared to the previous year. China continues to lead the Asian region in net sales, contributing 26.0% of the regions net sales on 23.1% year-on-year growth. Net sales in India suffered from weak consumer sentiment during most of the year, as well as a strong US Dollar. Net sales denominated in Indian Rupees were translated to US dollars at an average foreign exchange rate of US$0.019 for the year ended December 31, 2012 compared to US$0.022 for the year ended December 31, 2011, which negatively impacted reported net sales by approximately US$14.8 million. South Korea continues to experience robust sales growth driven by the success of the American Tourister and Samsonite Red brands.

— 6 —
Directors’ Report
The following table sets forth a breakdown of net sales within the Asian region by geographic location for the years ended December 31, 2012 and December 31, 2011, both in absolute terms and as a percentage of total regional net sales.
Year ended December 31,
2012 vs 20112012 2011
US$’000Percentage of net sales US$’000
Percentage of net sales
Percentageincrease
(decrease)
Percentageincrease
(decrease) excl. foreign
currency effects
Net sales by geographic location(1): China 178,035 26.0% 144,594 25.0% 23.1% 20.4% South Korea 122,921 18.0% 93,969 16.2% 30.8% 33.7% India 102,329 15.0% 109,846 19.0% (6.8)% 6.7% Japan 66,013 9.6% 51,984 9.0% 27.0% 27.4% Hong Kong(2) 56,473 8.3% 48,392 8.4% 16.7% 16.3% Other 158,383 23.1% 129,531 22.4% 22.3% 23.6%
Net sales 684,154 100.0% 578,316 100.0% 18.3% 21.0%
Notes
(1) The geographic location of the Company’s net sales refl ects the country from which its products were sold and does not necessarily indicate the country in which its end consumers were actually located.
(2) Includes Macau.
Europe
Excluding foreign currency effects, net sales for the European region increased by 4.9%. Euro denominated net sales were translated to US dollars at an average foreign exchange rate of US$1.29 for the year ended December 31, 2012 compared to US$1.40 for the previous year, which adversely impacted reported net sales by approximately US$28.0 million. US Dollar reported net sales for the European region decreased by US$13.7 million, or 2.9%, to US$465.4 million for the year ended December 31, 2012, from US$479.1 million for the year ended December 31, 2011.
Excluding Italy and Spain, net sales for the European region increased by US$9.4 million, or 2.6%, year-on-year and by 10.5% excluding foreign currency effects. The Company’s business in Italy and Spain were negatively impacted by the weak consumer sentiment brought about by the economic challenges in Southern European countries.
Local currency sales growth has been strong in several markets due to the positive sell-through of new product introductions and the continued success of products manufactured using the Curv material, which were brought to market with effective marketing strategies and local sales teams. Germany is now the Company’s leading market in Europe, representing 13.9% of net sales, with robust double-digit sales growth during the year ended December 31, 2012. The Company continued to penetrate the emerging markets of Russia, South Africa and Turkey with year-on-year constant currency net sales growth of 37.5%, 33.2% and 13.6%, respectively.

— 7 —
Directors’ Report
Excluding foreign currency effects, net sales of the Samsonite and American Tourister brands increased by 3.4% and 79.2%, respectively, for the year ended December 31, 2012 compared to the previous year. American Tourister now comprises 5.2% of the net sales in the European region, compared to 3.1% in the previous year, as the Company penetrates the market at lower price points.
On a constant currency basis, net sales in the travel product category increased by US$31.7 million, or 8.4%, year-on-year. Net sales in the business product category decreased by 19.3% for the year ended December 31, 2012 as a result of the economic challenges within the region, as well as the timing of product introductions, a strong competitive environment and stock reductions at key retailers limiting sell-in. Net sales in the casual product category decreased by 7.4% excluding foreign currency effects primarily due to the absence of Lacoste and Timberland licensed products in 2012. On a constant currency basis, net sales in the accessories product category increased by 10.4% and net sales in the other product category increased by 20.8%.
Net sales in the wholesale channel decreased by US$23.2 million, or 5.9%, for the year ended December 31, 2012 compared to the previous year. Net sales in the retail channel increased by US$9.5 million, or 10.7%, year-on-year. On a same store constant currency basis, net sales in the retail channel for the European region increased by 6.8%.
The following table sets forth a breakdown of net sales within the European region by geographic location for the years ended December 31, 2012 and December 31, 2011, both in absolute terms and as a percentage of total regional net sales.
Year ended December 31,
2012 vs 20112012 2011
US$’000Percentage of net sales US$’000
Percentage of net sales
Percentageincrease
(decrease)
Percentageincrease
(decrease) excl. foreign
currency effects
Net sales by geographic location(1): Germany 64,502 13.9% 61,077 12.7% 5.6% 14.9% France 59,580 12.8% 61,024 12.7% (2.4)% 6.1% Belgium(2) 58,164 12.5% 59,561 12.4% (2.3)% 6.3% Italy 52,383 11.3% 67,549 14.1% (22.5)% (15.7)% Spain 39,075 8.4% 46,973 9.8% (16.8)% (9.2)% Russia 35,931 7.7% 28,020 5.8% 28.2% 37.5% United Kingdom 30,754 6.6% 30,120 6.3% 2.1% 3.4% Other 124,994 26.8% 124,765 26.2% 0.2% 8.2%
Net sales 465,383 100.0% 479,089 100.0% (2.9)% 4.9%
Notes
(1) The geographic location of the Company’s net sales refl ects the country from which its products were sold and does not necessarily indicate the country in which its end consumers were actually located.
(2) Net sales in Belgium were US$25.1 million and US$24.4 million for the years ended December 31, 2012 and December 31, 2011, respectively. Remaining sales consisted of direct shipments to distributors, customers and agents in other countries.

— 8 —
Directors’ Report
North America
Net sales for the North American region increased by US$111.7 million, or 28.8%, to US$499.9 million for the year ended December 31, 2012, from US$388.2 million for the year ended December 31, 2011. Excluding foreign currency effects, net sales increased by 28.9%. Excluding net sales attributable to the recently acquired High Sierra and Hartmann brands, net sales increased by US$86.2 million, or 22.3%.
The North American region had double-digit year-on-year net sales growth in both of the Company’s core brands, Samsonite and American Tourister, and across all product categories and all distribution channels. These increases were largely due to the Company’s continued focus on marketing and selling regionally developed products, which has enabled it to bring to market products designed to appeal to the tastes and preferences of North American consumers. Strong consumer demand for the Company’s products has allowed it to continue to gain additional product placement with its wholesale customers. Including the impact from acquisitions, more than 3,400 points of sale were added during 2012 for a total of more than 26,900 points of sale in North America at December 31, 2012.
Net sales of the Samsonite brand increased by US$72.5 million, or 21.6%, and net sales of the American Tourister brand increased by US$10.8 million, or 23.7%, for the year ended December 31, 2012 compared to the previous year.
Net sales in the travel product category increased by US$82.8 million, or 25.2%, year-on-year. Net sales in the business product category increased by US$6.3 million, or 20.7%, for the year ended December 31, 2012 compared to the previous year. Net sales in the casual product category more than doubled from the previous year, in part due to the High Sierra acquisition. Net sales in the accessories product category increased by US$5.0 million, or 38.4%, year-on-year.
Net sales in the wholesale channel increased by US$96.6 million, or 33.6%, for the year ended December 31, 2012 compared to the previous year. Net sales in the retail channel increased by US$15.2 million, or 15.1%, year-on-year. On a same store constant currency basis, net sales in the retail channel increased by 3.8%.

— 9 —
Directors’ Report
The following table sets forth a breakdown of net sales within the North American region by geographic location for the years ended December 31, 2012 and December 31, 2011, both in absolute terms and as a percentage of total regional net sales.
Year ended December 31,
2012 vs 20112012 2011
US$’000Percentage of net sales US$’000
Percentage of net sales
Percentageincrease
(decrease)
Percentageincrease
(decrease) excl. foreign
currency effects
Net sales by geographic location(1): United States 469,773 94.0% 360,314 92.8% 30.4% 30.4% Canada 30,151 6.0% 27,876 7.2% 8.2% 9.6%
Net sales 499,924 100.0% 388,190 100.0% 28.8% 28.9%
Notes
(1) The geographic location of the Company’s net sales refl ects the country from which its products were sold and does not necessarily indicate the country in which its end consumers were actually located.
Latin America
Net sales for the Latin American region increased by US$4.0 million, or 3.6%, to US$112.6 million for the year ended December 31, 2012, from US$108.6 million for the year ended December 31, 2011. Excluding foreign currency effects, net sales increased by 7.5%.
For the year ended December 31, 2012, net sales in Mexico increased by 11.9%, excluding foreign currency effects, compared to the previous year. Net sales in Chile improved by 11.0% year-on-year, excluding foreign currency effects. The double-digit growth in both Mexico and Chile was due in large part to the strength of luggage sales and robust consumer purchases of backpacks for the back-to-school season. Local brand Xtrem also continues to fl ourish in Mexico and Chile. The Company made signifi cant progress in the emerging market of Brazil with year-on-year net sales growth of 14.1%, excluding foreign currency effects, led by points of sale expansion. Net sales in Argentina continued to be negatively impacted by import restrictions imposed by the local government. Excluding Argentina, net sales for the Latin American region increased by US$11.5 million, or 12.2%, excluding foreign currency effects.
Net sales of the Samsonite brand increased by US$0.9 million, or 1.8%, for the year ended December 31, 2012 compared to the previous year, while net sales of the American Tourister brand decreased by US$1.4 million, or 20.9%, as local brands Saxoline and Xtrem comprised an increasing share of the region’s net sales. Net sales of the local brands Saxoline and Xtrem increased by US$1.0 million, or 4.2%, and by US$2.9 million, or 11.9%, respectively.
Net sales in the travel product category increased by US$2.3 million, or 4.7%, year-on-year. Net sales in the business product category increased by US$0.3 million, or 2.1%. Net sales in the casual product category increased by US$0.6 million, or 2.1%. Net sales in the accessories product category decreased by US$0.4 million, or 2.6%, year-on-year while net sales in the other product category increased by US$1.2 million.

— 10 —
Directors’ Report
Net sales in the wholesale channel increased by US$3.2 million, or 4.3%, for the year ended December 31, 2012 compared to the previous year. Net sales in the retail channel increased by US$0.7 million, or 2.0%, year-on-year. On a same store constant currency basis, net sales in the retail channel increased by 14.5%.
The following table sets forth a breakdown of net sales within the Latin American region by geographic location for the years ended December 31, 2012 and December 31, 2011, both in absolute terms and as a percentage of total regional net sales.
Year ended December 31,
2012 vs 20112012 2011
US$’000Percentage of net sales US$’000
Percentage of net sales
Percentageincrease
(decrease)
Percentageincrease
(decrease) excl. foreign
currency effects
Net sales by geographic location(1): Chile 54,998 48.9% 50,158 46.2% 9.6% 11.0% Mexico 34,240 30.4% 32,790 30.2% 4.4% 11.9% Argentina 9,823 8.7% 14,218 13.1% (30.9)% (23.8)% Brazil(2) 9,628 8.6% 8,481 7.8% 13.5% 14.1% Other(3) 3,867 3.4% 2,954 2.7% 30.9% 30.9%
Net sales 112,556 100.0% 108,601 100.0% 3.6% 7.5%
Notes
(1) The geographic location of the Company’s net sales refl ects the country from which its products were sold and does not necessarily indicate the country in which its end consumers were actually located.
(2) The net sales fi gure for Brazil includes net sales attributable to sales made to third party distributors in Brazil.
(3) The net sales fi gure for Other primarily represents sales made through the Company’s distribution center in Uruguay but does not include net sales attributable to sales made in Brazil to third party distributors.
Cost of Sales and Gross Profi t
Cost of sales increased by US$112.5 million, or 15.9%, to US$820.7 million (representing 46.3% of net sales) for the year ended December 31, 2012 from US$708.2 million (representing 45.2% of net sales) for the year ended December 31, 2011. Cost of sales increased in line with increased net sales. The increase in cost of sales as a percentage of net sales was primarily due to unfavorable currency impacts, as well as a shift in the Company’s product mix which refl ected increased sales of American Tourister products that yield lower gross profi t margins.
Gross profi t increased by US$94.1 million, or 11.0%, to US$951.0 million for the year ended December 31, 2012, from US$856.9 million for the year ended December 31, 2011. Gross profi t margin decreased from 54.8% for the year ended December 31, 2011 to 53.7% for the year ended December 31, 2012. This decrease was attributable to the factors noted above.

— 11 —
Directors’ Report
Distribution Expenses
Distribution expenses increased by US$55.6 million, or 13.5%, to US$466.5 million (representing 26.3% of net sales) for the year ended December 31, 2012, from US$410.9 million (representing 26.3% of net sales) for the year ended December 31, 2011. This increase, which was refl ected in additional freight to customers, commissions, rent and increased personnel expenses, was primarily due to the increase in sales volume in 2012. Distribution expenses as a percentage of net sales remained consistent year-on-year.
Marketing Expenses
The Company spent US$117.2 million (representing 6.6% of net sales) on marketing for the year ended December 31, 2012 compared to US$122.8 million (representing 7.8% of net sales) for the year ended December 31, 2011, a decrease of US$5.6 million, or 4.6%. Excluding foreign currency effects, marketing expenses decreased by US$1.8 million, or 1.4%. During 2012, the Company employed more targeted and focused advertising and promotional campaigns. The Company believes the success of its effi cient advertising campaigns is evident in its net sales growth, and remains committed to enhance brand and product awareness and drive additional net sales growth through marketing activities.
General and Administrative Expenses
General and administrative expenses increased by US$7.5 million, or 6.6%, to US$121.1 million (representing 6.8% of net sales) for the year ended December 31, 2012 from US$113.6 million (representing 7.3% of net sales) for the year ended December 31, 2011. Although general and administrative expenses increased in absolute terms, such expenses decreased as a percentage of net sales by 0.5 percentage points as the Company maintained tight control of its fi xed cost base and leveraged it against strong sales growth.
Other Income (Expenses)
The Company recognized net other expenses of US$4.4 million and other income of US$0.3 million for the year ended December 31, 2012 and December 31, 2011, respectively. Other expenses for 2012 include acquisition costs of US$6.4 million, which are primarily comprised of costs associated with due diligence and integration activities, severance, and professional and legal fees for the acquisitions of High Sierra and Hartmann that were completed during 2012. Other income for the year ended December 31, 2011 includes US$0.9 million of restructuring charges that were reversed to refl ect a refund from certain local governmental agencies for upfront employee related payments made in connection with restructuring initiatives in 2009.
Operating Profi t
The Company’s operating profi t was US$241.7 million for the year ended December 31, 2012, an increase of US$31.8 million, or 15.2%, from an operating profi t of US$209.9 million for the year ended December 31, 2011. Excluding acquisition costs, operating profi t increased by 18.2% year-on-year.

— 12 —
Directors’ Report
Net Finance Costs
Net fi nance costs decreased by US$53.6 million, or 75.9%, to US$17.0 million for the year ended December 31, 2012 from US$70.6 million for the year ended December 31, 2011. This decrease was primarily attributable to the absence of certain non-recurring costs and charges related to the recognition of the remaining unamortized discount of US$28.6 million on the former amended senior credit facility upon repayment in full of such facility following the completion of the Company’s listing on the Main Board of The Stock Exchange of Hong Kong Limited in June 2011 (the “Global Offering”), as well as US$24.8 million of transaction costs related to the Global Offering.
Profi t before Income Tax
The following table sets forth the Company’s profi t before income tax, and certain non-recurring costs and charges affecting such profi t before income tax, for the years ended December 31, 2012 and December 31, 2011.
(Expressed in thousands of US Dollars)Year ended December 31,
2012 2011
Profi t before income tax 224,700 139,298(Plus) Minus: Expenses related to acquisition activities (6,417) — Additional interest expense recognized on immediate recognition of unamortized discount on debt — (28,639) Expenses related to the Global Offering — (24,805) Global Offering Stabilization Proceeds — 3,474 Reversals of restructuring charges — 877
Profi t before income tax, excluding certain non-recurring costs and charges 231,117 188,391
Profi t before income tax increased by US$85.4 million, or 61.3%, to US$224.7 million for the year ended December 31, 2012 from US$139.3 million for the year ended December 31, 2011.
Excluding the impact of the items noted above, profi t before income tax increased by US$42.7 million, or 22.7%, to US$231.1 million for the year ended December 31, 2012 compared to the previous year.

— 13 —
Directors’ Report
Income Tax Expense
Income tax expense increased by US$22.4 million, or 62.8%, to US$58.1 million for the year ended December 31, 2012 from US$35.7 million for the year ended December 31, 2011.
The Company’s consolidated effective tax rate for operations was 25.8% and 25.6% for the years ended December 31, 2012 and December 31, 2011, respectively. The effective tax rate is calculated using a weighted average income tax rate from those jurisdictions in which the Company is subject to tax, adjusted for permanent book/tax differences, tax incentives, changes in tax reserves and the recognition of previously unrecognized deferred tax assets.
During the year ended December 31, 2012, based upon an evaluation of all relevant evidence, the Company concluded that US$47.2 million of previously unrecognized deferred tax assets should be recognized. Of the US$47.2 million of previously unrecognized deferred tax assets, US$12.3 million was recognized as a benefi t within income tax expense in the consolidated income statement and US$34.9 million, which relates to deferred tax assets for pension plans, was recognized through other comprehensive income in the consolidated statement of comprehensive income.
Profi t for the Year
Profi t for the year of US$166.6 million for the year ended December 31, 2012 increased by US$63.0 million, or 60.8%, from US$103.6 million for the year ended December 31, 2011. Excluding the estimated impact of foreign currency translation, profi t for the year increased by approximately 65.2%. This increase was primarily driven by the Company’s robust sales growth while maintaining tight control of operating costs, followed by the absence of non-recurring costs and charges recognized in conjunction with the listing of the Company’s shares and the repayment of its former amended senior credit facility in 2011. Adjusted Net Income, a non-IFRS measure, increased by US$30.4 million, or 22.2%, to US$167.2 million for the year ended December 31, 2012 from US$136.8 million for the year ended December 31, 2011. Excluding the estimated impact of foreign currency translation, Adjusted Net Income increased by approximately 25.4%. See the reconciliation of profi t for the year to Adjusted Net Income below for a detailed discussion of the Company’s results excluding certain non-recurring costs and charges and other non-cash charges that impacted reported profi t for the year.
Basic and diluted earnings per share increased to US$0.11 for the year ended December 31, 2012 from US$0.06 for the year ended December 31, 2011. Adjusted basic and diluted earnings per share, a non-IFRS measure, increased to US$0.12 for the year ended December 31, 2012 from US$0.10 for the year ended December 31, 2011. The weighted average number of shares outstanding increased for the year ended December 31, 2012 compared to the previous year by 55.1 million shares as a result of the weighted average impact of the issuance of new shares by the Company in the Global Offering. No shares were issued during 2012.

— 14 —
Directors’ Report
Adjusted EBITDA
Adjusted EBITDA, which is a non-IFRS measure, increased by US$38.3 million, or 15.4%, to US$286.5 million for the year ended December 31, 2012 from US$248.3 million for the year ended December 31, 2011. Excluding the estimated impact of foreign currency translation, Adjusted EBITDA increased by approximately 19.7%. Adjusted EBITDA margin increased to 16.2% from 15.9% as the Company maintained tight control of its fi xed cost base while experiencing strong sales growth.
The following table presents the reconciliation from the Company’s profi t for the year to Adjusted EBITDA for the years ended December 31, 2012 and December 31, 2011.
(Expressed in thousands of US Dollars)Year ended December 31,
2012 2011
Profi t for the year 166,627 103,618(Plus) Minus: Income tax expense (58,073) (35,680) Finance costs (18,229) (71,879) Finance income 1,187 1,247 Depreciation (31,770) (30,158) Amortization (8,491) (8,333)
EBITDA 282,003 248,421
(Plus) Minus: Other adjustments(1) (4,518) 168
Adjusted EBITDA 286,521 248,253
Notes
(1) Other adjustments primarily comprised of ‘Other income (expense)’ per the consolidated income statement.

— 15 —
Directors’ Report
The following tables present a reconciliation from profi t (loss) for the year to Adjusted EBITDA on a regional basis for the years ended December 31, 2012 and December 31, 2011.
(Expressed in thousands of US Dollars)Year ended December 31, 2012
Asia EuropeNorth
AmericaLatin
America Corporate Total
Profi t (loss) for the year 64,469 32,750 23,732 10,774 34,902 166,627(Plus) Minus: Income tax (expense) benefi t (20,136) (9,889) (14,398) 1,732 (15,382) (58,073) Finance costs (3,553) (648) (344) (1,951) (11,733) (18,229) Finance income 211 188 16 25 747 1,187 Depreciation (10,436) (12,985) (3,396) (2,162) (2,791) (31,770) Amortization (4,207) (1,943) (400) (1,930) (11) (8,491)
EBITDA 102,590 58,027 42,254 15,060 64,072 282,003
(Plus) Minus: Other adjustments(1) (31,051) (21,484) (37,862) (2,143) 88,022 (4,518)
Adjusted EBITDA 133,641 79,511 80,116 17,203 (23,950) 286,521
Notes
(1) Other adjustments primarily comprised of ‘Other income (expense)’ per the consolidated income statement. Regional results include intercompany royalty income (expense).
(Expressed in thousands of US Dollars)Year ended December 31, 2011
Asia EuropeNorth
AmericaLatin
America Corporate Total
Profi t (loss) for the period 46,051 33,666 38,782 6,603 (21,484) 103,618(Plus) Minus: Income tax expense (13,447) (11,367) (465) (1,497) (8,904) (35,680) Finance costs (2,780) (16,477) (400) (1,798) (50,424) (71,879) Finance income 142 184 9 26 886 1,247 Depreciation (9,017) (11,519) (3,204) (1,892) (4,526) (30,158) Amortization (4,207) (1,922) (274) (1,930) — (8,333)
EBITDA 75,360 74,767 43,116 13,694 41,484 248,421
(Plus) Minus: Other adjustments(1) (29,784) (9,127) (16,072) (2,758) 57,909 168
Adjusted EBITDA 105,144 83,894 59,188 16,452 (16,425) 248,253
Notes
(1) Other adjustments primarily comprised of ‘Other income (expense)’ per the consolidated income statement. Regional results include intercompany royalty income (expense).

— 16 —
Directors’ Report
The Company has presented Adjusted EBITDA because it believes that, when viewed with its results of operations as prepared in accordance with IFRS and with the reconciliation to profi t (loss) for the year, Adjusted EBITDA provides additional information that is useful in gaining a more complete understanding of its operational performance and of the trends impacting its business. Adjusted EBITDA is an important metric the Company uses to evaluate its operating performance and cash generation.
Adjusted EBITDA is a non-IFRS fi nancial measure and as calculated herein may not be comparable to similarly named measures used by other companies and should not be considered as a measure comparable to profi t (loss) for the year in the Company’s consolidated income statement. Adjusted EBITDA has limitations as an analytical tool and should not be considered in isolation from, or as a substitute for, an analysis of the Company’s results of operations as reported under IFRS.
Adjusted Net Income
Adjusted Net Income, which is a non-IFRS measure, increased by US$30.4 million, or 22.2%, to US$167.2 million for the year ended December 31, 2012 from US$136.8 million for the year ended December 31, 2011. Excluding the estimated impact of foreign currency translation, Adjusted Net Income increased by approximately 25.4%.
The following table presents the reconciliation from the Company’s profi t for the year to Adjusted Net Income for the years ended December 31, 2012 and December 31, 2011.
Expressed in thousands of US DollarsYear ended December 31,
2012 2011
Profi t for the year 166,627 103,618Profi t attributable to non-controlling interests 18,188 16,870
Profi t attributable to the equity holders 148,439 86,748
(Plus) Minus: Expenses related to acquisition activities (6,417) — Change in fair value of put options (8,908) (8,644) Amortization of intangible assets(1) (8,491) (8,333) Expenses related to debt repaid in conjunction with the Global Offering — (23,240) Expenses related to the Global Offering — (24,805) Global Offering Stabilization Proceeds — 3,474 Reversal of restructuring charges — 877 Tax adjustments 5,041 10,638
Adjusted Net Income(2) 167,214 136,781
Notes
(1) Amortization of intangible assets above represents charges related to the amortization of other intangible assets with fi nite useful lives that were recognized in conjunction with the acquisition of the Company by the CVC Funds in 2007, as well as the acquisitions of High Sierra and Hartmann in 2012.
(2) Represents Adjusted Net Income attributable to the equity holders of the Company.

— 17 —
Directors’ Report
The Company has presented Adjusted Net Income because it believes this measure helps to give securities analysts, investors and other interested parties a better understanding of the Company’s underlying fi nancial performance. By presenting Adjusted Net Income, the Company eliminates the effect of a number of non-recurring costs and charges and certain other non-cash charges that impact its reported profi t for the year.
Adjusted Net Income is a non-IFRS fi nancial measure, and as calculated herein may not be comparable to similarly named measures used by other companies and should not be considered as a measure comparable to profi t for the year in the Company’s consolidated income statement. Adjusted Net Income has limitations as an analytical tool and should not be considered in isolation from, or as a substitute for, an analysis of the Company’s results of operations as reported under IFRS.
Liquidity and Capital Resources
The primary objective of the Company’s capital management policies is to safeguard its ability to continue as a going concern, to provide returns for shareholders, and to fund capital expenditures, normal operating expenses, working capital needs, and the payment of obligations. The Company’s primary sources of liquidity are its cash fl ows from operating activities, invested cash, available lines of credit and its ability to issue additional shares. The Company believes that its existing cash and estimated cash fl ows, along with current working capital, will be adequate to meet the operating and capital requirements of the Company for at least the next twelve months.
The Company’s net cash generated from operating activities was US$203.0 million for the year ended December 31, 2012 compared to US$64.5 million for the year ended December 31, 2011. The US$138.5 million increase in cash generated from operating activities was primarily due to a US$84.8 million increase in cash fl ows from operating assets and liabilities, as well as the US$30.4 million increase in Adjusted Net Income year-on-year.
For the year ended December 31, 2012, net cash used in investing activities was US$179.2 million, an increase of US$143.4 million compared to the previous year. This increase was primarily due to the US$142.0 million of cash outfl ow for the acquisitions of High Sierra and Hartmann during the year. Capital expenditures for the year ended December 31, 2012 amounted to US$37.9 million.
Net cash used in fi nancing activities was US$16.5 million for the year ended December 31, 2012, a decrease of US$153.8 million compared to the previous year, primarily resulting from the absence of transactions in 2012 associated with the 2011 Global Offering. The Company declared and paid a distribution of US$30.0 million to shareholders from its ad hoc distributable reserve during the year ended December 31, 2012.

— 18 —
Directors’ Report
Indebtedness
The following table sets forth the carrying amount of the Company’s loans and borrowings as of December 31, 2012 and December 31, 2011.
Expressed in thousands of US DollarsAs of December 31,
2012 2011
Revolving Credit Facility 25,000 —Finance lease obligations 97 78Other lines of credit 10,297 15,008
Total loans and borrowings 35,394 15,086Less deferred fi nancing costs (3,096) (3,319)
Total loans and borrowings less deferred fi nancing costs 32,298 11,767
The Company had US$151.4 million in cash and cash equivalents at December 31, 2012, compared to US$141.3 million at December 31, 2011.
On July 2, 2012 the Company increased its existing revolving credit facility (the “Revolving Facility”) from US$100.0 million to US$300.0 million. The facility can be increased by an additional US$100.0 million, subject to lender approval. The Revolving Facility has an initial term of three years, with a one year extension at the request of the Company and the option of the lenders. The interest rate on borrowings under the Revolving Facility is the aggregate of (i) (a) LIBOR (or EURIBOR in the case of borrowings made in Euro) or (b) the prime rate of the lender and (ii) a margin to be determined based on the Company’s leverage ratio. The Revolving Facility carries a commitment fee of 0.175% per annum on any unutilized amounts, as well as an agency fee. The Revolving Facility is secured by certain assets in the United States and Europe, as well as the Company’s intellectual property. The Revolving Facility also contains fi nancial covenants related to interest coverage and leverage ratios, and operating covenants that, among other things, limit the Company’s ability to incur additional debt, create liens on its assets, and participate in certain mergers, acquisitions, liquidations, asset sales or investments. The Company was in compliance with the fi nancial covenants as of December 31, 2012. At December 31, 2012, US$269.0 million was available to be borrowed on the Revolving Facility and US$25.0 million of borrowings were outstanding on the facility along with the utilization of US$6.0 million of the facility for outstanding letters of credit extended to certain creditors.
Certain members of the consolidated group maintain credit lines with various third party lenders in the regions in which they operate. These local credit lines provide working capital for the day-to-day business operations of such subsidiaries, including overdraft, bank guarantee, and trade fi nance and factoring facilities. The majority of these credit lines are uncommitted facilities. The total aggregate amount outstanding under the local facilities was US$10.3 million and US$15.0 million at December 31, 2012 and December 31, 2011, respectively.

— 19 —
Directors’ Report
The following represents the contractual maturity dates of the Company’s loans and borrowings (excluding the impact of netting agreements) as of December 31, 2012 and December 31, 2011.
Expressed in thousands of US DollarsAs of December 31,
2012 2011
On demand or within one year 35,330 15,015Between 1 and 2 years 22 26Between 2 and 5 years 42 37Over 5 years — 8
35,394 15,086
2. Principal Risks and Uncertainties
Details of principal risks and uncertainties can be found in notes 5 and 22 of the consolidated fi nancial statements.
In terms of fi nancial guarantees, the Company’s policy is to provide fi nancial guarantees only on behalf of subsidiaries. No other guarantees have been made to third parties.
3. Internal Control and Risk Management System
The Board places great importance on internal control and is responsible to ensure that the Company maintains sound and effective internal controls.
The Company’s internal audit department provides an independent review of the adequacy and effectiveness of the internal control system. The internal and external audit plans are discussed and agreed each year with the Audit Committee.
The Board has reviewed the overall effectiveness of the Company’s system of internal control for the year ended December 31, 2012. The Board has delegated to the Audit Committee responsibility for reviewing the Company’s internal controls and reporting the committee’s fi ndings to the Board. In conducting such review, the Audit Committee on behalf of the Board has (i) reviewed the Company’s internal audit activities during the year and discussed such activities and the results thereof with the Company’s Director of Internal Audit, (ii) reviewed and discussed the scope and results of the annual audit with the Company’s external auditors, (iii) reviewed the assessment of internal controls conducted in connection with the Company’s initial public offering, and (iv) reviewed with management the results of the Company’s internal management representation process that was performed in connection with the preparation of the annual fi nancial statements. Based on its review, the Board is not aware of any material defects in the effectiveness of internal controls.

— 20 —
Directors’ Report
4. Financial Risk Management and Hedging
The Company’s non U.S. subsidiaries periodically enter into forward contracts related to the purchase of inventory denominated primarily in US Dollars which are designated as cash fl ow hedges. Cash fl ows associated with these derivatives at December 31, 2012 are expected to be US$95.8 million within one year.
For further details on the Company’s fi nancial risk management and its exposure to price risk, credit risk, liquidity risk and cash fl ow risk, please refer to note 5 of the consolidated fi nancial statements.
5. Research and Development
The Company devotes signifi cant resources to new product design, development and innovation as it is a core part of its strategy. The Company believes it has a strong track record of innovation, and its global scale allows it to make signifi cant expenditures on research and development. The group incurred research and development expenses of US$14.6 million during the year ended December 31, 2012. Each of the Company’s regions has a design team that develops products specifi cally for that region, and who are in communication with each other on a regular basis, sharing ideas and designs. The Company’s design teams are continuously developing new products, based on continual improvement and innovation. The Company’s global research and development activities are managed by the Vice President of Global Design and Development, who is based in the Company’s Saltrio, Italy facility.
6. Capital Structure and Shareholding
Details on the capital structure of the Company can be found in note 15 of the consolidated fi nancial statements.
Since its incorporation, the Company did not proceed to acquire any of its own shares.
7. Other Information
Distributions to Shareholders
On March 27, 2012, the Company’s Board of Directors recommended that a cash distribution in the amount of US$30.0 million, or US$0.02132 per share, be made to the Company’s shareholders of record on June 15, 2012 from its ad hoc distributable reserve. The shareholders approved this distribution on June 7, 2012 at the annual general meeting and the distribution was paid on July 6, 2012.
The Board recommends that a cash distribution in the amount of US$0.02665 per share (the “Distribution”) be made to the Company’s shareholders from its ad hoc distributable reserve. The payment shall be made in US dollars, except that payment to shareholders whose names appear on the register of members in Hong Kong shall be paid in Hong Kong dollars. The relevant exchange rate shall be the opening buying rate of Hong Kong dollars to US dollars as announced by the Hong Kong Association of Banks (www.hkab.org.hk) on the day of the approval of the Distribution.
The Distribution will be subject to approval by the shareholders at the forthcoming AGM of the Company. For determining the entitlement to attend and vote at the AGM, the Register of Members of the Company will be closed from June 4, 2013 to June 6, 2013, both days inclusive, during which period no transfer of Shares will be registered. The record date to determine which shareholders will be eligible to attend and vote at the forthcoming AGM will be June 6, 2013 (the “AGM Record Date”). In order to be eligible to attend and vote at the AGM, all transfer documents accompanied by the relevant share certifi cates must be lodged with the Company’s branch Share Registrar in Hong Kong, Computershare Hong Kong Investor Services Limited, at Shops 1712–1716, 17th Floor, Hopewell Centre, 183 Queen’s Road East, Wanchai, Hong Kong for registration no later than 4:30 p.m. on June 3, 2013.

— 21 —
Directors’ Report
Subject to the shareholders approving the recommended Distribution at the forthcoming AGM, such Distribution will be payable on or about July 12, 2013 to shareholders whose names appear on the register of members on June 20, 2013 (the “Distribution Record Date”). To determine eligibility for the Distribution, the register of members will be closed from June 18, 2013 to June 20, 2013, both days inclusive, during which period no transfer of shares will be registered. In order to be entitled to receive the Distribution, all transfer documents accompanied by the relevant share certifi cates must be lodged with the Company’s branch Share Registrar in Hong Kong, Computershare Hong Kong Investor Services Limited, at Shops 1712–1716, 17th Floor, Hopewell Centre, 183 Queen’s Road East, Hong Kong, for registration not later than 4:30 p.m. on June 17, 2013.
The Distribution will not be subject to withholding tax under Luxembourg laws.
Human Resources and Remuneration
At December 31, 2012, the Company had approximately 7,070 employees worldwide, compared to approximately 6,640 employees at December 31, 2011. The Company regularly reviews remuneration and benefi ts of its employees according to the relevant market practice, employee performance and the fi nancial performance of the Company.
8. Strategic Review and Prospects
During 2012, the Company continued to implement its strategic plan in the following areas:
Positive fi nancial results
All key company metrics showed considerable growth for the year ended December 31, 2012 compared to the year ended December 31, 2011.
• Net sales increased by 13.2% to US$1,771.7 million for the year ended December 31, 2012. Excluding foreign currency effects, net sales increased by 16.8%.
• Adjusted Net Income increased by 22.2% to US$167.2 million.
• Adjusted EBITDA increased by 15.4% to US$286.5 million.
• Adjusted EBITDA margin increased to 16.2% from 15.9% refl ecting the Company’s ability to leverage its cost base against strong sales growth.
• The Company generated US$203.0 million of cash from operating activities.
Signifi cant investment in advertising and promotion
The Company maintained its signifi cant investment in marketing, which amounted to approximately 6.6% of net sales, refl ecting its commitment to advertise and promote its brands and products to support sales growth worldwide.
New products in the market
The Company continued to focus on innovation and ensuring that its products refl ect local consumer tastes in each region. Innovation and a regional focus on product development are key drivers of sales growth and are the means to deliver quality and value to the Company’s customers.

— 22 —
Directors’ Report
Expanded distribution network
The Company continued the further expansion of its distribution network by adding approximately 5,000 points of sale during the year ended December 31, 2012.
AcquisitionsThe Company sought out acquisition opportunities that presented a compelling strategic and fi nancial rationale. The Company completed the following acquisitions during 2012:
(a) High Sierra Sport Company
On July 17, 2012, certain of the Company’s wholly-owned subsidiaries (the “Samsonite Purchasers”) entered into an Asset Purchase Agreement with High Sierra Sport Company (“High Sierra”), pursuant to which, on July 31, 2012, the Samsonite Purchasers purchased substantially all of the assets of High Sierra for a net cash consideration of US$108.0 million.
Upon the consummation of the acquisition, the Samsonite Purchasers purchased substantially all of the assets of High Sierra excluding cash, certain receivables, and certain other retained assets and assumed all balance sheet liabilities and certain contractual liabilities of High Sierra.
The acquisition gives the Company a strong brand and product offering that provides a larger foothold in the North American casual bag market. It also provides the Company with opportunities to leverage its well-established global distribution network and retail presence to signifi cantly expand the High Sierra brand in additional markets in Asia, Europe and Latin America.
Please refer to note 8 of the accompanying consolidated fi nancial statements for further details on the acquisition of High Sierra.
(b) HL Operating Corp. doing business as Hartmann
On August 2, 2012, a wholly-owned subsidiary of the Company (the “Samsonite Purchaser”) entered into a Merger Agreement with HL Operating Corp. (“Hartmann”), pursuant to which, on August 2, 2012, the Samsonite Purchaser completed the acquisition, by way of merger, of all of the outstanding shares of the capital stock of Hartmann for a net cash consideration of US$34.0 million.
The Hartmann brand has a 135-year heritage and a tradition of stylish design and impeccable quality. The acquisition gives the Company a strong brand to expand its presence in the luxury luggage and leather goods market as well as opportunities to leverage the Company’s well-established global distribution network and retail presence to signifi cantly expand the Hartmann brand both in the U.S. and internationally.
Please refer to note 8 of the accompanying consolidated fi nancial statements for further details on the acquisition of Hartmann.

— 23 —
Directors’ Report
Future Prospects
The Company’s growth strategy will continue as planned for 2013, while focusing on the following:
• continue to gain market share by leveraging the strength of the Company’s brands, Samsonite, American Tourister, High Sierra and Hartmann, across all of its markets while continuing to capitalize on the robust growth in international travel;
• expand the geographic reach of the newly acquired High Sierra and Hartmann brands;
• introduce new and innovative product designs, adapted to the needs of consumers in different markets, while staying true to the Company’s core values of lightness, strength and functionality;
• improve the effi ciency and effectiveness of the Company’s supply chain and global distribution network;
• increase the Company’s investment in R&D and marketing broadly in line with sales growth;
• allocate more resources to the business, casual and accessory product categories, where the Company’s share is relatively low; and
• actively evaluate acquisition opportunities that have a compelling strategic fi t, leveraging a strong management team and balance sheet capacity.
The Company aims to deliver top-line growth, maintain gross margins, increase Adjusted EBITDA margins and enhance shareholder value.
9. Subsequent Events
Please refer to note 28 of the consolidated fi nancial statements for further details on subsequent events.

— 24 —
Report of the Réviseur d’Entreprises Agréé
To the ShareholdersSamsonite International S.A.13-15, Avenue de la LibertéL-1931 Luxembourg
REPORT OF THE REVISEUR D’ENTREPRISES AGREE
Report on the consolidated fi nancial statements
We have audited the accompanying consolidated fi nancial statements of Samsonite International S.A., which comprise the consolidated statement of fi nancial position as at December 31, 2012 and the consolidated statement of comprehensive income, consolidated statement of changes in equity and consolidated cash fl ow statement for the year then ended, and a summary of signifi cant accounting policies and other explanatory information.
Board of Directors’ responsibility for the consolidated fi nancial statements
The Board of Directors is responsible for the preparation and fair presentation of these consolidated fi nancial statements in accordance with International Financial Reporting Standards as adopted by the European Union, and for such internal control as the Board of Directors determines is necessary to enable the preparation of consolidated fi nancial statements that are free from material misstatement, whether due to fraud or error.
Responsibility of the Réviseur d’Entreprises agréé
Our responsibility is to express an opinion on these consolidated fi nancial statements based on our audit. We conducted our audit in accordance with International Standards on Auditing as adopted for Luxembourg by the Commission de Surveillance du Secteur Financier. Those standards require that we comply with ethical requirements and plan and perform the audit to obtain reasonable assurance about whether the consolidated fi nancial statements are free from material misstatement.
An audit involves performing procedures to obtain audit evidence about the amounts and disclosures in the consolidated fi nancial statements. The procedures selected depend on the judgement of the Réviseur d’Entreprises agréé, including the assessment of the risks of material misstatement of the consolidated fi nancial statements, whether due to fraud or error. In making those risk assessments, the Réviseur d’Entreprises agréé considers internal control relevant to the entity’s preparation and fair presentation of the consolidated fi nancial statements in order to design audit procedures that are appropriate in the circumstances, but not for the purpose of expressing an opinion on the effectiveness of the entity’s internal control. An audit also includes evaluating the appropriateness of accounting policies used and the reasonableness of accounting estimates made by the Board of Directors, as well as evaluating the overall presentation of the consolidated fi nancial statements.
We believe that the audit evidence we have obtained is suffi cient and appropriate to provide a basis for our audit opinion.

— 25 —
Report of the Réviseur d’Entreprises Agréé
Opinion
In our opinion, the consolidated fi nancial statements give a true and fair view of the consolidated fi nancial position of Samsonite International S.A. as of December 31, 2012, and of its consolidated fi nancial performance and its consolidated cash fl ows for the year then ended in accordance with International Financial Reporting Standards as adopted by the European Union.
Report on other legal and regulatory requirements
The consolidated management report, which is the responsibility of the Board of Directors, is consistent with the consolidated fi nancial statements.
Luxembourg, 18 March 2013 KPMG Luxembourg S.à r.l. Cabinet de révision agréé
Jean-Manuel Séris

— 26 —
Consolidated Income Statement
(Expressed in thousands of US Dollars, except per share data)
Year ended December 31,
Note 2012 2011
Net sales 7 1,771,726 1,565,147Cost of sales (820,721) (708,199)
Gross profi t 951,005 856,948
Distribution expenses (466,471) (410,889)Marketing expenses (117,211) (122,822)General and administrative expenses (121,132) (113,613)Other expenses (income) (4,449) 306
Operating profi t 241,742 209,930
Finance income 24 1,187 1,247Finance costs 24 (18,229) (71,879)
Net fi nance costs (17,042) (70,632)
Profi t before income tax 25 224,700 139,298Income tax expense 23 (58,073) (35,680)
Profi t for the year 166,627 103,618
Profi t attributable to the equity holders 148,439 86,748Profi t attributable to non-controlling interests 18,188 16,870
Profi t for the year 166,627 103,618
Earnings per share Basic and diluted earnings per share (Expressed in US Dollars per share) 16 0.11 0.06
The accompanying notes form part of the consolidated fi nancial statements.

— 27 —
Consolidated Statement of Comprehensive Income
(Expressed in thousands of US Dollars)
Year ended December 31,
Note 2012 2011
Profi t for the year 166,627 103,618
Other comprehensive loss: Recognition of previously unrecognized deferred tax on defi ned benefi t plans 23 34,899 — Actuarial losses on defi ned benefi t plans 18 (26,829) (12,886) Changes in fair value of cash fl ow hedges (6,267) 5,401 Foreign currency translation (losses)/gains for foreign operations 8,134 (15,357) Income tax benefi t (expense) on other comprehensive income (loss) items 12,392 (1,586)
Other comprehensive income (loss) 22,329 (24,428)
Total comprehensive income 188,956 79,190
Total comprehensive income attributable to the equity holders 169,982 64,585Total comprehensive income attributable to non-controlling interests 18,974 14,605
Total comprehensive income for the year 188,956 79,190
The accompanying notes form part of the consolidated fi nancial statements.

— 28 —
Consolidated Statement of Financial Position
(Expressed in thousands of US Dollars)
December 31,
Note 2012 2011
Non-Current AssetsProperty, plant and equipment, net 9 135,824 127,975Goodwill 10(a) 214,356 153,212Other intangible assets, net 10(b) 671,522 619,438Deferred tax assets 23(d) 55,302 14,023Other assets and receivables 11(a) 22,793 18,500
Total non-current assets 1,099,797 933,148
Current AssetsInventories 12 277,516 236,957Trade and other receivables, net 13 222,159 171,552Prepaid expenses and other assets 11(b) 62,293 61,630Cash and cash equivalents 14 151,399 141,259
Total current assets 713,367 611,398
Total assets 1,813,164 1,544,546
Equity and LiabilitiesEquity: Share capital 15 14,071 14,071 Reserves 15 1,037,522 904,060
Total equity attributable to equity holders 1,051,593 918,131 Non-controlling interests 15 34,512 27,069
Total equity 1,086,105 945,200
Non-Current LiabilitiesLoans and borrowings 17(a) 64 71Employee benefi ts 18 68,378 59,725Non-derivative fi nancial instruments 15(g) 44,950 29,522Deferred tax liabilities 23 113,809 120,307Other liabilities 6,319 6,252
Total non-current liabilities 233,520 215,877
Current LiabilitiesLoans and borrowings 17(b) 32,234 11,696Employee benefi ts 49,977 45,182Trade and other payables 21 362,488 286,560Current tax liabilities 23(d) 48,840 40,031
Total current liabilities 493,539 383,469
Total liabilities 727,059 599,346
Total equity and liabilities 1,813,164 1,544,546
Net current assets 219,828 227,929
Total assets less current liabilities 1,319,625 1,161,077
The accompanying notes form part of the consolidated fi nancial statements.

— 29 —
Con
soli
dat
ed S
tate
men
t of
Ch
ange
s in
Eq
uit
y(E
xpre
ssed
in
thou
sand
s of
US
Dol
lars
, exc
ept
num
ber
of s
hare
s)
Res
erve
s
Not
eN
umbe
r of
sh
ares
Shar
e ca
pita
l
Cla
ss B
pr
efer
ence
sh
are
rese
rve
Add
itio
nal
paid
-in
capi
tal
Tra
nsla
tion
re
serv
eO
ther
re
serv
es
Ret
aine
d ea
rnin
gs
(acc
umul
ated
de
fi cit
)
Tot
al e
quit
y at
trib
utab
le
to e
quit
y ho
lder
s
Non
-co
ntro
lling
in
tere
stT
otal
eq
uity
Yea
r en
ded
Dec
embe
r 31
, 201
1:B
alan
ce, J
anua
ry 1
, 201
12,
221,
394,
998
22,2
1417
,490
814,
506
4,07
3(7
9,70
9)(3
8,36
6)74
0,20
822
,644
762,
852
Profi
t fo
r th
e ye
ar—
——
——
—86
,748
86,7
4816
,870
103,
618
Oth
er c
ompr
ehen
sive
inco
me
(los
s):
A
ctua
rial
loss
es o
n de
fi ned
ben
efi t
plan
s, n
et o
f ta
x18
——
——
—(1
2,88
6)—
(12,
886)
—(1
2,88
6)
Cha
nges
in f
air
valu
e of
cas
h fl o
w h
edge
s, n
et o
f ta
x—
——
——
3,81
5—
3,81
5—
3,81
5
Fore
ign
curr
ency
tran
slat
ion
loss
es—
——
—(1
3,09
2)—
—(1
3,09
2)(2
,265
)(1
5,35
7)
Tot
al c
ompr
ehen
sive
inco
me
(los
s) f
or th
e ye
ar—
——
—(1
3,09
2)(9
,071
)86
,748
64,5
8514
,605
79,1
90
Tra
nsac
tions
with
ow
ners
rec
orde
d di
rect
ly in
equ
ity:
Sh
are-
base
d co
mpe
nsat
ion
——
—20
0—
——
200
—20
0
Gua
rant
eed
retu
rn o
n cl
ass
B p
refe
renc
e sh
ares
15—
—6,
489
——
—(6
,489
)—
——
C
onve
rsio
n of
pre
fere
nce
shar
es to
loan
not
es6,
15
(78,
000,
000)
(780
)(2
3,97
9)(7
6,23
0)—
——
(100
,989
)—
(100
,989
)
Con
trib
utio
n of
Del
ilah
Hol
ding
s S.
á.r.
l. sh
ares
6, 1
5(2
,143
,394
,998
)(2
1,43
4)—
——
——
(21,
434)
—(2
1,43
4)
Issu
ance
of
shar
e ca
pita
l to
Del
ilah
Hol
ding
s S.
á.r.
l. eq
uity
hol
ders
6, 1
51,
286,
036,
999
12,8
60—
8,57
4—
——
21,4
34—
21,4
34
Issu
ance
of
ordi
nary
sha
res
upon
Glo
bal O
ffer
ing
6, 1
512
1,10
0,00
51,
211
—22
4,04
1—
——
225,
252
—22
5,25
2
Tra
nsac
tion
cost
s as
soci
ated
with
Glo
bal O
ffer
ing
6, 1
5—
——
(8,8
99)
——
—(8
,899
)—
(8,8
99)
C
hang
e in
fai
r va
lue
of p
ut o
ptio
ns15
——
——
——
(2,2
26)
(2,2
26)
—(2
,226
)
Div
iden
ds p
aid
to n
on-c
ontr
ollin
g in
tere
sts
——
——
——
——
(5,3
90)
(5,3
90)
O
ther
tran
sact
ions
——
——
——
——
(4,7
90)
(4,7
90)
Bal
ance
, Dec
embe
r 31
, 201
11,
407,
137,
004
14,0
71—
962,
192
(9,0
19)
(88,
780)
39,6
6791
8,13
127
,069
945,
200
Yea
r en
ded
Dec
embe
r 31
, 201
2:B
alan
ce, J
anua
ry 1
, 201
21,
407,
137,
004
14,0
71—
962,
192
(9,0
19)
(88,
780)
39,6
6791
8,13
127
,069
945,
200
Profi
t fo
r th
e ye
ar—
——
——
—14
8,43
914
8,43
918
,188
166,
627
Oth
er c
ompr
ehen
sive
inco
me
(los
s):
A
ctua
rial
loss
es o
n de
fi ned
ben
efi t
plan
s, n
et o
f ta
x18
——
——
—(1
6,39
0)—
(16,
390)
—(1
6,39
0)
Rec
ogni
tion
of p
revi
ousl
y un
reco
gniz
ed d
efer
red
tax
on
defi n
ed b
enefi
t pl
ans
23—
——
——
34,8
99—
34,8
99—
34,8
99
Cha
nges
in f
air
valu
e of
cas
h fl o
w h
edge
s, n
et o
f ta
x—
——
——
(4,3
14)
—(4
,314
)—
(4,3
14)
Fo
reig
n cu
rren
cy tr
ansl
atio
n ga
ins
(los
ses)
——
——
7,34
8—
—7,
348
786
8,13
4
Tot
al c
ompr
ehen
sive
inco
me
(los
s) f
or th
e ye
ar—
——
—7,
348
14,1
9514
8,43
916
9,98
218
,974
188,
956
Tra
nsac
tions
with
ow
ners
rec
orde
d di
rect
ly in
equ
ity:
C
hang
e in
fai
r va
lue
of p
ut o
ptio
ns15
——
——
——
(6,5
20)
(6,5
20)
—(6
,520
)
Cas
h di
stri
butio
ns to
equ
ity h
olde
rs16
——
——
——
(30,
000)
(30,
000)
—(3
0,00
0)
Div
iden
ds p
aid
to n
on-c
ontr
ollin
g in
tere
sts
——
——
——
——
(6,4
79)
(6,4
79)
O
ther
tran
sact
ions
——
——
——
——
(5,0
52)
(5,0
52)
Bal
ance
, Dec
embe
r 31
, 201
21,
407,
137,
004
14,0
71—
962,
192
(1,6
71)
(74,
585)
151,
586
1,05
1,59
334
,512
1,08
6,10
5
The
acc
ompa
nyin
g no
tes
form
par
t of
the
con
soli
date
d fi
nanc
ial
stat
emen
ts.

— 30 —
Consolidated Statement of Cash Flows
(Expressed in thousands of US Dollars)
Year ended December 31,
Note 2012 2011
Cash fl ows from operating activities: Profi t for the year 166,627 103,618 Adjustments to reconcile profi t to net cash generated from operating activities: Gain on sale and disposal of assets, net (211) (252) Depreciation 9 31,770 30,158 Amortization of intangible assets 10 8,491 8,333 Provision for doubtful accounts 1,861 806 Reversal of provision for restructuring activities — (877) Change in fair value of put options 8,908 8,644 Net change in defi ned benefi t pension plan 18 (17,260) (29,989) Non-cash interest expense — 32,806 Non-cash share-based compensation — 200 Income tax expense 23 58,073 35,680
258,259 189,127
Changes in operating assets and liabilities (excluding the effects of acquisitions): Trade and other receivables (32,747) (33,244) Inventories (20,671) (24,628) Other current assets 4,727 258 Trade and other payables 64,022 (6,906) Other assets and liabilities, net (13,510) (18,505)
Cash generated from operating activities 260,080 106,102
Interest paid (2,945) (4,299) Income tax paid (54,143) (37,301)
Net cash generated from operating activities 202,992 64,502
Cash fl ows from investing activities: Purchases of property, plant and equipment 9 (37,941) (37,172) Acquisition of businesses, net of cash acquired 8 (141,953) — Other proceeds 713 1,401
Net cash used in investing activities (179,181) (35,771)

— 31 —
Consolidated Statements of Cash Flow (cont.)
Year ended December 31,
Note 2012 2011
Cash fl ows from fi nancing activities: Current loans and borrowings proceeds 17 21,034 2,766 Non-current loans and borrowings payments 17 — (279,051) Cash distributions to equity holders 16 (30,000) — Proceeds from issuance of share capital 6 — 225,252 Transaction costs associated with Global Offering recognized in equity 6 — (8,899) Loan note payments 6 — (100,989) Payment of debt issue costs (1,069) (3,981) Dividend payments to non-controlling interests (6,479) (5,390)
Net cash used in fi nancing activities (16,514) (170,292)
Net increase (decrease) in cash and cash equivalents 7,297 (141,561)Cash and cash equivalents, at January 1 141,259 285,798Effect of exchange rate changes on cash and cash equivalents 2,843 (2,978)
Cash and cash equivalents, at December 31 14 151,399 141,259
The accompanying notes form part of the consolidated fi nancial statements.

— 32 —
Notes to the Consolidated Financial Statements
1. Background
Samsonite International S.A. (together with its consolidated subsidiaries, the “Company”) is principally engaged in the design, manufacture, sourcing and distribution of luggage, business and computer bags, outdoor and casual bags, and travel accessories throughout the world, primarily under the Samsonite®, American Tourister®, High Sierra® and Hartmann® brand names and other owned and licensed brand names. The Company sells its products through a variety of wholesale distribution channels and through its company operated retail stores. The principal luggage wholesale distribution customers of the Company are department and specialty retail stores, mass merchants, catalog showrooms and warehouse clubs. The Company sells its products primarily in Asia, Europe, North America and Latin America.
The Company completed an initial public offering of its ordinary shares on the Main Board of The Stock Exchange of Hong Kong Limited on June 16, 2011 (the “Global Offering”). The Company was incorporated in Luxembourg on March 8, 2011 as a public limited liability company (a société anonyme), whose registered offi ce is 13–15 Avenue de la Liberté, L-1931, Luxembourg. Prior to the completion of the Global Offering, on June 10, 2011 the Company became the parent company of the consolidated subsidiaries. The benefi cial owners of the ordinary shares of Delilah Holdings S.à.r.l. (“OldCo”), the previous parent company of the consolidated subsidiaries, contributed their ordinary shares in OldCo to the Company in consideration for the issue of ordinary shares in the Company. See further details and discussion in note 6.
Details of the principal subsidiaries of the Company are set out in note 27.
2. Basis of Preparation
(a) Statement of Compliance
The consolidated fi nancial statements have been prepared in accordance with International Financial Reporting Standards (“IFRS”), which collective term includes all International Financial Reporting Standards as adopted by the European Union (“IFRS as adopted by the EU”).
The International Accounting Standards Board (“IASB”) has issued a number of new and revised IFRSs. For the purpose of preparing the consolidated fi nancial statements, the Company has adopted all these new and revised IFRSs for all periods presented, except for any new standards or interpretations that are not yet mandatorily effective for the accounting period ended December 31, 2012. The revised and new accounting standards and interpretations issued but not yet effective for the accounting period ended December 31, 2012 are set out in note 3(u).
The accounting policies below have been applied consistently to all periods presented in the consolidated fi nancial statements.
The consolidated fi nancial statements were authorized for issue by the Board of Directors on March 18, 2013.

— 33 —
Notes to the Consolidated Financial Statements
(b) Basis of Measurement
The consolidated fi nancial statements have been prepared on the historical cost basis except for the following material items in the consolidated statements of fi nancial position as set out in the accounting policies below:
• derivative fi nancial instruments are measured at fair value.
• the defi ned benefi t liability is recognized as the net total of the plan assets, plus unrecognized past service cost and unrecognized actuarial losses, less unrecognized actuarial gains and the present value of the defi ned benefi t obligation.
(c) Functional and Presentation Currency
The fi nancial statements are measured using the currency of the primary economic environment in which the Company operates (functional currency). The functional currencies of the Company’s signifi cant subsidiaries are the currencies of the primary economic environment and key business processes of these subsidiaries and include, but are not limited to, United States Dollars, Euros, and Renminbi.
Unless otherwise stated, the consolidated fi nancial statements are presented in the United States Dollar (“USD”), which is the functional and presentation currency of the Company.
(d) Use of Judgments, Estimates and Assumptions
The preparation of consolidated fi nancial statements in conformity with IFRS requires the use of certain critical accounting estimates. It also requires management to exercise its judgment in the process of applying the Company’s accounting policies and to make estimates and assumptions that affect the reported amounts of assets and liabilities, disclosure of contingent assets and liabilities at the date of the consolidated fi nancial statements and the reported amounts of revenues and expenses during the reporting period. The estimates and associated assumptions are based on historical experience and various other factors that are believed to be reasonable under the circumstances, the results of which form the basis of making the judgments about carrying values of assets and liabilities that are not readily apparent from other sources. Actual results may differ from these estimates under different assumptions and conditions.
The estimates and underlying assumptions are reviewed on an ongoing basis. Revisions to accounting estimates are recognized in the period in which the estimate is revised if the revision affects only that period, or in the period of the revision and future periods if the revision affects both current and future periods.
Information about critical judgments in applying accounting policies that have the most signifi cant effect on the amounts recognized in the consolidated fi nancial statements is included in the following notes:
• Note 3(n) — Revenue recognition
• Note 8 — Business combinations
• Note 9 — Property, plant and equipment
• Note 10 — Goodwill and other intangible assets

— 34 —
Notes to the Consolidated Financial Statements
• Note 12 — Inventories
• Note 13 — Allowances for trade and other receivables
• Note 15 — Non-controlling interests
• Note 18 — Obligations under defi ned benefi t plans
• Note 22 — Fair value of fi nancial instruments
• Note 23 — Income taxes
Information about assumptions and estimation uncertainties that may have an effect on the consolidated fi nancial statements resulting in a material adjustment within the next fi nancial year are included in the following notes:
• Note 18 — Measurement of plan assets and defi ned benefi t obligation
• Note 20 — Contingent liabilities
• Note 22 — Financial instruments
• Note 23 — Utilization of tax losses
(e) Changes in Accounting Policies
The IASB has issued a number of new and revised IFRSs. For the purpose of preparing the consolidated fi nancial information, there were no new or revised IFRSs yet effective for the year ended December 31, 2012. The Company has not applied any new standard or interpretation that is not yet mandatorily effective for the current accounting period.
3. Summary of Signifi cant Accounting Policies
The accounting policies set out below have been applied consistently by the Company and its subsidiaries to all periods presented in these consolidated fi nancial statements. Certain comparative amounts have been reclassifi ed to conform to the presentation adopted in the current year. None of the changes impacts the Company’s previously reported consolidated net sales, gross profi t, operating profi t, income tax expense, profi t for the year, earnings per share, net cash generated from operating activities, investing activities or fi nancing activities, or the statement of fi nancial position.
(a) Principles of Consolidation
(i) Subsidiaries
Subsidiaries are entities controlled by the Company. Control exists when the Company has the power to govern the fi nancial and operating policies of an entity so as to obtain benefi ts from its activities.
The fi nancial information of subsidiaries is included in the consolidated fi nancial statements from the date that control commences until the date that control ceases. All signifi cant intercompany balances and transactions have been eliminated in consolidation.

— 35 —
Notes to the Consolidated Financial Statements
(ii) Non-controlling Interests
Non-controlling interests are presented in the consolidated statement of fi nancial position within equity, separately from equity attributable to the equity holders of the Company. Non-controlling interests in the results of the Company are presented in the consolidated income statement and consolidated statement of comprehensive income as an allocation of the total profi t or loss and total comprehensive income for the period between non-controlling interests and the equity holders of the Company.
Changes in the Company’s interests in a subsidiary that do not result in a loss of control are accounted for as equity transactions, whereby adjustments are made to the amounts of controlling and non-controlling interests within consolidated equity to refl ect the change in relative interests, but no adjustments are made to goodwill and no gain or loss is recognized.
When the Company loses control of a subsidiary, it is accounted for as a disposal of the entire interest in that subsidiary, with a resulting gain or loss being recognized in profi t or loss. Any interest retained in that former subsidiary at the date when control is lost is recognized at fair value and this amount is regarded as the fair value on initial recognition of a fi nancial asset.
(iii) Business Combinations
Business combinations are accounted for using the acquisition method at the acquisition date, which is the date on which control is obtained by the Company. In assessing control, the Company takes into consideration potential voting rights that are currently exercisable.
The Company measures goodwill at the acquisition date as the excess of the aggregate of the fair value of the consideration transferred, the amount of any non-controlling interests in the acquiree and the fair value of the Company’s previously held equity interest in the acquiree; over the Company’s interest in the net fair value of the acquiree’s identifi able assets and liabilities measured at the acquisition date. If the net fair value is greater than the consideration transferred, then this excess is recognized immediately in profi t or loss as a gain on a bargain purchase.
The consideration transferred does not include amounts related to the settlement of pre-existing relationships. Such amounts generally are recognized in profi t or loss.
Transaction costs, other than those associated with the issue of debt or equity securities, that the Company incurs in connection with a business combination are expensed as incurred.
Any contingent consideration payable is measured at fair value at the acquisition date. If the contingent consideration is classifi ed as equity, then it is not remeasured and settlement is accounted for within equity. Otherwise, subsequent changes in the fair value of the contingent consideration are recognized in profi t or loss.

— 36 —
Notes to the Consolidated Financial Statements
When share-based payment awards (“replacement awards”) are required to be exchanged for awards held by the acquiree’s employees (“acquiree’s awards”) and relate to past services, then all or a portion of the amount of the acquirer’s replacement awards is included in measuring consideration transferred in the business combination. This determination is based on the market-based value of the replacement awards compared with the market-based value of the acquiree’s awards and the extent to which the replacement awards relate to past and/or future service.
(b) Foreign Currency Translation and Exchange Risk
(i) Foreign Currency Transactions
Foreign currency transactions are translated using foreign exchange rates prevailing at the dates of the transactions. Monetary assets and liabilities denominated in foreign currencies at the reporting date are retranslated to the functional currency at the exchange rate at that date. Foreign currency differences arising on retranslation are recognized in profi t or loss, except for differences arising on the retranslation of qualifying cash fl ow hedges, which are recognized in other comprehensive income. The foreign currency gain or loss on monetary items is the difference between amortized cost in the functional currency at the beginning of the period, adjusted for effective interest and payments during the period, and the amortized cost in foreign currency translated at the exchange rate at the end of the reporting period. Non-monetary assets and liabilities denominated in foreign currencies that are measured at fair value are retranslated to the functional currency at the exchange rate at the date that the fair value was determined. Non-monetary items that are measured in terms of historical cost in a foreign currency are translated using the exchange rate at the date of the transaction.
(ii) Foreign Operations
The assets and liabilities of the Company’s foreign subsidiaries are translated into USD at period end exchange rates. Equity accounts denominated in foreign currencies are translated into USD at historical exchange rates. Income and expense accounts are translated at average monthly exchange rates. The net exchange gains or losses resulting from translating at varied exchange rates are recorded as a component of other comprehensive income and accumulated in equity and attributed to non-controlling interests, as appropriate.
(c) Segment Reporting
An operating segment is a component of the Company that engages in business activities from which it may earn revenues and incur expenses, including revenues and expenses that relate to transactions with any of the Company’s other components. All operating segments’ operating results are reviewed regularly by the Company’s management to make decisions about resources to be allocated to the segment and assess its performance, and for which discrete fi nancial information is available.
The Company’s segment reporting is based on geographical areas, representative of how the Company’s business is managed and its operating results are evaluated. The Company’s operations are organized as follows; (i) “Asia”; (ii) “Europe”; (iii) “North America”; (iv) “Latin America”, and (v) “Corporate”, which are set out in note 7.

— 37 —
Notes to the Consolidated Financial Statements
Segment results that are reported to management include items directly attributable to a segment as well as those that can be allocated on a reasonable basis. Unallocated items comprise mainly corporate assets, head offi ce expenses, income tax assets and liabilities, and licensing activities from the license of brand names owned by the Company.
Segment capital expenditure is the total cost incurred during the period to acquire property, plant and equipment.
(d) Property, Plant and Equipment
Items of property, plant and equipment are measured at cost less accumulated depreciation and accumulated impairment losses. Cost includes expenditures that are directly attributable to the acquisition of the asset. Assets under fi nance leases are stated at the present value of the future minimum lease payments. Improvements which extend the life of an asset are capitalized. Maintenance and repair costs are expensed as incurred.
When parts of an item of property, plant and equipment have different useful lives, they are accounted for as separate items (major components).
Gains and losses arising from the retirement or disposal of an item of property, plant and equipment are determined by comparing the proceeds from disposal with the carrying amount of property, plant and equipment, and are recognized in profi t or loss on the date of retirement or disposal.
Depreciation and amortization are provided on the straight-line method over the estimated useful life of the asset or the lease term, if applicable, as follows:
Buildings 20 to 30 yearsMachinery, equipment and other 3 to 10 yearsLeasehold improvements lesser of useful life or the lease term
Depreciation methods, useful lives and residual values are reviewed annually and adjusted if appropriate. Land owned by the Company with freehold interest is not depreciated.
The Company capitalizes the costs of purchased software and costs to confi gure, install and test software and includes these costs within machinery, equipment and other in the consolidated statement of fi nancial position. Software assessment and evaluation, process reengineering, data conversion, training, maintenance and ongoing software support costs are expensed.
(e) Goodwill and Other Intangible Assets
(i) Goodwill
Goodwill that arises upon the acquisition of subsidiaries is included in intangible assets. For measurement of goodwill at initial recognition, see note 3(a)(iii). Subsequent to initial recognition, goodwill is stated at cost less accumulated impairment losses. Goodwill arising on a business combination is allocated to each cash-generating unit (CGU), or groups of cash-generating units, that are expected to benefi t from the synergies of the combination and is tested annually for impairment (see note 10).

— 38 —
Notes to the Consolidated Financial Statements
(ii) Intangible Assets (other than Goodwill)
Intangible assets consist of tradenames, customer relationships, patents and leasehold rights. No recognized intangible assets have been generated internally.
Intangible assets which are considered to have an indefi nite life, tradenames, are measured at cost less accumulated impairment losses and are not amortized but are tested for impairment at least annually or more frequently if events or circumstances indicate that the asset may be impaired. Samsonite®, American Tourister®, High Sierra® and Hartmann®are the signifi cant tradenames of the Company. It is anticipated that the economic benefi ts associated with these tradenames will continue for an indefi nite period. The conclusion that the tradenames are an indefi nite lived asset is reviewed annually to determine whether events and circumstances continue to support the indefi nite useful life assessment for that asset. If they do not, the change in the useful life assessment from indefi nite to fi nite is accounted for prospectively from the date of change and in accordance with the policy for amortization of intangible assets with fi nite lives as set out below.
Intangible assets which have a fi nite life are amortized and measured at cost less accumulated amortization and accumulated impairment losses. Amortization expense is recognized in profi t or loss on a straight-line basis over the estimated useful lives from the date that they are available for use, as this most closely refl ects the expected pattern of consumption of the future economic benefi ts embodied in the assets. The estimated useful lives are as follows:
Customer relationships 10 to 20 yearsLeasehold rights 3 to 6 yearsPatents 1 to 10 years
Intangible assets having a fi nite life are reviewed for impairment whenever events or changes in circumstances indicate that the carrying amount of an asset may not be recoverable. Estimated useful lives of intangible assets are reviewed annually and adjusted if applicable.
(f) Impairment
(i) Financial Assets (Including Trade and Other Receivables)
A fi nancial asset not carried at fair value through profi t or loss is assessed at each reporting date to determine whether there is objective evidence that it is impaired. A fi nancial asset is impaired if objective evidence indicates that a loss event has occurred after the initial recognition of the asset, and that the loss event had a negative effect on the estimated future cash fl ows of that asset that can be estimated reliably. The allowance account for receivables is used to record impairment losses unless the Company believes recovery is remote and the impairment loss is applied directly against the fi nancial asset.
Objective evidence that fi nancial assets are impaired can include default or delinquency by a debtor, restructuring of an amount due to the Company on terms that the Company would not consider otherwise, or indications that a debtor or issuer will enter bankruptcy.

— 39 —
Notes to the Consolidated Financial Statements
The Company considers evidence of impairment for receivables at both a specifi c asset and collective level. All individually signifi cant receivables are assessed for specifi c impairment. All individually signifi cant receivables found not to be specifi cally impaired are then collectively assessed for any impairment that has been incurred but not yet identifi ed.
In assessing collective impairment, the Company uses historical trends, adjusted for management’s judgment as to whether current economic and credit conditions are such that the actual losses are likely to be greater or less than suggested by historical trends. Impairment losses that have been recognized in prior periods are assessed at each reporting date for any indications that the loss has decreased or no longer exists. An impairment loss is reversed if there has been a change in the estimates used to determine the recoverable amount.
(ii) Non-fi nancial Assets
The carrying amounts of the Company’s non-fi nancial assets, other than inventories and deferred tax assets, are reviewed at each reporting date to determine whether there is any indication of impairment. If any such indication exists, then the asset’s recoverable amount is estimated. For those CGUs or group of CGUs that to which goodwill has been allocated and intangible assets that have indefi nite useful lives, the recoverable amount is estimated each year at the same time.
The recoverable amount of an asset or CGU is the greater of its value in use and its fair value less costs to sell. In assessing value in use, the estimated future cash fl ows are discounted to their present value using an appropriate discount rate that refl ects current market assessments of the time value of money and the risks specifi c to the asset. For the purpose of impairment testing, assets that cannot be tested individually are grouped together into the smallest group of assets that generates cash infl ows from continuing use that are largely independent of the cash infl ows of other assets or groups of assets (the “CGU”). For the purposes of goodwill impairment testing, goodwill acquired in a business combination is allocated to the group of CGUs that is expected to benefi t from the synergies of the combination. This allocation is subject to an operating segment before aggregation ceiling test and refl ects the lowest level at which that goodwill is monitored for internal reporting purposes to the asset or CGU.
The Company’s corporate assets do not generate separate cash infl ows. If there is an indication that a corporate asset may be impaired, then the recoverable amount is determined for the CGU to which the corporate asset belongs.
An impairment loss is recognized if the carrying amount of an asset or its CGU exceeds its estimated recoverable amount. Impairment losses are recognized in profi t or loss. Impairment losses recognized in respect of CGUs are allocated fi rst to reduce the carrying amount of any goodwill allocated to the group of units, and then to reduce the carrying amounts of the other assets in the unit (group of units) on a pro rata basis.

— 40 —
Notes to the Consolidated Financial Statements
An impairment loss that has been recognized on goodwill is not reversed in subsequent periods if estimates used to determine the recoverable amount change. For other assets, impairment losses that have been recognized in prior periods are assessed at each reporting date for any indications that the loss has decreased or no longer exists. An impairment loss is reversed if there has been a change in the estimates used to determine the recoverable amount. An impairment loss is reversed only to the extent that the asset’s carrying amount does not exceed the carrying amount that would have been determined, net of depreciation or amortization, if no impairment loss had been recognized.
(g) Inventories
Inventories are carried at the lower of cost or net realizable value. Cost is calculated using the weighted average method. The cost of inventory includes expenditures incurred in acquiring the inventories, production costs and other costs incurred in bringing them to their existing location and condition. In the case of manufactured inventories and work in progress, cost includes an appropriate share of production overheads based on normal operating capacity. Cost also may include transfers from other comprehensive income of any gain or loss on qualifying cash fl ow hedges of foreign currency purchases of inventories. Net realizable value is the estimated selling price in the ordinary course of business, less the estimated costs of completion and selling expenses.
When inventories are sold, the carrying amount of those inventories is recognized as an expense in the period in which the related revenue is recognized. The amount of any write-down of inventories to net realizable value and all losses of inventories are recognized as expenses in the period the write-down or loss occurs. The amount of any reversal of any write-down of inventories is recognized as a reduction in the amount of inventories recognized as an expense in the period in which the reversal occurs.
(h) Cash and Cash Equivalents
Cash and cash equivalents includes cash held at banks, deposits held at call with banks, and other short-term highly liquid investments that are readily convertible into known amounts of cash and which are subject to an insignifi cant risk of changes in value, having been within three months of maturity at acquisition.
(i) Trade and Other Payables
Trade and other payables are initially recognized at fair value. Trade and other payables are subsequently measured at amortized cost using the effective interest method.
(j) Interest-bearing Borrowings
Interest-bearing borrowings are recognized initially at fair value less attributable transaction costs. Subsequent to initial recognition, interest-bearing borrowings are stated at amortized cost with any difference between the amount initially recognized and redemption value being recognized in profi t or loss over the period of the borrowings, together with any interest and fees payable, using the effective interest method.

— 41 —
Notes to the Consolidated Financial Statements
(k) Financial Instruments
(i) Non-derivative Financial Assets and Liabilities
The Company initially recognizes receivables and deposits on the date that they are originated.
The Company derecognizes a fi nancial asset when the contractual rights to the cash fl ows from the asset expire, or it transfers the rights to receive the contractual cash fl ows on the fi nancial asset in a transaction in which substantially all the risks and rewards of ownership of the fi nancial asset are transferred. Any interest in transferred fi nancial assets that is created or retained by the Company is recognized as a separate asset or liability.
Financial assets and liabilities are offset and the net amount is presented in the consolidated statement of fi nancial position when the Company has a legal right to offset the amounts and intends either to settle on a net basis or to realize the asset and settle the liability simultaneously.
Receivables are non-derivative fi nancial assets with fi xed or determinable payments that are not quoted in an active market. Subsequent to initial recognition, receivables are measured at cost, less any impairment losses. Receivables are comprised of trade and other receivables.
The Company initially recognizes debt instruments issued on the date that they are originated. The Company derecognizes a fi nancial liability when its contractual obligations are discharged, cancelled or expire.
The Company has the following non-derivative fi nancial liabilities: loans and borrowings and trade and other payables. Both loans and borrowings and trade and other payables are recognized initially at fair value plus any directly attributable transaction costs. Subsequent to their initial recognition, loans and borrowings are accounted for at amortized cost using the effective interest method.
(ii) Derivative Financial Instruments
The Company holds derivative fi nancial instruments to hedge certain of its foreign currency risk exposures. Embedded derivatives are separated from the host contract and accounted for separately if the economic characteristics and risks of the host contract and the embedded derivative are not closely related, a separate instrument with the same terms as the embedded derivative would meet the defi nition of a derivative, and the combined instrument is not measured at fair value through profi t or loss. For derivatives designated in hedging relationships, changes in the fair value are either offset through profi t or loss against the change in fair value of the hedged item attributable to the risk being hedged or recognized in hedging reserves that are reported directly in equity (defi cit) until the hedged item is recognized in profi t or loss and, at that time, the related hedging gain or loss is removed from equity (defi cit) and is used to offset the change in value of the hedged item.

— 42 —
Notes to the Consolidated Financial Statements
Other than agreements with holders of non-controlling interests, there were no derivatives embedded in host contracts during the periods presented. The Company has certain put option agreements that are classifi ed as fi nancial liabilities in accordance with IAS 32, Financial Instruments: Presentation, in the consolidated statement of fi nancial position, as the Company has a potential obligation to settle the option in cash in the future. The amount recognized initially is the fair value of the redeemable non-controlling interests and subsequently remeasured at each reporting date based on a price to earnings multiple discounted to the reporting date. For agreements entered into prior to the adoption of IFRS 3, Business Combinations, on January 1, 2008, subsequent changes in liabilities are recognized in profi t or loss. For agreements entered into after January 1, 2008, subsequent changes in liabilities are recognized through equity.
Derivatives are recognized initially at fair value and any attributable transaction costs are recognized in profi t or loss as incurred. Subsequent to initial recognition, derivatives are measured at fair value, and changes therein are accounted for as described below.
The Company periodically enters into derivative contracts that it designates as a hedge of a forecasted transaction or the variability of cash fl ows to be received or paid related to a recognized asset or liability (cash fl ow hedge). For all hedging relationships, the Company formally documents the hedging relationship and its risk management objective and strategy for undertaking the hedge, the hedging instrument, the hedged item, the nature of the risk being hedged, how the hedging instrument’s effectiveness in offsetting the hedged risk will be assessed prospectively and retrospectively, and a description of the method of measuring ineffectiveness. The Company also formally assesses, both at the hedge’s inception and on an ongoing basis, whether the derivatives that are used in hedging transactions are highly effective in offsetting cash fl ows of hedged items by determining whether the actual results of each hedge are within a range of 80% to 125%. For derivative instruments that are designated and qualify as a cash fl ow hedge, the effective portion of the gain or loss on the derivative is reported as a component of other comprehensive income and reclassifi ed into profi t or loss in the same period or periods during which the hedged transaction affects profi t or loss. Gains and losses on the derivative representing hedge ineffectiveness are excluded from the assessment of effectiveness and are recognized in current profi t or loss.
The Company discontinues hedge accounting prospectively when it determines that the derivative is no longer effective in offsetting cash fl ows of the hedged item, the derivative expires or is sold, terminated, or exercised, the derivative is de-designated as a hedging instrument because it is unlikely that a forecasted transaction will occur, or management determines that designation of the derivative as a hedging instrument is no longer appropriate.
When a derivative fi nancial instrument is not held for trading, and is not designated in a qualifi ed hedging relationship, all changes in fair value are recognized immediately through profi t or loss.

— 43 —
Notes to the Consolidated Financial Statements
(iii) Share Capital
(a) Ordinary Shares
Ordinary shares are classifi ed as equity. Incremental costs directly attributable to the issue of ordinary shares are recognized as a deduction from equity, net of any tax effects.
(b) Preference Shares
Prior to the Global Offering, there were Class A and Class B preference shares of OldCo issued and outstanding. The Class A and Class B preference shares were classifi ed as equity in accordance with IAS 32. The Company does not have any preference shares outstanding subsequent to the Global Offering.
(l) Employee Benefi ts
(i) Defi ned Contribution Plans
A defi ned contribution plan is a post-employment benefi t plan under which an entity pays fi xed contributions into a separate entity and will have no legal or constructive obligation to pay further amounts. Obligations for contributions to defi ned contribution pension plans are recognized as an employee benefi t expense in profi t or loss in the periods during which services are rendered by employees.
(ii) Defi ned Benefi t Plans
A defi ned benefi t plan is a post-employment benefi t plan other than a defi ned contribution plan. The Company’s net obligation in respect of defi ned benefi t pension plans is calculated separately for each plan by estimating the amount of future benefi t that employees have earned in return for their service in the current and prior periods; that benefi t is discounted to determine its present value. Any unrecognized past service costs and the fair value of any plan assets are deducted. The discount rate is based on a high grade bond yield curve under which the benefi ts were projected and discounted at spot rates along the curve. The discount rate was then determined as a single rate yielding the same present value. When the calculation results in a benefi t to the Company, the recognized asset is limited to the total of any unrecognized past service costs and the present value of economic benefi ts available in the form of any future refunds from the plan or reductions in future contributions to the plan. In order to calculate the present value of economic benefi ts, consideration is given to any minimum funding requirements that apply to any plan in the Company. An economic benefi t is available to the Company if it is realizable during the life of the plan, or on settlement of the plan liabilities.
The Company initially recognizes all actuarial gains and losses arising from defi ned benefi t plans in other comprehensive income. Actuarial valuations are obtained annually at the end of the fi scal year.
— 44 —
Notes to the Consolidated Financial Statements
(iii) Other Long-Term Employee Benefi ts
The Company’s net obligation in respect of long-term employee benefi ts other than pension plans is the amount of future benefi t that employees have earned in return for their service in the current and prior periods; that benefi t is discounted to determine its present value, and the fair value of any related assets is deducted. The discount rate is based on a high grade bond yield curve under which the benefi ts were projected and discounted at spot rates along the curve. The discount rate was then determined as a single rate yielding the same present value. Any actuarial gains and losses are recognized in profi t or loss in the period in which they arise. Actuarial valuations are obtained annually at the end of the fi scal year.
(iv) Termination Benefi ts
Termination benefi ts, including severance, are recognized as an expense when the Company is committed demonstrably, without realistic possibility of withdrawal, to a formal detailed plan to either terminate employment before the normal retirement date, or to provide termination benefi ts as a result of an offer made to encourage voluntary redundancy. Termination benefi ts for voluntary redundancies are recognized as an expense if the Company has made an offer of voluntary redundancy, it is probable that the offer will be accepted, and the number of acceptances can be estimated reliably. If benefi ts are payable more than 12 months after the reporting period, then they are discounted to their present value where the effect of discounting is determined to be material.
(v) Short-Term Employee Benefi ts
Short-term employee benefi t obligations are measured on an undiscounted basis and are expensed as the related service is provided. A liability is recognized for the amount expected to be paid under short-term cash bonus plans if the Company has a present legal or constructive obligation to pay this amount as a result of past service provided by the employee, and the obligation can be estimated reliably.
(vi) Share-based Payments
The grant-date fair value of equity-settled share-based payment awards granted to employees is recognized as an employee expense, with a corresponding increase in equity, over the period that the employees unconditionally become entitled to the awards. The amount recognized as an expense is adjusted to refl ect the number of awards for which the related service and non-market performance conditions are expected to be met, such that the amount ultimately recognized as an expense is based on the number of awards that meet the related service and non-market performance conditions at the vesting date. For equity-settled share-based payment awards with non-vesting conditions, the grant-date fair value of the share-based payment is measured to refl ect such conditions and there is no true-up for differences between expected and actual outcomes.
(m) Income Taxes
Income tax expense comprises current and deferred tax. Current tax and deferred tax are recognized in profi t or loss except to the extent that it relates to a business combination, items recognized directly in equity or in other comprehensive income.

— 45 —
Notes to the Consolidated Financial Statements
Current tax is the expected tax payable or receivable on the taxable income or loss for the year, using tax rates enacted or substantively enacted at the reporting date, and any adjustment to tax payable in respect of previous years.
Deferred tax is recognized in respect of temporary differences between the carrying amounts of assets and liabilities for fi nancial reporting purposes and the amounts used for taxation purposes. Deferred tax is not recognized for the following temporary differences: the initial recognition of assets or liabilities in a transaction that is not a business combination and that affects neither accounting nor taxable profi t or loss, and differences relating to investments in subsidiaries to the extent that it is probable that they will not reverse in the foreseeable future. In addition, deferred tax is not recognized for taxable temporary differences arising on the initial recognition of goodwill. Deferred tax is measured at the tax rates that are expected to be applied to temporary differences when they reverse, based on the laws that have been enacted or substantively enacted by the reporting date. Deferred tax assets and liabilities are offset if there is a legally enforceable right to offset current tax liabilities and assets, and they relate to income taxes levied by the same tax authority on the same taxable entity, or on different tax entities, if they intend to settle current tax liabilities and assets on a net basis or their tax assets and liabilities will be realized simultaneously.
A deferred tax asset is recognized for unused tax losses, tax credits and deductible temporary differences, to the extent that it is probable that future taxable profi ts will be available against which they can be utilized. Deferred tax assets are reviewed at each reporting date and are reduced to the extent that it is no longer probable that the related tax benefi t will be realized.
(n) Revenue Recognition
Revenues from wholesale product sales are recognized when (i) evidence of a sales arrangement at a fi xed or determinable price exists (usually in the form of a sales order), (ii) collectibility is reasonably assured, and (iii) title transfers to the customer. Provisions are made for estimates of markdown allowances, warranties, returns and discounts at the time product sales are recognized. Shipping terms are predominately FOB shipping point (title transfers to the customer at the Company’s shipping location) except in certain Asian countries where title transfers upon delivery to the customer. In all cases, sales are recognized upon transfer of title to customers. Revenues from retail sales are recognized at the point of sale to consumers. Revenue excludes collected sales taxes.
Revenue is measured at the fair value of the consideration received or receivable. Provided that it is probable that the economic benefi ts will fl ow to the Company and the revenue and costs, if applicable, can be measured reliably, revenue is recognized in profi t or loss.
The Company licenses its brand names to certain third parties. Net sales in the accompanying consolidated income statement include royalties earned on licensing agreements with third parties, for which revenue is earned and recognized when the third party makes a sale of Company branded product.
(o) Cost of Sales, Distribution, Marketing and General and Administrative Expenses
The Company includes the following types of costs in cost of sales: direct product purchase and manufacturing costs, duties, freight in, freight out, receiving, inspection, internal transfer costs, depreciation and procurement and manufacturing overhead. The impairment of inventories and the reversals of such impairments are included in cost of sales during the period in which they occur.

— 46 —
Notes to the Consolidated Financial Statements
Distribution expenses are primarily comprised of rent, employee benefi ts, customer freight, depreciation, amortization, warehousing costs and other selling expenses.
Marketing expenses consist of advertising and promotional activities. Costs for producing media advertising are deferred until the related advertising fi rst appears in print or television media, at which time such costs are expensed. All other advertising costs are expensed as incurred. Cooperative advertising costs associated with customer support programs giving the Company an identifi able advertising benefi t equal to at least the amount of the advertising allowance are accrued and charged to marketing expenses when the related revenues are recognized. From time to time, the Company offers various types of incentive arrangements such as cash or payment discounts, rebates or free products. All such incentive arrangements are accrued and reduce reported revenues when incurred.
General and administrative expenses consist of management salaries and benefi ts, information technology costs, and other costs related to administrative functions.
(p) Finance Income and Costs
Finance income comprises interest income on funds invested and gains on hedging instruments that are recognized in profi t or loss. Interest income is recognized as it accrues in profi t or loss, using the effective interest method.
Finance costs comprise interest expense on borrowings, unwinding of the discount on provisions, changes in the fair value of put options associated with the Company’s majority-owned subsidiaries, expenses related to the Global Offering, and losses on hedging instruments that are recognized in profi t or loss. Foreign currency gains and losses are reported on a net basis.
Costs incurred in connection with the issuance of debt instruments are included in the initial measurement of the related fi nancial liabilities in the consolidated statement of fi nancial position. Such costs are amortized as fi nance costs using the effective interest method over the term of the related debt obligation.
(q) Earnings Per Share
The Company presents basic and diluted earnings per share (“EPS”) data for its ordinary shares. Basic EPS is calculated by dividing the profi t or loss attributable to ordinary shareholders of the Company by the weighted average number of ordinary shares outstanding for the period, adjusted for shares held by the Company. Diluted EPS is determined by adjusting the profi t or loss attributable to ordinary shareholders and the weighted average number of ordinary shares outstanding, adjusted for shares held by the Company, for the effects of all potentially dilutive ordinary shares, which comprise convertible notes and share options granted to employees, as applicable.
(r) Leases
An arrangement comprising a transaction or a series of transactions, is or contains a lease if the Company determines that the arrangement conveys a right to use a specifi c asset or assets for an agreed period of time in return for a payment or a series of payments. Such a determination is made based on an evaluation of the substance of the arrangement and is regardless of whether the arrangement takes the legal form of a lease.

— 47 —
Notes to the Consolidated Financial Statements
Leases in which the Company assumes substantially all the risks and rewards of ownership are classifi ed as fi nance leases. Upon initial recognition, the leased asset is measured at an amount equal to the lower of its fair value and the present value of the minimum lease payments. Subsequent to initial recognition, the asset is accounted for in accordance with the accounting policy applicable to that asset. Other leases are operating leases and the leased assets are not recognized in the Company’s consolidated statement of fi nancial position.
The Company leases retail stores, distribution centers and offi ce facilities. Initial terms of the leases range from one to twenty years. Most leases provide for monthly fi xed minimum rentals or contingent rentals based upon sales in excess of stated amounts and normally require the Company to pay real estate taxes, insurance, common area maintenance costs and other occupancy costs. The Company recognizes rent expense for leases that include scheduled and specifi ed escalations of the minimum rent on a straight-line basis over the base term of the lease. Any difference between the straight-line rent amount and the amount payable under the lease is included in other liabilities in the consolidated statement of fi nancial position. Contingent rental payments are expensed as incurred.
Minimum lease payments made under fi nance leases are apportioned between the fi nance expense and the reduction of the outstanding liability. The fi nance expense is allocated to each period during the lease term so as to produce a constant periodic rate of interest on the remaining balance of the liability.
(s) Provisions and Contingent Liabilities
Provisions are recognized for other liabilities of uncertain timing or amount when the Company has a legal or constructive obligation arising as a result of a past event, it is probable that an outfl ow of economic benefi ts will be required to settle the obligation and a reliable estimate can be made. Where the time value of money is material, provisions are stated at the present value of the expenditure expected to settle the obligation.
Where it is not probable that an outfl ow of economic benefi ts will be required, or the amount cannot be estimated reliably, the obligation is disclosed as a contingent liability, unless the probability of outfl ow of economic benefi ts is remote. Possible obligations, whose existence will only be confi rmed by the occurrence or non-occurrence of one or more future events are also disclosed as contingent liabilities unless the probability of outfl ow of economic benefi ts is remote.
(t) Related Parties
(i) A person, or a close member of that person’s family, is related to the Company if that person:
(1) has control or joint control over the Company;
(2) has signifi cant infl uence over the Company; or
(3) is a member of the key management personnel of the Company or the Company’s parent.

— 48 —
Notes to the Consolidated Financial Statements
(ii) An entity is related to the Company if any of the following conditions applies:
(1) the entity and the Company are members of the same group (which means that each parent, the subsidiary and fellow subsidiary is related to the others);
(2) one entity is an associate or joint venture of the other entity (or an associate or joint venture of a member of a group of which the other entity is a member);
(3) both entities are joint ventures of the same third party;
(4) one entity is a joint venture of a third entity and the other entity is an associate of the third entity;
(5) the entity is a post-employment benefi t plan for the benefi t of employees of either the Company or an entity related to the Company;
(6) the entity is controlled or jointly controlled by a person identifi ed in (i); or
(7) a person identifi ed in (i) (1) has signifi cant infl uence over the entity or is a member of the key management personnel of the entity (or of a parent of the entity).
Close members of the family of a person are those family members who may be expected to infl uence, or be infl uenced by, that person in their dealings with the entity.
(u) New Standards and Interpretations
A number of new standards, amendments to standards and interpretations are not yet effective for the year ended December 31, 2012, and have not been applied in preparing these consolidated fi nancial statements.
(i) IFRS 9 Financial Instruments (2010), IFRS 9 Financial Instruments (2009)
IFRS 9 (2009) introduces new requirements for the classifi cation and measurement of fi nancial assets. Under IFRS 9 (2009), fi nancial assets are classifi ed and measured based on the business model in which they are held and the characteristics of their contractual cash fl ows. IFRS 9 (2010) introduces additions relating to fi nancial liabilities. The IASB currently has an active project to make limited amendments to the classifi cation and measurement requirements of IFRS 9 and add new requirements to address the impairment of fi nancial assets and hedge accounting.
IFRS 9 (2010 and 2009) is effective for annual periods beginning on or after January 1, 2015 with early adoption permitted. The Company has not determined the extent of the impact on its fi nancial statements upon adoption of this standard. The European Union has not yet adopted this standard.
(ii) IFRS 10 Consolidated Financial Statements, IFRS 11 Joint Arrangements, IFRS 12 Disclosure of Interests in Other Entities (2011)
IFRS 10 introduces a single control model to determine whether an investee should be consolidated. The Company does not expect that the adoption of this standard will change its current conclusion in respect of consolidated subsidiaries.

— 49 —
Notes to the Consolidated Financial Statements
Under IFRS 11, the structure of a joint arrangement, although still an important consideration, is no longer the main factor in determining the type of joint arrangement and therefore the subsequent accounting.
• The Company’s interest in a joint operation, which is an arrangement in which the parties have rights to the assets and obligations for the liabilities, will be accounted for on the basis of the Company’s interest in those assets and liabilities.
• The Company’s interest in a joint venture, which is an arrangement in which the parties have rights to the net assets, will be equity-accounted.
The Company does not expect that the adoption of this standard will have a material impact on its fi nancial statements.
IFRS 12 brings together into a single standard all the disclosure requirements about an entity’s interests in subsidiaries, joint arrangements, associates and unconsolidated structured entities. The Company is currently assessing the disclosure requirements in comparison with existing disclosures. IFRS 12 requires the disclosure of information about the nature, risks and fi nancial effects of these interests.
These standards are effective for annual periods beginning on or after January 1, 2014.
(iii) IFRS 13 Fair Value Measurement (2011)
IFRS 13 provides a single source of guidance on how fair value is measured, and replaces the fair value measurement guidance that is currently dispersed throughout IFRS. Subject to limited exceptions, IFRS 13 is applied when fair value measurements or disclosures are required or permitted by other IFRSs. The Company is currently reviewing its methodologies in determining fair values (see Note 4). IFRS 13 is effective for annual periods beginning on or after January 1, 2013.
(iv) IAS 1 Presentation of Items of Other Comprehensive Income (2011)
IAS 1 has been amended by the IASB to require that an entity presents separately the items of other comprehensive income that would be reclassifi ed to profi t or loss in the future if certain conditions are met from those that would never be reclassifi ed to profi t or loss. The standard is effective for annual periods beginning on or after July 1, 2012. There will not be any impact to the fi nancial results of the Company upon adoption of this standard.
(v) IAS 19 Employee Benefi ts (2011)
IAS 19 (2011) changes the defi nition of short-term and other long-term employee benefi ts to clarify the distinction between the two. For defi ned benefi t plans, removal of the accounting policy choice for recognition of actuarial gains and losses is not expected to have a signifi cant impact on the Company. The Company is currently assessing the impact of the change in measurement principles of expected return on plan assets. IAS 19 (2011) is effective for annual periods beginning on or after January 1, 2013.

— 50 —
Notes to the Consolidated Financial Statements
4. Determination of Fair Values
A number of the Company’s accounting policies and disclosures require the determination of fair value, for both fi nancial and non-fi nancial assets and liabilities. Fair values have been determined for measurement and/or disclosure purposes based on the following methods. When applicable, further information about the assumptions made in determining fair values is disclosed in the notes specifi c to that asset or liability.
(a) Trade and Other Receivables
The fair value of trade and other receivables is estimated as the present value of future cash fl ows, discounted at the market rate of interest at the reporting date. This fair value is determined for disclosure purposes and generally approximates carrying value.
(b) Derivatives
The fair value of forward exchange contracts is based on their listed market price. If a listed market price is not available, then fair value is estimated by discounting the difference between the contractual forward price and the current forward price for the residual maturity of the contract using a risk-free interest rate (based on government bonds).
Call options are considered derivative fi nancial assets and are recorded at fair value.
Fair value estimates refl ect the credit risk of the Company and counterparty.
(c) Non-derivative Financial Liabilities
Fair value, which is determined for disclosure purposes, is calculated based on the present value of future principal and interest cash fl ows, discounted at the market rate of interest at the reporting date.
Redeemable Non-controlling Interests
The Company has entered into agreements that include put and call option arrangements to acquire non-controlling interests in certain majority-owned subsidiaries exercisable at fair value at certain predetermined dates. Pursuant to these agreements, the Company has call options to acquire the remaining shares owned by the non-controlling interest holders and these non-controlling interest holders have put options to sell their ownership in these subsidiaries to the Company. In addition, the Company has the right to buy-out these non-controlling interests in the event of termination of the underlying agreements. The table of contractual maturities (note 22) does not include amounts for the repurchase of non-controlling interests as they do not include contractual maturities.
The put option agreements are classifi ed as fi nancial liabilities in accordance with IAS 32 in the consolidated statement of fi nancial position as the Company has a potential obligation to settle the option in cash in the future. The amount recognized initially is the fair value of the redeemable non-controlling interests and subsequently remeasured at each reporting date based on a price to earnings multiple discounted to the reporting date. For agreements entered into prior to the adoption of IFRS 3 on January 1, 2008, subsequent changes in liabilities are recognized in profi t or loss. For agreements entered into after January 1, 2008, subsequent changes in liabilities are recognized through equity.

— 51 —
Notes to the Consolidated Financial Statements
(d) Intangible Assets
The fair value of tradenames is based on the relief-from-royalty method of valuation. The fair value of leasehold interests is determined using the income approach. The fair value of customer relationships is determined using a combination of the income approach and the multi-period excess earnings method, whereby the subject asset is valued after deducting a fair return on all other assets that are part of creating the related cash fl ows.
5. Financial Risk Management Overview
The Company has exposure to the following risks from its use of fi nancial instruments:
• credit risk
• liquidity risk
• market risk
This note presents information about the Company’s exposure to each of the above risks, the Company’s objectives, policies and processes for measuring and managing risk, and the Company’s management of capital. Further quantitative disclosures are included throughout the notes to the consolidated fi nancial statements.
(a) Risk Management Framework
The Board of Directors has overall responsibility for the establishment and oversight of the Company’s risk management framework. The Company’s risk management policies are established to identify and analyze the risks faced by the Company, to set appropriate risk limits and controls, and to monitor risks and adherence to limits. Risk management policies and systems are reviewed regularly to refl ect changes in market conditions and the Company’s activities. The Company, through its training and management standards and procedures, aims to develop a disciplined and constructive control environment in which all employees understand their roles and obligations.
(b) Credit Risk
Credit risk is the risk of fi nancial loss to the Company if a customer or counterparty to a fi nancial instrument fails to meet its contractual obligations, and arises principally from the Company’s receivables from customers. Maximum exposure is limited to the carrying amounts of the fi nancial assets presented in the consolidated fi nancial statements.
Trade and Other Receivables
The Company’s exposure to credit risk is infl uenced mainly by the individual characteristics of each customer. However, management also considers the demographics of the Company’s customer base, including the default risk of the industry and country in which customers operate, as these factors may have an infl uence on credit risk. No single customer accounted for more than 5% of the Company’s sales for the periods presented or accounts receivable as of the reporting dates. Geographically there is no concentration of credit risk.

— 52 —
Notes to the Consolidated Financial Statements
The Company has established a credit policy under which each new customer is analyzed individually for creditworthiness before the Company’s standard payment and delivery terms and conditions are offered.
In monitoring customer credit risk, customers are grouped according to their credit characteristics, including aging profi le, and existence of previous fi nancial diffi culties. Trade and other receivables relate mainly to the Company’s wholesale customers. Customers that are graded as “high risk” are placed on credit hold and monitored by the Company, and future sales are made on an approval basis.
(c) Liquidity Risk
Liquidity risk is the risk that the Company will encounter diffi culty in meeting the obligations associated with its fi nancial liabilities.
The Company’s primary sources of liquidity are its cash fl ows from operating activities, invested cash, available lines of credit (note 17(b)) and its ability to issue additional shares. The Company believes that its existing cash and estimated cash fl ows, along with current working capital, will be adequate to meet the operating and capital requirements of the Company for at least the next twelve months.
(d) Market Risk
Market risk is the risk that changes in market prices, such as foreign exchange rates, interest rates and equity prices will affect the Company’s income or the value of its holdings of fi nancial instruments. The objective of market risk management is to manage and control market risk exposures within acceptable parameters, while optimizing the return.
The Company periodically buys and sells fi nancial derivatives, such as forward purchase contracts for hedging purposes, in order to manage market risks.
(i) Currency Risk
The Company is exposed to currency risk on purchases and borrowings that are denominated in a currency other than the respective functional currencies of the Company’s subsidiaries.
The Company periodically uses forward exchange contracts to hedge its exposure to currency risk on product purchases denominated in a currency other than the respective functional currency of the Company’s subsidiaries. The forward exchange contracts typically have maturities of less than one year.
Interest on borrowings is typically denominated in the local currency of the borrowing. Borrowings are generally denominated in currencies that match the cash fl ows generated by the underlying operations of the borrowing entity.

— 53 —
Notes to the Consolidated Financial Statements
(ii) Interest Rate Risk
The Company monitors its exposure to changes in interest rates on borrowings on variable rate debt instruments. Although the Company does not currently have any interest rate hedging instruments, it may, from time to time, enter into interest rate swap contracts to manage interest rate risk.
(iii) Other Market Price Risk
Equity price risk arises from available for sale equity securities held by the Company’s defi ned benefi t pension plans to fund obligations that are used to measure periodic net pension costs. Pension plan liabilities are presented net of pension plan assets in the Company’s consolidated statement of fi nancial position. The Company’s investment strategy is to generate investment returns on pension plan assets in order to satisfy the Company’s defi ned benefi t pension plan obligations. The Company engages professional pension plan asset managers to assist in this process.
(iv) Other Pension and Post-retirement Obligations
The estimated pension obligation (the actuarial present value of benefi ts attributed to employee service and compensation levels prior to the measurement date without considering future compensation levels) exceeds the fair value of the assets of the Company’s pension plans, which is primarily the result of the performance of equity markets during prior years. Future market conditions and interest rate fl uctuations could signifi cantly impact future assets and liabilities of our pension plans and future minimum required funding levels.
(e) Capital Management
The primary objective of the Company’s capital management policies is to safeguard its ability to continue as a going concern, to provide returns for shareholders, fund capital expenditures, normal operating expenses and working capital needs, and the payment of obligations. The primary source of cash is revenue from sales of the Company’s products. The Company anticipates generating suffi cient cash fl ow from operations in the majority of countries where it operates and will have suffi cient available cash and ability to draw on credit facilities for funding to satisfy the working capital and fi nancing needs.
The Company’s capital needs are primarily managed through cash and cash equivalents (note 14), trade and other receivables (note 13), inventories (note 12), property plant and equipment (note 9), trade and other payables (note 21) and loans and borrowings (note 17).
6. Global Offering and Related Events
The ordinary shares of the Company were listed on the Main Board of The Stock Exchange of Hong Kong Limited on June 16, 2011, at which time 671.2 million shares were sold at a unit price of HK$14.50. Out of these 671.2 million shares, 121.1 million shares were newly issued shares sold by the Company and 550.1 million shares were previously issued shares sold by existing shareholders. The Company’s remaining 735.9 million issued and outstanding shares were not sold in connection with the Global Offering and at the time of the Global Offering continued to be held by the shareholders who held such shares immediately prior to the Global Offering.

— 54 —
Notes to the Consolidated Financial Statements
The Company received gross proceeds of HK$1,756.0 million corresponding to a capital increase of US$225.3 million at the exchange rate prevailing at the date of the transaction. In connection with the transaction, the Company incurred costs of US$33.7 million, of which US$8.9 million were related to the listing and issue of new shares and were recorded as a reduction of additional paid-in capital. The remaining costs of US$24.8 million were recognized as an expense in the consolidated income statement for the year ended December 31, 2011.
Prior to the Global Offering, the benefi cial owners of the ordinary shares of OldCo contributed their shares to the Company in consideration for the issue of ordinary shares in the Company.
The 78.0 million preference shares of OldCo that were previously outstanding were redeemed and canceled on June 10, 2011 in consideration for the benefi cial owners of the preference shares receiving (i) A loan notes issued by OldCo with a principal equal to the nominal value of the A preference shares and the total share premium reserve attaching to the A preference shares for an aggregate principal value of US$77.0 million (the “A Loan Notes”) and (ii) B loan notes issued by OldCo with a principal equal to the nominal value of the B preference shares plus the accrued B preference share reserve for an aggregate principal value of US$24.0 million (the “B Loan Notes” and, together with the A Loan Notes, the “Loan Notes”). The Loan Notes received a commercial rate of interest. The US$101.0 million outstanding balance of the Loan Notes was repaid utilizing a portion of the Company’s proceeds from the sale of ordinary shares on completion of the Global Offering.
The Company utilized a portion of the remaining proceeds from the Global Offering, along with existing cash on hand, to repay in full the outstanding principal balance of US$221.6 million on its former amended senior credit facility and the outstanding principal and accrued interest of US$59.2 million on its former term loan facility. The former amended senior credit facility and former term loan facility were terminated following the Global Offering.
On July 8, 2011, the over-allotment option referred to in the Offering Circular was partially exercised by the Joint Global Coordinators on behalf of the International Underwriters, thereby requiring the funds managed by CVC Capital Partners Limited (the “CVC Funds”) and the Royal Bank of Scotland (“RBS”), members of the selling shareholder group, to sell 24.7 million additional shares, which represented approximately 3.7% of the shares initially being offered under the Global Offering before any exercise of the over-allotment option. These additional shares were sold by the CVC Funds and RBS at HK$14.50 per share, being the offer price per share under the Global Offering. The Company did not sell any additional shares upon the exercise of the over-allotment option. In connection with an agreement between the Company and the Joint Global Coordinators, the Company received proceeds of US$3.5 million on profi ts recognized by the Joint Global Coordinators from the exercise of the over-allotment option (the “Stabilization Proceeds”).
7. Segment Reporting
(a) Operating Segments
Management of the business and evaluation of operating results is organized primarily along geographic lines dividing responsibility for the Company’s operations, besides the Corporate segment, as follows:
• Asia — which includes operations in South Asia (India and Middle East), China, Singapore, South Korea, Taiwan, Malaysia, Japan, Hong Kong, Thailand, Indonesia, Philippines and Australia;

— 55 —
Notes to the Consolidated Financial Statements
• Europe — which includes operations in European countries as well as Africa;
• North America — which includes operations in the United States of America and Canada;
• Latin America — which includes operations in Chile, Mexico, Argentina, Brazil and Uruguay; and
• Corporate — which primarily includes certain licensing activities from brand names owned by the Company and Corporate headquarters overhead.
Information regarding the results of each reportable segment is included below. Performance is measured based on segment operating profi t or loss, as included in the internal management reports. Segment operating profi t or loss is used to measure performance as management believes that such information is the most relevant in evaluating the results of the Company’s segments.
Segment information as of and for the year ended December 31, 2012 is as follows:
Expressed in thousands of US Dollars
Asia EuropeNorth
AmericaLatin
America Corporate Consolidated
External revenues 684,154 465,383 499,924 112,556 9,709 1,771,726Operating profi t 87,946 43,099 38,458 10,968 61,271 241,742Depreciation and amortization 14,643 14,928 3,796 4,092 2,802 40,261Capital expenditures 14,317 15,173 4,533 2,953 965 37,941Interest income 211 188 16 25 747 1,187Interest expense (1,809) (139) — (296) (1,683) (3,927)Income tax (expense) benefi t (20,136) (9,889) (14,398) 1,732 (15,382) (58,073)Total assets 499,149 422,793 512,975 91,795 286,452 1,813,164Total liabilities 193,273 189,390 463,569 46,011 (165,184) 727,059
Segment information as of and for the year ended December 31, 2011 is as follows:
Expressed in thousands of US Dollars
Asia EuropeNorth
AmericaLatin
America Corporate Consolidated
External revenues 578,316 479,089 388,190 108,601 10,951 1,565,147Operating profi t 62,136 61,327 39,639 9,871 36,957 209,930Depreciation and amortization 13,224 13,441 3,478 3,822 4,526 38,491Capital expenditures 13,826 16,924 3,761 1,829 832 37,172Restructuring charges/(reversals of charges) — (884) — — 7 (877)Interest income 142 184 9 26 886 1,247Interest expense (1,861) (23,158) — (540) (11,726) (37,285)Income tax expense (13,447) (11,367) (465) (1,497) (8,904) (35,680)Total assets 498,725 407,866 509,861 83,299 44,795 1,544,546Total liabilities 186,597 186,618 461,947 40,857 (276,673) 599,346
(b) Geographical Information
The following tables set out enterprise-wide information about the geographical location of (i) the Company’s revenue from external customers and (ii) the Company’s property, plant, and equipment, intangible assets and goodwill (specifi ed non-current assets). The geographical location of customers is based on the selling location of the goods. The geographical location of the specifi ed non-current assets is based on the physical location of the asset.

— 56 —
Notes to the Consolidated Financial Statements
(i) Revenue from External Customers
The following table presents the revenues earned from customers in major geographical locations where the Company has operations.
Expressed in thousands of US DollarsYear ended December 31,
2012 2011
Asia: China 178,035 144,594 Hong Kong (1) 56,473 48,392 Philippines 4,869 3,567 Taiwan 18,212 14,252 India 102,329 109,846 United Arab Emirates 27,714 21,364 Australia 40,678 34,881 South Korea 122,921 93,969 Japan 66,013 51,984 Singapore 21,328 19,399 Other 45,582 36,068
Total Asia 684,154 578,316
Europe: Italy 52,383 67,549 France 59,580 61,024 Germany 64,502 61,077 Spain 39,075 46,973 Belgium 58,164 59,561 Holland 23,470 25,030 United Kingdom 30,754 30,120 Austria 11,901 11,338 Switzerland 16,692 18,037 Russia 35,931 28,020 Turkey 11,684 11,059 Other 61,247 59,301
Total Europe 465,383 479,089
North America: United States 469,773 360,314 Canada 30,151 27,876
Total North America 499,924 388,190
Latin America: Chile 54,998 50,158 Mexico 34,240 32,790 Argentina 9,823 14,218 Other 13,495 11,435
Total Latin America 112,556 108,601
Corporate and other (royalty revenue): Luxembourg 9,522 10,713 United States 187 238
Total Corporate and other 9,709 10,951
Total 1,771,726 1,565,147
(1) Includes Macau

— 57 —
Notes to the Consolidated Financial Statements
(ii) Specifi ed Non-current Assets
The following table presents the Company’s signifi cant non-current assets by geographical location. Unallocated specifi ed non-current assets mainly comprise goodwill.
Expressed in thousands of US DollarsDecember 31,
2012 2011
United States 27,056 24,545Luxembourg 588,828 532,428India 24,037 25,307China 16,544 15,623South Korea 10,503 10,737Hong Kong 9,457 9,049Belgium 51,111 45,803Chile 12,834 10,510
8. Business Combinations
(a) High Sierra
On July 17, 2012, certain of the Company’s wholly-owned subsidiaries (the “Samsonite Purchasers”) entered into an Asset Purchase Agreement with High Sierra Sport Company (“High Sierra”), pursuant to which on July 31, 2012 the Samsonite Purchasers purchased substantially all of the assets of High Sierra for a net cash consideration of US$108.0 million. The Samsonite Purchasers purchased substantially all of the assets of High Sierra excluding cash, certain receivables, and certain other retained assets and assumed all balance sheet liabilities and certain contractual liabilities of High Sierra.
High Sierra is a U.S.-based manufacturer and distributor of casual bags and adventure travel luggage. Its products are targeted at active lifestyle consumers including outdoor enthusiasts, skiers and snowboarders, adventure travelers and students. It is the offi cial supplier of bags and luggage for the U.S. Ski and Snowboard Team. The High Sierra brand was founded in 1978.
The acquisition gives the Company a strong brand and product offering that provides a foothold in the North American casual bag market. It also provides the Company with opportunities to leverage its well-established global distribution network and retail presence to signifi cantly expand the High Sierra brand in additional markets in Asia, Europe and Latin America.
From the date of acquisition, High Sierra contributed US$17.6 million of revenue and US$1.2 million of profi t to the consolidated results of the Company for the year ended December 31, 2012.
— 58 —
Notes to the Consolidated Financial Statements
The following summarizes the recognized amounts of assets acquired and liabilities assumed at the acquisition date.
Expressed in thousands of US DollarsNote
Property, plant and equipment 195Intangible assets 10 43,000Inventories 11,087Trade receivables 13,267Other current assets 88Trade payables (3,123)Other current liabilities (4,254)
The trade receivables comprise gross contractual amounts due of US$14.3 million, of which US$1.0 million was expected to be uncollectible at the acquisition date.
If new information obtained within one year from the acquisition date about facts and circumstances that existed at the acquisition date identifi es adjustments to the above amounts, or any additional provisions that existed at the acquisition date, then the acquisition accounting will be revised.
Goodwill in the amount of US$47.7 million was recognized as a result of the acquisition. The goodwill is attributable mainly to the synergies expected to be achieved from integrating High Sierra into the Company’s existing business. None of the goodwill recognized is expected to be deductible for tax purposes.
(b) HL Operating Corp. doing business as Hartmann
On August 2, 2012, a wholly-owned subsidiary of the Company (the “Samsonite Purchaser”) entered into a Merger Agreement with HL Operating Corp. (“Hartmann”), pursuant to which on August 2, 2012 the Samsonite Purchaser completed the acquisition, by way of merger, of all of the outstanding shares of the capital stock of Hartmann for a net cash consideration of US$34.0 million.
Hartmann is a U.S.-based manufacturer and distributor of luggage, business cases, tote bags and leather accessories under the Hartmann® brand. Founded by Joseph S. Hartmann in 1877, Hartmann has established the brand as a mark of quality among American luxury consumers, with its products appealing to business and leisure consumers alike. The brand is currently offered through multiple channels, including leading retailers, corporate clients, Hartmann retail stores and its corporate website.
The acquisition gives the Company a strong brand to expand its presence in the luxury luggage and leather goods market as well as opportunities to leverage its well-established global distribution network and retail presence to signifi cantly expand the Hartmann brand both in the U.S. and internationally.
From the date of acquisition, Hartmann contributed US$8.0 million of revenue and US$0.1 million of profi t to the consolidated results of the Company for the year ended December 31, 2012.

— 59 —
Notes to the Consolidated Financial Statements
The following summarizes the recognized amounts of assets acquired and liabilities assumed at the acquisition date.
Expressed in thousands of US DollarsNote
Property, plant and equipment 52Intangible assets 10 17,000Inventories 4,987Trade receivables 3,249Other current assets 2,414Trade payables (4,577)Deferred tax liabilities (1,080)Other current liabilities (1,496)
The trade receivables comprise gross contractual amounts due of US$3.3 million, of which US$0.1 million was expected to be uncollectible at the acquisition date.
If new information obtained within one year from the acquisition date about facts and circumstances that existed at the acquisition date identifi es adjustments to the above amounts, or any additional provisions that existed at the acquisition date, then the acquisition accounting will be revised.
Goodwill in the amount of US$13.5 million was recognized as a result of the acquisition. The goodwill is attributable mainly to the synergies expected to be achieved from integrating Hartmann into the Company’s existing business. None of the goodwill recognized is expected to be deductible for tax purposes.
(c) Proforma results
If these acquisitions had occurred on January 1, 2012, the Company estimates that consolidated net sales would have been approximately US$1,832.0 million, and consolidated profi t for the year would have been approximately US$171.3 million. In determining these amounts, the Company has assumed that the fair value adjustments that arose on the date of acquisition would have been the same if the acquisition had occurred on January 1, 2012.
(d) Acquisition-related costs
The Company incurred approximately US$6.4 million in acquisition related costs during the year ended December 31, 2012. Such costs are primarily comprised of costs associated with due diligence and integration activities, as well as professional and legal fees, and are recognized within other expenses on the income statement.

— 60 —
Notes to the Consolidated Financial Statements
9. Property, Plant and Equipment, Net
Expressed in thousands of US Dollars
2012 Land Buildings
Machinery, equipment, leasehold
improvements and other Total
Cost: At January 1, 2012 8,275 49,690 320,165 378,130 Additions 2,449 2,562 32,930 37,941 Disposals — (4,384) (38,248) (42,632) Effect of movements in exchange rates/other 176 812 4,495 5,483
At December 31, 2012 10,900 48,680 319,342 378,922
Accumulated depreciation and impairment: At January 1, 2012 1,208 20,863 228,084 250,155 Depreciation for the year 24 3,148 28,598 31,770 Disposals — (4,377) (37,585) (41,962) Effect of movements in exchange rates/other 23 498 2,614 3,135
At December 31, 2012 1,255 20,132 221,711 243,098
Carrying value: At December 31, 2012 9,645 28,548 97,631 135,824
Expressed in thousands of US Dollars
2011 Land Buildings
Machinery, equipment, leasehold
improvements and other Total
Cost: At January 1, 2011 7,373 62,738 277,838 347,949 Additions 85 513 36,574 37,172 Disposals — (16) (10,614) (10,630) Effect of movements in exchange rates/other 817 (13,545) 16,367 3,639
At December 31, 2011 8,275 49,690 320,165 378,130
Accumulated depreciation and impairment: At January 1, 2011 — 7,544 215,623 223,167 Depreciation for the year — 1,508 28,650 30,158 Disposals — (11) (9,470) (9,481) Effect of movements in exchange rates/other 1,208 11,822 (6,719) 6,311
At December 31, 2011 1,208 20,863 228,084 250,155
Carrying value: At December 31, 2011 7,067 28,827 92,081 127,975

— 61 —
Notes to the Consolidated Financial Statements
Depreciation expense for the years ended December 31, 2012 and December 31, 2011 amounted to US$31.8 million and US$30.2 million, respectively. Of this amount, US$5.2 million and US$4.1 million was included in cost of sales during the years ended December 31, 2012 and December 31, 2011, respectively. Remaining amounts were presented in distribution and general and administrative expenses. The Company has authorized capital expenditures of US$72.6 million in 2013, of which approximately US$11.3 million has been committed as of December 31, 2012. All land owned by the Company is freehold.
No potential impairment indicators existed at December 31, 2012.
10. Goodwill and Other Intangible Assets
(a) Goodwill
As of December 31, 2012 and December 31, 2011, the Company’s goodwill balance amounted to US$214.4 million and US$153.2 million, respectively, of which none is deductible for income tax purposes.
The carrying amount of goodwill was as follows:
Expressed in thousands of US DollarsDecember 31,
2012 2011
Cost: At January 1 1,122,999 1,122,999 Additions (note 8) 61,144 —
At December 31 1,184,143 1,122,999
Accumulated impairment losses: At January 1 and at December 31 969,787 969,787
Carrying Amount: 214,356 153,212
The aggregate carrying amounts of goodwill allocated to each operating segment were as follows:
Expressed in thousands of US Dollars
Asia EuropeNorth
AmericaLatin
America Consolidated
At December 31, 2012 153,212 — 61,144 — 214,356At December 31, 2011 153,212 — — — 153,212
In accordance with IAS 36, Impairment of Assets (IAS 36), the recoverable amounts of the Company’s CGUs with goodwill were determined using the higher of fair value less cost to sell or value in use, which is determined by discounting the estimated future cash fl ows generated from the continuing use of the unit.

— 62 —
Notes to the Consolidated Financial Statements
For the purpose of impairment testing, goodwill is allocated to the Company’s operating segments, comprised of groups of CGUs, as these represent the lowest level within the Company at which the goodwill is monitored for internal management purposes. The allocation is made to those CGUs that are expected to benefi t from the business combination in which the goodwill arose.
Separate calculations are prepared for each of the groups of CGUs that make up the consolidated entity. These calculations use discounted cash fl ow projections based on fi nancial estimates reviewed by management covering a fi ve year period. Cash fl ows beyond the fi ve year period are extrapolated using estimated growth rates appropriate for the market in which the unit operates. The values assigned to the key assumptions represent management’s assessment of future trends and are based on both external sources and internal sources (historical data) and are summarized below.
• A pre-tax discount rate of 16% was used in discounting the projected cash fl ows.
• Segment cash fl ows were projected based on the historical operating results and the fi ve year forecasts.
• The terminal value is extrapolated using a constant long term growth rate of 3%, which is consistent with the average growth rate for the industry.
• The sales prices were assumed to be a constant margin above cost.
Management has considered the above assumptions and valuation and has also taken into account the business plans going forward. Management believes that any reasonably foreseeable change in any of the above key assumptions would not cause the carrying amount of goodwill to exceed the recoverable amount. Judgment is required to determine key assumptions adopted in the cash fl ow projections and the changes to key assumptions can signifi cantly affect these cash fl ow projections.

— 63 —
Notes to the Consolidated Financial Statements
(b) Other Intangible Assets
Other intangible assets consisted of the following:
Expressed in thousands of US Dollars
Customer relationships Other
Total subject to
amortization Tradenames
Total other intangible
assets
Cost: At January 1, 2011 111,650 5,551 117,201 538,755 655,956 Effect of movement in foreign currency exchange rate — — — (525) (525)
At December 31, 2011 and January 1, 2012 111,650 5,551 117,201 538,230 655,431 Additions 3,600 170 3,770 56,400 60,170 Effect of movement in foreign currency exchange rate — — — 405 405
At December 31, 2012 115,250 5,721 120,971 595,035 716,006
Accumulated amortization: At January 1, 2011 (23,916) (3,744) (27,660) — (27,660) Amortization for the year (7,608) (725) (8,333) — (8,333)
At December 31, 2011 and January 1, 2012 (31,524) (4,469) (35,993) — (35,993) Amortization for the year (7,758) (733) (8,491) — (8,491)
At December 31, 2012 (39,282) (5,202) (44,484) — (44,484)
Carrying amounts:At December 31, 2012 75,968 519 76,487 595,035 671,522
At December 31, 2011 80,126 1,082 81,208 538,230 619,438

— 64 —
Notes to the Consolidated Financial Statements
The aggregate carrying amounts of each signifi cant tradename were as follows:
Expressed in thousands of US Dollars
Samsonite®AmericanTourister® High Sierra® Hartmann® Other Consolidated
At January 1, 2011 462,459 69,969 — — 6,327 538,755 Foreign exchange — — — — (525) (525)
At December 31, 2011 462,459 69,969 — — 5,802 538,230 Additions — — 39,900 16,500 — 56,400 Foreign exchange — — — — 405 405
At December 31, 2012 462,459 69,969 39,900 16,500 6,207 595,035
Amortization expense for intangible assets for the years ended December 31, 2012 and December 31, 2011 was US$8.5 million and US$8.3 million, respectively, and is presented as a distribution expense in the consolidated income statement. Future amortization expense as of December 31, 2012 for the next fi ve years is estimated to be US$8.4 million, US$8.0 million, US$8.0 million, US$8.0 million, US$7.7 million and a total of US$36.4 million thereafter.
In accordance with IAS 36, the Company is required to evaluate its intangible assets with defi nite lives for recoverability whenever events or changes in circumstance indicate that their carrying amount might not be recoverable. As of December 31, 2012 and December 31, 2011 there were no potential impairment indicators and there were no accumulated impairment losses at December 31, 2012 and December 31, 2011.
11. Prepaid Expenses, Other Assets and Receivables
(a) Non-current
Other assets and receivables consisted of the following:
Expressed in thousands of US DollarsDecember 31,
2012 2011
Deposits 17,909 15,415Other 4,884 3,085
Total other assets and receivables 22,793 18,500
(b) Current
Prepaid expenses and other current assets are expected to be recoverable or expensed within one year.
— 65 —
Notes to the Consolidated Financial Statements
12. Inventories
Inventories consisted of the following:
Expressed in thousands of US DollarsDecember 31,
2012 2011
Raw materials 14,715 14,952Work in process 1,820 1,804Finished goods 260,981 220,201
Total inventories 277,516 236,957
The amounts above include the following:
Expressed in thousands of US DollarsDecember 31,
2012 2011
Inventories carried at fair value less costs to sell 69,850 47,561
During the years ended December 31, 2012 and December 31, 2011 the write-down of inventories to net realizable value (fair value less costs to sell) amounted to US$10.0 million and US$6.6 million, respectively. During the years ended December 31, 2012 and December 31, 2011 the reversal of write-downs recognized in profi t or loss amounted to US$2.8 million and US$0.3 million, respectively, where the Company was able to sell the previously written down inventories at higher selling prices than previously estimated.
13. Trade and Other Receivables
Trade and other receivables are presented net of related allowances for doubtful accounts of US$12.9 million and US$11.3 million as of December 31, 2012 and December 31, 2011, respectively.
(a) Aging Analysis
Included in trade and other receivables are trade receivables (net of allowance for doubtful accounts) of US$211.5 million and US$165.0 million as of December 31, 2012 and December 31, 2011, respectively, with the following aging analysis by invoice date:
Expressed in thousands of US DollarsDecember 31,
2012 2011
Current 173,185 127,926Past Due 38,311 37,074
Total trade receivables 211,496 165,000

— 66 —
Notes to the Consolidated Financial Statements
Credit terms are granted based on the credit worthiness of individual customers. As of December 31, 2012, trade receivables are on average due within 60 days from the date of billing.
(b) Impairment of Trade Receivables
Impairment losses in respect of trade receivables are recorded using an allowance account unless the Company is satisfi ed that recovery of the amount is remote, in which case the impairment loss is written off against trade receivables directly. The Company does not hold any collateral over these balances.
The movement in the allowance for doubtful accounts during the year:
Expressed in thousands of US Dollars2012 2011
At January 1 11,309 12,485Impairment loss recognized 1,861 806Impairment loss written back (298) (1,982)
At December 31 12,872 11,309
14. Cash and Cash Equivalents
Expressed in thousands of US DollarsDecember 31,
2012 2011
Bank balances 110,561 121,188Short-term investments 40,838 20,071
Total cash and cash equivalents 151,399 141,259
Short-term investments are comprised of overnight sweep accounts and time deposits. As of December 31, 2012 and December 31, 2011 the Company had no restrictions on the use of any of its cash.

— 67 —
Notes to the Consolidated Financial Statements
15. Share Capital and Reserves
As of December 31, share capital was as follows:
In thousands of shares
Ordinary sharesPreference shares of
OldCo
2012 2011 2012 2011
At January 1 1,407,137 2,143,395 — 78,000Conversion of preference shares to Loan Notes — — — (78,000)Contribution of OldCo shares — (2,143,395) — —Issuance of share capital to equity holders of OldCo — 1,286,037 — —Issued for cash upon Global Offering — 121,100 — —
At December 31 1,407,137 1,407,137 — —
In connection with the Global Offering during the year ended December 31, 2011, the benefi cial owners of the ordinary shares of OldCo contributed such shares to the Company in consideration for the issue of ordinary shares in the Company, which, upon completion of the reorganization prior to the Global Offering, totalled approximately 1,286.0 million ordinary shares. Please refer to note 27 for further details. In the Global Offering, approximately 121.1 million additional ordinary shares were offered and sold by the Company. The Company received gross proceeds of HK$1,756.0 million corresponding to a capital increase of US$225.3 million with the exchange rate prevailing at the date of the transaction. In connection with the transaction, the Company incurred costs amounting to US$33.7 million for the year ended December 31, 2011, of which US$8.9 million were related to the listing and issue of new shares and were recorded as a reduction of the additional paid-in capital. The remaining costs of US$24.8 million were recognized as an expense in the consolidated income statement for the year ended December 31, 2011.
In connection with the Global Offering, the 78.0 million preference shares of OldCo were redeemed and cancelled on June 10, 2011 in consideration for the benefi cial owners of the preference shares receiving the Loan Notes. The US$101.0 million outstanding balance of the Loan Notes were repaid utilizing a portion of the Company’s proceeds from the sale of ordinary shares on completion of the Global Offering.
(a) Ordinary Shares
At December 31, 2012 and December 31, 2011, the Company had 99,872,899,995 shares authorized but unissued and 1,407,137,004 ordinary shares with par value of US$0.01 per share issued and outstanding.
The holders of ordinary shares are entitled to one vote per share at meetings of the Company. All ordinary shares in issue rank equally and in full for all dividends or other distributions declared, made or paid on the shares in respect of a record date.

— 68 —
Notes to the Consolidated Financial Statements
(b) Preference Shares
(i) Class A Preference Shares
At January 1, 2011, OldCo had 77,000,000 shares of US$0.01 par Class A preference shares authorized, issued and outstanding. All issued shares were fully paid.
Class A preference shares were issued for a share premium which OldCo reserved against for future distribution to holders of Class A preference shares. The controlling shareholders of OldCo could not force a dividend or effect a redemption of the Class A preference shares as a result of restrictions on the applicable shareholders’ deed as well as Luxembourg company law. The Class A preference shares were classifi ed as equity in accordance with IAS 32. All Class A preference shares were redeemed and cancelled in on June 10, 2011.
(ii) Class B Preference Shares
At January 1, 2011, OldCo had 1,000,000 shares of US$0.01 par Class B preference shares authorized, issued and outstanding. All issued shares were fully paid.
Class B preference shares were entitled to an 8% cumulative return on the aggregate amount of US$165.0 million compounded annually, which was allocated to a reserve for Class B preference shareholders. Payment of the cumulative return would occur only upon a liquidation or repurchase of the Class B preference shares. The controlling benefi cial shareholders of OldCo could not force a dividend or effect a redemption of the Class B preference shares as a result of restrictions on the shareholders’ deed as well as Luxembourg company law. The Class B preference shares were classifi ed as equity in accordance with IAS 32. All Class B preference shares were redeemed and cancelled on June 10, 2011.
(c) Treasury Shares
There are no treasury shares held by the Company.
(d) Distributable Reserves
At December 31, 2012, distributable reserves amounted to approximately US$2.3 billion as shown in the statutory fi nancial statements of Samsonite International S.A. and calculated in accordance with the Company’s Articles of Incorporation and with Luxembourg legal and regulatory requirements.
(e) Foreign Currency Translation Reserve
The foreign currency translation reserve comprises all foreign currency differences arising from the translation of the fi nancial statements of foreign operations.
(f) Other Reserves
Other reserves comprises the cumulative net change in the fair value of cash fl ow hedging instruments related to hedged transactions that have not yet occurred.

— 69 —
Notes to the Consolidated Financial Statements
(g) Non-controlling Interests
The Company currently operates in certain markets by means of majority-owned subsidiaries that are operated in conjunction with a non-controlling partner in each country. Under these arrangements, the Company contributes brands through trademark licensing agreements and international marketing expertise and the partner contributes local market expertise. All interests acquired were paid in full at the time of the acquisition and each of these subsidiaries are operated on a self-fi nancing basis. There are no current or future requirements for the Company to contribute any further investment amount to any of these entities.
The agreements governing certain majority-owned subsidiaries include put and call options whereby the Company may be required to acquire the respective non-controlling interests at amounts intended to represent current fair value. As of December 31, 2012 and December 31, 2011, the fi nancial liabilities recognized related to these put options were US$45.0 million and US$29.5 million, respectively.
The call options were deemed to have a fair value of nil at each reporting date as the agreements call for redemption at fair value upon the option being exercised.
16. Earnings Per Share
(a) Basic
The calculation of basic earnings per share in the current period is based on the profi t attributable to ordinary equity shareholders of the Company, less the guaranteed return on the previously outstanding Class B preference shares of OldCo.
The weighted average number of shares has been calculated as follows:
Expressed in thousands of US Dollars, except share and per share dataYear ended December 31,
2012 2011
Issued ordinary shares at the beginning of the period 1,407,137,004 1,286,036,999Weighted average impact of issuance of shares in the Global Offering (note 6) — 66,024,386
Weighted average number of shares at end of the period 1,407,137,004 1,352,061,385
Profi t attributable to the equity holders 148,439 86,748 Less earnings on Class B preference shares — (6,489)
Adjusted profi t attributable to the equity holders 148,439 80,259
Basic earnings per share 0.11 0.06 (Expressed in US Dollars per share)
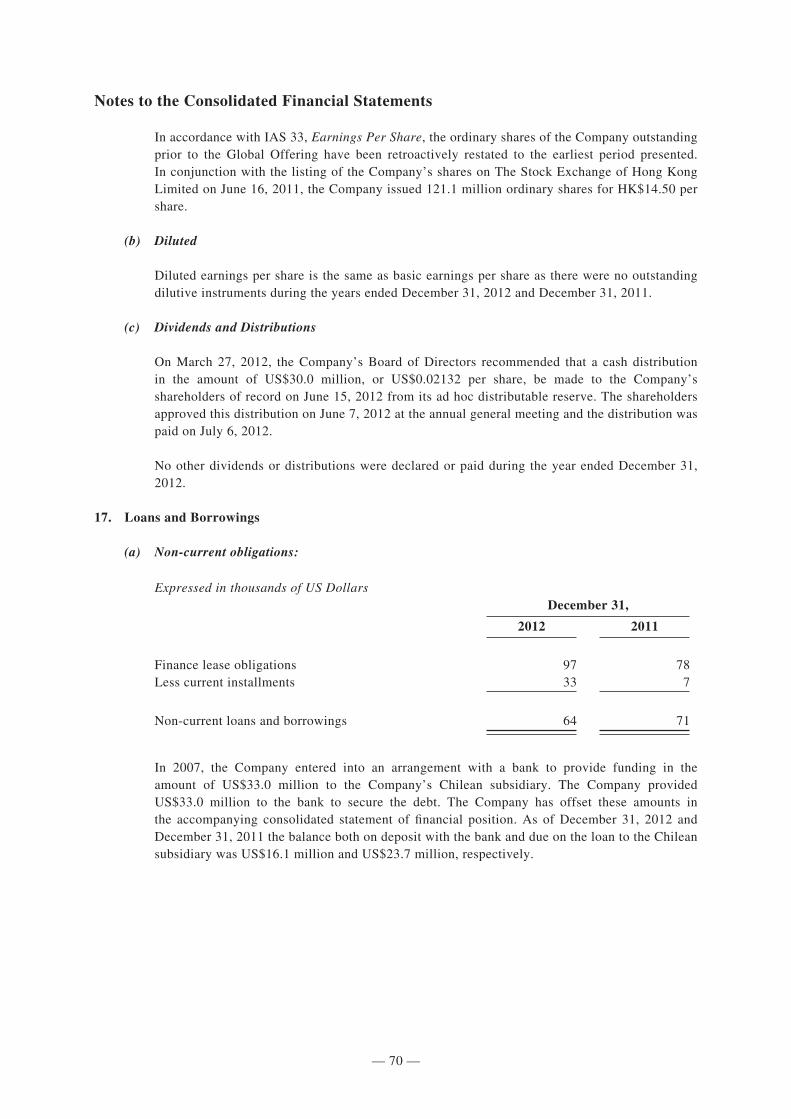
— 70 —
Notes to the Consolidated Financial Statements
In accordance with IAS 33, Earnings Per Share, the ordinary shares of the Company outstanding prior to the Global Offering have been retroactively restated to the earliest period presented. In conjunction with the listing of the Company’s shares on The Stock Exchange of Hong Kong Limited on June 16, 2011, the Company issued 121.1 million ordinary shares for HK$14.50 per share.
(b) Diluted
Diluted earnings per share is the same as basic earnings per share as there were no outstanding dilutive instruments during the years ended December 31, 2012 and December 31, 2011.
(c) Dividends and Distributions
On March 27, 2012, the Company’s Board of Directors recommended that a cash distribution in the amount of US$30.0 million, or US$0.02132 per share, be made to the Company’s shareholders of record on June 15, 2012 from its ad hoc distributable reserve. The shareholders approved this distribution on June 7, 2012 at the annual general meeting and the distribution was paid on July 6, 2012.
No other dividends or distributions were declared or paid during the year ended December 31, 2012.
17. Loans and Borrowings
(a) Non-current obligations:
Expressed in thousands of US DollarsDecember 31,
2012 2011
Finance lease obligations 97 78Less current installments 33 7
Non-current loans and borrowings 64 71
In 2007, the Company entered into an arrangement with a bank to provide funding in the amount of US$33.0 million to the Company’s Chilean subsidiary. The Company provided US$33.0 million to the bank to secure the debt. The Company has offset these amounts in the accompanying consolidated statement of fi nancial position. As of December 31, 2012 and December 31, 2011 the balance both on deposit with the bank and due on the loan to the Chilean subsidiary was US$16.1 million and US$23.7 million, respectively.

— 71 —
Notes to the Consolidated Financial Statements
(b) Current Obligations
The Company had the following current obligations:
Expressed in thousands of US DollarsDecember 31,
2012 2011
Revolving Credit Facility 25,000 —Current installments of non-current obligations 33 7Other lines of credit 10,297 15,008
Total current obligations 35,330 15,015 Less deferred fi nancing costs (3,096) (3,319)
Current loans and borrowings 32,234 11,696
Certain subsidiaries of the Company maintain credit lines with various third party lenders in the regions in which they operate. These local credit lines provide working capital for the day to day business operations of the subsidiaries, including overdraft, bank guarantee, and trade fi nance and factoring facilities. The majority of these credit lines are uncommitted facilities. The total aggregate amount outstanding under the local facilities was US$10.3 million and US$15.0 million at December 31, 2012 and December 31, 2011, respectively. The unused available lines of credit amounted to US$51.9 million and US$59.6 million as of December 31, 2012 and December 31, 2011, respectively.
On July 2, 2012, the Company increased its existing revolving credit facility (the “Revolving Facility”) from US$100.0 million to US$300.0 million. The facility can be increased by an additional US$100.0 million, subject to lender approval. The Revolving Facility has an initial term of three years, with a one year extension available at the request of the Company and at the option of the lenders. The interest rate on borrowings under the Revolving Facility is the aggregate of (i) (a) LIBOR (or EURIBOR in the case of borrowings made in Euro) or (b) the prime rate of the lender and (ii) a margin to be determined based on the Company’s leverage ratio. The Revolving Facility carries a commitment fee of 0.175% per annum on any unutilized amounts, as well as an agency fee. The Revolving Facility is secured by certain assets in the United States and Europe, as well as the Company’s intellectual property. The Revolving Facility also contains fi nancial covenants related to interest coverage and leverage ratios, and operating covenants that, among other things, limit the Company’s ability to incur additional debt, create liens on its assets, and participate in certain mergers, acquisitions, liquidations, asset sales or investments. The Company was in compliance with the fi nancial covenants as of December 31, 2012. At December 31, 2012 and December 31, 2011, US$25.0 million and US$0 were borrowed on the facility, respectively. At December 31, 2012, US$269.0 million was available to be borrowed on the Revolving Facility as a result of the US$25.0 million outstanding borrowing and the utilization of US$6.0 million of the facility for outstanding letters of credit. At December 31, 2011, US$82.4 million was available on the Revolving Facility as a result of the utilization of US$17.6 million of the facility for outstanding letters of credit.
— 72 —
Notes to the Consolidated Financial Statements
18. Employee Benefi ts
Employee benefi ts expense, which consists of payroll and other benefi ts, amounted to US$215.0 million and US$201.5 million for the years ended December 31, 2012 and December 31, 2011, respectively. Of these amounts, US$20.4 million and US$20.9 million was included in cost of sales during the years ended December 31, 2012 and December 31, 2011, respectively. Remaining amounts were presented in distribution and general and administrative expenses.
Average employee headcount worldwide was approximately 6,860 and 6,200 for the years ending December 31, 2012 and December 31, 2011, respectively.
(a) Long-Term Incentive Schemes
On September 14, 2012 the Company established a Share Award Scheme, as approved by the shareholders, that entitles certain Directors and employees of the Company and its subsidiaries to be granted Company share options or restricted stock units (“RSUs”). There were no such options granted as of December 31, 2012. On January 8, 2013, the Company granted 15,532,227 ordinary share options to certain directors, key management personnel, and other employees. The exercise price of the options granted is HK$17.36. Such options are subject to graded vesting over a 4 year period, with 25% of the options vesting on each anniversary date of the grant and have a 10 year term.
(b) Pension Plans and Defi ned Benefi t Schemes
(i) Plan Descriptions
Certain subsidiaries of the Company have pension plans and post-retirement health benefi t plans which provide retirement benefi ts for eligible employees, generally measured by length of service, compensation and other factors. The Company follows the recognition and disclosure provisions of IAS 19, Employee Benefi ts (IAS 19). Under IAS 19, actuarial gains and losses are recognized in other comprehensive income. The measurement date for all pension and other employee benefi t plans is the Company’s fi scal year end.
A U.S. subsidiary of the Company sponsors a defi ned benefi t retirement plan, the Samsonite Employee Retirement Income Plan, that covers certain employee groups. Retirement benefi ts are based on a fi nal average pay formula. The Company also maintains a supplemental retirement plan for certain management employees. These plans were closed to new entrants effective January 1, 2010. Effective December 31, 2010, both plans were frozen to future accruals.
A U.S. subsidiary of the Company also provides health care and life insurance benefi ts to certain retired employees who meet certain age and years of service eligibility requirements. The plan was closed to new entrants with regards to life insurance benefi ts effective January 1, 2009 and closed to new entrants with regards to medical benefi ts effective December 31, 2009. Eligible retirees are required to contribute to the costs of post-retirement benefi ts. The Company’s other post-retirement benefi ts are not vested and the Company has the right to modify any benefi t provision, including contribution requirements, with respect to any current or former employee, dependent or benefi ciary. As of December 31, 2012 and December 31, 2011, the percentage of health insurance cost that the retiree must contribute was 100%.

— 73 —
Notes to the Consolidated Financial Statements
A Belgium subsidiary of the Company sponsors a pre-pension defi ned benefi t retirement plan to certain employees who meet certain age and years of service eligibility requirements. Benefi ts are calculated based on a fi nal pay formula and are contributed until the employee reaches the legal retirement age.
The U.S. plans are administered by trustees, which are independent of the Company, with their assets held separately from those of the Company. These plans are funded by contributions from the Company in accordance with an independent actuary’s recommendation based on annual actuarial valuations. The latest independent actuarial valuations of the plans were as of December 31, 2012 and were prepared by independent qualifi ed actuaries, who are members of the Society of Actuaries of the United States of America, using the projected unit credit method. The actuarial valuations indicate that the Company’s obligations under these defi ned benefi t retirement plans are US$243.5 million and US$242.5 million as of December 31, 2012 and December 31, 2011, respectively, which are 77.5% and 75.4% funded by the plan assets held by the trustees at December 31, 2012 and December 31, 2011, respectively.
(ii) Amounts recognized in the consolidated statements of fi nancial position
Expressed in thousands of US DollarsDecember 31,
2012 2011
Present value of unfunded obligations (16,325) (13,730)Present value of partly funded obligations (240,860) (228,723)Fair value of plan assets 188,807 182,728
Net pension liability (68,378) (59,725)
Experience adjustments arising on plan liabilities 7,354 (2,660)
Experience adjustments arising on plan assets (7,384) (1,089)
The net pension liability is recorded in employee benefi ts in the consolidated statement of fi nancial position. The Company does not have net unrecognized actuarial losses as the Company recognizes all actuarial gains and losses in other comprehensive income.
A portion of the above liability is expected to be settled after more than one year. However, it is not practicable to segregate the amount from the amounts payable in the next twelve months, as future contributions will also relate to future services rendered, future changes in actuarial assumptions and market conditions. The Company estimates that the benefi t payments for the pension and post-retirement benefi ts will be approximately US$17.6 million during 2013 and between US$16.4 million and US$17.3 million each year from 2014 through 2017.

— 74 —
Notes to the Consolidated Financial Statements
The net pension liability is shown below:
Expressed in thousands of US DollarsDecember 31, 2012
US Pension benefi ts
US Post-retirement
benefi ts
Belgium retirement
benefi ts Total
Present value of the defi ned benefi t obligation (243,515) (2,511) (11,159) (257,185)Fair value of plan assets 188,807 — — 188,807
Net liability (54,708) (2,511) (11,159) (68,378)
Expressed in thousands of US DollarsDecember 31, 2011
US Pension benefi ts
US Post-retirement
benefi ts
Belgium retirement
benefi ts Total
Present value of the defi ned benefi t obligation (231,157) (2,510) (8,786) (242,453)Fair value of plan assets 182,728 — — 182,728
Net liability (48,429) (2,510) (8,786) (59,725)

— 75 —
Notes to the Consolidated Financial Statements
(iii) Movements in the present value of the defi ned benefi t obligations
Expressed in thousands of US DollarsYear ended December 31, 2012
US Pension benefi ts
US Post-retirement
benefi ts
Belgium retirement
benefi ts Total
Change in benefi t obligation: Benefi t obligation at January 1 231,157 2,510 8,786 242,453 Service cost — — 437 437 Interest cost 9,838 102 403 10,343 Plan participants’ contributions — 274 — 274 Actuarial loss 32,102 292 1,890 34,284 Benefi ts paid (29,582) (667) (567) (30,816) Foreign exchange adjustments — — 210 210
Benefi t obligation at December 31 243,515 2,511 11,159 257,185
Expressed in thousands of US DollarsYear ended December 31, 2011
US Pension benefi ts
US Post-retirement
benefi ts
Belgium retirement
benefi ts Total
Change in benefi t obligation: Benefi t obligation at January 1 223,321 2,390 9,037 234,748 Service cost — — 445 445 Interest cost 11,075 116 432 11,623 Plan participants’ contributions — 873 — 873 Actuarial (gain) loss 13,819 314 (191) 13,942 Benefi ts paid (17,058) (1,183) (642) (18,883) Foreign exchange adjustments — — (295) (295)
Benefi t obligation at December 31 231,157 2,510 8,786 242,453

— 76 —
Notes to the Consolidated Financial Statements
(iv) Movement in Plan Assets
Expressed in thousands of US DollarsYear ended December 31, 2012
US Pension benefi ts
US Post-retirement
benefi ts
Belgium retirement
benefi ts Total
Change in plan assets: Fair value of plan assets at January 1 182,728 — — 182,728 Expected return on plan assets 9,743 — — 9,743 Actuarial gain on plan assets 7,384 — — 7,384 Employer contributions 18,534 393 567 19,494 Plan participants’ contributions — 274 — 274 Benefi ts paid (29,582) (667) (567) (30,816)
Fair value of plan assets at December 31 188,807 — — 188,807
Expressed in thousands of US DollarsYear ended December 31, 2011
US Pension benefi ts
US Post-retirement
benefi ts
Belgium retirement
benefi ts Total
Change in plan assets: Fair value of plan assets at January 1 157,624 — — 157,624 Expected return on plan assets 8,303 — — 8,303 Actuarial gain on plan assets 1,089 — — 1,089 Employer contributions 32,770 310 642 33,722 Plan participants’ contributions — 873 — 873 Benefi ts paid (17,058) (1,183) (642) (18,883)
Fair value of plan assets at December 31 182,728 — — 182,728

— 77 —
Notes to the Consolidated Financial Statements
(v) Net actuarial gain (loss) recognized in other comprehensive income
Expressed in thousands of US DollarsYear ended December 31, 2012
US Pension benefi ts
US Post-retirement
benefi ts
Belgium retirement
benefi ts Total
Cumulative amount at January 1 91,579 (3,129) (48) 88,402Net actuarial loss 24,718 293 1,818 26,829
Cumulative amount at December 31 116,297 (2,836) 1,770 115,231
Expressed in thousands of US DollarsYear ended December 31, 2011
US Pension benefi ts
US Post-retirement
benefi ts
Belgium retirement
benefi ts Total
Cumulative amount at January 1 78,848 (3,443) 111 75,516Net actuarial (gain) loss 12,731 314 (159) 12,886
Cumulative amount at December 31 91,579 (3,129) (48) 88,402

— 78 —
Notes to the Consolidated Financial Statements
(vi) Expenses recognized in the consolidated income statement
Expressed in thousands of US DollarsYear ended December 31, 2012
US Pension benefi ts
US Post-retirement
benefi ts
Belgium retirement
benefi ts Total
Service cost — — 437 437Interest cost 9,838 102 403 10,343Expected return on plan assets (9,743) — — (9,743)Amortization of net loss — — 103 103
Total net periodic benefi t cost 95 102 943 1,140
Expressed in thousands of US DollarsYear ended December 31, 2011
US Pension benefi ts
US Post-retirement
benefi ts
Belgium retirement
benefi ts Total
Service cost — — 445 445Interest cost 11,075 116 432 11,623Expected return on plan assets (8,303) — — (8,303)Amortization of net gain — — (32) (32)
Total net periodic benefi t cost 2,772 116 845 3,733
The expense is recognized in the following line items in the consolidated income statement:
Expressed in thousands of US DollarsYear ended December 31,
2012 2011
General and administrative expenses 1,137 2,231Other expenses 3 1,502
1,140 3,733
Pension expense included in other income and expense relates to the actuarial determined pension expense associated with the pension plans of two companies unrelated to the Company’s current operations whose pension obligations were assumed by the Company as a result of a 1993 agreement with the Pension Benefi t Guaranty Corporation (the “PBGC”). The plans were part of a controlled company of corporations of which the Company was a part of, prior to 1993.

— 79 —
Notes to the Consolidated Financial Statements
(vii) Actuarial assumptions used
US Pension benefi ts
US Post-retirement
benefi ts
Belgium retirement
benefi ts
2012Weighted average assumptions used to determine benefi t obligations as of December 31: Discount rate 3.48% 3.48% 3.00% Rate of compensation increase N/A N/A — Rate of price infl ation N/A N/A —
Weighted average assumptions used to determine net periodic benefi t cost for the year ended December 31: Discount rate 4.42% 4.42% 4.75% Expected long-term rate of return on assets 6.40% N/A N/A Rate of compensation increase N/A N/A —
2011Weighted average assumptions used to determine benefi t obligations as of December 31: Discount rate 4.42% 4.42% 4.75% Rate of compensation increase — N/A — Rate of price infl ation N/A N/A 2.00%
Weighted average assumptions used to determine net periodic benefi t cost for the year ended December 31: Discount rate 5.16% 5.16% 4.38% Expected long-term rate of return on assets 6.30% N/A N/A Rate of compensation increase — N/A —
The Company’s overall expected long-term rate of return on assets is 6.4% for the U.S. plans. The expected long-term rate of return is based on the portfolio as a whole and not on the sum of the returns on individual asset categories. The return is based exclusively on historical returns, without adjustments. The expected long-term rate of return is a long-term assumption which refl ects the Company’s best estimate of the average rate of earnings expected on funds invested to provide for the projected plan obligations. In assessing this rate, appropriate consideration was given to the returns achieved in recent years as well as returns expected to be achieved in the long-term, based on the Company’s investment guidelines and objectives. The actual rate of return on assets for December 31, 2012 and December 31, 2011 was 11% and 8%, respectively.

— 80 —
Notes to the Consolidated Financial Statements
The discount rate is based on a high-grade bond yield curve under which benefi ts were projected and discounted at spot rates along the curve. The discount rate was then determined as a single rate yielding the same present value.
For post-retirement benefi t measurement purposes, a 7.7% annual rate of increase in the per capita cost of covered health care benefi ts was assumed for the year ended December 31, 2012. The rate was assumed to decrease gradually to 4.5% for the year ended December 31, 2028 and remain at that level thereafter.
Assumed health care cost trend rates have a signifi cant effect on the amounts reported for the post-retirement health care plans. A one percentage point change in assumed health care cost trend rates would have the following effects:
Expressed in thousands of US Dollars2012 2011
1% increase
1% decrease
1% increase
1% decrease
Effect on total of service and interest cost components 1 (1) 1 (1)Effect on post retirement benefi t obligation 19 (19) 15 (15)
The estimated benefi t obligation (the actuarial present value of benefi ts attributed to employee service and compensation levels prior to the measurement date without considering future compensation levels), exceeded the fair value of plan assets as of December 31, 2012 and December 31, 2011 by US$68.2 million and US$59.7 million, respectively.

— 81 —
Notes to the Consolidated Financial Statements
(viii) Fair values of the assets held by the U.S. pension plan by major asset category
December 31, 2012
Targeted allocation Fair value
(US$’000)
Equity —%–40% 18,409Fixed Income —%–100% 111,566Asset allocation 20%–40% 57,405Other —%–10% 1,427
Total 100% 188,807
December 31, 2011
Targeted allocation Fair value
(US$’000)
Equity —%–40% 28,692Fixed income —%–100% 102,687Asset allocation 20%–40% 46,986Other —%–10% 4,363
Total 100% 182,728
The asset allocation targets are set with the expectation that the plan’s assets will fund the plan’s expected liabilities with an appropriate level of risk. Expected returns, risk and correlation among asset classes are based on historical data and input received from our investment advisors.
The funding policy for the plans is to contribute amounts suffi cient to meet minimum funding requirements as set forth in employee benefi t and tax laws. In 2013, the minimum requirement expected to be contributed is approximately US$8.8 million, US$0.3 million and US$0.6 million to the U.S. pension, U.S. post-retirement and Belgium plans, respectively.

— 82 —
Notes to the Consolidated Financial Statements
(ix) Historical Information
Expressed in thousands of US DollarsDecember 31,
2012 2011 2010 2009 2008
Present value of the defi ned benefi t obligation (257,185) (242,453) (234,748) (234,485) (232,427)Fair value of plan assets 188,807 182,728 157,624 134,724 131,284
Net liability (68,378) (59,725) (77,124) (99,761) (101,143)
Experience adjustments arising on plan liabilities 7,354 (2,660) 9,897 1,332 5,337Experience adjustments arising on plan assets (7,384) (1,089) 2,675 9,277 (59,161)
(c) Samsonite LLC’s US Pension Plan Settlement Agreement
Samsonite LLC (a U.S. subsidiary of the Company) and the PBGC are party to a Settlement Agreement, under which PBGC was granted an equal and ratable lien in the amount of US$19.0 million on certain domestic assets of Samsonite LLC and certain of its U.S. subsidiaries (excluding any equity interests in subsidiaries and any inventory or accounts receivable of Samsonite LLC or its U.S. subsidiaries), together with Samsonite’s intellectual property rights in the U.S. and Samsonite’s rights under licenses of such intellectual property to affi liates or third parties. The PBGC’s lien is equal and ratable with the lien granted over such assets to Samsonite’s senior secured lenders. Other provisions of the agreement restrict the transfer of U.S. assets outside of the ordinary course of business. The Company is in compliance with these requirements as of December 31, 2012.
The agreement will expire upon (a) the Company obtaining investment grade status on its senior unsecured debt, (b) the date the plan has no unfunded benefi t liabilities for two consecutive plan years, (c) the date on which the Company becomes part of a controlled company whose unsecured debt has investment grade status, or (d) the date the plan is successfully terminated.

— 83 —
Notes to the Consolidated Financial Statements
19. Commitments
(a) Capital Commitments
Capital commitments outstanding as of December 31, 2012 and December 31, 2011 not recognized as liabilities in the consolidated statement of fi nancial position, as they do not meet the recognition criteria, include the following amounts:
Expressed in thousands of US DollarsDecember 31,
2012 2011
Contracted for 11,326 2,460Authorized but not contracted for 61,274 40,523
Total capital commitments 72,600 42,983
(b) Operating Lease Commitments
The Company’s lease obligations primarily consist of non-cancellable leases of offi ce, warehouse and retail store space and equipment. As of December 31, 2012 and December 31, 2011, future minimum payments under non-cancellable leases were as follows:
Expressed in thousands of US DollarsDecember 31,
2012 2011
Within one year 59,373 53,0741–2 years 47,743 41,8082–5 years 78,421 81,804More than 5 years 21,830 24,063
Total operating lease commitments 207,367 200,749
Certain of the leases are renewable at the Company’s option. Certain of the leases also contain rent escalation clauses that require additional rents in later years of the lease term, which are recognized on a straight-line basis over the lease term.
Rental expense under cancellable and non-cancellable operating leases amounted to US$83.2 million and US$74.0 million for the years ended December 31, 2012 and 2011, respectively. Certain of the retail leases provide for additional rent payments based on a percentage of sales. These additional rent payments amounted to US$2.9 million and US$2.8 million for the years ended December 31, 2012 and December 31, 2011, respectively, and are included in rent expense.

— 84 —
Notes to the Consolidated Financial Statements
20. Contingent Liabilities
In the ordinary course of business, the Company is subject to various forms of litigation and legal proceedings. The facts and circumstances relating to particular cases are evaluated in determining whether it is more likely than not that there will be a future outfl ow of funds and, once established, whether a provision relating to specifi c litigation is suffi cient. The Company records provisions based on its past experience and on facts and circumstances known at each reporting date. The provision charge is recognized within general and administrative expenses in the consolidated income statement. When the date of the incurrence of an obligation is not reliably measureable, the provisions are not discounted and are classifi ed in current liabilities.
During the year ended December 31, 2012, the Company reached an amicable settlement with Lankhorst Pure Composites B.V. with regard to the proceedings that were pending in relation to the ownership of the patents relating to the process used by the Company to manufacture products using Curv® material. While the terms of the settlement are confi dential, the Company remains full owner of the patents at issue in the dispute, and the settlement does not impact in any way the Company’s right to utilize its manufacturing process.
The Company did not settle any other signifi cant litigation during the year ended December 31, 2012.
21. Trade and Other Payables
Expressed in thousands of US DollarsDecember 31,
2012 2011
Accounts payable 268,588 212,974Other payables and accruals 85,074 66,953Other tax payables 8,826 6,633
Total trade and other payables 362,488 286,560
No restructuring charges were recognized during the year ended December 31, 2012. For the year ended December 31, 2011, US$0.9 million of restructuring charges were reversed to refl ect a refund from certain local governmental agencies for upfront employee related payments made in connection with restructuring initiatives in 2009.
Included in accounts payable are trade payables with the following aging analysis as of the reporting dates:
Expressed in thousands of US DollarsDecember 31,
2012 2011
Current 200,927 158,067Past Due 24,322 10,163
Total trade payables 225,249 168,230
Trade payables as of December 31, 2012 are on average due within 105 days from the invoice date.

— 85 —
Notes to the Consolidated Financial Statements
22. Financial Instruments
(a) Exposure to Credit Risk
The carrying amount of fi nancial assets represents the maximum credit exposure. The maximum exposure to credit risk at the reporting date was:
Expressed in thousands of US DollarsDecember 31,
2012 2011
Trade and other receivables 222,159 171,552Cash and cash equivalents 151,399 141,259Foreign currency forward contracts — 6,448
373,558 319,259
The maximum exposure to credit risk for trade receivables at the reporting date by geographic region was:
Expressed in thousands of US DollarsDecember 31,
2012 2011
Asia 73,279 63,980Europe 49,103 47,068North America 67,462 36,582Latin America 21,652 17,370
Total trade receivables 211,496 165,000
(b) Exposure to Liquidity Risk
The following are the contractual maturities of derivative and non-derivative fi nancial liabilities, including estimated interest payments.
Expressed in thousands of US DollarsDecember 31, 2012
Carrying amount
Contractual cash fl ows
Less than one year 1–2 years 2–5 years
More than 5 years
Non-derivative fi nancial liabilities: Trade and other payables 362,488 362,488 362,488 — — — Revolving Facility 25,000 25,000 25,000 — — — Other lines of credit 10,297 10,297 10,297 — — — Minimum operating lease payments — 207,367 59,373 47,743 78,421 21,830
Foreign currency forward contracts: Liabilities 1,694 95,799 95,799 — — —

— 86 —
Notes to the Consolidated Financial Statements
Expressed in thousands of US DollarsDecember 31, 2011
Carrying amount
Contractual cash fl ows
Less than one year 1–2 years 2–5 years
More than 5 years
Non-derivative fi nancial liabilities: Trade and other payables 286,560 286,560 286,560 — — — Other lines of credit 15,008 15,008 15,008 — — — Minimum operating lease payments — 200,749 53,074 41,808 81,804 24,063
Foreign currency forward contracts: Assets 6,448 82,246 82,246 — — — Liabilities 776 9,353 9,353 — — —
The following table indicates the periods in which the cash fl ows associated with derivatives that are cash fl ow hedges, are expected to occur and impact profi t or loss.
Expressed in thousands of US DollarsCarrying amount
Expected cash fl ows
Less than one year 1–2 years 2–5 years
More than 5 years
December 31, 2012: Liabilities 1,694 95,799 95,799 — — —
December 31, 2011: Assets 6,448 82,246 82,246 — — — Liabilities 776 9,353 9,353 — — —
(c) Exposure to Currency Risk
The Company’s exposure to foreign currency risk arising from the currencies that more signifi cantly affect the Company’s fi nancial performance was as follows based on notional amounts of items with largest exposure:
December 31, 2012
Euro Renminbi
(Euro’000) (RMB’000)
Cash 40,850 88,563Trade and other receivables, net 35,848 90,258Intercompany receivables (payables) (10,916) (6,731)Trade and other payables (44,214) (93,841)
Statement of fi nancial position exposure 21,568 78,249
December 31, 2011
Euro Renminbi
(Euro’000) (RMB’000)
Cash 19,255 54,215Trade and other receivables, net 34,492 83,430Intercompany receivables (payables) (5,885) —Trade payables 28,568 (72,965)
Statement of fi nancial position exposure 76,430 64,680

— 87 —
Notes to the Consolidated Financial Statements
The following signifi cant exchange rates applied during the year:
Average rate Reporting date spot rate
2012 2011 2012 2011
Euro 1.2911615 1.4000146 1.3197 1.2957Renminbi 0.1587069 0.1547979 0.16051 0.1588800
(d) Foreign Currency Sensitivity Analysis
A strengthening of the Euro by 10% against the US Dollar would have increased profi t for the years ended December 31, 2012 and December 31, 2011 by US$3.3 million and US$3.2 million, respectively, and increased equity as of December 31, 2012 and December 31, 2011 by US$22.8 million and US$22.1 million, respectively. The analysis assumes that all other variables, in particular interest rates, remain constant. A 10% weakening in the Euro would have an equal but opposite impact to profi t for the period and equity as of these reporting dates.
If the Renminbi had strengthened by 10% against the US Dollar profi t would have increased for the years ended December 31, 2012 and December 31, 2011 by US$2.1 million and US$1.1 million, respectively, and equity as of December 31, 2012 and December 31, 2011 would have increased by US$2.7 million and US$2.2 million, respectively. The analysis assumes that all other variables, in particular interest rates, remain constant. A 10% weakening in the Renminbi would have an equal but opposite impact to profi t for the period and equity as of these reporting dates.
(e) Interest Rate Profi le
The interest rate profi le of the Company’s interest bearing fi nancial instruments was:
Expressed in thousands of US DollarsDecember 31,
2012 2011
Fixed rate instruments: Financial assets — — Financial liabilities — —
— —
Variable rate instruments: Financial assets 40,838 20,071 Financial liabilities (35,394) (15,008)
5,444 5,063
(f) Fair Value Versus Carrying Amounts
All fi nancial assets and liabilities have fair values that approximate carrying amounts.

— 88 —
Notes to the Consolidated Financial Statements
(g) Fair Value Hierarchy
Fair value is the price that would be received to sell an asset or paid to transfer a liability in an orderly transaction between market participants at the measurement date. IFRSs establish a fair value hierarchy that prioritizes the inputs to valuation techniques used to measure fair value. The hierarchy gives the highest priority to unadjusted quoted prices in active markets for identical assets or liabilities (Level 1 measurements) and the lowest priority to measurements involving signifi cant unobservable inputs (Level 3 measurements). The three levels of the fair value hierarchy are as follows:
• Level 1 inputs are quoted prices (unadjusted) in active markets for identical assets or liabilities that the Company has the ability to access at the measurement date.
• Level 2 inputs are inputs other than quoted prices included within Level 1 that are observable for the asset or liability, either directly or indirectly.
• Level 3 inputs are unobservable inputs for the asset or liability.
The level in the fair value hierarchy within which a fair measurement in its entirety falls is based on the lowest level input that is signifi cant to the fair value measurement in its entirety.
The carrying amount of cash and cash equivalents, trade receivables, accounts payable, short-term debt, and accrued expenses approximates fair value because of the short maturity or duration of these instruments.
The fair value of foreign currency forward contracts is estimated by reference to market quotations received from banks.

— 89 —
Notes to the Consolidated Financial Statements
The following table presents assets and liabilities that are measured at fair value on a recurring basis (including items that are required to be measured at fair value) as of December 31, 2012 and December 31, 2011:
Expressed in thousands of US DollarsFair value measurements at reporting date using
December 31, 2012
Quoted prices in active
markets for identical assets
Signifi cant other
observable inputs
Signifi cant unobservable
inputs(Level 1) (Level 2) (Level 3)
Assets: Cash and cash equivalents 151,399 151,399 — —
Total assets 151,399 151,399 — —
Liabilities: Foreign currency forward contracts 1,694 1,694 — —
Total liabilities 1,694 1,694 — —
Expressed in thousands of US DollarsFair value measurements at reporting date using
December 31, 2011
Quoted prices in active
markets for identical assets
Signifi cant other
observable inputs
Signifi cant unobservable
inputs(Level 1) (Level 2) (Level 3)
Assets: Cash and cash equivalents 141,259 141,259 — —
Foreign currency forward contracts 6,448 6,448 — —
Total assets 147,707 147,707 — —
Liabilities: Foreign currency forward contracts 776 776 — —
Total liabilities 776 776 — —
Fair value estimates are made at a specifi c point in time, based on relevant market information and information about the fi nancial instrument. These estimates are subjective in nature and involve uncertainties and matters of signifi cant judgment and therefore cannot be determined with precision. Changes in assumptions could signifi cantly affect the estimates.
Certain non-U.S. subsidiaries of the Company periodically enter into forward contracts related to the purchase of inventory denominated primarily in USD which are designated as cash fl ow hedges. The hedging effectiveness was tested in accordance with IAS 39, Financial Instruments: Recognition and Measurement. The fair value of these instruments was a liability of US$1.7 million and US$0.8 million and an asset of US$0 and US$6.4 million, as of December 31, 2012 and December 31, 2011, respectively.

— 90 —
Notes to the Consolidated Financial Statements
23. Income Taxes
(a) Taxation in the Consolidated Income Statements
Expressed in thousands of US DollarsDecember 31,
2012 2011
Current tax expense — Hong Kong Profi ts Tax: Current period (2,566) (923)
Current tax expense — Foreign: Current period (50,255) (44,203) Adjustment for prior periods (5,738) (844)
(55,993) (45,047)
Deferred tax (expense) benefi t: Origination and reversal of temporary differences (10,563) 8,733 Change in tax rate (222) 70 Change in unrecognized deferred tax assets (606) (9,115) Recognition of previously unrecognized tax losses 11,877 10,602
486 10,290
Total income tax expense (58,073) (35,680)
During the year ended December 31, 2012, based upon an evaluation of both positive and negative evidence, the Company concluded that US$47.2 million of previously unrecognized deferred tax assets should be recognized. As part of the Company’s analysis, it evaluated, among other factors, its recent history of generating taxable income and its near-term forecasts of future taxable income and determined that it is more likely than not that it will be able to realize an additional US$47.2 million of its deferred tax assets over the next several years. After considering these factors, the Company concluded that recognition of these deferred tax assets was appropriate. Of the US$47.2 million of previously unrecognized deferred tax assets, US$12.3 million was recognized through income tax expense on the income statement and US$34.9 million, which relates to deferred tax assets for pension plans, was recognized through other comprehensive income on the statement of comprehensive income.
The provision for Hong Kong Profi ts Tax for the years ended December 31, 2012 and December 31, 2011 is calculated at 16.5% of the estimated assessable profi ts for the year. Taxation for overseas subsidiaries is charged at the appropriate current rates of taxation in the relevant countries.

— 91 —
Notes to the Consolidated Financial Statements
(b) Reconciliation between tax expense and profi t before taxation at applicable tax rates
Expressed in thousands of US DollarsDecember 31,
2012 2011
Profi t for the year 166,627 103,618Total income tax expense (58,073) (35,680)
Profi t before income tax 224,700 139,298Income tax expense using the Company’s applicable tax rate (62,406) (38,112)Tax incentives 14,514 9,582Change in tax rates (222) 70Change in tax reserves 2,234 (977)Non-deductible differences (9,708) (623)Unrecognized benefi t — Global Offering costs — (6,099)Recognition of previously unrecognized tax losses 11,877 10,602Change in unrecognized tax assets (606) (9,115)Withholding taxes (4,708) (2,589)Other (3,310) 2,425Under provided in prior periods (5,738) (844)
(58,073) (35,680)
The provision for taxation for the years ended December 31, 2012 and December 31, 2011 is calculated using the Company’s applicable tax rate of 27.8% and 27.4%, respectively. The applicable rate is based on the Company’s weighted average worldwide tax rate.
(c) Income tax (expense) benefi t recognized in Other Comprehensive Income
Expressed in thousands of US Dollars2012 2011
Before tax
Income tax(expense)
benefi t Net of tax Before tax
Income tax(expense)
benefi t Net of tax
Recognition of previously unrecognized deferred tax on defi ned benefi t plans — 34,899 34,899 — — —Defi ned benefi t plan actuarial losses (26,829) 10,439 (16,390) (12,886) (207) (13,093)Cash fl ow hedges (6,267) 1,953 (4,314) 5,401 (1,379) 4,022Foreign currency translation differences for foreign operations 8,134 — 8,134 (15,357) — (15,357)
(24,962) 47,291 22,329 (22,842) (1,586) (24,428)

— 92 —
Notes to the Consolidated Financial Statements
(d) Deferred Tax Assets and Liabilities
Deferred tax assets and liabilities are attributable to the following:
Expressed in thousands of US DollarsDecember 31,
2012 2011
Deferred tax assets: Allowance for doubtful accounts 2,294 1,224 Inventory 5,969 1,342 Plant and equipment 3,267 1,273 Pension and post-retirement benefi ts 27,064 6,821 Tax losses 3,436 951 Reserves 18,229 5,192 Other 5,240 1,227 Set off of tax (10,197) (4,007)
Total gross deferred tax assets 55,302 14,023
Deferred tax liabilities: Plant and equipment (14,383) (15,024) Intangible assets (101,772) (103,640) Other (7,851) (5,650) Set off of tax 10,197 4,007
Total gross deferred tax liabilities (113,809) (120,307)
Net deferred tax asset (liability) (58,507) (106,284)

— 93 —
Notes to the Consolidated Financial Statements
Movement in temporary differences for the years ended December 31, 2012 and December 31, 2011:
Expressed in thousands of US Dollars
Balance
December 31,
2011
Recognized in
profi t or loss
Recognized
in other
comprehensive
income
Balance
December 31,
2012
Allowance for doubtful accounts 1,224 1,070 — 2,294
Inventory 1,342 4,627 — 5,969
Property, plant and equipment (13,752) 2,636 — (11,116)
Intangible assets (103,640) 1,868 — (101,772)
Pension and post-retirement benefi ts 6,821 (25,167) 45,338 26,992
Tax losses 951 2,485 — 3,436
Reserves 5,192 13,037 — 18,229
Other (4,422) (70) 1,953 (2,539)
Net deferred tax asset (liability) (106,284) 486 47,291 (58,507)
Expressed in thousands of US Dollars
Balance
December 31,
2010
Recognized in
profi t or loss
Recognized
in other
comprehensive
income
Balance
December 31,
2011
Allowance for doubtful accounts 1,650 (426) — 1,224Inventory 1,487 (145) — 1,342Property, plant and equipment (17,980) 4,228 — (13,752)Intangible assets (108,899) 5,259 — (103,640)Pension and post-retirement benefi ts 10,986 (2,579) (1,586) 6,821Tax losses 4,165 (3,214) — 951Reserves 8,544 (3,352) — 5,192Other (14,941) 10,519 — (4,422)
Net deferred tax asset (liability) (114,988) 10,290 (1,586) (106,284)

— 94 —
Notes to the Consolidated Financial Statements
Unrecognized Deferred Tax Assets
Deferred tax assets have not been recognized in respect of the following items:
Expressed in thousands of US DollarsDecember 31,
2012 2011
Deductible temporary differences 5,101 101,289Tax losses 53,046 78,780
Balance at end of year 58,147 180,069
The deductible temporary differences do not expire under current tax legislation. Deferred tax assets have not been recognized in respect of these items because it is not probable that future taxable profi t will be available against which the Company can utilize the benefi ts from them.
Available tax losses (recognized and unrecognized):
Expressed in thousands of US DollarsDecember 31,
2012 2011
United States — 16,997Europe 55,853 43,142Asia 1,875 3,946Latin America 7,452 16,738
Total 55,180 80,823
Tax losses expire in accordance with local country tax regulations. European losses will expire beginning in 2016. Asian losses will be available indefi nitely. Latin American losses will expire beginning in 2017.
Unrecognized Deferred Tax Liabilities
At December 31, 2012 and December 31, 2011 a deferred tax liability of US$6.1 million and US$4.3 million, respectively, related to investments in subsidiaries is not recognized because the Company controls whether the liability will be incurred and it is satisfi ed that it will not be incurred in the foreseeable future.

— 95 —
Notes to the Consolidated Financial Statements
24. Finance Income and Finance Costs
The following table presents a summary of fi nance income and fi nance costs recognized in the consolidated income statement and consolidated statement of comprehensive income:
Expressed in thousands of US DollarsYear ended December 31,
2012 2011
Recognized in income or loss: Interest income on bank deposits 1,187 1,247
Finance income 1,187 1,247
Interest expense on fi nancial liabilities 3,927 37,285 Change in fair value of put options 8,908 8,644 Net foreign exchange loss 3,356 2,164 Expenses related to the Global Offering (note 6) — 24,805 Stabilization Proceeds (note 6) — (3,474) Other fi nance costs 2,038 2,455
Finance costs 18,229 71,879
Net fi nance costs recognized in profi t or loss 17,042 70,632
Recognized in other comprehensive income: Foreign currency translation differences for foreign operations 8,134 (15,357) Changes in fair value of cash fl ow hedges (6,267) 5,401 Income tax on fi nance income and fi nance costs recognized in other comprehensive income 1,953 (1,586)
Net fi nance (income) costs recognized in other comprehensive income, net of tax 3,820 (11,542)
Attributable to: Equity holders of the Company 3,034 (9,277) Non-controlling interests 786 (2,265) Finance costs (income) recognized in other comprehensive income, net of tax 3,820 (11,542)
— 96 —
Notes to the Consolidated Financial Statements
25. Expenses
Profi t before income tax is arrived at after charging/(crediting) the following for the years ended December 31, 2012 and December 31, 2011:
Expressed in thousands of US DollarsYear ended December 31,
2012 2011
Depreciation of fi xed assets 31,770 30,158Amortization of intangible assets 8,491 8,333Auditors’ remuneration 3,471 7,751Research and Development 14,610 13,407Operating lease charges in respect of properties 83,245 74,035Impairment losses on trade receivables 1,861 806Impairment losses on trade receivables written back (298) (1,982)Provision for impairment losses on inventories made 10,043 6,577Provision for impairment losses on inventories written back (2,832) (321)
The fees in relation to the audit and related services for the year ended December 31, 2012 provided by KPMG, the external auditors of the Company, were as follows:
Expressed in thousands of US Dollars
Annual audit and interim review services 3,037Non-audit related services 434
Total 3,471
26. Related Party Transactions
(a) Transactions with Key Management Personnel
In addition to their cash compensation, the Company also provides non-cash benefi ts to Executive Directors and other key management personnel, and contributes to a post-employment defi ned benefi t plan on their behalf.

— 97 —
Notes to the Consolidated Financial Statements
Key management is comprised of the Company’s Directors and Senior Management. Key management personnel compensation comprised:
Expressed in thousands of US DollarsYear ended December 31,
2012 2011
Director’s fees 400 251Salaries, allowances and other benefi ts in kind 4,820 4,666Bonus (1) 2,271 2,299Share-based payments — 200Contributions to post-employment plans 150 152
7,641 7,568
(1) Bonus is based on the performance of the Company.
(b) Directors’ Remuneration
Directors’ remuneration disclosed pursuant to Section 161 of the Hong Kong Companies Ordinance is as follows:
Expressed in thousands of US DollarsYear ended December 31, 2012
Directors’fees
Salaries,allowancesand otherbenefi tsin kind Bonus (1)
Share-basedpayments
Contributions to post-
employmentplans Total
Executive Directors Timothy Parker — 954 159 — — 1,113 Kyle Gendreau — 483 277 — 28 788 Ramesh Tainwala — 960 688 — — 1,648
Non-Executive Directors Keith Hamill 100 — — — — 100 Nicholas Clarry — — — — — — Bruce Hardy McLain — — — — — —
Independent Non-Executive Directors Paul Etchells 100 — — — — 100 Miguel Ko 100 — — — — 100 Ying Yeh 100 — — — — 100
Total 400 2,397 1,124 — 28 3,949
(1) Bonus is based on the performance of the Company.

— 98 —
Notes to the Consolidated Financial Statements
Expressed in thousands of US DollarsYear ended December 31, 2011
Directors’fees
Salaries,allowancesand otherbenefi tsin kind Bonus (1)
Share-basedpayments
Contributions to post-
employmentplans Total
Executive Directors Timothy Parker — 1,094 154 200 — 1,448 Kyle Gendreau — 462 481 — 27 970 Ramesh Tainwala — 853 532 — — 1,385
Non-Executive Directors Keith Hamill 71 — — — — 71 Nicholas Clarry — — — — — — Bruce Hardy McLain — — — — — —
Independent Non-Executive Directors Paul Etchells 60 — — — — 60 Miguel Ko 60 — — — — 60 Ying Yeh 60 — — — — 60
Total 251 2,409 1,167 200 27 4,054
(1) Bonus is based on the performance of the Company.
No director received any emoluments from the Company as an inducement to join or upon joining the Company during the years ended December 31, 2012 and December 31, 2011. No director waived or agreed to waive any emoluments during the periods presented. No director received any compensation during the years ended December 31, 2012 or December 31, 2011 for the loss of offi ce as a director of Company or of any other offi ce in connection with the management of the affairs of the Company.
(c) Individuals with the Highest Emoluments
The fi ve highest paid individuals of the Company include three directors during the years ended December 31, 2012 and December 31, 2011, whose emoluments are disclosed above. Details of remuneration paid to the remaining highest paid individuals of the Company are as follows:
Expressed in thousands of US DollarsYear ended December 31,
2012 2011
Salaries, allowances and other benefi ts in kind 712 944Bonus (1) 819 672Contributions to post-employment plans 32 9
1,563 1,625
(1) Bonus is based on the performance of the Company.
The emoluments of each individual exceeded US$250 thousand for each of the years presented. No amounts have been paid to these individuals as compensation for loss of offi ce or as an inducement to join or upon joining the Company during the years ended December 31, 2012 and December 31, 2011.

— 99 —
Notes to the Consolidated Financial Statements
(d) Other Related Party Transactions
(i) On October 24, 2007, the Company entered into a monitoring agreement with CVC Capital Partners Advisory Company to provide ongoing consulting and management advisory services to the Company for an annual fee of US$150 thousand. The monitoring agreement was terminated on June 16, 2011.
(ii) The Company’s Indian subsidiary, Samsonite South Asia Pvt. Ltd., purchases raw materials and fi nished goods from, and sells certain raw materials and fi nished goods to, Abhishri Packaging Pvt. Ltd, which is managed and controlled by the family of Mr. Ramesh Tainwala, Executive Director and President, Asia-Pacifi c and Middle East of the Company (“Mr. Tainwala”).
Related amounts of purchases, sales, payables and receivables are the following:
Expressed in thousands of US DollarsYear ended December 31,
2012 2011
Purchases 4,005 4,867Sales 548 271
Expressed in thousands of US DollarsDecember 31,
2012 2011
Payables 483 543Receivables 145 67
(iii) Samsonite South Asia Pvt. Ltd. also sells fi nished goods to Bagzone Lifestyle Private Limited. Bagzone Lifestyle Private Limited is managed and controlled by the family of Mr. Tainwala. Mr. Tainwala and his family also own a non-controlling interest in Samsonite South Asia Pvt. Ltd. and the Company’s United Arab Emirates subsidiary.
Expressed in thousands of US DollarsYear ended December 31,
2012 2011
Purchases — 117Sales 10,636 7,347Rent 49 992
Expressed in thousands of US DollarsDecember 31,
2012 2011
Payables — —Receivables 6,895 4,131

— 100 —
Notes to the Consolidated Financial Statements
Approximately US$1.0 million and US$1.9 million was paid to entities owned by Mr. Tainwala and his family, for offi ce space rent for the years ended December 31, 2012 and December 31, 2011, respectively. As of December 31, 2012 and December 31, 2011, no amounts were payable to Mr. Tainwala and his family. As of December 31, 2012 and December 31, 2011, US$0.1 million and US$0.5 million, respectively, were recorded as a receivable in the form of a security deposit.
(iv) Samsonite South Asia Pvt. Ltd. sells fi nished goods to Planet Retail Holding Pvt. Ltd. (“Planet Retail”). Mr. Tainwala is the majority shareholder of Planet Retail. Sales to this entity amounted to US$0.1 million and US$0.1 million for the years ended December 31, 2012 and December 31, 2011, respectively. As of December 31, 2012 and December 31, 2011, US$7 thousand and $33 thousand, respectively, were receivable from Planet Retail.
(v) The Royal Bank of Scotland plc, which was the issuer of certain letters of credit under a letter of credit facility with the Company during 2011, also owned 15.8% of the ordinary shares of the Company as of December 31, 2011.
All outstanding balances with these related parties are priced at an arm’s length basis and are to be settled in cash within six months of the reporting date. None of the balances are secured.
27. Particulars of Company Entities
Ownership%
Company name Country 2012 2011
Samsonite International S.A. Luxembourg Parent ParentSamsonite Sub Holdings S.á.r.l. Luxembourg 100 100Delilah Europe Holdings S.á.r.l. Luxembourg — 100Delilah Europe Investments S.á.r.l. Luxembourg 100 100Delilah US Investments S.á.r.l. Luxembourg 100 100Astrum R.E. LLC United States 100 100Bypersonal S.A. de C.V. Mexico 100 100Direct Marketing Ventures, LLC United States 100 100Equipaje en Movimiento, S.A. de C.V. Mexico 100 —Global Licensing Company, LLC United States 100 100HL Operating LLC United States 100 —Jody Apparel II, LLC United States 100 100Lonberg Express S.A. Uruguay 100 100Limited Liability Company Samsonite Russian Federation 60 60McGregor II, LLC United States 100 100PT Samsonite Indonesia Indonesia 60 60Samsonite (Malaysia) Sdn Bhd Malaysia 100 100Samsonite (Thailand) Co., Ltd. Thailand 60 60Samsonite A/S Denmark 100 100Samsonite AB Sweden 100 100Samsonite AG Switzerland 99 99Samsonite Argentina S.A. Argentina 95 95Samsonite Asia Limited Hong Kong 100 100Samsonite Australia Pty Limited Australia 70 70Samsonite Brasil Ltda. Brazil 100 100Samsonite B.V. Netherlands 100 100

— 101 —
Notes to the Consolidated Financial Statements
Ownership%
Company name Country 2012 2011
Samsonite Canada, Inc. Canada 100 100Samsonite CES Holding B.V. Netherlands 60 60Samsonite Chile S.A. Chile 85 85Samsonite China Holdings Limited Hong Kong 100 100Samsonite Colombia S.A.S. Colombia 100 —Samsonite Company Stores, LLC United States 100 100Samsonite Espana S.A. Spain 100 100Samsonite Europe N.V. Belgium 100 100Samsonite Finanziaria S.r.l. Italy 100 100Samsonite Finland Oy Finland 100 100Samsonite Ges.m.b.H. Austria 100 100Samsonite GmbH Germany 100 100Samsonite International Trading (Ningbo) Co. Ltd. China 100 100Samsonite IP Holdings S.á.r.l. Luxembourg 100 100Samsonite Japan Co., Ltd. Japan 100 100Samsonite Korea Limited Korea, Republic 100 100Samsonite Latinoamerica, S.A. de C.V. Mexico 100 100Samsonite Limited United Kingdom 100 100Samsonite LLC United States 100 100Samsonite Macau Limitada Macau 100 100Samsonite Mauritius Limited Mauritius 100 100Samsonite Mercosur Limited Bahamas 100 100Samsonite Mexico, S.A. de C.V. Mexico 100 100Samsonite Middle East FZCO United Arab Emirates 60 60Samsonite Norway AS Norway 100 100Samsonite Pacifi c LLC United States 100 100Samsonite Philippines, Inc. Philippines 60 60Samsonite S.A.S. France 100 100Samsonite S.p.A. Italy 100 100Samsonite Seyahat Ürünleri Sanayi ve Ticaret Anonim Sirketi Turkey 60 60Samsonite Singapore Pte Ltd Singapore 100 100Samsonite South Asia Private Limited India 60 60Samsonite Southern Africa Ltd. South Africa 60 60Samsonite Sp. z o.o. Poland 100 100Samsonite-Hungaria Borond KFT Hungary 100 100SC Chile Uno S.A. Chile 100 100SC Inversiones Chile Limitada Chile 100 100

— 102 —
Notes to the Consolidated Financial Statements
28. Subsequent Events
The Company has evaluated events occurring subsequent to December 31, 2012, the statement of fi nancial position date, through March 18, 2013, the date this fi nancial information was authorized for issue by the Board of Directors.
On January 8, 2013, the Company granted 15,532,227 options to certain directors, key management personnel, and other employees. The exercise price of the options granted is HK$17.36. Such options are subject to graded vesting over a 4 year period, with 25% of the options vesting on each of the fi rst four anniversary dates of the grant.