san francisco bay wetlands atlas article2016
TRANSCRIPT

San Francisco Bay Estuary (USA)
Beth Huning and Mike Perlmutter
ContentsIntroduction . . . . . . . . . . . . . . . . . . . . . . . . . . . . . . . . . . . . . . . . . . . . . . . . . . . . . . . . . . . . . . . . . . . . . . . . . . . . . . . . . . . . . . . 2Description . . . . . . . . . . . . . . . . . . . . . . . . . . . . . . . . . . . . . . . . . . . . . . . . . . . . . . . . . . . . . . . . . . . . . . . . . . . . . . . . . . . . . . . . 2Biodiversity . . . . . . . . . . . . . . . . . . . . . . . . . . . . . . . . . . . . . . . . . . . . . . . . . . . . . . . . . . . . . . . . . . . . . . . . . . . . . . . . . . . . . . . 5Ecosystem Services . . . . . . . . . . . . . . . . . . . . . . . . . . . . . . . . . . . . . . . . . . . . . . . . . . . . . . . . . . . . . . . . . . . . . . . . . . . . . . . 8Conservation Status . . . . . . . . . . . . . . . . . . . . . . . . . . . . . . . . . . . . . . . . . . . . . . . . . . . . . . . . . . . . . . . . . . . . . . . . . . . . . . . 9Threats and Future Challenges . . . . . . . . . . . . . . . . . . . . . . . . . . . . . . . . . . . . . . . . . . . . . . . . . . . . . . . . . . . . . . . . . . . 11Cross-References . . . . . . . . . . . . . . . . . . . . . . . . . . . . . . . . . . . . . . . . . . . . . . . . . . . . . . . . . . . . . . . . . . . . . . . . . . . . . . . . . 12References . . . . . . . . . . . . . . . . . . . . . . . . . . . . . . . . . . . . . . . . . . . . . . . . . . . . . . . . . . . . . . . . . . . . . . . . . . . . . . . . . . . . . . . . 12
AbstractThe San Francisco Bay Estuary (SFBE) is the second largest estuary in the UnitedStates, encompassing approximately 4145 km2 (1600 mi2) and draining about40 % (155,400 km2; 60,000 mi2) of the State of California through the Sacra-mento and San Joaquin Rivers, which pass through the San Francisco Bay-Deltato the Pacific Ocean (Fig. 1). The SFBE has perhaps suffered the most extensivedegradation of any estuary in the United States. Many years of diking, draining,filling, pollution, and introduction of alien species have taken a great toll on theecosystem. Although 80 % of the tidal salt marshes have been lost, many of theremaining marshes are now protected, and there are large-scale restoration effortsunder way to return salt evaporation ponds, agricultural areas, and some urbanareas back to tidal wetlands. The SFBE was designated as a Wetland of Interna-tional Importance under the Ramsar Convention on Wetlands in 2013.
B. Huning (*)San Francisco Bay Joint Venture, Fairfax, CA, USAe-mail: [email protected]
M. Perlmutter (*)Environmental Services Division, City of Oakland Public Works Department, Oakland, CA, USAe-mail: [email protected]
# Springer Science+Business Media Dordrecht 2016C.M. Finlayson et al. (eds.), The Wetland Book,DOI 10.1007/978-94-007-6173-5_214-1
1

KeywordsRidgeway’s rail • Estuary • Shorebird • Tidal wetlands • Salt marsh • California •Ramsar • Salt marsh harvest mouse • Waterfowl
Introduction
The San Francisco Bay Estuary (SFBE) is the second largest estuary in the UnitedStates, encompassing approximately 4145 km2 (1600 mi2) and draining about 40 %(155,400 km2; 60,000 mi2) of the State of California through the Sacramento andSan Joaquin Rivers, which pass through the San Francisco Bay-Delta to the PacificOcean (Fig. 1). The SFBE has perhaps suffered the most extensive degradation ofany estuary in the United States. Many years of diking, draining, filling, pollution,and introduction of alien species have taken a great toll on the ecosystem. Although80 % of the tidal salt marshes have been lost, many of the remaining marshes arenow protected, and there are large-scale restoration efforts under way to return saltevaporation ponds, agricultural areas, and some urban areas back to tidal wetlands.The SFBE was designated as a Wetland of International Importance under theRamsar Convention on Wetlands in 2013.
SFBE was historically rimmed with tidal salt marshes, particularly in its northernand southern reaches. Despite losing one third of its size and approximately 85 % ofits wetlands to development, agricultural and salt flat conversion, and fill, SFBEremains critically ecologically important, accounting for 77 % of California’sremaining perennial estuarine wetlands (Sutula et al. 2008). SFBE is widely recog-nized as one of North America’s most ecologically important estuaries, providingkey habitat for a broad suite of flora and fauna, and a range of ecological servicessuch as flood protection, water quality maintenance, nutrient filtration and cycling,and carbon sequestration. SFBE is home to many plant species and over 1,000species of animals (USEPA 1999), including endemic and conservation statusspecies, i.e., federally and state listed threatened or endangered species as well asthose identified by International Union for Conservation of Nature (IUCN) or UnitedStates Fish and Wildlife Service (USFWS) as Birds of Conservation Concern.
Description
San Francisco Bay Estuary is approximately 10,000 years old and is a product oftoday’s high sea level, which presently floods the ancient river drainage fromCalifornia’s Central Valley out to the Pacific Ocean through the Golden Gate(Sloan 2006). The general climate for SFBE and the surrounding region is catego-rized as Mediterranean featuring temperate wet winters and warm, dry summers(National Park Service 2009). Average annual rainfall in the region is 38–61 cm(15–24 in), which generally falls between November and April (Western RegionalClimate Center 2009). Salinity is approximately 30 ppt near the mouth of the Golden
2 B. Huning and M. Perlmutter

Gate, whereas upstream sources in the delta are nearly fresh at 1 ppt (NOAA 2007).About 90 % of the freshwater entering the Bay comes from the Sacramento/SanJoaquin watershed, with the remaining 10 % originating from local streams andcreeks and from wastewater treatment facilities. Seasonal and year-to-year
Fig. 1 The San Francisco Bay Estuary (Photo credit: San Francisco Estuary Institute/AquaticScience Center #)
San Francisco Bay Estuary (USA) 3

variability in freshwater inflow to the Bay have been reduced (San Francisco EstuaryPartnership 2011) and is about 60 % less than historic flows due to diversions ofmunicipal water (responsible for about 9 % of flow reductions) and for CentralValley agricultural uses (responsible for about 51 % of flow reductions) (Sloan2006).
SFBE water temperature variation generally follows the Pacific Ocean’s,which has a cool season of upwelling from April–July, a warmer season fromAugust–November, and a cold storm season from December–March. The Bay’stemperature swings, however, are greater than the ocean’s due to the Bay’sshallower water and river flow inputs, making the Bay generally colder than theocean during the winter, and warmer than the ocean the rest of the year (NOAA2007).
The average depth of SFBE is 5.5 m (18 ft). With few exceptions, the waters arenaturally deep only in parts of the Central Bay between San Francisco, MarinCounty, and Angel Island and in channels through Carquinez Strait (about 27.4 m;90 ft), Raccoon Strait (18.3 m; 60 ft), and the Golden Gate (much of which isbetween 30.5 and 61 m; 100–200 ft) (Sloan 2006). The SFBE is at its deepest at theouter mouth of the Golden Gate, where it plunges to 107 m (350 ft) (Cohen 2000).Dredged channels provide shipping access to ports in Oakland, Richmond, andRedwood City.
Water depth changes twice daily with the tides. SFBE’s tides are of unequalheight. Average difference between high and low tide heights is about 1.2 m (4 ft) inthe Central Bay, 1.5 m (5 ft) in northern San Pablo Bay, and about 2.1 m (7 ft) in theSouth Bay. These tides transport 1603.5 Mm3 of water, about 25 % of the Bay’swater volume every day (Cohen 2000).
The SFBE’s floor is covered with sand, silt, or clay, along with significantquantities of oyster shell fragments. In the North Bay, channels are mostly sand,with shell fragments occurring in the southeastern and southwestern shallows of theSouth Bay. A few areas of bedrock rim the western part of the Central Bay and cropout at islands and a few shoreline locations. Artificial hard substrate is scatteredacross the Bay, including rip-rapped banks, jetties, breakwaters, seawalls, pilings,docks and piers, bridge and power line supports, and debris (NOAA 2007).
Sediment in the SFBE primarily derives from upstream watershed erosion andsubsequent transport and deposition into the Bay through freshwater tributaries. Thefirst large storm of the year carries large sediment plumes into the Bay, followed bysmaller amounts of sediment during subsequent storms. Most suspended sediment isfrom the Sacramento and San Joaquin rivers, but sediment also comes from the YoloBypass, Mokelumne River, Calaveras River, Cosumnes River, and several othersmaller streams. Hydraulic mining in the Sierra Nevada in the mid-late 1800sresulted in hundreds of millions of cubic meters of sediment deposition into theSFBE. Current deposition rates are much lower as hydraulic mining deposition hastapered off and additional sediment sources have been reduced (by stream flowrestrictions) and trapped behind dams (NOAA 2007).
4 B. Huning and M. Perlmutter

Biodiversity
Historically, wetlands accounted for 5 % of California’s land area, but approximately91 % have been lost, reducing their relative land cover to less than 0.5 %. Californiaretains approximately 18,000 ha (44,456 acres) of perennial estuarine wetlandhabitat, with 77 % in the SFBE (California Resources Agency 2008). The predom-inant native habitats in SFBE are primarily open water of varying depths based ontidal conditions and location, tidally influenced mudflats, submerged eelgrass beds,vegetated marshes, sand and salt flats, and sandy and cobble beaches. There are alsoseveral rock islands within SFBE providing nesting habitat for colonial water birds.
Many parts of the SFBE have been altered by human activities but still providehabitat for many species. They include diked marshes, agricultural baylands (grazedand farmed), and salt ponds. Upland habitats exist adjacent to and within the SFBEin the form of transitional habitats adjacent to tidal marshes and in the form ofislands. Some of the islands are manmade (fill) and some are natural and still containnative upland plant communities consisting of grasslands, shrub lands, and wood-lands. Pickleweed (Sarcocornia pacifica) and cord grass (Spartina foliosa) predom-inate the marshes in more saline waters and bulrush (Scirpus spp.) predominates inmore freshwater marshes.
Submerged aquatic plant communities of the shallow subtidal habitats and tidalflats of SFBE are important food sources for estuarine fish, invertebrates, and birds.Submerged plants such as eelgrass (Zostera marina) and certain macroalgae alsoprovide important cover, spawning, and rearing grounds for invertebrates andestuarine fish, such as migrating salmon and Pacific herring Clupea pallasii (Olofson2000). Eelgrass, surfgrass (Psyllospadix scouleri) and (P. torreyi), widgeon grass(Ruppia maritima), and sago pondweed (Potamegeton pectinatus) provide importantnursery and foraging habitats, dampen wave energy, and aid in sediment capture(NOAA 2007).
The predominant animal communities are those associated with open water, tidalflats, and tidal marshes, as well as managed ponds. Open water provides habitat forwintering diving and sea ducks, and migratory corridors for anadromous fish toreach freshwater spawning areas. The Bay’s subtidal habitats are also important forapproximately 500 species (USEPA 1999) of aquatic invertebrates, while tidal flatssupport thousands of migratory and overwintering shorebirds and waterfowl. Tidalmarshes also provide habitat for a diverse assemblage of migratory shorebirds andwaterfowl, various fish species, and tidal marsh specialists such as the Ridgway’s rail(Rallus obsoletus) (formerly California clapper rail) and salt marsh harvest mouse(Reithrodontomys raviventris).
SFBE is noted for hosting more wintering and migrating shorebirds than anyother estuary along the US Pacific Coast south of Alaska (Stenzel et al. 2002). Forthis, SFBE is recognized as a Site of Hemispheric Importance by the WesternHemispheric Shorebird Reserve Network (WHSRN). Bay-wide surveys of winteringshorebirds conducted in November from 2006 through 2008 averaged over 340,000shorebirds, including 29 species (Wood et al. 2010). During the height of spring andfall migration, 589,000–932,000 and 340,000–396,000 shorebirds respectively were
San Francisco Bay Estuary (USA) 5

counted during surveys conducted between 1988 and 1993 (Stenzel et al. 2002).Compared to the major wetlands along the Pacific Coast, SFBE held an average of55.7 % (37.8–90.1 %) of the total number of individuals of 13 key shorebird species.In particular, a significant portion of arctic-breeding dunlin (Calidris alpina) andwestern sandpipers (C. mauri) winter in SFBE.
SFBE is also recognized as one of 67 areas of continental significance forwaterfowl by the North American Waterfowl Conservation Plan (NAWMP 2004).SFBE is the winter home for 50% of the diving ducks in the Pacific Flyway (Olofson2000). The US Fish & Wildlife Service midwinter waterfowl counts from 1988 to2006 document SFBE as containing 49 % of the scaup (Aythya sp.) population and43 % percent of the scoters (Melanitta sp.) of the lower Pacific Flyway, fromWashington State to southern California. About 99 % of SFBE’s scoters are surfscoters Melanitta perspicillata. Midwinter SFBE waterfowl surveys from 1992 to2007 averaged 182,818 birds in mid-January (Susan Wainwright-De La Cruz,27 May 2009, United States Geological Survey, personal communication). Addi-tionally, from 2006 to 2009, Suisun Marsh in the eastern portion of the estuaryaveraged 99,649 birds. Within the larger totals of birds, there are hotspots where over20,000 water birds regularly congregate. San Pablo Bay hosts at least 20,000 ducksin early winter until mid-January. In the East Bay, San Leandro Bay is criticallyimportant for scoters all winter but becomes increasingly more important over winteras the majority of the SFBE population moves there before migration.
The extent and diversity of SFBE fish habitats (varying salinities, substrates,water depth, etc.) make it important to over 130 species of resident and migratorymarine, estuarine, and anadromous fish species (SFBCDC 2009) through manylifecycle stages. Marine species tend to use the Bay as spawning and nursery habitat,while estuarine species reside in the Bay throughout their life cycle. For anadromouschinook salmon (Onchorhynchus tshawytscha), steelhead (Onchorhynchus mykiss),and white sturgeon (Acipenser transmontanus), the SFBE is a critical migratorypathway between foraging areas in the Pacific Ocean and spawning groundsupstream in the SFBE’s tributary rivers (The Bay Institute 2003). SFBE is identifiedas Essential Fish Habitat for various fish species life stages managed under threeFisheries Management Plans of the National Marine Fisheries Service. Additionally,SFBE is designated as Habitat Areas of Particular Concern for various fish specieswithin the Pacific Groundfish Fisheries Management Plan (NOAA 2008). SFBEsupports spawning Pacific herring, which is not only a major fishery, but a source ofroe forage for diving waterfowl in the Central Bay.
Eight animal species are endemic to SFBE and its associated wetlands, which alsoprovide habitat for a number of near-endemic or range-limited species, subspecies,and races of flora and fauna. The Bay supports three endemic fish taxa: the federallyendangered delta smelt (Hypomesus transpacificus), San Francisco topsmelt(Atherinops affinis affinis), and tule perch (Hysterocarpus traskii traskii), in additionto four local races of chinook salmon. The federally endangered delta smelt occursonly in the San Francisco Bay-Delta Estuary. The species spends much of itslifecycle in the Sacramento and San Joaquin rivers and deltas, which feed intoSFBE. Juvenile and adult smelt also may spend time adjoining northern SFBE,
6 B. Huning and M. Perlmutter

where they have been observed in Suisun and San Pablo bays and the Napa River(Olofson 2000). Although exact population estimates are unknown (Moyle 2002),relative population levels have been monitored for several decades by federal andstate water export facilities (Bennett 2005). Counts from 2002 to 2007 showed lowabundance (Armor et al. 2005).
Longfin smelt are widely but patchily distributed along North America’s PacificCoast but historically occupied only three estuaries and the lower reaches of theirlarger tributary rivers in California: San Francisco Bay-Delta Estuary, HumboldtBay, and Klamath River Estuary. Presently, the largest and southernmost self-sustaining longfin smelt population is in the SFBE-Delta Estuary. The HumboldtBay and Klamath River populations are thought to be extinct, and the small numbersof fish recently reported in the Russian River do not likely represent a self-sustainingpopulation.
There are three recognized subspecies of tule perch, one of which occurs from theSacramento-San Joaquin River drainage through SFBE. The range of this subspecieshas contracted from its historic distribution, which formerly extended beyond theBay to the Pajaro and Salinas rivers (Olofson 2000).
Sacramento-San Joaquin chinook salmon are grouped within four distinct races,based on the timing of adult spawning migration: winter, spring, fall, and late fall.Three of these races are presently of conservation concern and have the followingstatus: winter run (federally and state endangered), spring run (California Class1 qualified as threatened or endangered), and late-fall run (California listed Class2 special concern) (Olofson 2000).
The tidal wetlands support the endemic salt marsh harvest mouse populations andthe majority of the Ridgway’s rail populations, both federally listed endangeredspecies. The best mouse population estimate comes from the Salt Marsh Harvest
Fig. 2 The Ridgeway’s rail, see here in pickleweed and cord grass, is the endemic rail of SanFrancisco Bay (Photo credit: B. Huning #)
San Francisco Bay Estuary (USA) 7

Mouse and California Clapper Rail Recovery Plan published by the US Fish andWildlife Service in 1984: “a few thousand individuals at the peak of their numberseach summer, distributed around the Bay marshes in small, disjunct populations,often in marginal vegetation and almost always in marshes without an upper edge ofupland vegetation” (USFWS 1984). Ridgway’s rail (Fig. 2) are now almost entirelyrestricted to the marshes of the SFBE, where the only known breeding populationsoccur. When first listed, the population was considered to be 4,200–6,000 individ-uals, but today’s estimates appear to be about 1,200 individual birds (US Fish andWildlife Service 2013).
Numbers of scaup, scoters, and canvasback (Aythya valisineria) vary by year andseason, but SFBE hosts 44 % of the Pacific Flyway diving duck population duringwinter months.
Ecosystem Services
SFBE wetlands provide many ecological services such as flood control, aquiferrecharge, regional climate mediation, and water quality maintenance (Save the Bay2007). Tidal marshes produce organic nutrients, sequester carbon, reduce shorelineerosion, and provide a nursery for some fish species. The importance of the SFBE toresident and migratory species has been well documented above.
SFBE provides for a host of social and economic values through ports andindustry, agriculture, fisheries, archaeological and cultural sites, recreation, andresearch. Open water areas of the estuary are used as shipping and ferry channelsand approximately 5.35 Mm3 (seven million cubic yards) of sediment are dredgedannually to maintain shipping channels and marinas; some of the sediment is beingreused to bring wetland areas back up to marsh plain elevation (the elevation withinthe tidal prism at which marsh vegetation can become established) during therestoration process. The industrial port of Oakland is one of the world’s largestports, ranking among the top four in the United States and 20th in the world in termsof annual container traffic (Port of Oakland 2009). Other water-related industriessuch as refineries, factories, and dredged material rehandling plants utilize the SFBE.In addition to water-related industries, about 1780 ha (4,400 acres) of diked baylandsin the South Bay continue to be used for salt production by Cargill Salt. Saltproduction in the SFBE historically occurred on nearly 16,600 ha (over 41,000acres), but since the 1960s about 90 % of these lands have been publicly acquired forconservation and restoration (SFB CDC 2008), part of the largest wetland restorationon the west coast of the United States (South Bay Salt Pont Restoration 2009). Thesesalt ponds, both in converted and restored conditions, provide important habitatfunction for a wide suite of species and the restoration aims to balance the habitatneeds of each species, while simultaneously providing for public access and floodprotection.
Agriculture on diked baylands continues today, especially in northern San PabloBay where farming includes: oat hay (sometimes double-cropped with beans), dairy,
8 B. Huning and M. Perlmutter

row crops, vineyards, orchards, livestock, and irrigated pastureland (North BayWater Reuse Authority 2009).
SFBE fisheries have suffered dramatic declines in the last few years. A reducednumber of commercial fishing boats continue to operate in the Bay as do sportfisheries (Rogers 2009). In 2009, the Bay’s last commercial fishery, herring, was shutdown for the season to allow the species to recover.
Many important cultural and archaeological sites documented in the Bay includeover 425 Native American shellmounds mapped by Nelson (1909). More modernhistoric sites include: the immigration and detention center at Angel Island, theWorld War II era naval shipyard at Rosie the Riveter/WW II Home Front NationalHistoric Park, Alcatraz Island lighthouse and penitentiary, and the Presidio of SanFrancisco, in what is now the Golden Gate National Recreation Area. SFBE alsohosts a large body of scientific research and numerous universities.
Waterfront parks and trails, such as the San Francisco Bay Trail, provide oppor-tunity for recreation and nature appreciation, such as bird watching, along theshoreline. A variety of public and private access points and facilities are locatedthroughout the Bay for water entry and shoreline access. These opportunities haveexpanded greatly in recent decades as public planning and policy has prioritizedpublic access.
The SFBE Area is a renowned international tourist destination. Attractions suchas the Golden Gate Bridge, acclaimed as one of the world’s most beautiful bridges,attract an estimated nine million tourists annually. Alcatraz Island attracts more than1.3 million visitors annually. The SFBE is a popular destination for water-orientedrecreation such as boating and open water swimming. In 2013, San Francisco wasthe host city for the America’s Cup international yacht race. Other destinations in andaround the SFBE, including the city of San Francisco; Napa and Sonoma countyvineyards; and national, state, and local parks; events; and festivals draw many moretourists.
Conservation Status
In addition to Ramsar and WHSRN designations, the importance of SFBE and itswetlands has been recognized by the National Audubon Society, which has desig-nated portions of the Bay’s habitats as nine distinct Important Bird Areas for the vastnumbers of shorebirds, waterfowl, and endangered, threatened, and sensitive birdspecies populations (see: http://web4.audubon.org/bird/iba/ibaadopt.html).
The SFBE is now a major center for a vibrant habitat restoration movement. Overthe past two decades, significant progress has been made to protect and enhanceremaining habitats and restore as much as possible of what has been lost. A uniquepartnership of landowners, conservation organizations, state and federal agencies,and businesses has been formed to plan and guide the restoration. Members of thispartnership, the San Francisco Bay Joint Venture (SFBJV), have established goals toprotect 25,495 ha (63,000 acres), restore 14,973 ha (37,000 acres), and enhanceanother 14,164 ha (35,000 acres) of bay habitats that include tidal flats, marshes, and
San Francisco Bay Estuary (USA) 9
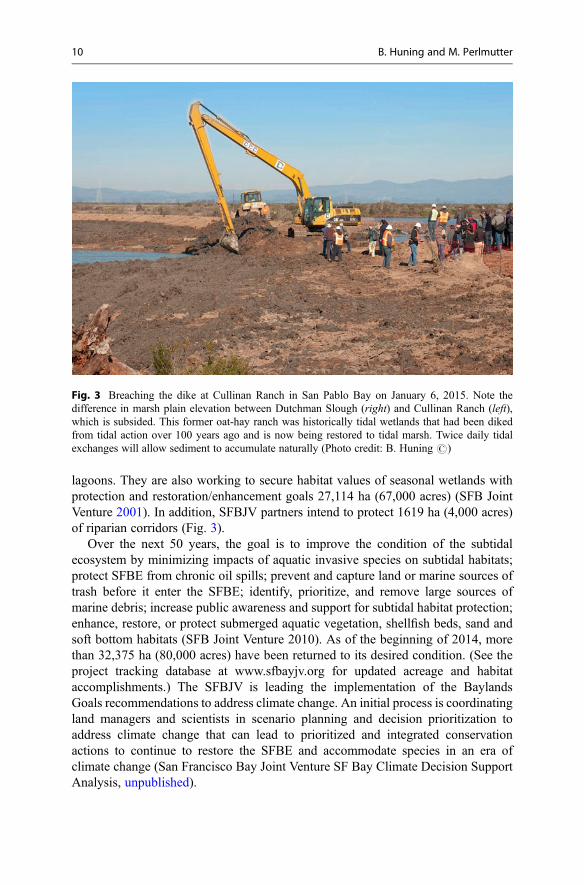
lagoons. They are also working to secure habitat values of seasonal wetlands withprotection and restoration/enhancement goals 27,114 ha (67,000 acres) (SFB JointVenture 2001). In addition, SFBJV partners intend to protect 1619 ha (4,000 acres)of riparian corridors (Fig. 3).
Over the next 50 years, the goal is to improve the condition of the subtidalecosystem by minimizing impacts of aquatic invasive species on subtidal habitats;protect SFBE from chronic oil spills; prevent and capture land or marine sources oftrash before it enter the SFBE; identify, prioritize, and remove large sources ofmarine debris; increase public awareness and support for subtidal habitat protection;enhance, restore, or protect submerged aquatic vegetation, shellfish beds, sand andsoft bottom habitats (SFB Joint Venture 2010). As of the beginning of 2014, morethan 32,375 ha (80,000 acres) have been returned to its desired condition. (See theproject tracking database at www.sfbayjv.org for updated acreage and habitataccomplishments.) The SFBJV is leading the implementation of the BaylandsGoals recommendations to address climate change. An initial process is coordinatingland managers and scientists in scenario planning and decision prioritization toaddress climate change that can lead to prioritized and integrated conservationactions to continue to restore the SFBE and accommodate species in an era ofclimate change (San Francisco Bay Joint Venture SF Bay Climate Decision SupportAnalysis, unpublished).
Fig. 3 Breaching the dike at Cullinan Ranch in San Pablo Bay on January 6, 2015. Note thedifference in marsh plain elevation between Dutchman Slough (right) and Cullinan Ranch (left),which is subsided. This former oat-hay ranch was historically tidal wetlands that had been dikedfrom tidal action over 100 years ago and is now being restored to tidal marsh. Twice daily tidalexchanges will allow sediment to accumulate naturally (Photo credit: B. Huning #)
10 B. Huning and M. Perlmutter

Threats and Future Challenges
Approximately seven million people (estimated at 7,150,739 by 2010 census) live inthe nine counties surrounding SFBE. San Francisco is the original urban center of theregion with an estimated population of 805,235 (SFB Area Census 2010), althoughSan Jose is the largest city (945,942). Land use in the SFBE region in modern timeshas been increasing urban development and industry, agriculture (farming andgrazing), and salt extraction. Specifically, nearly 50 % of the estuary’s watershedhas been converted to agriculture; about 4 % has been urbanized, and 10 % is nowindustrial sites. Large areas of former marshlands were filled during urbanization anddiked for agriculture or converted to salt evaporation ponds, thus dramaticallyreducing the overall acreage of tidal wetlands in the watershed today (Olofson2000). Salt ponds provide habitat for shorebirds, and as habitats are being convertedin an effort to restore the SFBE, some managed ponds are being maintained andsalinity levels managed for shorebird habitat.
The habitats of SFBE face a variety of human disturbances, which can pose directdegradation impacts to habitat as well as to flora and fauna. Human access throughwetlands can trample habitats and facilitate access by predators. Trail use nearwetland habitats, as well as nearby boat or aircraft use, may cause animals toflush, exposing them to predators and impinging on rest and feeding behaviors.
Climate change represents a suite of challenges to SFBE such as altered speciesviabilities and phenologies, sea level rise, shifts in salinity content and fresh waterflows, notable rises in temperature, and an increase in the severity of storms. Climatechange is expected to result in sea level rise in SFBE of nearly 40 cm by mid-centuryand 1.4 m by the end of the century.
By mid-century, nearly 73,000 ha (180,000 acres) of SFBE shoreline will bevulnerable to flooding, and 86,200 ha (213,000 acres) will be vulnerable by the endof the century. Vulnerability within today’s 100-year floodplain (the area with a onein 100 year flood probability) will increase from a one percent chance of flooding peryear to a 100 % chance of flooding per year by mid-century (SFB CDC 2009).Higher seas as well as more frequent and intense storm events threaten to increaseshoreline damage, erosion, and inundation. Depending upon sediment availabilityand the rate of sea level rise, modeling has indicated that tidal marshes may be able toaccrete and keep pace with higher waters, if large-scale restoration projects arecompleted and adjacent uplands protected. In the urbanized areas where the SFBEedges are developed, there is little opportunity for marsh transgression.
Freshwater runoff from mountain snowmelt is projected to flow earlier and moreintensely in the year as warmer temperatures speed snowmelt. Resulting increasedwinter freshwater inputs and decreased spring and summer freshwater inflows willdecrease salinities in the wet season and, by a larger degree, increase salinity levelsin the dry season. Sea level rise could further drive saltwater gradients upstream inthe SFBE compounding the salinity changes. These shifts in the quantity, timing, andquality of freshwater flowing into the Bay and the resulting habitat changes couldcause declines of fish species and populations. The reduced freshwater inflow and
San Francisco Bay Estuary (USA) 11

resulting increase in salinity causes more salt-tolerant species to move upstreamwhile freshwater species retreat.
Some bird species behavior, distribution, and population dynamics are suscepti-ble to climate change (Berthold et al. 2004). Sedentary taxa of SFBE such as songsparrows (Melospiza melodia), common yellowthroats (Geothlypis trichas), andRidgway’s rail endemic to San Francisco tidal marshes may face additional declinesif more tidal marsh habitat is impaired or lost through factors such as climate changeinduced sea level rise, storm damage, or associated increased invasive speciespressures. Recent efforts by conservation groups and government agencies toincrease acreage of tidal marsh habitat and improve tidal actions through leveesmight help to alleviate pressures arising from sea level rise and storm damage.
In early 2015 a science update to the Baylands Ecosystem Habitat Goals forClimate Change was released (http://baylandsgoals.org/science-update-2015/). Theprimary recommendations include the following: (1) Restore complete Baylandssystems; (2) accelerate restoration of complete systems by 2030; (3) plan ahead forthe dynamic future; (4) incerase regional coordination; (5) engage the citizenry inadvocacy for baylands.
Dealing with the conservation challenges in SFBE is challenging and not simple.In spite of the prevalence of invasive species, projected climate change and sea levelrise, human populations competing with the needs of wildlife, the investments inhabitat protection and restoration efforts are sustaining wildlife populations andproviding valuable economic services. Indicators point to the need to continue andaccelerate restoration, as research and modeling have shown that the SFBE has thepotential to recover endangered species and support migratory and wintering birds aswell as provide for the continued economic needs of a large urban population (PRBOConservation Science and San Francisco Bay Joint Venture 2011).
Cross-References
▶Estuaries▶Estuaries of Great Britain▶ Intertidal Flats of East and Southeast Asia▶La Plata River/Río de la Plata Estuary▶The Bay of Fundy and Its Wetlands▶The Danish Wadden Sea▶The Macrotidal Bay of Mont-Saint-Michel, France: The Function of Salt Marshes▶The Wash and the North Norfolk Coast, UK
References
Armor C, Baxter R, Bennett B, Breuer R, Chotkowski M, Coulston P, Denton D, Herbold B,Larsen K, Nobriga M, Rose K, Sommer T, Stacey M. 2005. Interagency ecological program
12 B. Huning and M. Perlmutter

synthesis of 2005 work to evaluate the pelagic organism decline (POD) in the upper SanFrancisco Estuary. 2005.
Bennett WA. Critical assessment of the delta smelt population in the San Francisco Estuary,California. San Franc Estuar Watershed Sci. 2005;3:1–71.
Berthold P, Møller AP, Fiedler W. Preface. In: Møller A, Berthold P, Fiedler, editors. Birds andclimate change, Advances in ecological research, vol. 35. Amsterdam: Elsevier/AcademicPress; 2004. p. vii.
California State Coastal Conservancy and Ocean Protection Council, et al. San Francisco BaySubtidal Habitat Goals Project 2010.
Cohen A. An introduction to the San Francisco Bay, save the Bay, San Francisco Estuary project,San Francisco Estuary Institute. 2000. p 4.
Moyle PB. Inland fishes of California. Revised and expanded. Berkeley: University of CaliforniaPress; 2002. p. 230.
National Oceanic and Atmospheric Administration. Letter from the national oceanic and atmo-spheric administration to the United States fish & wildlife service regarding the South Bay saltpond restoration project. 2008. http://www.southbayrestoration.org/pdf_files/Comment%20Letters/NOAA_FEIS_SBSP0001.pdf. Last accessed 21 Jan 2015.
National Oceanic and Atmospheric Administration. Report on the subtidal habitats and associatedbiological taxa in San Francisco Bay. 2007. p. 13.
National Park Service. A climate of contrasts. 2009. http://www.nps.gov/prsf/naturescience/climate.htm. Last accessed 21 Jan 2015.
Nelson N. Shellmounds of the San Francisco Bay region. Berkeley: University Press; 1909.North American Waterfowl Management Plan. United States fish & wildlife service, Canadian
wildlife service, Secretaria de Medio Ambiente y Recursos Naturales. 2004. p 15.North Bay Water Reuse Authority. North San Pablo Bay restoration and reuse project engineering
and economic/financial analysis report. 2009. http://www.nbwra.org/docs/pdfs/NBWRP_Draft_Phase3_section3_part1of2.pdf. Last accessed 21 Jan 2015.
Olofson PR. Baylands ecosystem habitat goals project. Baylands ecosystem species and communityprofiles: life histories and environmental requirements of key plants, fish, and wildlife. Preparedby the San Francisco Bay Area Wetlands Ecosystem Goals Project. San Francisco Bay RegionalWater Quality Control Board, Oakland; 2000. p. 309.
Port of Oakland. About us: revenue division. http://www.portofoakland.com/portnyou/overview.asp.Last accessed 8 Oct 2009.
PRBO Conservation Science and the San Francisco Bay Joint Venture. The state of the birds SanFrancisco Bay. 2011.
Rogers P. San Francisco Bay’s last commercial fishery closes. Silicon Valley Mercury News.September, 5 2009. http://www.mercurynews.com/bay-area-living/ci_13278722. Last accessed21 Jan 2015.
San Francisco Bay Area Census. 2010. http://www.bayareacensus.ca.gov/bayarea.htm. Lastaccessed 21 Jan 2015.
San Francisco Bay Conservation and Development Commission. 2009.San Francisco Bay Conservation and Development Commission. San Francisco Bay Estuary.
http://www.bcdc.ca.gov/bay_estuary.shtml. Last accessed 21 Jan 2015.San Francisco Bay Conservation and Development Commission. San Francisco Bay Plan. San
Francisco. 2008. p. 64.San Francisco Bay Joint Venture. Climate adaptation decision support analysis. 2015, unpublished.San Francisco Estuary Partnership. The State of San Francisco Bay. Oakland. 2011.Save the Bay. Greening the Bay – financing wetland restoration in San Francisco Bay. Oakland.
2007; p. 7.SF Bay Joint Venture. Implementation plan, restoring the estuary 2001, Baylands ecosystem habitat
goals project 2000.Sloan D. Geology of the San Francisco Bay region. Berkeley: University of California Press; 2006.
p. 134.
San Francisco Bay Estuary (USA) 13

South Bay Salt Pond Restoration Project. Project description. 2009. http://www.southbayrestoration.org/Project_Description.html. Last accessed 21 Jan 2015.
Stenzel L, Hickey C, Kjelmyr J, Page G. Abundance and distribution of shorebirds in the SanFrancisco Bay Area. West Birds. 2002;33:1.
Sutula M, Collins JN, Clark R, Roberts C, Stein E, Grosso C, Wiskind A, Solek S, May M,O’Connor K, Fetscher E, Grenier JL, Pearce S, Robinson A, Clark C, Rey K, Morrissette S,Eicher A, Pasquinelli R, Ritter K. California’s wetland demonstration program pilot – a finalreport to the California resources agency. Southern California coastal water research project,technical report 572. Costa Mesa. 2008.
The Bay Institute. Ecological scorecard San Francisco Bay index. Novato: The Bay Institute; 2003.U.S. Environmental Protection Agency. Goals project. Baylands ecosystem habitat goals. A report
of habitat recommendations prepared by the San Francisco Bay area wetlands ecosystem goalsproject, San Francisco/S.F. Bay Regional Water Quality Control Board, Oakland. Inside frontcover. 1999.
United States Fish & Wildlife Service. Recovery plan for tidal marsh ecosystems of Northern andCentral California. 2013. http://www.fws.gov/sacramento/ES/Recovery-Planning/Tidal-Marsh/es_recovery_tidal-marsh-recovery.htm
United States Fish & Wildlife Service. Salt marsh harvest mouse and California clapper railrecovery plan. Portland; 1984. p. 44.
Western Regional Climate Center. San Francisco Bay area climate summaries. 2009. http://www.wrcc.dri.edu/summary/climsmsfo.html. Last accessed 21 Jan 2015.
Wood J, Page G, Reiter M, Liu L, Robinson-Nilsen C. Abundance and distribution of winteringshorebirds in San Franciso Bay, 1990–2008: population change and informing future monitor-ing. Grant # 2009–0179: San Francisco Bay shorebird analysis. Resources Legacy Fund.Sacramento. 2010.
14 B. Huning and M. Perlmutter