san francisco health care services master plan - sf, dph · san francisco department of public...
TRANSCRIPT
SAN FRANCISCO DEPARTMENT OF PUBLIC HEALTH
SAN FRANCISCO PLANNING DEPARTMENT
San Francisco Health Care Services Master Plan
October 2013
Per San Francisco Ordinance No. 300-10, the Health Care Services Master Plan (HCSMP) identifies the current and projected needs for, and locations of, health care services in San Francisco. The HCSMP also sets forth recommendations on how to achieve and maintain an appropriate distribution of, and equitable access to, such health care services.

FINAL HCSMP: October 2013 Page 2
ACKNOWLEDGEMENTS
The Health Care Services Master Plan (HCSMP) represents a collaborative effort between the San Francisco Department of Public Health (SFDPH) and the San Francisco Planning Department (Planning)with the support of countless others. With the common mission of improving population health and creating equitable health care access for all, SFDPH and Planning wish to acknowledge the following entities for informing this report and supporting the HCSMP’s development:
HCSMP Task Force
HCSMP Data Advisory Committee
San Francisco Department of Emergency Management
San Francisco Foundation
San Francisco Health Commission
San Francisco Health Reform Task Force
San Francisco Human Services Agency – Department of Aging and Adult Services
San Francisco Planning Commission
SFDPH – Public Health Emergency Preparedness and Response Section
National Association of County and City Health Officials
University of California, San Francisco, particularly Dr. Kevin Grumbach and Dr. Dean Schillinger
Harder + Company Community Research Special thanks to Supervisor David Campos and Legislative Aide Hillary Ronen for their role in sponsoring and securing Board support for San Francisco Ordinance No. 300-10. Their vision and continued commitment to ensuring equitable health care access in San Francisco served as the catalyst for the current HCSMP and will shape San Francisco’s health care future for years to come. SFDPH and Planning also wish to thank Ms. Roma Guy and Dr. Tomás Aragón, co-chairs of the HCSMP Task Force. Their leadership, insight, and guidance framed the Task Force’s work, allowing for meaningful dialogue between community residents and Task Force members. Special thanks also to Dick Hodgson, former Vice President of Policy and Planning at the San Francisco Community Clinic Consortium. Mr. Hodgson’s expertise greatly informed the Health System Trends Assessment of this report, and we hope that his passion for increasing health care access among San Francisco’s underserved permeates the broader HCSMP. Above all, SFDPH and Planning wish to recognize the more than 100 San Francisco residents who gave their time to infuse the HCSMP with community perspective. Through public comment at HCSMP Task Force meetings and participation in HCSMP focus groups, community members shared their vision of what equitable health care access might look like in San Francisco. Community voice gives life to HCSMP quantitative data and highlights San Francisco’s health care successes as well as opportunities for change. We thank community members for their engagement and look forward to partnering with residents further should HCSMP recommendations be approved by the San Francisco Board of Supervisors and implemented.

FINAL HCSMP: October 2013 Page 3
TABLE OF CONTENTS
ACKNOWLEDGEMENTS ................................................................................................................................. 2
TABLE OF CONTENTS ..................................................................................................................................... 3
EXECUTIVE SUMMARY + KEY FINDINGS ........................................................................................................ 4
Executive Summary ................................................................................................................................... 4
Key Findings ............................................................................................................................................ 10
BACKGROUND ............................................................................................................................................. 18
San Francisco Ordinance No. 300-10 ...................................................................................................... 18
HCSMP Planning Framework .................................................................................................................. 23
METHODOLOGY AND DEVELOPMENT ........................................................................................................ 28
Quantitative ............................................................................................................................................ 28
Qualitative ............................................................................................................................................... 30
COMMUNITY HEALTH STATUS ASSESSMENT HIGHLIGHTS ......................................................................... 39
San Francisco is a Culturally Diverse and Changing City and County...................................................... 39
Health Burdens in San Francisco Tied to Social Determinants of Health ............................................... 42
Cardiovascular Diseases among Leading Causes of Death in San Francisco Overall .............................. 51
Many Health Care Resources Available to San Francisco Residents ...................................................... 53
ASSESSMENTS OF CURRENT AND PROJECTED COMMUNITY HEALTH NEEDS ............................................ 54
Health System Trends Assessment ......................................................................................................... 54
Capacity + Gap Assessment .................................................................................................................... 97
Land Use Assessment ............................................................................................................................ 141
Historical Role Assessment ................................................................................................................... 167
HCSMP RECOMMENDATIONS AND GUIDELINES ...................................................................................... 169
MOVING FORWARD .................................................................................................................................. 180
HCSMP Approval Process ...................................................................................................................... 180
Update Process and Timeline ............................................................................................................... 180
HCSMP as a Health Policy Resource ..................................................................................................... 180
Key Items for Future Consideration ...................................................................................................... 181
APPENDICES .............................................................................................................................................. 183
Appendix A: San Francisco Ordinance No. 300-10
Appendix B: HCSMP Medical Use Clarification Table + Summary
Appendix C: HCSMP Task Force Roster
Appendix D: Neighborhood-Specific Health Profiles
Appendix E: References

FINAL HCSMP: October 2013 Page 4
EXECUTIVE SUMMARY + KEY FINDINGS
Executive Summary
Sponsored by Supervisor David Campos and effective January 2, 2011, San Francisco Ordinance No. 300-10 (Ordinance) required the creation of a Health Care Services Master Plan (HCSMP) to “provide the Health Commission, the Planning Commission and Board of Supervisors with information and public policy recommendations to guide their decisions to promote the City's land use and policy goals developed in such Plan, such as distribution and access to health care services.” Specifically, the Ordinance required the San Francisco Department of Public Health (SFDPH) and the San Francisco Planning Department (Planning) to prepare a HCSMP for adoption by the Board of Supervisors that:
Identifies the current and projected need for, and locations of, health care services in San Francisco, and
Contains recommendations on how to achieve and maintain appropriate distribution of, and access to, such services.
Once the HCSMP is adopted by the Board of Supervisors, the Ordinance requires that certain land use projects that fall under the “medical use” sections of the Planning Code and meet certain size thresholds be compared for consistency against the HCSMP. This Consistency Determination process will be required for all projects that have not yet received their first permit. Between July 2011 and June 2013, SFDPH and Planning partnered to develop the current HCSMP, which was informed by:
A 41-member HCSMP Task Force that served as an advisory body charged with developing preliminary HCSMP recommendations that reflected both relevant data and community feedback. Charged with focusing on health care access among San Francisco’s vulnerable populations, the HCSMP Task Force held 10 Task Force meetings between July 2011 and May 2012 – four community meetings in different San Francisco neighborhoods and four issue-based meetings.
More than 100 San Francisco residents who gave their time to infuse the HCSMP with community perspective. Through public comment at HCSMP Task Force meetings and participation in HCSMP focus groups, community members shared their vision of what equitable health care access might look like in San Francisco.
Quantitative data and policy analysis reflected in the Community Health Status Assessment and the five assessments required of the HCSMP by the Ordinance.
The resulting HCSMP is a community- and data-driven document that sets forth a series of recommendations and related guidelines intended to provide a dynamic and inspiring roadmap for bettering health and health services, focus on improving access to care, particularly for San Francisco’s vulnerable populations, including low-income areas and geographic areas with high rates of health disparities (e.g., Bayview-Hunters Point, Tenderloin, Western Addition, Excelsior). These recommendations and guidelines were largely developed by the HCSMP Task Force and not only guide land use decisions and inform the siting and scope of health care facilities and services, but also reach far beyond bricks and mortar to acknowledge that health and wellness result from the complex integration of services, community partnerships, and neighborhood characteristics.
FINAL HCSMP: October 2013 Page 5
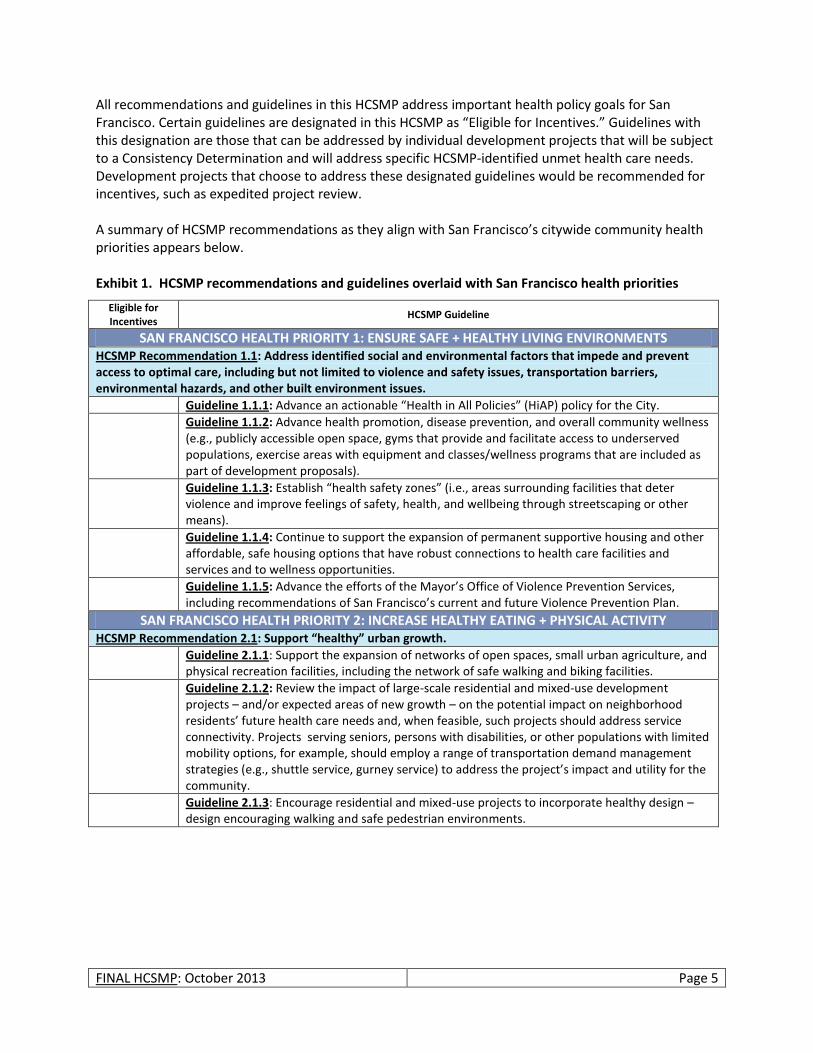
All recommendations and guidelines in this HCSMP address important health policy goals for San Francisco. Certain guidelines are designated in this HCSMP as “Eligible for Incentives.” Guidelines with this designation are those that can be addressed by individual development projects that will be subject to a Consistency Determination and will address specific HCSMP-identified unmet health care needs. Development projects that choose to address these designated guidelines would be recommended for incentives, such as expedited project review. A summary of HCSMP recommendations as they align with San Francisco’s citywide community health priorities appears below. Exhibit 1. HCSMP recommendations and guidelines overlaid with San Francisco health priorities
Eligible for Incentives
HCSMP Guideline
SAN FRANCISCO HEALTH PRIORITY 1: ENSURE SAFE + HEALTHY LIVING ENVIRONMENTS HCSMP Recommendation 1.1: Address identified social and environmental factors that impede and prevent access to optimal care, including but not limited to violence and safety issues, transportation barriers, environmental hazards, and other built environment issues.
Guideline 1.1.1: Advance an actionable “Health in All Policies” (HiAP) policy for the City.
Guideline 1.1.2: Advance health promotion, disease prevention, and overall community wellness (e.g., publicly accessible open space, gyms that provide and facilitate access to underserved populations, exercise areas with equipment and classes/wellness programs that are included as part of development proposals).
Guideline 1.1.3: Establish “health safety zones” (i.e., areas surrounding facilities that deter violence and improve feelings of safety, health, and wellbeing through streetscaping or other means).
Guideline 1.1.4: Continue to support the expansion of permanent supportive housing and other affordable, safe housing options that have robust connections to health care facilities and services and to wellness opportunities.
Guideline 1.1.5: Advance the efforts of the Mayor’s Office of Violence Prevention Services, including recommendations of San Francisco’s current and future Violence Prevention Plan.
SAN FRANCISCO HEALTH PRIORITY 2: INCREASE HEALTHY EATING + PHYSICAL ACTIVITY HCSMP Recommendation 2.1: Support “healthy” urban growth.
Guideline 2.1.1: Support the expansion of networks of open spaces, small urban agriculture, and physical recreation facilities, including the network of safe walking and biking facilities.
Guideline 2.1.2: Review the impact of large-scale residential and mixed-use development projects – and/or expected areas of new growth – on the potential impact on neighborhood residents’ future health care needs and, when feasible, such projects should address service connectivity. Projects serving seniors, persons with disabilities, or other populations with limited mobility options, for example, should employ a range of transportation demand management strategies (e.g., shuttle service, gurney service) to address the project’s impact and utility for the community.
Guideline 2.1.3: Encourage residential and mixed-use projects to incorporate healthy design – design encouraging walking and safe pedestrian environments.

FINAL HCSMP: October 2013 Page 6
Eligible for Incentives
HCSMP Guideline
SAN FRANCISCO HEALTH PRIORITY 3: INCREASE ACCESS TO HIGH QUALITY HEALTH CARE + SERVICES HCSMP Recommendation 3.1: Increase access to appropriate care for San Francisco’s vulnerable populations.
Guideline 3.1.1: Increase the availability and accessibility of primary care in low-income areas (i.e., areas where the percentage of low-income residents – defined as individuals living below 200% of the Census Poverty Threshold
1 – is greater than the San Francisco average), areas with
documented high rates of health disparities (e.g., areas in which residents face the highest rates of morbidity or premature mortality) and/or areas with limited existing health care resources
Guideline 3.1.2: Increase the availability and accessibility of culturally competent primary care among vulnerable subpopulations including but not limited to Medi-Cal beneficiaries, uninsured residents, limited English speakers, and populations with documented high rates of health disparities.
Guideline 3.1.3: Increase the availability and accessibility of prenatal care within neighborhoods with documented high rates of related health disparities.
Guideline 3.1.4: Increase the availability and accessibility of prenatal care for subpopulations with documented high rates of related health disparities including but not limited to Black/African American residents.
Guideline 3.1.5: Increase the availability and accessibility of dental care in low-income areas (i.e., areas where the percentage of low-income residents – defined as individuals living below 200% of the Census Poverty Threshold
2 – is greater than the San Francisco average) and areas with
documented high rates of health disparities (e.g., areas in which residents face the highest rates of morbidity or premature mortality).
Guideline 3.1.6: Increase the availability and accessibility of dental care among vulnerable subpopulations including but not limited to Medi-Cal beneficiaries, uninsured residents, limited English speakers, and populations with documented high rates of health disparities.
Guideline 3.1.7: Complete the rezoning of the Bayview Health Node, as envisioned by community residents in the adopted Bayview Redevelopment Plan.
Guideline 3.1.8: Increase the supply of culturally competent providers serving low-income and uninsured populations, which may include but is not limited to supporting projects that can demonstrate through metrics that they have served and/or plan to serve a significant proportion of existing/new Medi-Cal and/or uninsured patients, particularly in underserved neighborhoods.
Guideline 3.1.9: Advocate for the extension of the Medicaid primary care physician reimbursement rate established under Health Reform beyond 2014 to attract and retain physician participation in the Medi-Cal program.
Guideline 3.1.10: Promote projects that demonstrate the ability and commitment to deliver and facilitate access to specialty care for underserved populations (e.g., through transportation assistance, mobile services, and/or other innovative mechanisms).
Guideline 3.1.11: Support innovative education and outreach efforts that: a. Target youth and other hard-to-reach populations, such as homeless people and those
with behavioral health problems that inhibit them from seeking medical care and other health services, as well as “invisible” populations that are often overlooked due to their legal status.
b. Help low-income, publicly insured, and/or uninsured persons identify health care facilities where they may access care.
Guideline 3.1.12: Promote support services (e.g., escorting patients to medical appointments, using case managers to help patients navigate the health care system) for patients likely to have difficulty accessing or understanding health care services (e.g., multiply diagnosed or homeless persons).
Guideline 3.1.13: Support clinics and support services that offer non-traditional facility hours to accommodate patients who work during traditional business hours.
Guideline 3.1.14: Preserve the Healthy San Francisco program.
FINAL HCSMP: October 2013 Page 7
Eligible for Incentives
HCSMP Guideline
Guideline 3.1.15: Support mobile enrollment efforts to expand opportunities for people to enroll in health insurance or other health care programs.
HCSMP Recommendation 3.2: Promote new, innovative, or integrative models of care for health care delivery – such as the integration of behavioral health (mental health and substance abuse) services and medical services – that improves access for vulnerable populations.
Guideline 3.2.1: Research the feasibility of implementing a patient-centered medical home model for the severely mentally ill in which a mental health care provider leads an integrated team of service providers, including primary care practitioners; and conversely, for patients who are not severely mentally ill, support integration of behavioral health into primary care medical homes.
Guideline 3.2.2: Research the connection between specialty mental health services and Medi-Cal managed care for Medi-Cal beneficiaries.
Guideline 3.2.3: Increase the availability of behavioral health and trauma-related services – including school-based services – in neighborhoods with documented high rates of violence (i.e., neighborhoods exceeding citywide violence rates per San Francisco Police Department data).
Guideline 3.2.4: Support expansion of community-based behavioral health services.
HCSMP Recommendation 3.3: Ensure that San Francisco has a sufficient capacity of long-term care options for its growing senior population and for persons with disabilities to support their ability to live independently in the community.
Guideline 3.3.1: Support affordable and supportive housing options for seniors and persons with disabilities, enabling them to live independently in the community.
Guideline 3.3.2: Work in collaboration with the Department of Aging and Adult Services – and in alignment with the Long-Term Care Integration Plan – to promote a continuum of community-based long-term supports and services, such as home care to assist with activities of daily living, home-delivered meals, and day centers. Such services should address issues of isolation as well as seniors’ basic daily needs.
Guideline 3.3.3: Advocate for California to expand community-based Medi-Cal long-term care services, including through the Home- and Community-Based Services 1915(i) state plan option.
HCSMP Recommendation 3.4: Ensure that health care and support service providers have the cultural, linguistic, and physical capacity to meet the needs of San Francisco’s diverse population.
Guideline 3.4.1: Ensure that electronic health records capture key patient demographic data, consistent with patient privacy preferences, that facilitate the provision of culturally and linguistically competent care.
Guideline 3.4.2: Support workforce development and diversity efforts to develop a health care and home-based services workforce that reflects community characteristics (e.g., race/ethnicity, cultural and linguistic background, etc.), which is expected to increase provider supply and patient satisfaction in underserved areas.
Guideline 3.4.3: Encourage the assessment of patients’ health literacy and cultural/linguistic needs, so providers can better tailor care to each patient’s needs.
HCSMP Recommendation 3.5: Ensure that San Francisco residents – particularly those without regular car access – have available a range of appropriate transportation options (e.g., public transportation, shuttle services, bike lanes, etc.) that enable them to reach their health care destinations safely, affordably, and in a timely manner.
Guideline 3.5.1: Support the recommendations of the Municipal Transportation Agency’s (MTA) Transit Effectiveness Project, which is expected to positively impact passenger travel times on high ridership routes, including those that service San Francisco’s major health care facilities.
Guideline 3.5.2: Ensure that the MTA continues to consider the needs of seniors and persons with disabilities in its transportation planning efforts.
FINAL HCSMP: October 2013 Page 8
Eligible for Incentives
HCSMP Guideline
Guideline 3.5.3: As part of transit demand management efforts for patients, develop safe health care transit options beyond the public transportation system (e.g., bike storage, health care facility shuttle service, etc.) to increase health care access for those without regular car access.
Guideline 3.5.4: Provide transportation options (e.g., taxi vouchers, shuttles, other innovative transportation options, etc.) from low-income areas and areas with documented high rates of health disparities – particularly those with transportation access barriers – to health care facilities.
Guideline 3.5.5: Support mobility training programs for older adults to help them retain independence, access to health care, and other opportunities, especially important as San Francisco’s aging population grows.
Guideline 3.5.6: Ensure that special consideration is given to how the consolidation or retention of transit stops could impact access to health care services from sensitive uses such as housing for seniors and persons with disabilities who may regularly need health care services.
Guideline 3.5.7: Promote ongoing collaboration with MTA and San Francisco County Transportation Authority staff to consider pedestrian safety near health care facilities as well as how safety may be impacted by ongoing transportation planning and projects.
Guideline 3.5.8: Increase awareness of transportation options to health care facilities during facility hours. This may include but not be limited to providing relevant transit information in providers’ offices.
HCSMP Recommendation 3.6: Ensure collaboration between San Francisco’s existing health and social services networks and the community to maximize service effectiveness and cost-effectiveness.
Guideline 3.6.1: Support collaborations between medical service providers and existing community-based organizations with expertise in serving San Francisco’s diverse populations.
Guideline 3.6.2: Support inter-health system collaboration (e.g., via provider consultation hotlines, systems support for electronic health records adoption and implementation) that offers potential for improving care access, the patient experience, and health outcomes, and leverage the expertise of San Francisco’s diverse providers.
Guideline 3.6.3: Support partnerships between medical service providers and entities not specifically focused on health or social services (e.g., schools, private business, faith community, etc.) to leverage expertise and resources and expand access to health services and promote wellness.
Guideline 3.6.4: Support collaboration between San Francisco providers and the United Way to ensure that the 2-1-1 system reflects information on all available health services.
Guideline 3.6.5: Showcase collaboration outcomes to illustrate the potential impact of community partnerships.
HCSMP Recommendation 3.7: Facilitate sustainable health information technology systems that are interoperable, consumer-friendly, and that increase access to high-quality health care and wellness services.
Guideline 3.7.1: Promote health care provider participation in HealthShare Bay Area, a health information exchange that will provide a secure, controlled, and interoperable method for exchanging and aggregating patient health information.
Guideline 3.7.2: Support technology-based solutions that expand access to health services, such as telehealth (e.g., video medical interpretation, remote health monitoring, etc.) and coverage of such by health insurance. Such technology must be provided in a culturally and linguistically competent way, tailored to the needs of the target population, and accessible to San Francisco’s vulnerable populations.
Guideline 3.7.3: Integrate support service information (e.g., receipt and source of case management services) in electronic health records to paint a more complete picture of each patient’s health.

FINAL HCSMP: October 2013 Page 9
Eligible for Incentives
HCSMP Guideline
HCSMP Recommendation 3.8: Improve local health data collection and dissemination efforts.
Guideline 3.8.1: Improve collection, coordination of collection, availability, and understandability of data on San Francisco’s existing health care resources (e.g., the physical location of health care providers by type and population served).
Guideline 3.8.2: Gather and disseminate more data about the connection between safety and public health.
Guideline 3.8.3: Disseminate relevant health status data to health care providers so they can better affect key indicators of population health through their institutional and clinical decisions.
HCSMP Recommendation 3.9: Promote the development of cost-effective health care delivery models that address patient needs.
Guideline 3.9.1: Use nurse practitioners and physician assistants to the full extent of their training.
Guideline 3.9.2: Increase flexibility between primary care and specialty care (e.g., specialty mental health) provider roles. Such flexibility might include but not be limited to:
a. Allowing specialists with a history of treating patients with certain conditions to serve as those patients’ primary care provider;
b. Better equipping primary care providers to manage chronic conditions to maximize the appropriate use of specialists; and/or
c. Creating a health care delivery framework that allows for a shared scope of responsibilities between primary care providers and specialists that best supports the patient care experience.
Guideline 3.9.3: Advance the patient-centered medical home model for all San Franciscans.
FINAL HCSMP: October 2013 Page 10
Key Findings
Community Health Status Assessment
Overview Developed to inform both the HCSMP and San Francisco’s complementary community health improvement effort, the Community Health Status Assessment (CHSA) identifies priority community health and quality of life issues. By reviewing data along more than 150 health indicators, San Francisco’s CHSA attempts to answer questions such as:
How healthy are San Francisco residents?
What does San Francisco’s health status look like? The CHSA provides data for more than 150 indicators over the following 10 broad-based categories:
Demographic characteristics
Socioeconomic characteristics
Health resource availability
Quality of life
Behavioral risk factors
Environmental health indicators
Social and mental health
Maternal and child health
Death, illness, and injury
Communicable disease
Key Findings San Francisco is a culturally diverse and changing city and county.
Over the next two decades, it is estimated that 55 percent of San Franciscans will be over the age of 45, and that the population over age 75 will increase from seven percent to 11 percent by 2030. This has implications for the need of more long-term care options in the future.
San Francisco has experienced a decrease in the number of families with young children.
More families are moving out of the city than moving in.
More than 12 languages are spoken in San Francisco, a sign of its cultural diversity.
Income inequality is growing. San Francisco has the highest degree of income inequality among Bay Area counties, and certain subpopulations are more likely than others to experience poverty.
Data show that there are many health care resources available to San Franciscans; however, certain neighborhoods and subpopulations experience significant health disparities and inequities.
Black/African American babies in San Francisco have notably higher perinatal and infant mortality rates compared to other racial/ethnic groups.
Although there appears to be a recent dramatic decline in the number of homicides in San Francisco, Blacks/African Americans are more likely than those in other racial/ethnic groups to die of homicide.
FINAL HCSMP: October 2013 Page 11
Black/African American men and women in San Francisco experience disproportionately higher mortality and premature mortality rates compared to other racial/ethnic groups.
Among San Franciscans, Latinos are at greatest risk for obesity.
San Francisco has experienced an increase in active tuberculosis (TB) cases and ranks third statewide. Foreign-born Asians bear the largest TB burden; TB rates among Latinos have increased significantly.
Homicide is the leading cause of death among Latino males in San Francisco.
Across the 10 leading causes of death in San Francisco, Latino men and women experience the lowest death rates overall compared to other racial/ethnic groups.
The South of Market, Excelsior, Bayview-Hunters Point, and Visitacion Valley neighborhoods exceed city/county rates across three prenatal care and birth outcome risk factors.
Significant disparities exist between neighborhoods for risk of pedestrian injury and death.
The Tenderloin, South of Market, and Bayview-Hunters Point neighborhoods far exceed the city/countywide rate and goal for preventable emergency room visits.
San Francisco has an annual violent crime rate that is higher than the state average and national benchmark. Disparities in crime appear to exist by race/ethnicity and neighborhood.
Mirroring the nation, cardiovascular diseases are among the leading causes of death in San Francisco overall.
Cardiovascular diseases such as ischemic heart disease and stroke are among the leading causes of death for both men and women in San Francisco.
San Francisco offers a rich array of health care resources to residents.
Most San Franciscans (94 percent) are either insured or participate in Healthy San Francisco.3
Most children (95 percent) have health insurance.
Nearly all adults age 65+ have health insurance.
San Francisco has a very high number of primary care physicians relative to the size of its population. San Francisco outperforms all other California counties for this measure and exceeds the national benchmark.
San Francisco has at least 55 primary care health centers.
San Francisco ranks second only to Marin for the number of mental health providers compared to the size of its population.
The rate of dentists in San Francisco is more than 2.5 times that of California and the nation.
The rate of general acute care licensed hospital beds in San Francisco is almost double that of California, signaling a high rate of hospital bed availability to San Francisco residents.
Health System Trends Assessment
Overview San Francisco Ordinance No. 300-10 requires that the HCSMP contain a Health System Trends Assessment. This assessment is intended to analyze trends in health care services with respect to the City, including disease and population health status, governmental policy, disaster planning, clinical and communications technology, reimbursement and funding, organization and delivery of services, workforce, and community obligations of providers.
FINAL HCSMP: October 2013 Page 12
Key Findings Health Reform will place greater demand on San Francisco’s health care resources.
Up to 117,000 non-elderly San Franciscans (ages 0-64) are currently uninsured. This figure provides a useful upper bound of need when considering San Francisco’s capacity to meet increased health care demand following the implementation of Health Reform.
o Many of San Francisco’s uninsured already access care through a “medical home” thanks to Healthy San Francisco.
o Nearly half of San Francisco’s non-elderly uninsured are being served through existing capacity.
San Francisco exceeds benchmarks of primary care supply despite national and state shortage projections.
Despite the high number of primary care physicians, San Francisco may lack sufficient primary care providers to serve the expanded Medi-Cal population in a timely manner. (Medi-Cal is California’s Medicaid program.)
o San Francisco expects to have an estimated 30,000 new Medi-Cal beneficiaries following Health Reform implementation.
o California physicians are less likely to serve Medi-Cal patients compared to those with Medicare and/or private insurance. California has the 47th lowest Medicaid reimbursement rate in the nation, which contributes to low provider participation.
o Health Reform will increase the Medicaid primary care reimbursement rate to equal that of Medicare – but only through 2014.
o Because of standards imposed by California’s current 1115 Medicaid waiver and the California Department of Managed Health Care, San Francisco risks financial loss if timely access standards are not met. This is a particular concern given San Francisco’s expanding Medi-Cal population.
Despite the high number of primary care physicians, San Francisco may lack sufficient primary care providers to serve the uninsured.
o San Francisco should preserve the Healthy San Francisco program and maintain the program’s provider network.
Specialty care access is likely to remain an issue for the uninsured and those on Medi-Cal.
The state could mitigate provider supply concerns by:
o Increasing provider participation in Medi-Cal and the California Health Benefit Exchange; o Increasing flexibility between primary care and specialty care provider roles; and o Using nurse practitioners and physician assistants to the fullest extent of their education
and training.
FINAL HCSMP: October 2013 Page 13
Health care finance trends – including provider reimbursement mechanisms – impact the provision, cost, and outcomes of patient care.
The implementation of Medicaid reforms will fall heavily on Medi-Cal Managed Care, which exists in San Francisco.
Hospital systems will be heavily impacted by reimbursement changes under Health Reform.
o Medicare will launch hospital reimbursement reforms as performance incentives. o Medicaid will adjust (i.e., eliminate) hospital payments for specified hospital-acquired
conditions. o To compensate for the expected increase in the number of insured patients, Health
Reform will decrease “disproportionate share hospital” (DSH) Medicare and Medicaid payments to certain hospitals.4
Under Health Reform, Federally Qualified Health Centers (FQHC) receive incentives to serve the expanded insured population – increasing patient access to care – though FQHC federal base funding is threatened.
Health Reform’s federal Medicaid primary care reimbursement incentive is unlikely to drive significant expansion of primary care providers serving Medicaid recipients – particularly in California.
Health Reform advances the prioritization of home- and community-based long-term care services into which Medi-Cal could opt (e.g., 1915(i) Waiver). Long-term care is a particular concern given San Francisco’s expanding senior population.
Funding and system fragmentation (e.g., Medi-Cal Managed Care carve-outs) can lead to fragmentation in care and the patient experience. Access to support services – particularly for patients most likely to struggle with accessing and following through with care (e.g., multiply diagnosed persons) – can help patients navigate the fragmented system more successfully.
Innovations in health information technology and health care delivery are shaping San Francisco’s health care future and offer the potential to improve access to care for all San Franciscans, including the city/county’s more vulnerable residents.
HealthShare Bay Area, a regional health information exchange, will afford San Francisco and East Bay health care providers with a secure, controlled, and interoperable method for exchanging and aggregating patient health information across all participating providers of care.
The federal Electronic Health Record (EHR) Incentive Payment Program assignment methodology for Federally Qualified Health Centers (FQHC) should be modified to enable an FQHC entity to receive incentive funds for providers who predominantly practice there.
Using nurse practitioners and physician assistants to the fullest extent of their education and training represents an innovation in primary care that could be useful in San Francisco.
San Francisco should advance an actionable “Health in All Policies” (HiAP) policy for the City. HiAP is an approach that looks at all policy-making through a health lens with the objective of promoting and protecting the health of the population by addressing the social and physical environment influences on health.
Community collaboration should be promoted across the local public health system (e.g., with community-based organizations, academic institutions, etc.) to improve health outreach, education, and service delivery.
FINAL HCSMP: October 2013 Page 14
Collaboration between existing community resources databases should be fostered to create a single streamlined, comprehensive community resource repository for San Francisco. Explore complementing the resulting streamlined system with “connectors” to facilitate and follow-up on community resource referrals.
San Francisco is becoming increasingly prepared for emergencies through planned, coordinated response.
In 2011, SFDPH formed the Public Health Emergency Preparedness and Response (PHEPR) Section to serve the public, SFDPH, and community partners by coordinating health emergency preparedness, response, and recovery efforts. PHEPR’s work will complement that of the existing San Francisco Department of Emergency Management (DEM), which manages disaster preparation, mitigation, and response; 9-1-1 dispatch; and homeland security grant distribution for the City and County of San Francisco.
Capacity + Gap Assessment
Overview San Francisco Ordinance No. 300-10 requires that the HCSMP contain both a Capacity Assessment and Gap Assessment:
Capacity Assessment: Intended to quantify the current and projected capacities of existing medical institutions in San Francisco, including emergency services, hospital services, primary and specialty care, behavioral health, and long-term care;
Gap Assessment: Intended to identify medical service gaps across the City and medically underserved areas for particular services.
Viewing these required components as complementary, SFDPH and Planning combined the Capacity and Gap assessments in the HCSMP. Key Findings Overall, San Franciscans have better geographic access to health care services than other populations.
San Francisco hospital locations largely coincide with the city/county’s most densely populated areas, and San Francisco has more hospital beds per population than the state.
San Francisco’s emergency medical system capacity may be sufficient to meet resident needs; however, a more standardized definition of surge bed capacity would help San Francisco better assess its preparedness.
Data do not definitively indicate a need to increase San Francisco’s physical emergency medical services (EMS) capacity, especially given the increase in EMS beds projected for 2015. While utilization of San Francisco’s existing EMS capacity has increased in recent years, indicators of overcrowding more commonly point to a need for improved patient flow within hospital systems.
FINAL HCSMP: October 2013 Page 15
As currently measured, San Francisco exceeds need projections for surge bed capacity in the event of an emergency; however, greater standardization of surge bed definitions and measurements is needed to more accurately assess San Francisco’s physical medical surge capacity.
San Francisco offers many health care resources to residents; however, availability does not equal accessibility, and Medi-Cal beneficiaries and the uninsured often struggle to access care.
San Francisco boasts a primary care physician supply of one to every 401 residents – outperforming the national benchmark, California, and all other California counties; however, availability does not equate with accessibility, particularly for Medi-Cal beneficiaries and the uninsured.
Most San Franciscans (87 percent) have a regular source of care (general) and primary care (84 percent); however, despite a high number of dentists, publicly insured and uninsured residents struggle with costly access to oral health services.
San Francisco likely lacks sufficient long-term care capacity to accommodate its growing aging population.
San Francisco’s long-term care (LTC) bed occupancy rate is higher than that of the state, though San Francisco has fewer LTC beds per population. In addition, San Francisco lacks sufficient community-based options for senior residents and persons with disabilities.
San Francisco’s behavioral health services system is likely to be strained under Health Reform. Service gaps also exist for children and youth in need of substance use treatment.
While behavioral health clinics are well distributed throughout San Francisco geographically, expansion of behavioral health services – and, potentially, of the facilities that house them – may be needed to address increased patient utilization and increased demand expected under Health Reform.
While San Francisco has a high ratio of mental health providers to residents overall, the city/county safety net lacks sufficient psychiatrists to meet patient demand.
Additional substance use programs for children and youth are needed.
Despite geographic proximity to health care services, some San Francisco residents struggle to access care because of transportation issues, limited health literacy, and patient/provider gaps in culture and language.
Despite geographic proximity, San Franciscans with limited transportation options often struggle to access care. This is most common among low-income residents reliant on public transportation for whom traveling to care may take more than 30 minutes.
The degree to which San Francisco providers assess for and respond to patients’ health literacy needs is unknown; however, community research and public comment at HCSMP Task Force meetings suggest that response to health literacy issues is a possible gap in San Francisco, particularly for vulnerable populations.
Access to culturally and linguistically competent care is vital for San Francisco’s diverse population. While all hospitals provide access to interpretation services, outreach and education
FINAL HCSMP: October 2013 Page 16
efforts to make patients aware of these services could be improved. Increasing the training and diversity of San Francisco’s health care workforce is also a pivotal need.
Land Use Assessment
Overview San Francisco Ordinance No. 300-10 requires that the HCSMP contain a Land Use Assessment, which is intended to assess the supply, need, and demand for Medical Uses in different neighborhoods of the City; and the potential effects or land use burdens that medical uses may have on other neighborhood-serving uses. Key Findings San Francisco is on track to meet residents’ evolving health care needs: The need for development of additional medical facilities and hospital beds in the city is low given projected demand for new medical space as well as existing plans to expand services in areas of high need.
San Francisco has a wide range of services available, sufficient land and appropriate land use controls, and plans for additional infrastructure.
The city’s medical uses are relatively well distributed throughout the city’s neighborhoods, with slightly fewer clinics per resident in the lower income areas of the city’s southeast portion, specifically the Bayview and neighborhoods of the Ocean View, Lakeshore, Outer Mission, and Excelsior neighborhoods.
San Francisco should do the following to ensure an equitable distribution of medical uses throughout the city:
o Establish more clinics that provide key services (e.g., primary care) in areas of need, specifically the city’s low-income neighborhoods in the southeast section of San Francisco.
o Ensure that existing and new medical facilities target the growing number of younger and older residents in the coming years, particularly children 0-9-years-old and seniors age 65 and older.
o Improve access to healthcare and medical services for Medi-Cal beneficiaries and the uninsured.
o Develop language-specific and culturally sensitive medical services. o Encourage transportation connections between underserved areas and citywide medical
facilities.
Displacement and land use effects of future medical uses are likely minimal but dependent on a variety of development project-specific factors.
Zoning provides sufficient opportunities for development of medical uses throughout the city, and each zoning district’s specific criteria with regard to medical uses (which may be permitted as-of-right, with a conditional use, or not permitted) are generally appropriate to promote medical uses or protect other competing uses depending on the district’s primary purpose.
FINAL HCSMP: October 2013 Page 17
Historical Role Assessment
Overview San Francisco Ordinance No. 300-10 requires that the HCSMP contain a Historical Role Assessment, which is intended to take into consideration the historical role played, if any, by medical uses in the City to provide medical services to historically underserved groups. Key Findings San Francisco has developed many health care programs and facilities to respond to the needs of San Francisco’s diverse population.
San Francisco has both a diverse population (e.g., in terms of immigration status, primary language, sexual orientation, etc.) and a robust network of providers with a long history of serving specific segments of the population in a culturally and linguistically competent manner.
An array of programs and facilities has been developed to respond to unmet, underserved needs in culturally and linguistically competent ways.
FINAL HCSMP: October 2013 Page 18
BACKGROUND
San Francisco Ordinance No. 300-10
Overview
Sponsored by Supervisor David Campos and effective January 2, 2011, San Francisco Ordinance No. 300-10 (Ordinance; Appendix A) required the creation of a Health Care Services Master Plan (HCSMP) to guide land use decisions for health care-related projects in San Francisco. Specifically, the Ordinance required the San Francisco Department of Public Health (SFDPH) and the San Francisco Planning Department (Planning) to prepare a HCSMP for adoption by the Board of Supervisors that:
Identifies the current and projected need for, and locations of, health care services in San Francisco, and
Contains recommendations on how to achieve and maintain an appropriate distribution of, and access to, such services.
This document represents the culmination of the Ordinance-mandated process. Upon the Board of Supervisors’ adoption of the HCSMP, the Planning Department must determine whether certain “medical use” projects meeting certain size thresholds are consistent with the HCSMP. Consistent applications may move forward while inconsistent applications will have opportunities to achieve consistency. If an application remains inconsistent with the HCSMP, the Planning Department must withhold the approval of any entitlement or permit for that application unless countervailing public policy considerations justify otherwise.
HCSMP Development
Required Elements The Ordinance requires that the HCSMP contain the following components:
Health System Trends Assessment: Intended to analyze trends in health care services with respect to the City, including disease and population health status, governmental policy, disaster planning, clinical and communications technology, reimbursement and funding, organization and delivery of services, workforce, and community obligations of providers;
Capacity Assessment: Intended to quantify the current and projected capacities of existing medical institutions in San Francisco, including emergency services, hospital services, primary and specialty care, behavioral health, and long-term care;
Land Use Assessment: Intended to assess the supply, need and demand for medical uses in the different neighborhoods of the City;
Gap Assessment: Intended to identify medical service gaps across the City and medically underserved areas for particular services;
Historical Role Assessment: Intended to take into consideration the historical role played, if any, by medical uses in the City to provide medical services to historically underserved groups; and
Recommendations: Intended to promote an equitable and efficient distribution of healthcare services in the City.
FINAL HCSMP: October 2013 Page 19
Public Process The Ordinance mandates that SFDPH hold at least two publicly-noticed informational hearings during the course of HCSMP’s development; SFDPH expanded on this requirement by hosting a total of 10 public meetings of the HCSMP Task Force, described below. The Ordinance also specifies that, upon completion of the draft, there must be a public written comment period of no less than 30 days. Within 30 days of the close of the comment period, the Health Commission and the Planning Commission must hold a joint public hearing on the draft HCSMP; the Commissions may hold additional hearings as necessary to consider material changes to the draft HCSMP. The Health Commission and the Planning Commission may recommend approval or disapproval of the HCSMP. Following these recommendations, the Board of Supervisors will consider adoption of the HCSMP.
Consistency of Land Use Projects with the HCSMP
Consistency Determination Application Upon the Board of Supervisors’ adoption of the HCSMP, the Planning Department must determine, through a referral and consultation process with SFDPH, whether certain medical use projects are in compliance with the HCSMP by making a “Consistency Determination.” This Consistency Determination process will be required for all projects that have not yet received their first permit. The Ordinance references the medical use sections of the Planning Code (see Appendices A, B and Exhibit 86) and defines “medical use” as follows:
A retail use that provides medical and allied health services to the individual by physicians (e.g., surgeons, psychiatrists, podiatrists, etc.), dentists, psychologists, acupuncturists, chiropractors, or any other health care professional when licensed by a State-sanctioned Board overseeing the provision of medically oriented services.
A clinic, primarily providing outpatient care in medical, psychiatric or other health services, and not part of a hospital or medical center.
A hospital or medical center, which provides inpatient or outpatient medical care, medical offices, clinics, and laboratories.
Medical use excludes providers of massage and housing operated by a medical provider (e.g., employee or student dormitories adjacent to medical facilities when the dormitories are operated by and affiliated with a medical institution).
Following are the size thresholds for medical use projects that are subject to a HCSMP Consistency Determination:
Any of change of use from a non-medical use (e.g., retail) to a medical use that would occupy 10,000 gross square feet or more.
Any expansion of an existing medical use by 5,000 gross square feet or more. Any medical use project falling short of these size thresholds would not be subject to a Consistency Determination and would not be analyzed for general conformity with the HCSMP.
FINAL HCSMP: October 2013 Page 20
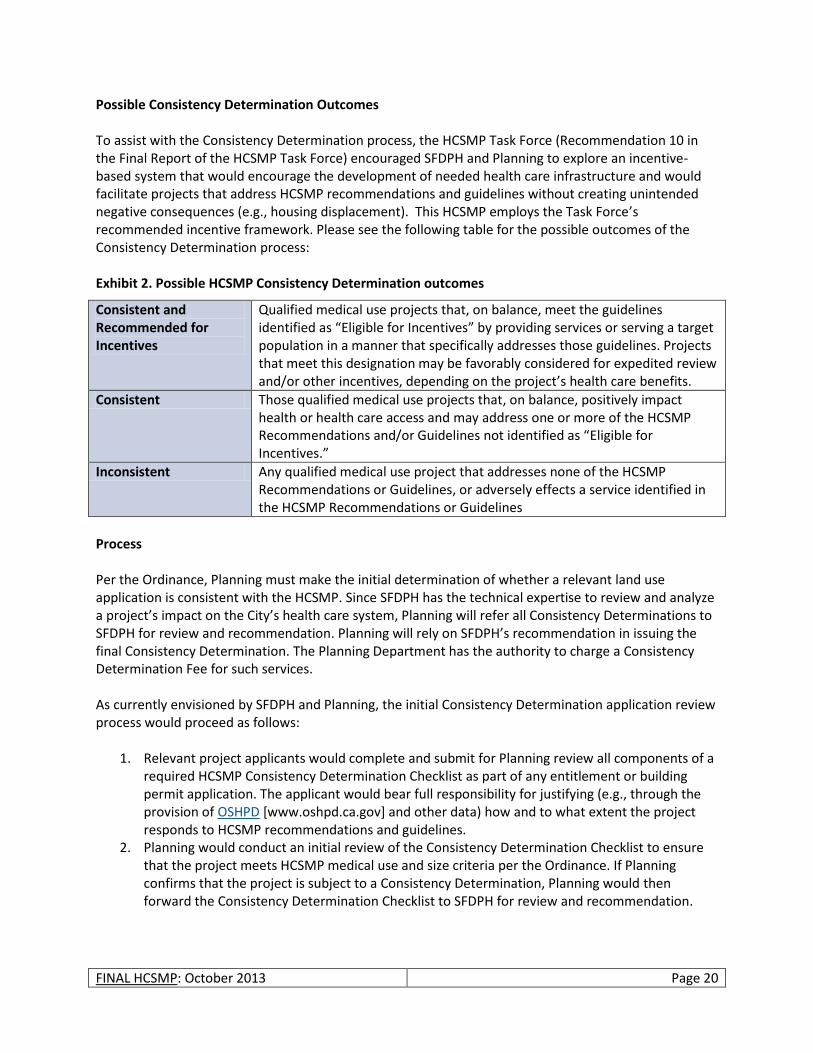
Possible Consistency Determination Outcomes To assist with the Consistency Determination process, the HCSMP Task Force (Recommendation 10 in the Final Report of the HCSMP Task Force) encouraged SFDPH and Planning to explore an incentive-based system that would encourage the development of needed health care infrastructure and would facilitate projects that address HCSMP recommendations and guidelines without creating unintended negative consequences (e.g., housing displacement). This HCSMP employs the Task Force’s recommended incentive framework. Please see the following table for the possible outcomes of the Consistency Determination process: Exhibit 2. Possible HCSMP Consistency Determination outcomes
Consistent and Recommended for Incentives
Qualified medical use projects that, on balance, meet the guidelines identified as “Eligible for Incentives” by providing services or serving a target population in a manner that specifically addresses those guidelines. Projects that meet this designation may be favorably considered for expedited review and/or other incentives, depending on the project’s health care benefits.
Consistent Those qualified medical use projects that, on balance, positively impact health or health care access and may address one or more of the HCSMP Recommendations and/or Guidelines not identified as “Eligible for Incentives.”
Inconsistent Any qualified medical use project that addresses none of the HCSMP Recommendations or Guidelines, or adversely effects a service identified in the HCSMP Recommendations or Guidelines
Process Per the Ordinance, Planning must make the initial determination of whether a relevant land use application is consistent with the HCSMP. Since SFDPH has the technical expertise to review and analyze a project’s impact on the City’s health care system, Planning will refer all Consistency Determinations to SFDPH for review and recommendation. Planning will rely on SFDPH’s recommendation in issuing the final Consistency Determination. The Planning Department has the authority to charge a Consistency Determination Fee for such services. As currently envisioned by SFDPH and Planning, the initial Consistency Determination application review process would proceed as follows:
1. Relevant project applicants would complete and submit for Planning review all components of a required HCSMP Consistency Determination Checklist as part of any entitlement or building permit application. The applicant would bear full responsibility for justifying (e.g., through the provision of OSHPD [www.oshpd.ca.gov] and other data) how and to what extent the project responds to HCSMP recommendations and guidelines.
2. Planning would conduct an initial review of the Consistency Determination Checklist to ensure that the project meets HCSMP medical use and size criteria per the Ordinance. If Planning confirms that the project is subject to a Consistency Determination, Planning would then forward the Consistency Determination Checklist to SFDPH for review and recommendation.
FINAL HCSMP: October 2013 Page 21
3. Qualified SFDPH staff would review the Consistency Determination Checklist and accompanying justification to determine if the project is consistent with HCSMP recommendations and guidelines.
4. Based on its review, SFDPH staff would recommend to Planning that the project be assigned one of three possible HCSMP Consistency Determination outcomes:
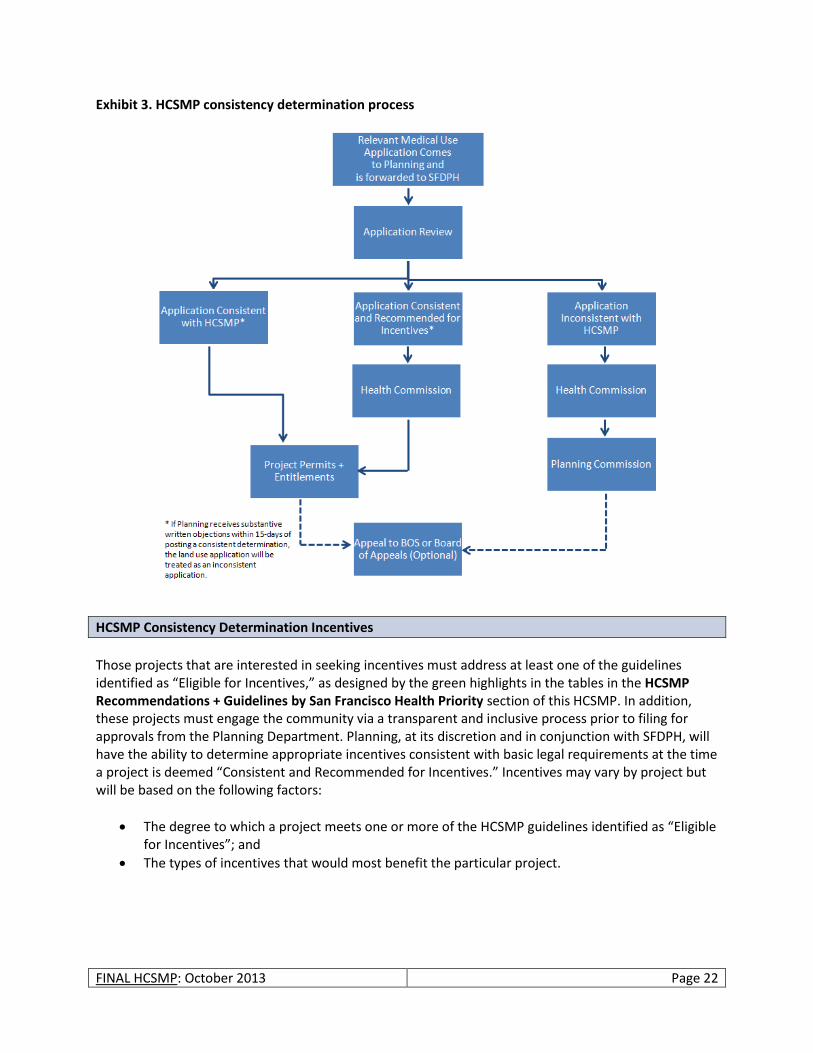
a. Consistent: Land use applications found to be “Consistent” with the HCSMP will be issued a Consistency Determination by the Planning Department. Following this determination, the Planning Department will post the Consistency Determination on its website for public comment. If, within 15 days of online posting, the Planning Department receives no substantive written objections to the application, the Consistency Determination will become final; however, if the Planning Department receives substantive written objections during the 15-day public comment period, the land use application will be treated as an inconsistent application.
b. Consistent and Recommended for Incentives: Land use applications that SFDPH staff recommends as “Consistent and Recommended for Incentives” will be forwarded to the Health Commission for review at a public hearing. If the Health Commission finds the application to be “Consistent and Recommended for Incentives,” the application will undergo a similar review process as described for Consistent Applications. However, in addition, these applications will be reviewed by Planning and SFDPH to determine appropriate project incentives, based on the project’s health care benefits (see HCSMP Consistency Determination Incentives section below).
c. Inconsistent: Land use applications that SFDPH staff recommends as “Inconsistent” with the HCSMP will be forwarded to the Health Commission for review at a public hearing. If the Health Commission finds the application to be consistent with the HCSMP, it will issue findings to this effect. If the Health Commission finds the application to be inconsistent, it will make recommendations to achieve consistency. The Health Commission must submit its findings or recommendations to the Planning Commission within 30 days of receipt of the application. The Planning Commission must hold a public hearing within 30 days of receiving the findings or recommendations from the Health Commission (or at the same time as it considers other entitlements associated with the application) and make a determination as to whether or not to issue a Consistency Determination. The Planning Department may not approve any permit or entitlements for a medical use project that does not have a Consistency Determination unless the Planning Commission finds countervailing public policy considerations that justify such approval.
Appeals Any person may file an appeal within 30 days of the issuance or denial of a Consistency Determination. If the Board of Supervisors has appeal authority to review an associated entitlement, the appeal should be made to the Board of Supervisors. In all other cases, the appeal should be filed with the San Francisco Board of Appeals. The Board of Supervisors and the Board of Appeals have the authority to reverse the Planning Department’s or Planning Commission’s decision.
FINAL HCSMP: October 2013 Page 22
Exhibit 3. HCSMP consistency determination process
HCSMP Consistency Determination Incentives
Those projects that are interested in seeking incentives must address at least one of the guidelines identified as “Eligible for Incentives,” as designed by the green highlights in the tables in the HCSMP Recommendations + Guidelines by San Francisco Health Priority section of this HCSMP. In addition, these projects must engage the community via a transparent and inclusive process prior to filing for approvals from the Planning Department. Planning, at its discretion and in conjunction with SFDPH, will have the ability to determine appropriate incentives consistent with basic legal requirements at the time a project is deemed “Consistent and Recommended for Incentives.” Incentives may vary by project but will be based on the following factors:
The degree to which a project meets one or more of the HCSMP guidelines identified as “Eligible for Incentives”; and
The types of incentives that would most benefit the particular project.
FINAL HCSMP: October 2013 Page 23
HCSMP Planning Framework
HCSMP Task Force
SFDPH and Planning convened a 41-member HCSMP Task Force to guide the HCSMP’s development. Comprised of a broad range of community stakeholders representing health care consumers, community advocacy groups, labor, hospitals, and more, the HCSMP Task Force served as an advisory body charged with developing preliminary HCSMP recommendations that reflected both relevant data and community feedback. Ms. Roma Guy and Dr. Tomás Aragón co-chaired the Task Force, providing guidance and leadership throughout the HCSMP’s development. Membership Selection and Representation The San Francisco Department of Public Health, with input from the Department of Planning, other City departments, and non-governmental entities, took primary responsibility for selecting a HCSMP Task Force that reflected San Francisco’s diverse communities. The 41-member Task Force represented the following entities:
African American Health Disparities Project
African American Leadership Group
AIDS Housing Alliance
Asian Pacific Islander Health Parity Coalition
California Nurses Association
California Pacific Medical Center
Chicano/Latino/Indígena Health Equity Coalition
Chinese Hospital
Chinese Progressive Association
Consumers and Community At-Large
Hospital Council of Northern California
Human Services Agency
Human Services Network
Independent Living Resource Center
Kaiser Permanente
LGBT Executive Directors Association
Long-Term Care Coordinating Council
Mental Health Association of San Francisco
Mission Neighborhood Health Center
National Union of Healthcare Workers
Northeast Medical Services
Planning for Elders in the Central City
Saint Francis Memorial Hospital
San Francisco Chamber of Commerce
San Francisco Community Clinic Consortium
The IMP-HCSMP Connection An Institutional Master Plan (IMP) is a document that describes existing and anticipated institutional development. In San Francisco, certain medical institutions and post-secondary educational institutions must file IMPs with the Planning Department and update them at least every two years. Medical institutions subject to the IMP requirement that propose any change to inpatient facilities (including general acute care hospitals), are additionally subject to review and comment by a “qualified health planner” retained by SFDPH. The health planner analyzes such change and its “relationship to citywide healthcare needs.” Upon adoption of the HCSMP by the Board of Supervisors, SFDPH-retained health planners will reflect HCSMP findings in their review of, and comment on, such new and updated IMPs. It is anticipated that highlighting the degree of alignment between IMPs and the HCSMP will lead more institutional medical projects to address San Francisco’s identified long-term healthcare needs, with a focus on health equity and vulnerable populations. It will also provide medical institutions with greater certainty about the consistency of the projects identified in their IMP.
FINAL HCSMP: October 2013 Page 24
San Francisco Department of Public Health
San Francisco General Hospital and Trauma Center
San Francisco Health Commission
San Francisco Health Plan Advisory Committee
San Francisco Medical Society
San Francisco Municipal Transportation Agency
San Francisco Planning Department
San Francisco Unified School District
Service Employees International Union, Local 1021
Sister Mary Philippa Health Center, St. Mary’s Medical Center
Small Business
Transgender Law Center
University of California, San Francisco Medical Center
Please see Appendix C for a complete list of all HCSMP Task Force members and, where applicable, their alternates. Responsibilities To assist in the HCSMP’s development, HCSMP Task Force members agreed to fulfill the following responsibilities:
Participate in 10 public meetings in the community between July 2011 and May 2012,
Review relevant data, research, and analysis,
Inform the HCSMP’s development with health care expertise,
Solicit community participation and hear public comment, and
Develop preliminary community-informed recommendations for consideration by the San Francisco Departments of Public Health and Planning.
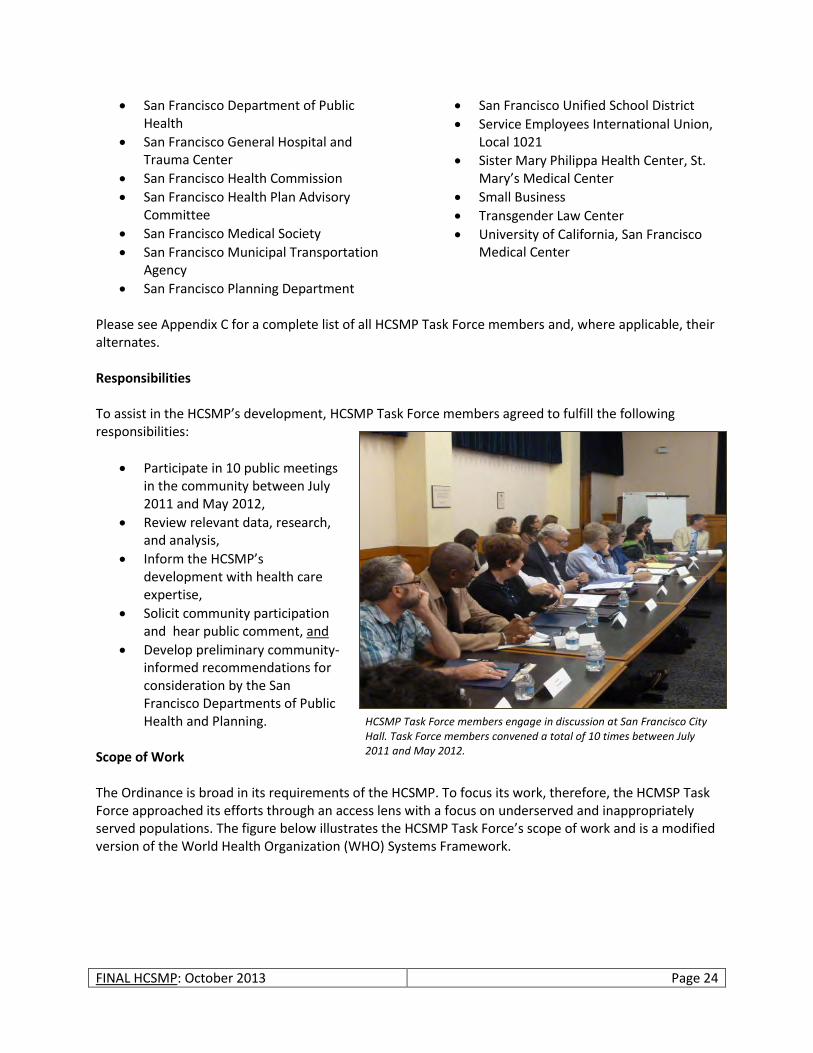
Scope of Work The Ordinance is broad in its requirements of the HCSMP. To focus its work, therefore, the HCMSP Task Force approached its efforts through an access lens with a focus on underserved and inappropriately served populations. The figure below illustrates the HCSMP Task Force’s scope of work and is a modified version of the World Health Organization (WHO) Systems Framework.
HCSMP Task Force members engage in discussion at San Francisco City Hall. Task Force members convened a total of 10 times between July 2011 and May 2012.
FINAL HCSMP: October 2013 Page 25
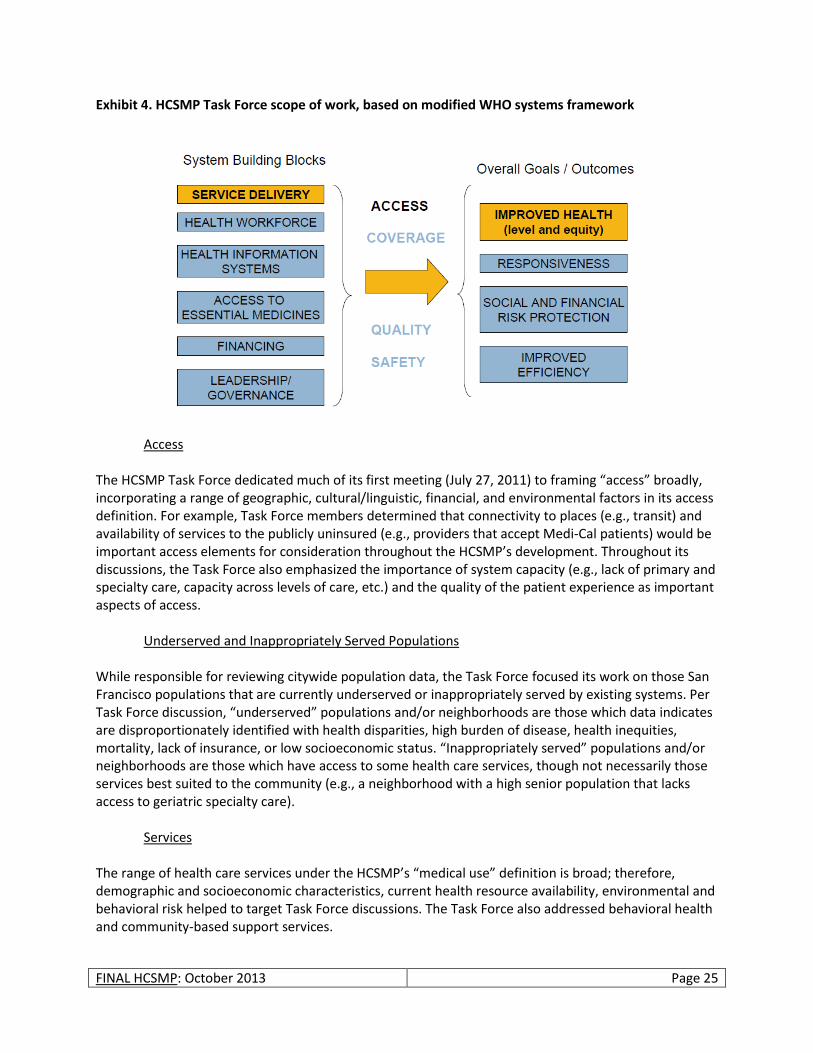
Exhibit 4. HCSMP Task Force scope of work, based on modified WHO systems framework
Access The HCSMP Task Force dedicated much of its first meeting (July 27, 2011) to framing “access” broadly, incorporating a range of geographic, cultural/linguistic, financial, and environmental factors in its access definition. For example, Task Force members determined that connectivity to places (e.g., transit) and availability of services to the publicly uninsured (e.g., providers that accept Medi-Cal patients) would be important access elements for consideration throughout the HCSMP’s development. Throughout its discussions, the Task Force also emphasized the importance of system capacity (e.g., lack of primary and specialty care, capacity across levels of care, etc.) and the quality of the patient experience as important aspects of access.
Underserved and Inappropriately Served Populations While responsible for reviewing citywide population data, the Task Force focused its work on those San Francisco populations that are currently underserved or inappropriately served by existing systems. Per Task Force discussion, “underserved” populations and/or neighborhoods are those which data indicates are disproportionately identified with health disparities, high burden of disease, health inequities, mortality, lack of insurance, or low socioeconomic status. “Inappropriately served” populations and/or neighborhoods are those which have access to some health care services, though not necessarily those services best suited to the community (e.g., a neighborhood with a high senior population that lacks access to geriatric specialty care).
Services The range of health care services under the HCSMP’s “medical use” definition is broad; therefore, demographic and socioeconomic characteristics, current health resource availability, environmental and behavioral risk helped to target Task Force discussions. The Task Force also addressed behavioral health and community-based support services.

FINAL HCSMP: October 2013 Page 26
Guiding Principles Acknowledging the importance of framing its work with shared values, the HCSMP Task Force identified the following “guiding principles” at the group’s launch meeting on July 27, 2011:
Health care is a human right. Strive to eliminate health inequities and disparities.
Keep discussions transparent and informed by data.
Approach the HCSMP through a lens of cultural competency and consideration for special populations (e.g., multi-diagnosed persons).
Consider community health impacts – not just individual outcomes.
Promote wellness and prevention as well as health care services.
Consider the role of geography (where we live, where services are) when planning to improve health outcomes.
Consider the role of financing in health care services and outcomes.
Plan with an eye to future policy (e.g., federal Health Reform), health trends (e.g., health information technology) and San Francisco’s changing population.
Consultant
SFDPH retained consulting services from Harder + Company Community Research (Harder + Company) to support the HCSMP Task Force planning effort and to conduct community research and data analysis .
HCSMP Task Force Planning Support
Harder + Company provided planning assistance to support the work of the HCSMP Task Force. In broad terms, Harder + Company:
Convened and facilitated 10 HCSMP Task Force meetings that took place between July 2011 and May 2012. Four of these meetings took place at different neighborhood locations throughout San Francisco to facilitate community participation. Four other meetings engaged the Task Force and members of the public on specific policy issues related to health care services and access.
Prepared and distributed meeting materials to Task Force members and the public. For example, Harder collected and analyzed neighborhood data for presentation before the HCSMP Task Force.
Harder tailored the data presentations to the specific neighborhoods in which the Task Force meetings took place. (Please see Appendix D for all Neighborhood-Specific Health Profiles.)
Recorded, summarized and distributed written notes from all HCSMP Task Force meetings, highlighting key meeting activities and identified themes and recommendations.
Community Research and Analysis Harder + Company conducted the community research and data analysis necessary to complete the four required HCSMP assessments. Specifically, Harder + Company:
Identified and obtained relevant information (e.g., demographic, health status, burden of disease, distribution of services, utilization, etc.) from various secondary data sources, both public and private, to gain an understanding of San Francisco’s health status.
FINAL HCSMP: October 2013 Page 27
Applied high-level data analysis techniques – including Geographic Information Systems (GIS) – to collected data and interpret data results to assess the health care needs of the community.
Designed and field-tested an appropriate focus group protocol.
Convened and facilitated five focus groups of San Francisco health care consumers to infuse the HCSMP with a consumer perspective.
Developed neighborhood-specific data and health profiles (Appendix D) that (1) incorporated secondary data on population health, health status, and access to health care, and (2) included community stakeholder perspectives.
For more detailed information on the HCSMP data collection process and methodology, please see the Methodology and Development section of this report below.
FINAL HCSMP: October 2013 Page 28
METHODOLOGY AND DEVELOPMENT
SFDPH and Planning relied on both quantitative and qualitative data methods to complete the HCSMP assessments mandated by the Ordinance. To ensure a collaborative process – and to ensure the presence of community voice in the final HCSMP – SFDPH and Planning used as their framework Mobilizing for Action through Planning and Partnerships, a community-driven strategic planning process developed by the National Association of County and City Health Officials (NACCHO).5 MAPP core indicators, including the 25 indicators recommended in the Institute of Medicine report “Improving Health in the Community,” served as the starting point for HCSMP data collection.6
Quantitative
Harder + Company Community Research Data Collection and Analysis
Harder + Company conducted quantitative data collection and analysis required for the HCSMP. Data collection and analysis informed both the neighborhood meetings of the HCSMP Task Force as well as the more comprehensive Community Health Status Assessment, the full text of which is available on the SFDPH website. Framework + Indicator Selection Mobilizing for Action Through Planning and Partnerships (MAPP) The Community Health Status Assessment (CHSA), Harder + Company’s primary HCSMP data deliverable, was developed in 2011 and 2012 using the National Association of County and City Health Officials’ MAPP framework. MAPP is a community-wide strategic planning tool for improving community health. It has been implemented nationally by many public health departments to help communities identify and prioritize public health issues and identify resources to address them. MAPP requires completion of four assessments, including the CHSA. CHSA data serves as the foundation for analyzing and identify community health issues and trends, allowing San Francisco to see where it stands compared to other counties, California, and the nation. San Francisco’s CHSA comprises a core list of health indicators in 10 broad-based categories that are informed by MAPP and that were vetted with the HCSMP Data Advisory Committee, described below. HCSMP Data Advisory Committee To assist Harder + Company in its data collection efforts, SFDPH assembled a Data Advisory Committee consisting of 11 persons including representatives from the San Francisco Departments of Public Health and Planning and the HCSMP Task Force. Led by Harder + Company, the data advisory group met a total of eight times between July 2011 and June 2012 to:
Identify and secure secondary data sources relevant to the selected core indicators.
Select additional indicators and data sources needed to accurately assess San Francisco’s health and wellness.
Determine how best to analyze accessible data (e.g., by age vs. race etc.) to identify existing health care gaps and needs.
FINAL HCSMP: October 2013 Page 29
Identify existing data collection needs. (I.e., is there telling health data that SFDPH should track but is not currently?)
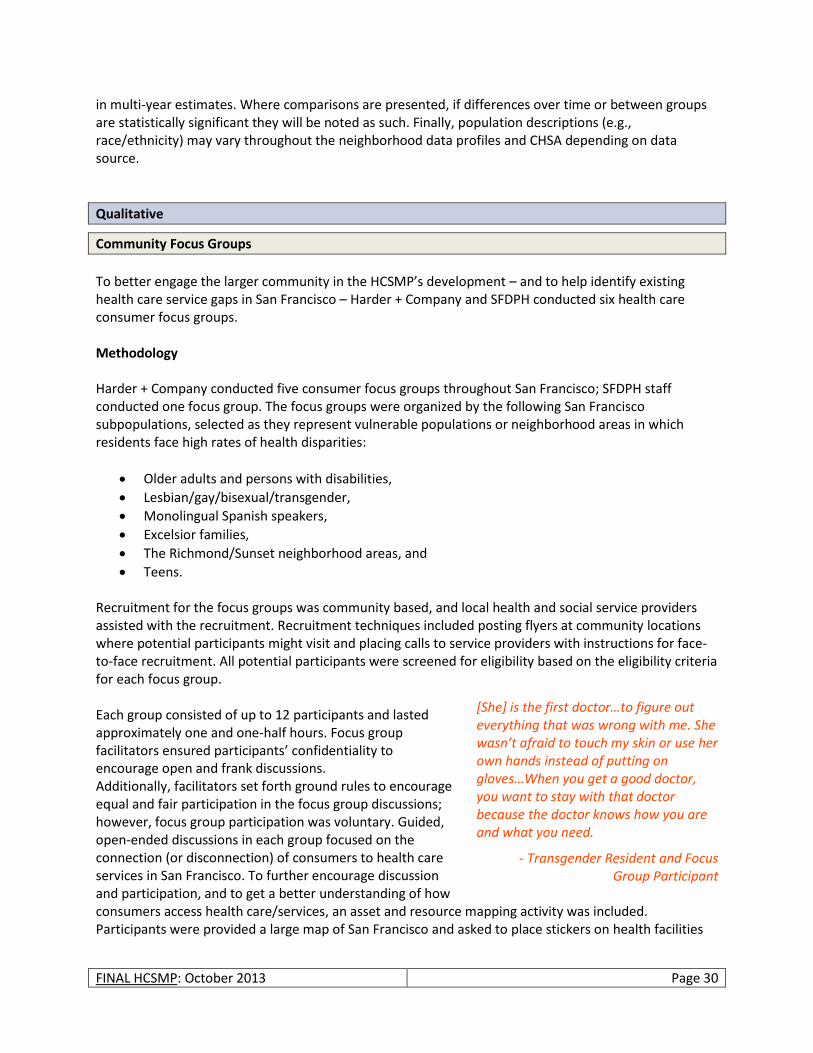
Review data comprising the four neighborhood profiles as well as the CHSA. In addition to meetings, individual data advisory group members met with Harder + Company staff as needed to provide missing data and analytical support. Methodology With support from SFDPH and the HCSMP Data Advisory Committee, Harder + Company conducted a comprehensive review of secondary data sources to obtain the most current and reliable data for all HCSMP deliverables. Secondary data sources and resources include, but are not limited to the US Census 2000 and 2010, the American Community Survey 2009 and 2010, the California Department of Public Health (CDPH), the California Department of Finance (DOF), the California Office of Statewide Health Planning and Development (OSHPD), the California Department of Education (CDE), SFDPH, SFDPH’s Sustainable Communities Index (SCI, formerly known as the Healthy Development Measurement Tool (HDMT)), Health Matters in San Francisco, the California Health Interview Survey (CHIS), the CDC’s Behavioral Risk Factor Surveillance System (BRFSS), Health Resources and Services Administration (HRSA), Healthy People 2020 (HP 2020), the 2012 County Health Rankings, and Community Health Status Indicators. Harder + Company used the most current data available to complete both the neighborhood data profiles and the Community Health Status Assessment (CHSA); data considered preliminary were not used. Harder + Company exported these data in database formats, cleaned all data, and applied basic statistical techniques to the data to analyze trends. Where applicable and appropriate, benchmark or target data were included as were state- and national-level data – as well as similar data from other California counties – for the purpose of comparison. All data were carefully reviewed and analyzed to ensure that they accurately address each of the indicators and category areas. Sample sizes for datasets were examined to ensure that they were large enough for analyses, particularly for subpopulations. To ensure sufficient sample sizes, Harder + Company, in some cases, aggregated data across several years. In other cases for which it was not possible to aggregate data across multiple years, Harder + Company either did not present data or presented the indicator as “statistically unstable.” Data Limitations Data compiled from OSHPD to examine health care utilization throughout San Francisco describes individuals who access some kind of health service based on patient discharge data or patient registration data. Therefore, this data does not capture those who did not access health services or who accessed health services at a health agency whose data is not collected or reported to OSHPD. Also, although US Census 2010 data were released between the end of 2011 and early 2012, all of the data required for this report were not yet available such as the descriptive breakdown of poverty status in San Francisco. In those instances, data from the American Community Survey 2009 and 2010, which are estimates based on the US Census and calculated by the US Census Bureau, were used and cited as such. For community health/population interviews such as CHIS and BRFSS, many survey items are rotated and asked in alternate years; therefore, results from those sources may be presented in varying years or
FINAL HCSMP: October 2013 Page 30
in multi-year estimates. Where comparisons are presented, if differences over time or between groups are statistically significant they will be noted as such. Finally, population descriptions (e.g., race/ethnicity) may vary throughout the neighborhood data profiles and CHSA depending on data source.
Qualitative
Community Focus Groups
To better engage the larger community in the HCSMP’s development – and to help identify existing health care service gaps in San Francisco – Harder + Company and SFDPH conducted six health care consumer focus groups. Methodology Harder + Company conducted five consumer focus groups throughout San Francisco; SFDPH staff conducted one focus group. The focus groups were organized by the following San Francisco subpopulations, selected as they represent vulnerable populations or neighborhood areas in which residents face high rates of health disparities:
Older adults and persons with disabilities,
Lesbian/gay/bisexual/transgender,
Monolingual Spanish speakers,
Excelsior families,
The Richmond/Sunset neighborhood areas, and
Teens.
Recruitment for the focus groups was community based, and local health and social service providers assisted with the recruitment. Recruitment techniques included posting flyers at community locations where potential participants might visit and placing calls to service providers with instructions for face-to-face recruitment. All potential participants were screened for eligibility based on the eligibility criteria for each focus group. Each group consisted of up to 12 participants and lasted approximately one and one-half hours. Focus group facilitators ensured participants’ confidentiality to encourage open and frank discussions. Additionally, facilitators set forth ground rules to encourage equal and fair participation in the focus group discussions; however, focus group participation was voluntary. Guided, open-ended discussions in each group focused on the connection (or disconnection) of consumers to health care services in San Francisco. To further encourage discussion and participation, and to get a better understanding of how consumers access health care/services, an asset and resource mapping activity was included. Participants were provided a large map of San Francisco and asked to place stickers on health facilities
[She] is the first doctor…to figure out everything that was wrong with me. She wasn’t afraid to touch my skin or use her own hands instead of putting on gloves…When you get a good doctor, you want to stay with that doctor because the doctor knows how you are and what you need.
- Transgender Resident and Focus Group Participant

FINAL HCSMP: October 2013 Page 31
that they access. All participants, with the exception of members of the teen focus group conducted by SFDPH, were provided a grocery store gift card at the conclusion of the focus group. Content Analysis Content analysis was used to analyze the qualitative focus group data. Content analysis is a systematic approach used to organize, analyze and interpret narrative data. It incorporates the identification and extraction of themes and a coding scheme to analyze the qualitative data. For each Harder+Company-conducted focus group, complete transcripts along with notes were generated; SFDPH generated only notes from the teen focus group. Prior to completing the analysis, reliability testing was conducted on the coding of the qualitative data. This process was conducted on each of the six focus groups. Emergent Themes HCSMP community focus groups yielded the following themes: Barriers to Health Care Participants noted that they had experienced the following barriers to care in San Francisco:
Wait times to get an appointment to see a health service provider.
Transportation to health services and travel times. Transgender as well as the elderly and disabled participants described transportation as a barrier, and Excelsior and Sunset/Richmond residents described distance and finding transportation to health services as barriers.
Complications with health insurance.
Cost of health care including specific health services/treatments and health insurance premiums.
Lack of linguistic competence (language barriers) in hospitals. Quality of Health Care Focus group participants, overall, expressed satisfaction with the quality of care they receive.
Once they are able to access health services, participants expressed general satisfaction with the health care they receive.
Chinese- and Spanish-speaking patients described being satisfied with their care once they found a doctor that spoke their language.
Health Care Needs While generally satisfied with care once they access it, focus group participants noted a variety of unmet health needs experienced in San Francisco:
Mental and behavioral health services, particularly among transgender and monolingual Spanish populations.
Affordable, accessible dental care for adults.
FINAL HCSMP: October 2013 Page 32
Spanish-speaking patients described the need for more “promotoras” (peer health advocates).
An easy way to find out about all of the different health services and health resources in San Francisco from types of services to locations to hours of operation.
Other Needs Among the elderly, disabled, and the transgender focus group participants, clean, safe and affordable housing was described as a priority.
HCSMP Task Force
The San Francisco Departments of Public Health and Planning convened a 41-member HCSMP Task Force to guide the HCSMP’s development. Comprised of a broad range of community stakeholders representing health care consumers, community advocacy groups, labor, hospitals, and more, the HCSMP Task Force served as an advisory body charged with developing preliminary HCSMP recommendations that reflected both relevant data and community feedback. Ms. Roma Guy and Dr. Tomás Aragón co-chaired the Task Force, providing guidance and leadership throughout the HCSMP’s development. Please see Appendix C for a complete list of all HCSMP Task Force members and alternates. The HCSMP Task Force held a total of 10 meetings – six full Task Force meetings, four of which were held in different San Francisco neighborhoods, and four issue-based meetings as described below. Summary of Full Task Force Meetings and Process Between July 2011 and May 2012, the HCSMP Task Force convened six times for a series of public meetings held at different community locations. The first and final meetings took place at San Francisco City Hall in the late afternoon; Meetings 2 through 5 took place in different neighborhood locations to enable community member attendance. Please see below for a summary of all meeting dates, times, locations, and Task Force discussions.
Meeting 1 (July 27, 2011 ▪ 2 – 4:30 pm ▪ San Francisco City Hall): Following opening remarks by SFDPH Director, Barbara A. Garcia, and Task Force Co-chairs, Dr. Tomás Aragón and Ms. Roma Guy, Task Force members received an overview of San Francisco Ordinance No. 300-10 and the various HCSMP requirements. Harder + Company then framed the work of the Task Force and outlined Task Force members’ role and responsibilities throughout the HCSMP’s development. Task Force members then discussed the body’s guiding principles, identified key elements of health care access, and shared ways in which they would support community outreach and engagement.
Meeting 2 (September 22, 2011 ▪ 5 – 7:30 pm ▪ Bernal Heights Neighborhood Center, Bernal Heights): The HCSMP Task Force held its first neighborhood meeting at the Bernal Heights Neighborhood Center, and the meeting focused discussion and presented data on the following neighborhoods: Bernal Heights, Mission, Outer Mission, Excelsior, and Ocean View. Task Force
[The “promotora”] is the one who schedules my health care appointments and also refers me to other places where I can get health-related assistance. She is with me during my appointment and helps me get there. She makes my health care services easier. She makes sure I take my medication the right way.
- Spanish-speaking Mission Resident and Focus Group Participant
FINAL HCSMP: October 2013 Page 33
Chairs Dr. Tomás Aragón and Ms. Roma Guy opened the meeting, followed by comments from Supervisor David Campos in whose district the meeting took place. The Task Force allocated substantial time to public comment, which, coupled with Task Force discussion and presented data, generated the following key themes, including the importance of:
o Health care facility proximity to the patient’s home neighborhood; o Access to culturally and linguistically competent health care services – particularly for
non-native English speakers. o Outreach and education regarding available services to ensure that health care
consumers access the care they need in the most appropriate setting. o Forming partnerships with community-based organizations to expand health care
access. o Health care technology to expand health care access beyond the confines of brick and
mortar health care facilities. o Extending health care facility hours to accommodate working persons and patients.
Task Force members focused their discussion on lessons learned from the Harder + Company neighborhood data presentation and public comment.
Meeting 3 (December 3, 2011 ▪ 10 am – 12:30 pm ▪ Gordon J. Lau Elementary School, Chinatown): The HCSMP Task Force held its second neighborhood meeting at the Gordon J. Lau Elementary School, and the meeting focused discussion and presented data on the following neighborhoods: Chinatown, Downtown/Civic Center, and South of Market. Task Force Chairs Dr. Tomás Aragón and Ms. Roma Guy opened the meeting, and the Task Force allocated substantial time to public comment, which, coupled with Task Force discussion and presented data, generated the following key themes, including the importance of:
o Easy geographic access to primary care services. o The appropriate use of services. For example, ready access to primary and urgent care
services may curb inappropriate use of emergency rooms. o Access to culturally and linguistically competent services that reflect the patient
population. o Providing services that reflect neighborhood and community needs. For example, some
neighborhoods need easy access to family and perinatal services because of their resident composition.
o Health insurance coverage (or lack thereof) when deciding where to seek health care services.
o Support services (e.g., escorting high-need patients to medical appointments) to help vulnerable populations access health care services appropriately.
o Creating safe environments around health care facilities. Unsafe environments may deter residents from seeking care at otherwise accessible facilities.
Task Force members focused their discussion on lessons learned from the Harder + Company neighborhood data presentation and public comment.
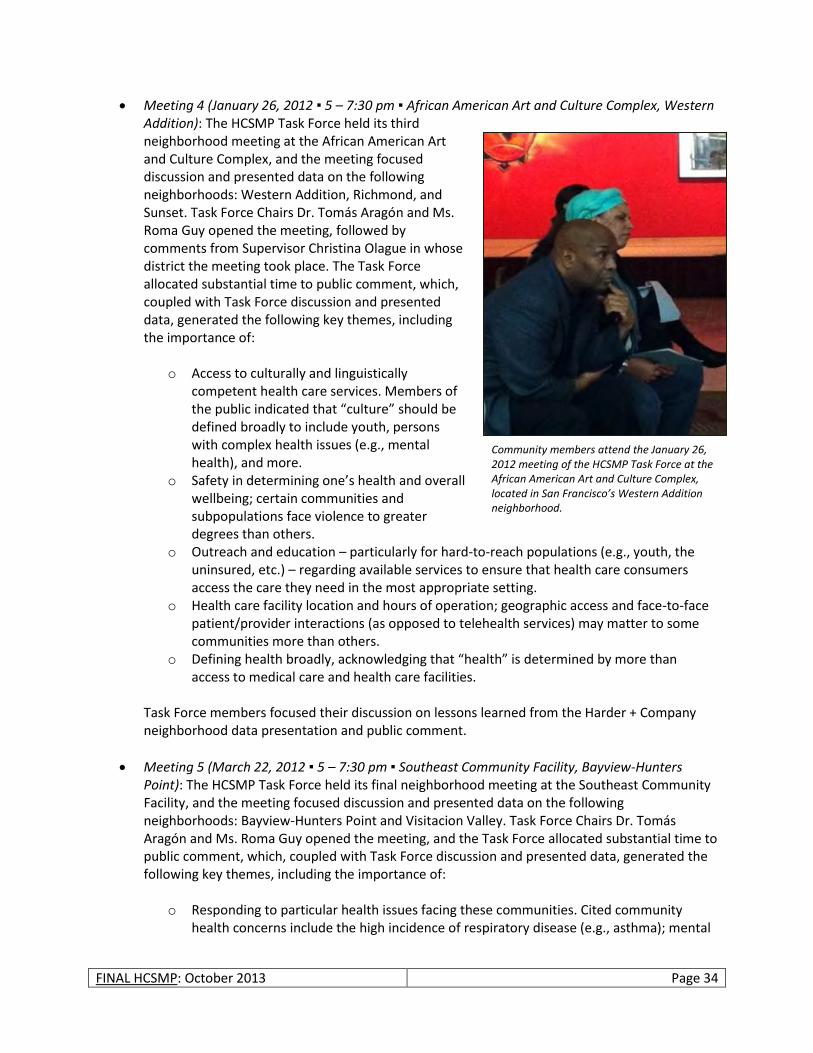
FINAL HCSMP: October 2013 Page 34
Meeting 4 (January 26, 2012 ▪ 5 – 7:30 pm ▪ African American Art and Culture Complex, Western Addition): The HCSMP Task Force held its third neighborhood meeting at the African American Art and Culture Complex, and the meeting focused discussion and presented data on the following neighborhoods: Western Addition, Richmond, and Sunset. Task Force Chairs Dr. Tomás Aragón and Ms. Roma Guy opened the meeting, followed by comments from Supervisor Christina Olague in whose district the meeting took place. The Task Force allocated substantial time to public comment, which, coupled with Task Force discussion and presented data, generated the following key themes, including the importance of:
o Access to culturally and linguistically competent health care services. Members of the public indicated that “culture” should be defined broadly to include youth, persons with complex health issues (e.g., mental health), and more.
o Safety in determining one’s health and overall wellbeing; certain communities and subpopulations face violence to greater degrees than others.
o Outreach and education – particularly for hard-to-reach populations (e.g., youth, the uninsured, etc.) – regarding available services to ensure that health care consumers access the care they need in the most appropriate setting.
o Health care facility location and hours of operation; geographic access and face-to-face patient/provider interactions (as opposed to telehealth services) may matter to some communities more than others.
o Defining health broadly, acknowledging that “health” is determined by more than access to medical care and health care facilities.
Task Force members focused their discussion on lessons learned from the Harder + Company neighborhood data presentation and public comment.
Meeting 5 (March 22, 2012 ▪ 5 – 7:30 pm ▪ Southeast Community Facility, Bayview-Hunters Point): The HCSMP Task Force held its final neighborhood meeting at the Southeast Community Facility, and the meeting focused discussion and presented data on the following neighborhoods: Bayview-Hunters Point and Visitacion Valley. Task Force Chairs Dr. Tomás Aragón and Ms. Roma Guy opened the meeting, and the Task Force allocated substantial time to public comment, which, coupled with Task Force discussion and presented data, generated the following key themes, including the importance of:
o Responding to particular health issues facing these communities. Cited community health concerns include the high incidence of respiratory disease (e.g., asthma); mental
Community members attend the January 26, 2012 meeting of the HCSMP Task Force at the African American Art and Culture Complex, located in San Francisco’s Western Addition neighborhood.
FINAL HCSMP: October 2013 Page 35
health issues, particularly violence-related trauma; environmental health hazards; and the need for more long-term care and housing options for older residents.
o Addressing barrier to care issues specific to these communities. Cited access barriers include but are not limited to health insurance coverage; public transportation, particularly the issue of lengthy travel times between home and health care; cultural and linguistic appropriateness; limited health literacy, highlighted as being a particular concern for San Francisco’s Black/African American population as well as those with limited English proficiency; unemployment/lack of economic opportunity; violence and related trauma, both mental and physical; and lack of adequate, affordable housing.
o Increasing the number of existing health services in the community and/or increasing the capacity of existing facilities. In terms of capacity, members of the public suggested the need for incentives to draw more providers to the community.
o Increasing social connectedness within the community. o Increasing access to services missing in these communities, including basic lab services
(e.g., phlebotomy) and radiology. o Enforcing environmental regulations to ensure the community’s health.
Meeting 6 (May 24, 2012 ▪ 2 – 4:30 pm ▪ San Francisco City Hall): The HCSMP Task Force concluded its work, discussing a draft of its report presenting final recommendations for consideration by SFDPH and Planning.
Harder + Company facilitated all HCSMP Task Force meetings and, with SFDPH support, also developed all meeting-related materials including agendas, neighborhood health profiles, and post-meeting minutes. Public Comment at Full HCSMP Task Force Meetings To ensure transparency and opportunity for community feedback, all full HCSMP Task Force meetings took place in different community locations – most in the evening – and allowed substantial time for public comment. Harder + Company facilitated each meeting’s public comment period in adherence to designated guidelines. While allowed to focus their comments on any topic within the HCSMP Task Force’s purview, facilitators encouraged community members to address the following questions:
What is working in terms of health care access in your neighborhood?
Who in your neighborhood has trouble getting health care and what do they need?
What would help increase health access for people in your neighborhood? Emergent themes from each meeting’s public comment period informed HCSMP Task Force discussion as well as the recommendations finalized at the body’s final meeting on May 24, 2012.
Violence has shaken up our children’s lives. It is hard for them to function. We need mental health services and counselors for children to speak with. We need more psychiatrists in the schools. The children are suffering.
- Bayview Resident
FINAL HCSMP: October 2013 Page 36
Summary of Task Force Issue Meetings and Process
In addition to six meetings of the full HCSMP Task Force, members supplemented the full meeting schedule with four issue-based meetings open to all interested members of the HCSMP Task Force and members of the public. These meetings served to allow interested Task Force members to discuss the implications of key policy issues on health care access as highlighted in the Ordinance. Please see below for a summary of all issue meeting dates, topics, and discussions. Please note that all issue-based meetings took place at San Francisco City Hall from 2 – 4:30pm on the designated date. While focused on Task Force member discussion, all issue meetings allowed limited time for public comment. SFDPH held primary responsibility for developing issue-based briefing papers and related presentations for the four issue meetings.
Issue Meeting 1, Impact of Federal Health Reform and California’s 1115 Medicaid Waiver on Patient Demand and Facility Capacity (October 27, 2011): The first HCSMP Issue Meeting focused on the impact of federal Health Reform and California’s 1115 Medicaid Waiver on patient demand and facility capacity. Task Force Co-Chair Ms. Roma Guy opened the meeting, followed by an issue-focused presentation by SFDPH. The meeting allowed substantive time for Task Force discussion, which yielded the following key themes, including the importance of:
o Outreach and education for hard-to-reach populations and underserved communities. o Developing a physician population willing to accept new Medi-Cal patients, the
uninsured, and other vulnerable populations. o Incentivizing integrated care, particularly for mental health services and long-term care. o Health information technology.
Toward the close of the first Issue Meeting, one person offered public comment, advocating for partnerships with community-based organizations for the purpose of outreach and education, such as informing people of available and appropriate services.
Issue Meeting 2, Health Care Financing (December 22, 2011): The second HCSMP Issue Meeting focused on the impact of health care finance – including anticipated changes to health care finance and reimbursement structures under Health Reform – on access to health care service in San Francisco. Task Force Co-Chair Ms. Roma Guy opened the meeting, followed by an issue-focused presentation by SFDPH. The meeting allowed substantive time for Task Force discussion, which yielded the following key themes, including the importance of:
o Recognizing that health care finance impacts the delivery of and access to quality health care services.
o Prioritizing the health care service needs of San Francisco’s vulnerable populations (e.g., Medi-Cal recipients, the uninsured, San Francisco’s growing elderly population, those with mental health and substance use issues).
o Social determinants of health when identifying and addressing health care access issues. o Meeting patients where they are in terms of service provision (e.g., offering critical
services outside of traditional business hours, providing culturally competent services to San Francisco’s diverse populations, etc.).
o Collaboration between and among varied service providers (e.g., schools, the medical community, community-based organizations) to meet San Francisco’s health and wellness needs – particularly in the current era of declining resources.
FINAL HCSMP: October 2013 Page 37
Issue Meeting 3, Health Care Technology and Innovation (February 23, 2012): The third HCSMP Issue Meeting focused on health information technology (HIT), such as the adoption of Electronic Health Records, and innovations that promise to alter the health care landscape going forward. Task Force Co-Chairs Ms. Roma Guy and Dr. Tomás Aragón opened the meeting, followed by an issue-focused presentation by SFDPH. The meeting allowed substantive time for Task Force discussion, which yielded the following key themes, including the importance of:
o Promoting Electronic Health Record (EHR) systems that are interoperable and that capture key patient data. For example, EHRs should capture data that facilitate the provision of culturally and linguistically competent patient care.
o Facilitating receipt of Medicare and Medicaid EHR incentive payments for community clinics.
o Telehealth services in, potentially, transcending geographic barriers to care, provided such services are accessible to San Francisco’s vulnerable populations.
o Innovation in improving service delivery to eliminate health disparities and reduce costs. o Collaboration between medical providers and the community to leverage the strengths
of each partner for the benefit of community health. o Advancing an actionable Health in All Policies (HiAP) initiative in San Francisco to
address the social determinants of health that result in health inequities.
Issue Meeting 4, Connectivity (April 26, 2012): The fourth and final Issue Meeting addressed more fully access, or “connectivity,” gaps in San Francisco’s health care delivery system such as geographic access barriers to care that exist despite San Francisco’s small footprint and extensive transit system. The Issue Meeting also delved into connectivity gaps that result from residents’ health literacy and cultural/linguistics needs versus the existing health care system’s capacity to tailor care in a manner best suited to the patient. Task Force Co-Chairs Ms. Roma Guy and Dr. Tomás Aragón opened the meeting, followed by an issue-focused presentation by SFDPH. The meeting allowed substantive time for Task Force discussion, which yielded the following key themes, including the importance of:
o Ensuring that all San Franciscans have available a range of appropriate transportation options that enable them to reach their health care destinations safely, affordably, and in a timely manner.
o In transportation planning, assessing transit access to smaller clinics/health care facilities as well as to major hospitals.
o Navigation and support services – particularly for more vulnerable populations such as older adults, persons with disabilities, and those with behavioral health issues – in helping patients access appropriate, needed care.
o Health literacy and the need for culturally and linguistically appropriate care. o Location in terms of siting and accessing needed community health and wellness
services.
HCSMP Task Force Email Feedback
To encourage transparency and broad community participation throughout the HCSMP’s development, SFDPH created a HCSMP Task Force webpage and corresponding email address
FINAL HCSMP: October 2013 Page 38
([email protected]), which launched on July 21, 2011. Intended to offer community members another means by which to submit HCSMP feedback, SFDPH staff checked the HCSMP Task Force email account at least once weekly, responding to all questions in a timely manner. In all, the Task Force received two emails, both from the same sender, though SFDPH staff also received emails directly from stakeholders throughout the process. SFDPH disabled the HCSMP Task Force email address in June 2012 at the close of the Task Force’s work. The HCSMP Task Force webpage remains live and can be accessed via the SFDPH webpage.
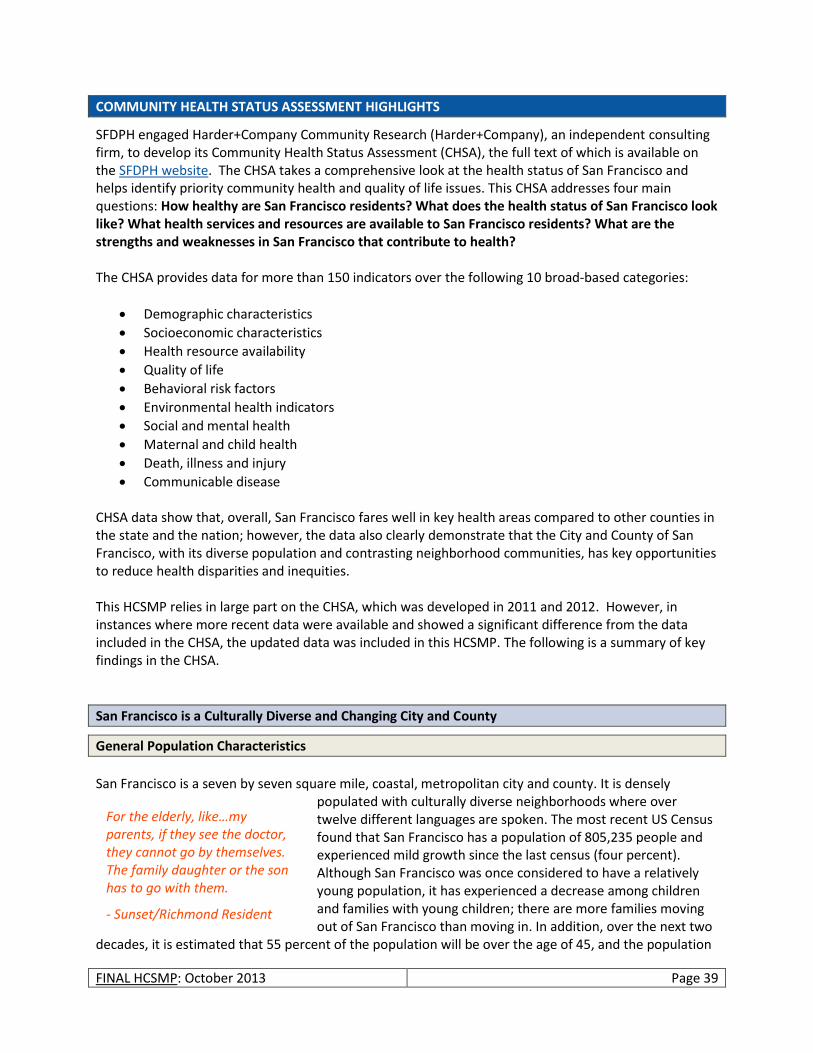
FINAL HCSMP: October 2013 Page 39
COMMUNITY HEALTH STATUS ASSESSMENT HIGHLIGHTS
SFDPH engaged Harder+Company Community Research (Harder+Company), an independent consulting firm, to develop its Community Health Status Assessment (CHSA), the full text of which is available on the SFDPH website. The CHSA takes a comprehensive look at the health status of San Francisco and helps identify priority community health and quality of life issues. This CHSA addresses four main questions: How healthy are San Francisco residents? What does the health status of San Francisco look like? What health services and resources are available to San Francisco residents? What are the strengths and weaknesses in San Francisco that contribute to health? The CHSA provides data for more than 150 indicators over the following 10 broad-based categories:
Demographic characteristics
Socioeconomic characteristics
Health resource availability
Quality of life
Behavioral risk factors
Environmental health indicators
Social and mental health
Maternal and child health
Death, illness and injury
Communicable disease CHSA data show that, overall, San Francisco fares well in key health areas compared to other counties in the state and the nation; however, the data also clearly demonstrate that the City and County of San Francisco, with its diverse population and contrasting neighborhood communities, has key opportunities to reduce health disparities and inequities. This HCSMP relies in large part on the CHSA, which was developed in 2011 and 2012. However, in instances where more recent data were available and showed a significant difference from the data included in the CHSA, the updated data was included in this HCSMP. The following is a summary of key findings in the CHSA.
San Francisco is a Culturally Diverse and Changing City and County
General Population Characteristics
San Francisco is a seven by seven square mile, coastal, metropolitan city and county. It is densely
populated with culturally diverse neighborhoods where over twelve different languages are spoken. The most recent US Census found that San Francisco has a population of 805,235 people and experienced mild growth since the last census (four percent). Although San Francisco was once considered to have a relatively young population, it has experienced a decrease among children and families with young children; there are more families moving out of San Francisco than moving in. In addition, over the next two
decades, it is estimated that 55 percent of the population will be over the age of 45, and the population
For the elderly, like…my parents, if they see the doctor, they cannot go by themselves. The family daughter or the son has to go with them.
- Sunset/Richmond Resident
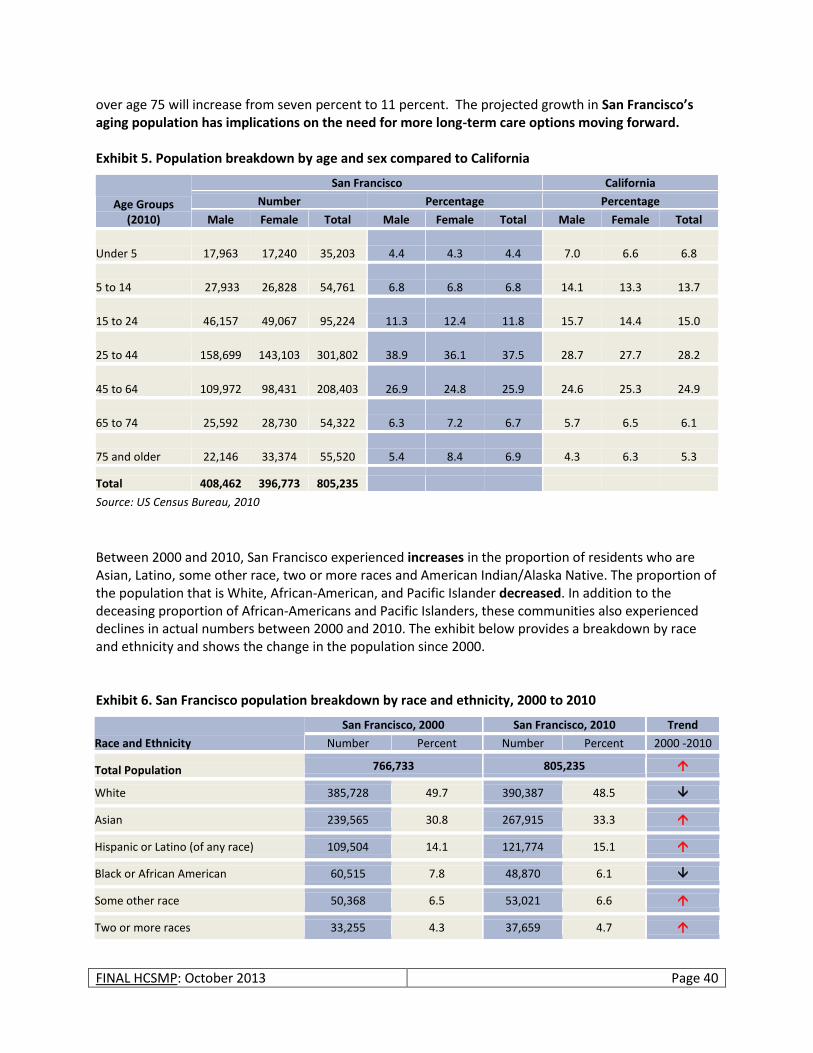
FINAL HCSMP: October 2013 Page 40
over age 75 will increase from seven percent to 11 percent. The projected growth in San Francisco’s aging population has implications on the need for more long-term care options moving forward. Exhibit 5. Population breakdown by age and sex compared to California
Age Groups (2010)
San Francisco California
Number Percentage Percentage
Male Female Total Male Female Total Male Female Total
Under 5 17,963 17,240 35,203
4.4 4.3 4.4 7.0 6.6 6.8
5 to 14 27,933 26,828 54,761
6.8 6.8 6.8 14.1 13.3 13.7
15 to 24 46,157 49,067 95,224
11.3 12.4 11.8 15.7 14.4 15.0
25 to 44 158,699 143,103 301,802
38.9 36.1 37.5 28.7 27.7 28.2
45 to 64 109,972 98,431 208,403
26.9 24.8 25.9 24.6 25.3 24.9
65 to 74 25,592 28,730 54,322
6.3 7.2 6.7 5.7 6.5 6.1
75 and older 22,146 33,374 55,520
5.4 8.4 6.9 4.3 6.3 5.3
Total 408,462 396,773 805,235
Source: US Census Bureau, 2010
Between 2000 and 2010, San Francisco experienced increases in the proportion of residents who are Asian, Latino, some other race, two or more races and American Indian/Alaska Native. The proportion of the population that is White, African-American, and Pacific Islander decreased. In addition to the deceasing proportion of African-Americans and Pacific Islanders, these communities also experienced declines in actual numbers between 2000 and 2010. The exhibit below provides a breakdown by race and ethnicity and shows the change in the population since 2000. Exhibit 6. San Francisco population breakdown by race and ethnicity, 2000 to 2010
Race and Ethnicity
San Francisco, 2000 San Francisco, 2010 Trend
Number Percent Number Percent 2000 -2010
Total Population 766,733 805,235
White 385,728 49.7 390,387 48.5
Asian 239,565 30.8 267,915 33.3
Hispanic or Latino (of any race) 109,504 14.1 121,774 15.1
Black or African American 60,515 7.8 48,870 6.1
Some other race 50,368 6.5 53,021 6.6
Two or more races 33,255 4.3 37,659 4.7
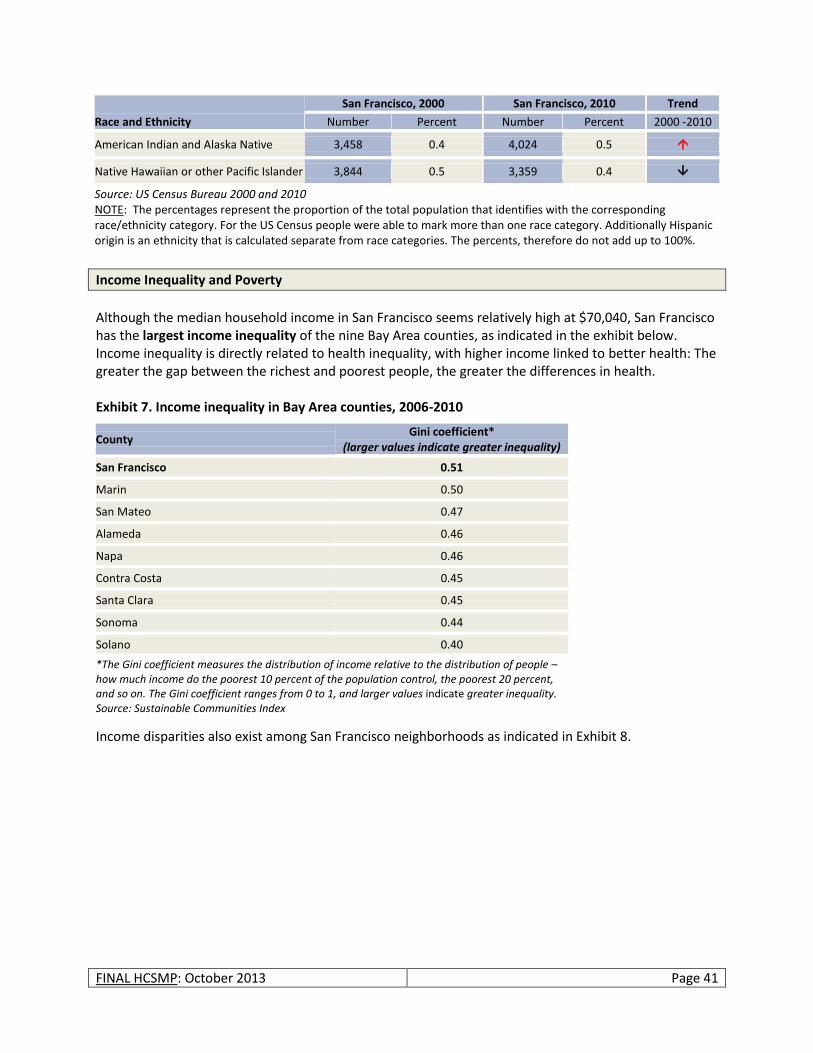
FINAL HCSMP: October 2013 Page 41
Race and Ethnicity
San Francisco, 2000 San Francisco, 2010 Trend
Number Percent Number Percent 2000 -2010
American Indian and Alaska Native 3,458 0.4 4,024 0.5
Native Hawaiian or other Pacific Islander 3,844 0.5 3,359 0.4
Source: US Census Bureau 2000 and 2010 NOTE: The percentages represent the proportion of the total population that identifies with the corresponding race/ethnicity category. For the US Census people were able to mark more than one race category. Additionally Hispanic origin is an ethnicity that is calculated separate from race categories. The percents, therefore do not add up to 100%.
Income Inequality and Poverty
Although the median household income in San Francisco seems relatively high at $70,040, San Francisco has the largest income inequality of the nine Bay Area counties, as indicated in the exhibit below. Income inequality is directly related to health inequality, with higher income linked to better health: The greater the gap between the richest and poorest people, the greater the differences in health. Exhibit 7. Income inequality in Bay Area counties, 2006-2010
Income disparities also exist among San Francisco neighborhoods as indicated in Exhibit 8.
County Gini coefficient*
(larger values indicate greater inequality)
San Francisco 0.51
Marin 0.50
San Mateo 0.47
Alameda 0.46
Napa 0.46
Contra Costa 0.45
Santa Clara 0.45
Sonoma 0.44
Solano 0.40
*The Gini coefficient measures the distribution of income relative to the distribution of people – how much income do the poorest 10 percent of the population control, the poorest 20 percent, and so on. The Gini coefficient ranges from 0 to 1, and larger values indicate greater inequality. Source: Sustainable Communities Index
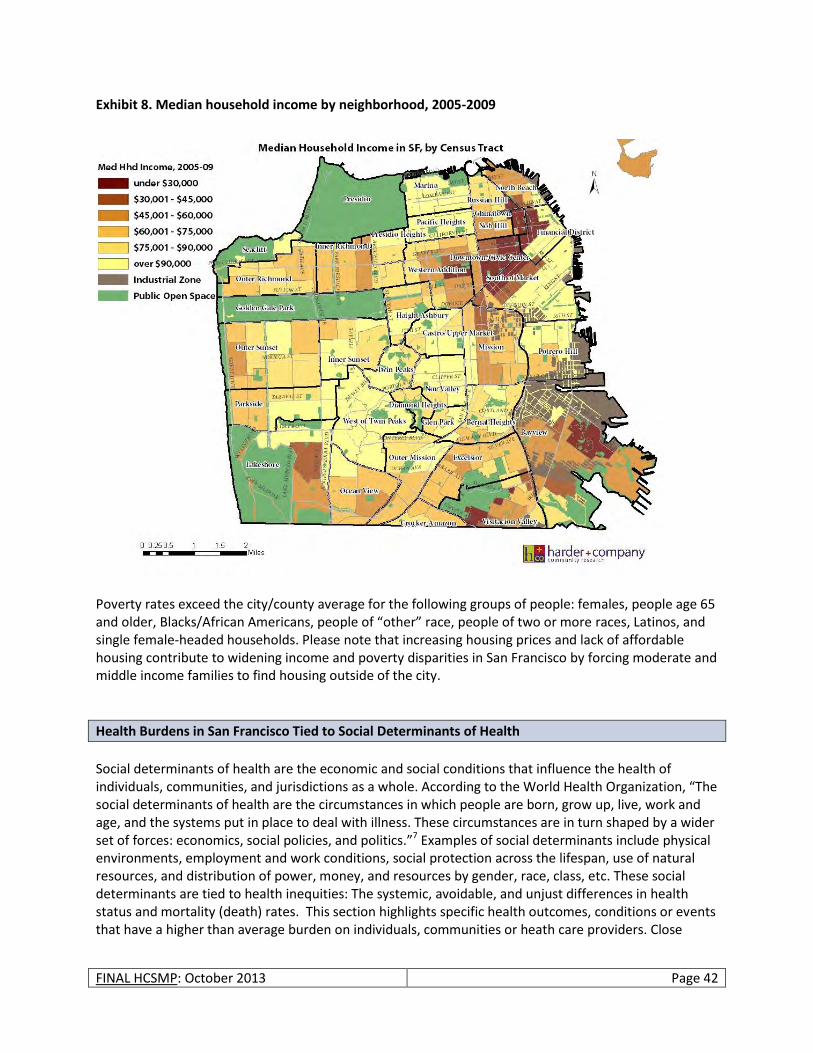
FINAL HCSMP: October 2013 Page 42
Exhibit 8. Median household income by neighborhood, 2005-2009
Poverty rates exceed the city/county average for the following groups of people: females, people age 65 and older, Blacks/African Americans, people of “other” race, people of two or more races, Latinos, and single female-headed households. Please note that increasing housing prices and lack of affordable housing contribute to widening income and poverty disparities in San Francisco by forcing moderate and middle income families to find housing outside of the city.
Health Burdens in San Francisco Tied to Social Determinants of Health
Social determinants of health are the economic and social conditions that influence the health of individuals, communities, and jurisdictions as a whole. According to the World Health Organization, “The social determinants of health are the circumstances in which people are born, grow up, live, work and age, and the systems put in place to deal with illness. These circumstances are in turn shaped by a wider set of forces: economics, social policies, and politics.”7 Examples of social determinants include physical environments, employment and work conditions, social protection across the lifespan, use of natural resources, and distribution of power, money, and resources by gender, race, class, etc. These social determinants are tied to health inequities: The systemic, avoidable, and unjust differences in health status and mortality (death) rates. This section highlights specific health outcomes, conditions or events that have a higher than average burden on individuals, communities or heath care providers. Close
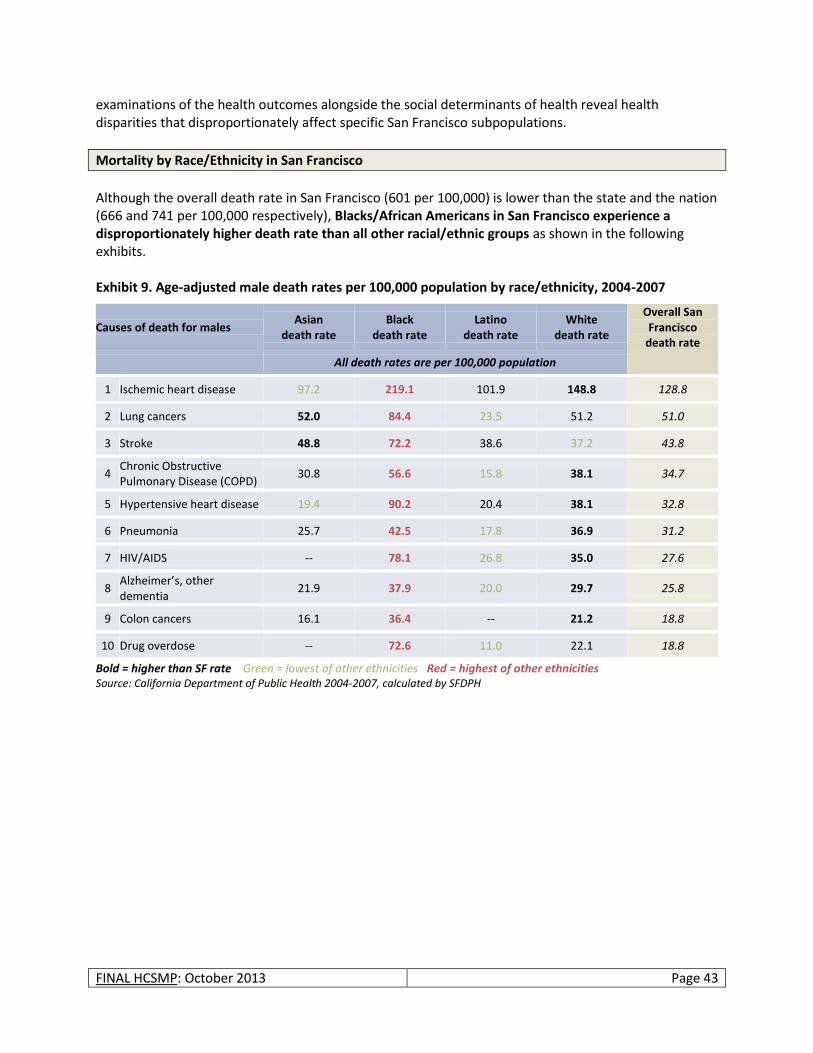
FINAL HCSMP: October 2013 Page 43
examinations of the health outcomes alongside the social determinants of health reveal health disparities that disproportionately affect specific San Francisco subpopulations.
Mortality by Race/Ethnicity in San Francisco
Although the overall death rate in San Francisco (601 per 100,000) is lower than the state and the nation (666 and 741 per 100,000 respectively), Blacks/African Americans in San Francisco experience a disproportionately higher death rate than all other racial/ethnic groups as shown in the following exhibits. Exhibit 9. Age-adjusted male death rates per 100,000 population by race/ethnicity, 2004-2007
Causes of death for males Asian
death rate Black
death rate Latino
death rate White
death rate
Overall San Francisco
death rate
All death rates are per 100,000 population
1 Ischemic heart disease 97.2 219.1 101.9 148.8 128.8
2 Lung cancers 52.0 84.4 23.5 51.2 51.0
3 Stroke 48.8 72.2 38.6 37.2 43.8
4 Chronic Obstructive Pulmonary Disease (COPD)
30.8 56.6 15.8 38.1 34.7
5 Hypertensive heart disease 19.4 90.2 20.4 38.1 32.8
6 Pneumonia 25.7 42.5 17.8 36.9 31.2
7 HIV/AIDS -- 78.1 26.8 35.0 27.6
8 Alzheimer’s, other dementia
21.9 37.9 20.0 29.7 25.8
9 Colon cancers 16.1 36.4 -- 21.2 18.8
10 Drug overdose -- 72.6 11.0 22.1 18.8
Bold = higher than SF rate Green = lowest of other ethnicities Red = highest of other ethnicities Source: California Department of Public Health 2004-2007, calculated by SFDPH

FINAL HCSMP: October 2013 Page 44
Exhibit 10. Age-adjusted female death rates per 100,000 population by race/ethnicity, 2004-2007
Causes of death for females Asian
death rate Black
death rate Latino
death rate White
death rate
Overall San Francisco
death rate
All death rates are per 100,000 population
1 Ischemic heart disease 57.6 139.1 59.9 91.4 79.1
2 Stroke 45.4 63.9 31.1 38.2 42.3
3 Lung cancers 22.7 57.9 14.0 35.8 29.3
4 Alzheimer’s, other dementia
19.9 38.4 25.0 37.1 29.2
5 Hypertensive heart disease 17.1 62.4 15.8 21.6 22.2
6 Pneumonia 17.1 23.1 10.8 24.5 20.2
7 Breast cancer 12.6 30.1 11.5 26.6 19.5
8 COPD 7.3 23.5 9.5 24.2 15.6
9 Colon cancers 12.0 24.9 -- 12.4 12.5
10 Diabetes mellitus 11.2 33.8 11.0 7.6 11.1
Bold = higher than SF rate Green = lowest of other ethnicities Red = highest of other ethnicities Source: California Department of Public Health 2004-2007, calculated by SFDPH
This trend is even more pronounced when examining premature deaths. Black/African American men and women experience the highest number of years of life lost (number of deaths multiplied by a standard life expectancy at the age at which death occurs) for all causes of premature death – even though Blacks/African Americans represent just over six percent of San Francisco’s total population.
Poor Prenatal Care and Birth Outcomes
Although San Francisco fares well overall in the area of prenatal care and birth outcomes (rating at or better than state outcomes and national benchmarks), there exist major disparities by race/ethnicity and neighborhood as seen in Exhibit 11 through Exhibit 14, below. When examining birth data by San Francisco zip codes, there are areas that stand out as having higher than the city/county rate in all of the following three areas: receiving no first trimester prenatal care, low birth weight babies, and preterm births, as seen in Exhibit 11 through Exhibit 13 below. Those zip codes include 94102 (Tenderloin, for no first trimester prenatal care only), 94104 (South of Market), 94112 (Excelsior), 94124 (Bayview-Hunters Point), and 94134 (Visitacion Valley).

FINAL HCSMP: October 2013 Page 45
Exhibit 11. Percentage of mothers who received no first trimester prenatal care in SF neighborhoods that have higher rates than the citywide average (2010)
Source: California Department of Public Health Birth Files, calculated by SFDPH, 2010
Exhibit 12. Percentage of low/very low birth weight babies in SF neighborhoods that have higher rates than the citywide average (2010)
* Benchmark is from 2012 County Health Rankings; represents the 90th percentile nationally Source: California Department of Public Health Birth Files 2010, calculated by SFDPH
22%
18% 17%
31%
20%
94102 (Tenderloin)
94104 (South of Market)
94112 (Excelsior) 94124 (Bayview-Hunters Point)
94134 (Visitacion Valley)
SF, 13%
HP2020 Target, 22%
11%
9%
7%
8%
94104 (South of Market)
94124 (Bayview-Hunters Point)
94134 (Visitacion Valley)
94112 (Excelsior)
SF, 7%
Benchmark,* 6%
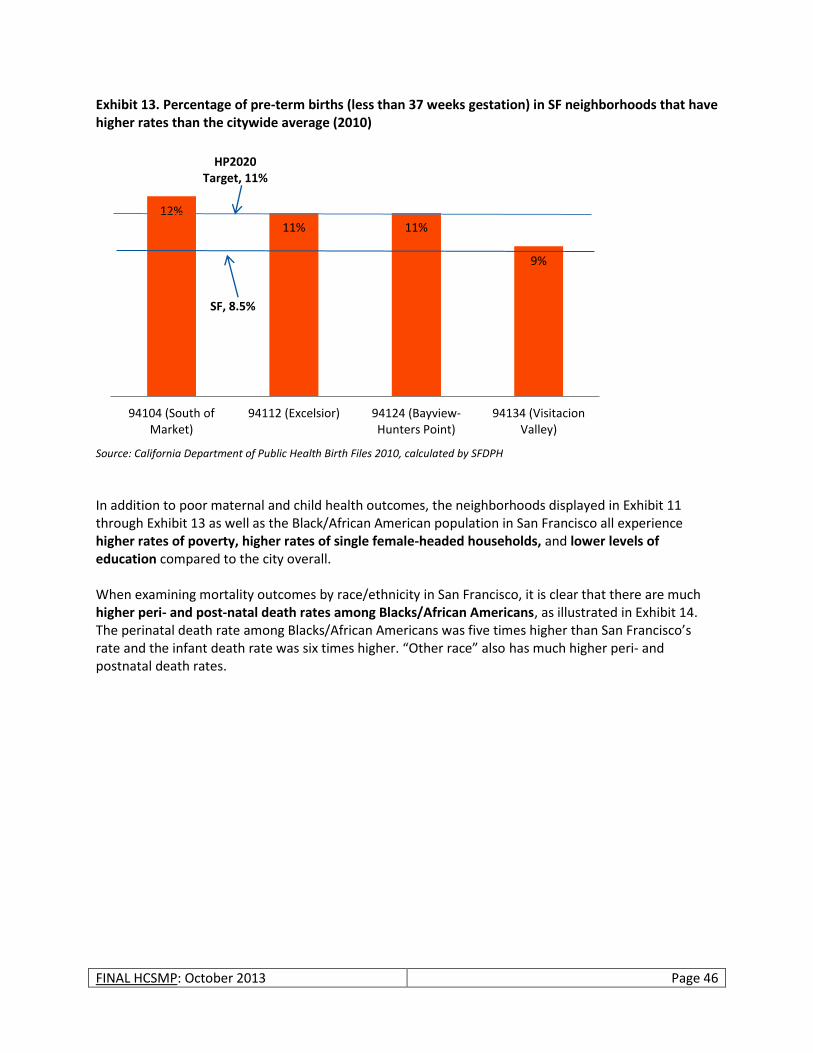
FINAL HCSMP: October 2013 Page 46
Exhibit 13. Percentage of pre-term births (less than 37 weeks gestation) in SF neighborhoods that have higher rates than the citywide average (2010)
Source: California Department of Public Health Birth Files 2010, calculated by SFDPH
In addition to poor maternal and child health outcomes, the neighborhoods displayed in Exhibit 11 through Exhibit 13 as well as the Black/African American population in San Francisco all experience higher rates of poverty, higher rates of single female-headed households, and lower levels of education compared to the city overall. When examining mortality outcomes by race/ethnicity in San Francisco, it is clear that there are much higher peri- and post-natal death rates among Blacks/African Americans, as illustrated in Exhibit 14. The perinatal death rate among Blacks/African Americans was five times higher than San Francisco’s rate and the infant death rate was six times higher. “Other race” also has much higher peri- and postnatal death rates.
12%
11% 11%
9%
94104 (South of Market)
94112 (Excelsior) 94124 (Bayview-Hunters Point)
94134 (Visitacion Valley)
SF, 8.5%
HP2020 Target, 11%
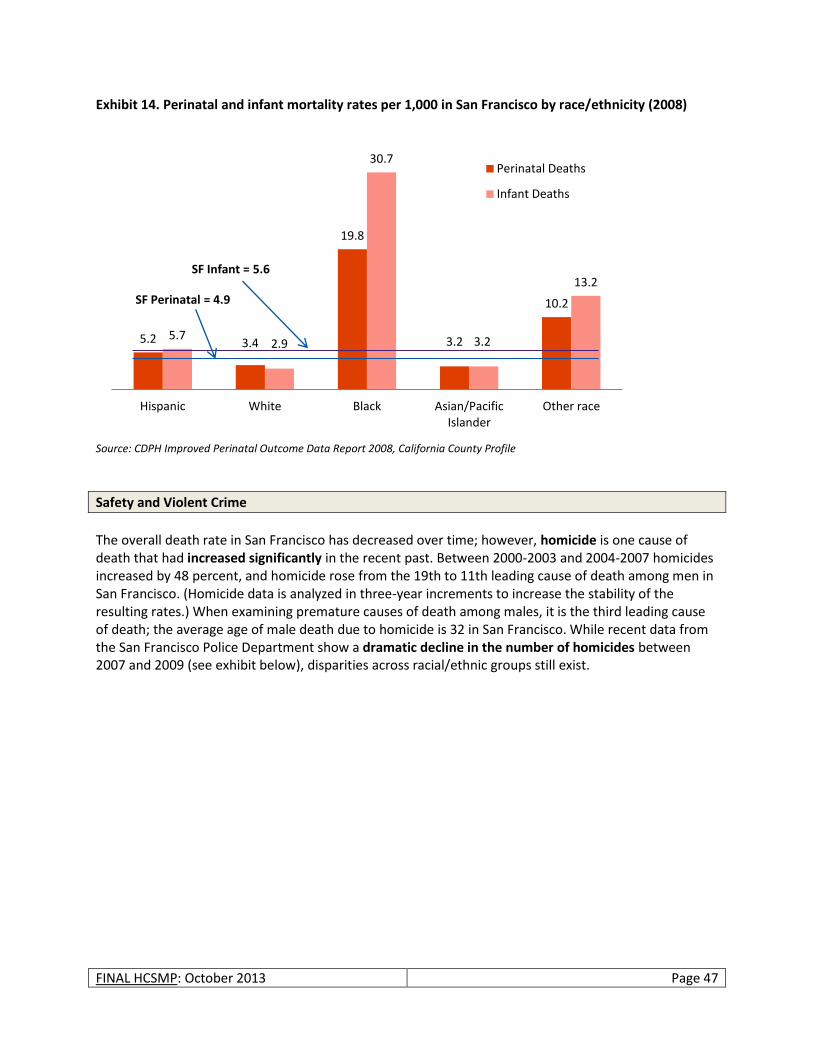
FINAL HCSMP: October 2013 Page 47
Exhibit 14. Perinatal and infant mortality rates per 1,000 in San Francisco by race/ethnicity (2008)
Source: CDPH Improved Perinatal Outcome Data Report 2008, California County Profile
Safety and Violent Crime
The overall death rate in San Francisco has decreased over time; however, homicide is one cause of death that had increased significantly in the recent past. Between 2000-2003 and 2004-2007 homicides increased by 48 percent, and homicide rose from the 19th to 11th leading cause of death among men in San Francisco. (Homicide data is analyzed in three-year increments to increase the stability of the resulting rates.) When examining premature causes of death among males, it is the third leading cause of death; the average age of male death due to homicide is 32 in San Francisco. While recent data from the San Francisco Police Department show a dramatic decline in the number of homicides between 2007 and 2009 (see exhibit below), disparities across racial/ethnic groups still exist.
5.2 3.4
19.8
3.2
10.2
5.7 2.9
30.7
3.2
13.2
Hispanic White Black Asian/Pacific Islander
Other race
Perinatal Deaths
Infant Deaths
SF Infant = 5.6
SF Perinatal = 4.9
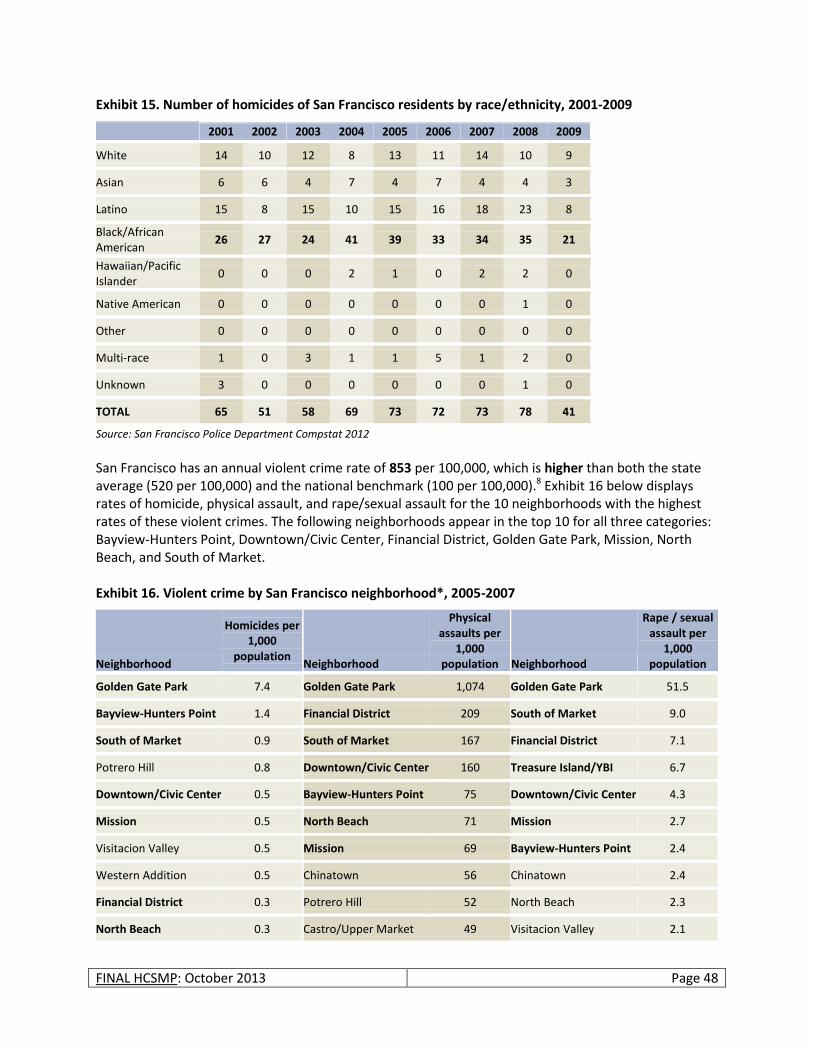
FINAL HCSMP: October 2013 Page 48
Exhibit 15. Number of homicides of San Francisco residents by race/ethnicity, 2001-2009
2001 2002 2003 2004 2005 2006 2007 2008 2009
White 14 10 12 8 13 11 14 10 9
Asian 6 6 4 7 4 7 4 4 3
Latino 15 8 15 10 15 16 18 23 8
Black/African American
26 27 24 41 39 33 34 35 21
Hawaiian/Pacific Islander
0 0 0 2 1 0 2 2 0
Native American 0 0 0 0 0 0 0 1 0
Other 0 0 0 0 0 0 0 0 0
Multi-race 1 0 3 1 1 5 1 2 0
Unknown 3 0 0 0 0 0 0 1 0
TOTAL 65 51 58 69 73 72 73 78 41
Source: San Francisco Police Department Compstat 2012 San Francisco has an annual violent crime rate of 853 per 100,000, which is higher than both the state average (520 per 100,000) and the national benchmark (100 per 100,000).8 Exhibit 16 below displays rates of homicide, physical assault, and rape/sexual assault for the 10 neighborhoods with the highest rates of these violent crimes. The following neighborhoods appear in the top 10 for all three categories: Bayview-Hunters Point, Downtown/Civic Center, Financial District, Golden Gate Park, Mission, North Beach, and South of Market. Exhibit 16. Violent crime by San Francisco neighborhood*, 2005-2007
Neighborhood
Homicides per 1,000
population Neighborhood
Physical assaults per
1,000 population Neighborhood
Rape / sexual assault per
1,000 population
Golden Gate Park 7.4 Golden Gate Park 1,074 Golden Gate Park 51.5
Bayview-Hunters Point 1.4 Financial District 209 South of Market 9.0
South of Market 0.9 South of Market 167 Financial District 7.1
Potrero Hill 0.8 Downtown/Civic Center 160 Treasure Island/YBI 6.7
Downtown/Civic Center 0.5 Bayview-Hunters Point 75 Downtown/Civic Center 4.3
Mission 0.5 North Beach 71 Mission 2.7
Visitacion Valley 0.5 Mission 69 Bayview-Hunters Point 2.4
Western Addition 0.5 Chinatown 56 Chinatown 2.4
Financial District 0.3 Potrero Hill 52 North Beach 2.3
North Beach 0.3 Castro/Upper Market 49 Visitacion Valley 2.1
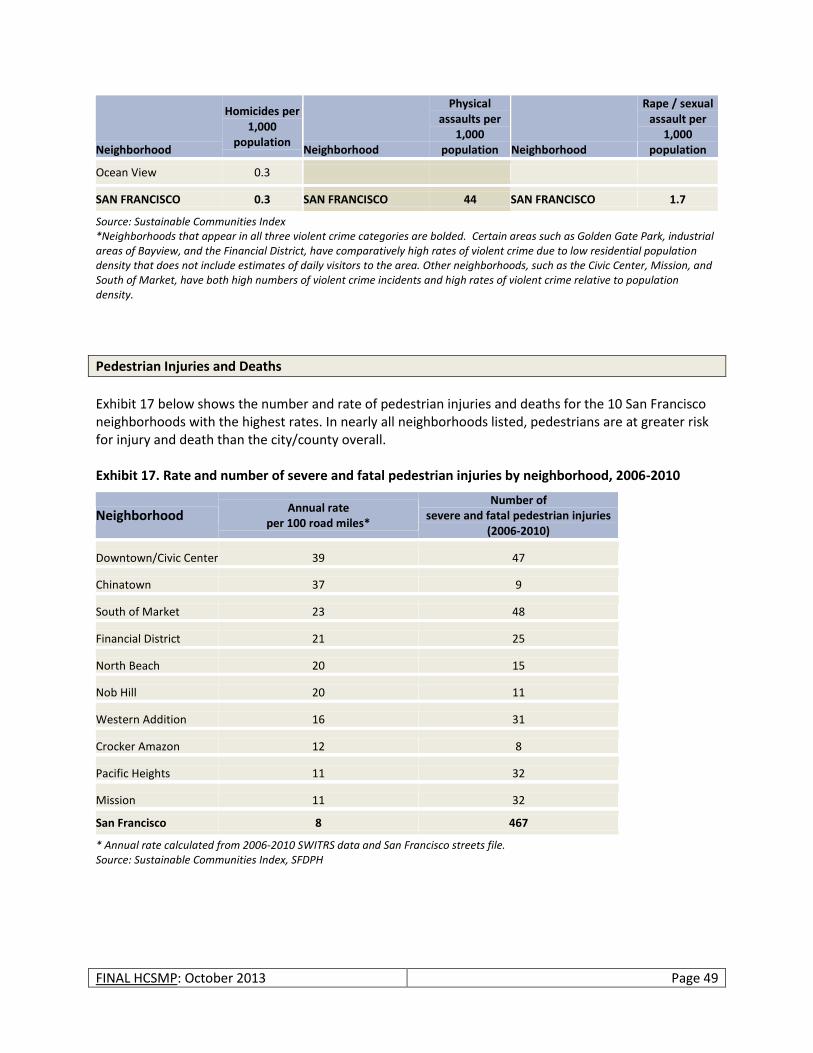
FINAL HCSMP: October 2013 Page 49
Neighborhood
Homicides per 1,000
population Neighborhood
Physical assaults per
1,000 population Neighborhood
Rape / sexual assault per
1,000 population
Ocean View 0.3
SAN FRANCISCO 0.3 SAN FRANCISCO 44 SAN FRANCISCO 1.7
Source: Sustainable Communities Index *Neighborhoods that appear in all three violent crime categories are bolded. Certain areas such as Golden Gate Park, industrial areas of Bayview, and the Financial District, have comparatively high rates of violent crime due to low residential population density that does not include estimates of daily visitors to the area. Other neighborhoods, such as the Civic Center, Mission, and South of Market, have both high numbers of violent crime incidents and high rates of violent crime relative to population density.
Pedestrian Injuries and Deaths
Exhibit 17 below shows the number and rate of pedestrian injuries and deaths for the 10 San Francisco neighborhoods with the highest rates. In nearly all neighborhoods listed, pedestrians are at greater risk for injury and death than the city/county overall. Exhibit 17. Rate and number of severe and fatal pedestrian injuries by neighborhood, 2006-2010
Neighborhood Annual rate
per 100 road miles*
Number of severe and fatal pedestrian injuries
(2006-2010)
Downtown/Civic Center 39 47
Chinatown 37 9
South of Market 23 48
Financial District 21 25
North Beach 20 15
Nob Hill 20 11
Western Addition 16 31
Crocker Amazon 12 8
Pacific Heights 11 32
Mission 11 32
San Francisco 8 467
* Annual rate calculated from 2006-2010 SWITRS data and San Francisco streets file. Source: Sustainable Communities Index, SFDPH

FINAL HCSMP: October 2013 Page 50
If my son has an ear infection, that’s not necessarily an emergency because it’s not life threatening…You have to wait three to seven days to get an appointment if it’s busy, but, during that time, what can you give to your child? I took him once to the emergency room because he was in too much pain.
- Excelsior Resident
Preventable Emergency Room Visits
Information on preventable emergency room visits is often used as an indicator of the availability and use of primary care services: People that do not have access to preventive health services or primary care often rely on emergency care to treat conditions that would best be addressed in primary care settings. These conditions range from primary care services such as pregnancy exams and eye exams to bacterial and parasitic infections. Additionally, because people that do not have access to preventive health services or primary care delay seeking health services, they often suffer from more severe outcomes due to infections and unmanaged chronic conditions. The rate of preventable emergency room visits in San Francisco in 2006-2008 was 238 per 10,000. According to Health Matters in San Francisco, the target for San Francisco is 235 per 10,000. The exhibit below shows how rates of preventable emergency room visits vary by neighborhood areas in San Francisco. The Tenderloin, South of Market and Bayview-Hunters Point neighborhoods far exceed the citywide rate as well as San Francisco’s goal. Exhibit 18. Rates of preventable emergency room visits by select San Francisco neighborhoods,*^ 2006-2008
* Rates per 10,000 population ^ These neighborhoods correspond to communities in which Health Care Services Master Plan meetings were held, based on an analysis of risk indicators from Health Matters in San Francisco. Source: Health Matters in San Francisco, 2006-08 Measurement Period
452 445 409
328 319 318
240
Ten
der
loin
, Hay
es V
alle
y (9
41
02
)
Sou
th o
f M
arke
t (9
41
03
,94
10
4)
Bay
view
-Hu
nte
rs P
oin
t (9
41
24
)
No
b H
ill, R
uss
ian
Hill
, Po
lk
(94
10
9)
Po
trer
o H
ill
94
10
5,9
41
07
,94
11
1,9
41
30
Wes
tern
Ad
dit
ion
, Jap
anto
wn
(9
41
15
)
Hai
ght
(94
11
7)
SF Actual, 238
SF Goal, 235
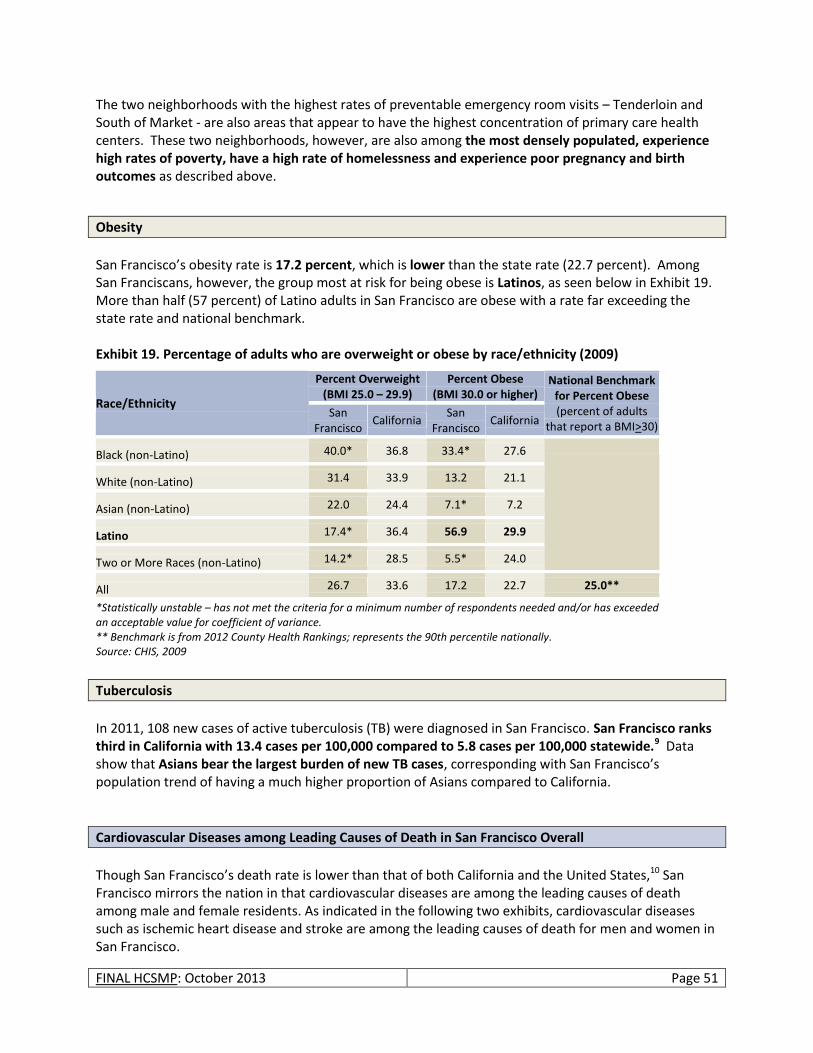
FINAL HCSMP: October 2013 Page 51
The two neighborhoods with the highest rates of preventable emergency room visits – Tenderloin and South of Market - are also areas that appear to have the highest concentration of primary care health centers. These two neighborhoods, however, are also among the most densely populated, experience high rates of poverty, have a high rate of homelessness and experience poor pregnancy and birth outcomes as described above.
Obesity
San Francisco’s obesity rate is 17.2 percent, which is lower than the state rate (22.7 percent). Among San Franciscans, however, the group most at risk for being obese is Latinos, as seen below in Exhibit 19. More than half (57 percent) of Latino adults in San Francisco are obese with a rate far exceeding the state rate and national benchmark. Exhibit 19. Percentage of adults who are overweight or obese by race/ethnicity (2009)
Race/Ethnicity
Percent Overweight (BMI 25.0 – 29.9)
Percent Obese (BMI 30.0 or higher)
National Benchmark for Percent Obese (percent of adults
that report a BMI>30) San
Francisco California
San Francisco
California
Black (non-Latino) 40.0* 36.8 33.4* 27.6
White (non-Latino) 31.4 33.9 13.2 21.1
Asian (non-Latino) 22.0 24.4 7.1* 7.2
Latino 17.4* 36.4 56.9 29.9
Two or More Races (non-Latino) 14.2* 28.5 5.5* 24.0
All 26.7 33.6 17.2 22.7 25.0**
*Statistically unstable – has not met the criteria for a minimum number of respondents needed and/or has exceeded an acceptable value for coefficient of variance. ** Benchmark is from 2012 County Health Rankings; represents the 90th percentile nationally. Source: CHIS, 2009
Tuberculosis
In 2011, 108 new cases of active tuberculosis (TB) were diagnosed in San Francisco. San Francisco ranks third in California with 13.4 cases per 100,000 compared to 5.8 cases per 100,000 statewide.9 Data show that Asians bear the largest burden of new TB cases, corresponding with San Francisco’s population trend of having a much higher proportion of Asians compared to California.
Cardiovascular Diseases among Leading Causes of Death in San Francisco Overall
Though San Francisco’s death rate is lower than that of both California and the United States,10 San Francisco mirrors the nation in that cardiovascular diseases are among the leading causes of death among male and female residents. As indicated in the following two exhibits, cardiovascular diseases such as ischemic heart disease and stroke are among the leading causes of death for men and women in San Francisco.
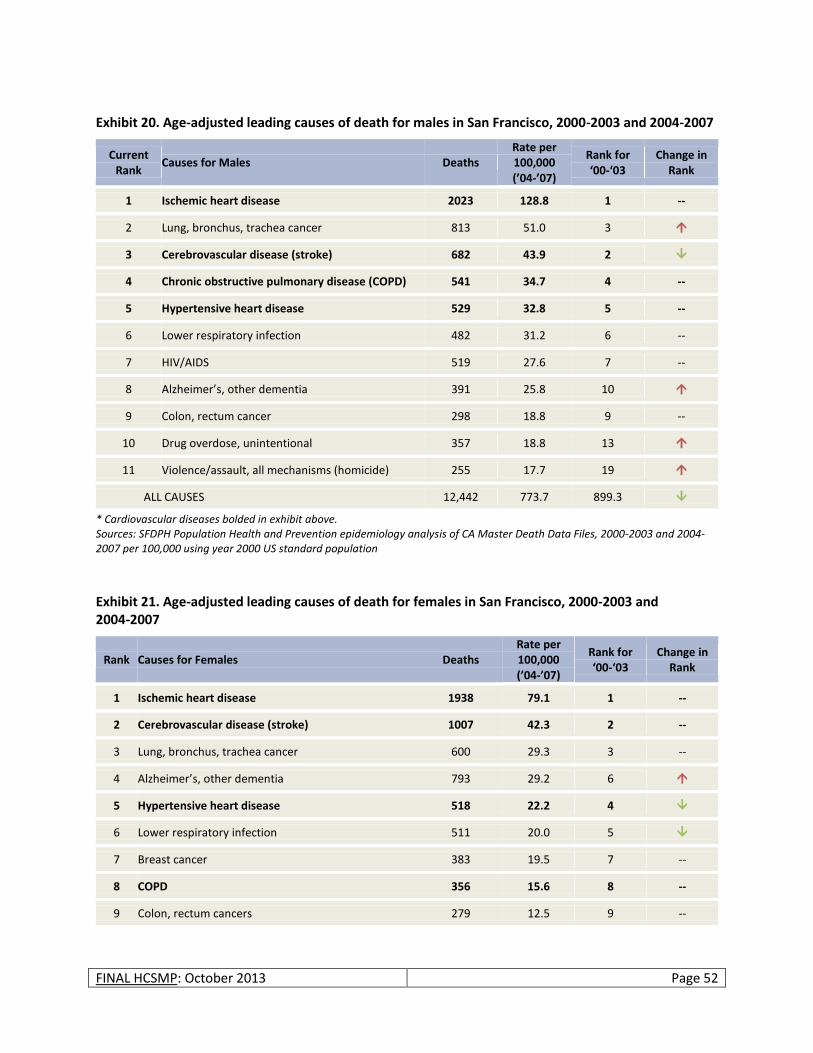
FINAL HCSMP: October 2013 Page 52
Exhibit 20. Age-adjusted leading causes of death for males in San Francisco, 2000-2003 and 2004-2007
Current Rank
Causes for Males Deaths Rate per 100,000 (’04-’07)
Rank for ‘00-‘03
Change in Rank
1 Ischemic heart disease 2023 128.8 1 --
2 Lung, bronchus, trachea cancer 813 51.0 3
3 Cerebrovascular disease (stroke) 682 43.9 2
4 Chronic obstructive pulmonary disease (COPD) 541 34.7 4 --
5 Hypertensive heart disease 529 32.8 5 --
6 Lower respiratory infection 482 31.2 6 --
7 HIV/AIDS 519 27.6 7 --
8 Alzheimer’s, other dementia 391 25.8 10
9 Colon, rectum cancer 298 18.8 9 --
10 Drug overdose, unintentional 357 18.8 13
11 Violence/assault, all mechanisms (homicide) 255 17.7 19
ALL CAUSES 12,442 773.7 899.3
* Cardiovascular diseases bolded in exhibit above. Sources: SFDPH Population Health and Prevention epidemiology analysis of CA Master Death Data Files, 2000-2003 and 2004-2007 per 100,000 using year 2000 US standard population
Exhibit 21. Age-adjusted leading causes of death for females in San Francisco, 2000-2003 and 2004-2007
Rank Causes for Females Deaths Rate per 100,000 (’04-’07)
Rank for ‘00-‘03
Change in Rank
1 Ischemic heart disease 1938 79.1 1 --
2 Cerebrovascular disease (stroke) 1007 42.3 2 --
3 Lung, bronchus, trachea cancer 600 29.3 3 --
4 Alzheimer’s, other dementia 793 29.2 6
5 Hypertensive heart disease 518 22.2 4
6 Lower respiratory infection 511 20.0 5
7 Breast cancer 383 19.5 7 --
8 COPD 356 15.6 8 --
9 Colon, rectum cancers 279 12.5 9 --
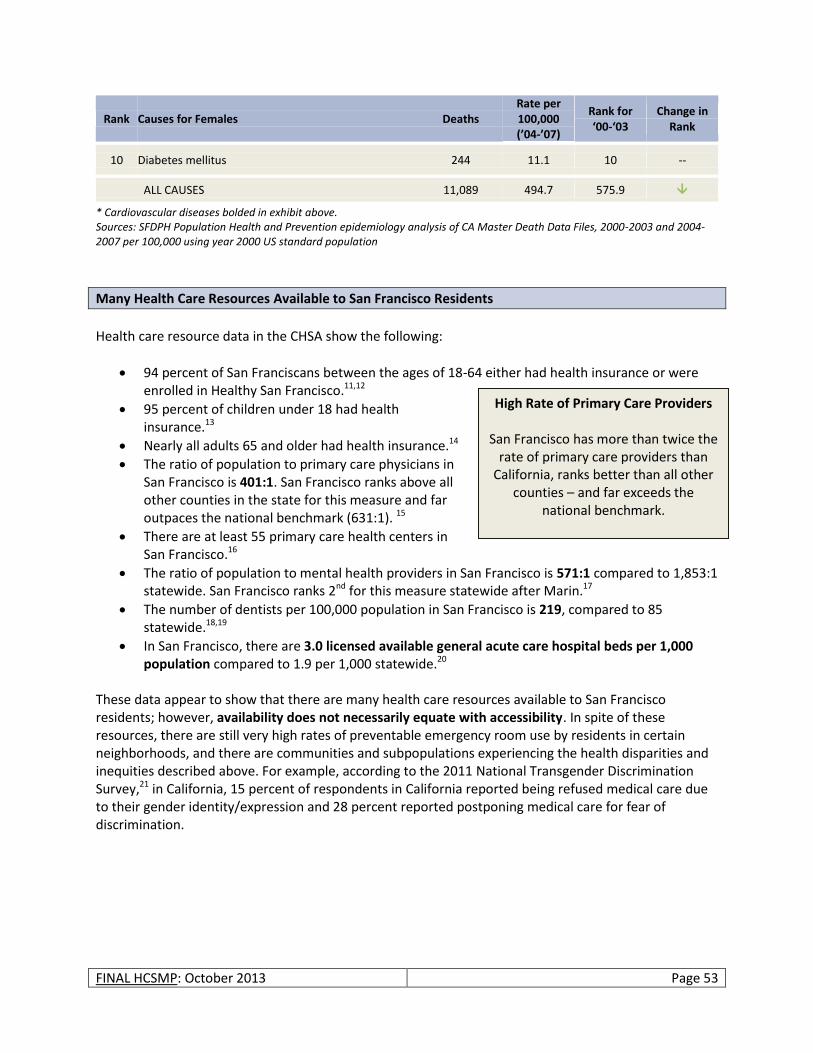
FINAL HCSMP: October 2013 Page 53
Rank Causes for Females Deaths Rate per 100,000 (’04-’07)
Rank for ‘00-‘03
Change in Rank
10 Diabetes mellitus 244 11.1 10 --
ALL CAUSES 11,089 494.7 575.9
* Cardiovascular diseases bolded in exhibit above. Sources: SFDPH Population Health and Prevention epidemiology analysis of CA Master Death Data Files, 2000-2003 and 2004-2007 per 100,000 using year 2000 US standard population
Many Health Care Resources Available to San Francisco Residents
Health care resource data in the CHSA show the following:
94 percent of San Franciscans between the ages of 18-64 either had health insurance or were enrolled in Healthy San Francisco.11,12
95 percent of children under 18 had health insurance.13
Nearly all adults 65 and older had health insurance.14
The ratio of population to primary care physicians in San Francisco is 401:1. San Francisco ranks above all other counties in the state for this measure and far outpaces the national benchmark (631:1). 15
There are at least 55 primary care health centers in San Francisco.16
The ratio of population to mental health providers in San Francisco is 571:1 compared to 1,853:1 statewide. San Francisco ranks 2nd for this measure statewide after Marin.17
The number of dentists per 100,000 population in San Francisco is 219, compared to 85 statewide.18,19
In San Francisco, there are 3.0 licensed available general acute care hospital beds per 1,000 population compared to 1.9 per 1,000 statewide.20
These data appear to show that there are many health care resources available to San Francisco residents; however, availability does not necessarily equate with accessibility. In spite of these resources, there are still very high rates of preventable emergency room use by residents in certain neighborhoods, and there are communities and subpopulations experiencing the health disparities and inequities described above. For example, according to the 2011 National Transgender Discrimination Survey,21 in California, 15 percent of respondents in California reported being refused medical care due to their gender identity/expression and 28 percent reported postponing medical care for fear of discrimination.
High Rate of Primary Care Providers
San Francisco has more than twice the rate of primary care providers than
California, ranks better than all other counties – and far exceeds the
national benchmark.
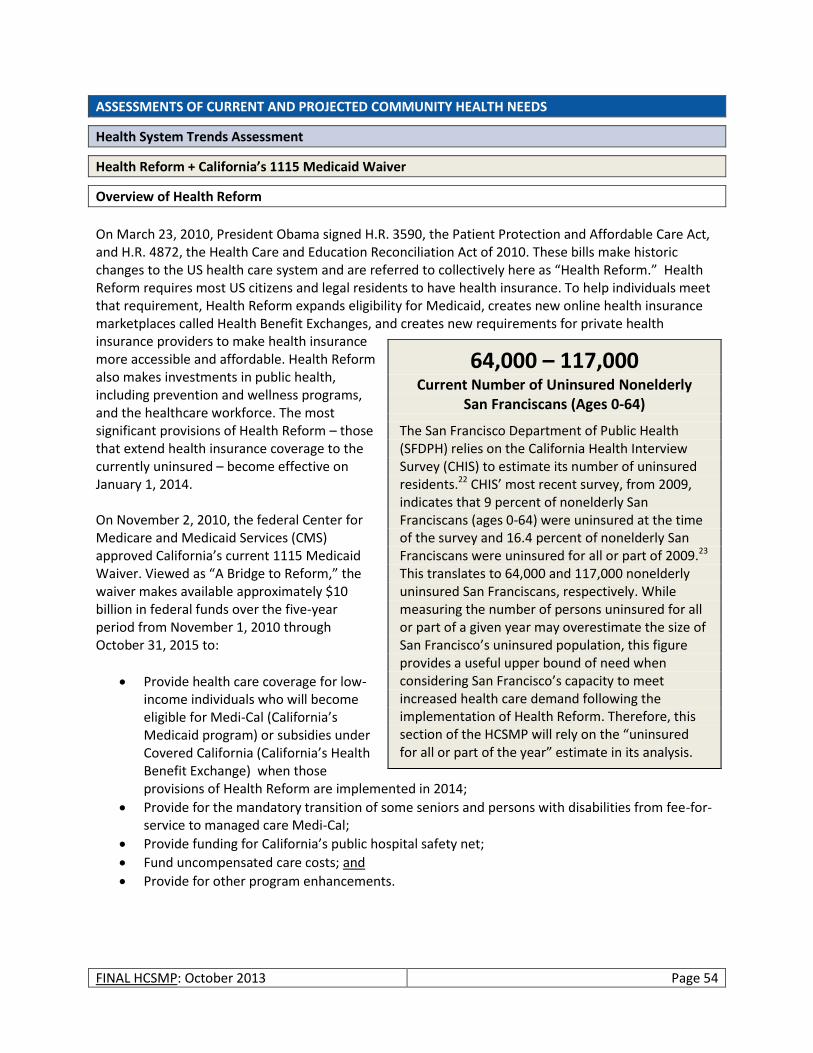
FINAL HCSMP: October 2013 Page 54
ASSESSMENTS OF CURRENT AND PROJECTED COMMUNITY HEALTH NEEDS
Health System Trends Assessment
Health Reform + California’s 1115 Medicaid Waiver
Overview of Health Reform
On March 23, 2010, President Obama signed H.R. 3590, the Patient Protection and Affordable Care Act, and H.R. 4872, the Health Care and Education Reconciliation Act of 2010. These bills make historic changes to the US health care system and are referred to collectively here as “Health Reform.” Health Reform requires most US citizens and legal residents to have health insurance. To help individuals meet that requirement, Health Reform expands eligibility for Medicaid, creates new online health insurance marketplaces called Health Benefit Exchanges, and creates new requirements for private health insurance providers to make health insurance more accessible and affordable. Health Reform also makes investments in public health, including prevention and wellness programs, and the healthcare workforce. The most significant provisions of Health Reform – those that extend health insurance coverage to the currently uninsured – become effective on January 1, 2014. On November 2, 2010, the federal Center for Medicare and Medicaid Services (CMS) approved California’s current 1115 Medicaid Waiver. Viewed as “A Bridge to Reform,” the waiver makes available approximately $10 billion in federal funds over the five-year period from November 1, 2010 through October 31, 2015 to:
Provide health care coverage for low-income individuals who will become eligible for Medi-Cal (California’s Medicaid program) or subsidies under Covered California (California’s Health Benefit Exchange) when those provisions of Health Reform are implemented in 2014;
Provide for the mandatory transition of some seniors and persons with disabilities from fee-for-service to managed care Medi-Cal;
Provide funding for California’s public hospital safety net;
Fund uncompensated care costs; and
Provide for other program enhancements.
64,000 – 117,000 Current Number of Uninsured Nonelderly
San Franciscans (Ages 0-64)
The San Francisco Department of Public Health (SFDPH) relies on the California Health Interview Survey (CHIS) to estimate its number of uninsured residents.22 CHIS’ most recent survey, from 2009, indicates that 9 percent of nonelderly San Franciscans (ages 0-64) were uninsured at the time of the survey and 16.4 percent of nonelderly San Franciscans were uninsured for all or part of 2009.23 This translates to 64,000 and 117,000 nonelderly uninsured San Franciscans, respectively. While measuring the number of persons uninsured for all or part of a given year may overestimate the size of San Francisco’s uninsured population, this figure provides a useful upper bound of need when considering San Francisco’s capacity to meet increased health care demand following the implementation of Health Reform. Therefore, this section of the HCSMP will rely on the “uninsured for all or part of the year” estimate in its analysis.
FINAL HCSMP: October 2013 Page 55
Key Legislative Components of Health Reform
Individual Mandate Beginning January 1, 2014, most US citizens and legal residents will be required to have baseline health insurance.24 To help people meet this requirement, Health Reform enacted a series of policies to expand access to health insurance. These include expanding eligibility for Medicaid, creating subsidies for low-income individuals purchasing health insurance on the private market, and enacting health insurance reforms to ensure increased or continued access to private and employer-sponsored health insurance. Health Benefit Exchanges Health Insurance Marketplace for US Citizens and Legal Immigrants Health Reform requires states to create health benefit exchanges through which individuals or small businesses may purchase health insurance. Citizens and legal immigrants and employers with up to 100 employees may purchase coverage through an exchange. All plans offered in the exchanges will be required to offer benefits that meet a minimum set of standards. Insurers will offer four levels of coverage that vary by premiums, out-of-pocket costs, and benefits beyond the minimum requirements plus a catastrophic coverage plan. California's health benefit exchange, Covered California, is likely to be the largest exchange operated by a single state, with as many as 8.3 million residents expected to be eligible for coverage. Covered California also will provide resources to connect low-income Californians to federal subsidies for health coverage or government programs such as Medicaid. Subsidies for Low Income Individuals and Families Premium credits will be provided to individuals and families with incomes between 138 percent (per Modified Adjusted Gross Income calculations) and 400 percent of FPL to help them purchase insurance through Covered California. These subsidies will be offered on a sliding scale basis and will limit the cost of the insurance premiums to between two percent of income for people with incomes up to 138 percent of FPL and nine percent of income for people with incomes between 300 and 400 percent of FPL. Cost-sharing subsidies will also be available to people with incomes between 138 and 400 percent of FPL to limit out-of-pocket spending. Contracts Required with Safety Net Providers Participation by safety net providers will be required for health plans operating in Covered California. Safety net providers are defined in the new law as those eligible to participate in the 340B drug discount program. Under Covered California, health plans must contract with 15 percent of designated essential community providers (304B entities). San Francisco has 219 designated essential community providers.
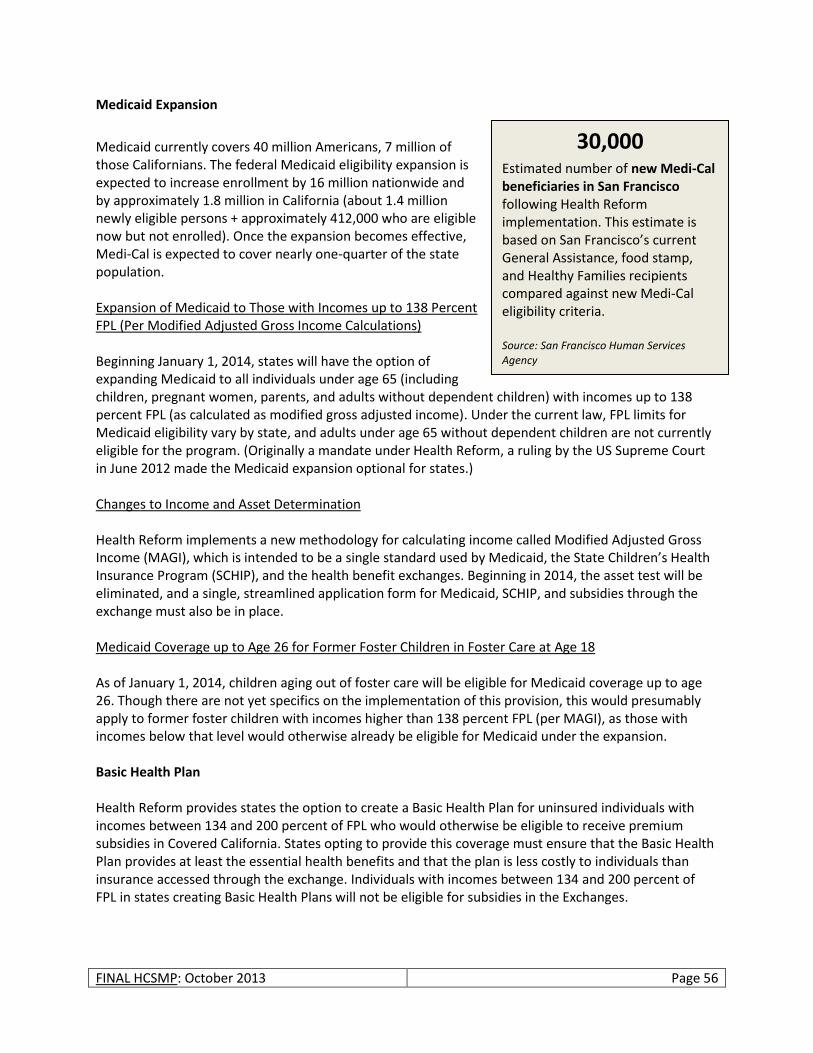
FINAL HCSMP: October 2013 Page 56
Medicaid Expansion
Medicaid currently covers 40 million Americans, 7 million of those Californians. The federal Medicaid eligibility expansion is expected to increase enrollment by 16 million nationwide and by approximately 1.8 million in California (about 1.4 million newly eligible persons + approximately 412,000 who are eligible now but not enrolled). Once the expansion becomes effective, Medi-Cal is expected to cover nearly one-quarter of the state population. Expansion of Medicaid to Those with Incomes up to 138 Percent FPL (Per Modified Adjusted Gross Income Calculations) Beginning January 1, 2014, states will have the option of expanding Medicaid to all individuals under age 65 (including children, pregnant women, parents, and adults without dependent children) with incomes up to 138 percent FPL (as calculated as modified gross adjusted income). Under the current law, FPL limits for Medicaid eligibility vary by state, and adults under age 65 without dependent children are not currently eligible for the program. (Originally a mandate under Health Reform, a ruling by the US Supreme Court in June 2012 made the Medicaid expansion optional for states.) Changes to Income and Asset Determination Health Reform implements a new methodology for calculating income called Modified Adjusted Gross Income (MAGI), which is intended to be a single standard used by Medicaid, the State Children’s Health Insurance Program (SCHIP), and the health benefit exchanges. Beginning in 2014, the asset test will be eliminated, and a single, streamlined application form for Medicaid, SCHIP, and subsidies through the exchange must also be in place. Medicaid Coverage up to Age 26 for Former Foster Children in Foster Care at Age 18 As of January 1, 2014, children aging out of foster care will be eligible for Medicaid coverage up to age 26. Though there are not yet specifics on the implementation of this provision, this would presumably apply to former foster children with incomes higher than 138 percent FPL (per MAGI), as those with incomes below that level would otherwise already be eligible for Medicaid under the expansion. Basic Health Plan Health Reform provides states the option to create a Basic Health Plan for uninsured individuals with incomes between 134 and 200 percent of FPL who would otherwise be eligible to receive premium subsidies in Covered California. States opting to provide this coverage must ensure that the Basic Health Plan provides at least the essential health benefits and that the plan is less costly to individuals than insurance accessed through the exchange. Individuals with incomes between 134 and 200 percent of FPL in states creating Basic Health Plans will not be eligible for subsidies in the Exchanges.
30,000 Estimated number of new Medi-Cal beneficiaries in San Francisco following Health Reform implementation. This estimate is based on San Francisco’s current General Assistance, food stamp, and Healthy Families recipients compared against new Medi-Cal eligibility criteria. Source: San Francisco Human Services Agency
FINAL HCSMP: October 2013 Page 57
Private Insurance Reforms Health Reform requires the following private insurance reforms, many of which have already been enacted:
High-risk insurance pools for persons with pre-existing conditions
Dependent coverage up to age 26
Elimination of cost-sharing for prevention
No limits on essential benefits for group health plans
Re-insurance program for retirees under age 65 (ends 2014)
Elimination of certain coverage restrictions:
o Guarantee issue (requirement that health plans may not deny coverage based on age, sex, and/or health status),
o Ban on lifetime coverage limits, o Prohibition on policy recissions, and o Elimination of pre-existing condition coverage restrictions
Employer Requirements Employer Penalties When Employees Access Benefit Exchange Premium Credits
There is no mandate that employers offer health insurance. However, beginning in 2014, employers with more than 50 employees that have at least one employee who accesses a premium credit – credits that allow persons with incomes between 138 – 400 percent FPL (per MAGI calculations) to purchase insurance through Covered California – will be required to pay a fee. Those employers that do not offer coverage will be assessed a fee of $2,000 per full-time employee. Those that do offer coverage will pay the lesser of the following: $3,000 for each employee receiving the premium credit or $2,000 for each full-time employee, excluding the first 30 employees from the assessment.
What should the California Health Benefit Exchange look like?
On September 30, 2010, California became the first state to pass legislation creating a health insurance exchange, called Covered California. Since that time, California has convened a five-member governing body that, as of April 2011, began meeting monthly to design the exchange and plan for its implementation.25 Among the state’s challenges is the decision of how to model the California Health Benefit Exchange (CHBE). Should California establish a Basic Health Plan? Should the state create a “public-partner” exchange of which Medi-Cal would be part? These questions are especially important for low-income individuals, many of whom are likely to alternate – because of income fluctuations – between Medi-Cal and the CHBE after Health Reform implementation, begging the question of how their continuity of care could be affected. For example, a recent national study suggests that half of all adults with household incomes below 200% FPL “will experience a shift in eligibility from Medicaid to an insurance exchange, or the reverse, within a year.”26 Once decided, the design of the CHBE may pose special health care access issues to individuals, providers, and policymakers.
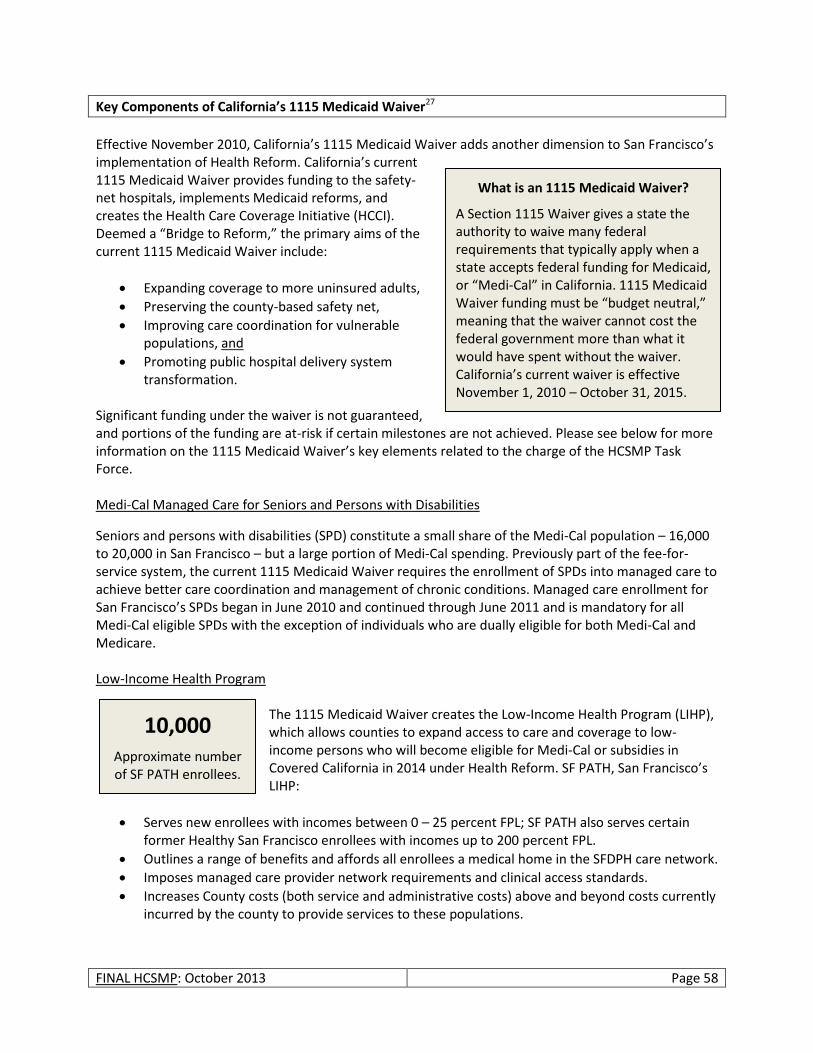
FINAL HCSMP: October 2013 Page 58
Key Components of California’s 1115 Medicaid Waiver27
Effective November 2010, California’s 1115 Medicaid Waiver adds another dimension to San Francisco’s implementation of Health Reform. California’s current 1115 Medicaid Waiver provides funding to the safety-net hospitals, implements Medicaid reforms, and creates the Health Care Coverage Initiative (HCCI). Deemed a “Bridge to Reform,” the primary aims of the current 1115 Medicaid Waiver include:
Expanding coverage to more uninsured adults,
Preserving the county-based safety net,
Improving care coordination for vulnerable populations, and
Promoting public hospital delivery system transformation.
Significant funding under the waiver is not guaranteed, and portions of the funding are at-risk if certain milestones are not achieved. Please see below for more information on the 1115 Medicaid Waiver’s key elements related to the charge of the HCSMP Task Force. Medi-Cal Managed Care for Seniors and Persons with Disabilities
Seniors and persons with disabilities (SPD) constitute a small share of the Medi-Cal population – 16,000 to 20,000 in San Francisco – but a large portion of Medi-Cal spending. Previously part of the fee-for-service system, the current 1115 Medicaid Waiver requires the enrollment of SPDs into managed care to achieve better care coordination and management of chronic conditions. Managed care enrollment for San Francisco’s SPDs began in June 2010 and continued through June 2011 and is mandatory for all Medi-Cal eligible SPDs with the exception of individuals who are dually eligible for both Medi-Cal and Medicare. Low-Income Health Program
The 1115 Medicaid Waiver creates the Low-Income Health Program (LIHP), which allows counties to expand access to care and coverage to low-income persons who will become eligible for Medi-Cal or subsidies in Covered California in 2014 under Health Reform. SF PATH, San Francisco’s LIHP:
Serves new enrollees with incomes between 0 – 25 percent FPL; SF PATH also serves certain former Healthy San Francisco enrollees with incomes up to 200 percent FPL.
Outlines a range of benefits and affords all enrollees a medical home in the SFDPH care network.
Imposes managed care provider network requirements and clinical access standards.
Increases County costs (both service and administrative costs) above and beyond costs currently incurred by the county to provide services to these populations.
What is an 1115 Medicaid Waiver?
A Section 1115 Waiver gives a state the authority to waive many federal requirements that typically apply when a state accepts federal funding for Medicaid, or “Medi-Cal” in California. 1115 Medicaid Waiver funding must be “budget neutral,” meaning that the waiver cannot cost the federal government more than what it would have spent without the waiver. California’s current waiver is effective November 1, 2010 – October 31, 2015.
10,000
Approximate number of SF PATH enrollees.
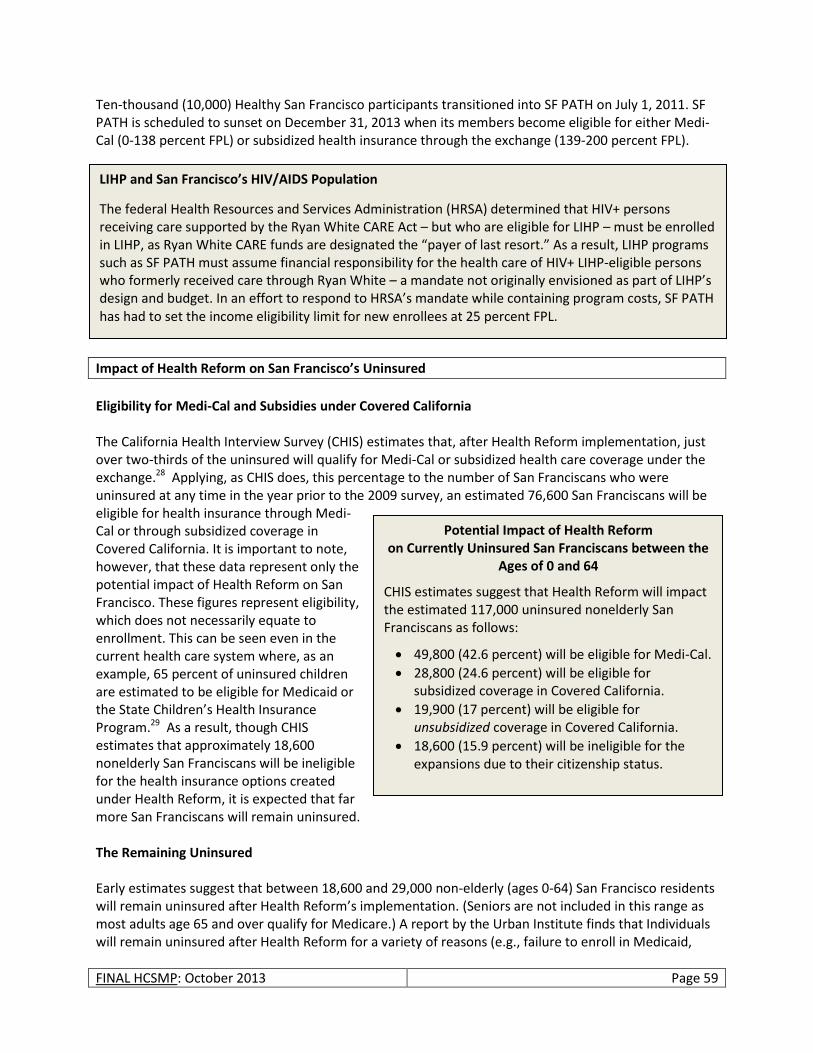
FINAL HCSMP: October 2013 Page 59
Ten-thousand (10,000) Healthy San Francisco participants transitioned into SF PATH on July 1, 2011. SF PATH is scheduled to sunset on December 31, 2013 when its members become eligible for either Medi-Cal (0-138 percent FPL) or subsidized health insurance through the exchange (139-200 percent FPL).
Impact of Health Reform on San Francisco’s Uninsured
Eligibility for Medi-Cal and Subsidies under Covered California The California Health Interview Survey (CHIS) estimates that, after Health Reform implementation, just over two-thirds of the uninsured will qualify for Medi-Cal or subsidized health care coverage under the exchange.28 Applying, as CHIS does, this percentage to the number of San Franciscans who were uninsured at any time in the year prior to the 2009 survey, an estimated 76,600 San Franciscans will be eligible for health insurance through Medi-Cal or through subsidized coverage in Covered California. It is important to note, however, that these data represent only the potential impact of Health Reform on San Francisco. These figures represent eligibility, which does not necessarily equate to enrollment. This can be seen even in the current health care system where, as an example, 65 percent of uninsured children are estimated to be eligible for Medicaid or the State Children’s Health Insurance Program.29 As a result, though CHIS estimates that approximately 18,600 nonelderly San Franciscans will be ineligible for the health insurance options created under Health Reform, it is expected that far more San Franciscans will remain uninsured. The Remaining Uninsured Early estimates suggest that between 18,600 and 29,000 non-elderly (ages 0-64) San Francisco residents will remain uninsured after Health Reform’s implementation. (Seniors are not included in this range as most adults age 65 and over qualify for Medicare.) A report by the Urban Institute finds that Individuals will remain uninsured after Health Reform for a variety of reasons (e.g., failure to enroll in Medicaid,
LIHP and San Francisco’s HIV/AIDS Population
The federal Health Resources and Services Administration (HRSA) determined that HIV+ persons receiving care supported by the Ryan White CARE Act – but who are eligible for LIHP – must be enrolled in LIHP, as Ryan White CARE funds are designated the “payer of last resort.” As a result, LIHP programs such as SF PATH must assume financial responsibility for the health care of HIV+ LIHP-eligible persons who formerly received care through Ryan White – a mandate not originally envisioned as part of LIHP’s design and budget. In an effort to respond to HRSA’s mandate while containing program costs, SF PATH has had to set the income eligibility limit for new enrollees at 25 percent FPL.
Potential Impact of Health Reform on Currently Uninsured San Franciscans between the
Ages of 0 and 64
CHIS estimates suggest that Health Reform will impact the estimated 117,000 uninsured nonelderly San Franciscans as follows:
49,800 (42.6 percent) will be eligible for Medi-Cal.
28,800 (24.6 percent) will be eligible for subsidized coverage in Covered California.
19,900 (17 percent) will be eligible for unsubsidized coverage in Covered California.
18,600 (15.9 percent) will be ineligible for the expansions due to their citizenship status.
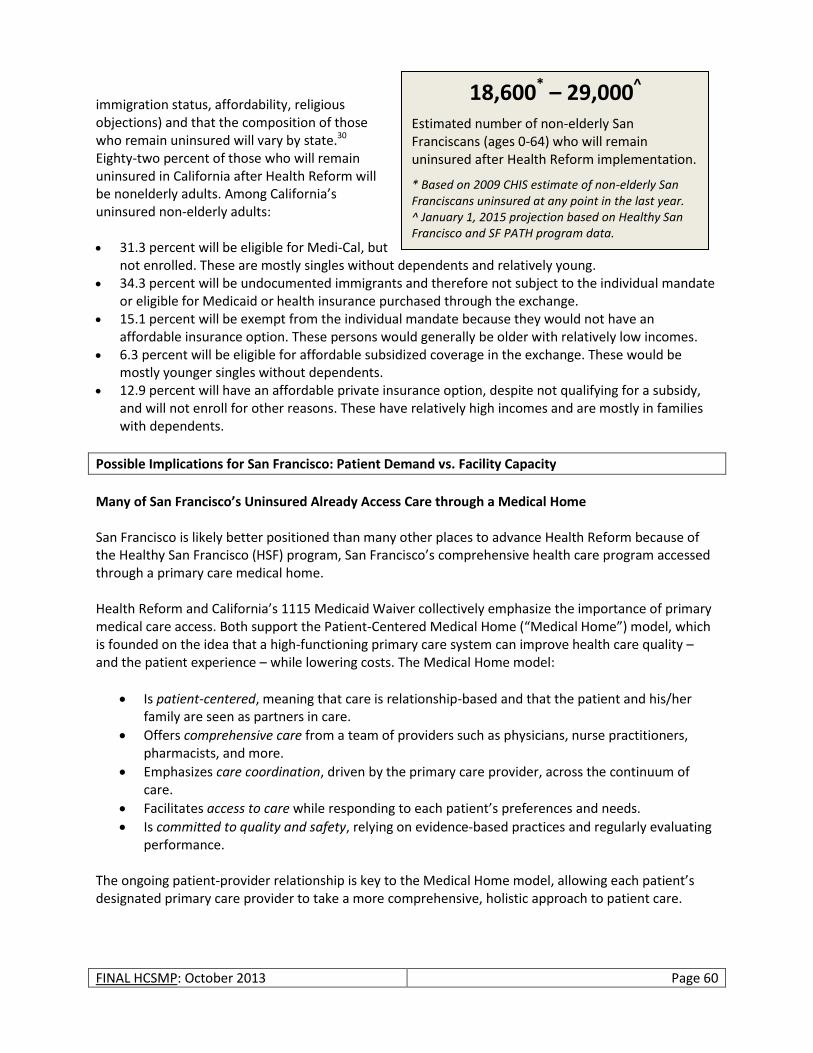
FINAL HCSMP: October 2013 Page 60
immigration status, affordability, religious objections) and that the composition of those who remain uninsured will vary by state.30 Eighty-two percent of those who will remain uninsured in California after Health Reform will be nonelderly adults. Among California’s uninsured non-elderly adults: 31.3 percent will be eligible for Medi-Cal, but
not enrolled. These are mostly singles without dependents and relatively young. 34.3 percent will be undocumented immigrants and therefore not subject to the individual mandate
or eligible for Medicaid or health insurance purchased through the exchange. 15.1 percent will be exempt from the individual mandate because they would not have an
affordable insurance option. These persons would generally be older with relatively low incomes. 6.3 percent will be eligible for affordable subsidized coverage in the exchange. These would be
mostly younger singles without dependents. 12.9 percent will have an affordable private insurance option, despite not qualifying for a subsidy,
and will not enroll for other reasons. These have relatively high incomes and are mostly in families with dependents.
Possible Implications for San Francisco: Patient Demand vs. Facility Capacity
Many of San Francisco’s Uninsured Already Access Care through a Medical Home San Francisco is likely better positioned than many other places to advance Health Reform because of the Healthy San Francisco (HSF) program, San Francisco’s comprehensive health care program accessed through a primary care medical home. Health Reform and California’s 1115 Medicaid Waiver collectively emphasize the importance of primary medical care access. Both support the Patient-Centered Medical Home (“Medical Home”) model, which is founded on the idea that a high-functioning primary care system can improve health care quality – and the patient experience – while lowering costs. The Medical Home model:
Is patient-centered, meaning that care is relationship-based and that the patient and his/her family are seen as partners in care.
Offers comprehensive care from a team of providers such as physicians, nurse practitioners, pharmacists, and more.
Emphasizes care coordination, driven by the primary care provider, across the continuum of care.
Facilitates access to care while responding to each patient’s preferences and needs.
Is committed to quality and safety, relying on evidence-based practices and regularly evaluating performance.
The ongoing patient-provider relationship is key to the Medical Home model, allowing each patient’s designated primary care provider to take a more comprehensive, holistic approach to patient care.
18,600* – 29,000^
Estimated number of non-elderly San Franciscans (ages 0-64) who will remain uninsured after Health Reform implementation.
* Based on 2009 CHIS estimate of non-elderly San Franciscans uninsured at any point in the last year. ^ January 1, 2015 projection based on Healthy San Francisco and SF PATH program data.
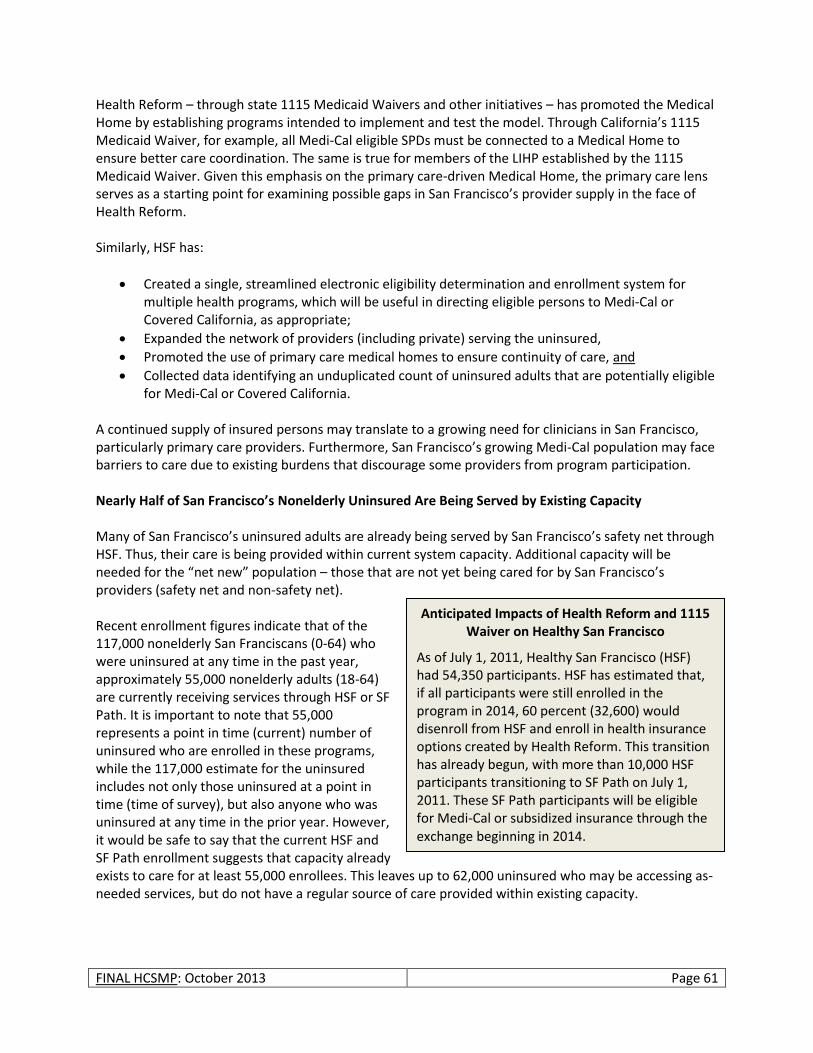
FINAL HCSMP: October 2013 Page 61
Health Reform – through state 1115 Medicaid Waivers and other initiatives – has promoted the Medical Home by establishing programs intended to implement and test the model. Through California’s 1115 Medicaid Waiver, for example, all Medi-Cal eligible SPDs must be connected to a Medical Home to ensure better care coordination. The same is true for members of the LIHP established by the 1115 Medicaid Waiver. Given this emphasis on the primary care-driven Medical Home, the primary care lens serves as a starting point for examining possible gaps in San Francisco’s provider supply in the face of Health Reform. Similarly, HSF has:
Created a single, streamlined electronic eligibility determination and enrollment system for multiple health programs, which will be useful in directing eligible persons to Medi-Cal or Covered California, as appropriate;
Expanded the network of providers (including private) serving the uninsured,
Promoted the use of primary care medical homes to ensure continuity of care, and
Collected data identifying an unduplicated count of uninsured adults that are potentially eligible for Medi-Cal or Covered California.
A continued supply of insured persons may translate to a growing need for clinicians in San Francisco, particularly primary care providers. Furthermore, San Francisco’s growing Medi-Cal population may face barriers to care due to existing burdens that discourage some providers from program participation. Nearly Half of San Francisco’s Nonelderly Uninsured Are Being Served by Existing Capacity Many of San Francisco’s uninsured adults are already being served by San Francisco’s safety net through HSF. Thus, their care is being provided within current system capacity. Additional capacity will be needed for the “net new” population – those that are not yet being cared for by San Francisco’s providers (safety net and non-safety net). Recent enrollment figures indicate that of the 117,000 nonelderly San Franciscans (0-64) who were uninsured at any time in the past year, approximately 55,000 nonelderly adults (18-64) are currently receiving services through HSF or SF Path. It is important to note that 55,000 represents a point in time (current) number of uninsured who are enrolled in these programs, while the 117,000 estimate for the uninsured includes not only those uninsured at a point in time (time of survey), but also anyone who was uninsured at any time in the prior year. However, it would be safe to say that the current HSF and SF Path enrollment suggests that capacity already exists to care for at least 55,000 enrollees. This leaves up to 62,000 uninsured who may be accessing as-needed services, but do not have a regular source of care provided within existing capacity.
Anticipated Impacts of Health Reform and 1115 Waiver on Healthy San Francisco
As of July 1, 2011, Healthy San Francisco (HSF) had 54,350 participants. HSF has estimated that, if all participants were still enrolled in the program in 2014, 60 percent (32,600) would disenroll from HSF and enroll in health insurance options created by Health Reform. This transition has already begun, with more than 10,000 HSF participants transitioning to SF Path on July 1, 2011. These SF Path participants will be eligible for Medi-Cal or subsidized insurance through the exchange beginning in 2014.
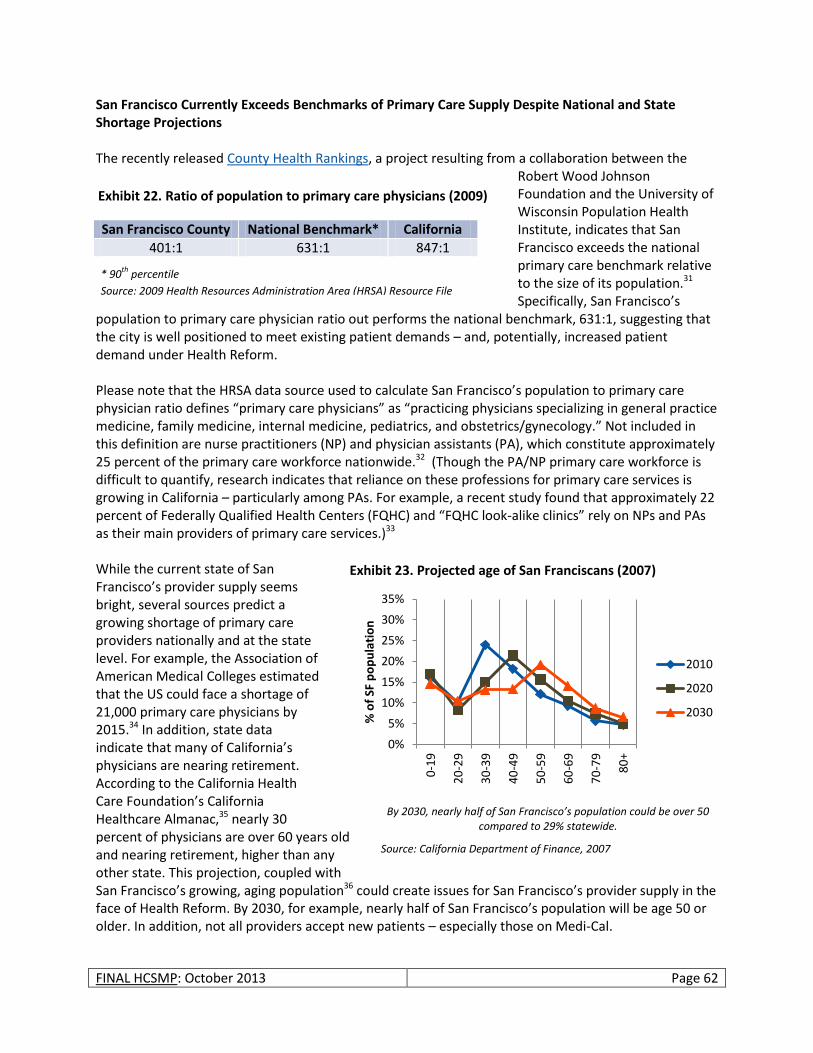
FINAL HCSMP: October 2013 Page 62
San Francisco Currently Exceeds Benchmarks of Primary Care Supply Despite National and State Shortage Projections The recently released County Health Rankings, a project resulting from a collaboration between the
Robert Wood Johnson Foundation and the University of Wisconsin Population Health Institute, indicates that San Francisco exceeds the national primary care benchmark relative to the size of its population.31 Specifically, San Francisco’s
population to primary care physician ratio out performs the national benchmark, 631:1, suggesting that the city is well positioned to meet existing patient demands – and, potentially, increased patient demand under Health Reform. Please note that the HRSA data source used to calculate San Francisco’s population to primary care physician ratio defines “primary care physicians” as “practicing physicians specializing in general practice medicine, family medicine, internal medicine, pediatrics, and obstetrics/gynecology.” Not included in this definition are nurse practitioners (NP) and physician assistants (PA), which constitute approximately 25 percent of the primary care workforce nationwide.32 (Though the PA/NP primary care workforce is difficult to quantify, research indicates that reliance on these professions for primary care services is growing in California – particularly among PAs. For example, a recent study found that approximately 22 percent of Federally Qualified Health Centers (FQHC) and “FQHC look-alike clinics” rely on NPs and PAs as their main providers of primary care services.)33 While the current state of San Francisco’s provider supply seems bright, several sources predict a growing shortage of primary care providers nationally and at the state level. For example, the Association of American Medical Colleges estimated that the US could face a shortage of 21,000 primary care physicians by 2015.34 In addition, state data indicate that many of California’s physicians are nearing retirement. According to the California Health Care Foundation’s California Healthcare Almanac,35 nearly 30 percent of physicians are over 60 years old and nearing retirement, higher than any other state. This projection, coupled with San Francisco’s growing, aging population36 could create issues for San Francisco’s provider supply in the face of Health Reform. By 2030, for example, nearly half of San Francisco’s population will be age 50 or older. In addition, not all providers accept new patients – especially those on Medi-Cal.
San Francisco County National Benchmark* California
401:1 631:1 847:1
* 90th
percentile
Source: 2009 Health Resources Administration Area (HRSA) Resource File
0%
5%
10%
15%
20%
25%
30%
35%
0-1
9
20
-29
30
-39
40
-49
50
-59
60
-69
70
-79
80
+
% o
f SF
po
pu
lati
on
2010
2020
2030
By 2030, nearly half of San Francisco’s population could be over 50 compared to 29% statewide.
Source: California Department of Finance, 2007
Exhibit 22. Ratio of population to primary care physicians (2009)
Exhibit 23. Projected age of San Franciscans (2007)

FINAL HCSMP: October 2013 Page 63
Despite High Number of Primary Care Physicians, San Francisco May Lack Sufficient Primary Care Providers to Serve Expanded Medi-Cal Population in Timely Manner Expanded Medi-Cal Population Likely to Have Difficulty Finding Primary Care Provider Health Reform is expected to expand San Francisco’s Medi-Cal population by an estimated 30,000 individuals. Research suggests, however, that Medi-Cal’s expansion may outpace any corresponding increase in the number of providers who serve Medi-Cal recipients. For example, a recent study indicated that:37
California physicians are less likely to serve Medi-Cal patients (68 percent) compared to patients with private insurance (92 percent) or Medicare (78 percent). This trend follows among primary care providers.
Ninety percent (90 percent) of survey respondents – all California physicians – were accepting new patients when the survey was administered; however, only 57 percent reported accepting new Medi-Cal patients.
Twenty-five percent (25 percent) of physicians provide care to 80 percent of Medi-Cal patients. Most physicians cite low reimbursement rates as the driver of their reluctance to enroll Medi-Cal patients. Through Health Reform, the federal government hopes to ameliorate such concerns by increasing Medi-Cal primary care physician reimbursement rates to match those provided through Medicare – but only for two years (2013 and 2014). While an important first step in shortening the Medi-Cal provider gap, whether this reimbursement increase is sufficient to attract new Medi-Cal providers to San Francisco in a timely manner has yet to be seen. Additionally, the rate increase does not apply to primary care clinics designated as Federally Qualified Health Centers (FQHCs). San Francisco Risks Financial Loss if Timely Access Standards Not Met The issue of increased patient demand vs. a relatively fixed provider workforce poses unique challenges in California given timely access standards imposed by the state’s current 1115 Medicaid Waiver and the California Department of Managed Health Care (DMHC).38 Specifically:
Under SF PATH, SFDPH’s network of care must be compliant with federally mandated timely access standards for primary, urgent, and specialty care and sets financial penalties for non-compliance.
The 1115 Medicaid Waiver expands San Francisco’s Medi-Cal managed care population for SPDs, subjecting more providers to DMHC timely access standards that impact a range of services. In addition, new Medi-Cal eligibles will also be subject to this standard.
To complicate matters, DMHC and the Federal 1115 Medicaid Waiver timely access standards do not always agree, as indicated in the following exhibit.
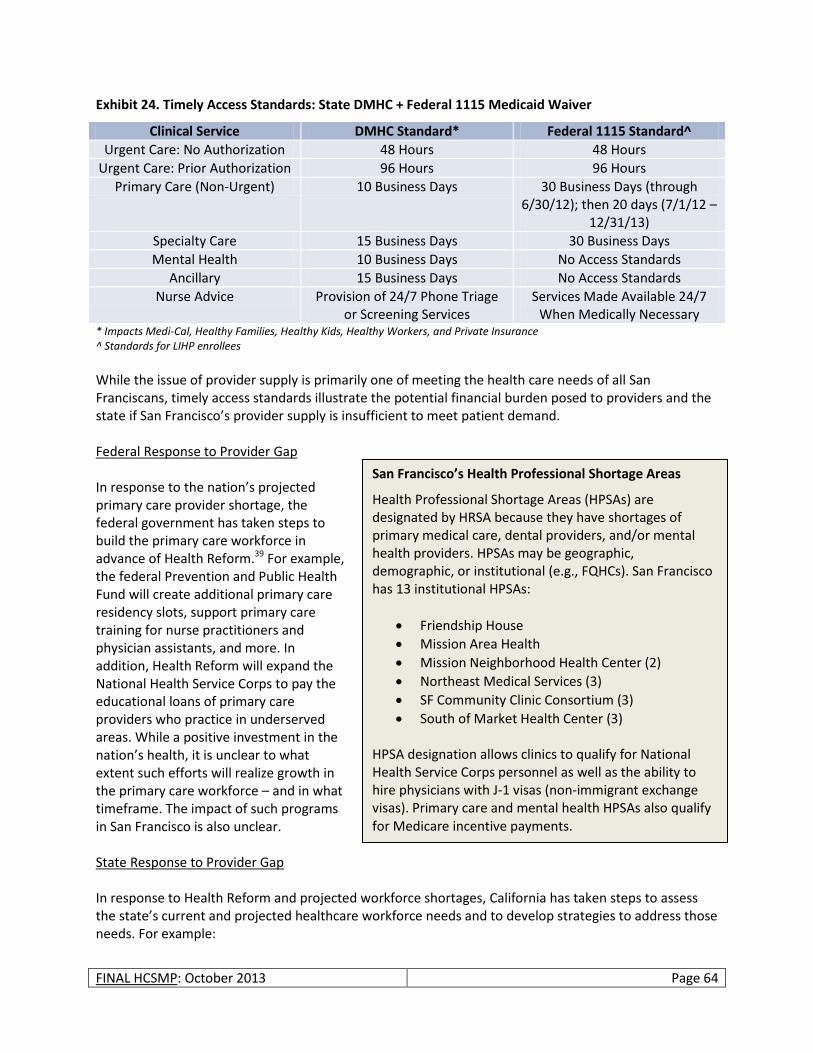
FINAL HCSMP: October 2013 Page 64
Exhibit 24. Timely Access Standards: State DMHC + Federal 1115 Medicaid Waiver
Clinical Service DMHC Standard* Federal 1115 Standard^
Urgent Care: No Authorization 48 Hours 48 Hours
Urgent Care: Prior Authorization 96 Hours 96 Hours
Primary Care (Non-Urgent) 10 Business Days 30 Business Days (through 6/30/12); then 20 days (7/1/12 –
12/31/13)
Specialty Care 15 Business Days 30 Business Days
Mental Health 10 Business Days No Access Standards
Ancillary 15 Business Days No Access Standards
Nurse Advice Provision of 24/7 Phone Triage or Screening Services
Services Made Available 24/7 When Medically Necessary
* Impacts Medi-Cal, Healthy Families, Healthy Kids, Healthy Workers, and Private Insurance ^ Standards for LIHP enrollees
While the issue of provider supply is primarily one of meeting the health care needs of all San Franciscans, timely access standards illustrate the potential financial burden posed to providers and the state if San Francisco’s provider supply is insufficient to meet patient demand. Federal Response to Provider Gap In response to the nation’s projected primary care provider shortage, the federal government has taken steps to build the primary care workforce in advance of Health Reform.39 For example, the federal Prevention and Public Health Fund will create additional primary care residency slots, support primary care training for nurse practitioners and physician assistants, and more. In addition, Health Reform will expand the National Health Service Corps to pay the educational loans of primary care providers who practice in underserved areas. While a positive investment in the nation’s health, it is unclear to what extent such efforts will realize growth in the primary care workforce – and in what timeframe. The impact of such programs in San Francisco is also unclear. State Response to Provider Gap In response to Health Reform and projected workforce shortages, California has taken steps to assess the state’s current and projected healthcare workforce needs and to develop strategies to address those needs. For example:
San Francisco’s Health Professional Shortage Areas
Health Professional Shortage Areas (HPSAs) are designated by HRSA because they have shortages of primary medical care, dental providers, and/or mental health providers. HPSAs may be geographic, demographic, or institutional (e.g., FQHCs). San Francisco has 13 institutional HPSAs:
Friendship House
Mission Area Health
Mission Neighborhood Health Center (2)
Northeast Medical Services (3)
SF Community Clinic Consortium (3)
South of Market Health Center (3) HPSA designation allows clinics to qualify for National Health Service Corps personnel as well as the ability to hire physicians with J-1 visas (non-immigrant exchange visas). Primary care and mental health HPSAs also qualify for Medicare incentive payments.
FINAL HCSMP: October 2013 Page 65
The California Workforce Investment Board (CWIB), in partnership with the Office of Statewide Health Planning and Development (OSHPD), received $150,000 from HRSA to support the development of coherent and comprehensive health workforce development plan for California.
With support from the HRSA Health Care Workforce Planning Grant, CWIB established the Health Workforce Development Council (HWDC) in August 2010. Comprised of wide-reaching representation, the HWDC seeks to expand the state’s health workforce to ensure access to quality healthcare for all Californians. In tune with Health Reform’s focus on primary care, HWDC also hopes to expand California’s full-time primary care workforce by 10 – 25 percent over the next 10 years.
The state has engaged in data collection to determine the direction health care workforce development efforts should take. For example, CWIB and OSHPD commissioned regional focus groups to assess the state’s health care workforce development needs. Through this effort, focus group respondents identified certain categories of primary care and other health workers that will be needed immediately to respond to increased patient demand created by Health Reform: Alternative Medicine Practitioners, Behavioral/Mental Health Specialists, Clinical Laboratory Scientists, Community Health Workers, Family Nurse Practitioners, Geriatric Nurse Practitioners, Nurse Practitioners, Physician Assistants, and Registered Nurses.40 Respondents also projected needs for other health care workers within the next two years and within the next three to five years.
Through these and other efforts, California plans to identify and create statewide and regional partnerships and priorities to shorten its provider gap and meet current and future demands on the health care delivery system. The Health Care Future of San Francisco’s Medically Underserved and Uninsured San Francisco’s primary care provider supply may not solely be a question of whether the city contains enough providers generally; rather, it could be a question of whether the city’s primary care provider population contains enough clinicians willing and able to serve a diverse patient base regardless of ability to pay. For example, HRSA designates at least portions of the following San Francisco neighborhoods as Medically Underserved Areas (MUA):41
Bayview
Chinatown
Downtown/Civic Center
Excelsior
Financial District
Golden Gate Park
Lakeshore
Mission
Mission Bay
Nob Hill
North Beach
Parkside
Potrero Hill
Russian Hill
South of Market
Sunset
Treasure Island/Yerba Buena Island
Visitacion Valley
West of Twin Peak
Determined by calculating and weighting four variables – ratio of primary medical care physicians per 1,000 population, infant mortality rate, percentage of the population with incomes below the poverty level, and percentage of the population age 65 and over – MUA designation suggests that residents of
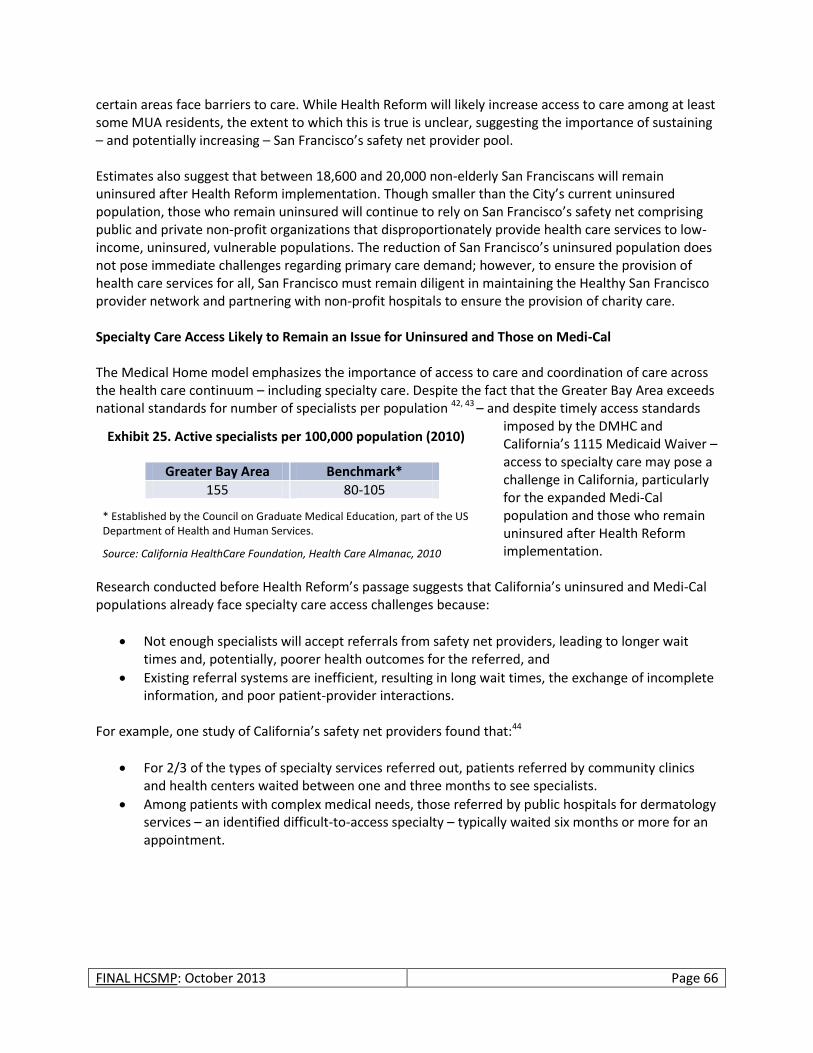
FINAL HCSMP: October 2013 Page 66
certain areas face barriers to care. While Health Reform will likely increase access to care among at least some MUA residents, the extent to which this is true is unclear, suggesting the importance of sustaining – and potentially increasing – San Francisco’s safety net provider pool. Estimates also suggest that between 18,600 and 20,000 non-elderly San Franciscans will remain uninsured after Health Reform implementation. Though smaller than the City’s current uninsured population, those who remain uninsured will continue to rely on San Francisco’s safety net comprising public and private non-profit organizations that disproportionately provide health care services to low-income, uninsured, vulnerable populations. The reduction of San Francisco’s uninsured population does not pose immediate challenges regarding primary care demand; however, to ensure the provision of health care services for all, San Francisco must remain diligent in maintaining the Healthy San Francisco provider network and partnering with non-profit hospitals to ensure the provision of charity care. Specialty Care Access Likely to Remain an Issue for Uninsured and Those on Medi-Cal The Medical Home model emphasizes the importance of access to care and coordination of care across the health care continuum – including specialty care. Despite the fact that the Greater Bay Area exceeds national standards for number of specialists per population 42, 43 – and despite timely access standards
imposed by the DMHC and California’s 1115 Medicaid Waiver – access to specialty care may pose a challenge in California, particularly for the expanded Medi-Cal population and those who remain uninsured after Health Reform implementation.
Research conducted before Health Reform’s passage suggests that California’s uninsured and Medi-Cal populations already face specialty care access challenges because:
Not enough specialists will accept referrals from safety net providers, leading to longer wait times and, potentially, poorer health outcomes for the referred, and
Existing referral systems are inefficient, resulting in long wait times, the exchange of incomplete information, and poor patient-provider interactions.
For example, one study of California’s safety net providers found that:44
For 2/3 of the types of specialty services referred out, patients referred by community clinics and health centers waited between one and three months to see specialists.
Among patients with complex medical needs, those referred by public hospitals for dermatology services – an identified difficult-to-access specialty – typically waited six months or more for an appointment.
Greater Bay Area Benchmark*
155 80-105
* Established by the Council on Graduate Medical Education, part of the US Department of Health and Human Services.
Source: California HealthCare Foundation, Health Care Almanac, 2010
Exhibit 25. Active specialists per 100,000 population (2010)
FINAL HCSMP: October 2013 Page 67
In response to such findings, many clinics across the state have piloted various strategies – such as ensuring appropriate referrals, expanding primary care site expertise, increasing non-visit tools to support consult needs, bringing specialty care services on-site, building institutional relationships, and expanding the use of telemedicine – to improve patient access to specialty care.45 San Francisco has served as a national model in this regard through San Francisco General Hospital’s (SFGH) use of the eReferral system throughout its network of safety net clinics. Developed by SFGH and the University of California, San Francisco, the eReferral system allows SFGH primary care providers and specialists to exchange free text messages through a referral program embedded in each patient’s electronic medical record. A specialty clinic’s designated “reviewer” must respond to referrals within three days, and the message exchange will result in scheduling an approved specialty care appointment, requesting more information (if needed), providing consultation, or direct scheduling of other needed services. A one-year pilot of the eReferral system in SFGH’s gastroenterology clinic found that wait times for appointments fell from 11 months to four months after the system’s implementation.46 While San Francisco’s innovations promise to improve vulnerable populations’ access to specialty care, such efforts may still not meet the timely access standards set forth by the DMHC and California’s 1115 Medicaid Waiver. In addition, these innovations expand access within the existing safety care network and do not encourage an expansion of the specialty care workforce itself – of particular concern in more difficult-to-access specialties. In short, San Francisco may still lack the right number – and the right mix – of specialists sufficient to meet the demand and often complex needs of San Francisco’s Medi-Cal and uninsured populations.
Health Care Financing
Overview
In 2009, the US spent $2.5 trillion on health care, or about $8,086 per capita.47, 48 While health care spending increased by only four percent from 2008 to 2009 – an all-time low and the smallest annual increase on record – health care spending continues to occupy a large share of the nation’s economy, representing 17.6 percent of the nation’s gross domestic product (GDP); 49 current projections indicate that health care spending may exceed 25 percent of the nation’s GDP by 2035.50 While US health care spending far exceeds that of other
California’s Most Difficult-to-Access Specialties
In 2007, Kaiser Permanente Community Benefit and the California HealthCare Foundation offered local safety net coalitions the chance to implement strategies to improve specialty care access for their patients. Selected coalitions most often focused on the following specialty areas for improved access:
Orthopedics
Gastroenterology
Neurology
Dermatology
Cardiology
Endocrinology
Ophthalmology
Rheumatology
GDP
A nation’s gross domestic product, or “GDP,” refers to the market value of all final goods and services produced within a country in a given time period. GDP is considered one measure of a country’s economic health. Generally speaking, the larger a country’s GDP, the stronger its economy.
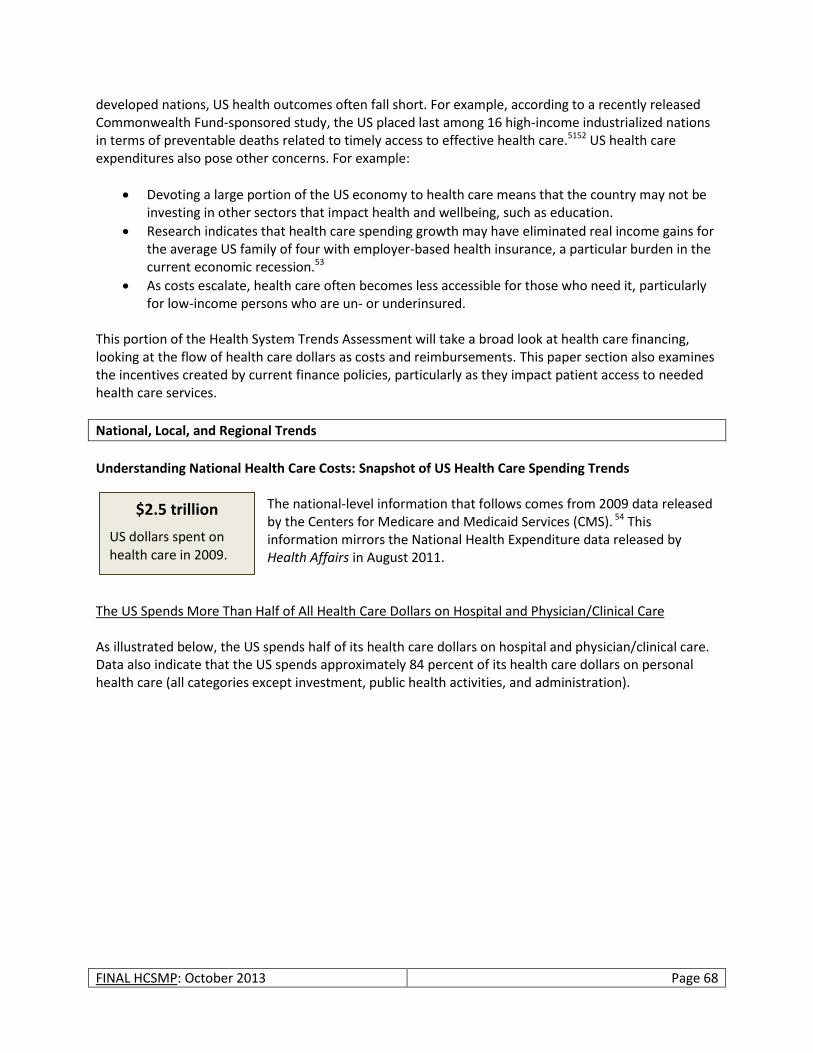
FINAL HCSMP: October 2013 Page 68
developed nations, US health outcomes often fall short. For example, according to a recently released Commonwealth Fund-sponsored study, the US placed last among 16 high-income industrialized nations in terms of preventable deaths related to timely access to effective health care.5152 US health care expenditures also pose other concerns. For example:
Devoting a large portion of the US economy to health care means that the country may not be investing in other sectors that impact health and wellbeing, such as education.
Research indicates that health care spending growth may have eliminated real income gains for the average US family of four with employer-based health insurance, a particular burden in the current economic recession.53
As costs escalate, health care often becomes less accessible for those who need it, particularly for low-income persons who are un- or underinsured.
This portion of the Health System Trends Assessment will take a broad look at health care financing, looking at the flow of health care dollars as costs and reimbursements. This paper section also examines the incentives created by current finance policies, particularly as they impact patient access to needed health care services.
National, Local, and Regional Trends
Understanding National Health Care Costs: Snapshot of US Health Care Spending Trends
The national-level information that follows comes from 2009 data released by the Centers for Medicare and Medicaid Services (CMS). 54 This information mirrors the National Health Expenditure data released by Health Affairs in August 2011.
The US Spends More Than Half of All Health Care Dollars on Hospital and Physician/Clinical Care As illustrated below, the US spends half of its health care dollars on hospital and physician/clinical care. Data also indicate that the US spends approximately 84 percent of its health care dollars on personal health care (all categories except investment, public health activities, and administration).
$2.5 trillion
US dollars spent on health care in 2009.
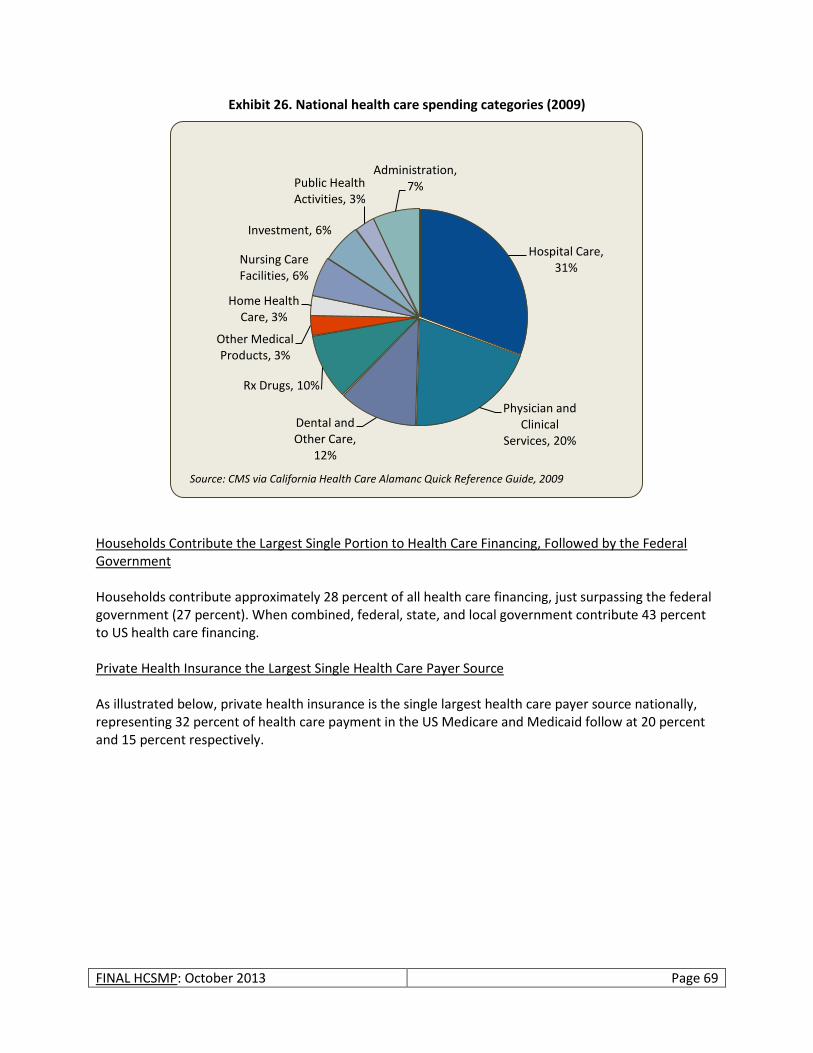
FINAL HCSMP: October 2013 Page 69
Exhibit 26. National health care spending categories (2009)
Households Contribute the Largest Single Portion to Health Care Financing, Followed by the Federal Government Households contribute approximately 28 percent of all health care financing, just surpassing the federal government (27 percent). When combined, federal, state, and local government contribute 43 percent to US health care financing. Private Health Insurance the Largest Single Health Care Payer Source As illustrated below, private health insurance is the single largest health care payer source nationally, representing 32 percent of health care payment in the US Medicare and Medicaid follow at 20 percent and 15 percent respectively.
Hospital Care, 31%
Physician and Clinical
Services, 20%
Dental and Other Care,
12%
Rx Drugs, 10%
Other Medical Products, 3%
Home Health Care, 3%
Nursing Care Facilities, 6%
Investment, 6%
Public Health Activities, 3%
Administration, 7%
Source: CMS via California Health Care Alamanc Quick Reference Guide, 2009
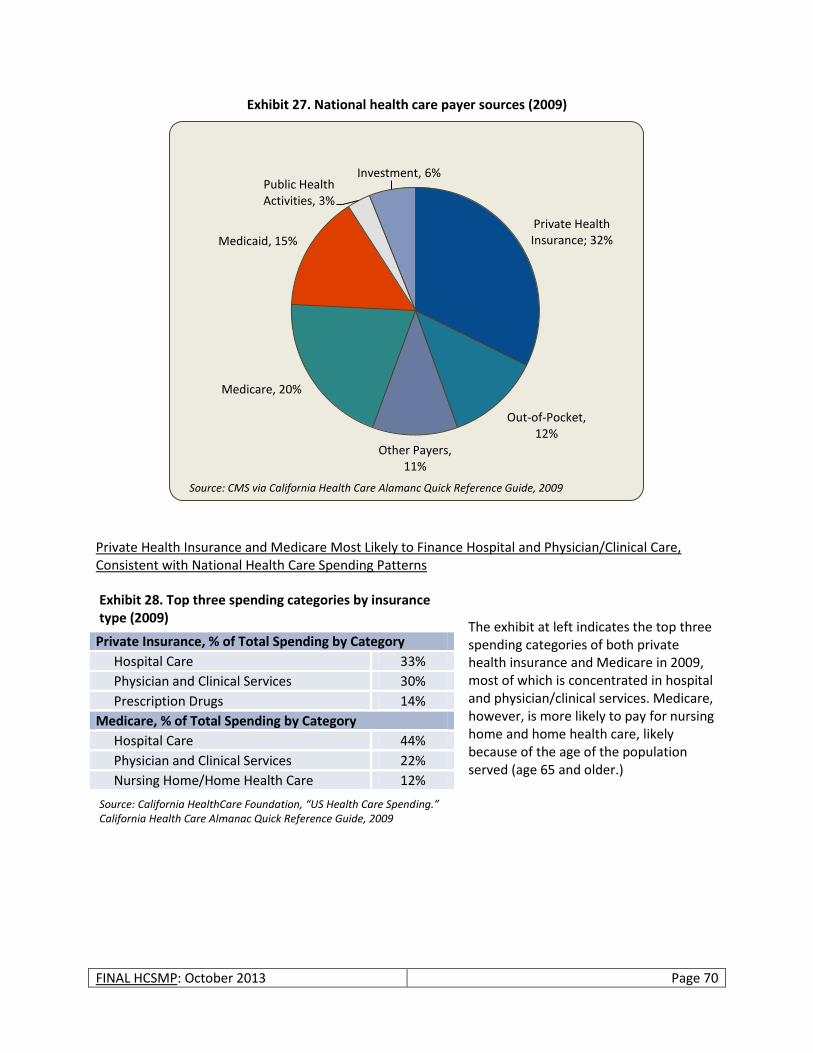
FINAL HCSMP: October 2013 Page 70
Exhibit 27. National health care payer sources (2009)
Private Health Insurance and Medicare Most Likely to Finance Hospital and Physician/Clinical Care, Consistent with National Health Care Spending Patterns
The exhibit at left indicates the top three spending categories of both private health insurance and Medicare in 2009, most of which is concentrated in hospital and physician/clinical services. Medicare, however, is more likely to pay for nursing home and home health care, likely because of the age of the population served (age 65 and older.)
Private Health Insurance; 32%
Out-of-Pocket, 12%
Other Payers, 11%
Medicare, 20%
Medicaid, 15%
Public Health Activities, 3%
Investment, 6%
Source: CMS via California Health Care Alamanc Quick Reference Guide, 2009
Private Insurance, % of Total Spending by Category
Hospital Care 33%
Physician and Clinical Services 30%
Prescription Drugs 14%
Medicare, % of Total Spending by Category
Hospital Care 44%
Physician and Clinical Services 22%
Nursing Home/Home Health Care 12%
Exhibit 28. Top three spending categories by insurance type (2009)
Source: California HealthCare Foundation, “US Health Care Spending.” California Health Care Almanac Quick Reference Guide, 2009
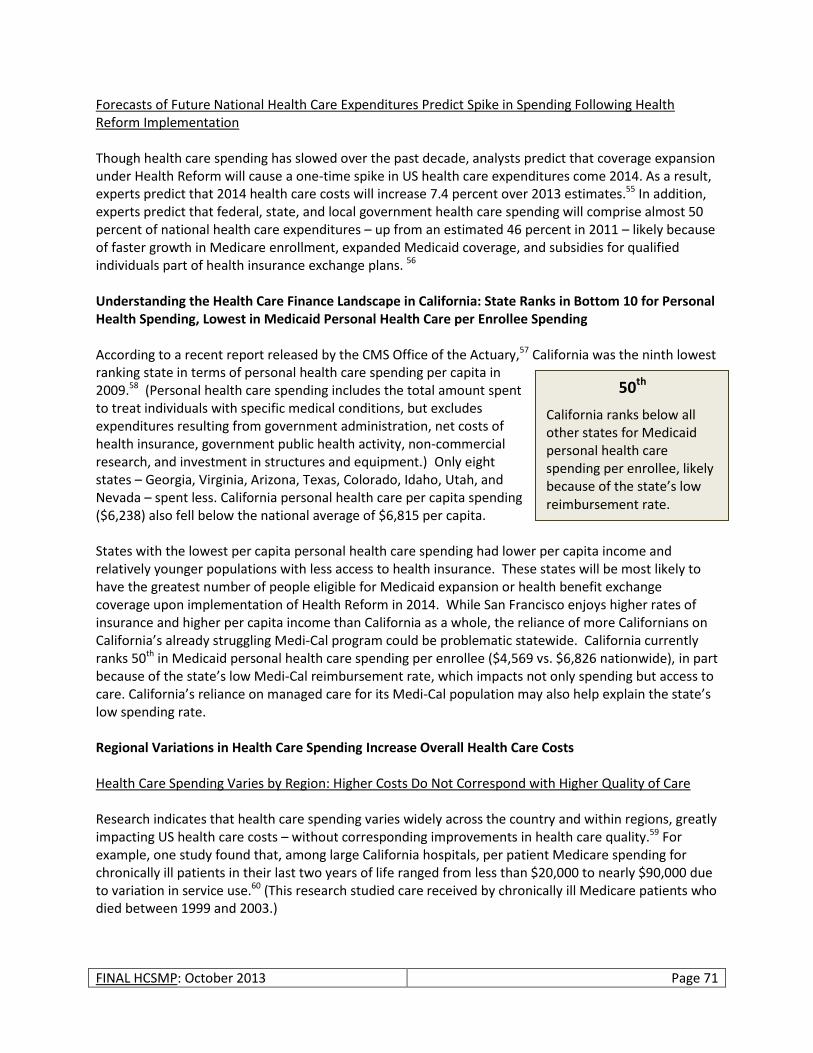
FINAL HCSMP: October 2013 Page 71
Forecasts of Future National Health Care Expenditures Predict Spike in Spending Following Health Reform Implementation Though health care spending has slowed over the past decade, analysts predict that coverage expansion under Health Reform will cause a one-time spike in US health care expenditures come 2014. As a result, experts predict that 2014 health care costs will increase 7.4 percent over 2013 estimates.55 In addition, experts predict that federal, state, and local government health care spending will comprise almost 50 percent of national health care expenditures – up from an estimated 46 percent in 2011 – likely because of faster growth in Medicare enrollment, expanded Medicaid coverage, and subsidies for qualified individuals part of health insurance exchange plans. 56 Understanding the Health Care Finance Landscape in California: State Ranks in Bottom 10 for Personal Health Spending, Lowest in Medicaid Personal Health Care per Enrollee Spending According to a recent report released by the CMS Office of the Actuary,57 California was the ninth lowest ranking state in terms of personal health care spending per capita in 2009.58 (Personal health care spending includes the total amount spent to treat individuals with specific medical conditions, but excludes expenditures resulting from government administration, net costs of health insurance, government public health activity, non-commercial research, and investment in structures and equipment.) Only eight states – Georgia, Virginia, Arizona, Texas, Colorado, Idaho, Utah, and Nevada – spent less. California personal health care per capita spending ($6,238) also fell below the national average of $6,815 per capita. States with the lowest per capita personal health care spending had lower per capita income and relatively younger populations with less access to health insurance. These states will be most likely to have the greatest number of people eligible for Medicaid expansion or health benefit exchange coverage upon implementation of Health Reform in 2014. While San Francisco enjoys higher rates of insurance and higher per capita income than California as a whole, the reliance of more Californians on California’s already struggling Medi-Cal program could be problematic statewide. California currently ranks 50th in Medicaid personal health care spending per enrollee ($4,569 vs. $6,826 nationwide), in part because of the state’s low Medi-Cal reimbursement rate, which impacts not only spending but access to care. California’s reliance on managed care for its Medi-Cal population may also help explain the state’s low spending rate. Regional Variations in Health Care Spending Increase Overall Health Care Costs Health Care Spending Varies by Region: Higher Costs Do Not Correspond with Higher Quality of Care Research indicates that health care spending varies widely across the country and within regions, greatly impacting US health care costs – without corresponding improvements in health care quality.59 For example, one study found that, among large California hospitals, per patient Medicare spending for chronically ill patients in their last two years of life ranged from less than $20,000 to nearly $90,000 due to variation in service use.60 (This research studied care received by chronically ill Medicare patients who died between 1999 and 2003.)
50th
California ranks below all other states for Medicaid personal health care spending per enrollee, likely because of the state’s low reimbursement rate.
FINAL HCSMP: October 2013 Page 72
The Congressional Budget Office (CBO) examined the geographic variability of Medicare spending based on 2005 data and found that:61
The price of health care services and severity of illness explain less than half of all geographic variability.
Individual preferences explain little of the geographic variability of health care spending.
Much remains unexplained regarding spending variability: Some regions are more likely than others to adopt low-cost, highly effective patterns than others.
CBO research also found, however, that geographic variations in Medicare spending were less pronounced than overall health care spending nationally. The CBO attributed this finding, at least in part, to changes made in Medicare reimbursement policy, suggesting that health care policy mechanisms have at least the potential to impact health care spending trends while increasing attention on care coordination and quality.62 Subsequent findings have strengthened the connection between care reimbursement mechanisms, degree of care coordination/integration, and cost. Research has shown, for example, that health care cost and use variation among older adults (age 55+) is greatest among fee-for-service systems compared to Health Maintenance Organizations.63 Hospital Consolidation Contributes to Regional Cost Variation in California Analysis of state data indicates a significant degree of cost variation between hospitals in Northern versus Southern California, due in large part to the degree of hospital competition that exists in each region. In Northern California, where hospital consolidation is more prevalent, hospitals in the region’s six most populous counties generate roughly 56 percent more revenue per patient day than hospitals in Southern California’s six largest counties.64 In San Francisco, this translates to $7,349 per patient day compared to the $4,389 per patient day revenue generated by hospitals in Los Angeles County. Experts agree that the biggest driver of this regional health care cost variation is lack of competition in the Northern California hospital market caused by a significant move toward hospital system consolidation.65 In San Francisco, for example, the share of unaffiliated hospitals dropped from 71 to 32 percent between 1995 and 1996, 66 giving a small number of hospital networks the power to negotiate higher prices with private insurers. These costs are most often passed on to employers and individual health care consumers – without a corresponding improvement in care quality.67 Private insurers affirm that higher negotiated hospital rates translate to higher costs for health care consumers. In 2011, for example, Aetna Inc. indicated that it charged Northern California consumers 30 percent more in premiums compared to customers in Southern California.68 Blue Shield of California affirmed this trend, indicating that it charged Northern California customers 40 percent more for coverage compared to their Southern California counterparts. While health care experts agree that consolidation has the power to increase health care costs without corresponding improvements in care, a singular path toward mitigating the trend is unclear. Some cite the need for greater pricing transparency, requiring state action to California Insurance Code Section 10133, which allows private health insurers to contract with a closed panel of hospitals and doctors. (Ironically, California amended this section of the Insurance Code in 1982 in an effort to contain rising health care costs.69) Complicating the issue still further is the view that consolidation has the power to reduce care fragmentation in otherwise competitive markets. Per the California HealthCare Foundation, for example, “Hospitals [in Los Angeles] are starting to consider affiliating or even merging with each
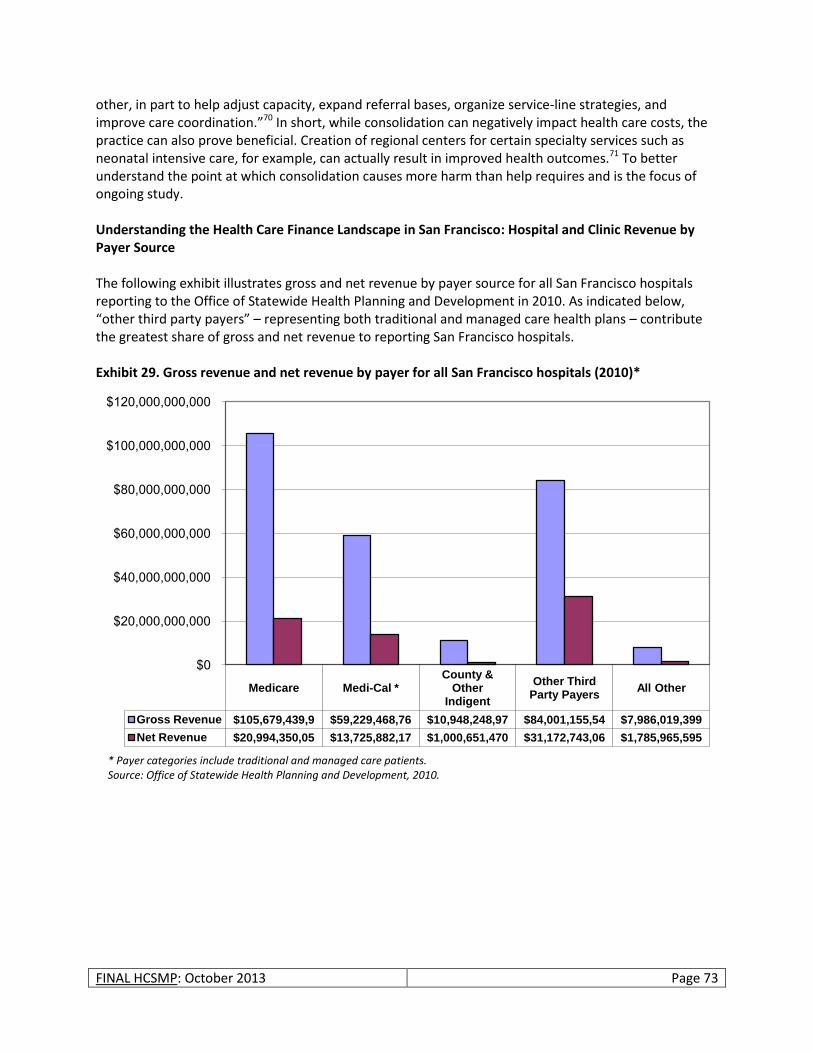
FINAL HCSMP: October 2013 Page 73
other, in part to help adjust capacity, expand referral bases, organize service-line strategies, and improve care coordination.”70 In short, while consolidation can negatively impact health care costs, the practice can also prove beneficial. Creation of regional centers for certain specialty services such as neonatal intensive care, for example, can actually result in improved health outcomes.71 To better understand the point at which consolidation causes more harm than help requires and is the focus of ongoing study. Understanding the Health Care Finance Landscape in San Francisco: Hospital and Clinic Revenue by Payer Source The following exhibit illustrates gross and net revenue by payer source for all San Francisco hospitals reporting to the Office of Statewide Health Planning and Development in 2010. As indicated below, “other third party payers” – representing both traditional and managed care health plans – contribute the greatest share of gross and net revenue to reporting San Francisco hospitals. Exhibit 29. Gross revenue and net revenue by payer for all San Francisco hospitals (2010)*
Medicare Medi-Cal * County &
Other Indigent
Other Third Party Payers
All Other
Gross Revenue $105,679,439,9 $59,229,468,76 $10,948,248,97 $84,001,155,54 $7,986,019,399
Net Revenue $20,994,350,05 $13,725,882,17 $1,000,651,470 $31,172,743,06 $1,785,965,595
$0
$20,000,000,000
$40,000,000,000
$60,000,000,000
$80,000,000,000
$100,000,000,000
$120,000,000,000
* Payer categories include traditional and managed care patients. Source: Office of Statewide Health Planning and Development, 2010.
FINAL HCSMP: October 2013 Page 74
Drivers of Health Care Costs
In an effort to curb the US’s current health care spending trajectory, much research has focused on identifying the drivers of national health care costs. Primary among them are:
Medical Technology: Research indicates that medical technology has contributed to between 28 and 65 percent of health care spending growth in the US, largely because technology expands the number – and cost – of available treatments.72
Health Status, Particularly Obesity and Chronic Disease: Research suggests that obesity accounts for an estimated 12 percent of health care spending growth in the US.73 Viewed collectively, health care costs associated with chronic disease account for more than 75 percent of US health care spending.74
Administration and Inefficiencies in the US Health Care System: The US spends significantly more than other developed nations in terms of drug prices and insurance administration. In addition, inefficiencies exist within US health care systems. For example, about seven percent of US health care spending goes toward administration;75 however, administrative costs are much lower for the Medicare program (less than two percent) because it is operated by a single entity – the federal government.76
The aging of the population and medical malpractice contribute only minimally to increasing US health care costs.77
The Financing Structure of Medi-Cal, California’s Medicaid Program
Before discussing the impact of health care reimbursement more broadly, it is important to have a basic understanding of Medi-Cal’s financing structure. (Medi-Cal is California’s Medicaid program.) In California, approximately half of all beneficiaries receive their benefits through Medi-Cal managed care and half through the fee-for-service (FFS) model.78 Fee-for-Service Under the FFS model, Medi-Cal beneficiaries may seek services from any participating provider, and providers are paid for each service they provide (e.g., an office visit, test, procedure, or other health care service). The FFS model allows greater flexibility for Medi-Cal beneficiaries to see the physician of their choice. However, it is also seen as a barrier to coordinated care because the system incentivizes providers to provide more services (whether or not they are needed) and provides few incentives to reduce cost, coordinate care, or increase quality.
Understanding Health Care Speak: Fee-for-Service and Managed Care
Fee-for-Service (FFS): Payment for health care based on the charges for each service or item use. The more services provided, the greater the reimbursement, creating an incentive to provide more care than is necessarily needed while driving up health care costs.
Managed Care: The use of a manager to control medical service use and contain health care costs. Managed care incentivizes appropriate levels of care, thereby containing health care costs; however, patients have less choice in which providers they may see.

FINAL HCSMP: October 2013 Page 75
Managed Care Twenty-five of California’s 58 counties operate Medi-Cal managed care programs, though the model of managed care delivery varies. (Please see below for more information.) The remaining counties rely on FFS Medi-Cal. Under the managed care system, beneficiaries enroll in a health plan and see providers within a designated network participating in that plan. Members choose one main physician, called a primary care physician (PCP), who is responsible for the beneficiary’s basic care and coordinates other medical needs, including referrals to specialists. Managed care is intended to integrate the payment and delivery of health in an effort to deliver the highest quality services at the lowest possible cost. Three Models of Medi-Cal Managed Care There are three models of Medi-Cal Managed Care:79
Two-plan Model: The Two-Plan Model is the most common of the Medi-Cal managed care programs. Under this model, the State Department of Health Care Services contracts with two health plans: the Local Initiative, which is a quasi-governmental entity developed by public providers and local stakeholders with a governing board established by the county board of supervisors; and the Commercial Plan, which is a private plan selected through a competitive process. The Two-Plan Model covers the most populous areas of the state and is implemented in the following 12 counties: Alameda, Contra Costa, Fresno, Kern, Los Angeles, Riverside, San Bernardino, San Francisco, San Joaquin, Santa Clara, Stanislaus, and Tulare.
County Organized Health Systems: County Organized Health Systems (COHS) are single-plan models operated by counties that accept full risk for a broad scope of services. COHS operate with special approval under federal law. There are five COHS operating in the following nine counties: Santa Barbara, San Mateo, Monterey, Solano, San Luis Obispo, Santa Cruz, Napa, Yolo, and Orange Counties.
Geographic Managed Care: Operating in San Diego and Sacramento counties, the Geographic Managed Care Model is a multi-plan competitive model, which is similar to the Medicaid managed care programs used in the majority of other states. In this model, most of the commercial health plans in a geographic area participate in the Medicaid managed care program. Plans negotiate with the State to establish final payment rates.
Medi-Cal Managed Care’s Mandatory Enrollment Populations In counties that offer Medi-Cal Managed Care, nearly all beneficiaries are required to enroll in managed care. Prior to June 2011, children, non-disabled parents, and pregnant women were required to enroll in a Medi-Cal Managed Care plan to access their benefits. These populations are still required to access the Medi-Cal benefits to which they are entitled through managed Medi-Cal. As of June 2011, seniors and
San Francisco’s Two-Plan Model
San Francisco administers its Medi-Cal Managed Care program as a “two-plan” model. San Francisco’s Medi-Cal Managed Care beneficiaries may choose between two health plans:
San Francisco Health Plan (the Local Initiative); or
Anthem Blue Cross (the commercial plan).

FINAL HCSMP: October 2013 Page 76
persons with disabilities (SPD) are also required to enroll in Medi-Cal Managed Care under California’s current 1115 Medicaid Waiver. SPDs constitute a small share of the Medi-Cal population – 16,000 – 20,000 in San Francisco – but a large portion of Medi-Cal spending, and participation in Medi-Cal Managed Care will allow for better care coordination and management of the SPD population’s chronic conditions. Managed care enrollment of the SPD population is now mandatory for all Medi-Cal-eligible SPDs with the exception of individuals who are dually eligible for both Medi-Cal and Medicare. Foster children, beneficiaries who pay a portion of their Medi-Cal costs, and people in long-term care remain exempt from mandatory enrollment in Medi-Cal Managed Care. Capitation Under Medi-Cal Managed Care, health plans received a flat rate from the State per member per month, no matter how frequently or infrequently patients access care. Similarly, under full capitation, health plans pay their member providers a flat rate per patient, per month, no matter how frequently or infrequently they see that patient. In return, health plans assure the State and providers assure health plans that beneficiaries receive all necessary covered services. Under this arrangement, health plans have a finite amount of money with which to contract with providers for services. Providers assume financial risk should the cost of care exceed total reimbursement. Carved Out Services Some medical services are “carved out” of the capitated Medi-Cal Managed Care model. That is, they are covered under a different payment arrangement. These carved-out services include: specialty mental health, dental services, services for seriously ill and disabled children, home and community-based services, and long-term facility care. Carve-outs were created for several reasons, primarily to increase access to qualified professionals that provide highly-specialized care that is not always readily available in or accessible to all-inclusive managed care organizations. Further, the appropriate treatment for specialized health care needs can contribute to overall cost-effectiveness by removing barriers to timely and effective care and consolidating specialized care into fewer administrative structures. However, by their nature, carve outs promote non-integrated care. The fragmented care that results when individuals with complex health conditions must obtain the care they need from multiple systems often results in poor health outcomes, duplication of services, and unnecessarily high costs.82
The California Context: Historical Shifts in Managed Care Reimbursement80, 81
Reimbursement structures advanced under Health Reform increasingly require providers to share the financial risk of patient care, creating incentives for better care coordination and cost containment. California, given its long history of managed care, is no stranger to risk-sharing. In the 1990s, for example, managed care plans increasingly transferred financial risk and care management to physician groups and hospitals, resulting in greater consolidation in both hospital and provider group markets. This “California Model” largely fell out of favor by the end of the decade as a result of poor management, perceived inadequate payments from health plans, and reduced opportunities for cost containment as the managed care system became more efficient.

FINAL HCSMP: October 2013 Page 77
Implementation of Medicaid Reforms Will Fall Heavily on Medi-Cal Managed Care Medi-Cal managed care plans are expected to face particular challenges under Health Reform and California’s 1115 Medicaid Waiver.83 Both initiatives demand that managed care plans:
Accommodate increased patient enrollment as part of Medi-Cal’s expansion – including the mandatory enrollment of SPDs and other designated populations.
Expand their provider networks to ensure their ability to serve Medi-Cal patients, a particular challenge given Medi-Cal’s low provider reimbursement rate.
Contain costs. Given that managed care, by definition, leans against FFS reimbursement in favor of capitation – and that managed care already emphasizes care coordination – it is unclear to what extent managed care plans will be able to decrease expenses further given the high health care costs associated with those it serves (e.g., SPDs).
Improve health outcomes, again a unique challenge given the composition of Medi-Cal Managed Care’s patient population.
The ability of Medi-Cal Managed Care to respond to these demands will likely depend on government assistance in the form of policy and fiscal support, the latter of which seems particularly unlikely given the grim financial situation facing all levels of government.
Health Reform’s Impact on Reimbursement
Health care reimbursement most often reflects an indirect, third-party transaction based on rates negotiated between health plans and providers – not the actual cost of providing care. As such, reimbursement models have the power to create significant incentives to increase health care quality and patient access – or not. This section provides an overview of how Health Reform advances various reimbursement structures that impact patient care, particularly for low-income vulnerable populations, as well as policy changes that promise to offer new opportunities and challenges for health care delivery going forward. General Impacts As of 2016, the Congressional Budget Office estimates that 92 percent of US residents (all ages) will be insured as a result of federal Health Reform. In San Francisco, this translates to approximately 740,816 residents who will have employer-based coverage, purchase insurance through Covered California, be part of California’s expanded Medi-Cal program, or maintain coverage through Medicare or another public source. San Francisco’s growing insured population will put increased demands on the existing health care system, though hopefully resulting in expanded patient access to care and better health outcomes. Through an extensive patchwork of reimbursement incentives and demonstration programs piloting new care delivery models, Health Reform attempts to curb health care spending while simultaneously improving health care affordability and
Cuts in Medicare Rates Likely Mean Cuts for All
Reimbursement rates – including reimbursement from private insurance plans – are often tied to the Medicare reimbursement rate. If the federal government reduces Medicare reimbursement rates, which is likely given the current fiscal crisis, other plans and programs are expected to follow suit.
FINAL HCSMP: October 2013 Page 78
access for patients. Key to Health Reform’s efforts is decreased reliance on FFS reimbursement in favor of incentives that reward providers for performance; however, the savings generated by such changes remain unclear – particularly in California, a state with a more extensive managed care network that is already focused on cost containment through capitation models of reimbursement. Also uncertain is the question of whether providers will be equipped to serve an expanded patient population efficiently and cost-effectively without shifting substantial costs to the privately insured, thereby driving up insurance premiums and health care costs more broadly. Hospital Systems Will Be Heavily Impacted by Reimbursement Changes Under Health Reform
Medicare to Launch Hospital Reimbursement Reforms as Performance Incentives As of Federal Fiscal Year 2013, the Medicare program will launch two hospital reimbursement reforms, one of which is mandatory and the other voluntary:
Hospital Readmissions Payment Reductions (Mandatory): In an effort to curb “excess readmissions” for specified conditions (heart attack, heart failure, pneumonia in 2013 and 2014),84 Medicare will reduce a hospital’s base Diagnosis Related Group (DRG) payment for the specified condition if readmissions for that condition exceed the expected rate. To avoid financial penalties through this reform, hospitals will be forced to carefully manage a patient’s care and discharge – a particular challenge for safety-net hospitals that typically serve a sicker population more likely to require readmission.
Hospital Value-Based Purchasing Program (Voluntary): Under this initiative, hospitals meeting certain requirements will receive incentive payments. Specifically, Medicare-designated hospitals that meet certain performance metrics and have sufficient infrastructure in place to meet CMS reporting requirements are eligible for payment rewards. Participation in this program is voluntary; however, hospitals that are able will likely engage in the program as a means of offsetting Medicare base payment reductions.
Medicaid to Adjust Hospital Payments for Hospital-Acquired Conditions
Under Health Reform, Medicaid will adopt a reform already part of the Medicare program: payment adjustments for hospital-acquired conditions (HACs). Following implementation, Medicaid will no longer reimburse hospitals for 10 types of HACs and other injuries and illnesses considered preventable.
Health Reform to Decrease Medicare and Medicaid Disproportionate Share Hospital (DSH) Payments, Extent of Financial Impact Unclear
The DSH program provides special funding to certain hospitals in recognition of the higher operating costs they incur in treating a large share of low-income patients. Health Reform makes annual reductions to both the Medicaid and Medicare DSH programs starting in 2014, coinciding with Medicaid’s expansion, implementation of health benefit exchanges, and the effective date of private insurance requirements. Health Reform directs the Secretary
18,600* – 29,000^
Estimated number of non-elderly San Franciscans (ages 0-64) who will remain uninsured after Health Reform implementation.
* Based on 2009 CHIS estimate of non-elderly San Franciscans uninsured at any point in the last year. ^ January 1, 2015 projection based on Healthy San Francisco and SF PATH program data.
FINAL HCSMP: October 2013 Page 79
of Health and Human Services to develop a methodology for imposing DSH reductions but provides no guidance on how states are to allocate DSH funds to individual hospitals. While DSH reductions are expected to be offset somewhat by a decrease in the number of uninsured patients seeking care after Health Reform implementation, the question remains as to whether DSH recipients will ultimately face a funding gap, potentially limiting their ability to serve those in need.
Need for Hospital Charity Care Will Persist After Health Reform Though Future Program Funding Uncertain
Charity care is currently the primary source of hospital care for low-income uninsured and underinsured San Franciscans. Charity care is the provision of services to low-income individuals without the expectation of reimbursement. Charity care is one component of the community benefit non-profit hospitals provide in exchange for their tax-exempt status. In 2010, San Francisco hospitals spent approximately $178 million in charity care services. San Francisco hospitals provide charity care both within and outside of the Healthy San Francisco program. Within Healthy San Francisco, the hospitals’ charity care commitments are leveraged in coordination with a primary care medical home to provide comprehensive health care services for participating uninsured San Franciscans. In addition, hospitals provide charity care to uninsured San Franciscans not participating in Healthy San Francisco. With the implementation of Health Reform, while hospitals will certainly see a decline in the number of uninsured utilizing hospital charity care services, there will still be demand for charity care services. As mentioned previously, 92 percent of US residents will be insured after Health Reform implementation; this leaves an estimated uninsured population of 20 million85 that includes between 18,600 and 29,000 non-elderly San Franciscans. One-third of the uninsured (all ages) will be undocumented immigrants. Many of the remaining two-thirds are likely to be unable to afford the coverage options that are available to them. Hospital charity care has historically been funded largely through cross-subsidization by privately insured patients. However, as hospitals must negotiate lower rates with insurers to remain competitive, the amount of funding available for community benefit will diminish. Additionally, other funds that are currently relied upon to support charity are programs may also diminish after full Health Reform implementation. For example, donors and other funding sources may perceive a reduced need for funding due to Health Reform or find it difficult to support to care for what is perceived to be a group comprising only undocumented individuals or those unwilling to comply with the law. Federally Qualified Health Centers Receive Incentives to Serve Expanded Insured Population – Increasing Patient Access to Care – Though Base Funding Threatened The nation’s Federally Qualified Health Centers (FQHC) provide a pivotal service to low-income persons through the provision of preventive and primary care. In California, for example, FQHCs serve 16 percent of the state’s Medi-Cal population but represent only 1.7 percent of the state’s total Medi-Cal spending.86 Under Health Reform, FQHCs – also known as Community Health Centers – are expected to double their patient capacity while generating cost savings to the health care system. Health Reform legislation sets forth a number of provisions that support FQHCs financially while expanding patient access to care. In recognition of their care of low-income and vulnerable populations, FQHCs receive cost-based reimbursement. (See inset below for more information.) While Health Reform relies heavily on FQHCs for many of its initiatives and also provides various avenues of support, some believe that the future of their cost-based reimbursement mechanism may be in question in the face of Medicaid cuts.
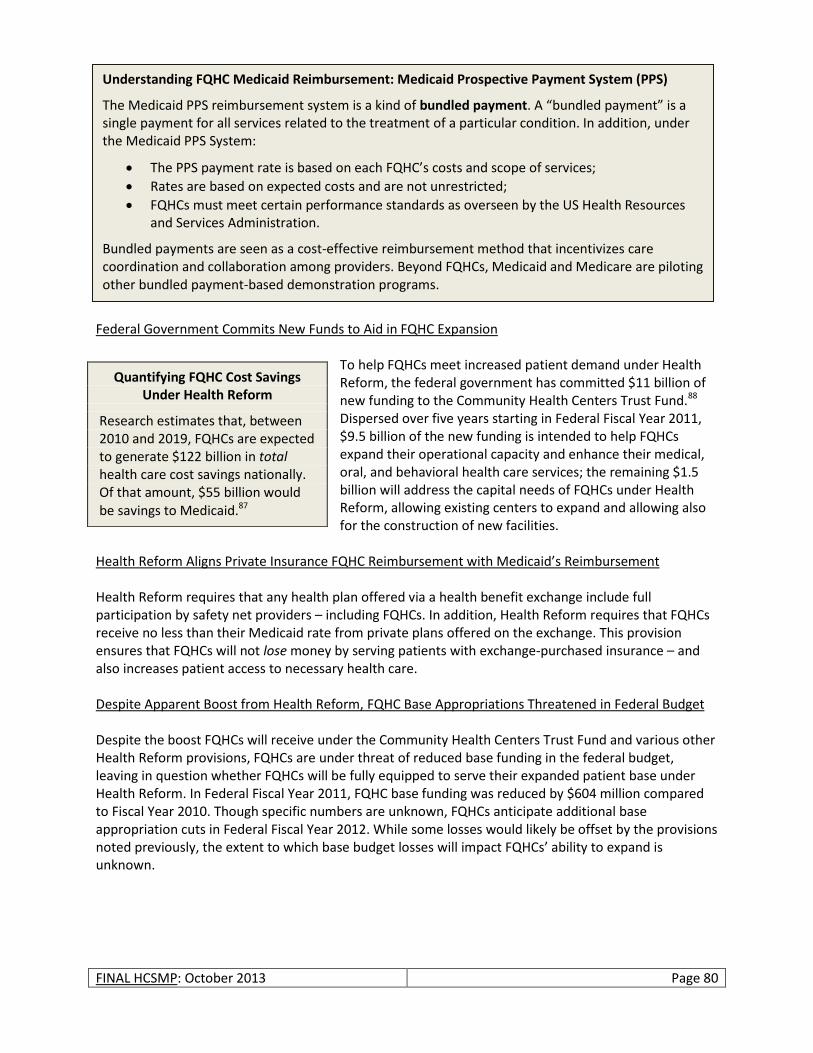
FINAL HCSMP: October 2013 Page 80
Federal Government Commits New Funds to Aid in FQHC Expansion
To help FQHCs meet increased patient demand under Health Reform, the federal government has committed $11 billion of new funding to the Community Health Centers Trust Fund.88 Dispersed over five years starting in Federal Fiscal Year 2011, $9.5 billion of the new funding is intended to help FQHCs expand their operational capacity and enhance their medical, oral, and behavioral health care services; the remaining $1.5 billion will address the capital needs of FQHCs under Health Reform, allowing existing centers to expand and allowing also for the construction of new facilities.
Health Reform Aligns Private Insurance FQHC Reimbursement with Medicaid’s Reimbursement Health Reform requires that any health plan offered via a health benefit exchange include full participation by safety net providers – including FQHCs. In addition, Health Reform requires that FQHCs receive no less than their Medicaid rate from private plans offered on the exchange. This provision ensures that FQHCs will not lose money by serving patients with exchange-purchased insurance – and also increases patient access to necessary health care. Despite Apparent Boost from Health Reform, FQHC Base Appropriations Threatened in Federal Budget Despite the boost FQHCs will receive under the Community Health Centers Trust Fund and various other Health Reform provisions, FQHCs are under threat of reduced base funding in the federal budget, leaving in question whether FQHCs will be fully equipped to serve their expanded patient base under Health Reform. In Federal Fiscal Year 2011, FQHC base funding was reduced by $604 million compared to Fiscal Year 2010. Though specific numbers are unknown, FQHCs anticipate additional base appropriation cuts in Federal Fiscal Year 2012. While some losses would likely be offset by the provisions noted previously, the extent to which base budget losses will impact FQHCs’ ability to expand is unknown.
Quantifying FQHC Cost Savings Under Health Reform
Research estimates that, between 2010 and 2019, FQHCs are expected to generate $122 billion in total health care cost savings nationally. Of that amount, $55 billion would be savings to Medicaid.87
Understanding FQHC Medicaid Reimbursement: Medicaid Prospective Payment System (PPS)
The Medicaid PPS reimbursement system is a kind of bundled payment. A “bundled payment” is a single payment for all services related to the treatment of a particular condition. In addition, under the Medicaid PPS System:
The PPS payment rate is based on each FQHC’s costs and scope of services;
Rates are based on expected costs and are not unrestricted;
FQHCs must meet certain performance standards as overseen by the US Health Resources and Services Administration.
Bundled payments are seen as a cost-effective reimbursement method that incentivizes care coordination and collaboration among providers. Beyond FQHCs, Medicaid and Medicare are piloting other bundled payment-based demonstration programs.
FINAL HCSMP: October 2013 Page 81
Federal Medicaid Primary Care Reimbursement Incentive Unlikely to Drive Significant Expansion of Primary Care Providers Serving Medicaid Recipients – Particularly in California Under Health Reform, the federal government will increase the Medicaid primary care physician reimbursement rate to match that of Medicare – but only for 2012 and 2013. An effort to increase primary care provider participation in Medicaid, this reimbursement strategy will likely fall short of making a significant impact, particularly in California, where physicians have been historically reluctant to serve the Medi-Cal population, most often citing the state’s low Medi-Cal reimbursement rate as a factor.90 Additional research suggests that even when fees are raised, physicians may not be more willing to participate in the face of other obstacles, such as delays in payment for services, and the administrative burden of the Medicaid program (e.g., credentialing, prior authorization requirements, and claims processing) – both real and perceived. In fact, the San Francisco Medical Society notes that some physicians may prefer to provide charity care to Medi-Cal patients rather than engage in Medi-Cal’s cumbersome reimbursement process. These factors can be particularly onerous for sole practitioners or small group practices that may feel forced to limit the number of Medi-Cal beneficiaries they serve so as to remain financially viable. The State’s fiscal crisis may also deal primary care providers a blow, as the State has reduced provider reimbursement rates still further. (Please note that this action will come before the full 9th Circuit Court of Appeals in 2013.) Given that San Francisco is expected to see a 24 percent increase in its Medi-Cal population following the implementation of Health Reform – translating to about 30,000 new Medi-Cal enrollees – the question of creating incentives for primary care providers to serve new Medi-Cal patients is of particular concern. Patient-Centered Medical Homes Emphasize Primary Care Case Management, Disease Management, and Care Coordination by Leveraging Physician Extenders Health Reform and California’s 1115 Medicaid Waiver collectively emphasize the importance of primary medical care access through the Patient-Centered Medical Home (PCMH) model. The PCMH is founded on the idea that a high-functioning primary care system can improve health care quality – and the patient experience – while lowering costs. The ongoing patient-provider relationship is key to the PCMH model, allowing each patient’s designated primary care provider to take a more comprehensive, holistic approach to patient care. PCMH pilots under Health Reform, though currently unfunded, would emphasize the PCMH model for persons with chronic conditions by relying on the capitation method of reimbursement to incentivize the formation of interdisciplinary health teams that prioritize primary care case management, disease management activities, care coordination, and the use of home- and community-based care providers such as “physician extenders” (e.g., nurse practitioners, physician assistants). Medi-Cal, given its existing network of managed care plans that operate within the capitation framework and that serve a patient base with chronic conditions, could be well-positioned to participate in the PCMH pilot if and when federal funds for the project become available. Additionally, PCMH’s use of physician extenders could help bridge the Medi-Cal provider gap.
47th
California has the 47th lowest Medicaid reimbursement rates in the nation.89

FINAL HCSMP: October 2013 Page 82
Special Challenges for Long-Term Care
According to the US Department of Health and Human Services, adults age 65 and older have a 40 percent chance of entering a nursing home,91 a significant proposition for San Francisco given that nearly half of the city’s residents are projected to be age 50 or older by 2030.92 These numbers also pose a financial challenge for the Medi-Cal program, which constitutes 49 percent of the state’s total nursing home revenue compared to the 28 percent of revenue generated by Medicare.93
While older adults constitute the majority of US residents with long-term care needs, Medicare will fund only “medically necessary” home health care or skilled nursing care – and only if certain conditions are met. Medicare will not fund custodial care and will only finance a person’s first 100 days at a nursing home, leaving Medi-Cal to support the lion’s share of California’s long-term care costs.94 For example, Medi-Cal is currently the primary payer of 67 percent of California’s nursing home residents.95
States have tried various measures – from capping Medicaid reimbursement rates for long-term institutional care to halting construction of nursing homes (California ended its certificate of need program in 198796) – to contain long-term care costs; however, the answer may lie in better incentivizing home- and community-based service (HCBS) options over institutional care. For example, research suggests that the Medicaid dollars needed to support one person in a nursing home would be nearly enough to fund HCBS services for three adults.97 In addition, HCBS offer the added benefit of providing persons access to the care they need in the least restrictive setting. Health Reform advances the prioritization of HCBS options through several initiatives into which Medi-Cal could opt. Through HCBS 1915(i) Waiver, for example, Medi-Cal could offer long-term care services through a state plan option rather than through a more cumbersome federal process.100 While HCBS may not be the cure-all for long-term care cost containment – HCBS require significant up-front investment and are resource intensive (e.g., In-Home Support Services labor demands) – they do offer the possibility of curbing costs while more appropriately meeting patient needs. Beyond Health Reform, San Francisco is exploring a local approach to long-term care cost containment and access to better care: integrating long-term care and primary/acute care services via a managed care
Long-Term Care Financing: Historical Context98
Medicare was passed in 1965, a time when society largely viewed a person’s long-term care needs as a family responsibility – not something within the purview of medical insurance. Medicaid, in contrast, was seen as a program designed to serve the needy, as a kind of welfare. As such, long-term care financing fell to the Medicaid program and now constitutes nearly one-third of all Medicaid spending.99
12 million
The number of older US adults (age 65+) expected to need some type of long-term care.
What is long-term care?
“Long-term care” refers to a variety of services – both medical and non-medical – for persons who have a chronic illness or disability. “Institutional” long-term care refers to skilled medical and therapeutic care offered by licensed nurses for a continuous and extended period of time (e.g., care at skilled nursing facilities and nursing homes). Examples of “home- and community-based services” include but are not limited to In-Home Support Services and other personal services that help chronically ill and disabled persons with their activities of daily living (e.g., eating, bathing, dressing) at home or in a non-institutional community-based setting (e.g., assisted living, residential care facility).
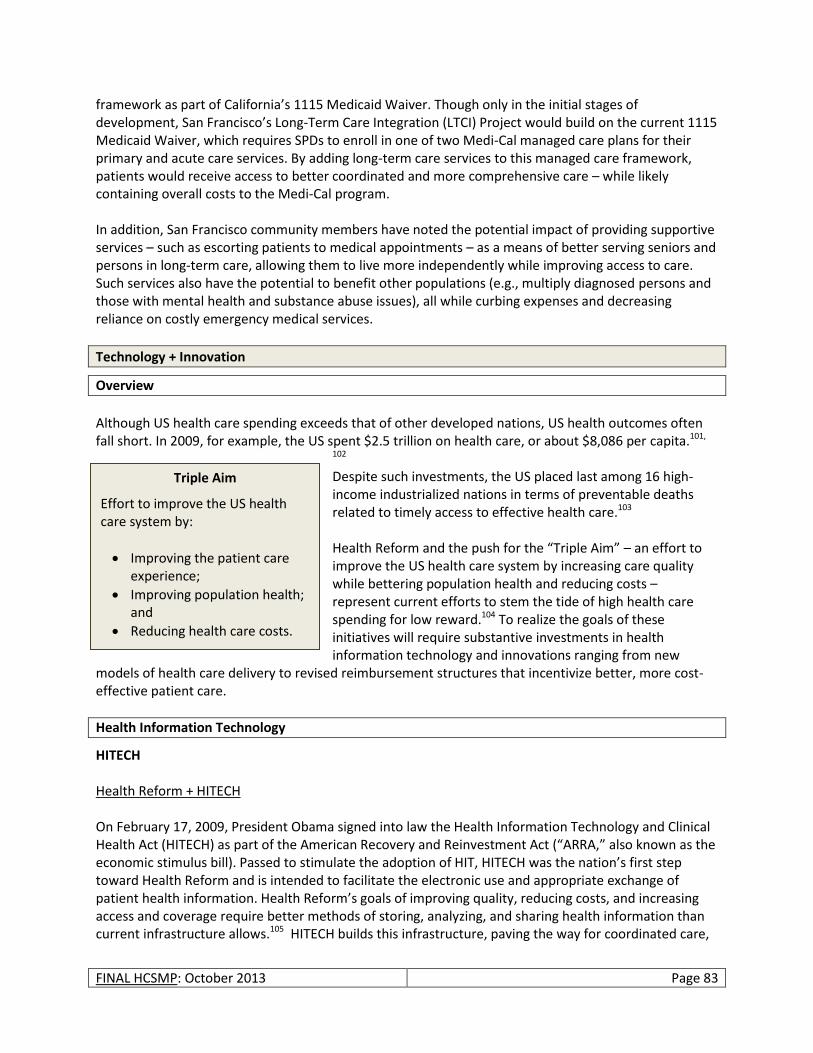
FINAL HCSMP: October 2013 Page 83
framework as part of California’s 1115 Medicaid Waiver. Though only in the initial stages of development, San Francisco’s Long-Term Care Integration (LTCI) Project would build on the current 1115 Medicaid Waiver, which requires SPDs to enroll in one of two Medi-Cal managed care plans for their primary and acute care services. By adding long-term care services to this managed care framework, patients would receive access to better coordinated and more comprehensive care – while likely containing overall costs to the Medi-Cal program. In addition, San Francisco community members have noted the potential impact of providing supportive services – such as escorting patients to medical appointments – as a means of better serving seniors and persons in long-term care, allowing them to live more independently while improving access to care. Such services also have the potential to benefit other populations (e.g., multiply diagnosed persons and those with mental health and substance abuse issues), all while curbing expenses and decreasing reliance on costly emergency medical services.
Technology + Innovation
Overview
Although US health care spending exceeds that of other developed nations, US health outcomes often fall short. In 2009, for example, the US spent $2.5 trillion on health care, or about $8,086 per capita.101,
102 Despite such investments, the US placed last among 16 high-income industrialized nations in terms of preventable deaths related to timely access to effective health care.103 Health Reform and the push for the “Triple Aim” – an effort to improve the US health care system by increasing care quality while bettering population health and reducing costs – represent current efforts to stem the tide of high health care spending for low reward.104 To realize the goals of these initiatives will require substantive investments in health information technology and innovations ranging from new
models of health care delivery to revised reimbursement structures that incentivize better, more cost-effective patient care.
Health Information Technology
HITECH Health Reform + HITECH On February 17, 2009, President Obama signed into law the Health Information Technology and Clinical Health Act (HITECH) as part of the American Recovery and Reinvestment Act (“ARRA,” also known as the economic stimulus bill). Passed to stimulate the adoption of HIT, HITECH was the nation’s first step toward Health Reform and is intended to facilitate the electronic use and appropriate exchange of patient health information. Health Reform’s goals of improving quality, reducing costs, and increasing access and coverage require better methods of storing, analyzing, and sharing health information than current infrastructure allows.105 HITECH builds this infrastructure, paving the way for coordinated care,
Triple Aim
Effort to improve the US health care system by:
Improving the patient care experience;
Improving population health; and
Reducing health care costs.
FINAL HCSMP: October 2013 Page 84
patient-centered medical homes, value-based purchasing, and bundled payment projects envisioned under Health Reform. HITECH Overview HITECH created the permanent Office of the National Coordinator for Health Information Technology (ONC) and provided $19 billion over a four-year period for providers who adopt and use HIT. Additionally, HITECH not only recognized but reinforced patient privacy protections created by the Health Insurance Portability and Accountability Act (HIPAA). Following is a brief overview of the key components of HITECH that relate to the establishment of a HIT infrastructure.
Office of the National Coordinator for Health Information Technology (ONC)
The ONC is charged with overseeing the development of a nationwide health information technology infrastructure that allows for the electronic use and exchange of information.106 This infrastructure will:
Ensure that each patient’s health information is secure and protected;
Improve health care quality, reduce medical errors, reduce health disparities, and advance the delivery of patient-centered medical care;
Reduce health care costs resulting from inefficiency, medical errors, inappropriate care, duplicative care, and incomplete information;
Provide appropriate information to help guide medical decisions at the time and place of care;
Ensure the inclusion of meaningful public input in development of such infrastructure;
Improve the coordination of care and information among hospitals, laboratories, physician offices, and other entities through an effective infrastructure for the secure and authorized exchange of health information;
Improve public health activities and facilitate the early identification of and rapid response to public health threats and emergencies, including bioterrorism events and infectious disease outbreaks;
Facilitate health and clinical research and health care quality;
Promote early detection, prevention, and management of chronic diseases;
Promote a more effective marketplace, greater competition, greater systems analysis, increased consumer choice, and improved health outcomes; and
Improve efforts to reduce health disparities.
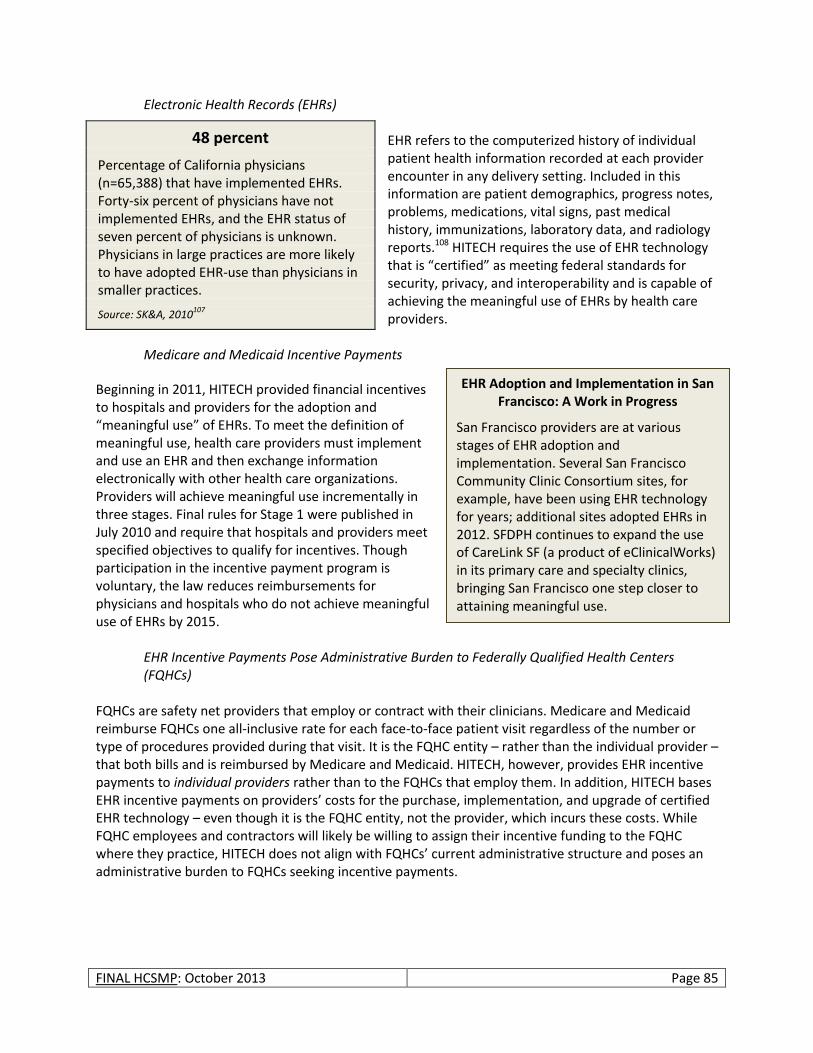
FINAL HCSMP: October 2013 Page 85
Electronic Health Records (EHRs) EHR refers to the computerized history of individual patient health information recorded at each provider encounter in any delivery setting. Included in this information are patient demographics, progress notes, problems, medications, vital signs, past medical history, immunizations, laboratory data, and radiology reports.108 HITECH requires the use of EHR technology that is “certified” as meeting federal standards for security, privacy, and interoperability and is capable of achieving the meaningful use of EHRs by health care providers.
Medicare and Medicaid Incentive Payments Beginning in 2011, HITECH provided financial incentives to hospitals and providers for the adoption and “meaningful use” of EHRs. To meet the definition of meaningful use, health care providers must implement and use an EHR and then exchange information electronically with other health care organizations. Providers will achieve meaningful use incrementally in three stages. Final rules for Stage 1 were published in July 2010 and require that hospitals and providers meet specified objectives to qualify for incentives. Though participation in the incentive payment program is voluntary, the law reduces reimbursements for physicians and hospitals who do not achieve meaningful use of EHRs by 2015.
EHR Incentive Payments Pose Administrative Burden to Federally Qualified Health Centers (FQHCs)
FQHCs are safety net providers that employ or contract with their clinicians. Medicare and Medicaid reimburse FQHCs one all-inclusive rate for each face-to-face patient visit regardless of the number or type of procedures provided during that visit. It is the FQHC entity – rather than the individual provider – that both bills and is reimbursed by Medicare and Medicaid. HITECH, however, provides EHR incentive payments to individual providers rather than to the FQHCs that employ them. In addition, HITECH bases EHR incentive payments on providers’ costs for the purchase, implementation, and upgrade of certified EHR technology – even though it is the FQHC entity, not the provider, which incurs these costs. While FQHC employees and contractors will likely be willing to assign their incentive funding to the FQHC where they practice, HITECH does not align with FQHCs’ current administrative structure and poses an administrative burden to FQHCs seeking incentive payments.
48 percent
Percentage of California physicians (n=65,388) that have implemented EHRs. Forty-six percent of physicians have not implemented EHRs, and the EHR status of seven percent of physicians is unknown. Physicians in large practices are more likely to have adopted EHR-use than physicians in smaller practices.
Source: SK&A, 2010107
EHR Adoption and Implementation in San Francisco: A Work in Progress
San Francisco providers are at various stages of EHR adoption and implementation. Several San Francisco Community Clinic Consortium sites, for example, have been using EHR technology for years; additional sites adopted EHRs in 2012. SFDPH continues to expand the use of CareLink SF (a product of eClinicalWorks) in its primary care and specialty clinics, bringing San Francisco one step closer to attaining meaningful use.
FINAL HCSMP: October 2013 Page 86
Regional Extension Centers HITECH provided grants to create Regional Extension Centers to offer technical assistance, guidance and information on best practices to support and accelerate health care providers’ efforts to become meaningful users of EHRs. There are 60 Regional Extension Centers around the country representing nearly every geographic region.
State Health Information Exchanges (HIEs) HITECH includes a grant program to help states build capacity for exchanging health information across health care systems both within and across states while moving toward nationwide interoperability. HIEs are distinct from the health benefit exchanges established under Health Reform. (HIEs are portals for the exchange of clinical information whereas health benefit exchanges are marketplaces for the purchase of health insurance.) Participation in a HIE is not a specific Stage 1 meaningful use requirement; however, several of the requirements are services or capabilities commonly offered and/or facilitated by HIEs. Additionally, HITECH does not require formal linkage between regional extension centers and HIEs, but coordination is encouraged.109
Extension of HIPAA Protections
HIPAA, enacted in 1996, provides federal protections for personal health information held by covered entities (e.g., providers and health plans). HITECH extends the security and privacy provisions in HIPAA by expanding the list of covered entities responsible for maintaining these protections and subjecting violators to civil and criminal penalties. With these provisions, HITECH recognizes the benefit of sharing vital health information among health care providers without compromising a patient’s right to privacy. The following schematic provides an overview of the HITECH structure as it relates to the use and exchange of health information.
Three Stages of Meaningful Use
Stage 1: Effective in 2011, Stage 1 criteria focus on electronically collecting health information and using that information to track key conditions, coordinate care, and report on clinical measures.
Stage 2: On September 4 2012, CMS published a final rule on Stage 2 meaningful use criteria. Stage 2 criteria expand on Stage 1 in the areas of disease management, clinical decision support, medication management, and bi-directional communication with public health agencies. All providers must achieve meaningful use under the Stage 1 criteria before moving to Stage 2.
Stage 3: Criteria to be established, implementation expected in 2015. Will expand on Stages 1 and 2 and will focus on improvements in quality, safety, patient access to self-management tools, and more.
Source: CMS.gov
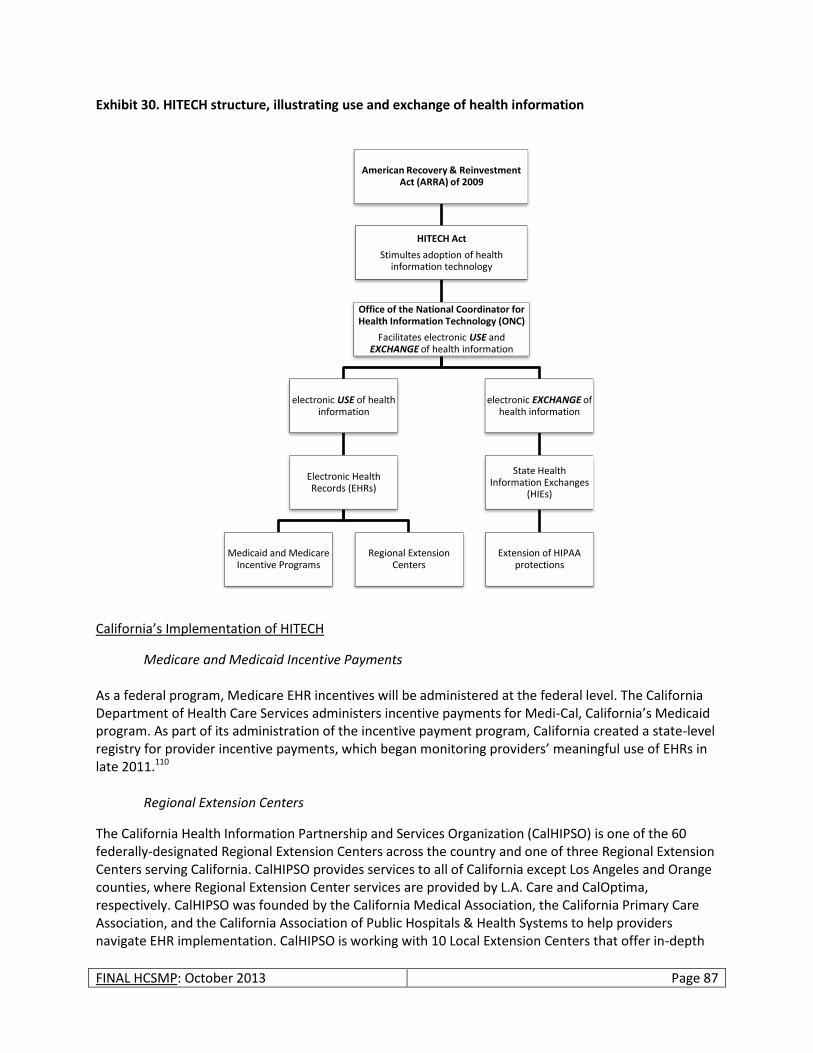
FINAL HCSMP: October 2013 Page 87
Exhibit 30. HITECH structure, illustrating use and exchange of health information
California’s Implementation of HITECH
Medicare and Medicaid Incentive Payments As a federal program, Medicare EHR incentives will be administered at the federal level. The California Department of Health Care Services administers incentive payments for Medi-Cal, California’s Medicaid program. As part of its administration of the incentive payment program, California created a state-level registry for provider incentive payments, which began monitoring providers’ meaningful use of EHRs in late 2011.110
Regional Extension Centers
The California Health Information Partnership and Services Organization (CalHIPSO) is one of the 60 federally-designated Regional Extension Centers across the country and one of three Regional Extension Centers serving California. CalHIPSO provides services to all of California except Los Angeles and Orange counties, where Regional Extension Center services are provided by L.A. Care and CalOptima, respectively. CalHIPSO was founded by the California Medical Association, the California Primary Care Association, and the California Association of Public Hospitals & Health Systems to help providers navigate EHR implementation. CalHIPSO is working with 10 Local Extension Centers that offer in-depth
American Recovery & Reinvestment Act (ARRA) of 2009
HITECH Act
Stimultes adoption of health information technology
Office of the National Coordinator for Health Information Technology (ONC)
Facilitates electronic USE and EXCHANGE of health information
electronic USE of health information
Electronic Health Records (EHRs)
Medicaid and Medicare Incentive Programs
Regional Extension Centers
electronic EXCHANGE of health information
State Health Information Exchanges
(HIEs)
Extension of HIPAA protections
FINAL HCSMP: October 2013 Page 88
knowledge of their local areas and provider communities. Local Extension Centers are local clinic consortia, regional medical societies, health plans, or other groups that have the ability to assist providers in a community.111 HealthShare Bay Area – A Local Approach to Health Information Exchange Created through a collaboration of key health care providers, HealthShare Bay Area (HSBA) – a combination of efforts in San Francisco (the San Francisco Health Exchange, or “SFHEX”) and the East Bay (Alameda Contra Costa Health Information Technology and Exchange Coalition, “ACC-HITEC”) – will afford San Francisco and East Bay health care providers a secure, controlled, and interoperable method for exchanging and aggregating patient health information across all participating providers of care. This data exchange is expected to improve the efficiency of service delivery while decreasing costs and improving patient care and outcomes throughout the Bay Area. The HSBA interoperability services will also help participating providers meet Stage 2 and 3 requirements for meaningful use. Starting Spring 2014, participating providers will be able to use HSBA interoperability services including the encounter registry, the community master patient index, and Nationwide Health Information Network protocol services. HSBA will act as a hub for information distribution by authenticating that all requests come from a valid registered and authorized provider, using its records locator to access a network of data sources and providing the clinician with valuable patient information entered by that patient’s current and previous providers (e.g., problem list, medication list, test results, immunizations, clinical documents such as discharge summaries, operative notes, ambulatory visit summaries, etc.). Background Established in August 2009 and operating under the auspices of the non-profit San Francisco Medical Society Community Service Foundation, HSBA organization was overseen by a Governing Committee with representation from the following (* indicates founding funders and board members):
*Alameda Contra Costa Medical Society
*Alameda County Medical Center
At-large independent physicians
*Brown and Toland Independent Practice Association (IPA)
Catholic Healthcare West (St. Francis, St. Mary’s)
Chinese Hospital Association
*Community Health Center Network
Health services consumer representative
*Hill Physicians IPA
John Muir Health
Licensed alternative medicine providers
*San Francisco Community Clinic Consortium
*San Francisco Department of Public Health
San Francisco Kaiser Permanente Center
San Francisco Mayor’s Office
*San Francisco Medical Society
*Sutter Health (California Pacific Medical Center)
University of California, San Francisco/Mt. Zion Medical Center
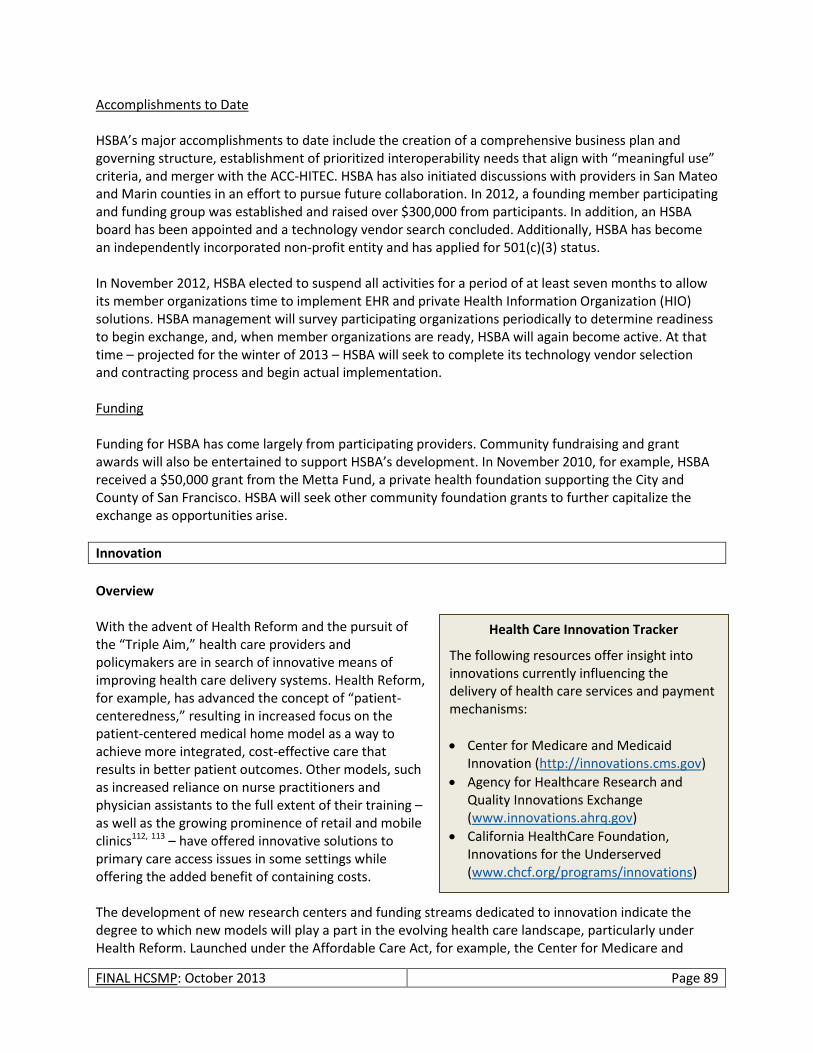
FINAL HCSMP: October 2013 Page 89
Accomplishments to Date HSBA’s major accomplishments to date include the creation of a comprehensive business plan and governing structure, establishment of prioritized interoperability needs that align with “meaningful use” criteria, and merger with the ACC-HITEC. HSBA has also initiated discussions with providers in San Mateo and Marin counties in an effort to pursue future collaboration. In 2012, a founding member participating and funding group was established and raised over $300,000 from participants. In addition, an HSBA board has been appointed and a technology vendor search concluded. Additionally, HSBA has become an independently incorporated non-profit entity and has applied for 501(c)(3) status. In November 2012, HSBA elected to suspend all activities for a period of at least seven months to allow its member organizations time to implement EHR and private Health Information Organization (HIO) solutions. HSBA management will survey participating organizations periodically to determine readiness to begin exchange, and, when member organizations are ready, HSBA will again become active. At that time – projected for the winter of 2013 – HSBA will seek to complete its technology vendor selection and contracting process and begin actual implementation. Funding Funding for HSBA has come largely from participating providers. Community fundraising and grant awards will also be entertained to support HSBA’s development. In November 2010, for example, HSBA received a $50,000 grant from the Metta Fund, a private health foundation supporting the City and County of San Francisco. HSBA will seek other community foundation grants to further capitalize the exchange as opportunities arise.
Innovation
Overview With the advent of Health Reform and the pursuit of the “Triple Aim,” health care providers and policymakers are in search of innovative means of improving health care delivery systems. Health Reform, for example, has advanced the concept of “patient-centeredness,” resulting in increased focus on the patient-centered medical home model as a way to achieve more integrated, cost-effective care that results in better patient outcomes. Other models, such as increased reliance on nurse practitioners and physician assistants to the full extent of their training – as well as the growing prominence of retail and mobile clinics112, 113 – have offered innovative solutions to primary care access issues in some settings while offering the added benefit of containing costs. The development of new research centers and funding streams dedicated to innovation indicate the degree to which new models will play a part in the evolving health care landscape, particularly under Health Reform. Launched under the Affordable Care Act, for example, the Center for Medicare and
Health Care Innovation Tracker
The following resources offer insight into innovations currently influencing the delivery of health care services and payment mechanisms:
Center for Medicare and Medicaid Innovation (http://innovations.cms.gov)
Agency for Healthcare Research and Quality Innovations Exchange (www.innovations.ahrq.gov)
California HealthCare Foundation, Innovations for the Underserved (www.chcf.org/programs/innovations)
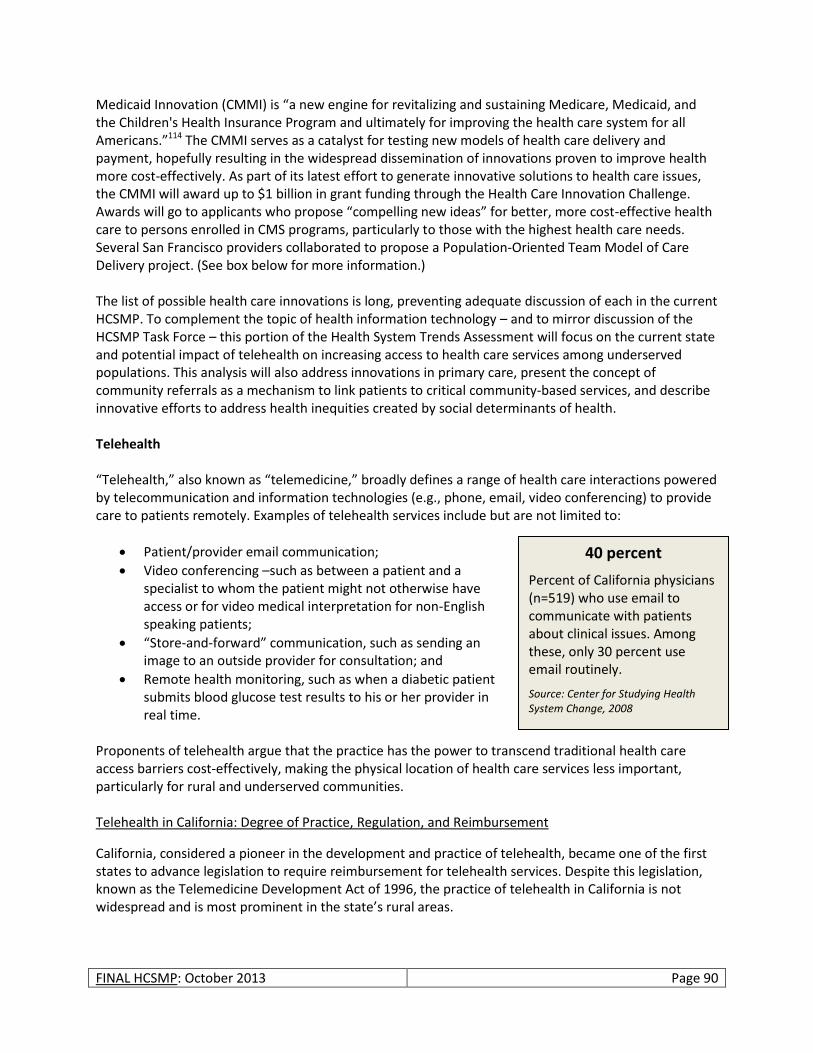
FINAL HCSMP: October 2013 Page 90
Medicaid Innovation (CMMI) is “a new engine for revitalizing and sustaining Medicare, Medicaid, and the Children's Health Insurance Program and ultimately for improving the health care system for all Americans.”114 The CMMI serves as a catalyst for testing new models of health care delivery and payment, hopefully resulting in the widespread dissemination of innovations proven to improve health more cost-effectively. As part of its latest effort to generate innovative solutions to health care issues, the CMMI will award up to $1 billion in grant funding through the Health Care Innovation Challenge. Awards will go to applicants who propose “compelling new ideas” for better, more cost-effective health care to persons enrolled in CMS programs, particularly to those with the highest health care needs. Several San Francisco providers collaborated to propose a Population-Oriented Team Model of Care Delivery project. (See box below for more information.) The list of possible health care innovations is long, preventing adequate discussion of each in the current HCSMP. To complement the topic of health information technology – and to mirror discussion of the HCSMP Task Force – this portion of the Health System Trends Assessment will focus on the current state and potential impact of telehealth on increasing access to health care services among underserved populations. This analysis will also address innovations in primary care, present the concept of community referrals as a mechanism to link patients to critical community-based services, and describe innovative efforts to address health inequities created by social determinants of health. Telehealth “Telehealth,” also known as “telemedicine,” broadly defines a range of health care interactions powered by telecommunication and information technologies (e.g., phone, email, video conferencing) to provide care to patients remotely. Examples of telehealth services include but are not limited to:
Patient/provider email communication;
Video conferencing –such as between a patient and a specialist to whom the patient might not otherwise have access or for video medical interpretation for non-English speaking patients;
“Store-and-forward” communication, such as sending an image to an outside provider for consultation; and
Remote health monitoring, such as when a diabetic patient submits blood glucose test results to his or her provider in real time.
Proponents of telehealth argue that the practice has the power to transcend traditional health care access barriers cost-effectively, making the physical location of health care services less important, particularly for rural and underserved communities. Telehealth in California: Degree of Practice, Regulation, and Reimbursement
California, considered a pioneer in the development and practice of telehealth, became one of the first states to advance legislation to require reimbursement for telehealth services. Despite this legislation, known as the Telemedicine Development Act of 1996, the practice of telehealth in California is not widespread and is most prominent in the state’s rural areas.
40 percent
Percent of California physicians (n=519) who use email to communicate with patients about clinical issues. Among these, only 30 percent use email routinely.
Source: Center for Studying Health System Change, 2008
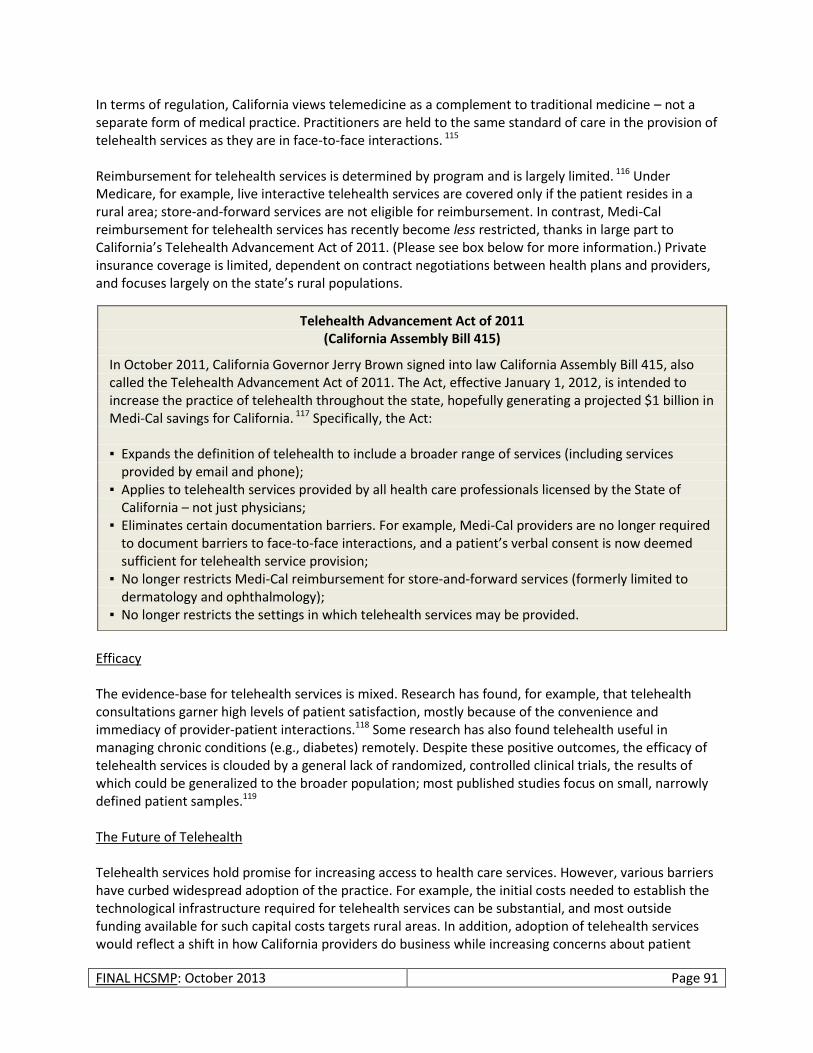
FINAL HCSMP: October 2013 Page 91
In terms of regulation, California views telemedicine as a complement to traditional medicine – not a separate form of medical practice. Practitioners are held to the same standard of care in the provision of telehealth services as they are in face-to-face interactions. 115 Reimbursement for telehealth services is determined by program and is largely limited. 116 Under Medicare, for example, live interactive telehealth services are covered only if the patient resides in a rural area; store-and-forward services are not eligible for reimbursement. In contrast, Medi-Cal reimbursement for telehealth services has recently become less restricted, thanks in large part to California’s Telehealth Advancement Act of 2011. (Please see box below for more information.) Private insurance coverage is limited, dependent on contract negotiations between health plans and providers, and focuses largely on the state’s rural populations.
Efficacy The evidence-base for telehealth services is mixed. Research has found, for example, that telehealth consultations garner high levels of patient satisfaction, mostly because of the convenience and immediacy of provider-patient interactions.118 Some research has also found telehealth useful in managing chronic conditions (e.g., diabetes) remotely. Despite these positive outcomes, the efficacy of telehealth services is clouded by a general lack of randomized, controlled clinical trials, the results of which could be generalized to the broader population; most published studies focus on small, narrowly defined patient samples.119 The Future of Telehealth Telehealth services hold promise for increasing access to health care services. However, various barriers have curbed widespread adoption of the practice. For example, the initial costs needed to establish the technological infrastructure required for telehealth services can be substantial, and most outside funding available for such capital costs targets rural areas. In addition, adoption of telehealth services would reflect a shift in how California providers do business while increasing concerns about patient
Telehealth Advancement Act of 2011 (California Assembly Bill 415)
In October 2011, California Governor Jerry Brown signed into law California Assembly Bill 415, also called the Telehealth Advancement Act of 2011. The Act, effective January 1, 2012, is intended to increase the practice of telehealth throughout the state, hopefully generating a projected $1 billion in Medi-Cal savings for California. 117 Specifically, the Act: ▪ Expands the definition of telehealth to include a broader range of services (including services
provided by email and phone); ▪ Applies to telehealth services provided by all health care professionals licensed by the State of
California – not just physicians; ▪ Eliminates certain documentation barriers. For example, Medi-Cal providers are no longer required
to document barriers to face-to-face interactions, and a patient’s verbal consent is now deemed sufficient for telehealth service provision;
▪ No longer restricts Medi-Cal reimbursement for store-and-forward services (formerly limited to dermatology and ophthalmology);
▪ No longer restricts the settings in which telehealth services may be provided.
FINAL HCSMP: October 2013 Page 92
privacy; however, the adoption of EHRs – and providers’ increasing ability to bill Medi-Cal and other payers for telehealth services – may facilitate this shift. On the patient side, more vulnerable populations may lack access to the basic technology needed to communicate their health information privately and securely. Despite the mixed evidence base for telehealth services and potential barriers to its adoption, demand for such care is likely to increase, particularly as a means of managing chronic conditions, which account for 75 percent of US health care costs annually.120 Hospitals will have an added incentive to experiment with remote health monitoring and other telehealth services, as they will face payment reductions for excessive readmissions for certain conditions starting in 2013 under Medicare as part of Health Reform.121, 122 In addition, telehealth services offer an innovative solution to providing care to vulnerable populations who might not otherwise have access to timely, flexible care.
Innovations in Primary Care According to a California HealthCare Foundation survey of insured persons, one-half of California’s emergency room patients felt their needs could have been addressed via a doctor’s visit had a primary care provider been available.125 Explanations for inaccessibility include difficulty finding a provider who will accept Medi-Cal, untimely access to appointments, limited hours of operation, and transportation issues. This reality, coupled with an expanding insured population in demand of primary care under Health Reform, signals that innovations in primary care are key to increasing San Franciscans’ access to needed services. Examples of primary care innovations include worksite clinics at which employees may seek care with more limited disruptions to their health and productivity. (While adoption of worksite clinics decreased in the 1970s, mirroring the decline of the US manufacturing sector, Health Reform language pushing employers to provide wellness and prevention programs may stem this tide.126 ) Other primary care innovations include increasing reliance on pharmacies and retail clinics, which typically offer expanded hours of operation compared to the typical physician’s office as well as shorter wait times and walk-in
Telehealth Case Study: mHealth123 mHealth, the trend of using mobile phones for health, illustrates that telehealth services need not rely on complicated, inaccessible technology to have an impact. The applications of mobile health technology are many, ranging from remote health monitoring to voicemail or text medication reminders that increase adherence. The successful Text4baby application sends free health tips to expectant and new mothers via text, offering information to women who might otherwise lack easy access to prenatal support; text messages continue through the baby’s first year. That mHealth can be as simple as sending a text message – smart phone technology is not a prerequisite for many mHealth applications – suggests one avenue of increasing health access for vulnerable populations who are more likely to have prepaid mobile phone plans. mHealth also promises to be more attractive to certain demographics, such as youth, who are increasingly reliant on mobile technology in their daily lives. In addition, certain minority groups have become increasingly reliant on mobile technology, signaling an opportunity to increase health access among San Francisco’s diverse populations. According to the Pew Research Center, for example, Latinos and African Americans – both of which face high rates of chronic disease – are more likely than whites to own a cell phone and use non voice data applications on their mobile devices.124

FINAL HCSMP: October 2013 Page 93
access. Please note, however, that existing research has not yet shown a link between the presence of retail clinics and improved health care access for vulnerable populations, as retail clinics typically locate in lower poverty/higher median income areas. Community partnerships also promise to bridge the primary care access gap by integrating care with the community. The ACCESS Health Care Network, for example, extends its patient reach through existing relationships with community organizations (e.g., churches, schools, etc.) and academic partners.127 ACCESS – the largest FQHC in the US, operating more than 50 health centers in metro Chicago – partners with community organizations to provide health and wellness education and outreach. ACCESS also offers a range of specialist services to patients through a partnership with the University of Chicago, which sends trained specialists to provide care at ACCESS health centers. In addition to the program’s philosophy of partnership and collaboration, ACCESS has increased patient access to care by extending its hours of operation and through adoption of an EHR system that allows patients to view their personal health data.
Community Resource Referrals Research resulting from the Robert Wood Johnson Foundation’s Prescription for Health initiative suggests that linkages between primary care providers and community resources offer the potential to help patients establish and maintain healthy behaviors.130 While helping patients improve health outcomes, provider referrals, or “prescriptions,” to community resources (e.g., free fitness classes, support groups, etc.) offer the added benefit of potentially mitigating the burden placed on the US health care system by unhealthy behaviors that result in chronic disease.
A Local Primary Care Innovation: HealthFirst128 Initiated with support from the Skirball Foundation and Atlantic Philanthropies, HealthFirst is a chronic disease self-management program and resource center located in California Pacific Medical Center’s St. Luke’s Health Center. HealthFirst is unique in its integration of trained clinical health workers (CHW) in a primary care setting; HealthFirst is a recognized partner of the City College of San Francisco CHW certificate program. In the HealthFirst model, primary care physicians refer stable, chronically ill patients to the program, which is staffed by CHWs, clinical nurse educators, a nurse practitioner, and a licensed clinical social worker. CHWs enhance this multidisciplinary, multilingual team to empower patients’ self-management of chronic conditions via medical adherence interventions, support, group sessions, and assistance overcoming barriers. Research has shown that HealthFirst succeeds in improving the health outcomes of diabetic patients by bettering their blood sugar levels and cholesterol.129 In addition, HealthFirst has garnered high levels of patient satisfaction, significant in that the program serves high numbers of Spanish-speaking patients who are publicly insured or uninsured – persons who traditionally face health care access barriers.
FINAL HCSMP: October 2013 Page 94
Examples of existing community resource referral programs vary in the degree to which they use technological and human capital. The United Way’s National 2-1-1 Collaborative, for example, operates a phone system and resource database to provide users (providers and/or individuals themselves) with access to local information on available resources. HealthLeads, in contrast, couples an online, Wiki-resource database with clinic-based volunteers, or “connectors,” who link patients to community resources, facilitate that connection, and also follow-up on the patient’s use of and success with the resources to which they are referred. HealthLeads is a social entrepreneurial venture that operates in six cities at 21 different sites. Research has found that “linkages were stronger when they incorporated practice or resource abilities to motivate the patient, such as brief counseling or post-referral outreach,”131 suggesting that some
iteration of the HealthLeads model could be a viable community referral resource approach for San Francisco. Innovations to Address Social Determinants of Health According to the World Health Organization, “The social determinants of health are the conditions in which people are born, grow, live, work and age, including the health system. These circumstances are shaped by the distribution of money, power and resources at global, national and local levels, which are themselves influenced by policy choices. The social determinants of health are mostly responsible for health inequities - the unfair and avoidable differences in health status seen within and between countries.”132 Innovations targeting the health issues caused by social determinants offer the potential to lessen the community health impact they pose while aligning with the National Quality Strategy. Established under Health Reform and building on the concept of the “triple aim,” the National Quality Strategy advances the importance of population health, charging health providers to partner with the broader community to “improve the health of the US population by supporting proven interventions to address behavioral, social, and environmental determinants of health in addition to delivering higher-quality care.”133 A local example of such innovation includes the San Francisco Tobacco Free Project (SFTFP), a project of SFDPH and local community-based organizations. The SFTFP strives to increase community and organizational capacity to address the social determinants of health associated with tobacco-related
Resources Match: A San Francisco Community Resource Referral Example
Mission Asset Fund’s “Resources Match,” is an online intake, screening, and referral tool used to connect low-income people to various government programs, community-based services, and financial products. Thirty-six San Francisco community-based organizations, schools, and public departments use Resources Match currently. The Resources Match application matches individual socio-economic profiles against eligibility criteria and utilizes a scoring engine to match client data to services in the system.
National Quality Strategy Principles
1. Person-centeredness and family engagement
2. Specific health considerations 3. Eliminating disparities in care 4. Aligning the efforts of public and
private sectors 5. Quality improvement 6. Consistent national standards 7. Primary care will become a
bigger focus 8. Coordination will be enhanced 9. Integration of care delivery 10. Providing clear information
Source: Agency for Healthcare Research and Quality
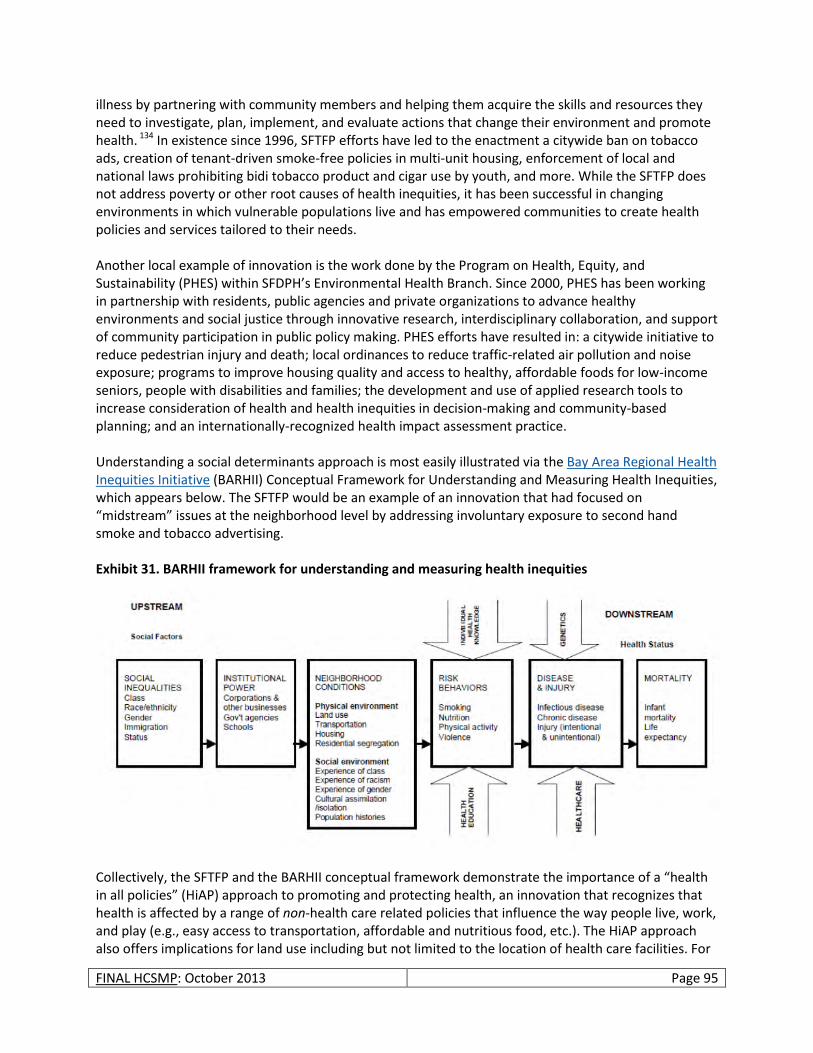
FINAL HCSMP: October 2013 Page 95
illness by partnering with community members and helping them acquire the skills and resources they need to investigate, plan, implement, and evaluate actions that change their environment and promote health. 134 In existence since 1996, SFTFP efforts have led to the enactment a citywide ban on tobacco ads, creation of tenant-driven smoke-free policies in multi-unit housing, enforcement of local and national laws prohibiting bidi tobacco product and cigar use by youth, and more. While the SFTFP does not address poverty or other root causes of health inequities, it has been successful in changing environments in which vulnerable populations live and has empowered communities to create health policies and services tailored to their needs. Another local example of innovation is the work done by the Program on Health, Equity, and Sustainability (PHES) within SFDPH’s Environmental Health Branch. Since 2000, PHES has been working in partnership with residents, public agencies and private organizations to advance healthy environments and social justice through innovative research, interdisciplinary collaboration, and support of community participation in public policy making. PHES efforts have resulted in: a citywide initiative to reduce pedestrian injury and death; local ordinances to reduce traffic-related air pollution and noise exposure; programs to improve housing quality and access to healthy, affordable foods for low-income seniors, people with disabilities and families; the development and use of applied research tools to increase consideration of health and health inequities in decision-making and community-based planning; and an internationally-recognized health impact assessment practice. Understanding a social determinants approach is most easily illustrated via the Bay Area Regional Health Inequities Initiative (BARHII) Conceptual Framework for Understanding and Measuring Health Inequities, which appears below. The SFTFP would be an example of an innovation that had focused on “midstream” issues at the neighborhood level by addressing involuntary exposure to second hand smoke and tobacco advertising. Exhibit 31. BARHII framework for understanding and measuring health inequities
Collectively, the SFTFP and the BARHII conceptual framework demonstrate the importance of a “health in all policies” (HiAP) approach to promoting and protecting health, an innovation that recognizes that health is affected by a range of non-health care related policies that influence the way people live, work, and play (e.g., easy access to transportation, affordable and nutritious food, etc.). The HiAP approach also offers implications for land use including but not limited to the location of health care facilities. For

FINAL HCSMP: October 2013 Page 96
example, zoning restrictions on where fast food restaurants and liquor stores may be located (e.g., a specified distance from schools and health care facilities) or designing streets and sidewalks to promote pedestrian activity offer the potential to promote healthy behaviors and support the existing health care system. By formally adopting a HiAP approach, San Francisco has the power to advance the importance of public health across disciplines while addressing the health inequities facing the city and county’s vulnerable populations.
Disaster Planning
Public Health Emergency Preparedness and Response Section In February 2011, SFDPH formed the Public Health Emergency Preparedness and Response (PHEPR) Section to serve the public, SFDPH, and community partners by coordinating health emergency preparedness, response, and recovery efforts. Since its inception, PHEPR has furthered San Francisco’s preparedness efforts by:
Convening a PHEPR Steering Committee to conduct a strategic planning process that resulted in an SFDPH vision for emergency preparedness and response as well as the purpose and values of the PHEPR section.
Developing an SFDPH emergency preparedness and response work plan identifying five Year 1 priority capabilities in addition to multiple five-year goals.
Facilitating the Community Health Emergency Planning Project to foster productive emergency planning processes among neighborhood/Emergency Response Districts (ERD) partners to improve emergency communication plans and promote personal and facility 72-hour preparedness. This project included Community Oriented Primary Care clinics, San Francisco Community Clinic Consortium facilities, Community Behavioral Health Services sites, and community-based organizations providing mental health and substance abuse services. The Community Health Emergency Planning Project, which concluded in October 2011, included 45 different organizations and just fewer than 200 programs.
Hiring a consultant to coordinate the development of all operational citywide medical surge plans that include alternative care site planning. The consultant assessed all San Francisco hospitals’ surge capacity as well as that of the city’s five long-term care facilities and created a detailed roadmap for citywide medical surge plan development in Francisco.
Within five years of operation, PHEPR plans to establish a comprehensive all-hazards SFDPH emergency operation plan; establish a comprehensive citywide medical surge plan; establish a flexible emergency communication plan; establish a network of health service programs and facilities prepared to partner during and after emergencies; and establish an emergency resource management and distribution system.
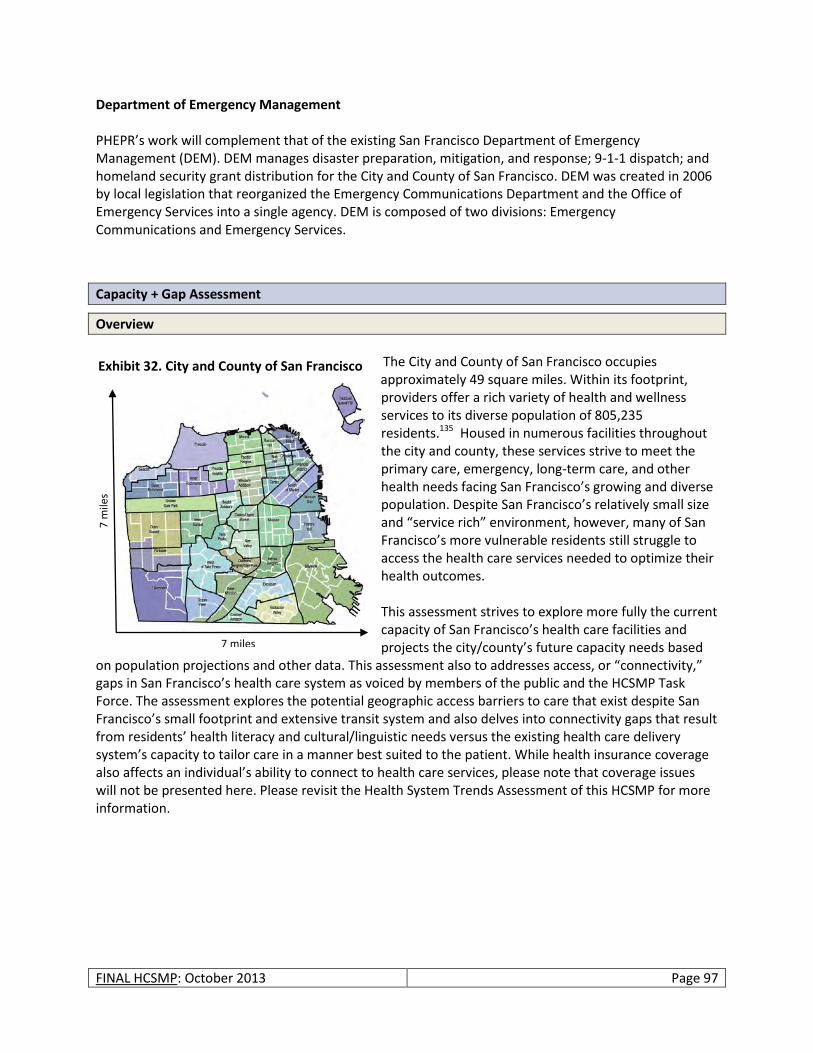
FINAL HCSMP: October 2013 Page 97
Department of Emergency Management PHEPR’s work will complement that of the existing San Francisco Department of Emergency Management (DEM). DEM manages disaster preparation, mitigation, and response; 9-1-1 dispatch; and homeland security grant distribution for the City and County of San Francisco. DEM was created in 2006 by local legislation that reorganized the Emergency Communications Department and the Office of Emergency Services into a single agency. DEM is composed of two divisions: Emergency Communications and Emergency Services.
Capacity + Gap Assessment
Overview
The City and County of San Francisco occupies
approximately 49 square miles. Within its footprint, providers offer a rich variety of health and wellness services to its diverse population of 805,235 residents.135 Housed in numerous facilities throughout the city and county, these services strive to meet the primary care, emergency, long-term care, and other health needs facing San Francisco’s growing and diverse population. Despite San Francisco’s relatively small size and “service rich” environment, however, many of San Francisco’s more vulnerable residents still struggle to access the health care services needed to optimize their health outcomes. This assessment strives to explore more fully the current capacity of San Francisco’s health care facilities and projects the city/county’s future capacity needs based
on population projections and other data. This assessment also to addresses access, or “connectivity,” gaps in San Francisco’s health care system as voiced by members of the public and the HCSMP Task Force. The assessment explores the potential geographic access barriers to care that exist despite San Francisco’s small footprint and extensive transit system and also delves into connectivity gaps that result from residents’ health literacy and cultural/linguistic needs versus the existing health care delivery system’s capacity to tailor care in a manner best suited to the patient. While health insurance coverage also affects an individual’s ability to connect to health care services, please note that coverage issues will not be presented here. Please revisit the Health System Trends Assessment of this HCSMP for more information.
7 miles
7 m
iles
Exhibit 32. City and County of San Francisco
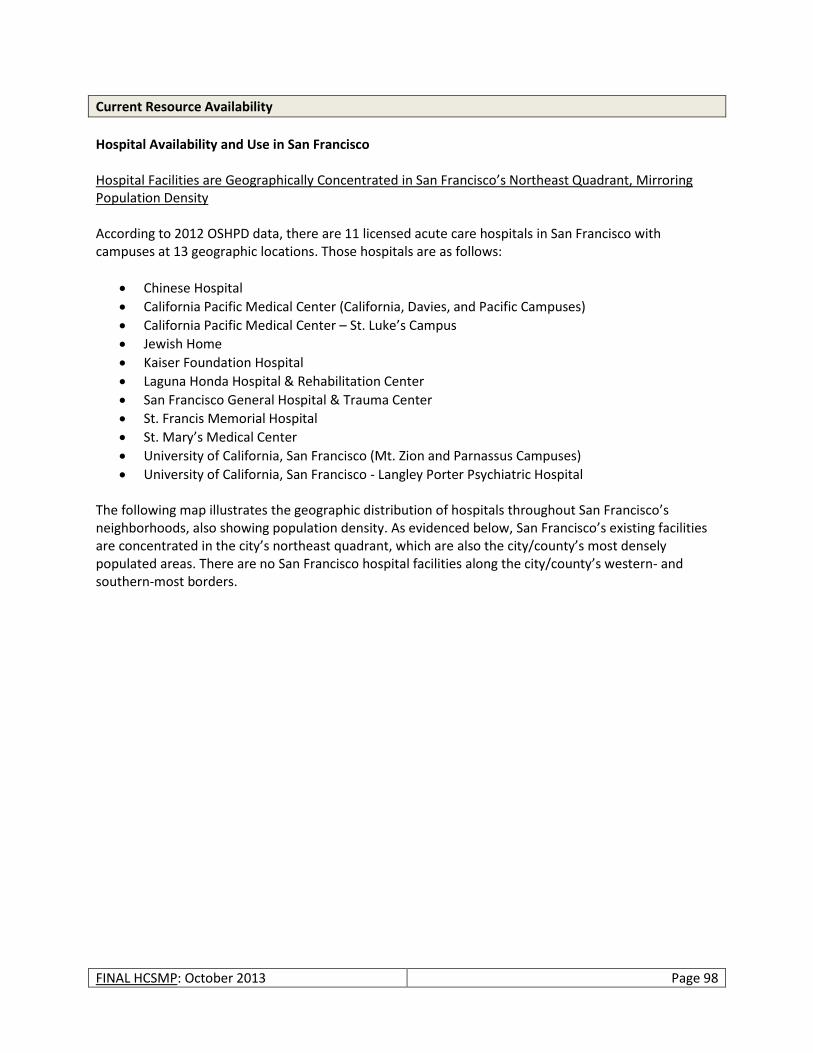
FINAL HCSMP: October 2013 Page 98
Current Resource Availability
Hospital Availability and Use in San Francisco Hospital Facilities are Geographically Concentrated in San Francisco’s Northeast Quadrant, Mirroring Population Density According to 2012 OSHPD data, there are 11 licensed acute care hospitals in San Francisco with campuses at 13 geographic locations. Those hospitals are as follows:
Chinese Hospital
California Pacific Medical Center (California, Davies, and Pacific Campuses)
California Pacific Medical Center – St. Luke’s Campus
Jewish Home
Kaiser Foundation Hospital
Laguna Honda Hospital & Rehabilitation Center
San Francisco General Hospital & Trauma Center
St. Francis Memorial Hospital
St. Mary’s Medical Center
University of California, San Francisco (Mt. Zion and Parnassus Campuses)
University of California, San Francisco - Langley Porter Psychiatric Hospital The following map illustrates the geographic distribution of hospitals throughout San Francisco’s neighborhoods, also showing population density. As evidenced below, San Francisco’s existing facilities are concentrated in the city’s northeast quadrant, which are also the city/county’s most densely populated areas. There are no San Francisco hospital facilities along the city/county’s western- and southern-most borders.
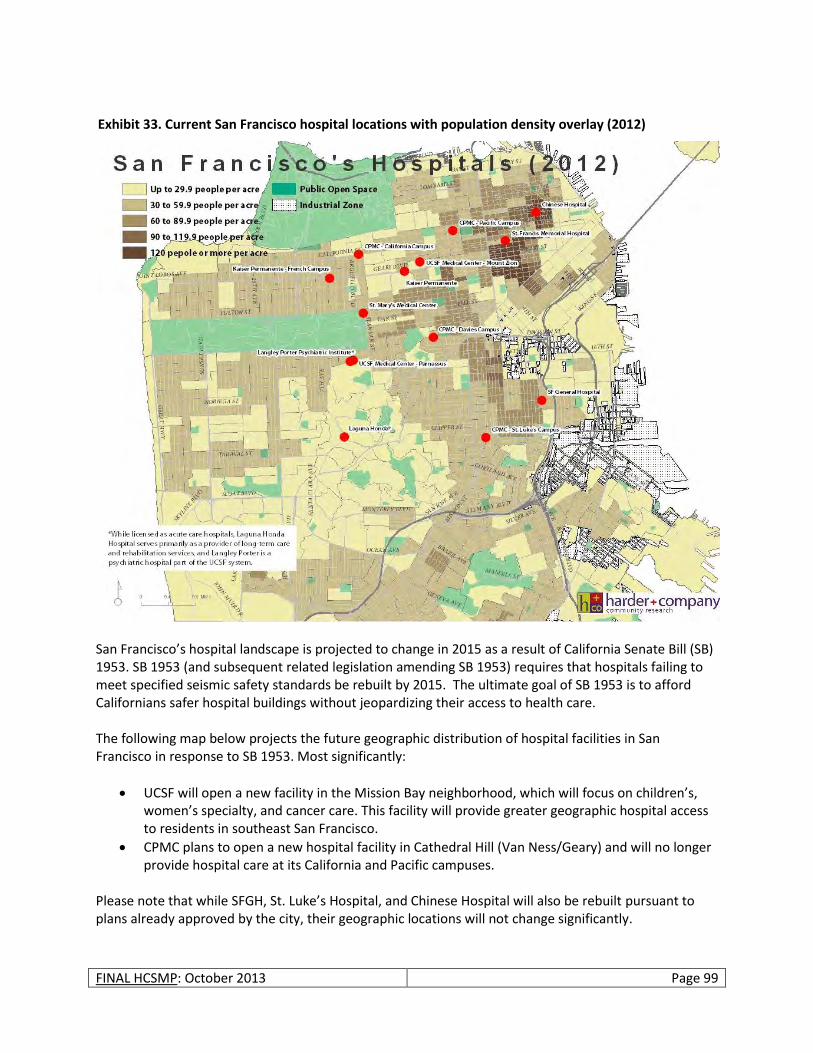
FINAL HCSMP: October 2013 Page 99
San Francisco’s hospital landscape is projected to change in 2015 as a result of California Senate Bill (SB) 1953. SB 1953 (and subsequent related legislation amending SB 1953) requires that hospitals failing to meet specified seismic safety standards be rebuilt by 2015. The ultimate goal of SB 1953 is to afford Californians safer hospital buildings without jeopardizing their access to health care. The following map below projects the future geographic distribution of hospital facilities in San Francisco in response to SB 1953. Most significantly:
UCSF will open a new facility in the Mission Bay neighborhood, which will focus on children’s, women’s specialty, and cancer care. This facility will provide greater geographic hospital access to residents in southeast San Francisco.
CPMC plans to open a new hospital facility in Cathedral Hill (Van Ness/Geary) and will no longer provide hospital care at its California and Pacific campuses.
Please note that while SFGH, St. Luke’s Hospital, and Chinese Hospital will also be rebuilt pursuant to plans already approved by the city, their geographic locations will not change significantly.
Exhibit 33. Current San Francisco hospital locations with population density overlay (2012)
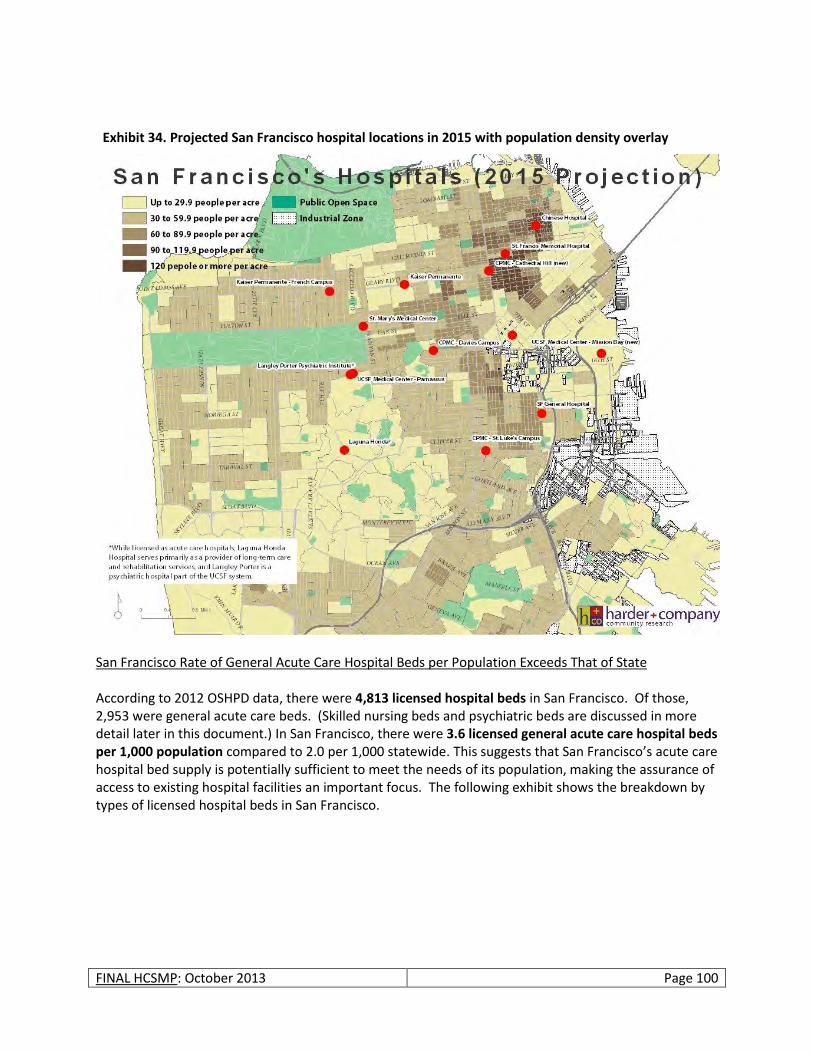
FINAL HCSMP: October 2013 Page 100
San Francisco Rate of General Acute Care Hospital Beds per Population Exceeds That of State According to 2012 OSHPD data, there were 4,813 licensed hospital beds in San Francisco. Of those, 2,953 were general acute care beds. (Skilled nursing beds and psychiatric beds are discussed in more detail later in this document.) In San Francisco, there were 3.6 licensed general acute care hospital beds per 1,000 population compared to 2.0 per 1,000 statewide. This suggests that San Francisco’s acute care hospital bed supply is potentially sufficient to meet the needs of its population, making the assurance of access to existing hospital facilities an important focus. The following exhibit shows the breakdown by types of licensed hospital beds in San Francisco.
Exhibit 34. Projected San Francisco hospital locations in 2015 with population density overlay
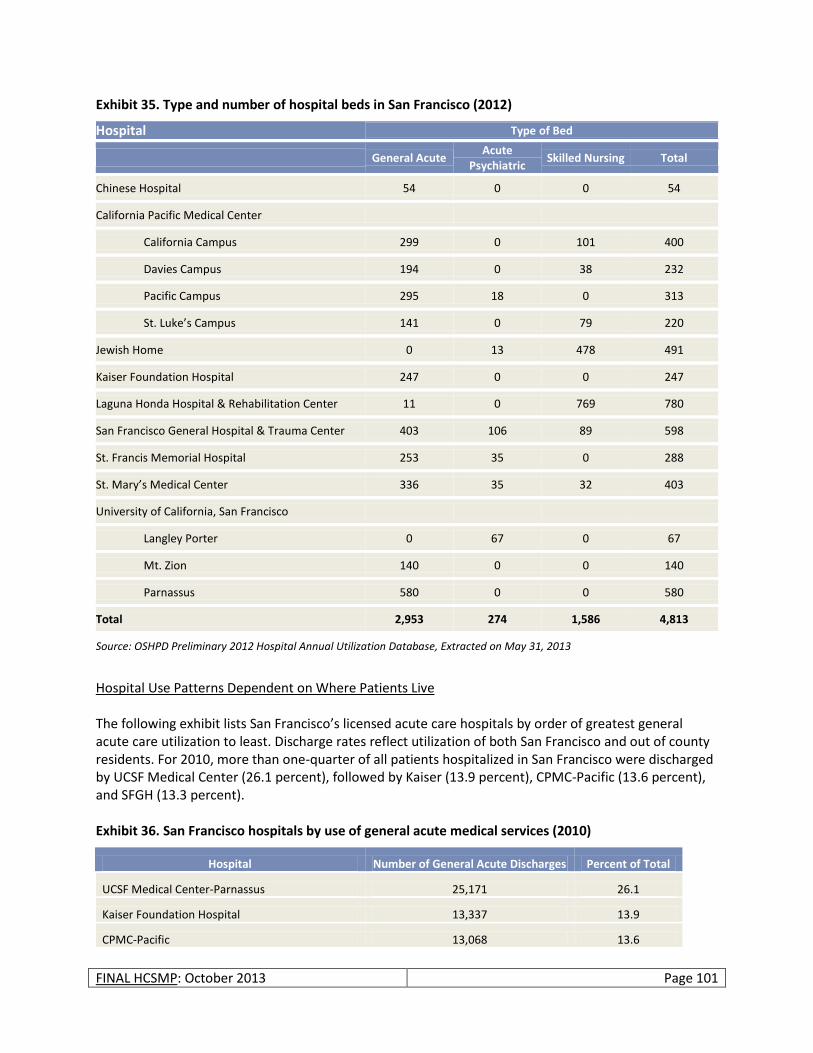
FINAL HCSMP: October 2013 Page 101
Exhibit 35. Type and number of hospital beds in San Francisco (2012)
Hospital Type of Bed
General Acute Acute
Psychiatric Skilled Nursing Total
Chinese Hospital 54 0 0 54
California Pacific Medical Center
California Campus 299 0 101 400
Davies Campus 194 0 38 232
Pacific Campus 295 18 0 313
St. Luke’s Campus 141 0 79 220
Jewish Home 0 13 478 491
Kaiser Foundation Hospital 247 0 0 247
Laguna Honda Hospital & Rehabilitation Center 11 0 769 780
San Francisco General Hospital & Trauma Center 403 106 89 598
St. Francis Memorial Hospital 253 35 0 288
St. Mary’s Medical Center 336 35 32 403
University of California, San Francisco
Langley Porter 0 67 0 67
Mt. Zion 140 0 0 140
Parnassus 580 0 0 580
Total 2,953 274 1,586 4,813
Source: OSHPD Preliminary 2012 Hospital Annual Utilization Database, Extracted on May 31, 2013
Hospital Use Patterns Dependent on Where Patients Live The following exhibit lists San Francisco’s licensed acute care hospitals by order of greatest general acute care utilization to least. Discharge rates reflect utilization of both San Francisco and out of county residents. For 2010, more than one-quarter of all patients hospitalized in San Francisco were discharged by UCSF Medical Center (26.1 percent), followed by Kaiser (13.9 percent), CPMC-Pacific (13.6 percent), and SFGH (13.3 percent). Exhibit 36. San Francisco hospitals by use of general acute medical services (2010)
Hospital Number of General Acute Discharges Percent of Total
UCSF Medical Center-Parnassus 25,171 26.1
Kaiser Foundation Hospital 13,337 13.9
CPMC-Pacific 13,068 13.6

FINAL HCSMP: October 2013 Page 102
Hospital Number of General Acute Discharges Percent of Total
San Francisco General Hospital 12,788 13.3
CPMC-California 8,104 8.4
St. Mary's Medical Center 5,461 5.7
St. Francis Memorial Hospital 5,105 5.3
St. Luke's Hospital 3,769 3.9
CPMC-Davies 3,714 3.9
UCSF Medical Center-Mt. Zion 3,602 3.7
Chinese Hospital 1,942 2.0
Laguna Honda Hospital and Rehabilitation Center 199 0.2
Langley Porter Psychiatric Institute 0 0.0
TOTAL 96,260 100.0%
Source: Office of Statewide Health Planning and Development (OSHPD) Hospital Utilization Profile Report, 2010 When looking solely at hospital use among San Francisco residents (out of county residents excluded), hospital utilization patterns change. The following exhibit lists the top 10 most used hospitals by San Francisco residents in 2008. Citywide, over one quarter (28 percent) of San Francisco residents who were hospitalized were discharged from California Pacific Medical Center. This is followed by San Francisco General Hospital (16 percent), UCSF Medical Center (14 percent) and Kaiser Foundation Hospital (12 percent). Exhibit 37. Top 10 hospitals most used by San Francisco residents (2008)
Hospital Number of Discharges Percent of Total
California Pacific Medical Center 22,088 27.6
San Francisco General Hospital 12,943 16.1
UCSF Medical Center 11,216 14.0
Kaiser Foundation Hospital – Geary SF 9,258 11.6
St. Mary’s Medical Center, San Francisco 4,768 5.9
St. Luke’s Hospital 4,413 5.5
St. Francis Memorial Hospital 4,272 5.3
Chinese Hospital 2,318 2.9
Seton Medical Center (in Daly City, San Mateo County) 1,932 2.4
Kaiser Foundation Hospital – South San Francisco 1,048 1.3
Total Discharges 80,154
Source: Office of Statewide Health Planning and Development (OSHPD) Patient Discharge Profile, 2008 NOTE: Out of county patient utilization is not captured in the above numbers.
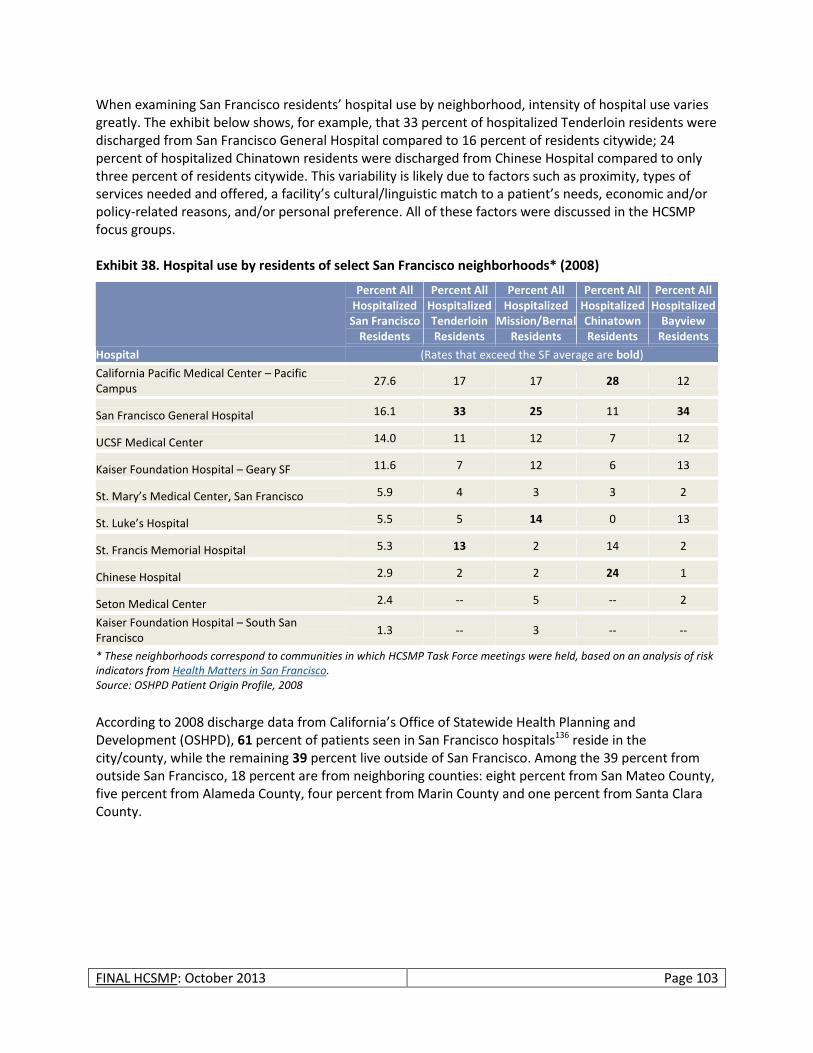
FINAL HCSMP: October 2013 Page 103
When examining San Francisco residents’ hospital use by neighborhood, intensity of hospital use varies greatly. The exhibit below shows, for example, that 33 percent of hospitalized Tenderloin residents were discharged from San Francisco General Hospital compared to 16 percent of residents citywide; 24 percent of hospitalized Chinatown residents were discharged from Chinese Hospital compared to only three percent of residents citywide. This variability is likely due to factors such as proximity, types of services needed and offered, a facility’s cultural/linguistic match to a patient’s needs, economic and/or policy-related reasons, and/or personal preference. All of these factors were discussed in the HCSMP focus groups. Exhibit 38. Hospital use by residents of select San Francisco neighborhoods* (2008)
Hospital
Percent All Hospitalized
San Francisco Residents
Percent All Hospitalized Tenderloin Residents
Percent All Hospitalized
Mission/Bernal Residents
Percent All Hospitalized Chinatown Residents
Percent All Hospitalized
Bayview Residents
(Rates that exceed the SF average are bold)
California Pacific Medical Center – Pacific Campus
27.6 17 17 28 12
San Francisco General Hospital 16.1 33 25 11 34
UCSF Medical Center 14.0 11 12 7 12
Kaiser Foundation Hospital – Geary SF 11.6 7 12 6 13
St. Mary’s Medical Center, San Francisco 5.9 4 3 3 2
St. Luke’s Hospital 5.5 5 14 0 13
St. Francis Memorial Hospital 5.3 13 2 14 2
Chinese Hospital 2.9 2 2 24 1
Seton Medical Center 2.4 -- 5 -- 2
Kaiser Foundation Hospital – South San Francisco
1.3 -- 3 -- --
* These neighborhoods correspond to communities in which HCSMP Task Force meetings were held, based on an analysis of risk indicators from Health Matters in San Francisco. Source: OSHPD Patient Origin Profile, 2008
According to 2008 discharge data from California’s Office of Statewide Health Planning and Development (OSHPD), 61 percent of patients seen in San Francisco hospitals136 reside in the city/county, while the remaining 39 percent live outside of San Francisco. Among the 39 percent from outside San Francisco, 18 percent are from neighboring counties: eight percent from San Mateo County, five percent from Alameda County, four percent from Marin County and one percent from Santa Clara County.
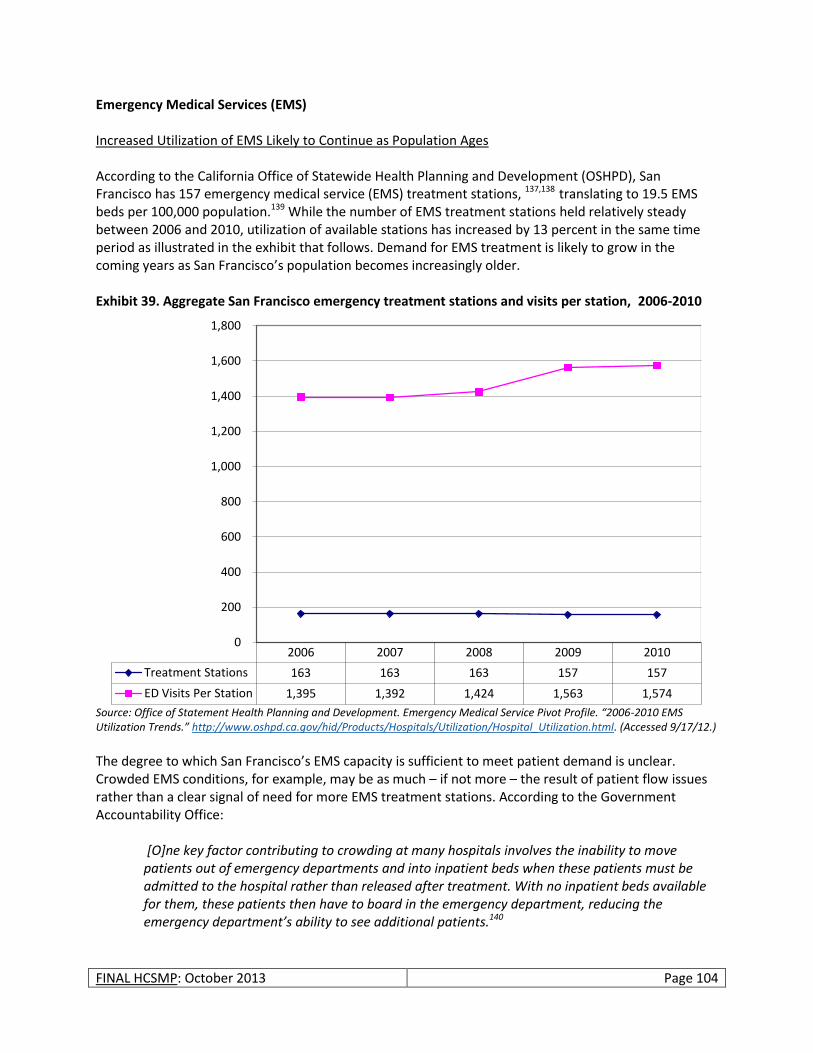
FINAL HCSMP: October 2013 Page 104
Emergency Medical Services (EMS) Increased Utilization of EMS Likely to Continue as Population Ages According to the California Office of Statewide Health Planning and Development (OSHPD), San Francisco has 157 emergency medical service (EMS) treatment stations, 137,138 translating to 19.5 EMS beds per 100,000 population.139 While the number of EMS treatment stations held relatively steady between 2006 and 2010, utilization of available stations has increased by 13 percent in the same time period as illustrated in the exhibit that follows. Demand for EMS treatment is likely to grow in the coming years as San Francisco’s population becomes increasingly older. Exhibit 39. Aggregate San Francisco emergency treatment stations and visits per station, 2006-2010
Source: Office of Statement Health Planning and Development. Emergency Medical Service Pivot Profile. “2006-2010 EMS Utilization Trends.” http://www.oshpd.ca.gov/hid/Products/Hospitals/Utilization/Hospital_Utilization.html. (Accessed 9/17/12.)
The degree to which San Francisco’s EMS capacity is sufficient to meet patient demand is unclear. Crowded EMS conditions, for example, may be as much – if not more – the result of patient flow issues rather than a clear signal of need for more EMS treatment stations. According to the Government Accountability Office: [O]ne key factor contributing to crowding at many hospitals involves the inability to move patients out of emergency departments and into inpatient beds when these patients must be admitted to the hospital rather than released after treatment. With no inpatient beds available for them, these patients then have to board in the emergency department, reducing the emergency department’s ability to see additional patients.140
2006 2007 2008 2009 2010
Treatment Stations 163 163 163 157 157
ED Visits Per Station 1,395 1,392 1,424 1,563 1,574
0
200
400
600
800
1,000
1,200
1,400
1,600
1,800

FINAL HCSMP: October 2013 Page 105
To determine the degree to which San Francisco has sufficient EMS capacity requires assessment along indicators of EMS overcrowding such as the percentage of patients who board in an emergency department for two hours or more; the proportion of patients who leave before a medical evaluation; and the number of hours on ambulance diversion. While San Francisco lacks comprehensive aggregate information along the first indicator, information is available for both the rate of patients leaving before treatment and ambulance diversion. San Francisco Sees Minimal Increase in Number of Patients Leaving EMS Before Treatment, Possibly Signaling Overcrowding and Issues of Patient Flow Research suggests that many EMS patients who register but leave without being seen (LWOBS) are seriously ill and at risk of poorer health outcomes.141 As indicated in the exhibit below, the actual number of San Francisco EMS patients who LWOBS increased by approximately five percent between 2006 and 2010, increasing from 11,897 in 2006 to 12,470 in 2010. However, the proportion of patients who LWOBS to total EMS visits (non-EMS visits excluded) held relatively steady with 5.2 percent of patients LWOBS in 2006 compared to 5.0 percent in 2010. Exhibit 40. Aggregate EMS visits vs. non-EMS visits in San Francisco, 2006-2010
While a review of the literature does not yield a standard or benchmark for that which constitutes an “acceptable” level of patients who LWOBS, recent research examining LWOBS rates in acute-care, non-federal hospitals in California found that the rates of LWOBS patients ranged from 0 percent to 20.3 percent in 2007, with a median of 2.6 percent.142 Using this standard, San Francisco’s LWOBS rate is well within the state range but slightly above the state median. While an imperfect measure of EMS capacity, this number suggests that San Francisco’s system may face some degree of overcrowding but neither definitively clarifies the cause nor the corresponding need.
2006 2007 2008 2009 2010
EMS 227,382 226,942 232,166 245,410 247,118
Non-EMS Visits 7,317 5,957 7,134 4,348 9,825
Registered, Left Without Being Seen
11,897 10,140 15,340 17,154 12,470
-
50,000
100,000
150,000
200,000
250,000
300,000
Source: Office of Statement Health Planning and Development. Emergency Medical Service Pivot Profile. “2006-2010 EMS Utilization Trends.” http://www.oshpd.ca.gov/hid/Products/Hospitals/Utilization/Hospital_Utilization.html. (Accessed 9/17/12.)
FINAL HCSMP: October 2013 Page 106
San Francisco Ambulance Diversion Rates Have Decreased Over Time Despite Steady EMS Capacity, Signals Potential to Improve Hospital Efficiencies Beyond Increasing EMS Bed Numbers The Department of Emergency Management (DEM) – Emergency Services maintains San Francisco’s ambulance-transport destination policy, which:
Establishes a network of approved ambulance-transport destinations;
Delineates parameters for when patients should be transported to general and specialty care hospitals and approved alternate destinations; and
Allows patients to be transported to the most appropriate destination from the field. This policy ensures more appropriate use of San Francisco’s health care facilities in a manner tailored to the needs of each patient. Ambulances may only transport patients to approved receiving hospitals or specialty care facilities, or to pre-approved alternate destinations, if appropriate. In addition, patients in need of specialty treatment (e.g., obstetric care) may bypass the receiving hospital’s emergency department and instead be taken to that hospital’s appropriate specialty care department. If, through pre-established criteria, it is determined that a receiving hospital is unable to accommodate more patients, an ambulance is diverted to an alternate destination. (Patients meeting specific criteria are not subject to total diversion.143 In addition, San Francisco General Hospital may not divert incarcerated patients or patients in police custody.) It is important to note that diversion impacts only those patients who arrive via ambulance. Nearly 70 percent of all emergency department patients arrive by private transport or walk in and cannot be lawfully turned away.144 Please see the following exhibit for San Francisco’s current ambulance destination designations.
What do diversion rates mean?
Diversion rates are considered one means of assessing a facility’s capacity to accommodate and serve new patients; however, high diversion rates do not necessarily signify that more health care facilities are needed to meet patient demand. Rather, diversion can signal:
Patient flow issues
Emergency department overcrowding
Internal management issues
Multiple ambulances arriving simultaneously at the same facility
Patient choice (i.e., patient preference for one hospital over another)
Seasonal (e.g., flu) or other outbreaks To understand the full meaning of diversion data, diversion rates must be considered along with hospital-specific information.
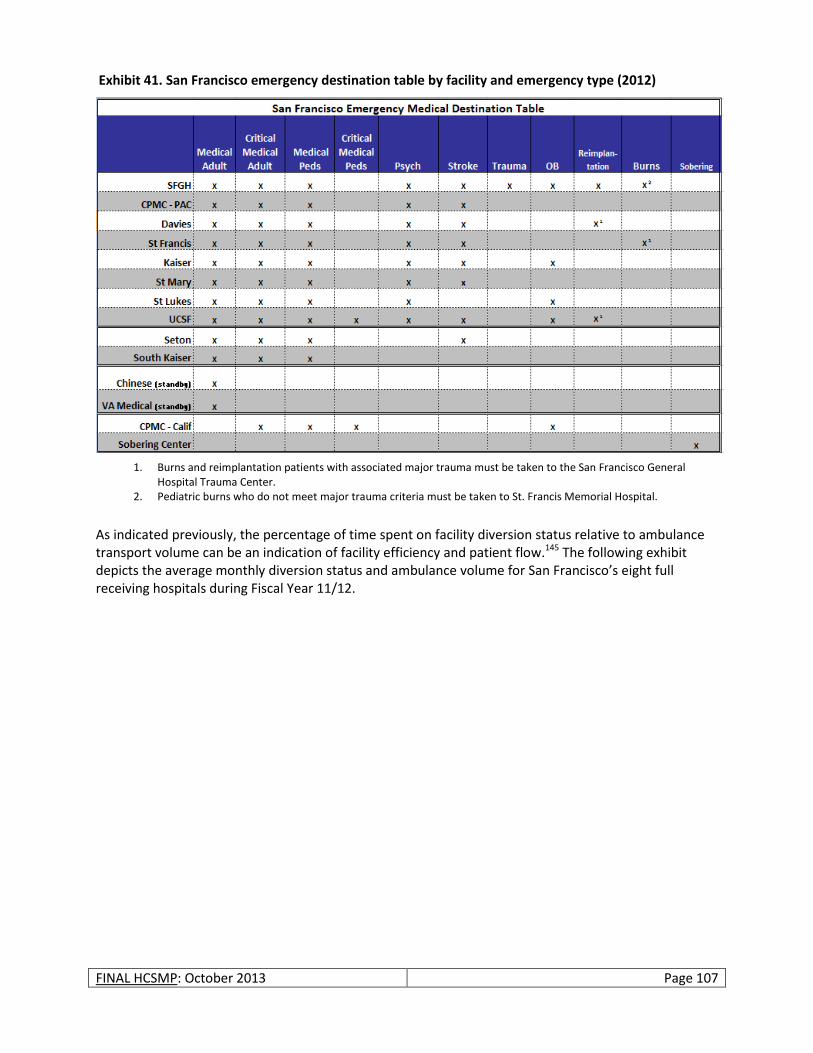
FINAL HCSMP: October 2013 Page 107
As indicated previously, the percentage of time spent on facility diversion status relative to ambulance transport volume can be an indication of facility efficiency and patient flow.145 The following exhibit depicts the average monthly diversion status and ambulance volume for San Francisco’s eight full receiving hospitals during Fiscal Year 11/12.
1. Burns and reimplantation patients with associated major trauma must be taken to the San Francisco General Hospital Trauma Center.
2. Pediatric burns who do not meet major trauma criteria must be taken to St. Francis Memorial Hospital.
Exhibit 41. San Francisco emergency destination table by facility and emergency type (2012)
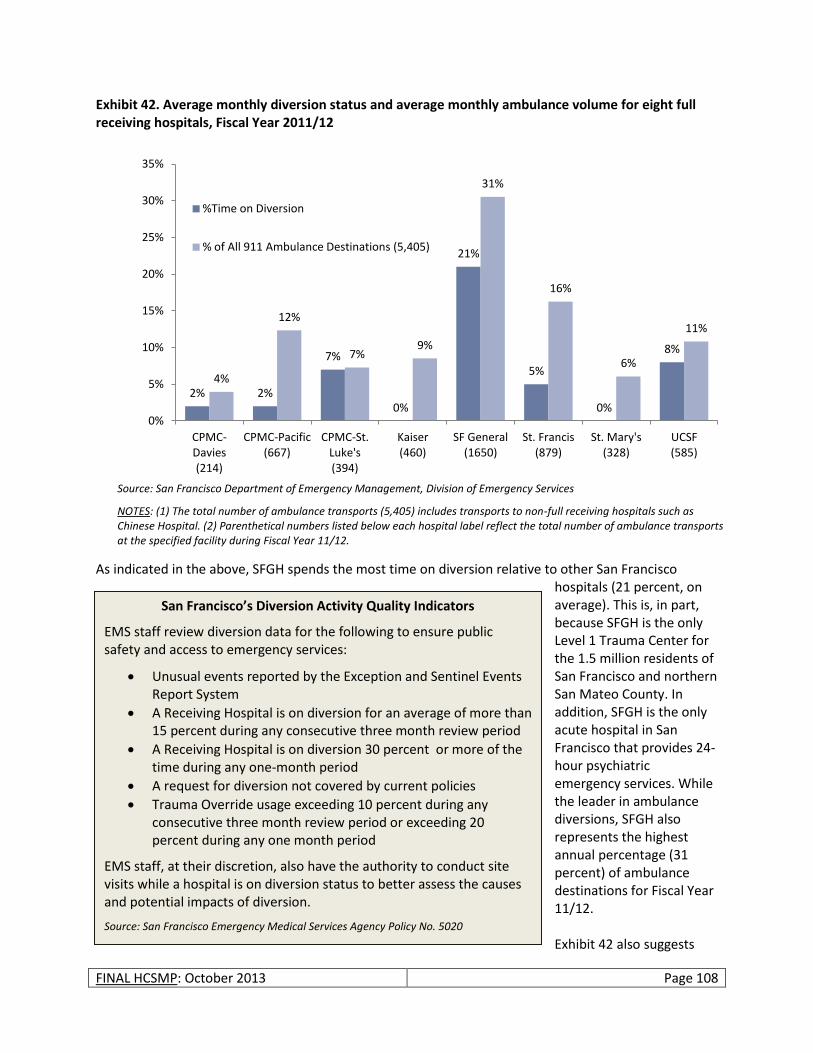
FINAL HCSMP: October 2013 Page 108
Exhibit 42. Average monthly diversion status and average monthly ambulance volume for eight full receiving hospitals, Fiscal Year 2011/12
As indicated in the above, SFGH spends the most time on diversion relative to other San Francisco
hospitals (21 percent, on average). This is, in part, because SFGH is the only Level 1 Trauma Center for the 1.5 million residents of San Francisco and northern San Mateo County. In addition, SFGH is the only acute hospital in San Francisco that provides 24-hour psychiatric emergency services. While the leader in ambulance diversions, SFGH also represents the highest annual percentage (31 percent) of ambulance destinations for Fiscal Year 11/12. Exhibit 42 also suggests
2% 2%
7%
0%
21%
5%
0%
8%
4%
12%
7% 9%
31%
16%
6%
11%
0%
5%
10%
15%
20%
25%
30%
35%
CPMC-Davies (214)
CPMC-Pacific (667)
CPMC-St. Luke's (394)
Kaiser (460)
SF General (1650)
St. Francis (879)
St. Mary's (328)
UCSF (585)
%Time on Diversion
% of All 911 Ambulance Destinations (5,405)
San Francisco’s Diversion Activity Quality Indicators
EMS staff review diversion data for the following to ensure public safety and access to emergency services:
Unusual events reported by the Exception and Sentinel Events Report System
A Receiving Hospital is on diversion for an average of more than 15 percent during any consecutive three month review period
A Receiving Hospital is on diversion 30 percent or more of the time during any one-month period
A request for diversion not covered by current policies
Trauma Override usage exceeding 10 percent during any consecutive three month review period or exceeding 20 percent during any one month period
EMS staff, at their discretion, also have the authority to conduct site visits while a hospital is on diversion status to better assess the causes and potential impacts of diversion.
Source: San Francisco Emergency Medical Services Agency Policy No. 5020
Source: San Francisco Department of Emergency Management, Division of Emergency Services
NOTES: (1) The total number of ambulance transports (5,405) includes transports to non-full receiving hospitals such as Chinese Hospital. (2) Parenthetical numbers listed below each hospital label reflect the total number of ambulance transports at the specified facility during Fiscal Year 11/12.
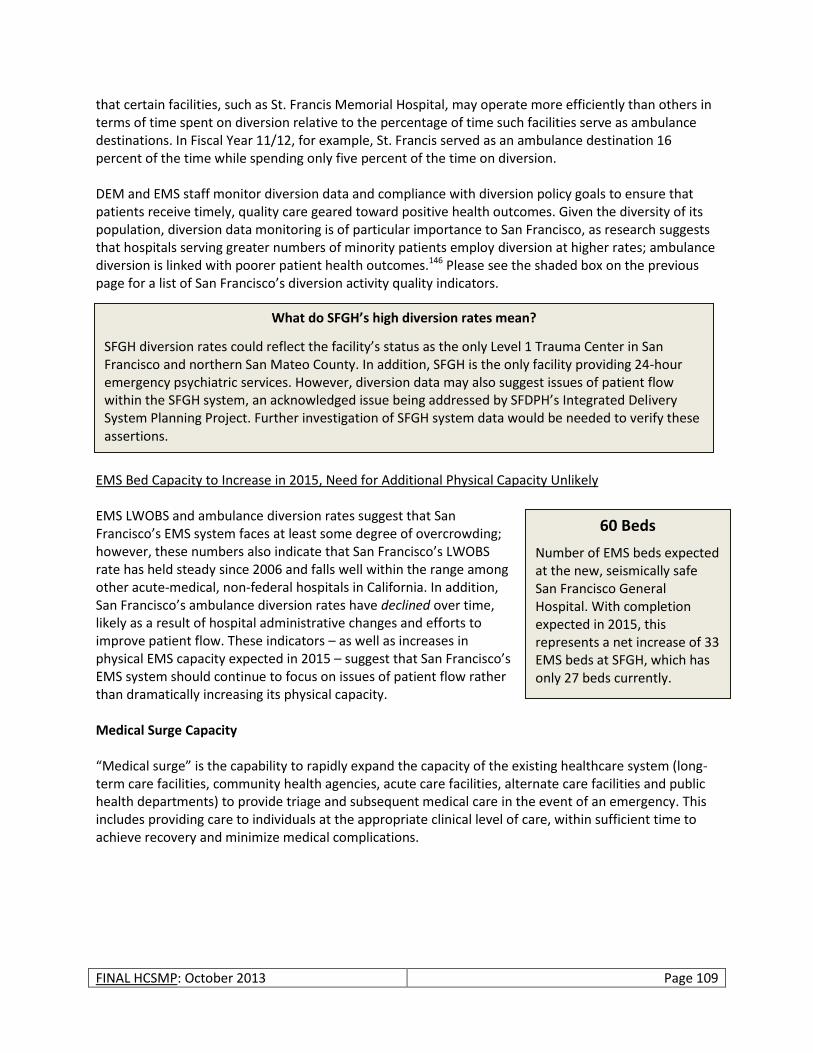
FINAL HCSMP: October 2013 Page 109
that certain facilities, such as St. Francis Memorial Hospital, may operate more efficiently than others in terms of time spent on diversion relative to the percentage of time such facilities serve as ambulance destinations. In Fiscal Year 11/12, for example, St. Francis served as an ambulance destination 16 percent of the time while spending only five percent of the time on diversion. DEM and EMS staff monitor diversion data and compliance with diversion policy goals to ensure that patients receive timely, quality care geared toward positive health outcomes. Given the diversity of its population, diversion data monitoring is of particular importance to San Francisco, as research suggests that hospitals serving greater numbers of minority patients employ diversion at higher rates; ambulance diversion is linked with poorer patient health outcomes.146 Please see the shaded box on the previous page for a list of San Francisco’s diversion activity quality indicators.
EMS Bed Capacity to Increase in 2015, Need for Additional Physical Capacity Unlikely EMS LWOBS and ambulance diversion rates suggest that San Francisco’s EMS system faces at least some degree of overcrowding; however, these numbers also indicate that San Francisco’s LWOBS rate has held steady since 2006 and falls well within the range among other acute-medical, non-federal hospitals in California. In addition, San Francisco’s ambulance diversion rates have declined over time, likely as a result of hospital administrative changes and efforts to improve patient flow. These indicators – as well as increases in physical EMS capacity expected in 2015 – suggest that San Francisco’s EMS system should continue to focus on issues of patient flow rather than dramatically increasing its physical capacity. Medical Surge Capacity “Medical surge” is the capability to rapidly expand the capacity of the existing healthcare system (long-term care facilities, community health agencies, acute care facilities, alternate care facilities and public health departments) to provide triage and subsequent medical care in the event of an emergency. This includes providing care to individuals at the appropriate clinical level of care, within sufficient time to achieve recovery and minimize medical complications.
What do SFGH’s high diversion rates mean?
SFGH diversion rates could reflect the facility’s status as the only Level 1 Trauma Center in San Francisco and northern San Mateo County. In addition, SFGH is the only facility providing 24-hour emergency psychiatric services. However, diversion data may also suggest issues of patient flow within the SFGH system, an acknowledged issue being addressed by SFDPH’s Integrated Delivery System Planning Project. Further investigation of SFGH system data would be needed to verify these assertions.
60 Beds
Number of EMS beds expected at the new, seismically safe San Francisco General Hospital. With completion expected in 2015, this represents a net increase of 33 EMS beds at SFGH, which has only 27 beds currently.
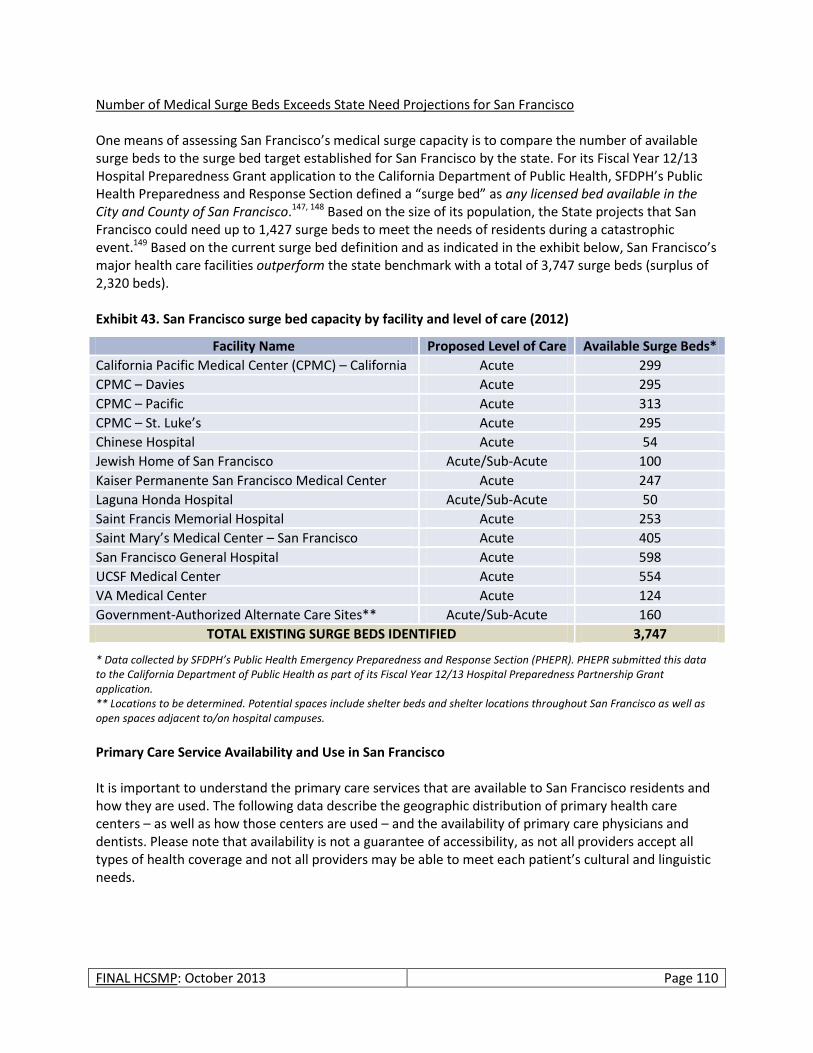
FINAL HCSMP: October 2013 Page 110
Number of Medical Surge Beds Exceeds State Need Projections for San Francisco One means of assessing San Francisco’s medical surge capacity is to compare the number of available surge beds to the surge bed target established for San Francisco by the state. For its Fiscal Year 12/13 Hospital Preparedness Grant application to the California Department of Public Health, SFDPH’s Public Health Preparedness and Response Section defined a “surge bed” as any licensed bed available in the City and County of San Francisco.147, 148 Based on the size of its population, the State projects that San Francisco could need up to 1,427 surge beds to meet the needs of residents during a catastrophic event.149 Based on the current surge bed definition and as indicated in the exhibit below, San Francisco’s major health care facilities outperform the state benchmark with a total of 3,747 surge beds (surplus of 2,320 beds). Exhibit 43. San Francisco surge bed capacity by facility and level of care (2012)
Facility Name Proposed Level of Care Available Surge Beds*
California Pacific Medical Center (CPMC) – California Acute 299
CPMC – Davies Acute 295
CPMC – Pacific Acute 313
CPMC – St. Luke’s Acute 295
Chinese Hospital Acute 54
Jewish Home of San Francisco Acute/Sub-Acute 100
Kaiser Permanente San Francisco Medical Center Acute 247
Laguna Honda Hospital Acute/Sub-Acute 50
Saint Francis Memorial Hospital Acute 253
Saint Mary’s Medical Center – San Francisco Acute 405
San Francisco General Hospital Acute 598
UCSF Medical Center Acute 554
VA Medical Center Acute 124
Government-Authorized Alternate Care Sites** Acute/Sub-Acute 160
TOTAL EXISTING SURGE BEDS IDENTIFIED 3,747
* Data collected by SFDPH’s Public Health Emergency Preparedness and Response Section (PHEPR). PHEPR submitted this data to the California Department of Public Health as part of its Fiscal Year 12/13 Hospital Preparedness Partnership Grant application. ** Locations to be determined. Potential spaces include shelter beds and shelter locations throughout San Francisco as well as open spaces adjacent to/on hospital campuses.
Primary Care Service Availability and Use in San Francisco It is important to understand the primary care services that are available to San Francisco residents and how they are used. The following data describe the geographic distribution of primary health care centers – as well as how those centers are used – and the availability of primary care physicians and dentists. Please note that availability is not a guarantee of accessibility, as not all providers accept all types of health coverage and not all providers may be able to meet each patient’s cultural and linguistic needs.

FINAL HCSMP: October 2013 Page 111
San Francisco Home to Several Primary Care Health Centers, Concentrated in City/County’s Northeast Quadrant Primary care health centers continue to be an important resource for community residents, as the care provided is more often community-based and focused on low-income populations with an emphasis on cultural and linguistic competence. The following map illustrates the geographic distribution of San Francisco’s primary care health centers, also showing population density throughout the city/county. As with hospitals, primary care health centers are predominantly located in San Francisco’s northeast quadrant, which is also the city’s most densely populated area. Primary care health centers are sparser in San Francisco’s northwest and southwest quadrants.
Primary Care Health Centers Serve High Number of Publicly Insured Residents, Utilization Varies by Facility The following exhibit lists those licensed primary care health centers that submitted data to the Office of Statewide Health Planning and Development (OSHPD) in 2010. Please note that not all primary care health centers are required to report to OSHPD, so this data is not comprehensive.
Exhibit 44. San Francisco primary care clinics by location, with population density overlay (2012)

FINAL HCSMP: October 2013 Page 112
Exhibit 45. San Francisco primary care health centers: location, patients seen, services provided, and payment types (2010)
Primary Care Health Center Zip
Code Planning
Neighborhood
Number of
Patients Seen
Number of
Services Provided
% Public Ins. (not inc. co
indigent) % County Indigent % Free
% Private Ins./Cash
30th Street Community Clinic
94131
Glen Park, Noe Valley, Diamond Heights, Twin Peaks, Inner Sunset
171 10,300 100 - - -
AHF Healthcare Center – San Francisco
94103 South of Market, Mission
424 2,411 43.9 - 51.9 4.2
BAART Market Clinic
94103 South of Market, Mission
588 1,757 45.6 - 48.8 5.6
BAART Turk Street Clinic
94102 Downtown/Civic Center, Western Addition
827 3,689 59.1 - 17.4 23.5
Chinese Community Health Services
94122 Outer Sunset, Inner Sunset
2,593 8,739 35.2 - - 64.8
Chinese Hospitals Excelsior Health Services
94112 Outer Mission, Ocean View, Excelsior
1,798 5,876 75.5 - - 24.5
Curry Senior Center
94102 Downtown/Civic Center, Western Addition
1,589 12,481 77.3 3.1 - 19.6
Glide Health Services
94102 Downtown/Civic Center, Western Addition
3,202 17,094 21 39 - 40
Haight Ashbury Free Medical Clinic
94117 Haight Ashbury, Western Addition
2,959 4,929 5.8 - 14.8 79.4
Haight Ashbury Integrated Care Center
94103 South of Market, Mission
4,220 5,821 19.1 - 63.7 17.3
Institute on Aging 94118 Inner Richmond, Presidio Heights
127 6,993 100 - - -
Instituto Familiar de la Raza – Outpatient
94110 Mission, Bernal Heights
297 8,710 51.2 - 4 44.8
Lyon-Martins Women’s Health Services
94102 Downtown/Civic Center, Western Addition
2,566 11,167 11.7 - - 88.3
Mission Neighborhood Health Center
94110 Mission, Bernal Heights
9,280 36,966 38.2 - 29.2 32.5
Mission Neighborhood Health Center – Valencia Clinic
94110 Mission, Bernal Heights
1,484 3,951 60.8 - 0.3 38.9
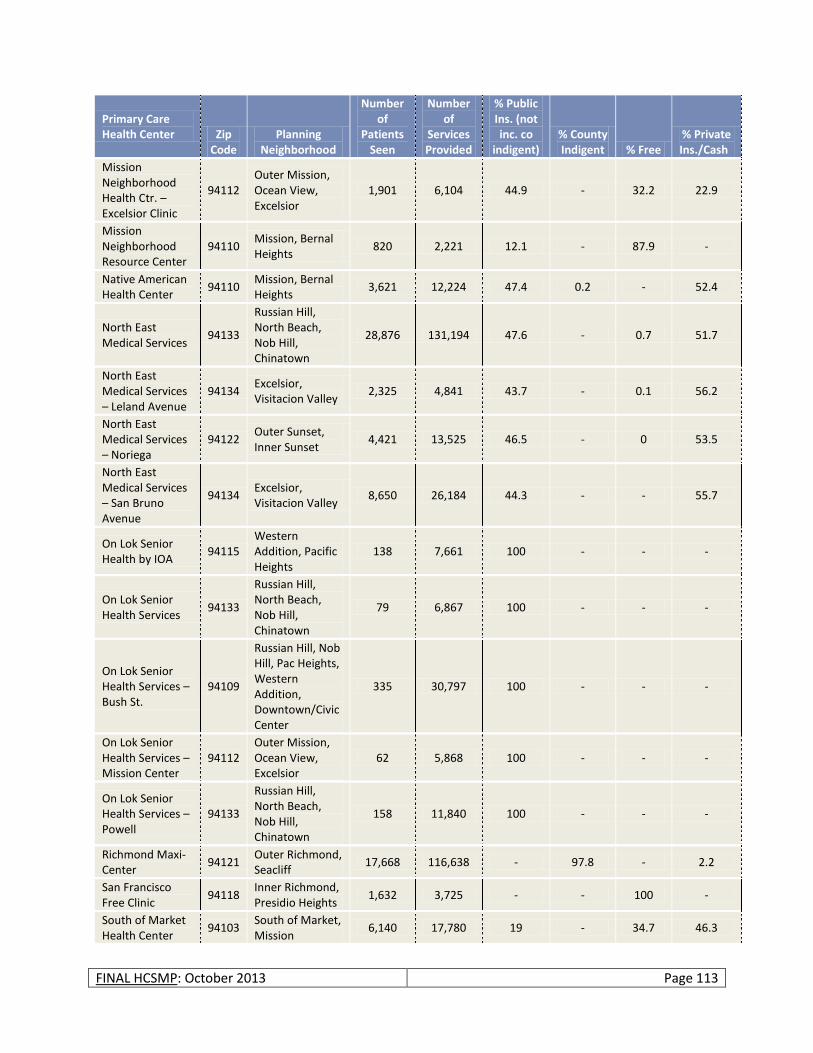
FINAL HCSMP: October 2013 Page 113
Primary Care Health Center Zip
Code Planning
Neighborhood
Number of
Patients Seen
Number of
Services Provided
% Public Ins. (not inc. co
indigent) % County Indigent % Free
% Private Ins./Cash
Mission Neighborhood Health Ctr. – Excelsior Clinic
94112 Outer Mission, Ocean View, Excelsior
1,901 6,104 44.9 - 32.2 22.9
Mission Neighborhood Resource Center
94110 Mission, Bernal Heights
820 2,221 12.1 - 87.9 -
Native American Health Center
94110 Mission, Bernal Heights
3,621 12,224 47.4 0.2 - 52.4
North East Medical Services
94133
Russian Hill, North Beach, Nob Hill, Chinatown
28,876 131,194 47.6 - 0.7 51.7
North East Medical Services – Leland Avenue
94134 Excelsior, Visitacion Valley
2,325 4,841 43.7 - 0.1 56.2
North East Medical Services – Noriega
94122 Outer Sunset, Inner Sunset
4,421 13,525 46.5 - 0 53.5
North East Medical Services – San Bruno Avenue
94134 Excelsior, Visitacion Valley
8,650 26,184 44.3 - - 55.7
On Lok Senior Health by IOA
94115 Western Addition, Pacific Heights
138 7,661 100 - - -
On Lok Senior Health Services
94133
Russian Hill, North Beach, Nob Hill, Chinatown
79 6,867 100 - - -
On Lok Senior Health Services – Bush St.
94109
Russian Hill, Nob Hill, Pac Heights, Western Addition, Downtown/Civic Center
335 30,797 100 - - -
On Lok Senior Health Services – Mission Center
94112 Outer Mission, Ocean View, Excelsior
62 5,868 100 - - -
On Lok Senior Health Services – Powell
94133
Russian Hill, North Beach, Nob Hill, Chinatown
158 11,840 100 - - -
Richmond Maxi-Center
94121 Outer Richmond, Seacliff
17,668 116,638 - 97.8 - 2.2
San Francisco Free Clinic
94118 Inner Richmond, Presidio Heights
1,632 3,725 - - 100 -
South of Market Health Center
94103 South of Market, Mission
6,140 17,780 19 - 34.7 46.3
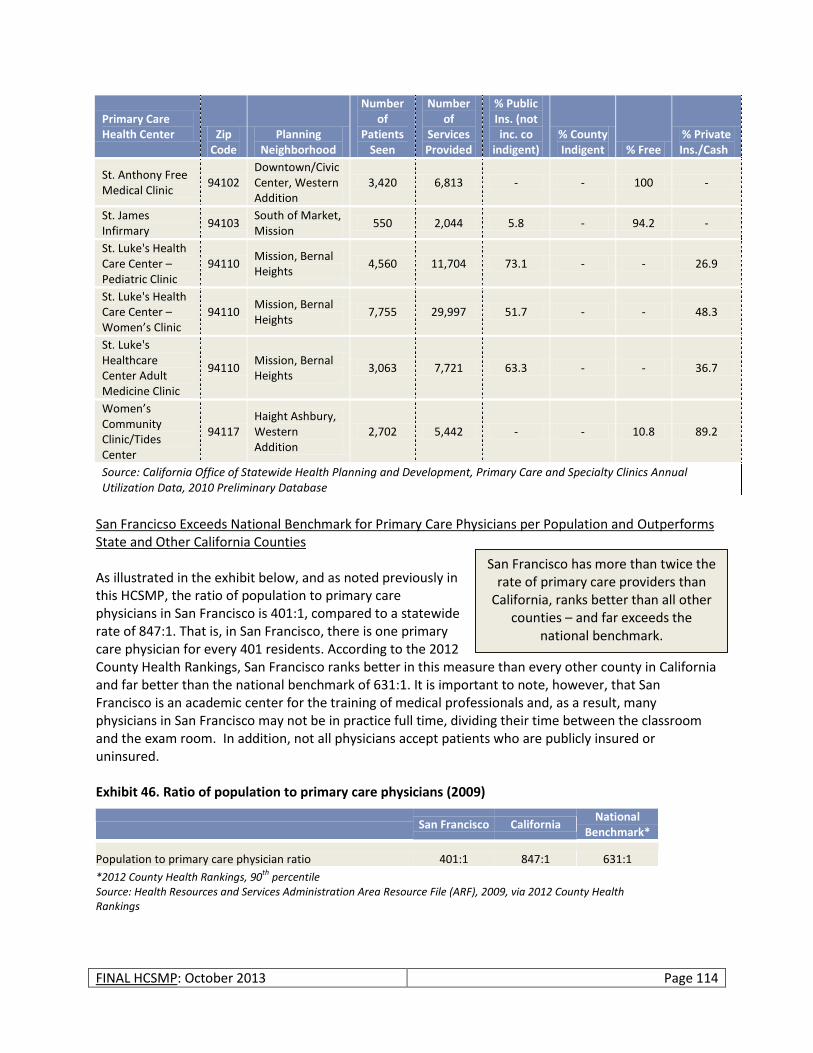
FINAL HCSMP: October 2013 Page 114
Primary Care Health Center Zip
Code Planning
Neighborhood
Number of
Patients Seen
Number of
Services Provided
% Public Ins. (not inc. co
indigent) % County Indigent % Free
% Private Ins./Cash
St. Anthony Free Medical Clinic
94102 Downtown/Civic Center, Western Addition
3,420 6,813 - - 100 -
St. James Infirmary
94103 South of Market, Mission
550 2,044 5.8 - 94.2 -
St. Luke's Health Care Center – Pediatric Clinic
94110 Mission, Bernal Heights
4,560 11,704 73.1 - - 26.9
St. Luke's Health Care Center – Women’s Clinic
94110 Mission, Bernal Heights
7,755 29,997 51.7 - - 48.3
St. Luke's Healthcare Center Adult Medicine Clinic
94110 Mission, Bernal Heights
3,063 7,721 63.3 - - 36.7
Women’s Community Clinic/Tides Center
94117 Haight Ashbury, Western Addition
2,702 5,442 - - 10.8 89.2
Source: California Office of Statewide Health Planning and Development, Primary Care and Specialty Clinics Annual Utilization Data, 2010 Preliminary Database
San Francicso Exceeds National Benchmark for Primary Care Physicians per Population and Outperforms State and Other California Counties As illustrated in the exhibit below, and as noted previously in this HCSMP, the ratio of population to primary care physicians in San Francisco is 401:1, compared to a statewide rate of 847:1. That is, in San Francisco, there is one primary care physician for every 401 residents. According to the 2012 County Health Rankings, San Francisco ranks better in this measure than every other county in California and far better than the national benchmark of 631:1. It is important to note, however, that San Francisco is an academic center for the training of medical professionals and, as a result, many physicians in San Francisco may not be in practice full time, dividing their time between the classroom and the exam room. In addition, not all physicians accept patients who are publicly insured or uninsured. Exhibit 46. Ratio of population to primary care physicians (2009)
San Francisco California National
Benchmark*
Population to primary care physician ratio 401:1 847:1 631:1
*2012 County Health Rankings, 90th
percentile Source: Health Resources and Services Administration Area Resource File (ARF), 2009, via 2012 County Health Rankings
San Francisco has more than twice the rate of primary care providers than
California, ranks better than all other counties – and far exceeds the
national benchmark.
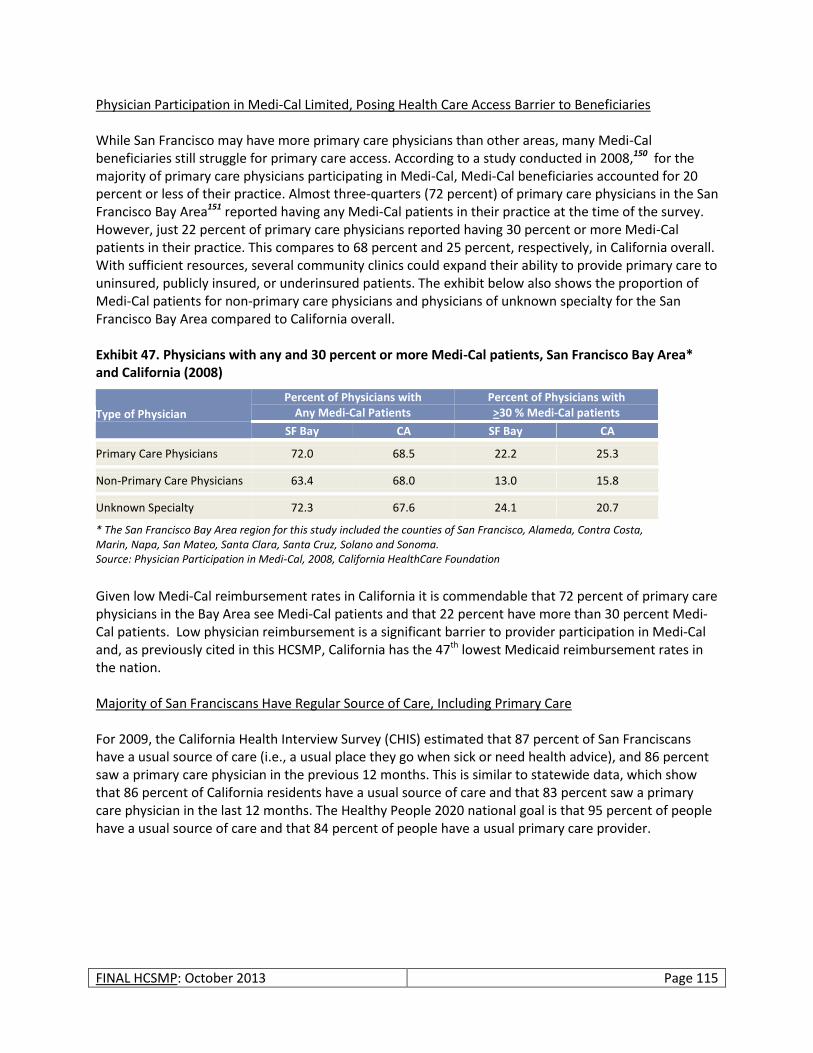
FINAL HCSMP: October 2013 Page 115
Physician Participation in Medi-Cal Limited, Posing Health Care Access Barrier to Beneficiaries While San Francisco may have more primary care physicians than other areas, many Medi-Cal beneficiaries still struggle for primary care access. According to a study conducted in 2008,150 for the majority of primary care physicians participating in Medi-Cal, Medi-Cal beneficiaries accounted for 20 percent or less of their practice. Almost three-quarters (72 percent) of primary care physicians in the San Francisco Bay Area151 reported having any Medi-Cal patients in their practice at the time of the survey. However, just 22 percent of primary care physicians reported having 30 percent or more Medi-Cal patients in their practice. This compares to 68 percent and 25 percent, respectively, in California overall. With sufficient resources, several community clinics could expand their ability to provide primary care to uninsured, publicly insured, or underinsured patients. The exhibit below also shows the proportion of Medi-Cal patients for non-primary care physicians and physicians of unknown specialty for the San Francisco Bay Area compared to California overall. Exhibit 47. Physicians with any and 30 percent or more Medi-Cal patients, San Francisco Bay Area* and California (2008)
Type of Physician
Percent of Physicians with Any Medi-Cal Patients
Percent of Physicians with >30 % Medi-Cal patients
SF Bay CA SF Bay CA
Primary Care Physicians 72.0 68.5 22.2 25.3
Non-Primary Care Physicians 63.4 68.0 13.0 15.8
Unknown Specialty 72.3 67.6 24.1 20.7
* The San Francisco Bay Area region for this study included the counties of San Francisco, Alameda, Contra Costa, Marin, Napa, San Mateo, Santa Clara, Santa Cruz, Solano and Sonoma. Source: Physician Participation in Medi-Cal, 2008, California HealthCare Foundation
Given low Medi-Cal reimbursement rates in California it is commendable that 72 percent of primary care physicians in the Bay Area see Medi-Cal patients and that 22 percent have more than 30 percent Medi-Cal patients. Low physician reimbursement is a significant barrier to provider participation in Medi-Cal and, as previously cited in this HCSMP, California has the 47th lowest Medicaid reimbursement rates in the nation. Majority of San Franciscans Have Regular Source of Care, Including Primary Care For 2009, the California Health Interview Survey (CHIS) estimated that 87 percent of San Franciscans have a usual source of care (i.e., a usual place they go when sick or need health advice), and 86 percent saw a primary care physician in the previous 12 months. This is similar to statewide data, which show that 86 percent of California residents have a usual source of care and that 83 percent saw a primary care physician in the last 12 months. The Healthy People 2020 national goal is that 95 percent of people have a usual source of care and that 84 percent of people have a usual primary care provider.
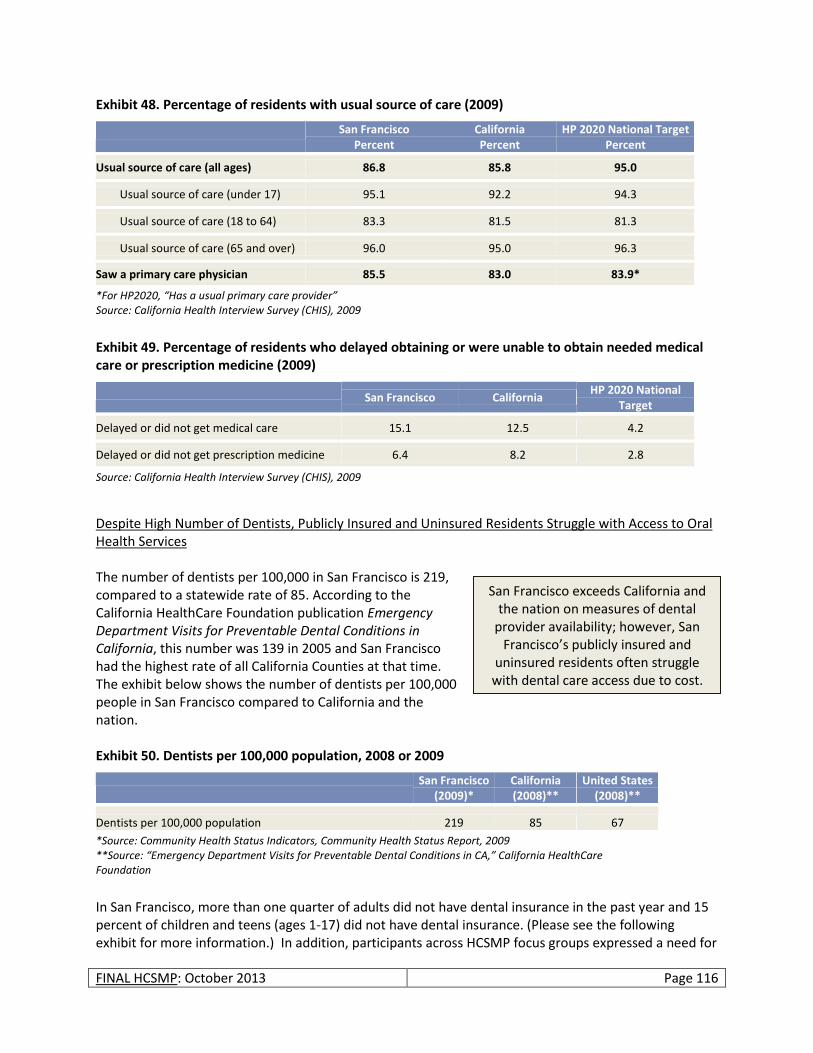
FINAL HCSMP: October 2013 Page 116
Exhibit 48. Percentage of residents with usual source of care (2009)
San Francisco Percent
California Percent
HP 2020 National Target Percent
Usual source of care (all ages) 86.8 85.8 95.0
Usual source of care (under 17) 95.1 92.2 94.3
Usual source of care (18 to 64) 83.3 81.5 81.3
Usual source of care (65 and over) 96.0 95.0 96.3
Saw a primary care physician 85.5 83.0 83.9*
*For HP2020, “Has a usual primary care provider” Source: California Health Interview Survey (CHIS), 2009
Exhibit 49. Percentage of residents who delayed obtaining or were unable to obtain needed medical care or prescription medicine (2009)
San Francisco California HP 2020 National
Target
Delayed or did not get medical care 15.1 12.5 4.2
Delayed or did not get prescription medicine 6.4 8.2 2.8
Source: California Health Interview Survey (CHIS), 2009
Despite High Number of Dentists, Publicly Insured and Uninsured Residents Struggle with Access to Oral Health Services The number of dentists per 100,000 in San Francisco is 219, compared to a statewide rate of 85. According to the California HealthCare Foundation publication Emergency Department Visits for Preventable Dental Conditions in California, this number was 139 in 2005 and San Francisco had the highest rate of all California Counties at that time. The exhibit below shows the number of dentists per 100,000 people in San Francisco compared to California and the nation. Exhibit 50. Dentists per 100,000 population, 2008 or 2009
San Francisco
(2009)* California (2008)**
United States (2008)**
Dentists per 100,000 population 219 85 67
*Source: Community Health Status Indicators, Community Health Status Report, 2009 **Source: “Emergency Department Visits for Preventable Dental Conditions in CA,” California HealthCare Foundation
In San Francisco, more than one quarter of adults did not have dental insurance in the past year and 15 percent of children and teens (ages 1-17) did not have dental insurance. (Please see the following exhibit for more information.) In addition, participants across HCSMP focus groups expressed a need for
San Francisco exceeds California and the nation on measures of dental
provider availability; however, San Francisco’s publicly insured and
uninsured residents often struggle with dental care access due to cost.
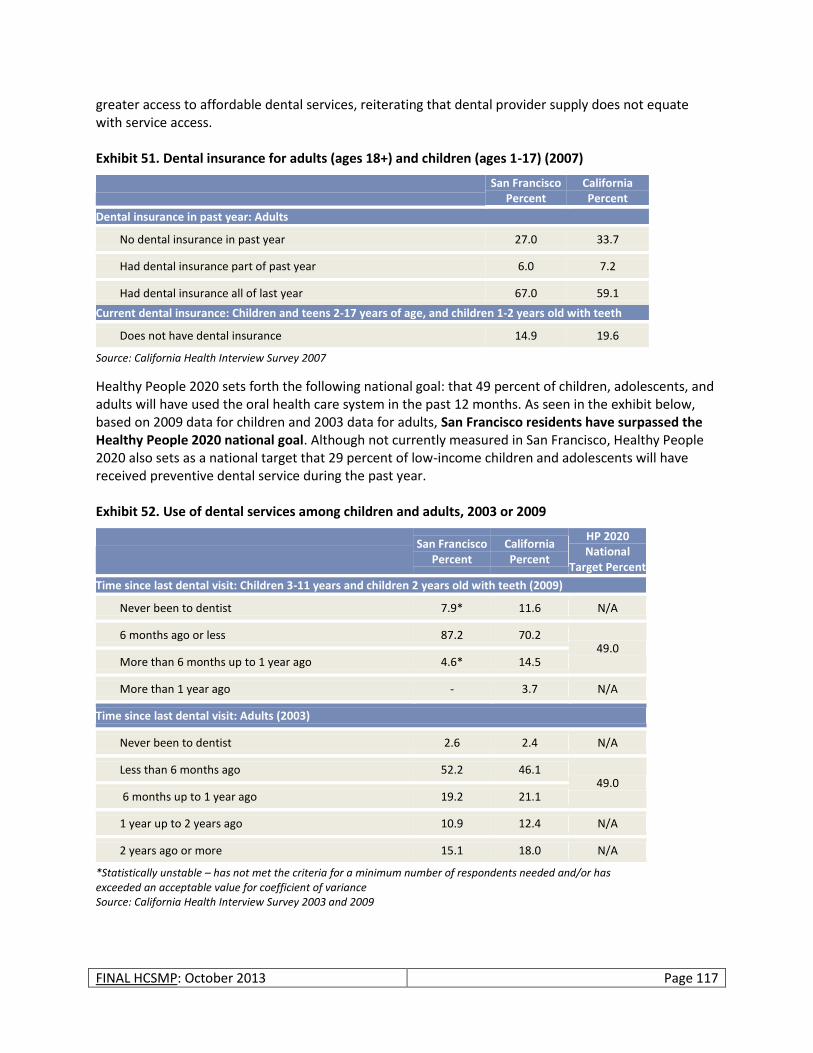
FINAL HCSMP: October 2013 Page 117
greater access to affordable dental services, reiterating that dental provider supply does not equate with service access. Exhibit 51. Dental insurance for adults (ages 18+) and children (ages 1-17) (2007)
San Francisco Percent
California Percent
Dental insurance in past year: Adults
No dental insurance in past year 27.0 33.7
Had dental insurance part of past year 6.0 7.2
Had dental insurance all of last year 67.0 59.1
Current dental insurance: Children and teens 2-17 years of age, and children 1-2 years old with teeth
Does not have dental insurance 14.9 19.6
Source: California Health Interview Survey 2007
Healthy People 2020 sets forth the following national goal: that 49 percent of children, adolescents, and adults will have used the oral health care system in the past 12 months. As seen in the exhibit below, based on 2009 data for children and 2003 data for adults, San Francisco residents have surpassed the Healthy People 2020 national goal. Although not currently measured in San Francisco, Healthy People 2020 also sets as a national target that 29 percent of low-income children and adolescents will have received preventive dental service during the past year. Exhibit 52. Use of dental services among children and adults, 2003 or 2009
San Francisco Percent
California Percent
HP 2020 National
Target Percent
Time since last dental visit: Children 3-11 years and children 2 years old with teeth (2009)
Never been to dentist 7.9* 11.6 N/A
6 months ago or less 87.2 70.2 49.0
More than 6 months up to 1 year ago 4.6* 14.5
More than 1 year ago - 3.7 N/A
Time since last dental visit: Adults (2003)
Never been to dentist 2.6 2.4 N/A
Less than 6 months ago 52.2 46.1 49.0
6 months up to 1 year ago 19.2 21.1
1 year up to 2 years ago 10.9 12.4 N/A
2 years ago or more 15.1 18.0 N/A
*Statistically unstable – has not met the criteria for a minimum number of respondents needed and/or has exceeded an acceptable value for coefficient of variance Source: California Health Interview Survey 2003 and 2009
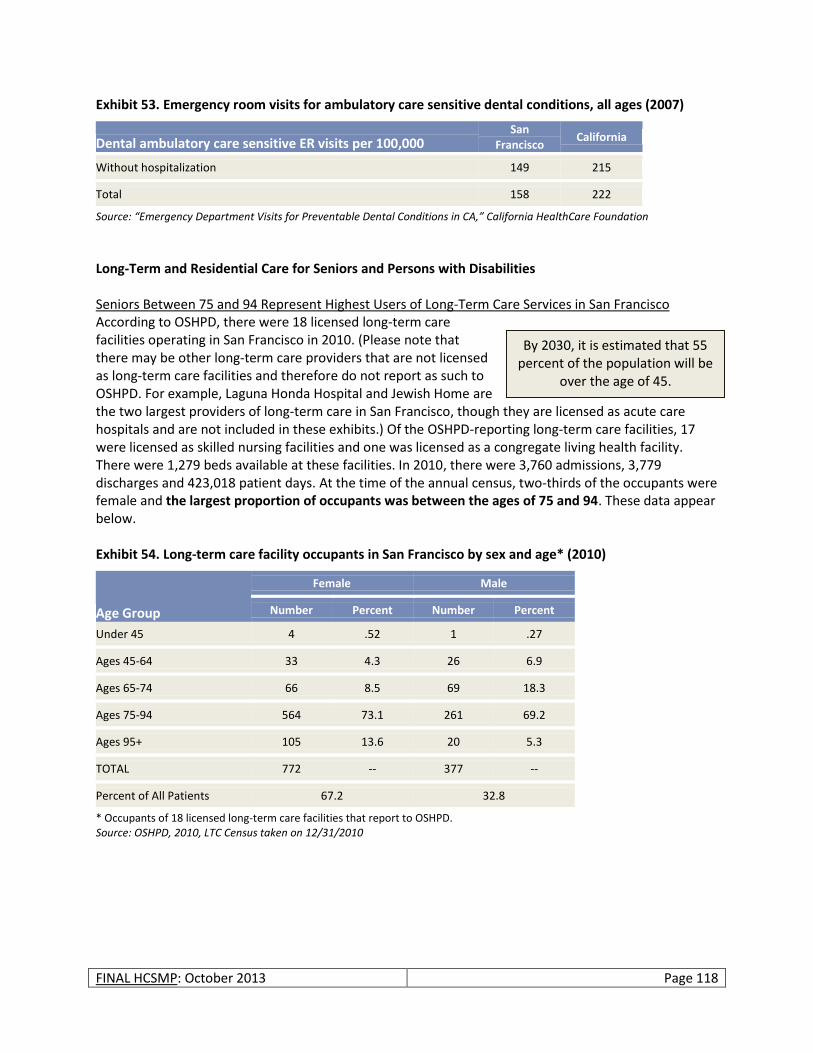
FINAL HCSMP: October 2013 Page 118
Exhibit 53. Emergency room visits for ambulatory care sensitive dental conditions, all ages (2007)
Dental ambulatory care sensitive ER visits per 100,000 San
Francisco California
Without hospitalization 149 215
Total 158 222
Source: “Emergency Department Visits for Preventable Dental Conditions in CA,” California HealthCare Foundation
Long-Term and Residential Care for Seniors and Persons with Disabilities Seniors Between 75 and 94 Represent Highest Users of Long-Term Care Services in San Francisco According to OSHPD, there were 18 licensed long-term care facilities operating in San Francisco in 2010. (Please note that there may be other long-term care providers that are not licensed as long-term care facilities and therefore do not report as such to OSHPD. For example, Laguna Honda Hospital and Jewish Home are the two largest providers of long-term care in San Francisco, though they are licensed as acute care hospitals and are not included in these exhibits.) Of the OSHPD-reporting long-term care facilities, 17 were licensed as skilled nursing facilities and one was licensed as a congregate living health facility. There were 1,279 beds available at these facilities. In 2010, there were 3,760 admissions, 3,779 discharges and 423,018 patient days. At the time of the annual census, two-thirds of the occupants were female and the largest proportion of occupants was between the ages of 75 and 94. These data appear below. Exhibit 54. Long-term care facility occupants in San Francisco by sex and age* (2010)
Age Group
Female Male
Number Percent Number Percent
Under 45 4 .52 1 .27
Ages 45-64 33 4.3 26 6.9
Ages 65-74 66 8.5 69 18.3
Ages 75-94 564 73.1 261 69.2
Ages 95+ 105 13.6 20 5.3
TOTAL 772 -- 377 --
Percent of All Patients 67.2 32.8
* Occupants of 18 licensed long-term care facilities that report to OSHPD. Source: OSHPD, 2010, LTC Census taken on 12/31/2010
By 2030, it is estimated that 55 percent of the population will be
over the age of 45.
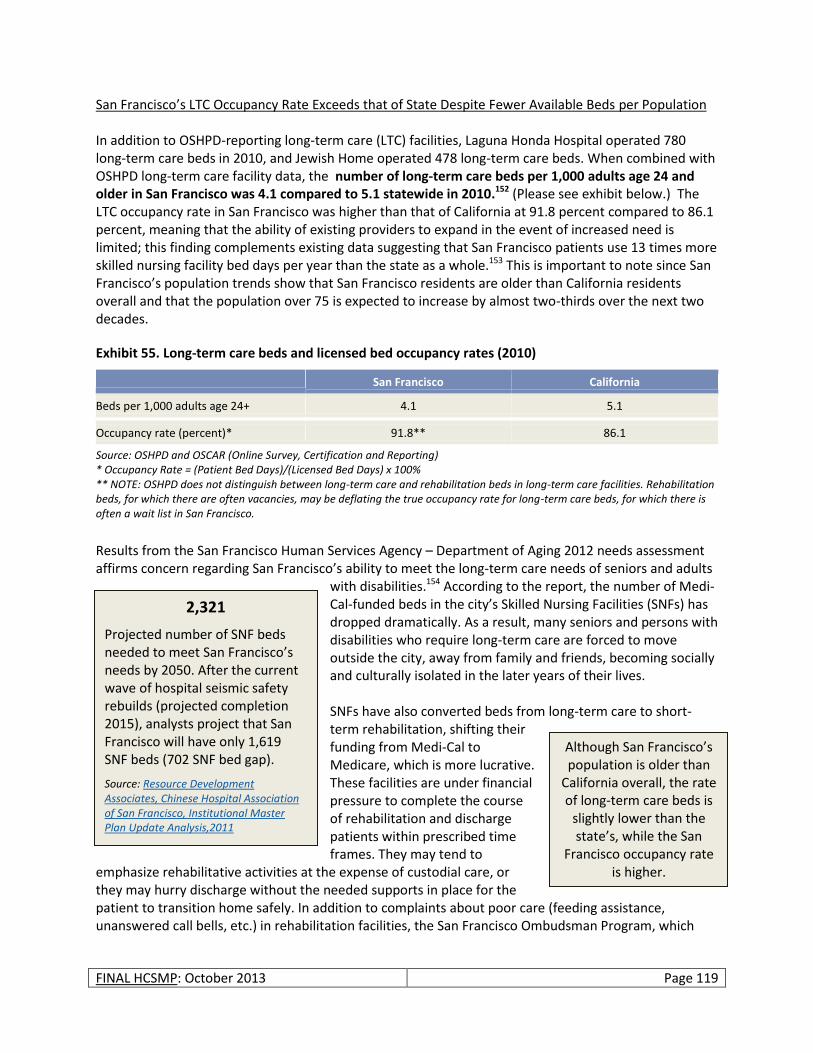
FINAL HCSMP: October 2013 Page 119
San Francisco’s LTC Occupancy Rate Exceeds that of State Despite Fewer Available Beds per Population In addition to OSHPD-reporting long-term care (LTC) facilities, Laguna Honda Hospital operated 780 long-term care beds in 2010, and Jewish Home operated 478 long-term care beds. When combined with OSHPD long-term care facility data, the number of long-term care beds per 1,000 adults age 24 and older in San Francisco was 4.1 compared to 5.1 statewide in 2010.152 (Please see exhibit below.) The LTC occupancy rate in San Francisco was higher than that of California at 91.8 percent compared to 86.1 percent, meaning that the ability of existing providers to expand in the event of increased need is limited; this finding complements existing data suggesting that San Francisco patients use 13 times more skilled nursing facility bed days per year than the state as a whole.153 This is important to note since San Francisco’s population trends show that San Francisco residents are older than California residents overall and that the population over 75 is expected to increase by almost two-thirds over the next two decades.
Exhibit 55. Long-term care beds and licensed bed occupancy rates (2010)
San Francisco California
Beds per 1,000 adults age 24+ 4.1 5.1
Occupancy rate (percent)* 91.8** 86.1
Source: OSHPD and OSCAR (Online Survey, Certification and Reporting) * Occupancy Rate = (Patient Bed Days)/(Licensed Bed Days) x 100% ** NOTE: OSHPD does not distinguish between long-term care and rehabilitation beds in long-term care facilities. Rehabilitation beds, for which there are often vacancies, may be deflating the true occupancy rate for long-term care beds, for which there is often a wait list in San Francisco.
Results from the San Francisco Human Services Agency – Department of Aging 2012 needs assessment affirms concern regarding San Francisco’s ability to meet the long-term care needs of seniors and adults
with disabilities.154 According to the report, the number of Medi-Cal-funded beds in the city’s Skilled Nursing Facilities (SNFs) has dropped dramatically. As a result, many seniors and persons with disabilities who require long-term care are forced to move outside the city, away from family and friends, becoming socially and culturally isolated in the later years of their lives. SNFs have also converted beds from long-term care to short-term rehabilitation, shifting their funding from Medi-Cal to Medicare, which is more lucrative. These facilities are under financial pressure to complete the course of rehabilitation and discharge patients within prescribed time frames. They may tend to
emphasize rehabilitative activities at the expense of custodial care, or they may hurry discharge without the needed supports in place for the patient to transition home safely. In addition to complaints about poor care (feeding assistance, unanswered call bells, etc.) in rehabilitation facilities, the San Francisco Ombudsman Program, which
Although San Francisco’s population is older than
California overall, the rate of long-term care beds is
slightly lower than the state’s, while the San
Francisco occupancy rate is higher.
2,321
Projected number of SNF beds needed to meet San Francisco’s needs by 2050. After the current wave of hospital seismic safety rebuilds (projected completion 2015), analysts project that San Francisco will have only 1,619 SNF beds (702 SNF bed gap).
Source: Resource Development Associates, Chinese Hospital Association of San Francisco, Institutional Master Plan Update Analysis,2011
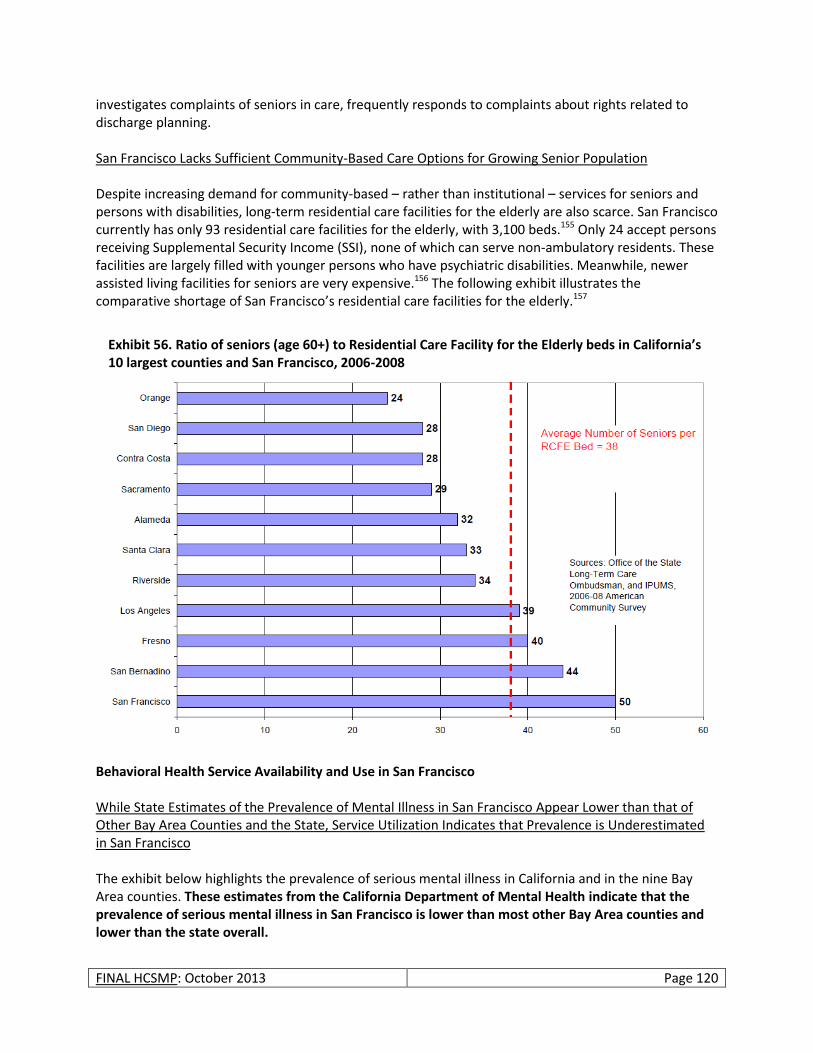
FINAL HCSMP: October 2013 Page 120
investigates complaints of seniors in care, frequently responds to complaints about rights related to discharge planning. San Francisco Lacks Sufficient Community-Based Care Options for Growing Senior Population Despite increasing demand for community-based – rather than institutional – services for seniors and persons with disabilities, long-term residential care facilities for the elderly are also scarce. San Francisco currently has only 93 residential care facilities for the elderly, with 3,100 beds.155 Only 24 accept persons receiving Supplemental Security Income (SSI), none of which can serve non-ambulatory residents. These facilities are largely filled with younger persons who have psychiatric disabilities. Meanwhile, newer assisted living facilities for seniors are very expensive.156 The following exhibit illustrates the comparative shortage of San Francisco’s residential care facilities for the elderly.157
Behavioral Health Service Availability and Use in San Francisco While State Estimates of the Prevalence of Mental Illness in San Francisco Appear Lower than that of Other Bay Area Counties and the State, Service Utilization Indicates that Prevalence is Underestimated in San Francisco The exhibit below highlights the prevalence of serious mental illness in California and in the nine Bay Area counties. These estimates from the California Department of Mental Health indicate that the prevalence of serious mental illness in San Francisco is lower than most other Bay Area counties and lower than the state overall.
Exhibit 56. Ratio of seniors (age 60+) to Residential Care Facility for the Elderly beds in California’s 10 largest counties and San Francisco, 2006-2008
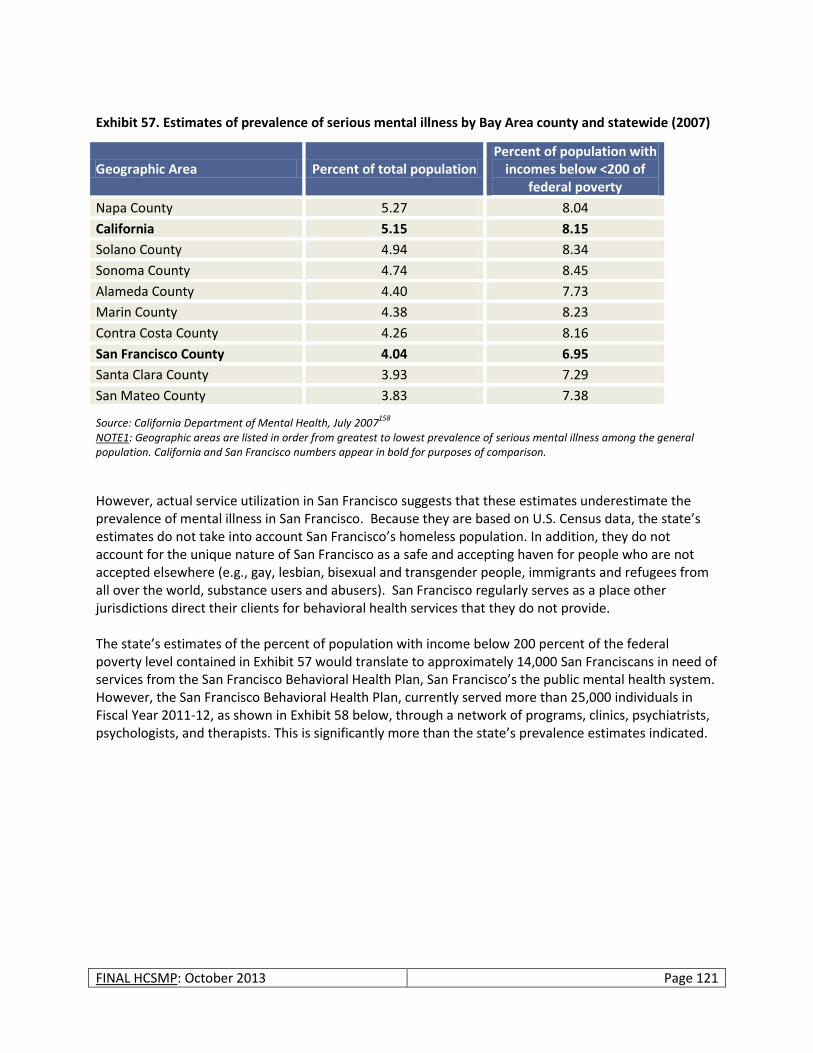
FINAL HCSMP: October 2013 Page 121
Exhibit 57. Estimates of prevalence of serious mental illness by Bay Area county and statewide (2007)
Geographic Area Percent of total population Percent of population with
incomes below <200 of federal poverty
Napa County 5.27 8.04
California 5.15 8.15
Solano County 4.94 8.34
Sonoma County 4.74 8.45
Alameda County 4.40 7.73
Marin County 4.38 8.23
Contra Costa County 4.26 8.16
San Francisco County 4.04 6.95
Santa Clara County 3.93 7.29
San Mateo County 3.83 7.38
Source: California Department of Mental Health, July 2007158
NOTE1: Geographic areas are listed in order from greatest to lowest prevalence of serious mental illness among the general population. California and San Francisco numbers appear in bold for purposes of comparison.
However, actual service utilization in San Francisco suggests that these estimates underestimate the prevalence of mental illness in San Francisco. Because they are based on U.S. Census data, the state’s estimates do not take into account San Francisco’s homeless population. In addition, they do not account for the unique nature of San Francisco as a safe and accepting haven for people who are not accepted elsewhere (e.g., gay, lesbian, bisexual and transgender people, immigrants and refugees from all over the world, substance users and abusers). San Francisco regularly serves as a place other jurisdictions direct their clients for behavioral health services that they do not provide. The state’s estimates of the percent of population with income below 200 percent of the federal poverty level contained in Exhibit 57 would translate to approximately 14,000 San Franciscans in need of services from the San Francisco Behavioral Health Plan, San Francisco’s the public mental health system. However, the San Francisco Behavioral Health Plan, currently served more than 25,000 individuals in Fiscal Year 2011-12, as shown in Exhibit 58 below, through a network of programs, clinics, psychiatrists, psychologists, and therapists. This is significantly more than the state’s prevalence estimates indicated.
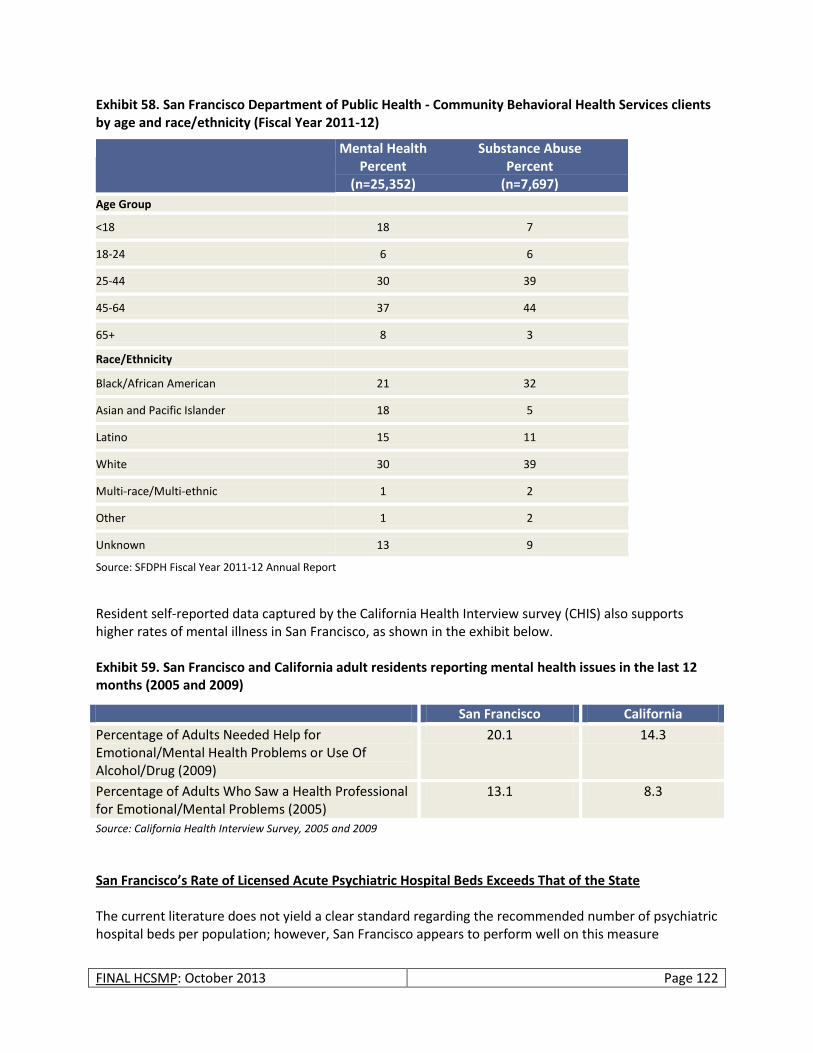
FINAL HCSMP: October 2013 Page 122
Exhibit 58. San Francisco Department of Public Health - Community Behavioral Health Services clients by age and race/ethnicity (Fiscal Year 2011-12)
Mental Health Percent
(n=25,352)
Substance Abuse Percent
(n=7,697)
Age Group
<18 18 7
18-24 6 6
25-44 30 39
45-64 37 44
65+ 8 3
Race/Ethnicity
Black/African American 21 32
Asian and Pacific Islander 18 5
Latino 15 11
White 30 39
Multi-race/Multi-ethnic 1 2
Other 1 2
Unknown 13 9
Source: SFDPH Fiscal Year 2011-12 Annual Report
Resident self-reported data captured by the California Health Interview survey (CHIS) also supports higher rates of mental illness in San Francisco, as shown in the exhibit below. Exhibit 59. San Francisco and California adult residents reporting mental health issues in the last 12 months (2005 and 2009)
San Francisco California
Percentage of Adults Needed Help for Emotional/Mental Health Problems or Use Of Alcohol/Drug (2009)
20.1 14.3
Percentage of Adults Who Saw a Health Professional for Emotional/Mental Problems (2005)
13.1 8.3
Source: California Health Interview Survey, 2005 and 2009
San Francisco’s Rate of Licensed Acute Psychiatric Hospital Beds Exceeds That of the State The current literature does not yield a clear standard regarding the recommended number of psychiatric hospital beds per population; however, San Francisco appears to perform well on this measure
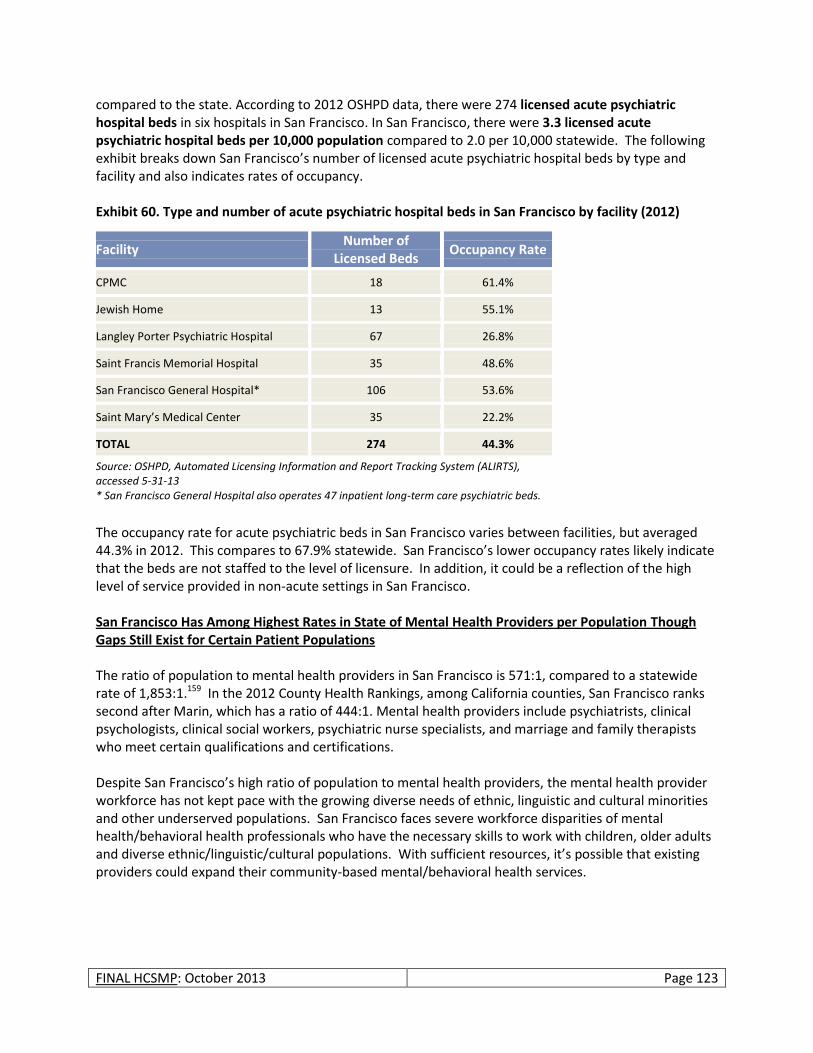
FINAL HCSMP: October 2013 Page 123
compared to the state. According to 2012 OSHPD data, there were 274 licensed acute psychiatric hospital beds in six hospitals in San Francisco. In San Francisco, there were 3.3 licensed acute psychiatric hospital beds per 10,000 population compared to 2.0 per 10,000 statewide. The following exhibit breaks down San Francisco’s number of licensed acute psychiatric hospital beds by type and facility and also indicates rates of occupancy. Exhibit 60. Type and number of acute psychiatric hospital beds in San Francisco by facility (2012)
Facility Number of
Licensed Beds Occupancy Rate
CPMC 18 61.4%
Jewish Home 13 55.1%
Langley Porter Psychiatric Hospital 67 26.8%
Saint Francis Memorial Hospital 35 48.6%
San Francisco General Hospital* 106 53.6%
Saint Mary’s Medical Center 35 22.2%
TOTAL 274 44.3%
Source: OSHPD, Automated Licensing Information and Report Tracking System (ALIRTS), accessed 5-31-13 * San Francisco General Hospital also operates 47 inpatient long-term care psychiatric beds.
The occupancy rate for acute psychiatric beds in San Francisco varies between facilities, but averaged 44.3% in 2012. This compares to 67.9% statewide. San Francisco’s lower occupancy rates likely indicate that the beds are not staffed to the level of licensure. In addition, it could be a reflection of the high level of service provided in non-acute settings in San Francisco. San Francisco Has Among Highest Rates in State of Mental Health Providers per Population Though Gaps Still Exist for Certain Patient Populations The ratio of population to mental health providers in San Francisco is 571:1, compared to a statewide rate of 1,853:1.159 In the 2012 County Health Rankings, among California counties, San Francisco ranks second after Marin, which has a ratio of 444:1. Mental health providers include psychiatrists, clinical psychologists, clinical social workers, psychiatric nurse specialists, and marriage and family therapists who meet certain qualifications and certifications. Despite San Francisco’s high ratio of population to mental health providers, the mental health provider workforce has not kept pace with the growing diverse needs of ethnic, linguistic and cultural minorities and other underserved populations. San Francisco faces severe workforce disparities of mental health/behavioral health professionals who have the necessary skills to work with children, older adults and diverse ethnic/linguistic/cultural populations. With sufficient resources, it’s possible that existing providers could expand their community-based mental/behavioral health services.
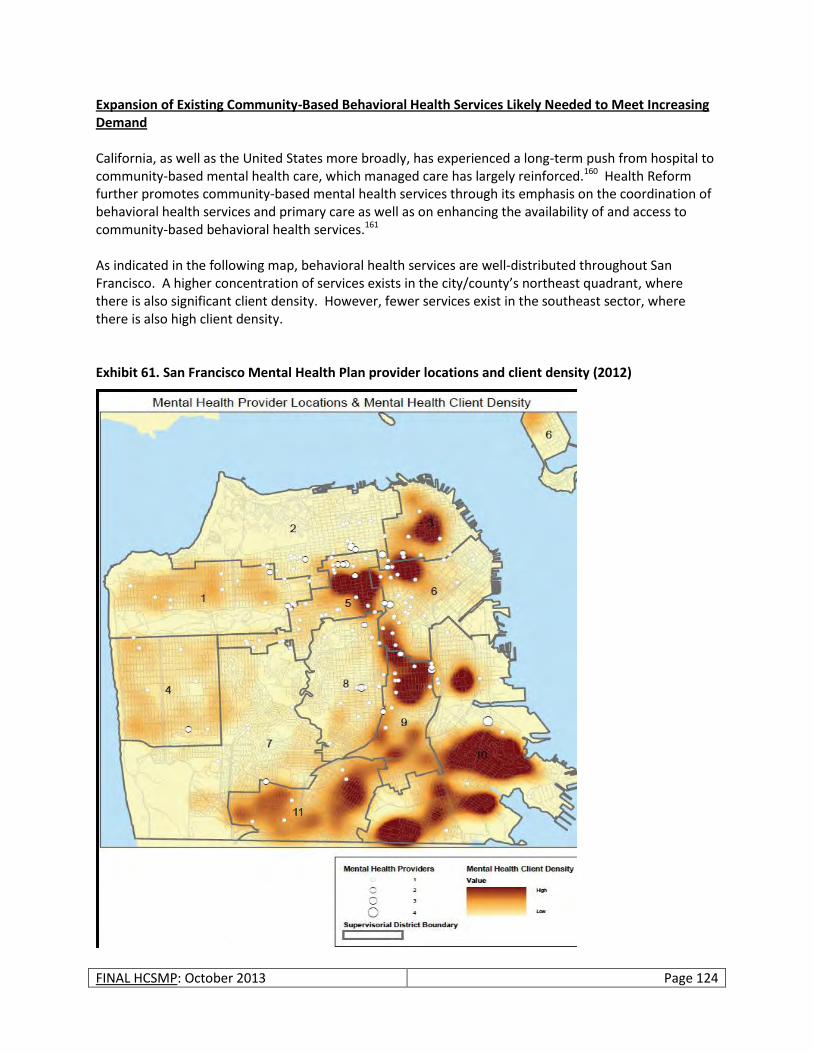
FINAL HCSMP: October 2013 Page 124
Expansion of Existing Community-Based Behavioral Health Services Likely Needed to Meet Increasing Demand California, as well as the United States more broadly, has experienced a long-term push from hospital to community-based mental health care, which managed care has largely reinforced.160 Health Reform further promotes community-based mental health services through its emphasis on the coordination of behavioral health services and primary care as well as on enhancing the availability of and access to community-based behavioral health services.161 As indicated in the following map, behavioral health services are well-distributed throughout San Francisco. A higher concentration of services exists in the city/county’s northeast quadrant, where there is also significant client density. However, fewer services exist in the southeast sector, where there is also high client density. Exhibit 61. San Francisco Mental Health Plan provider locations and client density (2012)
FINAL HCSMP: October 2013 Page 125
While San Francisco’s current behavioral health facilities are well located, existing service and, potentially, physical facility expansion may be required to accommodate increasing demand for behavioral health services in San Francisco. Behavioral health service utilization has increased in recent years, a trend that is expected to continue with the full implementation of Health Reform in 2014. Estimates suggest, for example, that 11 percent of California’s new Medi-Cal eligibles will need behavioral health services – substance use services specifically.162 Statewide projections assume that this need is largely unmet by the current system; however, San Francisco may fare better than other counties because of the Healthy San Francisco program. Absent facility expansion, greater collaboration between the behavioral health and primary care communities could serve to relieve some strain from the current safety net behavioral health system.163 Should primary care increasingly assume from behavioral health medication management oversight for stabilized mental health clients, for example, the behavioral health system could more easily accommodate new patients; however, additional trainings – and, potentially, a need for increased primary care capacity – would likely be needed to support this shift in care. Additional Substance Use Programs for Youth and Greater Access to Psychiatric Care Identified as Needs of Existing Behavioral Health System SFDPH – Community Behavioral Health Services has focused increasingly on the integration of mental health and substance abuse services to better meet the behavioral health needs of San Francisco’s low-income residents. Through its Mental Health Services Act program for seriously mentally ill residents who have been un-/underserved by the existing system, CBHS has also recognized prevention and early intervention efforts as a critical underpinning of a comprehensive behavioral health care system that is recovery-oriented and culturally-competent.164 Despite these strides, CBHS has noted additional gaps within San Francisco’s behavioral health system:165
San Francisco needs more substance use programs for children and youth as well as increased related trainings for existing providers.
The San Francisco safety net lacks a sufficient number of psychiatrists serving low-income patients, as evidenced in long waits to get an appointment.
Health Professional Shortage Areas and Medically Underserved Areas Five San Francisco Federally Qualified Health Center Systems Meet Health Professional Shortage Area Designation Health professional shortage areas (HPSA) are designated by the US Health Resources and Services Administration (HRSA) as having shortages of primary medical care, dental or mental health providers and may be geographic (a county or service area), demographic (low-income population) or institutional (comprehensive health center, federally qualified health center or other public facility). The following San Francisco facilities or facility organizations have been designated as HPSAs:
South of Market Health Center
Mission Neighborhood Health Center
Northeast Medical Services
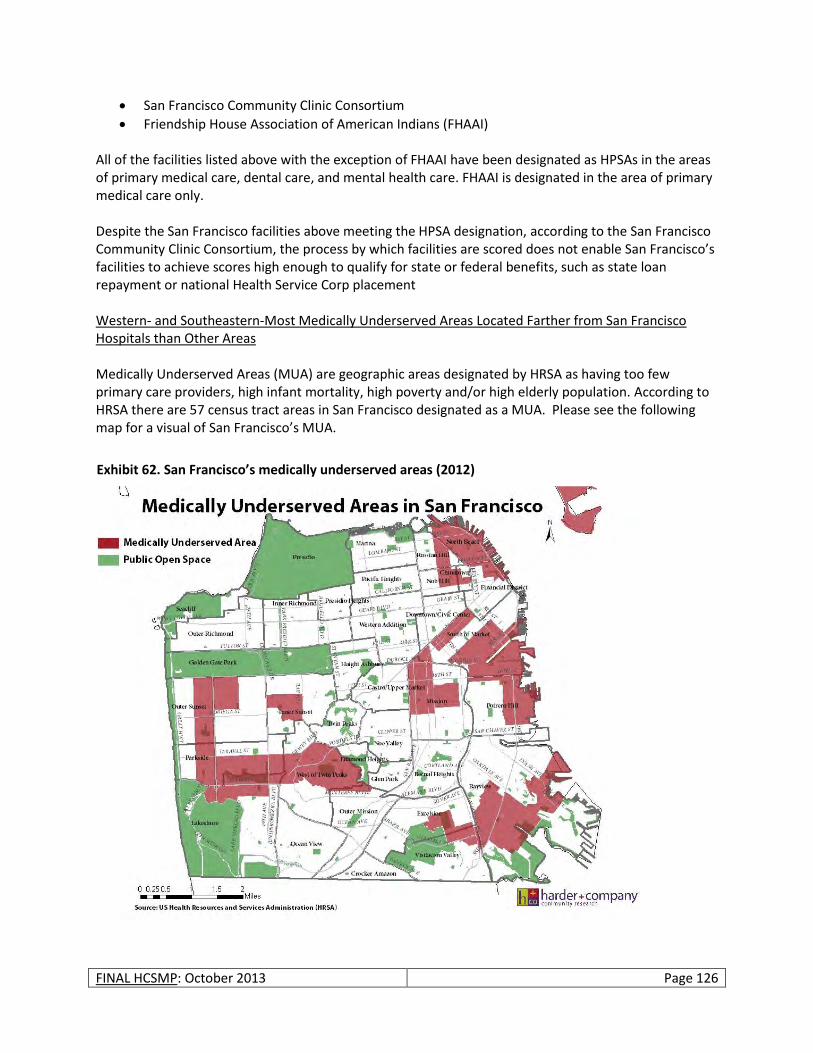
FINAL HCSMP: October 2013 Page 126
San Francisco Community Clinic Consortium
Friendship House Association of American Indians (FHAAI) All of the facilities listed above with the exception of FHAAI have been designated as HPSAs in the areas of primary medical care, dental care, and mental health care. FHAAI is designated in the area of primary medical care only. Despite the San Francisco facilities above meeting the HPSA designation, according to the San Francisco Community Clinic Consortium, the process by which facilities are scored does not enable San Francisco’s facilities to achieve scores high enough to qualify for state or federal benefits, such as state loan repayment or national Health Service Corp placement Western- and Southeastern-Most Medically Underserved Areas Located Farther from San Francisco Hospitals than Other Areas Medically Underserved Areas (MUA) are geographic areas designated by HRSA as having too few primary care providers, high infant mortality, high poverty and/or high elderly population. According to HRSA there are 57 census tract areas in San Francisco designated as a MUA. Please see the following map for a visual of San Francisco’s MUA.
Exhibit 62. San Francisco’s medically underserved areas (2012)

FINAL HCSMP: October 2013 Page 127
Future Need + Capacity
Population Projections San Francisco’s population is growing. The 2010 Census has established San Francisco’s current population at 805,235.166 State estimates suggest that San Francisco’s population will increase to 844,466 by 2020 and 854,675 by 2030167 – representing 4.9 percent growth over the next ten years and 6.1 percent growth over the next 20 years. Other estimates suggest that San Francisco’s population could increase to 964,000168 by 2040, representing 19.7 percent growth over the 30-year period. San Francisco Projected to Become Home to Greater White and Pacific Islander Populations, Size of Other Subpopulations Decreasing When looking at population projections by race and ethnicity, estimates suggest that there will be increases in the White and Pacific Islander populations and decreases among the Hispanic, Asian, Black/African American, and Native American populations by 2030. Exhibit 63. San Francisco population projections by race/ethnicity (2010)
Percent of Total San Francisco Population
Current 2020 Estimate 2030 Estimate Trend
White 42 47 47
Hispanic 15 13 12
Asian 33 31 30
Pacific Islander 0 1 1
Black/African American 6 6 5
Native American 1 0 0
Multi-race 3 3 3
Total Population 805,235 844,466 854,675
Source: Current values from 2010 US Census; projections from California State Department of Finance, 2007
San Francisco’s Senior Population Projected to Rise, Posing Questions for System Capacity When examining population projections by age, estimates suggest that the population over age 75 will increase from seven to 11 percent by 2030. As indicated earlier, this growing population represents the heaviest users of San Francisco’s long-term care services, of which San Francisco lacks sufficient supply. Projections also suggest that, as of 2030, 55 percent of the population will be over the age of 45, and the population between the ages of 25 to 44 will drop from 37 percent to 26 percent.
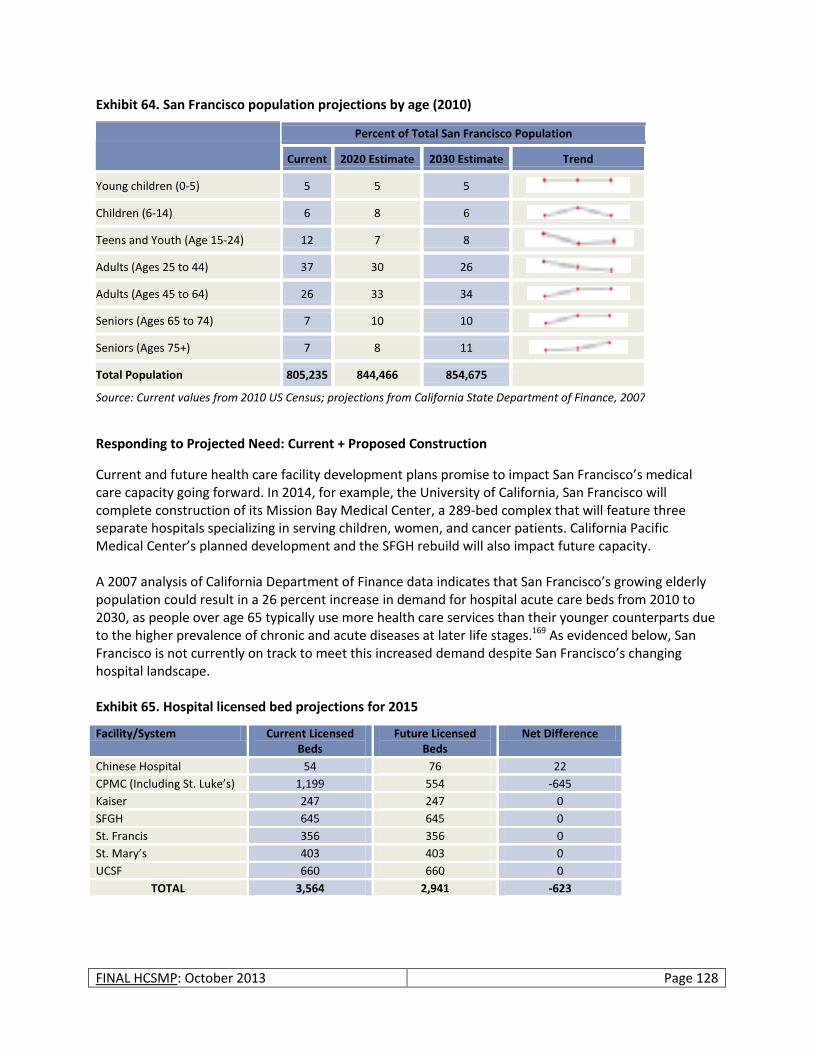
FINAL HCSMP: October 2013 Page 128
Exhibit 64. San Francisco population projections by age (2010)
Percent of Total San Francisco Population
Current 2020 Estimate 2030 Estimate Trend
Young children (0-5) 5 5 5
Children (6-14) 6 8 6
Teens and Youth (Age 15-24) 12 7 8
Adults (Ages 25 to 44) 37 30 26
Adults (Ages 45 to 64) 26 33 34
Seniors (Ages 65 to 74) 7 10 10
Seniors (Ages 75+) 7 8 11
Total Population 805,235 844,466 854,675
Source: Current values from 2010 US Census; projections from California State Department of Finance, 2007
Responding to Projected Need: Current + Proposed Construction
Current and future health care facility development plans promise to impact San Francisco’s medical care capacity going forward. In 2014, for example, the University of California, San Francisco will complete construction of its Mission Bay Medical Center, a 289-bed complex that will feature three separate hospitals specializing in serving children, women, and cancer patients. California Pacific Medical Center’s planned development and the SFGH rebuild will also impact future capacity. A 2007 analysis of California Department of Finance data indicates that San Francisco’s growing elderly population could result in a 26 percent increase in demand for hospital acute care beds from 2010 to 2030, as people over age 65 typically use more health care services than their younger counterparts due to the higher prevalence of chronic and acute diseases at later life stages.169 As evidenced below, San Francisco is not currently on track to meet this increased demand despite San Francisco’s changing hospital landscape. Exhibit 65. Hospital licensed bed projections for 2015
Facility/System Current Licensed Beds
Future Licensed Beds
Net Difference
Chinese Hospital 54 76 22
CPMC (Including St. Luke’s) 1,199 554 -645
Kaiser 247 247 0
SFGH 645 645 0
St. Francis 356 356 0
St. Mary’s 403 403 0
UCSF 660 660 0
TOTAL 3,564 2,941 -623
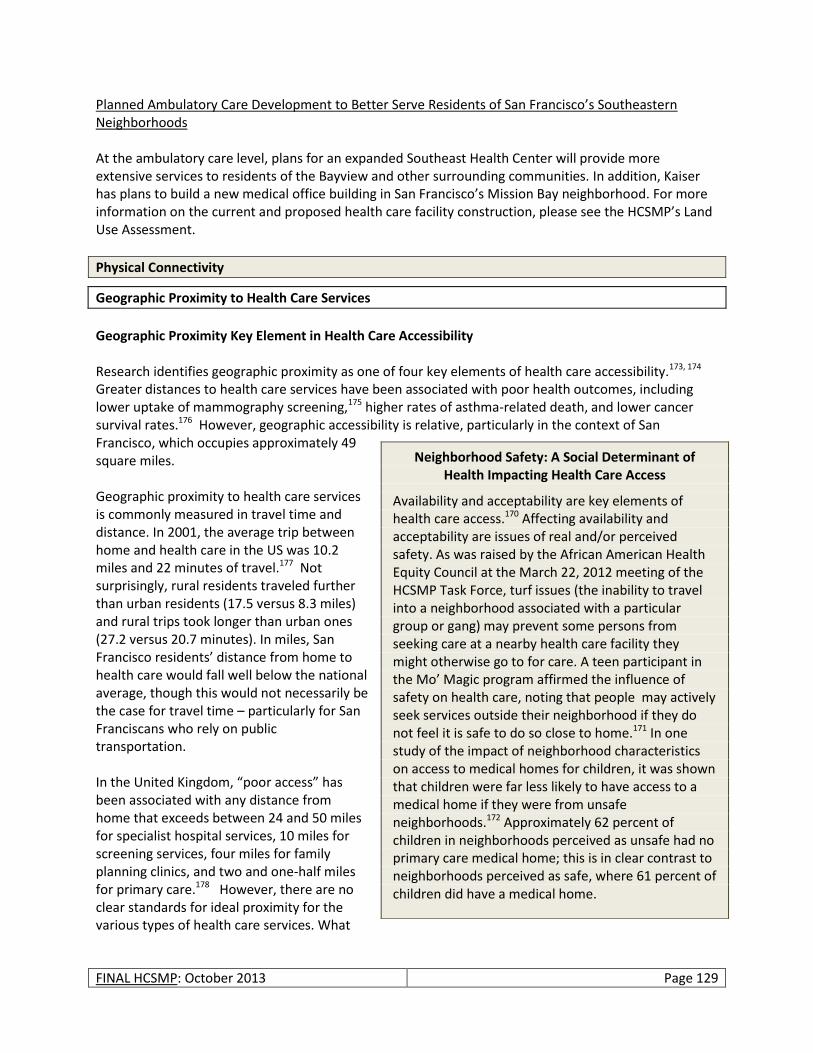
FINAL HCSMP: October 2013 Page 129
Planned Ambulatory Care Development to Better Serve Residents of San Francisco’s Southeastern Neighborhoods At the ambulatory care level, plans for an expanded Southeast Health Center will provide more extensive services to residents of the Bayview and other surrounding communities. In addition, Kaiser has plans to build a new medical office building in San Francisco’s Mission Bay neighborhood. For more information on the current and proposed health care facility construction, please see the HCSMP’s Land Use Assessment.
Physical Connectivity
Geographic Proximity to Health Care Services
Geographic Proximity Key Element in Health Care Accessibility Research identifies geographic proximity as one of four key elements of health care accessibility.173, 174 Greater distances to health care services have been associated with poor health outcomes, including lower uptake of mammography screening,175 higher rates of asthma-related death, and lower cancer survival rates.176 However, geographic accessibility is relative, particularly in the context of San Francisco, which occupies approximately 49 square miles. Geographic proximity to health care services is commonly measured in travel time and distance. In 2001, the average trip between home and health care in the US was 10.2 miles and 22 minutes of travel.177 Not surprisingly, rural residents traveled further than urban residents (17.5 versus 8.3 miles) and rural trips took longer than urban ones (27.2 versus 20.7 minutes). In miles, San Francisco residents’ distance from home to health care would fall well below the national average, though this would not necessarily be the case for travel time – particularly for San Franciscans who rely on public transportation. In the United Kingdom, “poor access” has been associated with any distance from home that exceeds between 24 and 50 miles for specialist hospital services, 10 miles for screening services, four miles for family planning clinics, and two and one-half miles for primary care.178 However, there are no clear standards for ideal proximity for the various types of health care services. What
Neighborhood Safety: A Social Determinant of Health Impacting Health Care Access
Availability and acceptability are key elements of health care access.170 Affecting availability and acceptability are issues of real and/or perceived safety. As was raised by the African American Health Equity Council at the March 22, 2012 meeting of the HCSMP Task Force, turf issues (the inability to travel into a neighborhood associated with a particular group or gang) may prevent some persons from seeking care at a nearby health care facility they might otherwise go to for care. A teen participant in the Mo’ Magic program affirmed the influence of safety on health care, noting that people may actively seek services outside their neighborhood if they do not feel it is safe to do so close to home.171 In one study of the impact of neighborhood characteristics on access to medical homes for children, it was shown that children were far less likely to have access to a medical home if they were from unsafe neighborhoods.172 Approximately 62 percent of children in neighborhoods perceived as unsafe had no primary care medical home; this is in clear contrast to neighborhoods perceived as safe, where 61 percent of children did have a medical home.
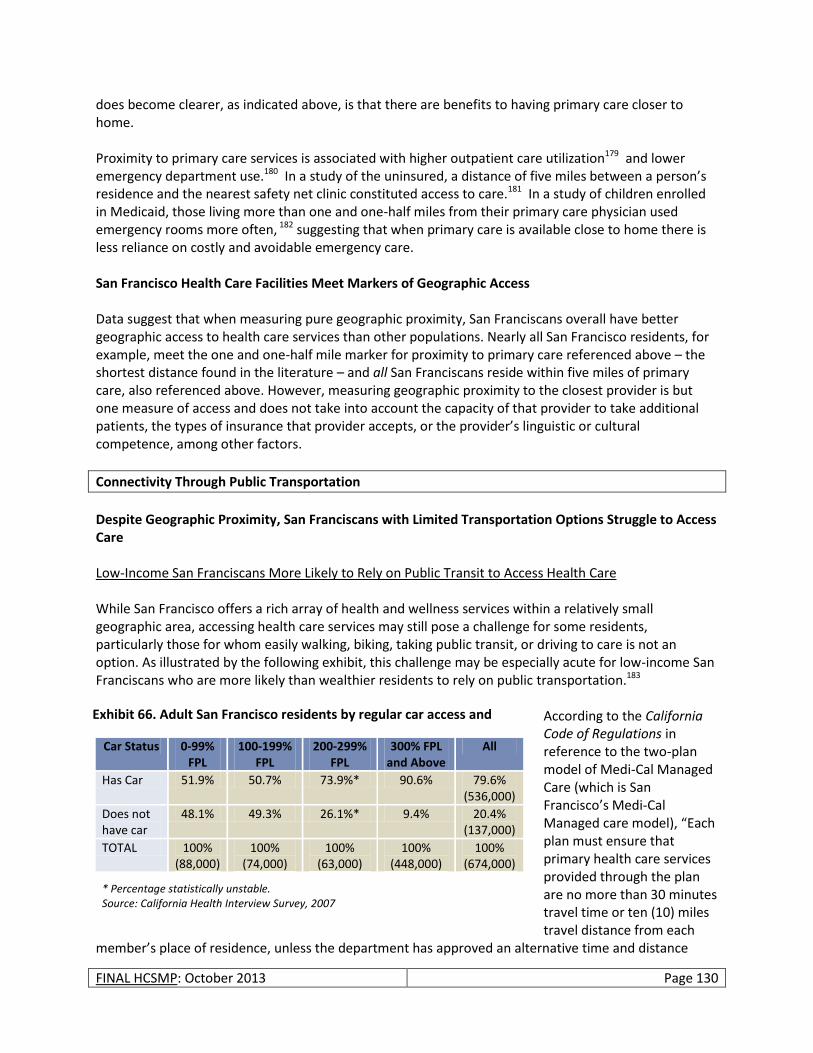
FINAL HCSMP: October 2013 Page 130
does become clearer, as indicated above, is that there are benefits to having primary care closer to home. Proximity to primary care services is associated with higher outpatient care utilization179 and lower emergency department use.180 In a study of the uninsured, a distance of five miles between a person’s residence and the nearest safety net clinic constituted access to care.181 In a study of children enrolled in Medicaid, those living more than one and one-half miles from their primary care physician used emergency rooms more often, 182 suggesting that when primary care is available close to home there is less reliance on costly and avoidable emergency care. San Francisco Health Care Facilities Meet Markers of Geographic Access Data suggest that when measuring pure geographic proximity, San Franciscans overall have better geographic access to health care services than other populations. Nearly all San Francisco residents, for example, meet the one and one-half mile marker for proximity to primary care referenced above – the shortest distance found in the literature – and all San Franciscans reside within five miles of primary care, also referenced above. However, measuring geographic proximity to the closest provider is but one measure of access and does not take into account the capacity of that provider to take additional patients, the types of insurance that provider accepts, or the provider’s linguistic or cultural competence, among other factors.
Connectivity Through Public Transportation
Despite Geographic Proximity, San Franciscans with Limited Transportation Options Struggle to Access Care Low-Income San Franciscans More Likely to Rely on Public Transit to Access Health Care While San Francisco offers a rich array of health and wellness services within a relatively small geographic area, accessing health care services may still pose a challenge for some residents, particularly those for whom easily walking, biking, taking public transit, or driving to care is not an option. As illustrated by the following exhibit, this challenge may be especially acute for low-income San Franciscans who are more likely than wealthier residents to rely on public transportation.183
According to the California Code of Regulations in reference to the two-plan model of Medi-Cal Managed Care (which is San Francisco’s Medi-Cal Managed care model), “Each plan must ensure that primary health care services provided through the plan are no more than 30 minutes travel time or ten (10) miles travel distance from each
member’s place of residence, unless the department has approved an alternative time and distance
Car Status 0-99% FPL
100-199% FPL
200-299% FPL
300% FPL and Above
All
Has Car 51.9% 50.7% 73.9%* 90.6% 79.6% (536,000)
Does not have car
48.1% 49.3% 26.1%* 9.4% 20.4% (137,000)
TOTAL 100% (88,000)
100% (74,000)
100% (63,000)
100% (448,000)
100% (674,000)
* Percentage statistically unstable. Source: California Health Interview Survey, 2007
Exhibit 66. Adult San Francisco residents by regular car access and
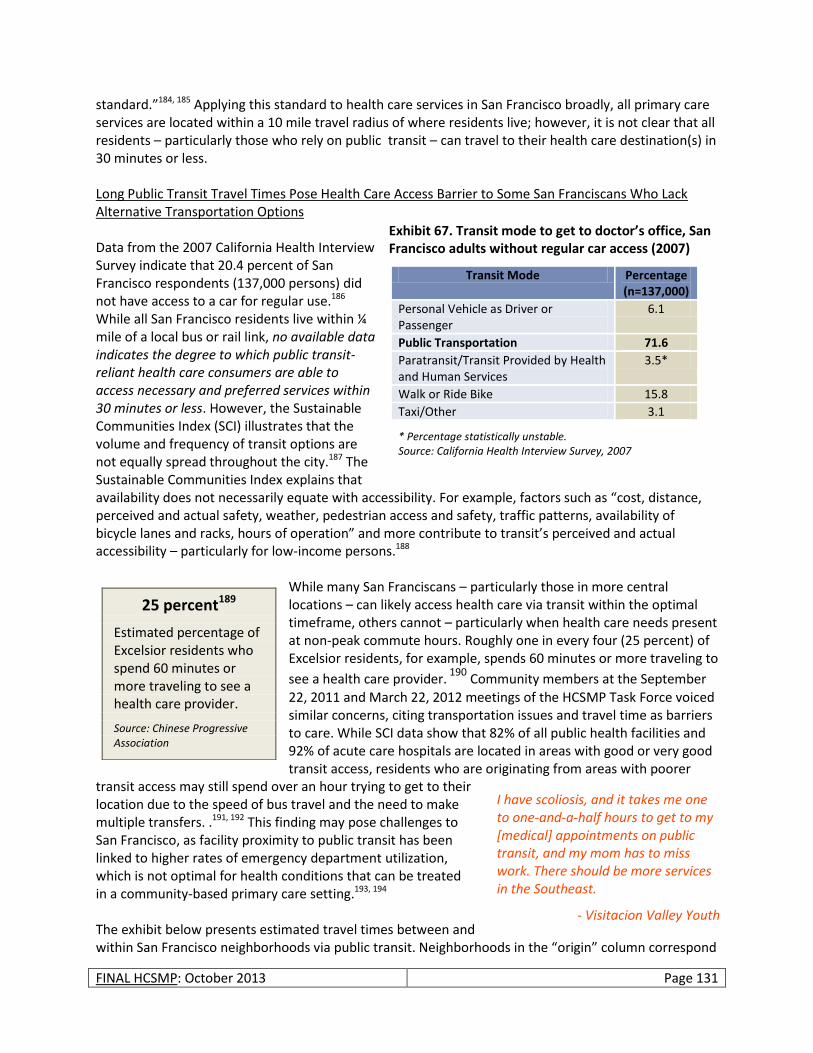
FINAL HCSMP: October 2013 Page 131
standard.”184, 185 Applying this standard to health care services in San Francisco broadly, all primary care services are located within a 10 mile travel radius of where residents live; however, it is not clear that all residents – particularly those who rely on public transit – can travel to their health care destination(s) in 30 minutes or less. Long Public Transit Travel Times Pose Health Care Access Barrier to Some San Franciscans Who Lack Alternative Transportation Options Data from the 2007 California Health Interview Survey indicate that 20.4 percent of San Francisco respondents (137,000 persons) did not have access to a car for regular use.186 While all San Francisco residents live within ¼ mile of a local bus or rail link, no available data indicates the degree to which public transit-reliant health care consumers are able to access necessary and preferred services within 30 minutes or less. However, the Sustainable Communities Index (SCI) illustrates that the volume and frequency of transit options are not equally spread throughout the city.187 The Sustainable Communities Index explains that availability does not necessarily equate with accessibility. For example, factors such as “cost, distance, perceived and actual safety, weather, pedestrian access and safety, traffic patterns, availability of bicycle lanes and racks, hours of operation” and more contribute to transit’s perceived and actual accessibility – particularly for low-income persons.188
While many San Franciscans – particularly those in more central locations – can likely access health care via transit within the optimal timeframe, others cannot – particularly when health care needs present at non-peak commute hours. Roughly one in every four (25 percent) of Excelsior residents, for example, spends 60 minutes or more traveling to
see a health care provider. 190
Community members at the September 22, 2011 and March 22, 2012 meetings of the HCSMP Task Force voiced similar concerns, citing transportation issues and travel time as barriers to care. While SCI data show that 82% of all public health facilities and 92% of acute care hospitals are located in areas with good or very good transit access, residents who are originating from areas with poorer
transit access may still spend over an hour trying to get to their location due to the speed of bus travel and the need to make multiple transfers. .191, 192 This finding may pose challenges to San Francisco, as facility proximity to public transit has been linked to higher rates of emergency department utilization, which is not optimal for health conditions that can be treated in a community-based primary care setting.193, 194 The exhibit below presents estimated travel times between and within San Francisco neighborhoods via public transit. Neighborhoods in the “origin” column correspond
25 percent189
Estimated percentage of Excelsior residents who spend 60 minutes or more traveling to see a health care provider.
Source: Chinese Progressive Association
Transit Mode Percentage (n=137,000)
Personal Vehicle as Driver or Passenger
6.1
Public Transportation 71.6
Paratransit/Transit Provided by Health and Human Services
3.5*
Walk or Ride Bike 15.8
Taxi/Other 3.1
* Percentage statistically unstable. Source: California Health Interview Survey, 2007
I have scoliosis, and it takes me one to one-and-a-half hours to get to my [medical] appointments on public transit, and my mom has to miss work. There should be more services in the Southeast.
- Visitacion Valley Youth
Exhibit 67. Transit mode to get to doctor’s office, San Francisco adults without regular car access (2007)
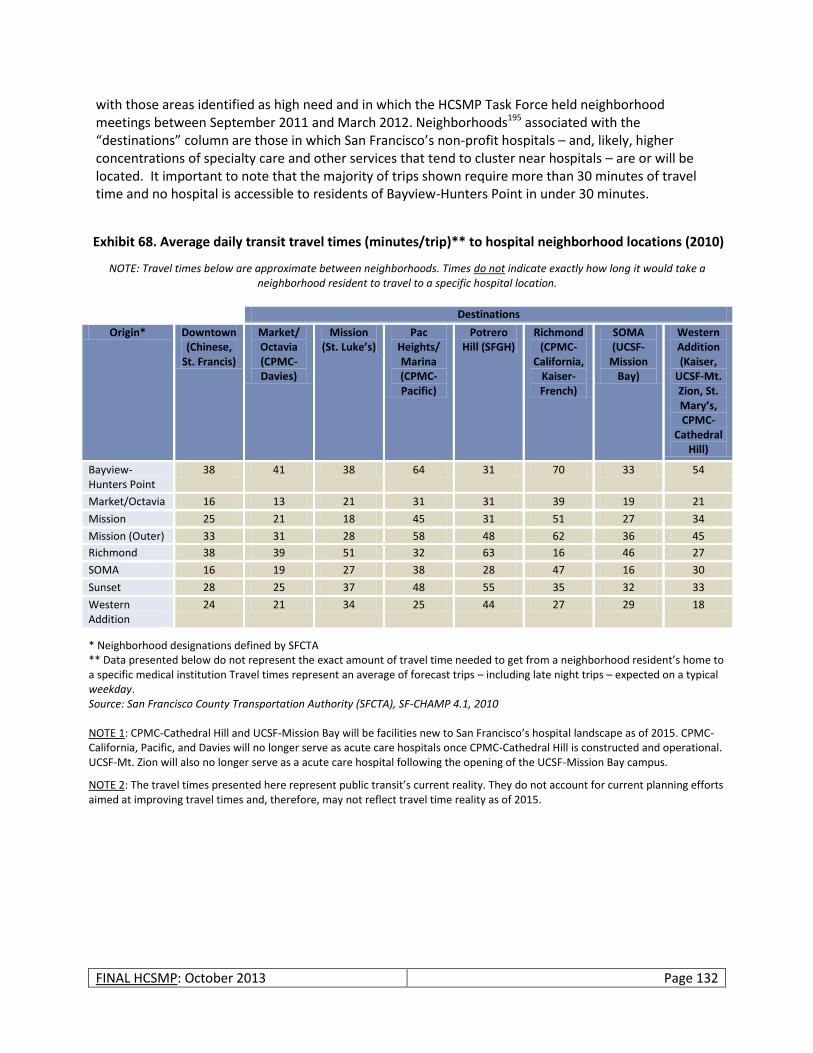
FINAL HCSMP: October 2013 Page 132
with those areas identified as high need and in which the HCSMP Task Force held neighborhood meetings between September 2011 and March 2012. Neighborhoods195 associated with the “destinations” column are those in which San Francisco’s non-profit hospitals – and, likely, higher concentrations of specialty care and other services that tend to cluster near hospitals – are or will be located. It important to note that the majority of trips shown require more than 30 minutes of travel time and no hospital is accessible to residents of Bayview-Hunters Point in under 30 minutes.
NOTE: Travel times below are approximate between neighborhoods. Times do not indicate exactly how long it would take a neighborhood resident to travel to a specific hospital location.
Destinations
Origin* Downtown (Chinese,
St. Francis)
Market/ Octavia (CPMC-Davies)
Mission (St. Luke’s)
Pac Heights/ Marina (CPMC-Pacific)
Potrero Hill (SFGH)
Richmond (CPMC-
California, Kaiser-French)
SOMA (UCSF-
Mission Bay)
Western Addition (Kaiser,
UCSF-Mt. Zion, St. Mary’s, CPMC-
Cathedral Hill)
Bayview-Hunters Point
38 41 38 64 31 70 33 54
Market/Octavia 16 13 21 31 31 39 19 21
Mission 25 21 18 45 31 51 27 34
Mission (Outer) 33 31 28 58 48 62 36 45
Richmond 38 39 51 32 63 16 46 27
SOMA 16 19 27 38 28 47 16 30
Sunset 28 25 37 48 55 35 32 33
Western Addition
24 21 34 25 44 27 29 18
* Neighborhood designations defined by SFCTA ** Data presented below do not represent the exact amount of travel time needed to get from a neighborhood resident’s home to a specific medical institution Travel times represent an average of forecast trips – including late night trips – expected on a typical weekday. Source: San Francisco County Transportation Authority (SFCTA), SF-CHAMP 4.1, 2010 NOTE 1: CPMC-Cathedral Hill and UCSF-Mission Bay will be facilities new to San Francisco’s hospital landscape as of 2015. CPMC-California, Pacific, and Davies will no longer serve as acute care hospitals once CPMC-Cathedral Hill is constructed and operational. UCSF-Mt. Zion will also no longer serve as a acute care hospital following the opening of the UCSF-Mission Bay campus.
NOTE 2: The travel times presented here represent public transit’s current reality. They do not account for current planning efforts aimed at improving travel times and, therefore, may not reflect travel time reality as of 2015.
Exhibit 68. Average daily transit travel times (minutes/trip)** to hospital neighborhood locations (2010)
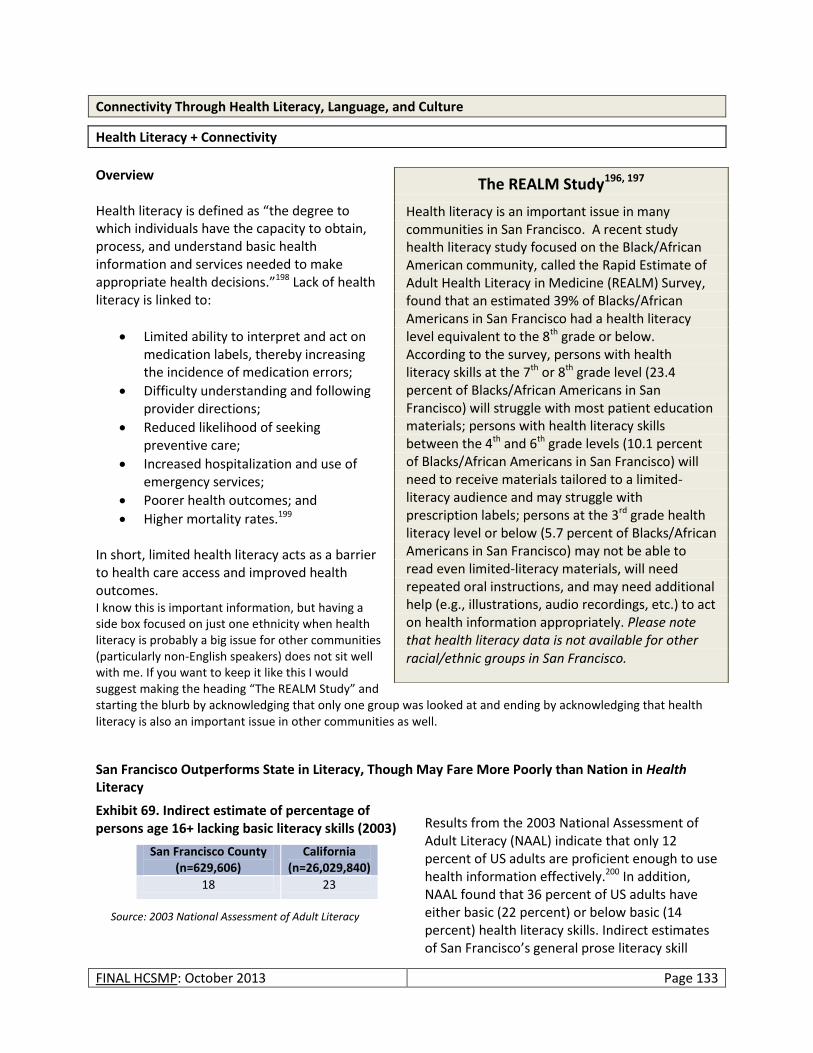
FINAL HCSMP: October 2013 Page 133
Connectivity Through Health Literacy, Language, and Culture
Health Literacy + Connectivity
Overview Health literacy is defined as “the degree to which individuals have the capacity to obtain, process, and understand basic health information and services needed to make appropriate health decisions.”198 Lack of health literacy is linked to:
Limited ability to interpret and act on medication labels, thereby increasing the incidence of medication errors;
Difficulty understanding and following provider directions;
Reduced likelihood of seeking preventive care;
Increased hospitalization and use of emergency services;
Poorer health outcomes; and
Higher mortality rates.199 In short, limited health literacy acts as a barrier to health care access and improved health outcomes. I know this is important information, but having a side box focused on just one ethnicity when health literacy is probably a big issue for other communities (particularly non-English speakers) does not sit well with me. If you want to keep it like this I would suggest making the heading “The REALM Study” and starting the blurb by acknowledging that only one group was looked at and ending by acknowledging that health literacy is also an important issue in other communities as well.
San Francisco Outperforms State in Literacy, Though May Fare More Poorly than Nation in Health Literacy
Results from the 2003 National Assessment of Adult Literacy (NAAL) indicate that only 12 percent of US adults are proficient enough to use health information effectively.200 In addition, NAAL found that 36 percent of US adults have either basic (22 percent) or below basic (14 percent) health literacy skills. Indirect estimates of San Francisco’s general prose literacy skill
The REALM Study196, 197
Health literacy is an important issue in many communities in San Francisco. A recent study health literacy study focused on the Black/African American community, called the Rapid Estimate of Adult Health Literacy in Medicine (REALM) Survey, found that an estimated 39% of Blacks/African Americans in San Francisco had a health literacy level equivalent to the 8th grade or below. According to the survey, persons with health literacy skills at the 7th or 8th grade level (23.4 percent of Blacks/African Americans in San Francisco) will struggle with most patient education materials; persons with health literacy skills between the 4th and 6th grade levels (10.1 percent of Blacks/African Americans in San Francisco) will need to receive materials tailored to a limited-literacy audience and may struggle with prescription labels; persons at the 3rd grade health literacy level or below (5.7 percent of Blacks/African Americans in San Francisco) may not be able to read even limited-literacy materials, will need repeated oral instructions, and may need additional help (e.g., illustrations, audio recordings, etc.) to act on health information appropriately. Please note that health literacy data is not available for other racial/ethnic groups in San Francisco.
San Francisco County (n=629,606)
California (n=26,029,840)
18 23
Source: 2003 National Assessment of Adult Literacy
Exhibit 69. Indirect estimate of percentage of persons age 16+ lacking basic literacy skills (2003)
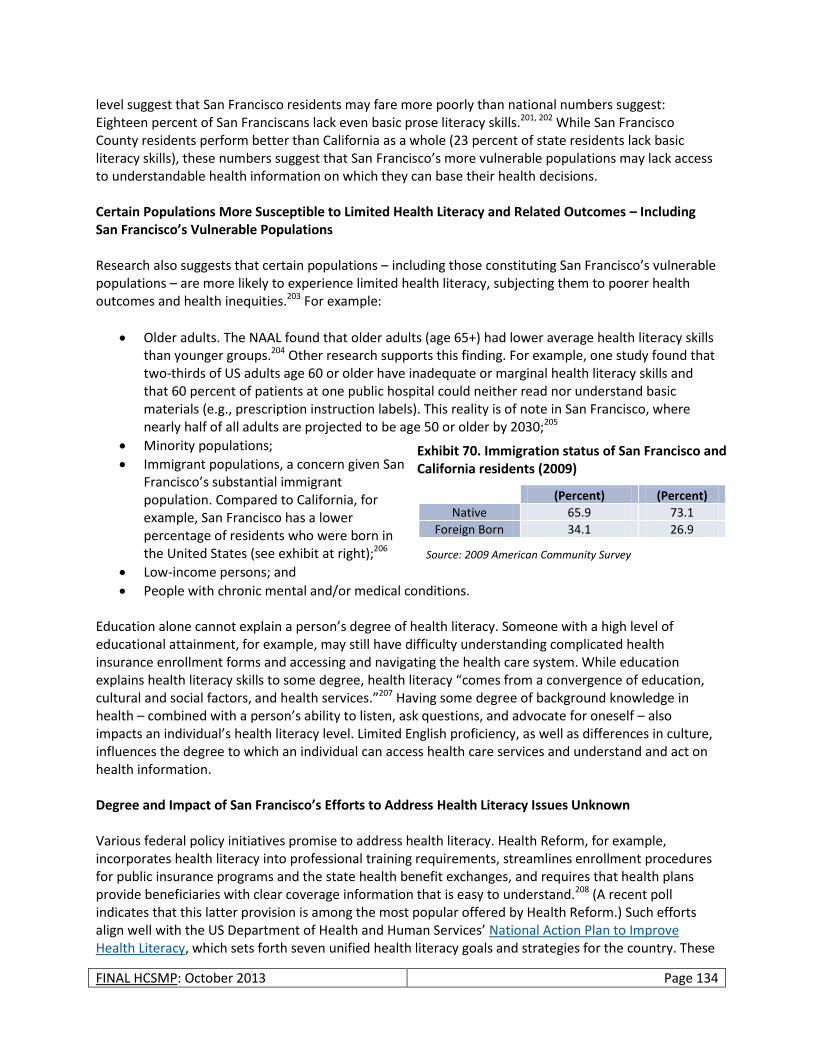
FINAL HCSMP: October 2013 Page 134
level suggest that San Francisco residents may fare more poorly than national numbers suggest: Eighteen percent of San Franciscans lack even basic prose literacy skills.201, 202 While San Francisco County residents perform better than California as a whole (23 percent of state residents lack basic literacy skills), these numbers suggest that San Francisco’s more vulnerable populations may lack access to understandable health information on which they can base their health decisions. Certain Populations More Susceptible to Limited Health Literacy and Related Outcomes – Including San Francisco’s Vulnerable Populations Research also suggests that certain populations – including those constituting San Francisco’s vulnerable populations – are more likely to experience limited health literacy, subjecting them to poorer health outcomes and health inequities.203 For example:
Older adults. The NAAL found that older adults (age 65+) had lower average health literacy skills than younger groups.204 Other research supports this finding. For example, one study found that two-thirds of US adults age 60 or older have inadequate or marginal health literacy skills and that 60 percent of patients at one public hospital could neither read nor understand basic materials (e.g., prescription instruction labels). This reality is of note in San Francisco, where nearly half of all adults are projected to be age 50 or older by 2030;205
Minority populations;
Immigrant populations, a concern given San Francisco’s substantial immigrant population. Compared to California, for example, San Francisco has a lower percentage of residents who were born in the United States (see exhibit at right);206
Low-income persons; and
People with chronic mental and/or medical conditions.
Education alone cannot explain a person’s degree of health literacy. Someone with a high level of educational attainment, for example, may still have difficulty understanding complicated health insurance enrollment forms and accessing and navigating the health care system. While education explains health literacy skills to some degree, health literacy “comes from a convergence of education, cultural and social factors, and health services.”207 Having some degree of background knowledge in health – combined with a person’s ability to listen, ask questions, and advocate for oneself – also impacts an individual’s health literacy level. Limited English proficiency, as well as differences in culture, influences the degree to which an individual can access health care services and understand and act on health information. Degree and Impact of San Francisco’s Efforts to Address Health Literacy Issues Unknown Various federal policy initiatives promise to address health literacy. Health Reform, for example, incorporates health literacy into professional training requirements, streamlines enrollment procedures for public insurance programs and the state health benefit exchanges, and requires that health plans provide beneficiaries with clear coverage information that is easy to understand.208 (A recent poll indicates that this latter provision is among the most popular offered by Health Reform.) Such efforts align well with the US Department of Health and Human Services’ National Action Plan to Improve Health Literacy, which sets forth seven unified health literacy goals and strategies for the country. These
San Francisco (Percent)
California (Percent)
Native 65.9 73.1
Foreign Born 34.1 26.9
Source: 2009 American Community Survey
Exhibit 70. Immigration status of San Francisco and California residents (2009)
FINAL HCSMP: October 2013 Page 135
efforts, combined with Health Information Technology and Clinical Health Act’s (HITECH) goal to provide meaningful and useful health information to patients, health literacy-related Healthy People 2020 objectives, and efforts at the hospital- and provider-level suggest that health literacy has come to the forefront of the health care community’s consciousness; however, to protect and promote the health of its most vulnerable populations, San Francisco must
be vigilant about providing health information – and health service access – to consumers in an appropriate and understandable way. The degree to which San Francisco providers assess patients for limited health literacy – and respond to identified health literacy issues – is unknown.
Linguistic Connectivity
Limited English Proficiency Limits Health Care Access A patient’s ability to communicate with a health care provider in a common language impacts his/her likelihood of accessing needed services and ability to act on health information successfully. According to the Institute of Medicine:
Language barriers may affect the delivery of adequate care through poor exchange of information, loss of important cultural information, misunderstanding of physician instruction, poor shared decision-making or ethical compromises (e.g., difficulty obtaining informed consent). Linguistic difficulties may also result in decreased adherence
with medication regimes, poor appointment attendance, and decreased satisfaction with services.209 Considered a risk factor for health disparities, limited English proficiency (LEP) – defined by the US Census as speaking English “less than very well” 210 – has also been associated with decreased satisfaction with services, increased incidence of misdiagnosis, longer
hospital stays, and poorer health outcomes.211 Research also suggests that language barriers may reduce LEP participation in Covered California, again limiting access to health care for which LEP individuals will be eligible.212 According to the UCLA Center for Health Policy Research and the California Pan-Ethnic Health Network, for example, an estimated 110,000 LEP Californians may fail to enroll in the CBHE if outreach efforts do not target this population effectively.
Health Literacy Resources
The Health Resources and Services Administration offers
numerous health literacy resources on its website.
Linguistic Competence
The capacity to communicate effectively and convey information in a manner that is easily understood by diverse audiences.
Source: National Center for Cultural Competence At the [clinic in Chinatown] it’s convenient
because a lot of people speak Chinese. At [SF hospital] you have to wait for the translator to explain something to you. My English level is okay for daily speaking. For medical questions I need a translator, but it takes a long time. Sometimes I don’t want to wait so I just guess what it’s about.
- Chinese Excelsior Resident
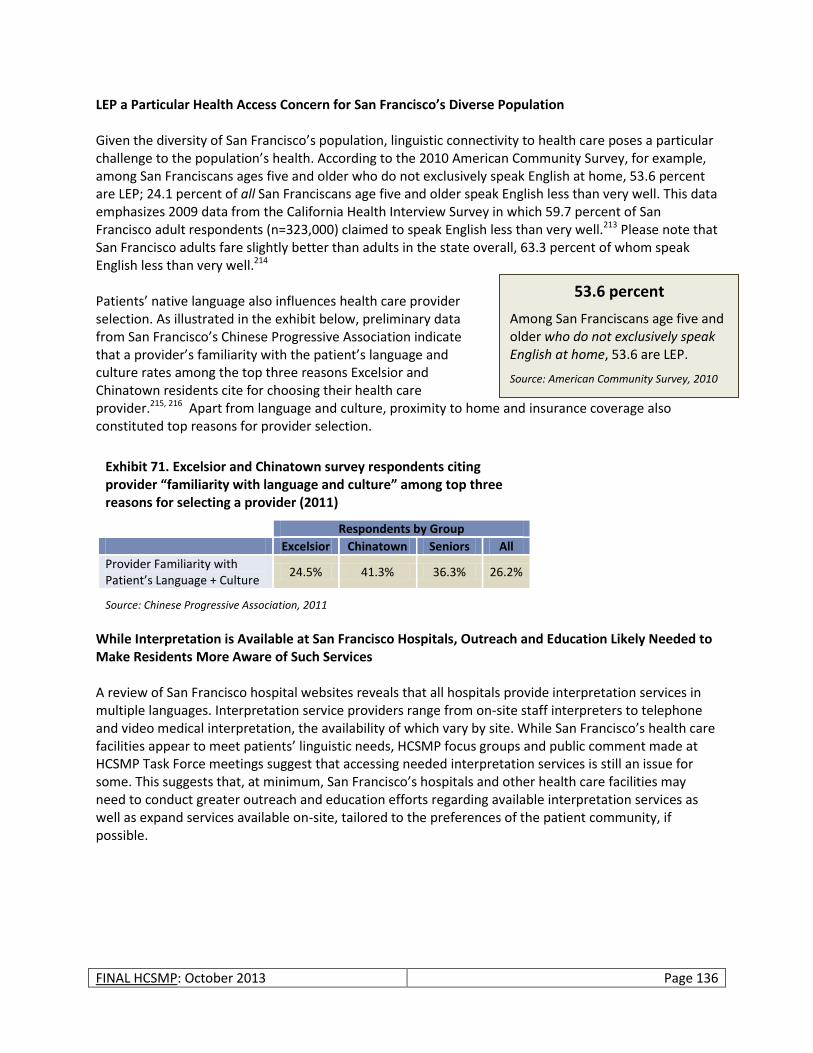
FINAL HCSMP: October 2013 Page 136
53.6 percent
Among San Franciscans age five and older who do not exclusively speak English at home, 53.6 are LEP.
Source: American Community Survey, 2010
LEP a Particular Health Access Concern for San Francisco’s Diverse Population Given the diversity of San Francisco’s population, linguistic connectivity to health care poses a particular challenge to the population’s health. According to the 2010 American Community Survey, for example, among San Franciscans ages five and older who do not exclusively speak English at home, 53.6 percent are LEP; 24.1 percent of all San Franciscans age five and older speak English less than very well. This data emphasizes 2009 data from the California Health Interview Survey in which 59.7 percent of San Francisco adult respondents (n=323,000) claimed to speak English less than very well.213 Please note that San Francisco adults fare slightly better than adults in the state overall, 63.3 percent of whom speak English less than very well.214 Patients’ native language also influences health care provider selection. As illustrated in the exhibit below, preliminary data from San Francisco’s Chinese Progressive Association indicate that a provider’s familiarity with the patient’s language and culture rates among the top three reasons Excelsior and Chinatown residents cite for choosing their health care provider.215, 216 Apart from language and culture, proximity to home and insurance coverage also constituted top reasons for provider selection.
While Interpretation is Available at San Francisco Hospitals, Outreach and Education Likely Needed to Make Residents More Aware of Such Services A review of San Francisco hospital websites reveals that all hospitals provide interpretation services in multiple languages. Interpretation service providers range from on-site staff interpreters to telephone and video medical interpretation, the availability of which vary by site. While San Francisco’s health care facilities appear to meet patients’ linguistic needs, HCSMP focus groups and public comment made at HCSMP Task Force meetings suggest that accessing needed interpretation services is still an issue for some. This suggests that, at minimum, San Francisco’s hospitals and other health care facilities may need to conduct greater outreach and education efforts regarding available interpretation services as well as expand services available on-site, tailored to the preferences of the patient community, if possible.
Exhibit 71. Excelsior and Chinatown survey respondents citing provider “familiarity with language and culture” among top three reasons for selecting a provider (2011)
Respondents by Group
Excelsior Chinatown Seniors All
Provider Familiarity with Patient’s Language + Culture
24.5% 41.3% 36.3% 26.2%
Source: Chinese Progressive Association, 2011
FINAL HCSMP: October 2013 Page 137
Innovations Offer Promise to Increase Linguistic Connectivity, Some Applied in San Francisco Providers have piloted numerous innovations to increase access for and improve the health outcomes of LEP populations. Please note that the innovations discussed below do not constitute an exhaustive list. Shared Remote Interpreters via Phone and Video Medical Conferencing Shared networks of trained interpreters promise to increase health care access at minimal cost. The Health Care Interpreter Network (HCIN), for example, is a cooperative of eight California public hospitals sharing trained health care interpreters through an automated video/voice call center.217 Through the HCIN, more than 60 interpreters are available to provide member hospitals with interpretation services in Spanish, Cantonese, Mandarin, Vietnamese, Lao, Mien, Thai, Cambodian, Hmong, Korean, Russian, Farsi, Armenian, Tongan, and Hindi. American Sign Language is available on HCIN video stations through Language Line Services. In addition, Spanish interpreters offer assistance beyond traditional work hours, offering patients greater access to timely, flexible care. While participation in shared networks of interpreters is not free, research suggests that such interventions are cost-effective relative to the expenses associated with emergency and follow-up care.218 Recorded Hospital Discharge Instructions in Patients’ Native Language Children’s Hospital Central California provides non-English speaking patients with a recording of their discharge instructions in their native language; the hospital also provides this service to English-speaking patients with limited literacy skills. For up to two weeks post-discharge, patients and their families may access these instructions as needed via a password-protected telephone mailbox. According to the Agency for Healthcare Research and Quality, the program has “been used by a higher-than-expected number of patients and family members, has reduced gaps in comprehension, and has generated high levels of patient/family satisfaction.”221
A San Francisco Example: Increasing Linguistic Connectivity219, 220
To ensure the culturally and linguistically competent provision of health care services, San Francisco General Hospital (SFGH) and all community oriented primary care (COPC) clinics offer interpretation services in 45 different languages to LEP patients. Available from 8am – 12am seven days per week, SFGH’s Interpreter Services Department affords both entities access to interpretation through various methods including in-person interpreting (10 different languages), telephone-based interpreting, videoconferencing interpreting, and a back-up interpreter system used as needed to reach “on call” language bank interpreters and telephonic agency services.
Policies Advancing Linguistic Connectivity
Civil Rights Act of 1964 (Title IV): Health care providers accepting federal funds must ensure health care accessibility, even to LEP populations.
National Standards on Culturally and Linguistically Appropriate Services (CLAS) Standards (Standards 4 through 7): Reinforce the Civil Rights Act of 1964 by detailing how to provide compliant language assistance services.
Health Reform: Advances linguistic connectivity in numerous ways. For example, by requiring federally-supported providers, to the extent possible, to capture culturally and linguistically specific data on population served; requiring that health plan information be presented in culturally and linguistically appropriate way; and more.
Sources: Health Affairs, 30, no. 10 (2011)
HRSA Website
FINAL HCSMP: October 2013 Page 138
Cultural Connectivity
Limited Cultural Competence Negatively Impacts Patient Experience and Health Outcomes
Linked closely to language is culture, or the “thoughts, communications, actions, customs, beliefs, values, and institutions of racial, ethnic, religious, or social groups” that impact how health information may be received.222 Cultural disconnects between patients and health care providers have been linked to unequal clinical treatment, particularly for racial and ethnic minorities, which can result in lower patient
satisfaction, lack of trust in the provider (and therefore limited adherence to treatment), and poorer health outcomes.223, 224 In addition, lack of cultural competency in patient-provider interactions can be experienced as discrimination. A study of HIV-positive patients, for example, found that many had experienced discrimination in care, which was associated with higher rates of depression, more severe AIDS-related symptoms, and lower general health (self-report).225 Broad Understanding of “Culture” Needed to Most Appropriately Serve San Francisco’s Diverse Population San Francisco’s diverse population represents a rich mix of races and ethnicities, ages, income levels, sexual orientations and gender identities, abilities, and other possible identities. Many individuals fall into more than one cultural group. The US Department of Health and Human Services, Health Resources and Services Administration (HRSA) identifies a series of cultural groups and subpopulations (see box, right) with identified health care needs, all of which exist in San Francisco. San Francisco, for example, has prominent lesbian, gay, bisexual, and transgender (LGBT) communities which has spurred the development of population specific health resources and research centers such as the Center of Excellence for Transgender Health. The city also has a significant homeless population, many of whom present with co-occurring disorders such as mental health and substance use issues as well as chronic medical conditions. In response to this need, numerous collaborative programs through the San Francisco Department of Public Health, UCSF, and local non-profits have been developed to provide necessary services. While San Francisco has excelled in developing many unique programs to address the needs of certain populations, it is important that the city maintains a diverse workforce with a comprehensive understanding of culture as it relates to health.
Cultural Competence
A set of congruent behaviors, attitudes, and policies that come together in a system, agency, or among professionals that enables effective work in cross-cultural situations.
Source: US Department of Health and Office of Health and Human Services, Office of Minority Health
Sampling of Cultural and “Special Population” Categories
Youth and Seniors
Women
People of color
LGBT
Homeless
Public Housing Residents
People with Disabilities (Incl. People with Mental Health Issues)
Farm Workers/Migrant Workers
Source: HRSA Website
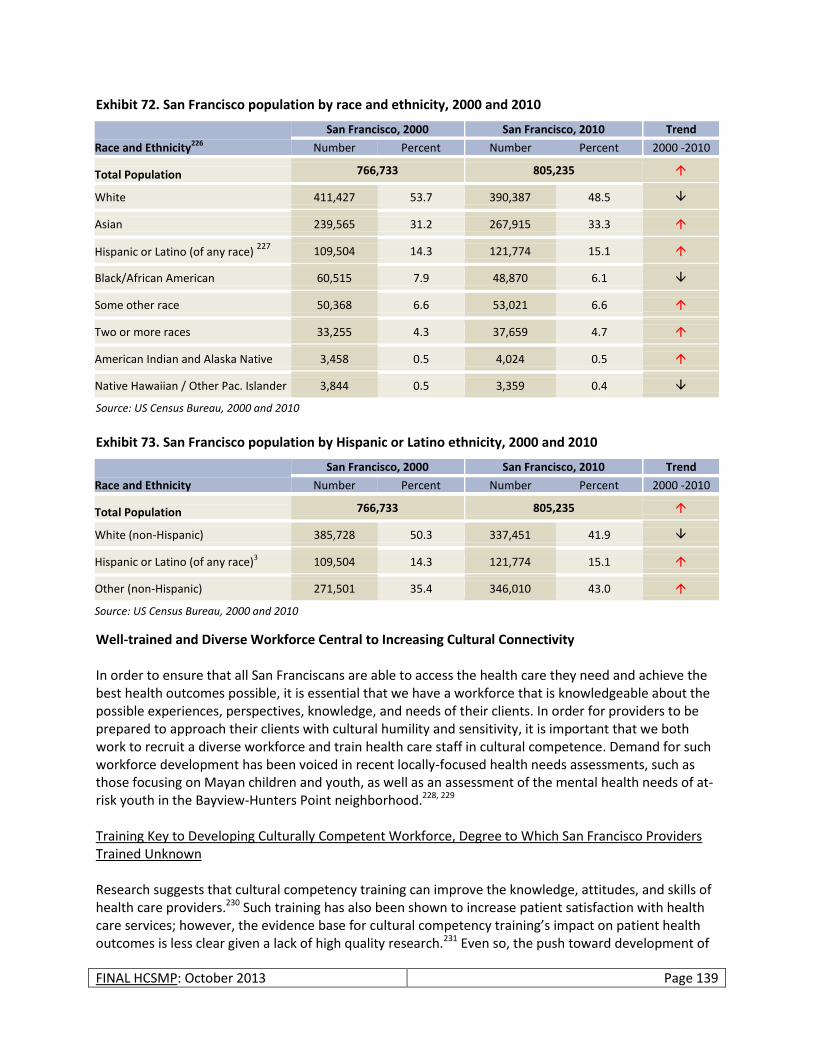
FINAL HCSMP: October 2013 Page 139
Exhibit 72. San Francisco population by race and ethnicity, 2000 and 2010
Race and Ethnicity226
San Francisco, 2000 San Francisco, 2010 Trend
Number Percent Number Percent 2000 -2010
Total Population 766,733 805,235
White 411,427 53.7 390,387 48.5
Asian 239,565 31.2 267,915 33.3
Hispanic or Latino (of any race) 227
109,504 14.3 121,774 15.1
Black/African American 60,515 7.9 48,870 6.1
Some other race 50,368 6.6 53,021 6.6
Two or more races 33,255 4.3 37,659 4.7
American Indian and Alaska Native 3,458 0.5 4,024 0.5
Native Hawaiian / Other Pac. Islander 3,844 0.5 3,359 0.4
Source: US Census Bureau, 2000 and 2010 Exhibit 73. San Francisco population by Hispanic or Latino ethnicity, 2000 and 2010
Race and Ethnicity
San Francisco, 2000 San Francisco, 2010 Trend
Number Percent Number Percent 2000 -2010
Total Population 766,733 805,235
White (non-Hispanic) 385,728 50.3 337,451 41.9
Hispanic or Latino (of any race)3 109,504 14.3 121,774 15.1
Other (non-Hispanic) 271,501 35.4 346,010 43.0
Source: US Census Bureau, 2000 and 2010
Well-trained and Diverse Workforce Central to Increasing Cultural Connectivity In order to ensure that all San Franciscans are able to access the health care they need and achieve the best health outcomes possible, it is essential that we have a workforce that is knowledgeable about the possible experiences, perspectives, knowledge, and needs of their clients. In order for providers to be prepared to approach their clients with cultural humility and sensitivity, it is important that we both work to recruit a diverse workforce and train health care staff in cultural competence. Demand for such workforce development has been voiced in recent locally-focused health needs assessments, such as those focusing on Mayan children and youth, as well as an assessment of the mental health needs of at-risk youth in the Bayview-Hunters Point neighborhood.228, 229 Training Key to Developing Culturally Competent Workforce, Degree to Which San Francisco Providers Trained Unknown Research suggests that cultural competency training can improve the knowledge, attitudes, and skills of health care providers.230 Such training has also been shown to increase patient satisfaction with health care services; however, the evidence base for cultural competency training’s impact on patient health outcomes is less clear given a lack of high quality research.231 Even so, the push toward development of

FINAL HCSMP: October 2013 Page 140
a well-trained and culturally competent workforce is clear. The National Standards on Culturally and Linguistically Appropriate Services (CLAS), for example, devote Standards 1 through 3 to the theme of cultural competency.232, 233 Beyond CLAS standards, HRSA, National Centers of Excellence, and other entities are working to compile best practice information in terms of appropriate delivery of health care services to specific populations. San Francisco leads this charge in many ways, posing CLAS standards as general guidelines for City/County direct service contractors and serving as home to National Centers of Excellence devoted to women’s health, transgender health, and HIV health services. HRSA also cites SFDPH’s best
practice guidelines for providing HIV/AIDS services to transgender persons.234 However, the degree to which San Francisco providers actually seek out and receive related training is unknown. Health Care Workforce Diversity Identified as California Priority but Actual Diversity of San Francisco’s Prevention Workforce Unknown The National Prevention Strategy cites increasing diversity within the prevention workforce as one factor necessary to eliminate health disparities and facilitate the provision of culturally competent care.
235 According to the Strategy, “The workforce should not only be culturally competent but also sufficiently diverse to reflect underlying community characteristics (e.g., race/ethnicity, culture, language, disability)…A well-trained, diverse, and culturally competent workforce helps enhance development and delivery of prevention programs and patient-centered care.” Increasing diversity within the health care workforce may offer the added benefit of increasing the provider supply in traditionally underserved areas while increasing access to culturally competent care tailored to the needs of the resident community. Research has found, for example, that minority physicians in California are more likely than white physicians to practice in Medically Underserved Areas, Health Professional Shortage Areas, and communities with higher proportions of minority and/or low-income residents.236 Please note, however, that Latinos and African Americans are underrepresented among California physicians relative to the prevalence of those racial/ethnic groups in the state’s general population.237 Other ethnic groups – among them Samoan, Cambodian, and Hmong/Laotian – are also underrepresented. Despite California’s patient-provider culture gap, state bodies such as the California Health Workforce Development Council have identified cultural responsiveness and sensitivity as a cross-cutting theme in its work, making the case for increased diversity in the health care workforce. In addition, the California Medical Board Survey – mandated by California State Bill 1586 (enacted in 2001) – provides important physician-reported data on race/ethnicity and language fluency to gauge the degree to which California providers reflect the patients they serve.
CLAS Standard 1
“Health care organizations should ensure that patients/consumers received from all staff members effective, understandable, and respectful care that is provided in a manner compatible with their cultural health beliefs and practices and preferred language.”
Source: Office of Minority Health
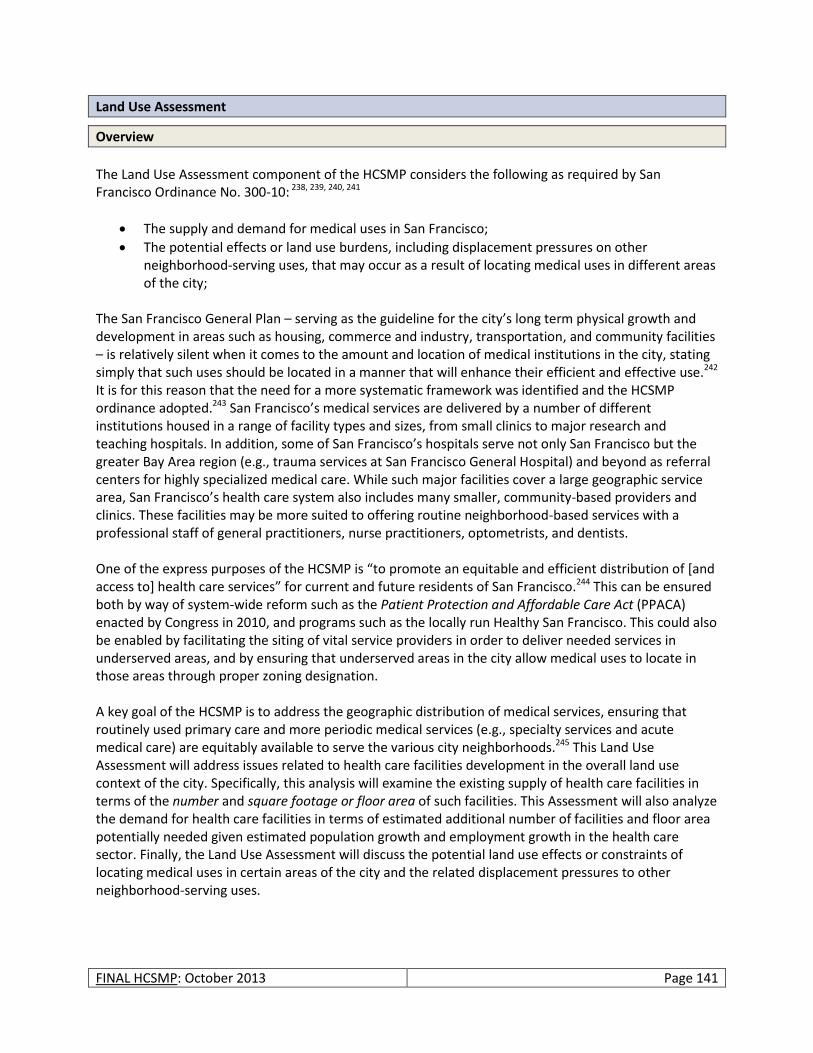
FINAL HCSMP: October 2013 Page 141
Land Use Assessment
Overview
The Land Use Assessment component of the HCSMP considers the following as required by San Francisco Ordinance No. 300-10: 238, 239, 240, 241
The supply and demand for medical uses in San Francisco;
The potential effects or land use burdens, including displacement pressures on other neighborhood-serving uses, that may occur as a result of locating medical uses in different areas of the city;
The San Francisco General Plan – serving as the guideline for the city’s long term physical growth and development in areas such as housing, commerce and industry, transportation, and community facilities – is relatively silent when it comes to the amount and location of medical institutions in the city, stating simply that such uses should be located in a manner that will enhance their efficient and effective use.242 It is for this reason that the need for a more systematic framework was identified and the HCSMP ordinance adopted.243 San Francisco’s medical services are delivered by a number of different institutions housed in a range of facility types and sizes, from small clinics to major research and teaching hospitals. In addition, some of San Francisco’s hospitals serve not only San Francisco but the greater Bay Area region (e.g., trauma services at San Francisco General Hospital) and beyond as referral centers for highly specialized medical care. While such major facilities cover a large geographic service area, San Francisco’s health care system also includes many smaller, community-based providers and clinics. These facilities may be more suited to offering routine neighborhood-based services with a professional staff of general practitioners, nurse practitioners, optometrists, and dentists. One of the express purposes of the HCSMP is “to promote an equitable and efficient distribution of [and access to] health care services” for current and future residents of San Francisco.244 This can be ensured both by way of system-wide reform such as the Patient Protection and Affordable Care Act (PPACA) enacted by Congress in 2010, and programs such as the locally run Healthy San Francisco. This could also be enabled by facilitating the siting of vital service providers in order to deliver needed services in underserved areas, and by ensuring that underserved areas in the city allow medical uses to locate in those areas through proper zoning designation. A key goal of the HCSMP is to address the geographic distribution of medical services, ensuring that routinely used primary care and more periodic medical services (e.g., specialty services and acute medical care) are equitably available to serve the various city neighborhoods.245 This Land Use Assessment will address issues related to health care facilities development in the overall land use context of the city. Specifically, this analysis will examine the existing supply of health care facilities in terms of the number and square footage or floor area of such facilities. This Assessment will also analyze the demand for health care facilities in terms of estimated additional number of facilities and floor area potentially needed given estimated population growth and employment growth in the health care sector. Finally, the Land Use Assessment will discuss the potential land use effects or constraints of locating medical uses in certain areas of the city and the related displacement pressures to other neighborhood-serving uses.
FINAL HCSMP: October 2013 Page 142
Definitions
Uses of Land “Use” in the Planning Code is defined as “[t]he purpose for which land or a structure, or both, are designed, constructed, arranged or intended, or for which they are occupied or maintained, let or leased.” For example, land or a building structure can be designed to be occupied by an office, residential, bar, clinic, hospital, or restaurant “use,” etc. Different areas (or zones) of the city permit; do not permit; permit “as of right” or permit with special conditions different uses, as determined by their zoning (e.g., residential, commercial, industrial, etc.) designation/district.
Medical Use For the purpose of the HCSMP, the definition of “medical use” draws from different sections of the Planning Code (see the Land Use Assessment Supplement at the end of this assessment for all the exact definitions of medical uses, as referenced in Ordinance 300-10), specifically from Sections 790.114, 790.44, 890.114, 890.44, 209.3(a), 217 (a) and (c) .246 All of these Planning Code definitions have significant overlap but apply to different zoning districts or areas of the city. For the purposes of simplifying the discussion, the definitions of medical uses can be broadly categorized into two types: 1) A large institution such as a hospital or medical center (Planning Code Sections 790.44,
890.44, 217 (a) and 209.3 (a)) defined in the Code as “a public or private institutional use which provides medical facilities for inpatient or outpatient medical care, medical offices, clinics, and laboratories.”
2) An office or retail space (Planning Code Sections 790.114, 890.114, 217 (c)) that houses medical uses which can range from an optometrist or dentist’s office to a neighborhood clinic (i.e., uses generally smaller than a larger institutional hospital). Such medical uses are defined in the Code as “a use [retail or office] which provides medical and allied health services to the individual by physicians, surgeons, dentists, podiatrists, psychologists, psychiatrists, acupuncturists, chiropractors, or any other health-care professionals when licensed by a State-sanctioned Board overseeing the provision of medically oriented services. It includes a clinic, primarily providing outpatient care in medical, psychiatric or other health services, and not part of a hospital or medical center.” o Clinics vs. medical office distinction:
Clinics are predominantly primary care facilities in which services are offered either at no cost or low cost to the patient.247
Medical offices are facilities of doctor’s private practice, offering services for a fee paid in cash or by a health plan.
Land Use Burden “Land use burdens” are typically defined as restrictions on land that affect its value. Since the purpose of the HCSMP is to promote equitable access to and distribution of health care services, the HCSMP recommendations will likely not make zoning change proposals that make property more restrictive than is currently allowed ; rather, zoning change proposals, if any, would ensure that medical uses are allowed, as appropriate, throughout the city. Therefore, the analysis will
FINAL HCSMP: October 2013 Page 143
focus more on the broader potential effects of locating medical uses in different areas of the city, or their impact upon the existing character of certain areas of the city.
Displacement (of other neighborhood-serving uses) “Displacement” generally refers to the involuntary move or dislocation of a use (e.g., housing or a local business tenant) through the direct or indirect pressures of another use (e.g., an office tenant) moving into the same space, or of an activity happening in the neighborhood such as construction, evictions, and price/rent increases that force existing tenants/businesses to relocate. This often leads to larger changes in neighborhood character and livability of an area. For example, when transit stations or freeways are built, it can lead to vacating existing parcels of land to make room for the infrastructure; or when higher income residents/businesses move into a low-income area this often “prices out” existing residents and businesses.
Data
Data for this section come from a variety of sources. Data on city clinics and hospitals are obtained from the State of California Office of Statewide Health Planning and Development (OSHPD), and information on medical use floor area comes from Dun & Bradstreet, CoStar, the San Francisco Assessor’s Office, and a LiDAR248 dataset recorded in 2007. Micro-level access to health care services were unavailable, due to patient privacy issues, and therefore patient profiles, which might otherwise have been informative in assessing future land use demand for medical services based on assumptions about changing demographics, were not created. Instead, the analysis provides an estimate by way of simple extrapolation of present trends for the future need of physical facilities based on the anticipated size of population and employment growth. Medical Uses and Zoning Designations in the Planning Code The San Francisco Planning Code regulates the type and intensity of uses for all land in the city. This is done through a set of land use regulations commonly referred to as “zoning,” detailing requirements such as the size of businesses, buildings heights, open space, and parking requirements. While there are dozens of individual zoning and height districts, they can be grouped into general categories based on common characteristics and purpose. Such a summary is given in the table below: Exhibit 74. Overview of zoning districts
Zoning Districts Districts Symbols / Classification
General Description - Purpose and General Uses
Residential RH, RM, RC, RTO (all e.g., RH-1, RM-4, RTO-M, etc.)
All residential districts including single-family homes, apartments, residential-commercial, and residential-transit areas of the city. The primary function and uses of these districts are residential in nature with some other limited uses, often through a Conditional Use authorization permit depending on the use (e.g., schools, churches medical institutions, and in some cases, limited commercial on the ground floor) interspersed. The intent of such controls is to preserve housing and promote balanced and convenient neighborhoods with appropriate public improvements and services, suitable nonresidential activities that are compatible
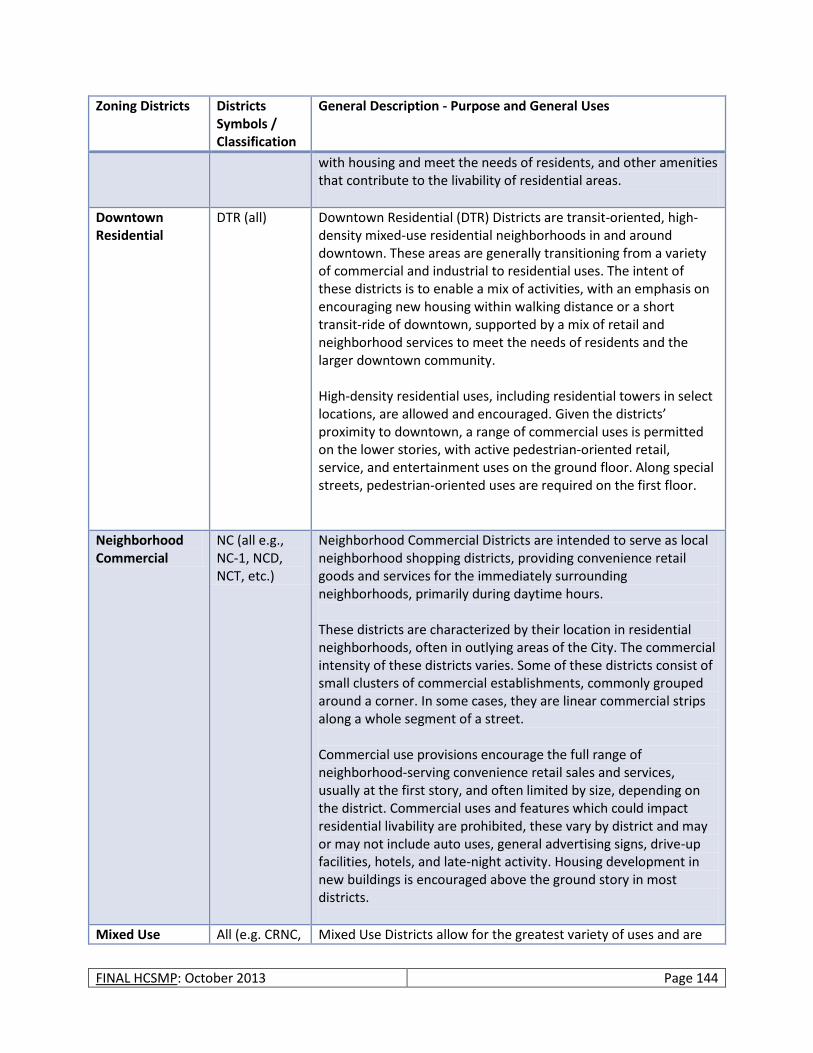
FINAL HCSMP: October 2013 Page 144
Zoning Districts Districts Symbols / Classification
General Description - Purpose and General Uses
with housing and meet the needs of residents, and other amenities that contribute to the livability of residential areas.
Downtown Residential
DTR (all) Downtown Residential (DTR) Districts are transit-oriented, high-density mixed-use residential neighborhoods in and around downtown. These areas are generally transitioning from a variety of commercial and industrial to residential uses. The intent of these districts is to enable a mix of activities, with an emphasis on encouraging new housing within walking distance or a short transit-ride of downtown, supported by a mix of retail and neighborhood services to meet the needs of residents and the larger downtown community. High-density residential uses, including residential towers in select locations, are allowed and encouraged. Given the districts’ proximity to downtown, a range of commercial uses is permitted on the lower stories, with active pedestrian-oriented retail, service, and entertainment uses on the ground floor. Along special streets, pedestrian-oriented uses are required on the first floor.
Neighborhood Commercial
NC (all e.g., NC-1, NCD, NCT, etc.)
Neighborhood Commercial Districts are intended to serve as local neighborhood shopping districts, providing convenience retail goods and services for the immediately surrounding neighborhoods, primarily during daytime hours. These districts are characterized by their location in residential neighborhoods, often in outlying areas of the City. The commercial intensity of these districts varies. Some of these districts consist of small clusters of commercial establishments, commonly grouped around a corner. In some cases, they are linear commercial strips along a whole segment of a street. Commercial use provisions encourage the full range of neighborhood-serving convenience retail sales and services, usually at the first story, and often limited by size, depending on the district. Commercial uses and features which could impact residential livability are prohibited, these vary by district and may or may not include auto uses, general advertising signs, drive-up facilities, hotels, and late-night activity. Housing development in new buildings is encouraged above the ground story in most districts.
Mixed Use All (e.g. CRNC, Mixed Use Districts allow for the greatest variety of uses and are
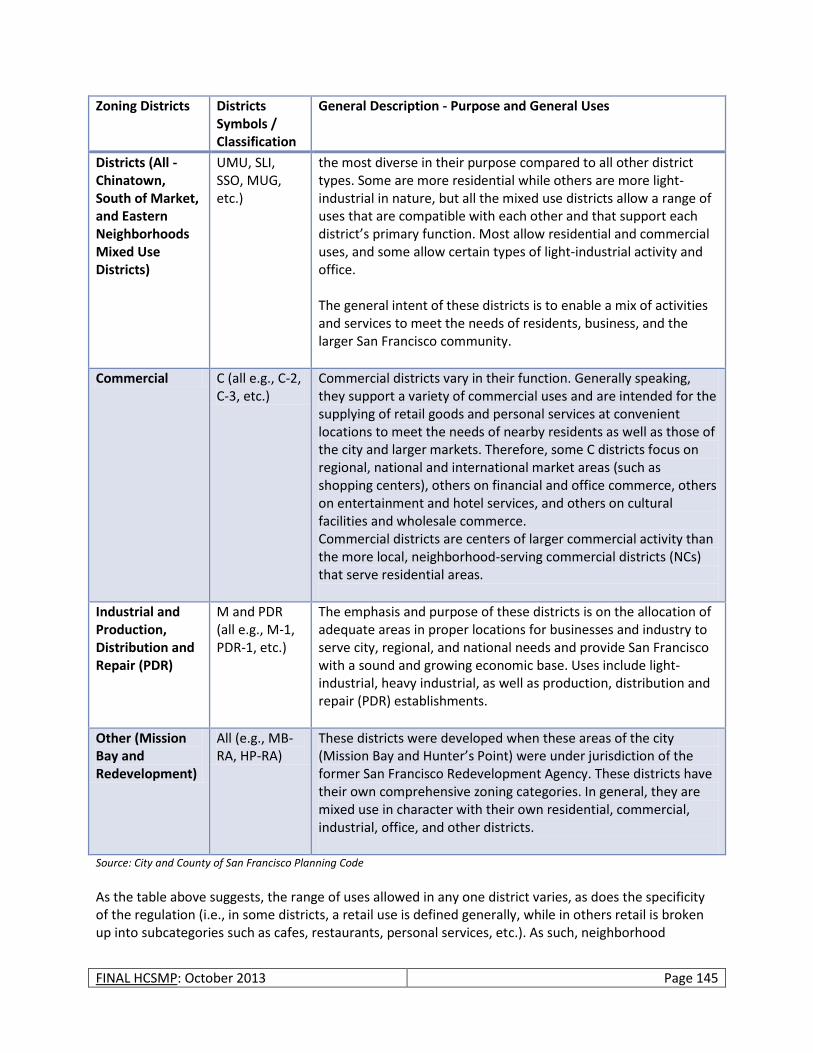
FINAL HCSMP: October 2013 Page 145
Zoning Districts Districts Symbols / Classification
General Description - Purpose and General Uses
Districts (All -Chinatown, South of Market, and Eastern Neighborhoods Mixed Use Districts)
UMU, SLI, SSO, MUG, etc.)
the most diverse in their purpose compared to all other district types. Some are more residential while others are more light-industrial in nature, but all the mixed use districts allow a range of uses that are compatible with each other and that support each district’s primary function. Most allow residential and commercial uses, and some allow certain types of light-industrial activity and office. The general intent of these districts is to enable a mix of activities and services to meet the needs of residents, business, and the larger San Francisco community.
Commercial C (all e.g., C-2, C-3, etc.)
Commercial districts vary in their function. Generally speaking, they support a variety of commercial uses and are intended for the supplying of retail goods and personal services at convenient locations to meet the needs of nearby residents as well as those of the city and larger markets. Therefore, some C districts focus on regional, national and international market areas (such as shopping centers), others on financial and office commerce, others on entertainment and hotel services, and others on cultural facilities and wholesale commerce. Commercial districts are centers of larger commercial activity than the more local, neighborhood-serving commercial districts (NCs) that serve residential areas.
Industrial and Production, Distribution and Repair (PDR)
M and PDR (all e.g., M-1, PDR-1, etc.)
The emphasis and purpose of these districts is on the allocation of adequate areas in proper locations for businesses and industry to serve city, regional, and national needs and provide San Francisco with a sound and growing economic base. Uses include light-industrial, heavy industrial, as well as production, distribution and repair (PDR) establishments.
Other (Mission Bay and Redevelopment)
All (e.g., MB-RA, HP-RA)
These districts were developed when these areas of the city (Mission Bay and Hunter’s Point) were under jurisdiction of the former San Francisco Redevelopment Agency. These districts have their own comprehensive zoning categories. In general, they are mixed use in character with their own residential, commercial, industrial, office, and other districts.
Source: City and County of San Francisco Planning Code
As the table above suggests, the range of uses allowed in any one district varies, as does the specificity of the regulation (i.e., in some districts, a retail use is defined generally, while in others retail is broken up into subcategories such as cafes, restaurants, personal services, etc.). As such, neighborhood
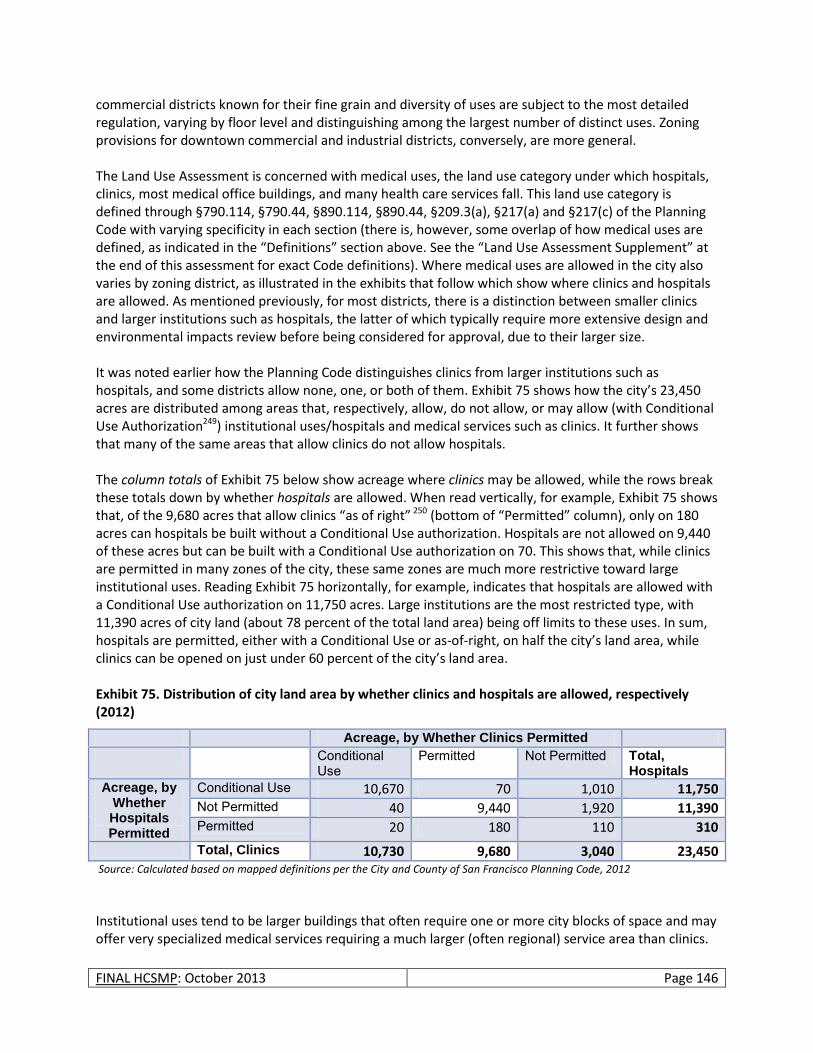
FINAL HCSMP: October 2013 Page 146
commercial districts known for their fine grain and diversity of uses are subject to the most detailed regulation, varying by floor level and distinguishing among the largest number of distinct uses. Zoning provisions for downtown commercial and industrial districts, conversely, are more general. The Land Use Assessment is concerned with medical uses, the land use category under which hospitals, clinics, most medical office buildings, and many health care services fall. This land use category is defined through §790.114, §790.44, §890.114, §890.44, §209.3(a), §217(a) and §217(c) of the Planning Code with varying specificity in each section (there is, however, some overlap of how medical uses are defined, as indicated in the “Definitions” section above. See the “Land Use Assessment Supplement” at the end of this assessment for exact Code definitions). Where medical uses are allowed in the city also varies by zoning district, as illustrated in the exhibits that follow which show where clinics and hospitals are allowed. As mentioned previously, for most districts, there is a distinction between smaller clinics and larger institutions such as hospitals, the latter of which typically require more extensive design and environmental impacts review before being considered for approval, due to their larger size. It was noted earlier how the Planning Code distinguishes clinics from larger institutions such as hospitals, and some districts allow none, one, or both of them. Exhibit 75 shows how the city’s 23,450 acres are distributed among areas that, respectively, allow, do not allow, or may allow (with Conditional Use Authorization249) institutional uses/hospitals and medical services such as clinics. It further shows that many of the same areas that allow clinics do not allow hospitals. The column totals of Exhibit 75 below show acreage where clinics may be allowed, while the rows break these totals down by whether hospitals are allowed. When read vertically, for example, Exhibit 75 shows that, of the 9,680 acres that allow clinics “as of right” 250 (bottom of “Permitted” column), only on 180 acres can hospitals be built without a Conditional Use authorization. Hospitals are not allowed on 9,440 of these acres but can be built with a Conditional Use authorization on 70. This shows that, while clinics are permitted in many zones of the city, these same zones are much more restrictive toward large institutional uses. Reading Exhibit 75 horizontally, for example, indicates that hospitals are allowed with a Conditional Use authorization on 11,750 acres. Large institutions are the most restricted type, with 11,390 acres of city land (about 78 percent of the total land area) being off limits to these uses. In sum, hospitals are permitted, either with a Conditional Use or as-of-right, on half the city’s land area, while clinics can be opened on just under 60 percent of the city’s land area. Exhibit 75. Distribution of city land area by whether clinics and hospitals are allowed, respectively (2012)
Acreage, by Whether Clinics Permitted
Conditional Use
Permitted Not Permitted Total, Hospitals
Acreage, by Whether Hospitals Permitted
Conditional Use 10,670 70 1,010 11,750 Not Permitted 40 9,440 1,920 11,390 Permitted 20 180 110 310
Total, Clinics 10,730 9,680 3,040 23,450 Source: Calculated based on mapped definitions per the City and County of San Francisco Planning Code, 2012
Institutional uses tend to be larger buildings that often require one or more city blocks of space and may offer very specialized medical services requiring a much larger (often regional) service area than clinics.
FINAL HCSMP: October 2013 Page 147
Therefore, limiting the areas of the city where they are allowed is appropriate for the larger medical institutions and hospitals. For example, large hospital campuses with taller, multiple buildings, and a large footprint may be appropriate in some small-scale residential neighborhoods but not in others. The Conditional Use process allows for reviewing their appropriateness in such areas of the city. A potential hospital site should meet several key criteria: geographic location (i.e., proximity to patients, physicians and staff), suitable size, and availability for acquisition. There is no defined minimum size requirement for a hospital site, but there are examples of urban hospitals on small sites in San Francisco and other metropolitan cities: Moffitt/Long Hospital at the University of California, San Francisco (UCSF) Parnassus Heights campus houses 560 beds on approximately three acres, and the Kaiser Los Angeles Medical Center houses a 450-bed hospital and medical office building on approximately 3.5 acres. The focus for hospital development is to locate a site that is sufficient to develop a new hospital that accommodates its entire program and support services. The minimum lot size required for an inpatient acute care hospital varies, depending upon the location of the lot. In areas closer to San Francisco’s downtown core, less acreage is necessary because a taller facility can be built there than would be possible in primarily residential areas located farther from downtown. Sufficient site size is also related to parking demand. Specifically, the ability to reduce such demand, and resulting parking space area and volume, through the availability of mass transit and use of transportation demand management (TDM) programs to create incentives for transit use. Smaller clinics, conversely, can easily blend in the City’s many neighborhoods commercial and some residential districts and provide walk-in service often within walking distance to the surrounding areas. With regards to zoning, even if the distribution is somewhat uneven across the city (see Exhibit 76 and Exhibit 77) hospital uses could be built on land in about half of the city under current zoning. Given that San Francisco is only 49 square miles, the competing demand for land from other uses (e.g., housing, commercial uses) that must be accommodated to support the various housing and economic functions of the city, and the types of lots (large size and intensity) that large medical institutions require, this is likely an adequate number of districts to accommodate these functions, notwithstanding the challenges associated with siting any one new large scale project. Future revisions of the HCSMP could include a more systematic way of determining whether more land is needed for medical uses.
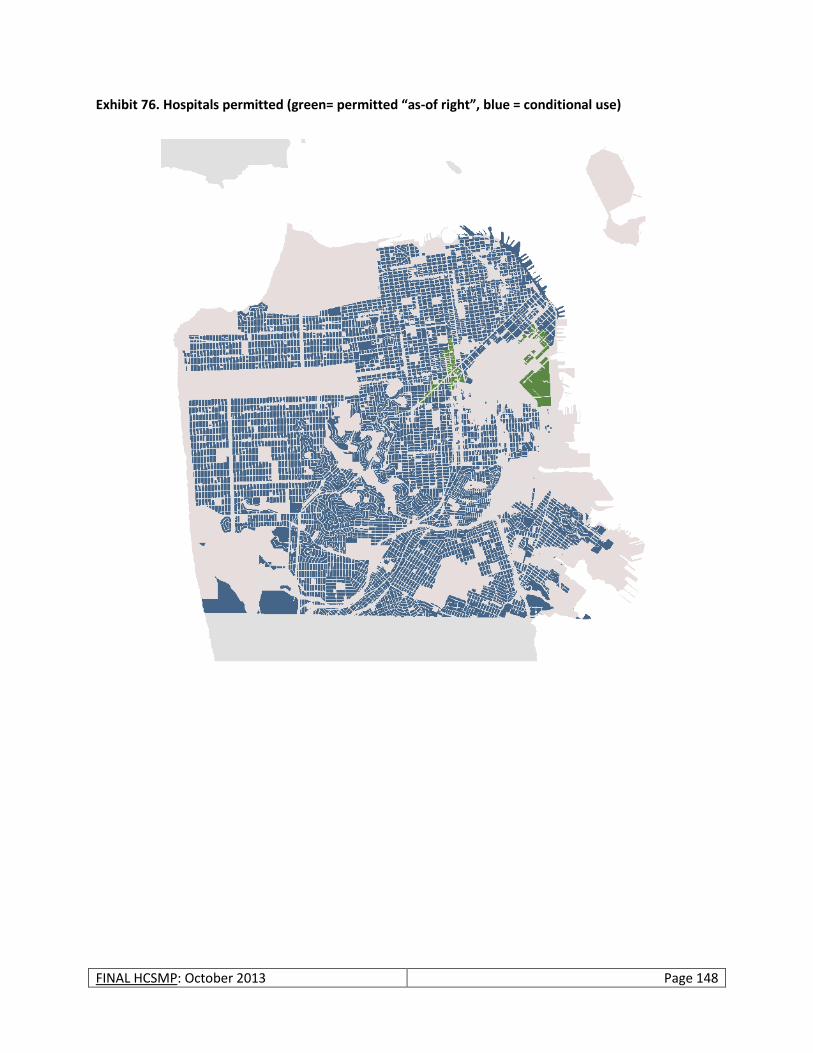
FINAL HCSMP: October 2013 Page 148
Exhibit 76. Hospitals permitted (green= permitted “as-of right”, blue = conditional use)
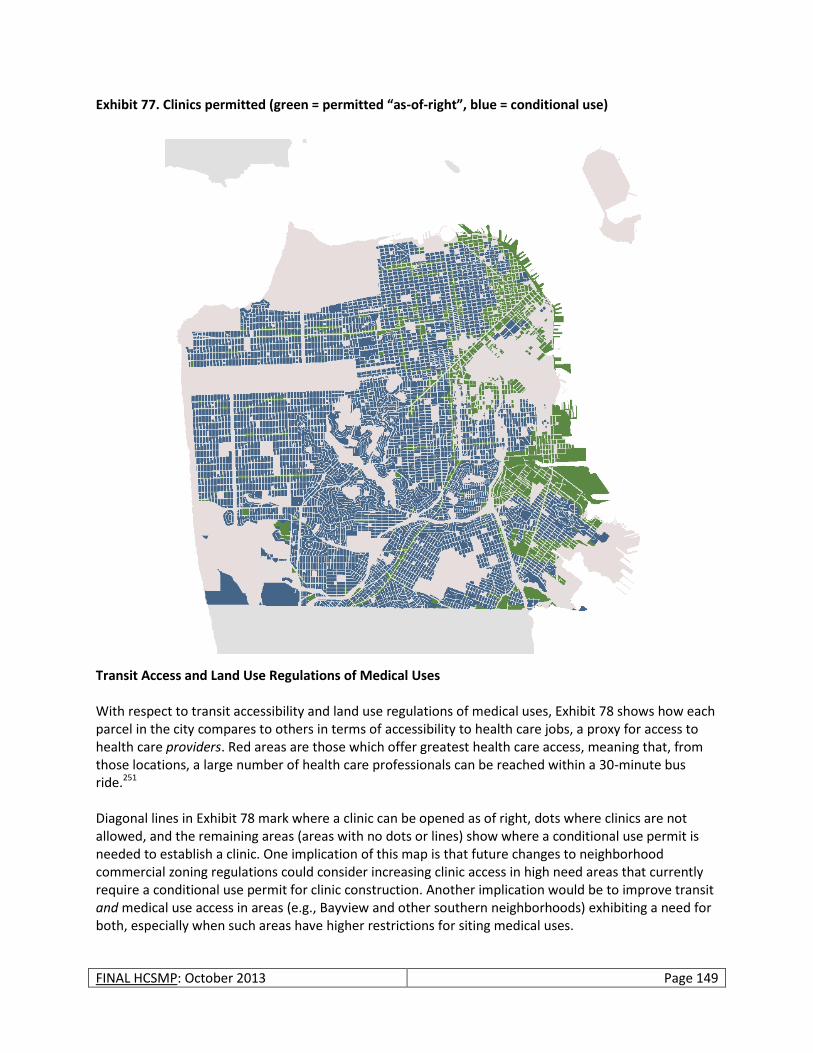
FINAL HCSMP: October 2013 Page 149
Exhibit 77. Clinics permitted (green = permitted “as-of-right”, blue = conditional use)
Transit Access and Land Use Regulations of Medical Uses With respect to transit accessibility and land use regulations of medical uses, Exhibit 78 shows how each parcel in the city compares to others in terms of accessibility to health care jobs, a proxy for access to health care providers. Red areas are those which offer greatest health care access, meaning that, from those locations, a large number of health care professionals can be reached within a 30-minute bus ride.251 Diagonal lines in Exhibit 78 mark where a clinic can be opened as of right, dots where clinics are not allowed, and the remaining areas (areas with no dots or lines) show where a conditional use permit is needed to establish a clinic. One implication of this map is that future changes to neighborhood commercial zoning regulations could consider increasing clinic access in high need areas that currently require a conditional use permit for clinic construction. Another implication would be to improve transit and medical use access in areas (e.g., Bayview and other southern neighborhoods) exhibiting a need for both, especially when such areas have higher restrictions for siting medical uses.
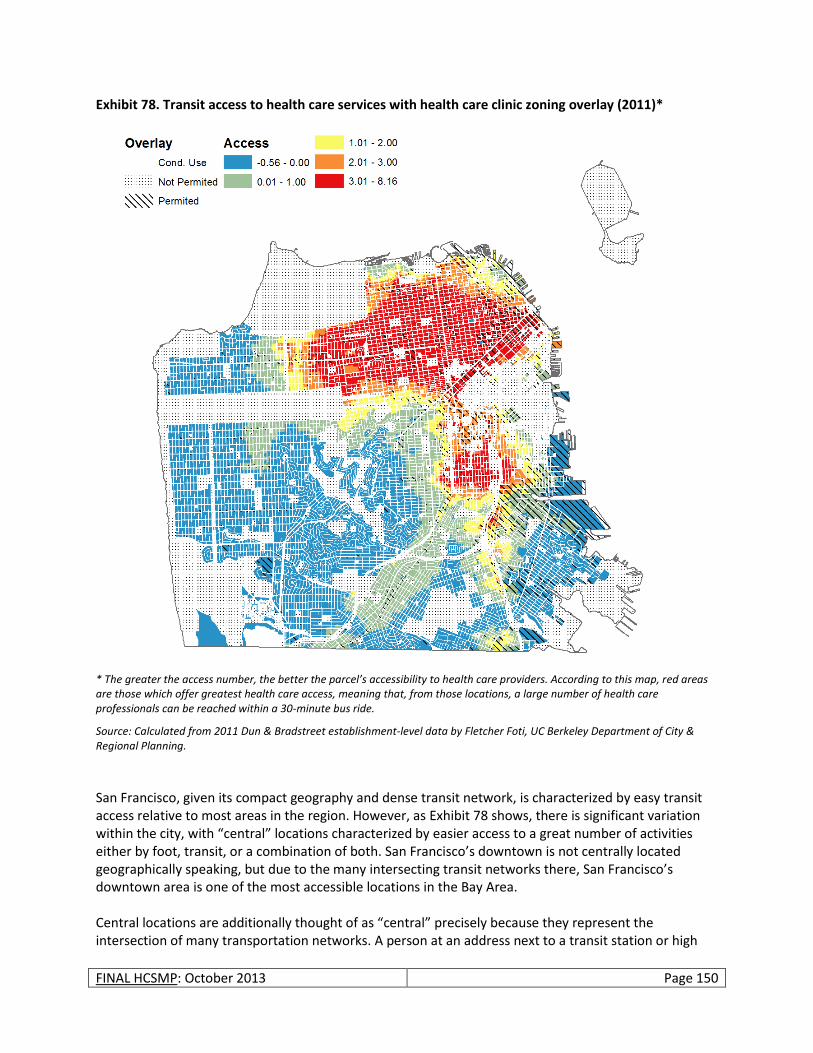
FINAL HCSMP: October 2013 Page 150
Exhibit 78. Transit access to health care services with health care clinic zoning overlay (2011)*
* The greater the access number, the better the parcel’s accessibility to health care providers. According to this map, red areas are those which offer greatest health care access, meaning that, from those locations, a large number of health care professionals can be reached within a 30-minute bus ride.
Source: Calculated from 2011 Dun & Bradstreet establishment-level data by Fletcher Foti, UC Berkeley Department of City & Regional Planning.
San Francisco, given its compact geography and dense transit network, is characterized by easy transit access relative to most areas in the region. However, as Exhibit 78 shows, there is significant variation within the city, with “central” locations characterized by easier access to a great number of activities either by foot, transit, or a combination of both. San Francisco’s downtown is not centrally located geographically speaking, but due to the many intersecting transit networks there, San Francisco’s downtown area is one of the most accessible locations in the Bay Area. Central locations are additionally thought of as “central” precisely because they represent the intersection of many transportation networks. A person at an address next to a transit station or high
FINAL HCSMP: October 2013 Page 151
frequency bus line, for example, will be able to reach a much larger number of areas and activities within a given time span relative to a person located far from the transit network. While it makes sense to encourage medical uses in central locations, it is also important for transit access to be improved and expanded to areas of the city where residents rely most on public transit (i.e., primarily low-income neighborhoods).
Supply of Medical Uses
There are, as of 2010, 40 registered clinics in San Francisco and 11 hospitals operated by seven organizations, including California Pacific Medical Center, Chinese Hospital, Dignity Health, Jewish Home, Kaiser, SFDPH, and the University of California, San Francisco. Further, health care is offered through thousands of private doctors’ offices located throughout the city. Health Clinics Health services in San Francisco are offered in a range of facility types scattered throughout the city. While many clinicians operate out of small private offices (see below), there are also a number of primary care health centers ranging from hospital-based to stand-alone clinics offering services in and to the community, often with the cultural and linguistic capacity to serve San Francisco’s diverse population. These facilities are critical to the city in that they are often more accessible to those who are under- or uninsured or face other barriers to health care access. While not all city neighborhoods have such clinics, some serve much larger areas than their immediate vicinity and, because they are neighborhood based address some of the transportation problems often cited as a barrier to care. Private Doctors’ Offices According to the Medical Board of California, there were 5,761 licensed physicians and surgeons in San Francisco in Fiscal Year 2008-2009.252 Per the 2011 Dun & Bradstreet release of establishment-level data classified according to the North American Industry Classification System (NAICS), there are 5,137 ambulatory health care establishments (NAICS code 621) in San Francisco, primarily offering appointment-based health services in connection with a health care plan (as shown in the exhibit below). The employment count in the following exhibit includes administrative personnel; accordingly, it is much higher than the 5,761 figure obtained from the Medical Board. These private doctors’ offices, mostly located in smaller buildings throughout the city, provide a substantial amount of the city’s medical services.
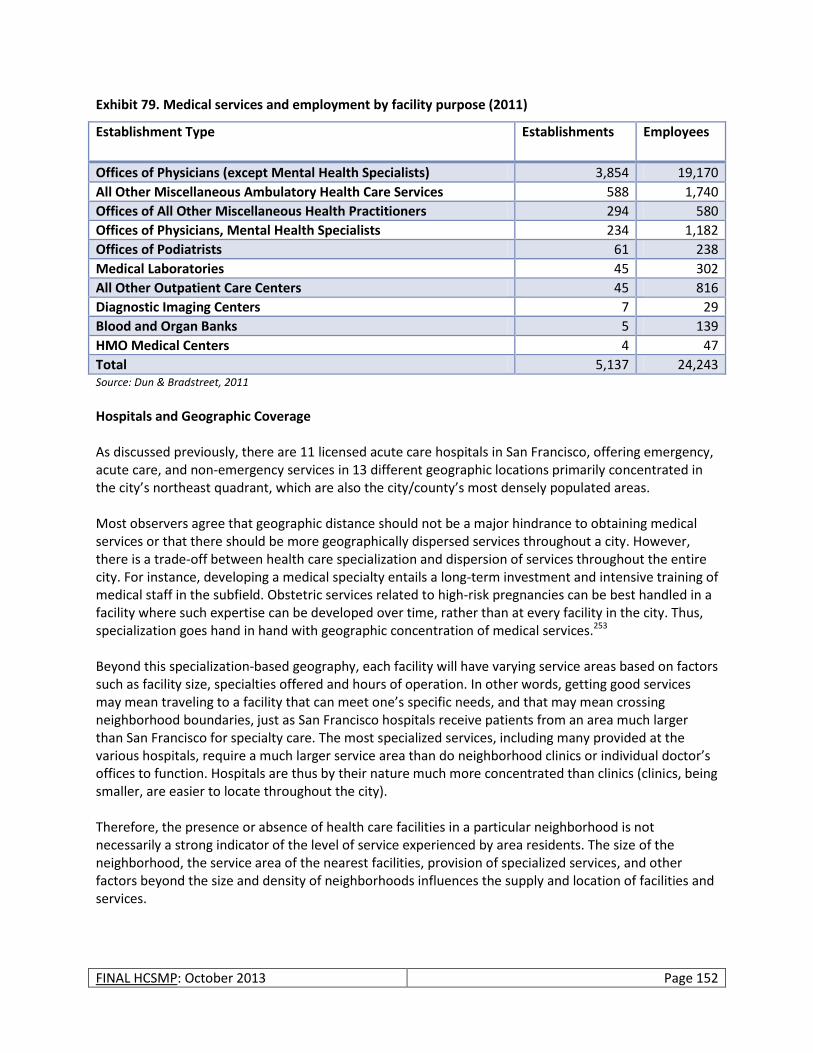
FINAL HCSMP: October 2013 Page 152
Exhibit 79. Medical services and employment by facility purpose (2011)
Establishment Type Establishments Employees
Offices of Physicians (except Mental Health Specialists) 3,854 19,170
All Other Miscellaneous Ambulatory Health Care Services 588 1,740
Offices of All Other Miscellaneous Health Practitioners 294 580
Offices of Physicians, Mental Health Specialists 234 1,182
Offices of Podiatrists 61 238
Medical Laboratories 45 302
All Other Outpatient Care Centers 45 816
Diagnostic Imaging Centers 7 29
Blood and Organ Banks 5 139
HMO Medical Centers 4 47
Total 5,137 24,243 Source: Dun & Bradstreet, 2011
Hospitals and Geographic Coverage As discussed previously, there are 11 licensed acute care hospitals in San Francisco, offering emergency, acute care, and non-emergency services in 13 different geographic locations primarily concentrated in the city’s northeast quadrant, which are also the city/county’s most densely populated areas. Most observers agree that geographic distance should not be a major hindrance to obtaining medical services or that there should be more geographically dispersed services throughout a city. However, there is a trade-off between health care specialization and dispersion of services throughout the entire city. For instance, developing a medical specialty entails a long-term investment and intensive training of medical staff in the subfield. Obstetric services related to high-risk pregnancies can be best handled in a facility where such expertise can be developed over time, rather than at every facility in the city. Thus, specialization goes hand in hand with geographic concentration of medical services.253 Beyond this specialization-based geography, each facility will have varying service areas based on factors such as facility size, specialties offered and hours of operation. In other words, getting good services may mean traveling to a facility that can meet one’s specific needs, and that may mean crossing neighborhood boundaries, just as San Francisco hospitals receive patients from an area much larger than San Francisco for specialty care. The most specialized services, including many provided at the various hospitals, require a much larger service area than do neighborhood clinics or individual doctor’s offices to function. Hospitals are thus by their nature much more concentrated than clinics (clinics, being smaller, are easier to locate throughout the city). Therefore, the presence or absence of health care facilities in a particular neighborhood is not necessarily a strong indicator of the level of service experienced by area residents. The size of the neighborhood, the service area of the nearest facilities, provision of specialized services, and other factors beyond the size and density of neighborhoods influences the supply and location of facilities and services.
FINAL HCSMP: October 2013 Page 153
Clinic Size and Geographic Coverage Data from the Office of Statewide Health Planning and Development (OSHPD) do not contain information on the physical size of health care facilities but is instead focused on the services offered. For land use purposes, an effort was made to match each OSHPD health care facility record by address with information on establishment size from other data sources254; however, the derived square footage in the case of mixed use buildings often includes residential square footage making it difficult to determine the floor area devoted solely to clinical functions. With this caveat, most clinics in the city are relatively small, averaging about 2,000 square feet in size. These clinics, in turn, staff a median of 3.35 full-time equivalent (FTE) medical personnel, and treat a median of 7,300 patients per year.255 While some San Francisco neighborhoods are home to multiple community clinics, some neighborhoods have none at all. Recognizing that service areas vary for clinics, to get an “all-other-things-equal”-sense of geographical coverage of clinics, the map in Exhibit 80 shows each clinic bounded by a geographic area, defined as points closer to that particular clinic than to any other clinic,256 and the population living in each of these service areas. This map does not show where people actually go for medical services, as this information was not available; it merely divides the city’s geography into areas around each clinic and shows the population of these “service areas.” This offers a perspective on where the clinic density, relative to resident population, is smaller, which is in more outlying, lower density areas of the city. Moreover, the low-income areas of the city that show a large population per clinic include the Bayview, portions of Ocean View, Lakeshore, the Outer Mission and Excelsior neighborhoods, primarily the southernmost sections of San Francisco. Conversely, low income areas around the Tenderloin/Civic Center have a higher geographic clinic density. See Exhibit 81and Exhibit 82 for the low-income neighborhoods in the city compared to the population density per clinic in Exhibit 80.
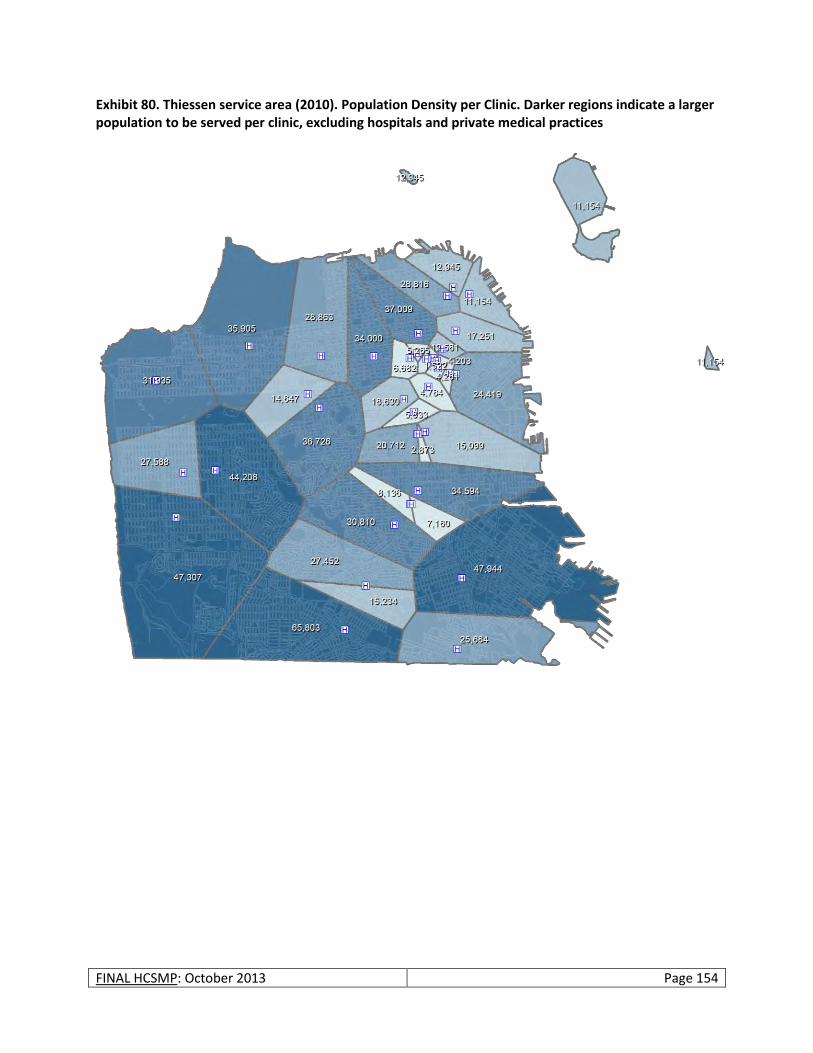
FINAL HCSMP: October 2013 Page 154
Exhibit 80. Thiessen service area (2010). Population Density per Clinic. Darker regions indicate a larger population to be served per clinic, excluding hospitals and private medical practices
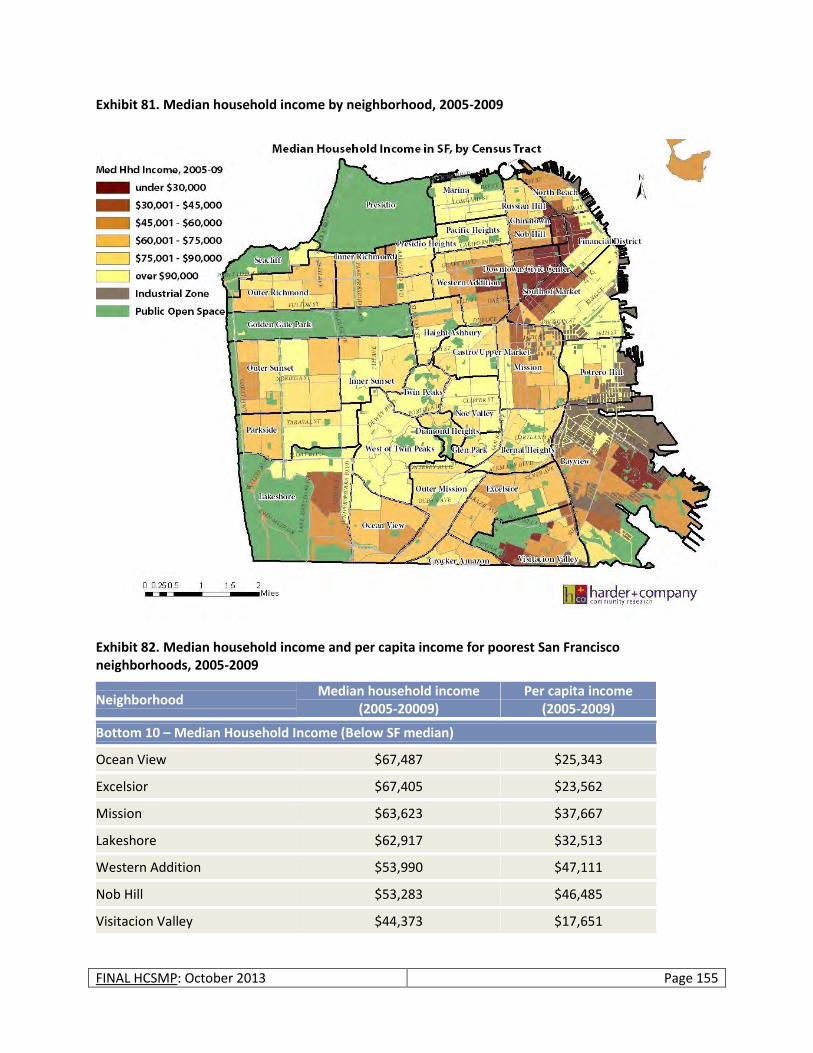
FINAL HCSMP: October 2013 Page 155
Exhibit 81. Median household income by neighborhood, 2005-2009
Exhibit 82. Median household income and per capita income for poorest San Francisco neighborhoods, 2005-2009
Neighborhood Median household income
(2005-20009) Per capita income
(2005-2009)
Bottom 10 – Median Household Income (Below SF median)
Ocean View $67,487 $25,343
Excelsior $67,405 $23,562
Mission $63,623 $37,667
Lakeshore $62,917 $32,513
Western Addition $53,990 $47,111
Nob Hill $53,283 $46,485
Visitacion Valley $44,373 $17,651
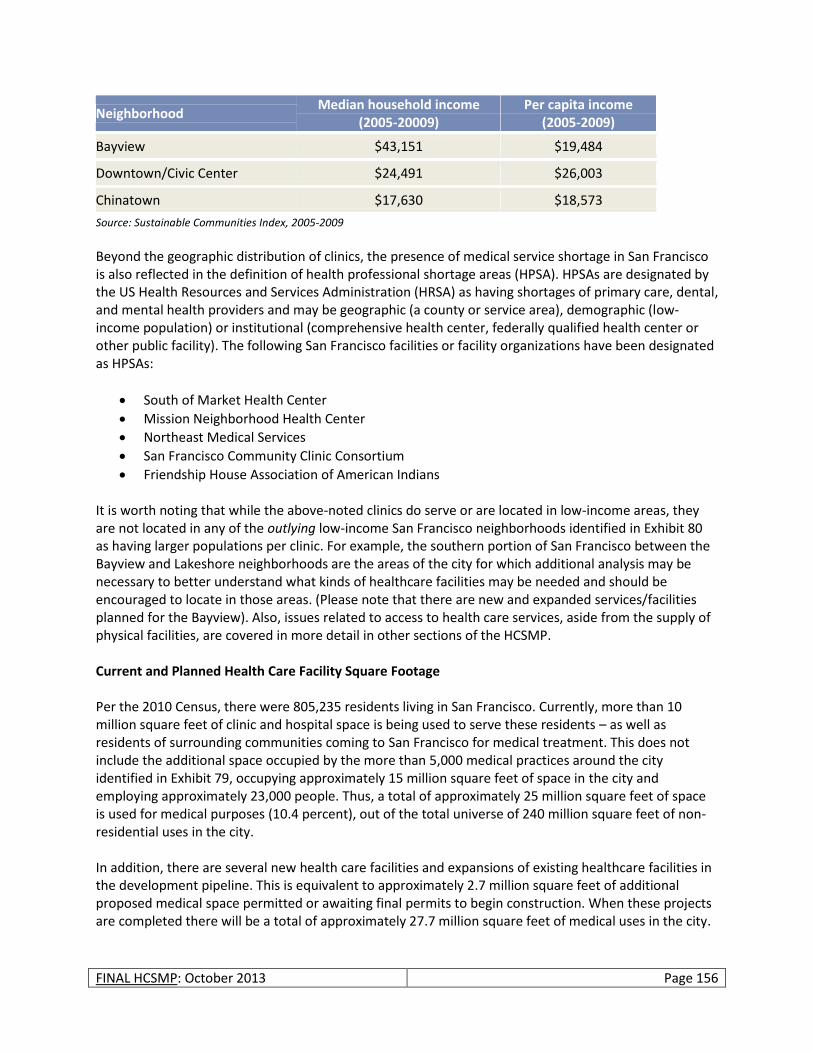
FINAL HCSMP: October 2013 Page 156
Neighborhood Median household income
(2005-20009) Per capita income
(2005-2009)
Bayview $43,151 $19,484
Downtown/Civic Center $24,491 $26,003
Chinatown $17,630 $18,573
Source: Sustainable Communities Index, 2005-2009
Beyond the geographic distribution of clinics, the presence of medical service shortage in San Francisco is also reflected in the definition of health professional shortage areas (HPSA). HPSAs are designated by the US Health Resources and Services Administration (HRSA) as having shortages of primary care, dental, and mental health providers and may be geographic (a county or service area), demographic (low-income population) or institutional (comprehensive health center, federally qualified health center or other public facility). The following San Francisco facilities or facility organizations have been designated as HPSAs:
South of Market Health Center
Mission Neighborhood Health Center
Northeast Medical Services
San Francisco Community Clinic Consortium
Friendship House Association of American Indians It is worth noting that while the above-noted clinics do serve or are located in low-income areas, they are not located in any of the outlying low-income San Francisco neighborhoods identified in Exhibit 80 as having larger populations per clinic. For example, the southern portion of San Francisco between the Bayview and Lakeshore neighborhoods are the areas of the city for which additional analysis may be necessary to better understand what kinds of healthcare facilities may be needed and should be encouraged to locate in those areas. (Please note that there are new and expanded services/facilities planned for the Bayview). Also, issues related to access to health care services, aside from the supply of physical facilities, are covered in more detail in other sections of the HCSMP. Current and Planned Health Care Facility Square Footage Per the 2010 Census, there were 805,235 residents living in San Francisco. Currently, more than 10 million square feet of clinic and hospital space is being used to serve these residents – as well as residents of surrounding communities coming to San Francisco for medical treatment. This does not include the additional space occupied by the more than 5,000 medical practices around the city identified in Exhibit 79, occupying approximately 15 million square feet of space in the city and employing approximately 23,000 people. Thus, a total of approximately 25 million square feet of space is used for medical purposes (10.4 percent), out of the total universe of 240 million square feet of non-residential uses in the city. In addition, there are several new health care facilities and expansions of existing healthcare facilities in the development pipeline. This is equivalent to approximately 2.7 million square feet of additional proposed medical space permitted or awaiting final permits to begin construction. When these projects are completed there will be a total of approximately 27.7 million square feet of medical uses in the city.

FINAL HCSMP: October 2013 Page 157
Exhibit 83. Major medical use (institution) projects in the development pipeline (2012)
Facility Description
UCSF Mission Bay Hospital A 289-bed hospital for children, women and cancer patients due to open in 2015 totaling 878,000 square feet.
CPMC Cathedral Hill Hospital and Expansion
CPMC is going through a reorganization of several of its campuses around the city, including a 12-story, 730,888 square foot, 274-304 bed acute care hospital and a nine story 242,987 square foot medical office building at Cathedral Hill; a 120-bed seismic and smaller rebuild of St. Luke’s Hospital of 214,061 square feet; and a new 46,006 gross square feet Neuroscience Institute medical clinic and office building at the Davies Campus.
Chinese Hospital Construction of a 54-bed, acute-care, 101,545 gross square feet building.
Replacement hospital building includes a new 22-bed skilled nursing facility on the footprint of the demolished buildings on the eastern portion of the project site (approximately 11,526 square-foot area).
Kaiser Medical Office Building
New medical office project at 1600 Owens consisting of 264,000 square feet of floor area.
SF General Hospital Part of SF General Upgrade is a 374,000 square feet research facility.
Source: City and County of San Francisco Planning Department land use database
Demand and Need for Medical Uses
Overview For the purposes of the HCSMP, the demand analysis in this section of the Land Use Assessment focuses on expected additional land use demand for medical services/uses in the city given the projected employment growth in the medical services sector and overall population growth in the city. As an indication of current citywide demand, San Francisco’s clinics recorded 984,000 encounters257 representing 141,000 unduplicated patients in 2010. The area in which clinics experienced the highest number of patient encounters was North Beach (including Chinatown), followed by Downtown/Civic Center, and the Mission. These three neighborhoods are areas with a substantial proportion of low-income residents (see Exhibit 81), particularly Chinatown and Civic Center, in San Francisco. These top three areas account for more than 50 percent of all patient encounters in San Francisco. Exhibit 84 also demonstrates that the number of patient encounters in a given neighborhood is only marginally related to the actual population of the neighborhood. In the case of North Beach, there were 18 patient encounters per resident, while in the Inner Richmond, where the population is more than two times that of North Beach, the corresponding figure is substantially lower at 0.20 encounters per resident, representing a difference of almost two orders of magnitude. While this says as much about the arbitrary task of drawing neighborhood boundaries as it does about local demand, it does show that clinics likely serve a much larger catchment area than their immediate environs, as noted in the overview.
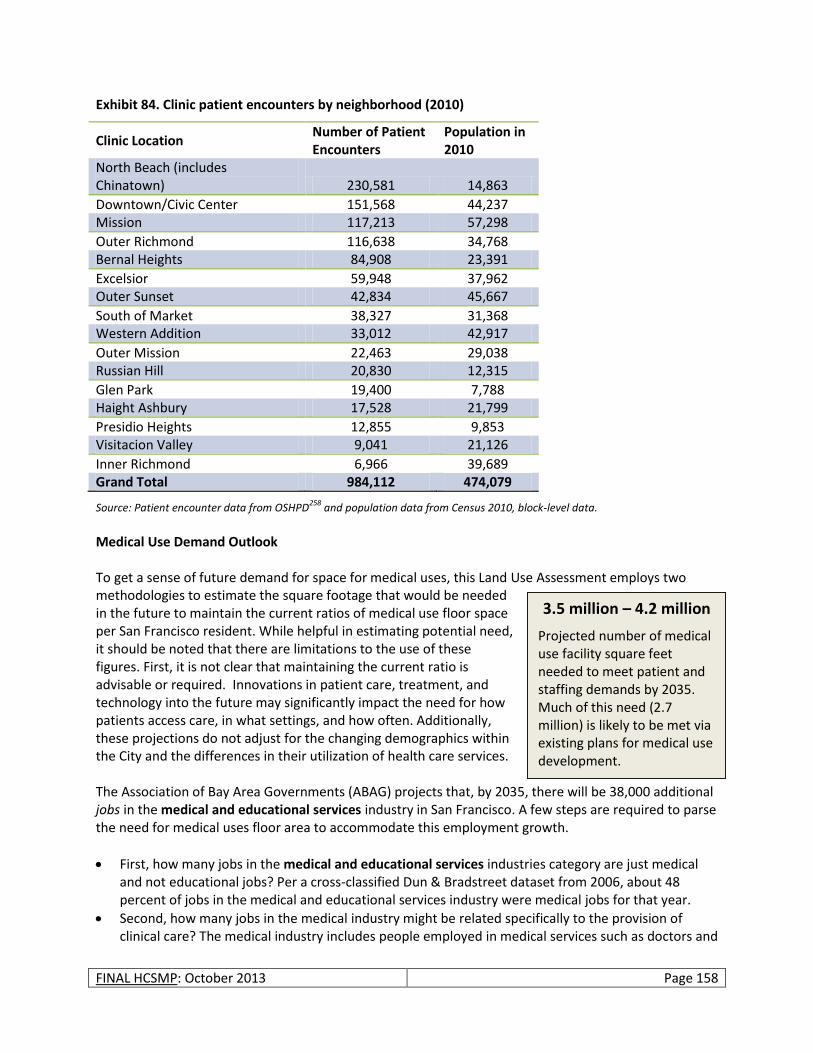
FINAL HCSMP: October 2013 Page 158
Exhibit 84. Clinic patient encounters by neighborhood (2010)
Clinic Location Number of Patient Encounters
Population in 2010
North Beach (includes Chinatown) 230,581 14,863
Downtown/Civic Center 151,568 44,237 Mission 117,213 57,298
Outer Richmond 116,638 34,768 Bernal Heights 84,908 23,391
Excelsior 59,948 37,962 Outer Sunset 42,834 45,667
South of Market 38,327 31,368 Western Addition 33,012 42,917
Outer Mission 22,463 29,038 Russian Hill 20,830 12,315
Glen Park 19,400 7,788 Haight Ashbury 17,528 21,799
Presidio Heights 12,855 9,853 Visitacion Valley 9,041 21,126
Inner Richmond 6,966 39,689 Grand Total 984,112 474,079
Source: Patient encounter data from OSHPD258
and population data from Census 2010, block-level data.
Medical Use Demand Outlook To get a sense of future demand for space for medical uses, this Land Use Assessment employs two methodologies to estimate the square footage that would be needed in the future to maintain the current ratios of medical use floor space per San Francisco resident. While helpful in estimating potential need, it should be noted that there are limitations to the use of these figures. First, it is not clear that maintaining the current ratio is advisable or required. Innovations in patient care, treatment, and technology into the future may significantly impact the need for how patients access care, in what settings, and how often. Additionally, these projections do not adjust for the changing demographics within the City and the differences in their utilization of health care services. The Association of Bay Area Governments (ABAG) projects that, by 2035, there will be 38,000 additional jobs in the medical and educational services industry in San Francisco. A few steps are required to parse the need for medical uses floor area to accommodate this employment growth.
First, how many jobs in the medical and educational services industries category are just medical and not educational jobs? Per a cross-classified Dun & Bradstreet dataset from 2006, about 48 percent of jobs in the medical and educational services industry were medical jobs for that year.
Second, how many jobs in the medical industry might be related specifically to the provision of clinical care? The medical industry includes people employed in medical services such as doctors and
3.5 million – 4.2 million
Projected number of medical use facility square feet needed to meet patient and staffing demands by 2035. Much of this need (2.7 million) is likely to be met via existing plans for medical use development.
FINAL HCSMP: October 2013 Page 159
nurses but also support staff, including secretaries, truck drivers, and cleaners. We are interested more in the former than the latter group for the purposes of deriving actual medical uses in the city. Per data from the American Community Survey (2010) about 54 percent of those employed in ambulatory health care services, hospitals, and nursing and residential care facilities function in actual patient care positions (as opposed to administrative support functions, such as catering, architectural services, etc.).
Based on these pieces of information, about 9,900 of the 38,000 additional jobs would be actual patient care jobs.259 Further, using an employment density of 350 square feet per job, all other things equal260 corresponds to a need for an additional 3.5 million square feet of medical use space in the city by 2035. For comparison, the new UCSF Mission Bay hospital is planned to be a total of 900,000 square feet, while California Pacific Medical Center across all campuses is planning to expand by 1.1 million square feet; these two medical institutions together account for a substantial part (2.0 million) of the 3.5 million square figure of future additional medical space required. The remaining portion of estimated medical space required (less than one 1 million adding the other major projects in the development pipeline from Exhibit 83), in the context of all of the neighborhood commercial and other districts that allow medical uses, and in context of current space used for medical uses (around 25 million square feet), is fairly small. As an alternative measure of future need for additional medical services space, we can scale the approximately 25 million square feet of space currently used for medical purposes up to the future citywide population in 2035 (projected to grow to 940,000 residents261), keeping the proportion constant. Based on this method, about 4.2 million square feet of additional space would be needed by 2035. This extrapolated figure of future needed additional medical services space is about 700,000 square feet larger than the one obtained from the ABAG projections-employment density method above. This suggests that the employment projections are slightly less focused on medical services than would be warranted by the simple extrapolation method—that ABAG projects more jobs in sectors other than medical services, thus changing future overall shares. It also reinforces the above point that the estimated need for future additional medical services space by 2035 (between 3.5 to 4.2 million square feet, with certain planned future expansions covered in Exhibit 83, accounting for about 2.7 million square feet of that need) is not a substantial amount of space in the context of the existing 25 million square feet of medical uses. To further illustrate that the amount of assumed future need is not a “substantial” figure, a rough representation of what the remaining (0.8-1.5 million square feet) figure could mean in terms of actual buildings (vs. square footage) can be given. Assuming project sizes of 5,000 to 10,000 square feet per project (the threshold sizes of the HCSMP ordinance for new additions and expansions of medical facilities) the additional space could represent anywhere from 200-500 new medical use spaces (clinics, private offices, etc.). These would likely be distributed throughout the entire city’s 23,000 acres (1 billion square feet) or more accurately, in the 19,000 acres of the city (83 million square feet) where hospitals and clinics are currently permitted. Even if we assume the citywide need for future additional medical services space would be fulfilled by small medical services establishments and that it would entail development of 200-500 small new medical establishments, either through new construction or new leases signed in existing commercial buildings, this additional development would be relatively small in the context of the existing medical spaces (25 million square feet ) in the city where these uses are permitted and the overall citywide building stock of non-residential uses (240 million square feet ).
FINAL HCSMP: October 2013 Page 160
From a different angle, while San Francisco’s ratio of hospital beds per resident (3.0 licensed and available general acute care hospital beds per 1,000 residents) is higher than the state’s ratio of 1.9 licensed and available general acute care beds per 1,000 residents, maintaining a similar hospital beds per resident ratio in the city in the future based on the 2035 population projections would require that San Francisco add around 400 hospital beds. The planned hospital expansions and additions in the development pipeline would add close to 700 hospital beds, more than the 400 needed to maintain the current ratio. Since there are existing plans for new (non-hospital) and renovated facilities in the Bayview (such as the Southeast Health Center and the Child Advocacy Center and Center for Youth Wellness), one of the neighborhoods identified as needing more medical services infrastructure, this Land Use Assessment and the other HCSMP assessments together reveal that focusing on other aspects of medical service access is more critical in San Francisco than providing or incentivizing additional physical infrastructure. These aspects may include focusing on the need for specialized linguistic and culturally appropriate medical services and certain key services, such as primary care, that can be accommodated in smaller clinics or existing locations or ensuring that providers accept Medi-Cal recipients and the uninsured. However, additional physical infrastructure and services may be needed in other low-income neighborhoods in the southern section of San Francisco as discussed earlier.
Potential for Land Use Burdens and Displacement of Neighborhood Services
As a result of its nature and relation with the surrounding community, certain land uses could potentially have an adverse effect on the neighborhood. There are many different types of potential adverse effects that could result from the interaction of a land use with its surrounding neighborhood. For instance, a new ballpark will generate a substantial amount of traffic on game nights; a university will be the target of trips throughout the day, while a new housing project may reduce open space but provide housing. Traffic and other physical environmental impacts of a particular project or proposed new land use are studied as part of the environmental review process. Therefore, the environmental review document accompanying the HCSMP will include a more thorough assessment of traffic and other physical environmental impacts of the proposed HCSMP on the physical environment. This Land Use Assessment section will focus on a more general discussion of potential effects of a medical use project on the character of an area depending on the area’s zoning classification. Generally, the potential adverse effects of medical uses in certain areas of the city will depend on the exact site location (e.g., on an empty lot near transit vs. in a very built-out area with small streets and no transit service) and size of the use proposed. Institutional uses – hospitals and/or medical centers – because of their larger footprint have greater potential adverse effects on a given neighborhood, depending on the interaction of such proposed medical uses with other surrounding uses. In the case of retail, office, and neighborhood clinic types of medical uses, which tend to be smaller development projects, the potential impact will depend on the size of the use. Exhibit 85 below identifies generalized potential land use effects of medical use projects by zoning district classification.
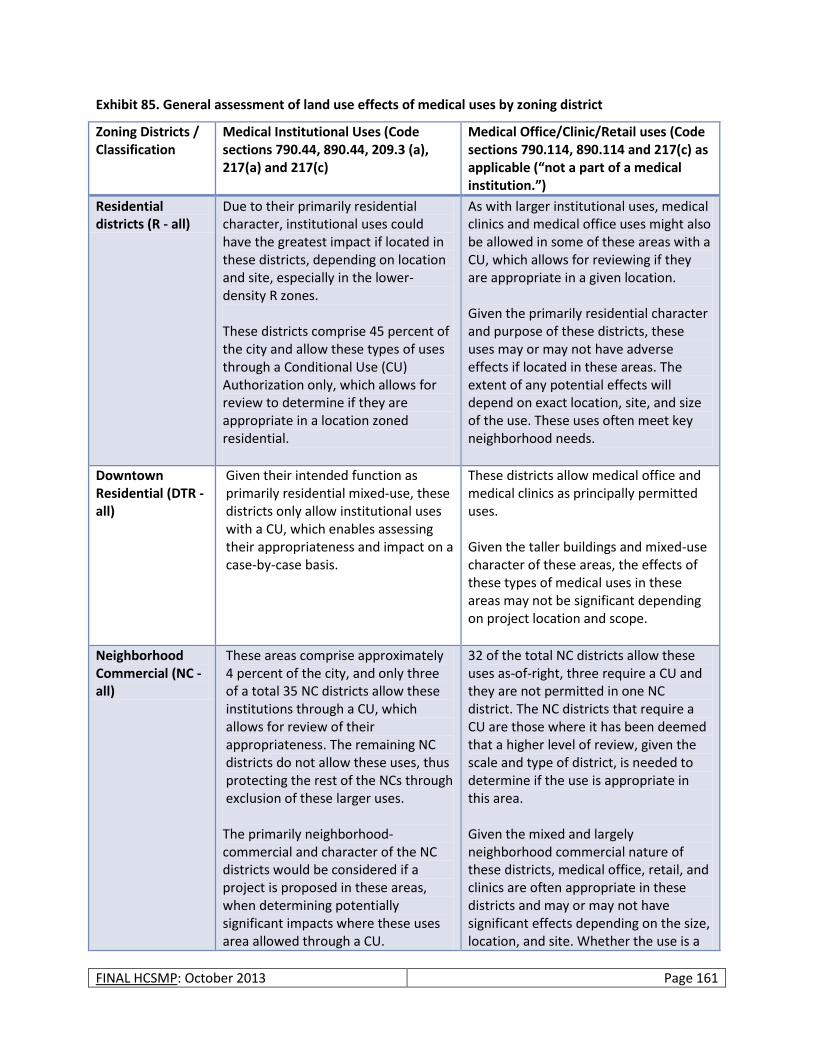
FINAL HCSMP: October 2013 Page 161
Exhibit 85. General assessment of land use effects of medical uses by zoning district
Zoning Districts / Classification
Medical Institutional Uses (Code sections 790.44, 890.44, 209.3 (a), 217(a) and 217(c)
Medical Office/Clinic/Retail uses (Code sections 790.114, 890.114 and 217(c) as applicable (“not a part of a medical institution.”)
Residential districts (R - all)
Due to their primarily residential character, institutional uses could have the greatest impact if located in these districts, depending on location and site, especially in the lower-density R zones. These districts comprise 45 percent of the city and allow these types of uses through a Conditional Use (CU) Authorization only, which allows for review to determine if they are appropriate in a location zoned residential.
As with larger institutional uses, medical clinics and medical office uses might also be allowed in some of these areas with a CU, which allows for reviewing if they are appropriate in a given location. Given the primarily residential character and purpose of these districts, these uses may or may not have adverse effects if located in these areas. The extent of any potential effects will depend on exact location, site, and size of the use. These uses often meet key neighborhood needs.
Downtown Residential (DTR - all)
Given their intended function as primarily residential mixed-use, these districts only allow institutional uses with a CU, which enables assessing their appropriateness and impact on a case-by-case basis.
These districts allow medical office and medical clinics as principally permitted uses. Given the taller buildings and mixed-use character of these areas, the effects of these types of medical uses in these areas may not be significant depending on project location and scope.
Neighborhood Commercial (NC - all)
These areas comprise approximately 4 percent of the city, and only three of a total 35 NC districts allow these institutions through a CU, which allows for review of their appropriateness. The remaining NC districts do not allow these uses, thus protecting the rest of the NCs through exclusion of these larger uses. The primarily neighborhood-commercial and character of the NC districts would be considered if a project is proposed in these areas, when determining potentially significant impacts where these uses area allowed through a CU.
32 of the total NC districts allow these uses as-of-right, three require a CU and they are not permitted in one NC district. The NC districts that require a CU are those where it has been deemed that a higher level of review, given the scale and type of district, is needed to determine if the use is appropriate in this area. Given the mixed and largely neighborhood commercial nature of these districts, medical office, retail, and clinics are often appropriate in these districts and may or may not have significant effects depending on the size, location, and site. Whether the use is a

FINAL HCSMP: October 2013 Page 162
Zoning Districts / Classification
Medical Institutional Uses (Code sections 790.44, 890.44, 209.3 (a), 217(a) and 217(c)
Medical Office/Clinic/Retail uses (Code sections 790.114, 890.114 and 217(c) as applicable (“not a part of a medical institution.”)
needed neighborhood service should be considered when assessing impacts.
Mixed Use districts (all)
Institutional uses are largely restricted in the Mixed Use districts with the exception of two districts each in both the SOMA and Eastern Neighborhoods’ mixed use districts (SSO and MUO262) where it is principally permitted. Institutional uses are also permitted in one of Chinatown’s mixed use districts (CRNC263) through a CU. Given the primary function as either residential-commercial or light-industrial mixed use districts of the districts that prohibit large institutional medical uses, this restriction protects them from potential adverse effects.
Clinic-type uses are largely not permitted in the Mixed Use districts with the exception of the three Chinatown districts and two (MUG264 and MUO) in the Eastern Neighborhood Mixed Use districts where they are allowed on the ground floor only. This prohibition protects most of the Mixed Use districts from the effects of locating medical office/clinics.
Commercial (C - all)
These areas comprise approximately 3 percent of the city and may allow these institutional uses only through a CU process, which allows for review of their appropriateness on a case-by-case basis. Due to their primary commercial function, these areas may or may not see a significant impact from the location of institutional uses depending on the size and scale of the project and the needs of the district and surrounding areas.
Clinics are principally permitted in all of these districts and seem appropriate in these areas due to their mixed-use character.
Industrial and Production, Distribution and Repair (M and PDR - all)
With the exception of M-1, which is light-industrial, these areas do not permit the location of these types of institutional uses. This serves to protect the industrial functions of the city. Therefore the Code controls are
These areas allow clinics as a principal use if they are below a certain size (5,000 square feet for all districts except for PDR-1-G265 which allows them as-of-right below 7,500 square feet). Further, these areas may allow larger clinics with
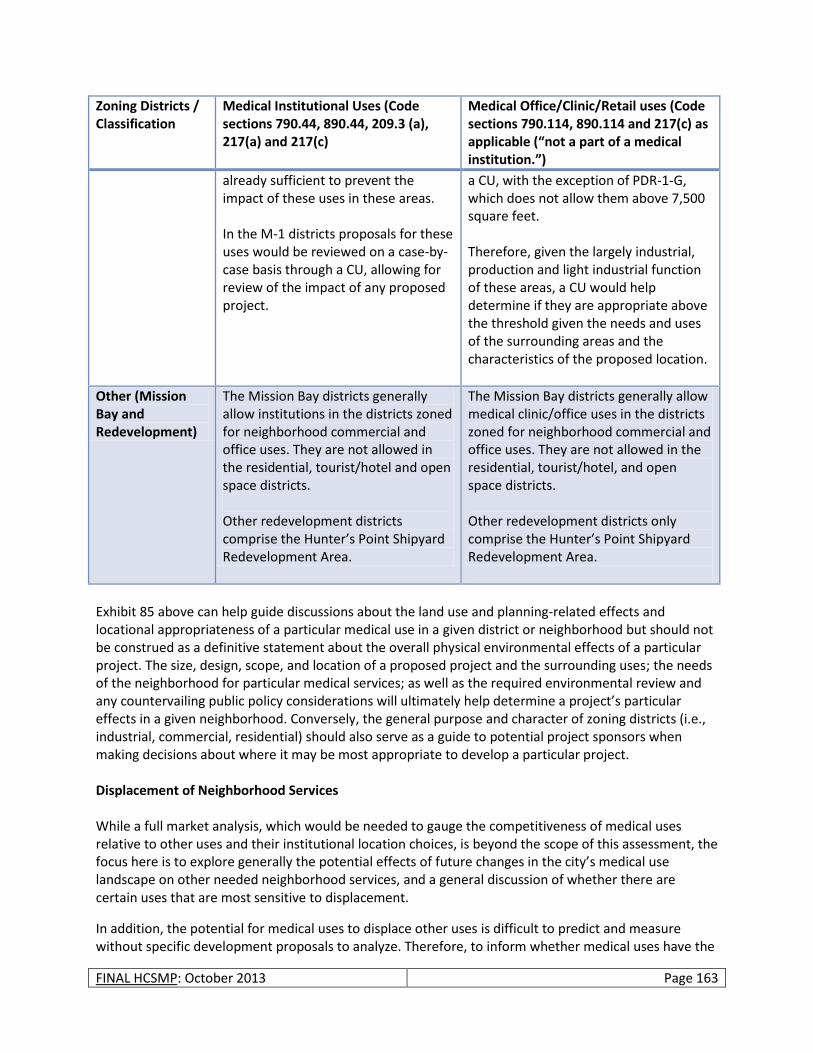
FINAL HCSMP: October 2013 Page 163
Zoning Districts / Classification
Medical Institutional Uses (Code sections 790.44, 890.44, 209.3 (a), 217(a) and 217(c)
Medical Office/Clinic/Retail uses (Code sections 790.114, 890.114 and 217(c) as applicable (“not a part of a medical institution.”)
already sufficient to prevent the impact of these uses in these areas. In the M-1 districts proposals for these uses would be reviewed on a case-by-case basis through a CU, allowing for review of the impact of any proposed project.
a CU, with the exception of PDR-1-G, which does not allow them above 7,500 square feet. Therefore, given the largely industrial, production and light industrial function of these areas, a CU would help determine if they are appropriate above the threshold given the needs and uses of the surrounding areas and the characteristics of the proposed location.
Other (Mission Bay and Redevelopment)
The Mission Bay districts generally allow institutions in the districts zoned for neighborhood commercial and office uses. They are not allowed in the residential, tourist/hotel and open space districts. Other redevelopment districts comprise the Hunter’s Point Shipyard Redevelopment Area.
The Mission Bay districts generally allow medical clinic/office uses in the districts zoned for neighborhood commercial and office uses. They are not allowed in the residential, tourist/hotel, and open space districts. Other redevelopment districts only comprise the Hunter’s Point Shipyard Redevelopment Area.
Exhibit 85 above can help guide discussions about the land use and planning-related effects and locational appropriateness of a particular medical use in a given district or neighborhood but should not be construed as a definitive statement about the overall physical environmental effects of a particular project. The size, design, scope, and location of a proposed project and the surrounding uses; the needs of the neighborhood for particular medical services; as well as the required environmental review and any countervailing public policy considerations will ultimately help determine a project’s particular effects in a given neighborhood. Conversely, the general purpose and character of zoning districts (i.e., industrial, commercial, residential) should also serve as a guide to potential project sponsors when making decisions about where it may be most appropriate to develop a particular project. Displacement of Neighborhood Services While a full market analysis, which would be needed to gauge the competitiveness of medical uses relative to other uses and their institutional location choices, is beyond the scope of this assessment, the focus here is to explore generally the potential effects of future changes in the city’s medical use landscape on other needed neighborhood services, and a general discussion of whether there are certain uses that are most sensitive to displacement.
In addition, the potential for medical uses to displace other uses is difficult to predict and measure without specific development proposals to analyze. Therefore, to inform whether medical uses have the
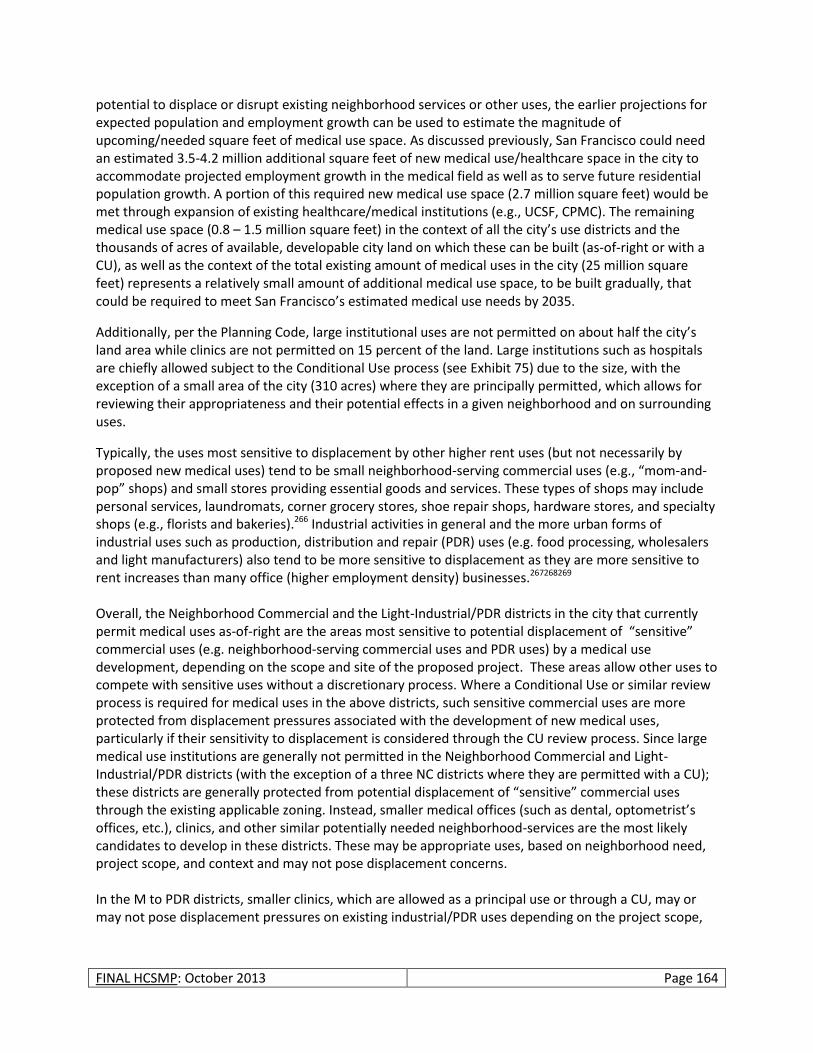
FINAL HCSMP: October 2013 Page 164
potential to displace or disrupt existing neighborhood services or other uses, the earlier projections for expected population and employment growth can be used to estimate the magnitude of upcoming/needed square feet of medical use space. As discussed previously, San Francisco could need an estimated 3.5-4.2 million additional square feet of new medical use/healthcare space in the city to accommodate projected employment growth in the medical field as well as to serve future residential population growth. A portion of this required new medical use space (2.7 million square feet) would be met through expansion of existing healthcare/medical institutions (e.g., UCSF, CPMC). The remaining medical use space (0.8 – 1.5 million square feet) in the context of all the city’s use districts and the thousands of acres of available, developable city land on which these can be built (as-of-right or with a CU), as well as the context of the total existing amount of medical uses in the city (25 million square feet) represents a relatively small amount of additional medical use space, to be built gradually, that could be required to meet San Francisco’s estimated medical use needs by 2035.
Additionally, per the Planning Code, large institutional uses are not permitted on about half the city’s land area while clinics are not permitted on 15 percent of the land. Large institutions such as hospitals are chiefly allowed subject to the Conditional Use process (see Exhibit 75) due to the size, with the exception of a small area of the city (310 acres) where they are principally permitted, which allows for reviewing their appropriateness and their potential effects in a given neighborhood and on surrounding uses.
Typically, the uses most sensitive to displacement by other higher rent uses (but not necessarily by proposed new medical uses) tend to be small neighborhood-serving commercial uses (e.g., “mom-and-pop” shops) and small stores providing essential goods and services. These types of shops may include personal services, laundromats, corner grocery stores, shoe repair shops, hardware stores, and specialty shops (e.g., florists and bakeries).266 Industrial activities in general and the more urban forms of industrial uses such as production, distribution and repair (PDR) uses (e.g. food processing, wholesalers and light manufacturers) also tend to be more sensitive to displacement as they are more sensitive to rent increases than many office (higher employment density) businesses.267268269 Overall, the Neighborhood Commercial and the Light-Industrial/PDR districts in the city that currently permit medical uses as-of-right are the areas most sensitive to potential displacement of “sensitive” commercial uses (e.g. neighborhood-serving commercial uses and PDR uses) by a medical use development, depending on the scope and site of the proposed project. These areas allow other uses to compete with sensitive uses without a discretionary process. Where a Conditional Use or similar review process is required for medical uses in the above districts, such sensitive commercial uses are more protected from displacement pressures associated with the development of new medical uses, particularly if their sensitivity to displacement is considered through the CU review process. Since large medical use institutions are generally not permitted in the Neighborhood Commercial and Light-Industrial/PDR districts (with the exception of a three NC districts where they are permitted with a CU); these districts are generally protected from potential displacement of “sensitive” commercial uses through the existing applicable zoning. Instead, smaller medical offices (such as dental, optometrist’s offices, etc.), clinics, and other similar potentially needed neighborhood-services are the most likely candidates to develop in these districts. These may be appropriate uses, based on neighborhood need, project scope, and context and may not pose displacement concerns. In the M to PDR districts, smaller clinics, which are allowed as a principal use or through a CU, may or may not pose displacement pressures on existing industrial/PDR uses depending on the project scope,
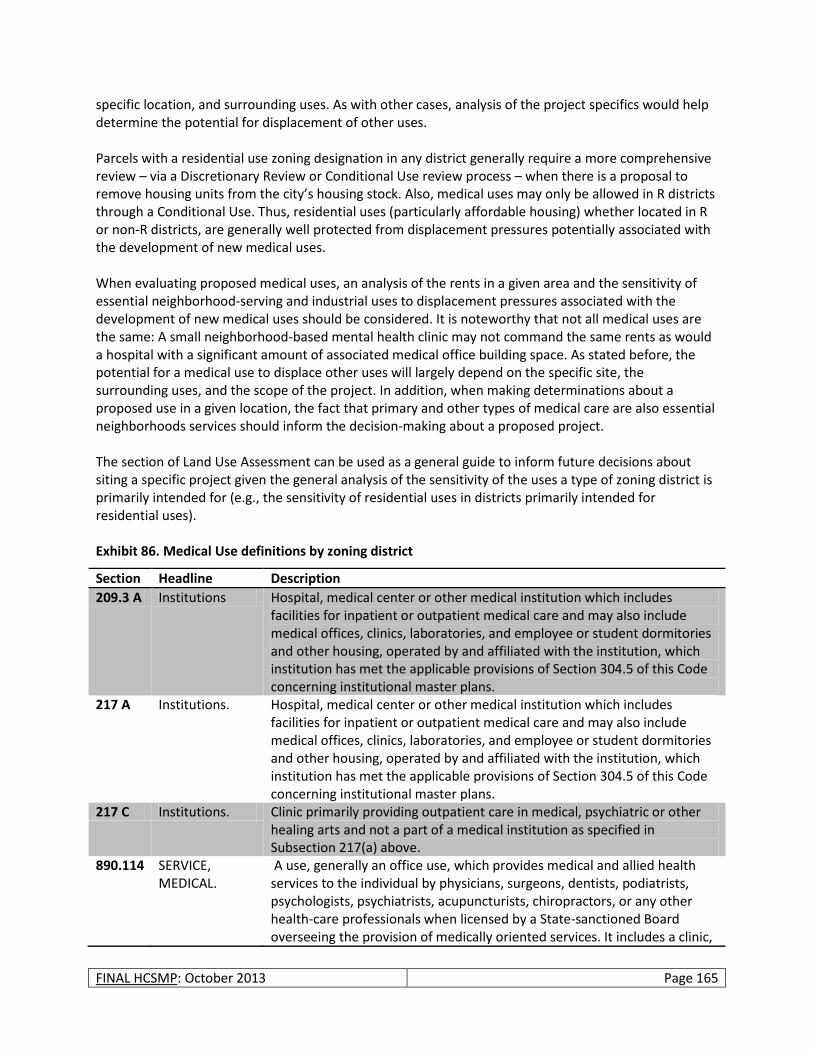
FINAL HCSMP: October 2013 Page 165
specific location, and surrounding uses. As with other cases, analysis of the project specifics would help determine the potential for displacement of other uses. Parcels with a residential use zoning designation in any district generally require a more comprehensive review – via a Discretionary Review or Conditional Use review process – when there is a proposal to remove housing units from the city’s housing stock. Also, medical uses may only be allowed in R districts through a Conditional Use. Thus, residential uses (particularly affordable housing) whether located in R or non-R districts, are generally well protected from displacement pressures potentially associated with the development of new medical uses. When evaluating proposed medical uses, an analysis of the rents in a given area and the sensitivity of essential neighborhood-serving and industrial uses to displacement pressures associated with the development of new medical uses should be considered. It is noteworthy that not all medical uses are the same: A small neighborhood-based mental health clinic may not command the same rents as would a hospital with a significant amount of associated medical office building space. As stated before, the potential for a medical use to displace other uses will largely depend on the specific site, the surrounding uses, and the scope of the project. In addition, when making determinations about a proposed use in a given location, the fact that primary and other types of medical care are also essential neighborhoods services should inform the decision-making about a proposed project. The section of Land Use Assessment can be used as a general guide to inform future decisions about siting a specific project given the general analysis of the sensitivity of the uses a type of zoning district is primarily intended for (e.g., the sensitivity of residential uses in districts primarily intended for residential uses). Exhibit 86. Medical Use definitions by zoning district
Section Headline Description
209.3 A Institutions Hospital, medical center or other medical institution which includes facilities for inpatient or outpatient medical care and may also include medical offices, clinics, laboratories, and employee or student dormitories and other housing, operated by and affiliated with the institution, which institution has met the applicable provisions of Section 304.5 of this Code concerning institutional master plans.
217 A Institutions. Hospital, medical center or other medical institution which includes facilities for inpatient or outpatient medical care and may also include medical offices, clinics, laboratories, and employee or student dormitories and other housing, operated by and affiliated with the institution, which institution has met the applicable provisions of Section 304.5 of this Code concerning institutional master plans.
217 C Institutions. Clinic primarily providing outpatient care in medical, psychiatric or other healing arts and not a part of a medical institution as specified in Subsection 217(a) above.
890.114 SERVICE, MEDICAL.
A use, generally an office use, which provides medical and allied health services to the individual by physicians, surgeons, dentists, podiatrists, psychologists, psychiatrists, acupuncturists, chiropractors, or any other health-care professionals when licensed by a State-sanctioned Board overseeing the provision of medically oriented services. It includes a clinic,
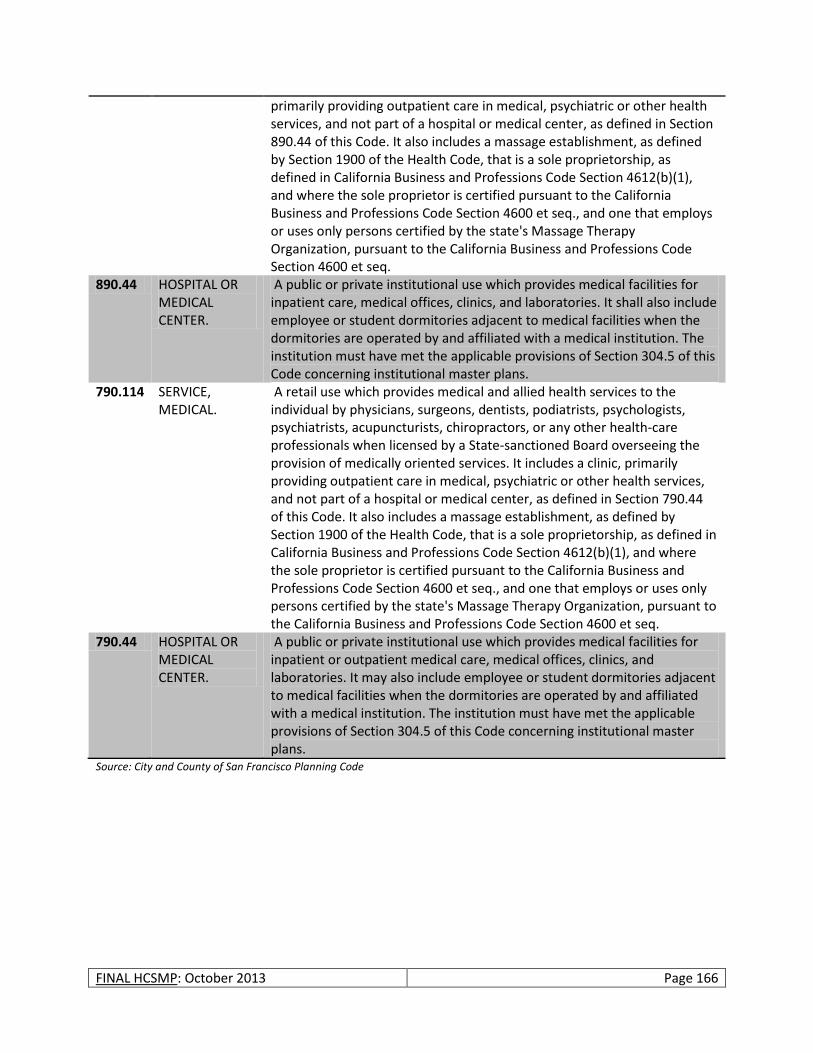
FINAL HCSMP: October 2013 Page 166
primarily providing outpatient care in medical, psychiatric or other health services, and not part of a hospital or medical center, as defined in Section 890.44 of this Code. It also includes a massage establishment, as defined by Section 1900 of the Health Code, that is a sole proprietorship, as defined in California Business and Professions Code Section 4612(b)(1), and where the sole proprietor is certified pursuant to the California Business and Professions Code Section 4600 et seq., and one that employs or uses only persons certified by the state's Massage Therapy Organization, pursuant to the California Business and Professions Code Section 4600 et seq.
890.44 HOSPITAL OR MEDICAL CENTER.
A public or private institutional use which provides medical facilities for inpatient care, medical offices, clinics, and laboratories. It shall also include employee or student dormitories adjacent to medical facilities when the dormitories are operated by and affiliated with a medical institution. The institution must have met the applicable provisions of Section 304.5 of this Code concerning institutional master plans.
790.114 SERVICE, MEDICAL.
A retail use which provides medical and allied health services to the individual by physicians, surgeons, dentists, podiatrists, psychologists, psychiatrists, acupuncturists, chiropractors, or any other health-care professionals when licensed by a State-sanctioned Board overseeing the provision of medically oriented services. It includes a clinic, primarily providing outpatient care in medical, psychiatric or other health services, and not part of a hospital or medical center, as defined in Section 790.44 of this Code. It also includes a massage establishment, as defined by Section 1900 of the Health Code, that is a sole proprietorship, as defined in California Business and Professions Code Section 4612(b)(1), and where the sole proprietor is certified pursuant to the California Business and Professions Code Section 4600 et seq., and one that employs or uses only persons certified by the state's Massage Therapy Organization, pursuant to the California Business and Professions Code Section 4600 et seq.
790.44 HOSPITAL OR MEDICAL CENTER.
A public or private institutional use which provides medical facilities for inpatient or outpatient medical care, medical offices, clinics, and laboratories. It may also include employee or student dormitories adjacent to medical facilities when the dormitories are operated by and affiliated with a medical institution. The institution must have met the applicable provisions of Section 304.5 of this Code concerning institutional master plans.
Source: City and County of San Francisco Planning Code
FINAL HCSMP: October 2013 Page 167
Historical Role Assessment
The HCSMP Ordinance provides that, in the Historical Role Assessment, DPH “shall take into consideration the historical role played, if any, by medical uses in the City to provide medical services to historically underserved groups, such as minority or low-income communities.” San Francisco has both a diverse population and a robust network of providers with a long history of serving specific segments of the population in a culturally and linguistically competent manner. In terms of the city’s racial and ethnic diversity, according to the 2010 US Census:
33.3 percent of residents are Asian, up from 30.8 percent in 2000
15.1 percent identify as Hispanic or Latino (of any race), up from 14.1 percent in 2000
6.1 percent are Black/African-American, down from 7.8 percent in 2000
6.6 percent identify as “some other race,” up from 6.5 percent in 2000
4.7 percent consider themselves two or more races, up from 4.3 percent in 2000
0.5 percent are American Indian or Alaska Native, up from 0.4 percent in 2000
0.4 percent identify as Native Hawaiian or Pacific Islander, down from 0.5 percent in 2000 In terms of immigration status and language spoken at home, San Francisco is similarly diverse. According to the 2010 American Community Survey (ACS), although a majority of San Francisco residents are native born US citizens (64.5 percent), this is significantly lower than California’s 72.8 percent. This varies widely by neighborhood. DPH’s Sustainable Communities Index (SCI) estimates the range of foreign-born residents from 11.6 percent in the Presidio to 75.4 percent in Chinatown. Linguistically, the 2010 ACS reports that a slight majority (55.5 percent) of San Franciscans speaks only English at home, and among those who do not exclusively speak English at home, 46.4 percent speak English “very well” and 53.6 percent speak English “less than very well.” Among those who speak a language other than English at home, 18.8 percent speak a Chinese dialect and 11.5 percent speak Spanish or Spanish Creole. Socioeconomically, San Francisco is diverse as well. In 2010, the HDMT estimated that the median annual household income in the city was $70,040 with a range from $17,630 in Chinatown to $162,903 in Seacliff. The 2010 ACS found 12.5 percent of residents living below poverty, with nearly a quarter (24.5 percent) of Blacks/African Americans under the poverty level. By neighborhood, the HDMT found a range from 11 percent of Marina residents living below 200 percent of poverty to 68 percent of Chinatown residents under that same level. Although more difficult to estimate, San Francisco also has diversity of sexual orientation and gender identification. A 2006 study by the UCLA School of Law based on ACS data estimated that of large US cities, San Francisco had the highest percentage (15.4 percent) and fourth highest number (94,234) of gay, lesbian, and bisexual identified residents.270 Even harder to estimate is the transgender population of the city. Estimates vary widely based both on the definition of transgender, which range from gender dysphoria to individuals granted legal change of name or gender status, and on individuals transitioning from male to female(MtF) or from female to male (FtM). A survey of six studies in European countries between 1993 and 2007 found the population prevalence to range from 1:7,400 for MtF with gender dysphoria to 1:104,000 for FtM granted legal name change or gender status.271
FINAL HCSMP: October 2013 Page 168
In response to this diversity, an array of programs and facilities has been developed over time to respond to unmet, underserved needs in culturally and linguistically competent ways. The organizations providing these services, both medical and non-medical, have played a critical role in San Francisco’s health care delivery system.
FINAL HCSMP: October 2013 Page 169
HCSMP RECOMMENDATIONS AND GUIDELINES
Overview
Pursuant to San Francisco Ordinance No. 300-10, the “Health Care Services Master Plan will provide the Health Commission, the Planning Commission and Board of Supervisors with information and public policy recommendations to guide their decisions to promote the City's land use and policy goals developed in such Plan, such as distribution and access to health care services.” As such, the following HCSMP recommendations and guidelines are intended to provide a dynamic and inspiring roadmap for bettering health and health services, focus on improving access to care, particularly for San Francisco’s vulnerable populations, including low-income areas and geographic areas with high rates of health disparities (e.g., Bayview-Hunters Point, Tenderloin, Western Addition, Excelsior). These recommendations and guidelines were largely developed by the HCSMP Task Force and not only guide land use decisions and inform the siting and scope of health care facilities and services, but also reach far beyond bricks and mortar to acknowledge that health and wellness result from the complex integration of services, community partnerships, and neighborhood characteristics. All recommendations and guidelines in this HCSMP address important health policy goals for San Francisco. Certain guidelines are designated in this HCSMP as “Eligible for Incentives.” Guidelines with this designation are those that can be addressed by individual development projects that will be subject to a Consistency Determination and will address specific HCSMP-identified unmet health care needs. Development projects that choose to address these designated guidelines would be recommended for incentives, such as expedited project review.
HCSMP Recommendations Framework
Alignment with Community Health Improvement Plan (CHIP)
Overview
The HCSMP recommendations framework is aligned with the priorities of San Francisco’s citywide Community Health Improvement Plan (CHIP) finalized in December 2012 and adds HCSMP-specific recommendations and guidelines. The CHIP is an action-oriented three- to five-year plan outlining three health priorities for San Francisco and provides guidance on how these priorities will be addressed; the work of the HCSMP Task Force heavily informed the CHIP’s development as illustrated below. For more information on the CHIP, including access to the full plan as well as a description of key partners and process, please visit the SFDPH website (www.sfdph.org).
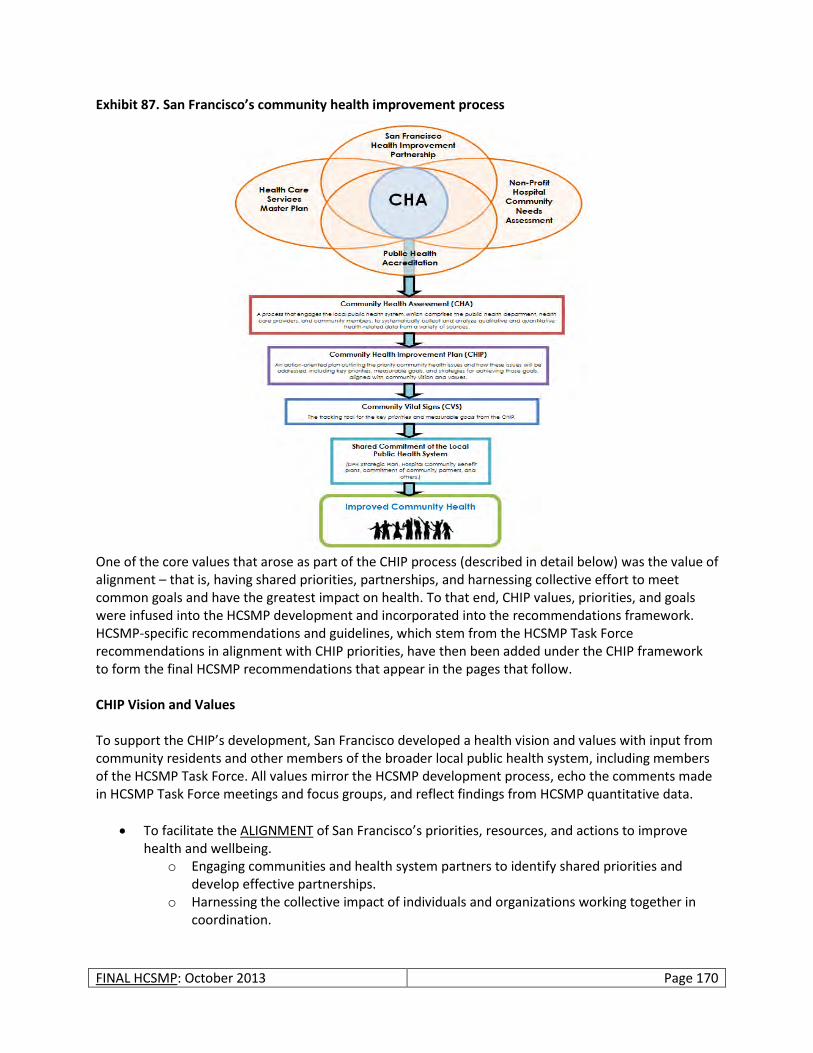
FINAL HCSMP: October 2013 Page 170
Exhibit 87. San Francisco’s community health improvement process
One of the core values that arose as part of the CHIP process (described in detail below) was the value of alignment – that is, having shared priorities, partnerships, and harnessing collective effort to meet common goals and have the greatest impact on health. To that end, CHIP values, priorities, and goals were infused into the HCSMP development and incorporated into the recommendations framework. HCSMP-specific recommendations and guidelines, which stem from the HCSMP Task Force recommendations in alignment with CHIP priorities, have then been added under the CHIP framework to form the final HCSMP recommendations that appear in the pages that follow.
CHIP Vision and Values To support the CHIP’s development, San Francisco developed a health vision and values with input from community residents and other members of the broader local public health system, including members of the HCSMP Task Force. All values mirror the HCSMP development process, echo the comments made in HCSMP Task Force meetings and focus groups, and reflect findings from HCSMP quantitative data.
To facilitate the ALIGNMENT of San Francisco’s priorities, resources, and actions to improve health and wellbeing.
o Engaging communities and health system partners to identify shared priorities and develop effective partnerships.
o Harnessing the collective impact of individuals and organizations working together in coordination.
FINAL HCSMP: October 2013 Page 171
To promote COMMUNITY CONNECTIONS that support health and wellbeing. o Getting to know each other and looking out for one another. o Increasing communication and collaboration among individuals and organizations within
communities.
To ensure that HEALTH EQUITY is addressed throughout program planning and service delivery. o Reducing disparities in health access and health outcomes for San Francisco’s diverse
communities. o Partnering with those most affected by health disparities to create innovative and
impactful health actions. San Francisco’s Health Priorities San Francisco’s CHIP highlights three health priorities for action:
Ensure Safe + Healthy Living Environments
Increase Healthy Eating and Physical Activity
Increase Access to High Quality Health Care + Services In the pages that follow, SFDPH and Planning present HCSMP recommendations and guidelines alongside the CHIP priority with which they best align. Please note, in the next section, health priorities are numbered. However, these numbers do not reflect a hierarchy among the priorities, but rather are included for reference purposes only. These three priorities are considered to be equally important for San Francisco. Because of the HCSMP’s focus on medical uses in San Francisco, the HCSMP recommendations fall primarily within the third priority of increasing access to high quality health care and services.
HCSMP Recommendations + Guidelines by San Francisco Health Priority
San Francisco Health Priority 1: Ensure Safe + Healthy Living Environments
Despite being one of the wealthiest and most socially progressive cities in the country, not everyone in San Francisco has a safe and healthy place to live. Some neighborhoods in San Francisco, for example, have great access to parks, public transit, grocery stores, and other resources that benefit health and wellness. Other neighborhoods – often poor communities of color – are more likely to be impacted by fast food and alcohol outlets, freeways, industrial pollutants, and other factors that contribute to high rates of disease, death, injury, and violence. As such, San Francisco’s CHIP identifies three goals designed to ensure that all San Franciscans have a safe and healthy place to live:
Improve safety and crime prevention.
Reduce exposure to environmental hazards.
Foster safe, green, “active” public spaces. The HCSMP recommendations and guidelines that follow align with CHIP Priority 1, “Ensure Safe + Healthy Living Environments.”
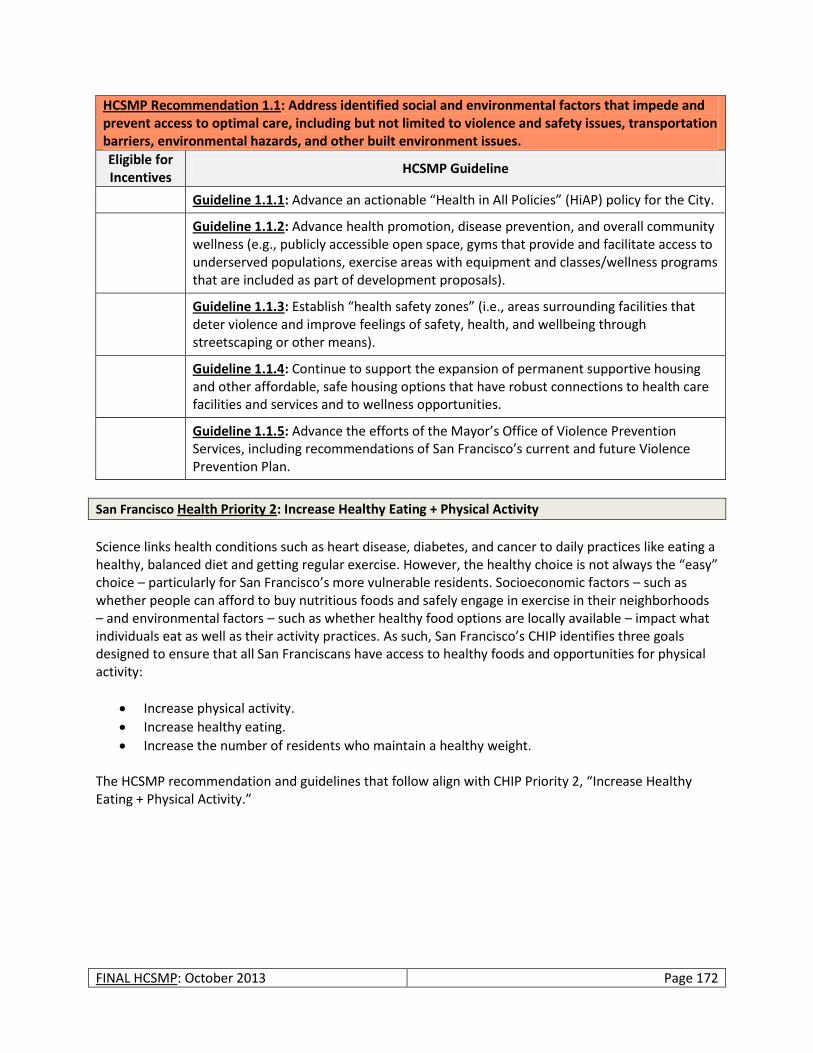
FINAL HCSMP: October 2013 Page 172
HCSMP Recommendation 1.1: Address identified social and environmental factors that impede and prevent access to optimal care, including but not limited to violence and safety issues, transportation barriers, environmental hazards, and other built environment issues.
Eligible for Incentives
HCSMP Guideline
Guideline 1.1.1: Advance an actionable “Health in All Policies” (HiAP) policy for the City.
Guideline 1.1.2: Advance health promotion, disease prevention, and overall community wellness (e.g., publicly accessible open space, gyms that provide and facilitate access to underserved populations, exercise areas with equipment and classes/wellness programs that are included as part of development proposals).
Guideline 1.1.3: Establish “health safety zones” (i.e., areas surrounding facilities that deter violence and improve feelings of safety, health, and wellbeing through streetscaping or other means).
Guideline 1.1.4: Continue to support the expansion of permanent supportive housing and other affordable, safe housing options that have robust connections to health care facilities and services and to wellness opportunities.
Guideline 1.1.5: Advance the efforts of the Mayor’s Office of Violence Prevention Services, including recommendations of San Francisco’s current and future Violence Prevention Plan.
San Francisco Health Priority 2: Increase Healthy Eating + Physical Activity
Science links health conditions such as heart disease, diabetes, and cancer to daily practices like eating a healthy, balanced diet and getting regular exercise. However, the healthy choice is not always the “easy” choice – particularly for San Francisco’s more vulnerable residents. Socioeconomic factors – such as whether people can afford to buy nutritious foods and safely engage in exercise in their neighborhoods – and environmental factors – such as whether healthy food options are locally available – impact what individuals eat as well as their activity practices. As such, San Francisco’s CHIP identifies three goals designed to ensure that all San Franciscans have access to healthy foods and opportunities for physical activity:
Increase physical activity.
Increase healthy eating.
Increase the number of residents who maintain a healthy weight. The HCSMP recommendation and guidelines that follow align with CHIP Priority 2, “Increase Healthy Eating + Physical Activity.”

FINAL HCSMP: October 2013 Page 173
HCSMP Recommendation 2.1: Support “healthy” urban growth.
Eligible for Incentives
HCSMP Guideline
Guideline 2.1.1: Support the expansion of networks of open spaces, small urban agriculture, and physical recreation facilities, including the network of safe walking and biking facilities.
Guideline 2.1.2: Review the impact of large-scale residential and mixed-use development projects – and/or expected areas of new growth – on the potential impact on neighborhood residents’ future health care needs and, when feasible, such projects should address service connectivity. Projects serving seniors, persons with disabilities, or other populations with limited mobility options, for example, should employ a range of transportation demand management strategies (e.g., shuttle service, gurney service) to address the project’s impact and utility for the community.
Guideline 2.1.3: Encourage residential and mixed-use projects to incorporate healthy design – design encouraging walking and safe pedestrian environments.
San Francisco Health Priority 3: Increase Access to High Quality Health Care + Services
As the HCSMP highlights, access to comprehensive, high quality health care and other services is essential in preventing illness, promoting wellness, and fostering vibrant communities. While San Francisco often outperforms the State and other California counties in terms of health care resources like primary care doctors, availability does not always equal accessibility; many of San Francisco’s more vulnerable residents – ranging from low-income persons to non-native English speakers seeking culturally competent care in their primary language – struggle to get the services they need. As such, San Francisco’s CHIP identifies four goals designed to ensure that all San Franciscans have access to the health care and other services they need to be healthy and well:
Improve integration and coordination of services across the continuum of care.
Increase the connection of individuals to the health services they need.
Ensure that services are culturally and linguistically appropriate.
Ensure that San Franciscans have access to a health care home. The HCSMP recommendations and guidelines that follow align with CHIP Priority 3, “Increase Access to High Quality Health Care + Services.”

FINAL HCSMP: October 2013 Page 174
HCSMP Recommendation 3.1: Increase access to appropriate care for San Francisco’s vulnerable populations.
Eligible for Incentives
HCSMP Guideline
Guideline 3.1.1: Increase the availability and accessibility of primary care in low-income areas (i.e., areas where the percentage of low-income residents – defined as individuals living below 200% of the Census Poverty Threshold272 – is greater than the San Francisco average) areas with documented high rates of health disparities (e.g., areas in which residents face the highest rates of morbidity or premature mortality) and/or areas with limited existing health care resources.
Guideline 3.1.2: Increase the availability and accessibility of culturally competent primary care among vulnerable subpopulations including but not limited to Medi-Cal beneficiaries, uninsured residents, limited English speakers, and populations with documented high rates of health disparities.
Guideline 3.1.3: Increase the availability and accessibility of prenatal care within neighborhoods with documented high rates of related health disparities.
Guideline 3.1.4: Increase the availability and accessibility of prenatal care for subpopulations with documented high rates of related health disparities including but not limited to Black/African American residents.
Guideline 3.1.5: Increase the availability and accessibility of dental care in low-income areas (i.e., areas where the percentage of low-income residents – defined as individuals living below 200% of the Census Poverty Threshold273 – is greater than the San Francisco average) and areas with documented high rates of health disparities (e.g., areas in which residents face the highest rates of morbidity or premature mortality).
Guideline 3.1.6: Increase the availability and accessibility of dental care among vulnerable subpopulations including but not limited to Medi-Cal beneficiaries, uninsured residents, limited English speakers, and populations with documented high rates of health disparities.
Guideline 3.1.7: Complete the rezoning of the Bayview Health Node, as envisioned by community residents in the adopted Bayview Redevelopment Plan.
Guideline 3.1.8: Increase the supply of culturally competent providers serving low-income and uninsured populations, which may include but is not limited to supporting projects that can demonstrate through metrics that they have served and/or plan to serve a significant proportion of existing/new Medi-Cal and/or uninsured patients, particularly in underserved neighborhoods.
Guideline 3.1.9: Advocate for the extension of the Medicaid primary care physician reimbursement rate established under Health Reform beyond 2014 to attract and retain physician participation in the Medi-Cal program.
Guideline 3.1.10: Promote projects that demonstrate the ability and commitment to deliver and facilitate access to specialty care for underserved populations (e.g., through transportation assistance, mobile services, and/or other innovative mechanisms).
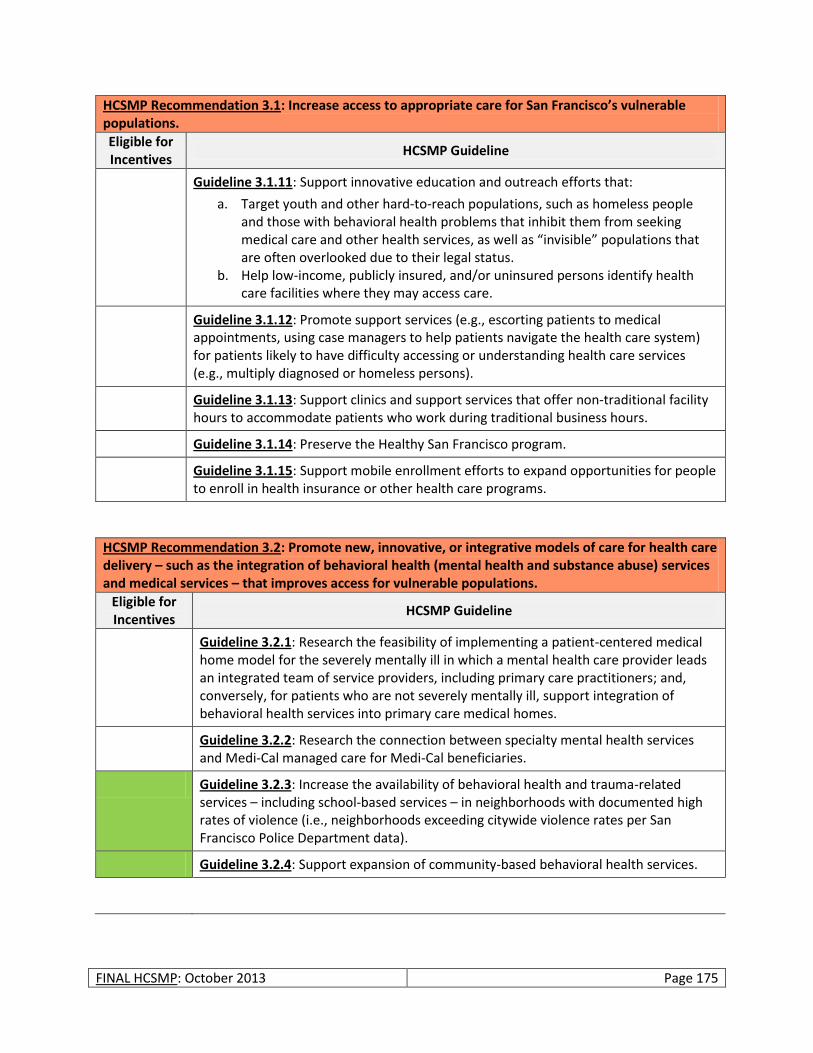
FINAL HCSMP: October 2013 Page 175
HCSMP Recommendation 3.1: Increase access to appropriate care for San Francisco’s vulnerable populations.
Eligible for Incentives
HCSMP Guideline
Guideline 3.1.11: Support innovative education and outreach efforts that:
a. Target youth and other hard-to-reach populations, such as homeless people and those with behavioral health problems that inhibit them from seeking medical care and other health services, as well as “invisible” populations that are often overlooked due to their legal status.
b. Help low-income, publicly insured, and/or uninsured persons identify health care facilities where they may access care.
Guideline 3.1.12: Promote support services (e.g., escorting patients to medical appointments, using case managers to help patients navigate the health care system) for patients likely to have difficulty accessing or understanding health care services (e.g., multiply diagnosed or homeless persons).
Guideline 3.1.13: Support clinics and support services that offer non-traditional facility hours to accommodate patients who work during traditional business hours.
Guideline 3.1.14: Preserve the Healthy San Francisco program.
Guideline 3.1.15: Support mobile enrollment efforts to expand opportunities for people to enroll in health insurance or other health care programs.
HCSMP Recommendation 3.2: Promote new, innovative, or integrative models of care for health care delivery – such as the integration of behavioral health (mental health and substance abuse) services and medical services – that improves access for vulnerable populations.
Eligible for Incentives
HCSMP Guideline
Guideline 3.2.1: Research the feasibility of implementing a patient-centered medical home model for the severely mentally ill in which a mental health care provider leads an integrated team of service providers, including primary care practitioners; and, conversely, for patients who are not severely mentally ill, support integration of behavioral health services into primary care medical homes.
Guideline 3.2.2: Research the connection between specialty mental health services and Medi-Cal managed care for Medi-Cal beneficiaries.
Guideline 3.2.3: Increase the availability of behavioral health and trauma-related services – including school-based services – in neighborhoods with documented high rates of violence (i.e., neighborhoods exceeding citywide violence rates per San Francisco Police Department data).
Guideline 3.2.4: Support expansion of community-based behavioral health services.
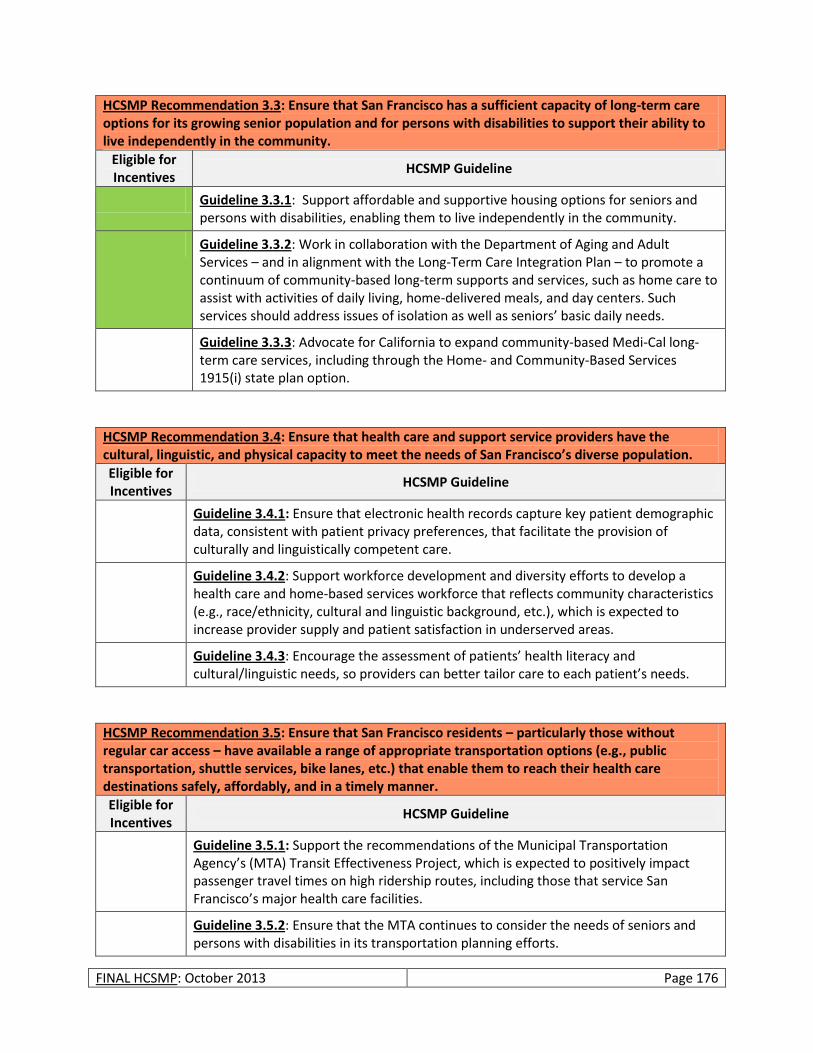
FINAL HCSMP: October 2013 Page 176
HCSMP Recommendation 3.3: Ensure that San Francisco has a sufficient capacity of long-term care options for its growing senior population and for persons with disabilities to support their ability to live independently in the community.
Eligible for Incentives
HCSMP Guideline
Guideline 3.3.1: Support affordable and supportive housing options for seniors and persons with disabilities, enabling them to live independently in the community.
Guideline 3.3.2: Work in collaboration with the Department of Aging and Adult Services – and in alignment with the Long-Term Care Integration Plan – to promote a continuum of community-based long-term supports and services, such as home care to assist with activities of daily living, home-delivered meals, and day centers. Such services should address issues of isolation as well as seniors’ basic daily needs.
Guideline 3.3.3: Advocate for California to expand community-based Medi-Cal long-term care services, including through the Home- and Community-Based Services 1915(i) state plan option.
HCSMP Recommendation 3.4: Ensure that health care and support service providers have the cultural, linguistic, and physical capacity to meet the needs of San Francisco’s diverse population.
Eligible for Incentives
HCSMP Guideline
Guideline 3.4.1: Ensure that electronic health records capture key patient demographic data, consistent with patient privacy preferences, that facilitate the provision of culturally and linguistically competent care.
Guideline 3.4.2: Support workforce development and diversity efforts to develop a health care and home-based services workforce that reflects community characteristics (e.g., race/ethnicity, cultural and linguistic background, etc.), which is expected to increase provider supply and patient satisfaction in underserved areas.
Guideline 3.4.3: Encourage the assessment of patients’ health literacy and cultural/linguistic needs, so providers can better tailor care to each patient’s needs.
HCSMP Recommendation 3.5: Ensure that San Francisco residents – particularly those without regular car access – have available a range of appropriate transportation options (e.g., public transportation, shuttle services, bike lanes, etc.) that enable them to reach their health care destinations safely, affordably, and in a timely manner.
Eligible for Incentives
HCSMP Guideline
Guideline 3.5.1: Support the recommendations of the Municipal Transportation Agency’s (MTA) Transit Effectiveness Project, which is expected to positively impact passenger travel times on high ridership routes, including those that service San Francisco’s major health care facilities.
Guideline 3.5.2: Ensure that the MTA continues to consider the needs of seniors and persons with disabilities in its transportation planning efforts.
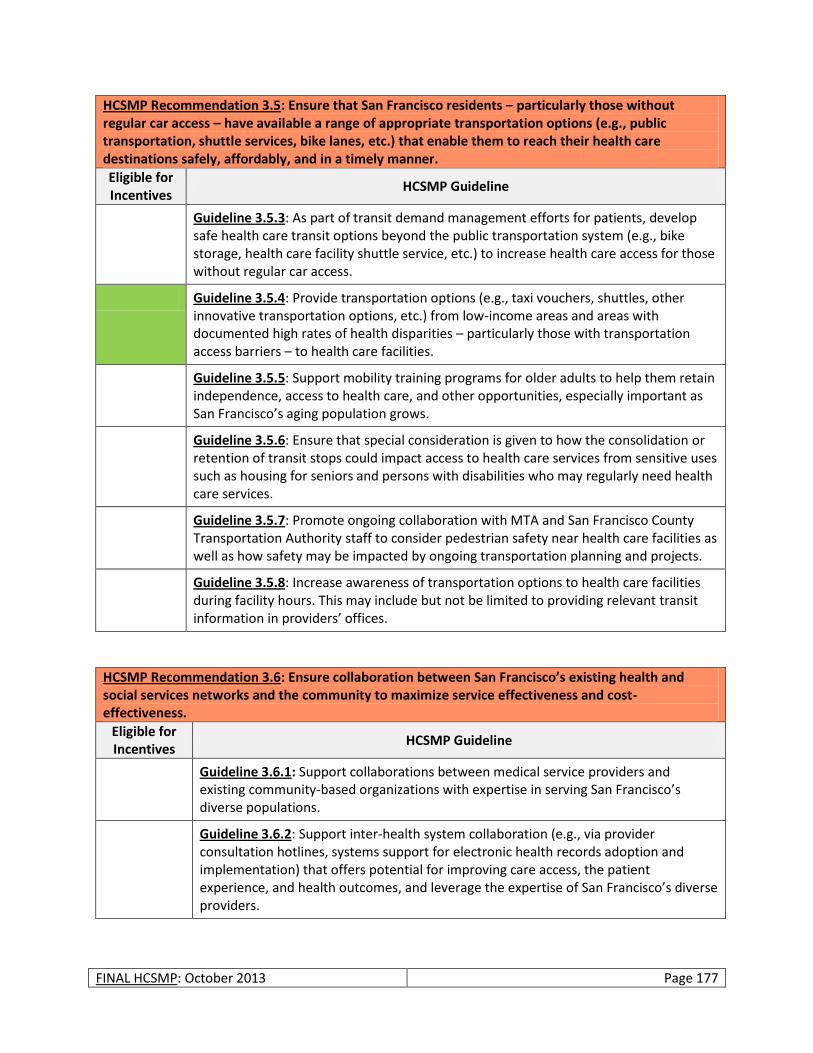
FINAL HCSMP: October 2013 Page 177
HCSMP Recommendation 3.5: Ensure that San Francisco residents – particularly those without regular car access – have available a range of appropriate transportation options (e.g., public transportation, shuttle services, bike lanes, etc.) that enable them to reach their health care destinations safely, affordably, and in a timely manner.
Eligible for Incentives
HCSMP Guideline
Guideline 3.5.3: As part of transit demand management efforts for patients, develop safe health care transit options beyond the public transportation system (e.g., bike storage, health care facility shuttle service, etc.) to increase health care access for those without regular car access.
Guideline 3.5.4: Provide transportation options (e.g., taxi vouchers, shuttles, other innovative transportation options, etc.) from low-income areas and areas with documented high rates of health disparities – particularly those with transportation access barriers – to health care facilities.
Guideline 3.5.5: Support mobility training programs for older adults to help them retain independence, access to health care, and other opportunities, especially important as San Francisco’s aging population grows.
Guideline 3.5.6: Ensure that special consideration is given to how the consolidation or retention of transit stops could impact access to health care services from sensitive uses such as housing for seniors and persons with disabilities who may regularly need health care services.
Guideline 3.5.7: Promote ongoing collaboration with MTA and San Francisco County Transportation Authority staff to consider pedestrian safety near health care facilities as well as how safety may be impacted by ongoing transportation planning and projects.
Guideline 3.5.8: Increase awareness of transportation options to health care facilities during facility hours. This may include but not be limited to providing relevant transit information in providers’ offices.
HCSMP Recommendation 3.6: Ensure collaboration between San Francisco’s existing health and social services networks and the community to maximize service effectiveness and cost-effectiveness.
Eligible for Incentives
HCSMP Guideline
Guideline 3.6.1: Support collaborations between medical service providers and existing community-based organizations with expertise in serving San Francisco’s diverse populations.
Guideline 3.6.2: Support inter-health system collaboration (e.g., via provider consultation hotlines, systems support for electronic health records adoption and implementation) that offers potential for improving care access, the patient experience, and health outcomes, and leverage the expertise of San Francisco’s diverse providers.
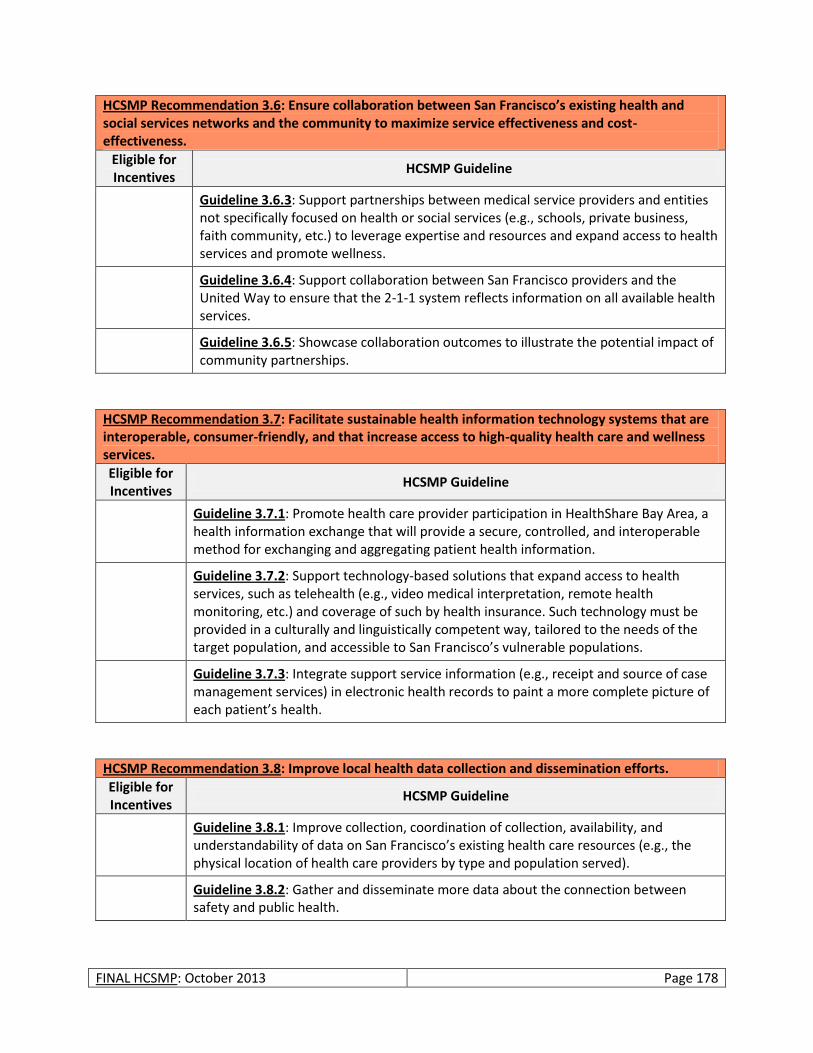
FINAL HCSMP: October 2013 Page 178
HCSMP Recommendation 3.6: Ensure collaboration between San Francisco’s existing health and social services networks and the community to maximize service effectiveness and cost-effectiveness.
Eligible for Incentives
HCSMP Guideline
Guideline 3.6.3: Support partnerships between medical service providers and entities not specifically focused on health or social services (e.g., schools, private business, faith community, etc.) to leverage expertise and resources and expand access to health services and promote wellness.
Guideline 3.6.4: Support collaboration between San Francisco providers and the United Way to ensure that the 2-1-1 system reflects information on all available health services.
Guideline 3.6.5: Showcase collaboration outcomes to illustrate the potential impact of community partnerships.
HCSMP Recommendation 3.7: Facilitate sustainable health information technology systems that are interoperable, consumer-friendly, and that increase access to high-quality health care and wellness services.
Eligible for Incentives
HCSMP Guideline
Guideline 3.7.1: Promote health care provider participation in HealthShare Bay Area, a health information exchange that will provide a secure, controlled, and interoperable method for exchanging and aggregating patient health information.
Guideline 3.7.2: Support technology-based solutions that expand access to health services, such as telehealth (e.g., video medical interpretation, remote health monitoring, etc.) and coverage of such by health insurance. Such technology must be provided in a culturally and linguistically competent way, tailored to the needs of the target population, and accessible to San Francisco’s vulnerable populations.
Guideline 3.7.3: Integrate support service information (e.g., receipt and source of case management services) in electronic health records to paint a more complete picture of each patient’s health.
HCSMP Recommendation 3.8: Improve local health data collection and dissemination efforts.
Eligible for Incentives
HCSMP Guideline
Guideline 3.8.1: Improve collection, coordination of collection, availability, and understandability of data on San Francisco’s existing health care resources (e.g., the physical location of health care providers by type and population served).
Guideline 3.8.2: Gather and disseminate more data about the connection between safety and public health.
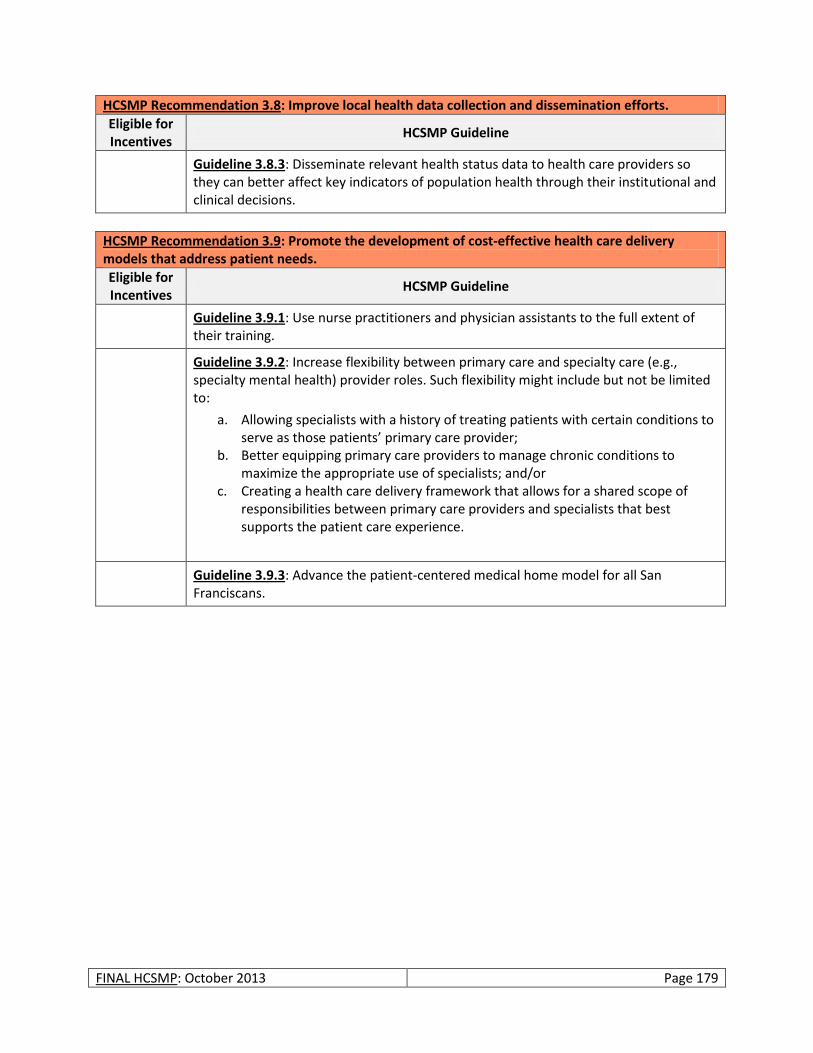
FINAL HCSMP: October 2013 Page 179
HCSMP Recommendation 3.8: Improve local health data collection and dissemination efforts.
Eligible for Incentives
HCSMP Guideline
Guideline 3.8.3: Disseminate relevant health status data to health care providers so they can better affect key indicators of population health through their institutional and clinical decisions.
HCSMP Recommendation 3.9: Promote the development of cost-effective health care delivery models that address patient needs.
Eligible for Incentives
HCSMP Guideline
Guideline 3.9.1: Use nurse practitioners and physician assistants to the full extent of their training.
Guideline 3.9.2: Increase flexibility between primary care and specialty care (e.g., specialty mental health) provider roles. Such flexibility might include but not be limited to:
a. Allowing specialists with a history of treating patients with certain conditions to serve as those patients’ primary care provider;
b. Better equipping primary care providers to manage chronic conditions to maximize the appropriate use of specialists; and/or
c. Creating a health care delivery framework that allows for a shared scope of responsibilities between primary care providers and specialists that best supports the patient care experience.
Guideline 3.9.3: Advance the patient-centered medical home model for all San Franciscans.
FINAL HCSMP: October 2013 Page 180
MOVING FORWARD
HCSMP Approval Process
San Francisco Ordinance No. 300-10 outlines the process by which to finalize the HCSMP and secure plan approval from the Board of Supervisors. Specifically:
1. Upon completion of a draft HCSMP, SFDPH will provide notice of a written public comment period to last no less than 30 days. The full draft of the HCSMP will be available during that time, and comments will be reviewed by both SFDPH and Planning.
2. Upon the close of the written public comment period, the San Francisco Health and Planning Commissions will hold a joint public hearing on the HCSMP; the joint hearing date may not be more than 30 days after the close of the public written comment period. Should either body request significant changes to the draft, the Health and Planning Commissions must hold additional hearings to review such changes, either together or separately.
3. The Health and Planning Commission may recommend approval or disapproval of the HCSMP. Following this recommendation, the Board of Supervisors will schedule a hearing to consider a resolution to adopt the HCSMP.
SFDPH and Planning anticipate that the HCSMP will come before the Board of Supervisors for possible approval in Spring 2014.
Update Process and Timeline
San Francisco Ordinance No. 300-10 mandates that SFDPH and Planning update the HCSMP every three years, including a summary of changes since the HCSMP last received approval. Please note that SFDPH and Planning interpret this requirement as updating the HCSMP within three years of the date on which the Board of Supervisors last approved the HCSMP. If SFDPH and Planning are unable to update the HCSMP within three years, they must seek an extension of time from the Board of Supervisors. Upon completion of the update, the Health Commission, the Planning Commission, and the Board of Supervisors must review and approve or disapprove of the revised HCSMP per the process outlined in the “HCSMP Approval Process” section of this document.
HCSMP as a Health Policy Resource
The Health Commission views this HCSMP not only as a document that helps to create a stronger link between land use and health, but as a roadmap for broader health policy decision making. These recommendations and guidelines are useful to not only guide land use decisions and inform the siting and scope of health care facilities and services, but also reach far beyond bricks and mortar to acknowledge that health and wellness result from the complex integration of services, community partnerships, and neighborhood characteristics. This HCSMP will inform and support broader citywide strategic and health improvement planning efforts, particularly for San Francisco’s vulnerable populations. The Health Commission intends this to be a living document that is regularly updated, monitored, and utilized to inform health policy decisions for San Francisco.
FINAL HCSMP: October 2013 Page 181
Key Items for Future Consideration
The current HCSMP represents SFDPH and Planning’s first and best effort to respond to community health care needs in accordance with San Francisco Ordinance No. 300-10. While this HCSMP is a comprehensive reflection of available quantitative and qualitative data – including extensive public feedback as captured through HCSMP Task Force meetings and focus groups – future iterations might consider the following items for future inclusion:
Updates to the HCSMP might explore the “geographic sensitivity” of specific services and how the placement of various services impacts health access and outcomes. For example, people may benefit from having certain types of health services available in their neighborhood (e.g., primary care, prenatal care), but other types of health services (e.g., specialty care) may be more appropriately provided in centralized locations due to the need for special equipment, proximity to other specialists or sub-specialists, etc.
SFDPH is conducting its first community health survey in 2013. Future version of the survey could incorporate questions to further understand health care access and access barriers experienced by San Franciscans and addressed in this HCSMP, including health care facilities used and travel time.
SFDPH and Planning might collaborate with the San Francisco Metropolitan Transportation Agency, the San Francisco County Transportation Authority, and other appropriate partners to develop standards to ensure health care access via appropriate contributions to transportation choices and/or the direct provision of transportation choices (e.g., shuttle services). Such standards could serve as a best practice guide to developers of medical use projects going forward.
Future iterations of the Land Use Assessment might include a more robust analysis of where transit access should be improved relative to where medical uses are allowed and most needed.
Development of the current HCSMP highlighted that the San Francisco Planning Code defines “medical use” in different ways and in multiple sections of the Code. In the future, SFDPH and Planning may wish to recommend that the Planning Code be updated to reflect a more streamlined and cohesive definition of “medical use.”
Based on the public comment received, future updates to the HCSMP may include additional information on:
o Accessibility of neighborhood pharmacies. Providing access to pharmacies is an important factor in ensuring that patients can maintain health and access the medications they need.
o Adequacy of hospice and palliative care services. San Francisco will need to have ample hospice and palliative care services to meet the needs of a growing aging population. Patients who enroll in hospice may experience benefits including better symptom control, less aggressive care in final days of life, and greater family satisfaction with the care received. Ensuring that the city has ample hospice and palliative care services has the potential to reduce overall health care expenditures providing appropriate lower cost care.
o Addiction and substance abuse among San Francisco residents. San Francisco has historically had a high prevalence of addiction/substance abuse and thus ensuring an adequate supply of substance abuse treatment providers is important in meeting the needs of our community.
FINAL HCSMP: October 2013 Page 182
o Food access. Ensuring that residents in underserved areas have access to healthy food options is vital in creating healthy living environments.
SFDPH and Planning will work bring the Institutional Master Plan (IMP) process more in alignment with the HCSMP Consistency Determination process.
Planning Department will work to find creative incentive approaches and broaden the menu of possible incentives.
The above represents ideas generated throughout the development of the current HCSMP. Between HCSMP updates, SFDPH and Planning will keep a running list of other possible areas for future consideration to ensure that future plans best reflect the evolving health care needs of San Francisco’s diverse communities.

APPENDICES
Appendix A: San Francisco Ordinance No. 300-10
The following pages include the language of San Francisco Ordinance No. 300-10, legislation sponsored by Supervisor David Campos that required the creation of a Health Care Services Master Plan (HCSMP) to guide land use decisions for health care-related projects in San Francisco. San Francisco Ordinance No. 300-10 took effect January 2, 2011.
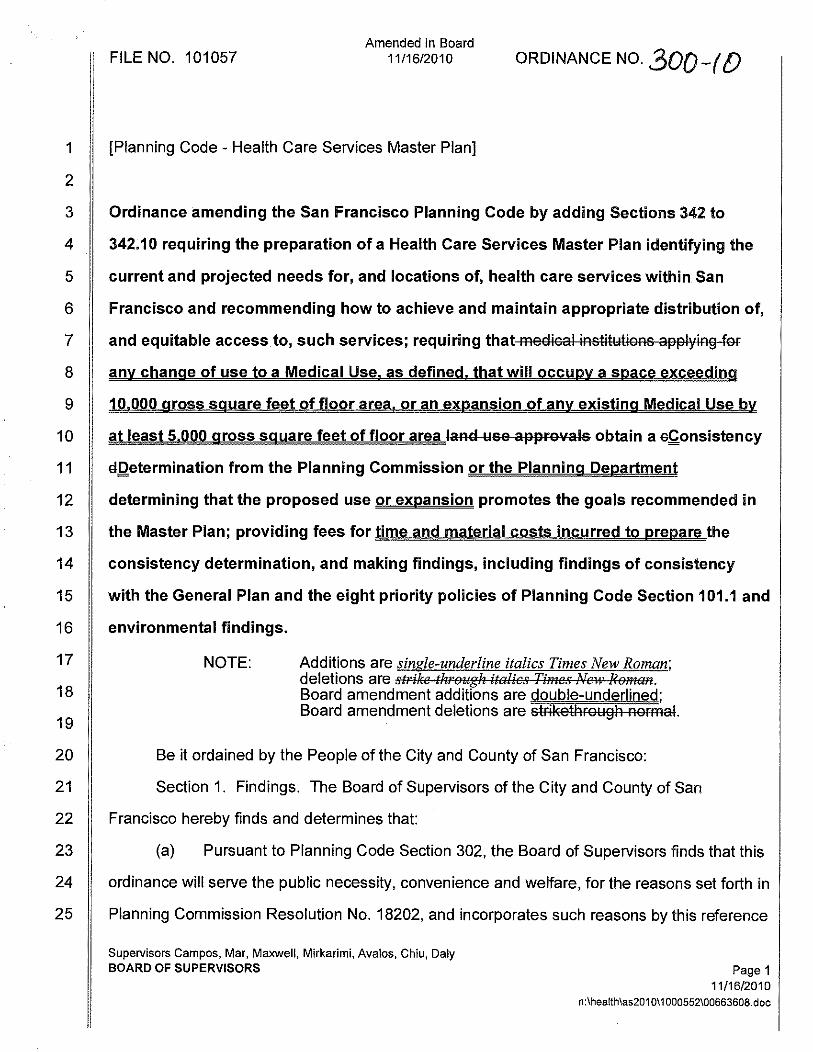
FILE NO. 101057Amended in Board
11/16/2010 ORDINANCE NO. 300-(D
1 [Planning Code - Health Care Services Master Plan]
2
3 Ordinance amending the San Francisco Planning Code by adding Sections 342 to
4 342.10 requiring the preparation of a Health Care Services Master Plan identifying the
5 current and projected needs for, and locations of, health care services within San
6 Francisco and recommending how to achieve and maintain appropriate distribution of,
7 and equitable access to, such services; requiring that meElioal institutions applying for
8 any change of use to a 1l(I~=dJcal Use. as d.!;l,Uned",=1hat wi,!,1 occupy a space exceedJng
9 10,000 gross square feet of floor area, or an expansion of any extl?-ting Medica! Use by
10 at least 5,000 gross square feet of floor area land use appro'lals obtain a oConsistency
11 eDetermination from the Planning Commission or the Planning Department
12 determining that the proposed use or expansion promotes the goals recommended in
13 the Master Plan; providing fees for time and maijlrial costs incurred to prepare the
14 consistency determination, and making findings, including findings of consistency
15 with the General Plan and the eight priority policies of Planning Code Section 101.1 and
16 environmental findings,
17
18
19
NOTE: Additions are single-underline italics Times New Roman;deletions are strilfe through italics Times Nell' Reman.Board amendment additions are double-underlined;Board amendment deletions are strikethrough normal.
20 Be it ordained by the People of the City and County of San Francisco:
21 Section 1. Findings. The Board of Supervisors of the City and County of San
22 Francisco hereby finds and determines that:
23 (a) Pursuant to Planning Code Section 302, the Board of Supervisors finds that this
24 ordinance will serve the public necessity, convenience and welfare, for the reasons set forth in
25 Planning Commission Resolution No. 18202, and incorporates such reasons by this reference
Supervisors Campos, Mar, Maxwell, Mirkarimi, Avalos, Chiu, DalyBOARD OF SUPERVISORS Page 1
11/16/2010n:\health\as201 0\1 000552\00663608.doc
1 thereto. A copy of said resolution is on file with the Clerk of the Board of Supervisors in File
2 No. 101057.
3 (b) The Board of Supervisors finds that this ordinance is in conformity with the
4 Priority Policies of Section 101.1 of the Planning Code and with the General Plan, and hereby
5 adopts the findings set forth in Planning Commission Resolution No. 18202 and incorporates
6 such findings by reference as if fUlly set forth herein. A copy of said resolution is on file with
7 the Clerk of the Board of Supervisors in File No. 101057.
8 (c) The Planning Department concluded environmental review of this ordinance
9 pursuant to the California Environmental Quality Act, Public Resources Code Section 2100 et
10 seq. Documentation of that review is on file with the Clerk of the Board of Supervisors in File
11 No. 101057.
12 Section 2. The San Francisco Planning Code is hereby amended by adding Sections
13 342 to 342.10, to read as follows:
SEC. 342. HEALTH CARE SERVICES MASTER PLAN FINDINGS.14
15 1. On March 23, 2010, President Barack Obama signed into law the "Patient Protection
16 and Affordable Care Act, " thereby initiating the most significant change to the health care delivery
17 system that the United States has experienced in fOrty years. As the City and County o[San Francisco
18 ("City"l works to implement this monumental law. it is an opportune moment to engage in a
19 comprehensive planning effOrt fOr health care services in the City.
20 2. Section 4.110 ofthe City Charter ("Charter"l provides that the Department o[Public
21 Health and Health Commission shall provide fOr the preservation, promotion and protection o[the
22 physical and mental health ofthe inhabitants ofthe City and County o[San Francisco.
23 3. Section 4.105 ofthe Charter provides that the Planning Commission create and
24 maintain a General Plan consisting o[goals. policies and programs fOr the future development ofthe
25 City and County that take into consideration social, economic and environmental [actors.
Supervisors Campos, Mar, Maxwell. Mirkarimi, Avalos. Chiu, DalyBOARD OF SUPERVISORS Page 2
11/16/2010n:\health\as201 0\1 000552\00663606.doc
1 4. Section 127340(a) ofthe Cali(ornia Health and Safety Code provides that "private not-
2 (or-profit hospitals meet certain needs oftheir communities through the provision ofessential
3 healthcare and other services. Public recognition oftheir unique status has led to favorable tax
4 treatment by the government. In exchange. nonprofit hospitals assume a social obligation to provide
5 community benefits in the public interests.s~
6 5. The elimination of the Bay Area Health Systems Agency in 1981 and the
7 establishment of a competitive marketplace for health services as state policy through state
8 legislation resulted in the loss of routine and comprehensive analysis of health service
9 resources, needs, trends, local impacts and related information in the City to guide decisions
10 by medical institutions and governmental land use decisions. This loss of information
11 promoted decisions, both private and public, that could favor short term individual
12 developments over long term, City wide public policy goals.
13 5. 6. The attempt by the City to fill the policy gap by passing Ordinance Number 279
14 07, requiring Implementation of Ordinance 279-07, requiring the Department of Public Health
15 to analyze the relationship between the City's long term health care needs and facility
16 planning for medical institutions. has revealed the need for a City-wide Health Care Services
17 Master Plan so that the Planning Department has a tool to analyze individual institutional
18 planning against a more comprehensive City plan. submission of Institutional Master Plans,
19 revealed the need to balance individual institutional planning with a city wide plan within \VhiBR
20 plans of individual institutions can be assessed for their relation to city wide public policy goals
21 and the impacts in neighborhoods and the City as a whole.
22 6 ~ A Health Care Services Master Plan will provide the Health Commission. the Planning
23 Commission and Board ofSupervisors with in(ormation and public policy recommendations to guide
24 their decisions to promote the City's land use and poliey goals developed in such Plan. such as
25 distribution and access to health care services.
Supervisors Campos. Mar, Maxwell, Mirkarimi, Avalos, Chiu, DalyBOARD OF SUPERVISORS P;3ge 3
1111612010n:lhealthlas201 0\1 000552100663608.doc
1 7 g~ A Health Care Services Master Plan will also provide the Health Commission, the
2 Planning Commission and Board ofSupervisors with information essential to disaster planning for the
3 City.
4 8 S,- The San Francisco Department ofPublic Health is particularly well situated to create a
5 Health Care Services Master Plan, as it can draw upon the innovative work ofBuilding a Healthier
6 San Francisco, including "The Living Community Needs Assessment" which is an up-to-date, web-
7 based, compilation ofdata about community health in neighborhoods throughout the City.
SEC. 342.1. DEFINITIONS.
As used in these sections 342 to 342.10, the following terms shall have the following meanings:
8
9
10 (a) "Application" shall mean an application submitted by an owner or operator of a
11 medical institution for any City land use approval, including but not limited to a conditional use
12 permit, variance, or other entitlement requiring Planning Commission or Zoning Administrator
13 action.
14 (b) "Applicant" shall mean an owner or operator of a medical institution submitting
15 an application for a land use appre\'al described in section (a) above.
16 (B) (a) "Medical Uselnstitution" shall mean a use as defined in Sections 790.114.
17 790.44,890.114.890.44, 209.3(a), 217(a) and (c) of the Planning Code, excluding any
18 housing operated by a medical provider or any massage use.providers of healthcare services,
19 such as hospitals, nursing homes, skilled nursing facilities, in patient hospices, mental and
20 behavioral health facilities, substance abuse and chemical dependency treatment centers,
21 ambUlatory care centers, rehabilitation facilities, free standing imaging centers, surgical
22 centers, birthing centers, clinics, and medical office buildings.
23 SEC. 342.2. HEALTH CARE SERVICES MASTER PLAN: COMPONENTS
24 Cal The Department ofPublic Health and the Planning Department shall prepare a Health
25 Care Services Master Plan that displays and analyzes information concerning the geography
Supervisors Campos, Mar, Maxwell, Mirkarimi, Avalos, Chiu, DalyBOARD OF SUPERVISORS Page 4
11/16/2010n:Ihealthlas201011 00055210066360B.doc
e
h
n,
re
e510
doc
be
f
nd
nt
(including natural features ofland, weather, and water supply), demography, epidemiology,
economics/finance, neighborhood characteristics, intensity ofuse, workforce, technology, and
governmental policy pertinent to distribution, access, quality and cost ofhealth care services in the
City, including the use ofthe health care services by patients from outside the City, and referral of
patients from the City to medical institutions located outside the City limits. Based on this infOrmatio
the Health Care Services Master Plan will identitY existing and anticipated future needs fOr health ca
services compared to available and anticipated resources and potential impacts on neighborhoods, a
make recommendations fOr improving the match between needs and resources, as well as where healt
care services may be located within an area ofthe City without a significant to minimize land use
burden on particular neighborhoods. The Health Care Services Master Plan shall consider
neighborhood density, uses, transit and infrastructure availability, traffic characteristics, including
mode split among cars, public transit, bicycles and pedestrians,
(bi The Health Care Services Master Plan shall, to the extent feasible, contain all ofthe
fOllowing components:
(l) Health System Trends Assessment: The Health Care Services Master Plan shall descri
and analyze trends in health care services with respect to the City. including but not limited to: diseas
and population health status; governmental policy (at the national, state, regional levels!; disaster
planning; clinical technology: communications technology: payment fOr services; sources and uses 0
capital fOr investment in services; organization and delivery ofservices; workforce; community
obligations ofproviders, and any other trends that, in the discretion ofthe Department ofPublic
Health, may affect availability, location, access and use ofservices in the City,
(2) Capacity Assessment: The Health Care Services Master Plan shall quantifv the curre
and projected capacities ofexisting Medical Uses medical institutions in San Francisco, including
public and private facilities and community based and for and non-profit organizations. The
capacity assessment shall describe, analyze, and project resources available fOr emergency services,
Supervisors Campos, Mar, Maxwell, Mirkarimi, Avalos, Chiu, DalyBOARD OF SUPERVISORS Pag
11/16/20n:\health\as201 0\1000552\00663608.
1
2
3
4
5
6
7
8
9
10
11
12
13
14
15
16
17
18
19
20
21
22
23
24
25
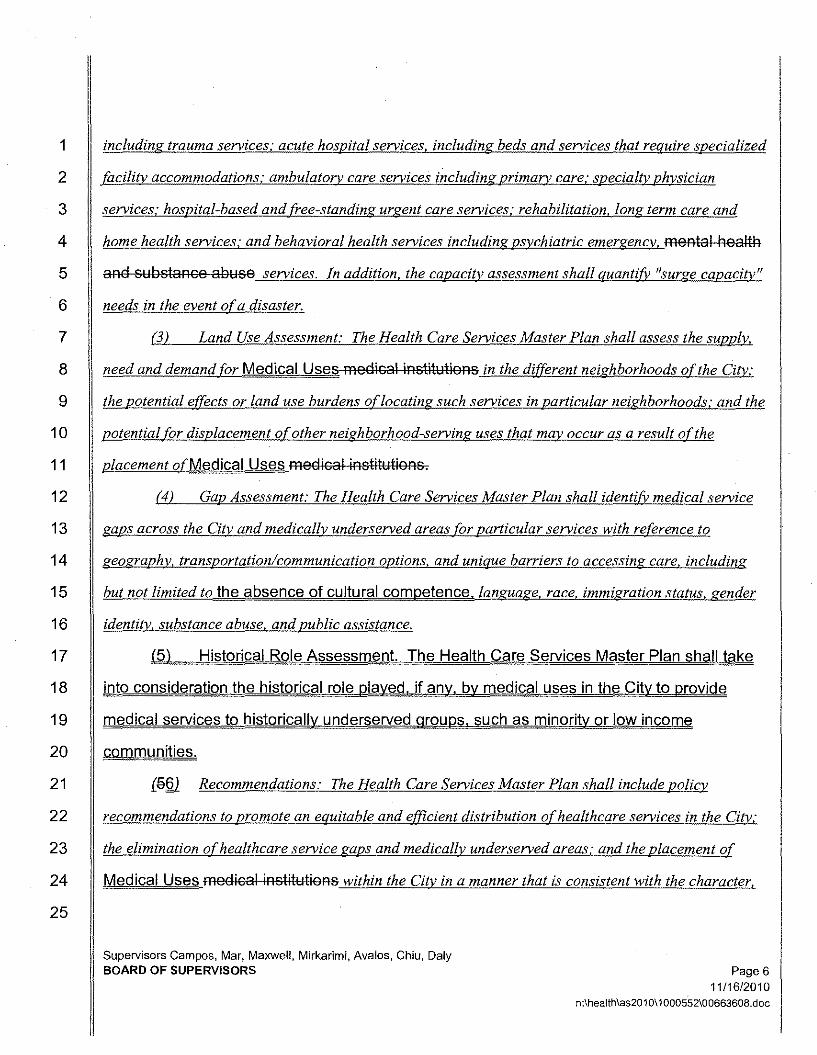
1 including trauma services; acute hospital services, including beds and services that require specialized
2 facility accommodations; ambulatorv care services including primarv care; specialty physician
3 services; hospital-based and (ree-standing urgent care services; rehabilitation, long term care and
4 home health services; and behavioral health services including psychiatric emergency, mental health
5 and substance abuse services. In addition, the capacity assessment shall quantifY "surge capacity"
6 needs in the event ofa disaster.
7 (3) Land Use Assessment; The Health Care Services Master Plan shall assess the supply,
8 need and demand for Medical Uses medical institutions in the di(ferent neighborhoods o{the City;
9 the potential e(fects or land use burdens oflocating such services in particular neighborhoods; and the
10 potential for displacement ofother neighborhood-serving uses that may occur as a result ofthe
11 placement ofMedical Uses medical institutions.
12 (4) Gap Assessment; The Health Care Services Master Plan shall identifY. medical service
13 gaps across the City and medically underserved areas for particular services with reference to
14 geography, transportation!communication options, and unique barriers to accessing care, including
15 but not limited to the absence of cultural competence. language, race, immigration status, gender
16 identity, substance abuse, and public assistance.
17 (5\ Historical ~ole Assessment. The Health Care Services Master Plan shall tgke
18 into consideration the historical role played. if any. by medical uses in the City to proVide
19 medical services to historically underserved groups. such as minority or low income
20 communities.
21 La§). Recommendations: The Health Care Services Master Plan shall include policy
22 recommendations to promote an equitable and emcient distribution ofhealthcare services in the City;
23 the elimination ofhealthcare service gaps and medically underserved areas; and the placement of
24 Medical Uses medical institutions within the City in a manner that is consistent with the character,
25
Supervisors Campos, Mar, Maxwell, Mirkarimi, Avalos, Chiu, DalyBOARD OF SUPERVISORS Page 6
11/16/2010n:\health\as2010\1000552\00663608.doc
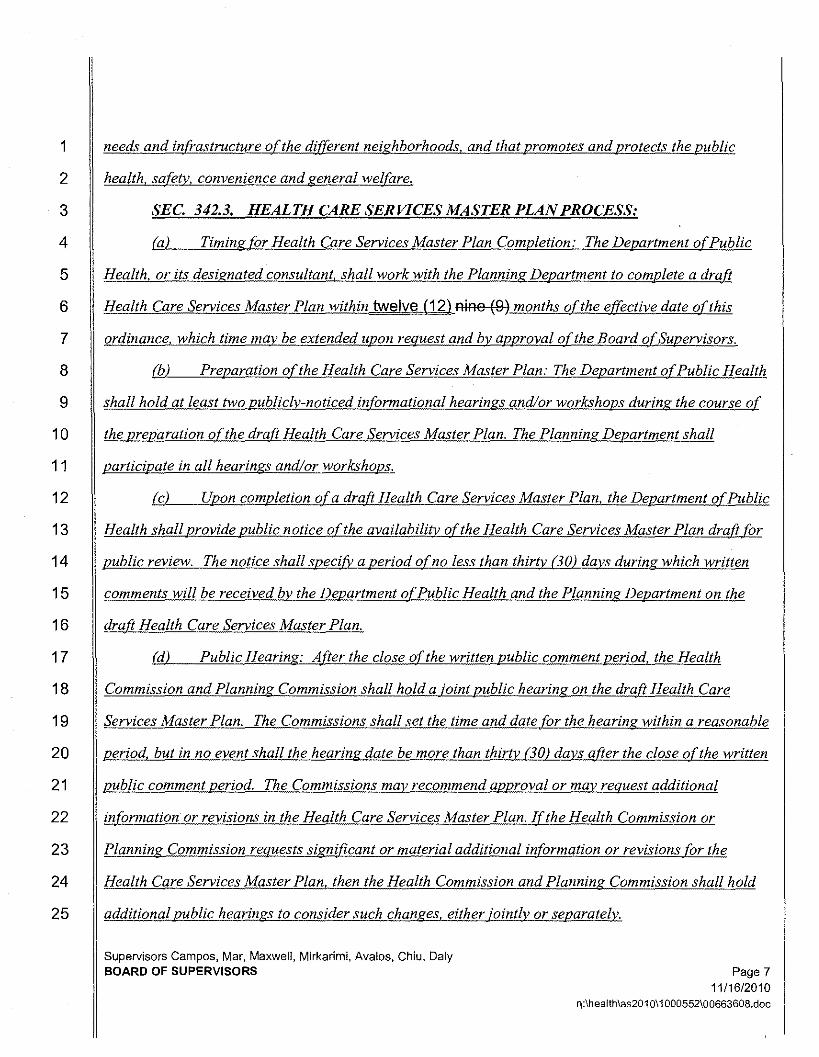
1 needs and infrastructure ofthe ditferent neighborhoods, and that promotes and protects the public
2 health, safety, convenience and general welfare.
3 SEC. 342.3. HEALTH CARE SERVICES MASTER PLANPROCESS:
4 (a) Timing for Health Care Services Master Plan Completion: The Department oCPublic
5 Health, or its designated consultant, shall work with the Planning Department to complete a draft
6 Health Care Services Master Plan within twelve (12) nine (9) months ofthe etfective date ofthis
7 ordinance, which time may be extended upon request and by approval ofthe Board ofSupervisors.
8 (b) Preparation ofthe Health Care Services Master Plan: The Department ofPublic Health
9 shall hold at least two publicly-noticed informational hearings and/or workshops during the course of
10 the preparation ofthe draft Health Care Services Master Plan. The Planning Department shall
11 participate in all hearings and/or workshops.
12 (c) Upon completion oCa draft Health Care Services Master Plan, the Department ofPublic
13 Health shall provide public notice ofthe availability ofthe Health Care Services Master Plan draa for
14 public review. The notice shall specifY a period ofno less than thirty (30) days during which written
15 comments will be received by the Department oCPublic Health and the Planning Department on the
16 draft Health Care Services Master Plan.
17 (d) Public Hearing: After the close ofthe written public comment period, the Health
18 Commission and Planning Commission shall hold a joint public hearing on the draft Health Care
19 Services Master Plan. The Commissions shall set the time and date for the hearing within a reasonable
20 period, but in no event shall the hearing date be more than thirty (30) days after the close ofthe written
21 public comment period. The Commissions may recommend approval or may request additional
22 information or revisions in the Health Care Services Master Plan. [fthe Health Commission or
23 Planning Commission requests significant or material additional information or revisions for the
24 Health Care Services Master Plan, then the Health Commission and Planning Commission shall hold
25 additional public hearings to consider such changes. either jointly or separately.
Supervisors Campos, Mar, Maxwell, Mirkarimi, Avalos, Chiu, DalyBOARD OF SUPERVISORS Page 7
11/16/2010~ :lhealthlas201011 000552100663608.doc
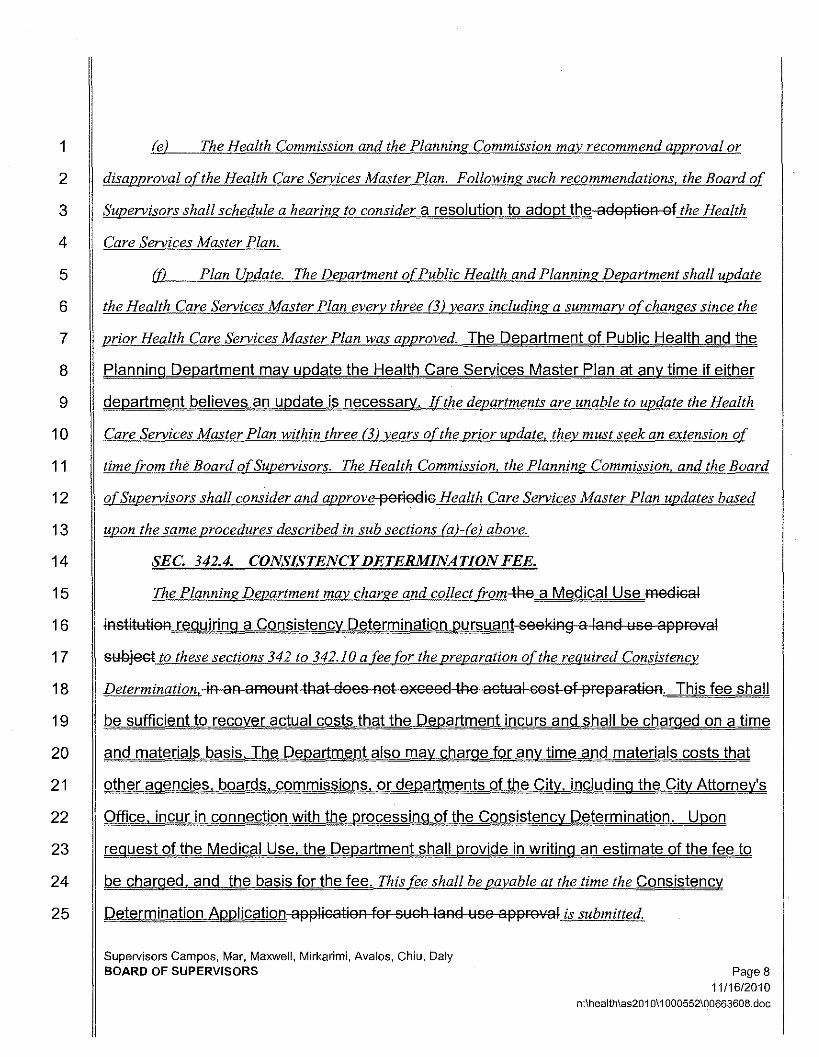
1 (el The Health Commission and the Planning Commission may recommend approval or
2 disapproval ofthe Health Care Services Master Plan. Following such recommendations, the Board of
3 Supervisors shall schedule a hearing to consider a resolution to adopt the adoption of the Health
4 Care Services Master Plan.
5 (j) Plan Update. The Department ofPublic Health and Planning Department shall update
6 the Health Care Services Master Plan every three (31 years including a summary ofchanges since the
7 prior Health Care Services Master Plan was approved. The Department of Public Health and the
8 Planning Department may update the Health Care Services Master Plan at any time if either
9 department believes an update is necessary. Ifthe departments are unable to update the Health
10 Care Services Master Plan within three (31 years ofthe prior update, they must seek an extension of
11 time from the Board ofSupervisors. The Health Commission, the Planning Commission, and the Board
12 ofSupervisors shall consider and approve periodic Health Care Services Master Plan updates based
13 upon the same procedures described in sub sections (al-(el above.
14 SEC. 342.4. CONSISTENCY DETERMINATION FEE.
15 The Planning Department may charge and collect trom-tJ:1B a Medical Use medioal
16 institution requiring a Consistency Determination pursuant seeking a land use approval
17 subject to these sections 342 to 342.10 a fee for the preparation ofthe required Consistency
18 Determination, in an amount that does not exoeed the aotual oost of preparation. This fee shall
19 be sufficient to recover actual costs that the Department incurs and shall be charged on a time
20 and materials basis. The Department also may charge for any time and materials costs that
21 other agencies. boards. commissions. or departments of the City. including the City Attorney's
22 Office, incur in connection with the processing of the Consistency Determination. Upon
23 request of the Medical Use, the Department shall proVide in writing an estimate of the fee to
24 be charged, and the basis for the fee. This fee shall be payable at the time the Consistency
25 Determination Application applioation for suoh land use approval is submitted.
Supervisors Campos, Mar, Maxweil, Mirkarimi, Avalos, Chiu, DalyBOARD OF SUPERVISORS Page 8
11/16/2010n:IheaIthlas201011000552100663608.doc
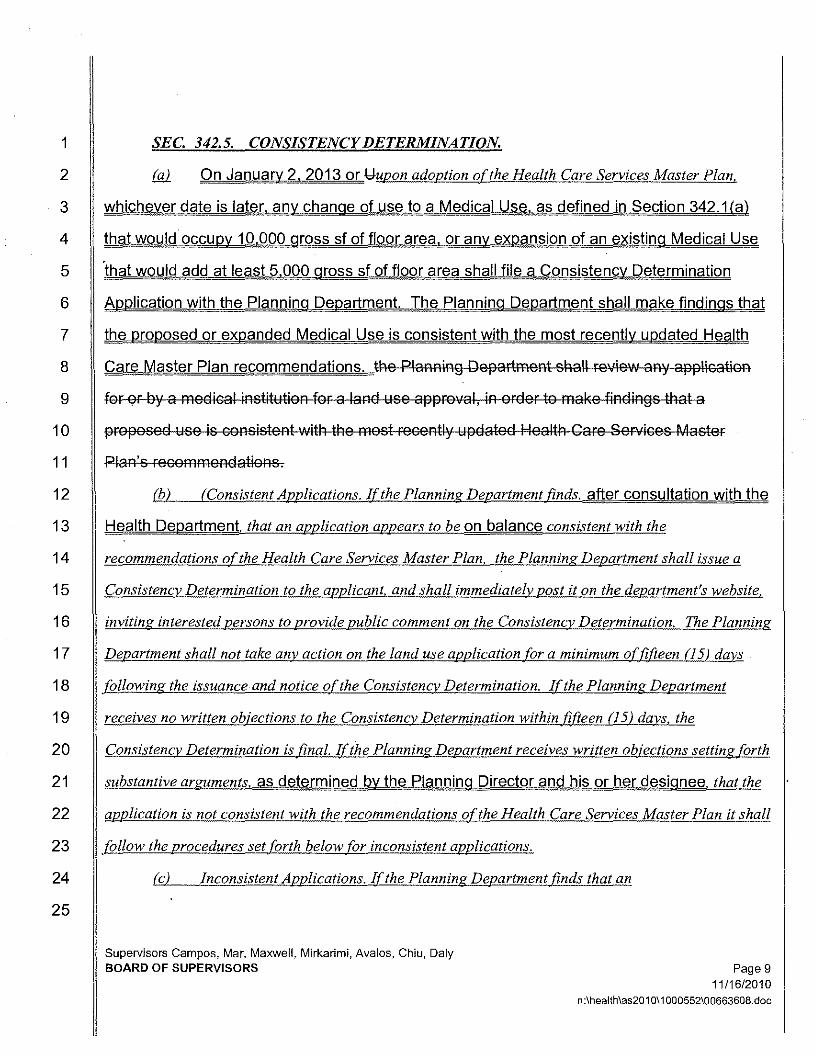
1
2
SEC. 342.5. CONSISTENCY DETERMINATION.
On January 2. 2013 or JJ.upon adoption ofthe Health Care Services Master Plan,
3 whichever date is later. any change of use to a Medical Use. as defined in Section 342.1 (a)
4 that would occupy 10.000 gross sf of floor area. or any expansion of an existing Medical Use
5 'that would add at least 5.000 gross sf of floor area shall file a Consistency Determination
6 Application with the Planning Department. 1;he Planning Department shall make findings that
7 the proposed or expanded Medical Use is consistent with the most recently updated Health
8 Care Master Plan recommendations. the Planning Department shall review any applioation
9 for or by a medioal institution for a land use approval, in order to make findings that a
10 proposed use is oonsistent .....ith the most reoently updated Health Care Servioes Master
11 Plan's reoommendations.
12 (b) (Consistent Applications. Ifthe Planning Department finds. after consultation with the
13 Health Department, that an application appears to be on balance consistent with the
14 recommendations ofthe Health Care Services Master Plan, the Planning Department shall issue a
15 Consistency Determination to the applicant, and shall immediately post it on the department's website,
16 inviting interested persons to prOVide public comment on the Consistency Determination. The Planning
17 Department shall not take any action on the land use application for a minimum o[fifieen 05) days
18 following the issuance and notice ofthe Consistency Determination. Ifthe Planning Department
19 receives no written obiections to the Consistency Determination within fifteen 05) days. the
20 Consistency Determination is final. If the Planning Department receives written objections setting forth
21 substantive arguments. as determined by the Planning Director and his or her designee, that the
22 application is not consistent with the recommendations ofthe Health Care Services Master Plan it shall
23 follow the procedures set forth below for inconsistent applications.
24
25
(c) Inconsistent Applications. Ifthe Planning Department finds that an
Supervisors Campos, Mar, Maxwell, Mirkarimi, Avalos, Chiu, DalyBOARD OF SUPERVISORS Page g
11/16/2010n:lhealthlas201 011 00055210066360B.doc
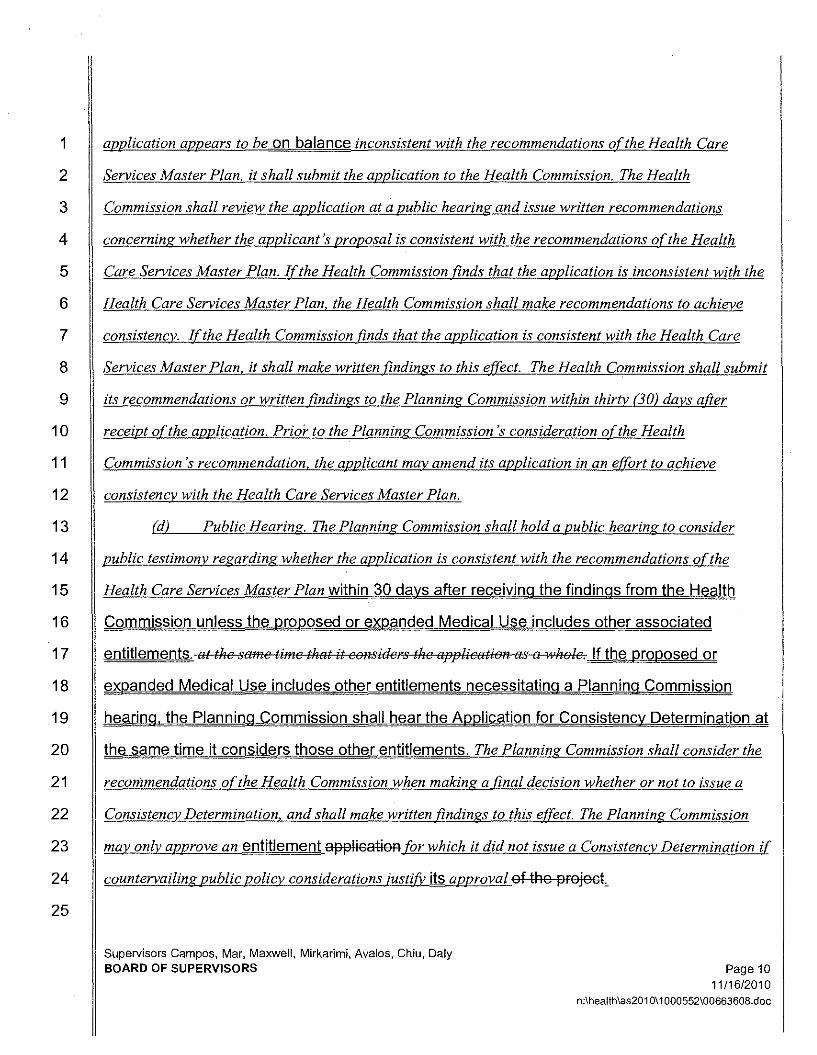
1 application appears to be on balance inconsistent with the recommendations ofthe Health Care
2 Services Master Plan, it shall submit the application to the Health Commission, The Health
3 Commission shall review the application at a public hearing and issue written recommendations
4 concerning whether the applicant's proposal is consistent with the recommendations ofthe Health
5 Care Services Master Plan. If the Health Commission finds that the application is inconsistent with the
6 Health Care Services Master Plan, the Health Commission shall make recommendations to achieve
7 consistency. Ifthe Health Commission finds that the application is consistent with the Health Care
8 Services Master Plan, it shall make written findings to this effect. The Health Commission shall submit
9 its recommendations or written findings to the Planning Commission within thirtv (30) days aOer
10 receipt ofthe application. Prior to the Planning Commission's consideration ofthe Health
11 Commission's recommendation, the applicant may amend its application in an effOrt to achieve
12 consistency with the Health Care Services Master Plan.
13 (d) Public Hearing. The Planning Commission shall hold a public hearing to consider
14 public testimony regarding whether the application is consistent with the recommendations oUhe
15 Health Care Services Master Plan within 30 days after receiving the findings from the Health
16 Commission unless the proposed or expanded Medical Use includes other associated
17 entitlements. et the smne time thet it eensidel's the eppliootien as a :vhele. If the proposed or
18 expanded Medical Use includes other entitlements necessitating a Planning Commission
19 hearing. the Planning Commission shall hear the Application for Consistency Determination at
20 the same time it considers those other entitlements. The Planning Commission shall consider the
21 recommendations ofthe Health Commission when making a final decision whether or not to issue a
22 Consistency Determination, and shall make written findings to this effect. The Planning Commission
23 may only approve an entitlement application fOr which it did not issue a Consistency Determination if
24 countervailing public policy considerations justifj; its approval of the project.
25
Supervisors Campos, Mar, Maxwell, Mirkarimi, Avaios, Chiu, DalyBOARD OF SUPERVISORS Page 10
11/16/2010n:lhealthlas201 011 000552100663608.doc
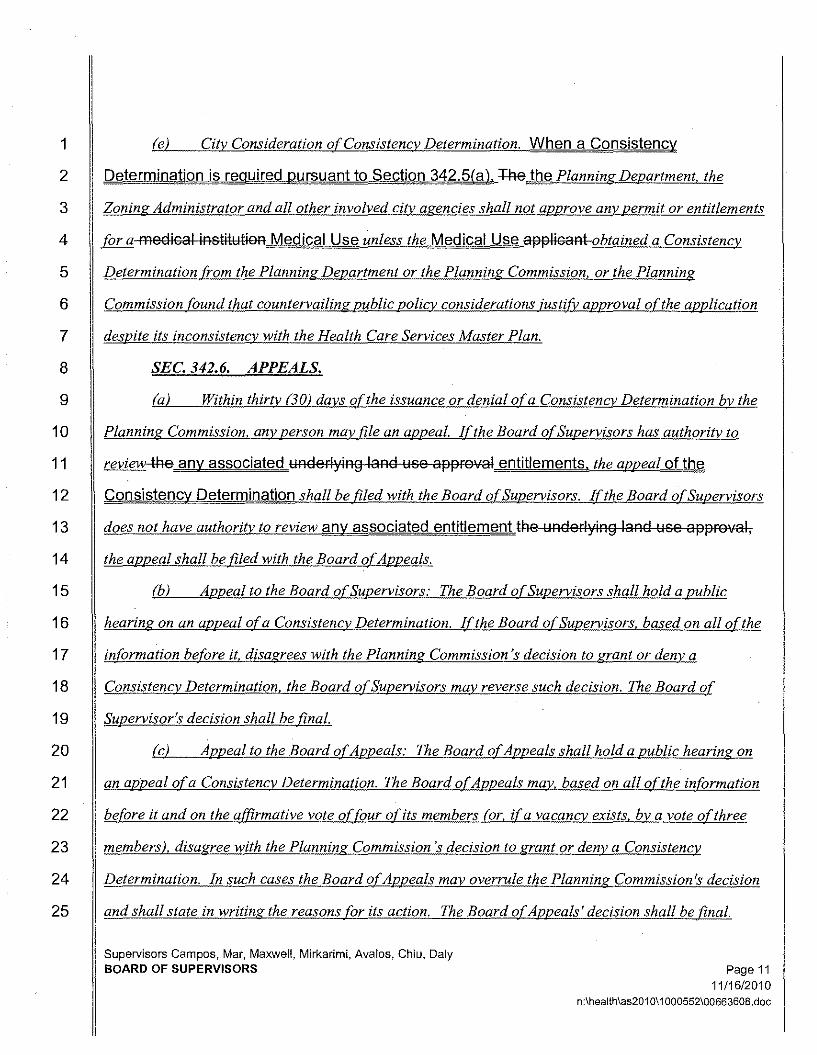
1 (e) City Consideration o(Consistency Determination. When a Consistency
2 ,Determination is required pursuant to Section 342.5Ia), +I:1e the Planning Department, the
3 Zoning Administrator and all other involved city agencies shall not approve any permit or entitlements
4 fOr a medical institution Medical Use unless the Medical Use applicant obtained a Consistency
5 Determination trom the Planning Department or the Planning Commission, or the Planning
6 Commission fOund that countervailing public policy considerations justi{i; approval ofthe armlication
7 despite its inconsistency with the Health Care Services Master Plan.
SEC. 342.6. APPEALS.8
9 (a) Within thirty (30) days o(the issuance or denial ora Consistency Determination by the
10 Planning Commission, any person may file an appeal. I(the Board o(Supervisors has authority to
11 review-#le any associated underlying land use approval entitlements, the appeal of the
12 Consistency Determination shall be filed with the Board o(Supervisors. Ifthe Board o(Supervisors
13 does not have authority to review any associated entitlement the underlying land use approval,
14 the appeal shall be filed with the Board o(Appeals.
15 (b) Appeal to the Board o(Supervisors: The Board o(Supervisors shall hold a public
16 hearing on an appeal ora Consistency Determination. I(the Board o(Supervisors, based on all ofthe
17 infOrmation befOre it, disagrees with the Planning Commission's decision to grant or deny a
18 Consistency Determination, the Board o(Supervisors may reverse such decision. The Board o(
19 Supervisor's decision shall be final.
20 (c) Appeal to the Board o(Appeals: The Board o(Appeals shall hold a public hearing on
21 an appeal ora Consistency Determination. The Board o(Appeals may, based on all ofthe infOrmation
22 before it and on the affirmative vote o(four oOts members (or, ira vacancy exists, by a vote ofthree
23 members), disagree with the Planning Commission's decision to grant or deny a Consistency
24 Determination. In such cases the Board o(Appeals may overrule the Planning Commissions decision
25 and shall state in writing the reasons for its action. The Board o(Appeals' decision shall be final.
Supervisors Campos, Mar, Maxwell, Mirkarimi, Avalos, Chiu, DalyBOARD OF SUPERVISORS Page 11
1111612010n:\heaIth\a52010\1 000552\00663608.doc
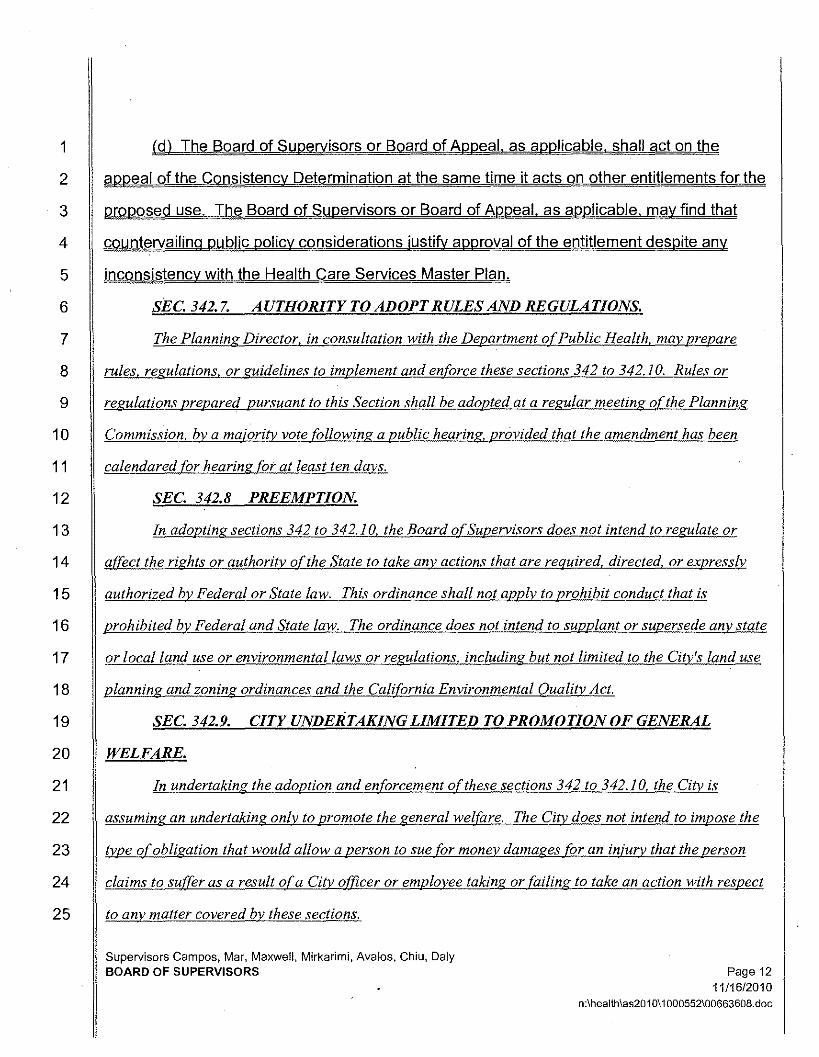
1 !.dl The Board of Supervisors or Board of Appeal. as applicable. shall act on the
2 appeal of the Consistency Determination at the same time it acts on other entitlements for the
3 proposed use. The Board of Supervisors or Board of Appeal. as applicable. may find that
4 countervailing public policy considerations justify approval of the entitlement despite any
5 inconsistency with the Health Care Services Master Plan.
6 SEC. 342.7. AUTHORITY TO ADOPTRULES AND REGULATIONS.
7 The Planning Director. in consultation with the Department ofPublic Health. may prepare
8 rules. regulations. or guidelines to implement and enforce these sections 342 to 342.10. Rules or
9 regulations prepared pursuant to this Section shall be adopted at a regular meeting ofthe Planning
10 Commission. by a majority vote following a public hearing. provided that the amendment has been
11 calendared for hearing for at least ten days.
12 SEC. 342.8 PREEMPTION.
13 In adopting sections 342 to 342.10. the Board ofSupervisors does not intend to regulate or
14 affect the rights or authority ofthe State to take any actions that are required. directed. or expressly
15 authorized by Federal or State law. This ordinance shall not apply to prohibit conduct that is
16 prohibited by Federal and State law. The ordinance does not intend to supplant or supersede any state
17 or local land use or environmental laws or regulations. including but not limited to the City's land use
18 planning and zoning ordinances and the California Environmental Quality Act.
19 SEC. 342.9. CITY UNDERTAKING LIMITED TO PROMOTION OF GENERAL
20 WELFARE.
21 In undertaking the adoption and enforcement ofthese sections 342 to 342.10. the City is
22 assuming an undertaking only to promote the general welfare. The City does not intend to impose the
23 type ofobligation that would allow a person to sue for money damages fOr an injurv that the person
24 claims to suffer as a result ofa City officer or employee taking or tailing to take an action with respect
25 to any matter covered by these sections.
Supervisors Campos, Mar, Maxwell. Mirkarimi, Avalos, Chiu. DalyBOARD OF SUPERVISORS Page 12
11/16/2010n:lhealthlas201 0\1 000552100663608.doc

1 SEC. 342.10. SEVERABILITY.
2 I[any ofthe provisions ofthese sections 342 to 342.10 or the application thereofto any person
3 or circumstance is held invalid, the remainder o[these sections, including the application o[such par:t
4 or provisions to persons or circumstances other than those to which it is held invalid, shall not be
5 affected thereby and shall continue in full force and effect. To this end, the provisions ofthese sections
6 are severable.
7 Section 3. This Section is uncodified.
8 The Board of Supervisors hereby urges the Planning Commission to initiate a General
9 Plan Amendment pursuant to Section 340 of the Planning Code, to bring the Health Care
10 Services Master Plan within the General Plan.
11
IDEBy:
APPROVED AS TO FORM:12 DENNIS J. HER RA, City Attorney
13
14
15
16
17
18
19
20
21
22
23
24
25
Supervisors Campos, Mar, Maxwell, Mirkarimi, Avalos, Chiu, DalyBOARD OF SUPERVISORS Page 13
11/16/2010n:lhealthlas201011000552100663608.doc
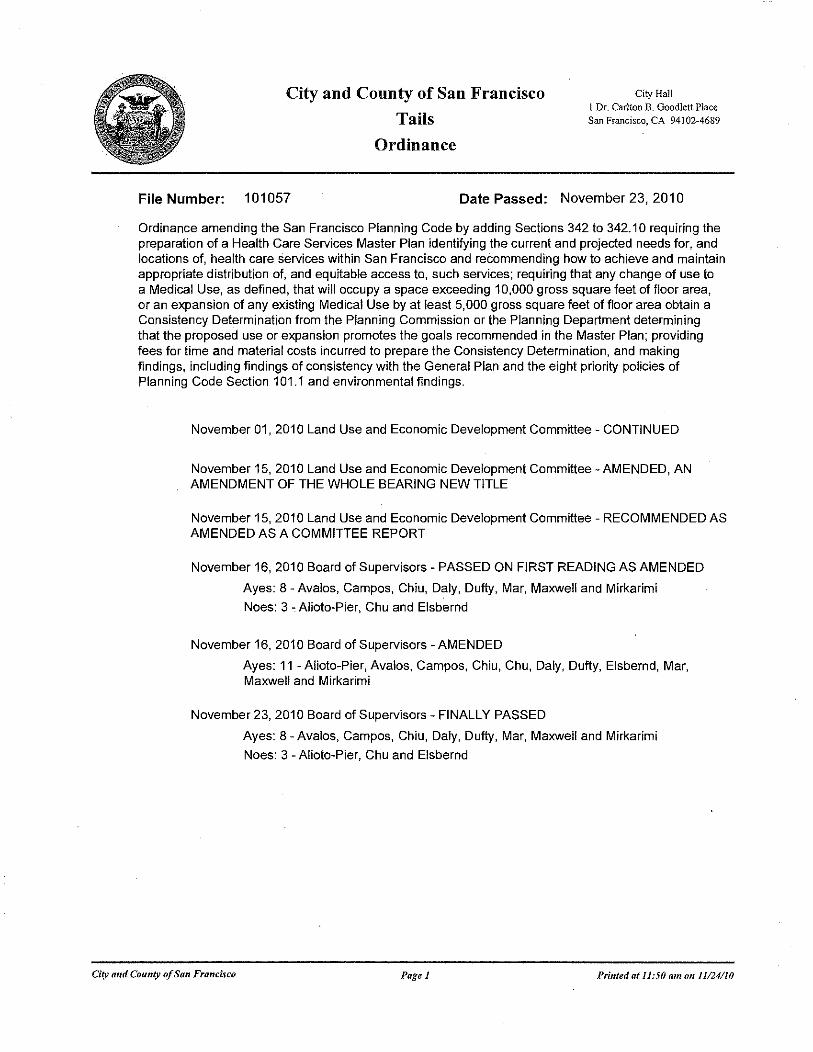
City and County of San Francisco
Tails
Ordinance
City Hall1Dr. Carlton B. Goodlett PlaceSan Francisco, CA 94 I02~4689
File Number: 101057 Date Passed: November 23,2010
Ordinance amending the San Francisco Planning Code by adding Sections 342 to 342.10 requiring thepreparation of a Health Care Services Master Plan identifying the current and projected needs for, andlocations of, health care services within San Francisco and recommending how to achieve and maintainappropriate distribution of, and equitable access to, such services; requiring that any change of use toa Medical Use, as defined, that will occupy a space exceeding 10,000 gross square feet of floor area,or an expansion of any existing Medical Use by at least 5,000 gross square feet of floor area obtain aConsistency Determination from the Planning Commission or the Planning Department determiningthat the proposed use or expansion promotes the goals recommended in the Master Plan; providingfees for time and material costs incurred to prepare the Consistency Determination, and makingfindings, including findings of consistency with the General Plan and the eight priority policies ofPlanning Code Section 101.1 and environmental findings.
November 01, 2010 Land Use and Economic Development Committee - CONTINUED
November 15,2010 Land Use and Economic Development Committee -AMENDED, ANAMENDMENT OF THE WHOLE BEARING NEW TITLE
November 15, 2010 Land Use and Economic Development Committee - RECOMMENDED ASAMENDED AS A COMMITTEE REPORT
November 16,2010 Board of Supervisors - PASSED ON FIRST READING AS AMENDED
Ayes: 8 - Avalos, Campos, Chiu, Daly, Duf!y, Mar, Maxwell and Mirkarimi
Noes: 3 ,Alioto-Pier, Chu and Elsbernd
November 16, 2010 Board of Supervisors - AMENDED
Ayes: 11 - Alioto-Pier, Avalos, Campos, Chiu, Chu, Daly, Duf!y, Elsbernd, Mar,Maxwell and Mirkarimi
November 23, 2010 Board of Supervisors - FINALLY PASSED
Ayes: 8 - Avalos, Campos, Chiu, Daly, Duf!y, Mar, Maxwell and Mirkarimi
Noes: 3 - Alioto-Pier, Chu and Elsbernd
City artd County ofSan Francisco Page 1 Printed at 1/:50 am on 11/24/10
File No.1 01057
UNSIGNED
Mayor Gavin Newsom
I hereby certify that the foregoingOrdinance was FINALLY PASSED on1112312010 by the Board of Supervisors ofthe City and County of San Francisco.
Angela CalvilloClerk of the Board
DECEMBER 3, 2010
Date Approved
Date: December 3, 2010
I hereby certify that the foregoing ordinance, not being signed by the Mayor within the time limit asset forth in Section 3.103 of the Charter, became effective without his approval in accordance withthe provision of said Section 3.103 of the Charter.
Angela Calvillolerk of the Board
FileNo.101057
City and County ofSan Francisco Pllge 2 Printed at 11:50 am on 11/24/10
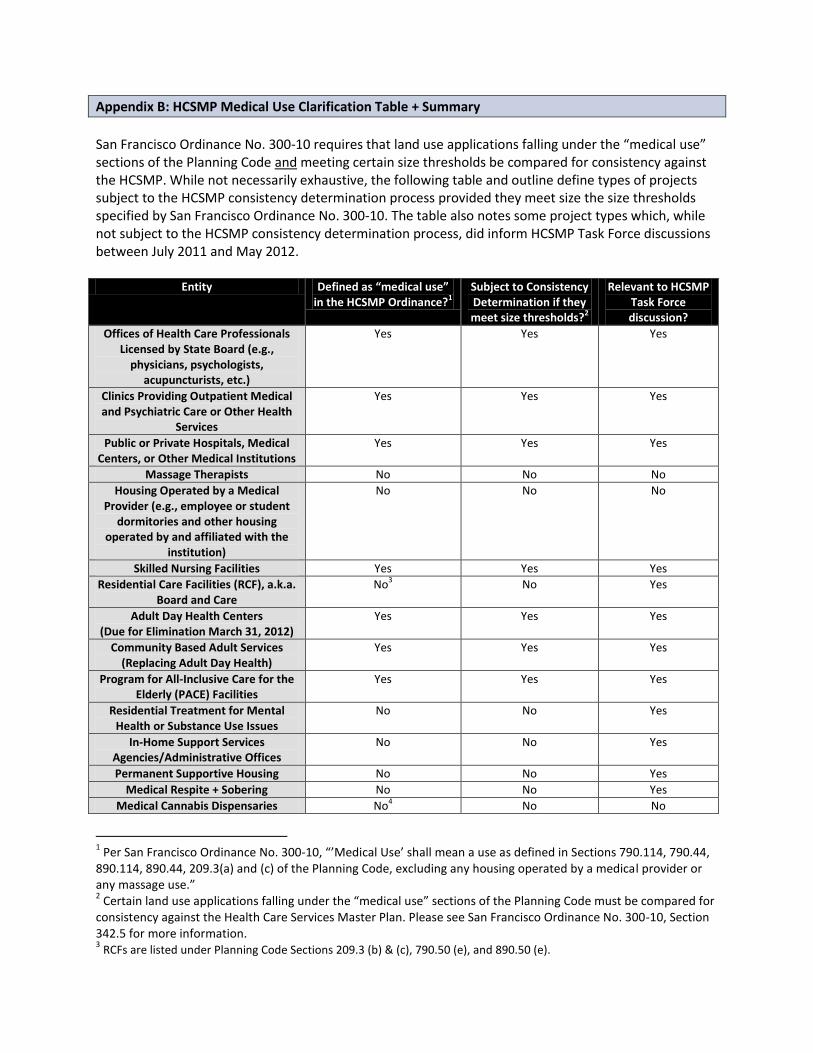
Appendix B: HCSMP Medical Use Clarification Table + Summary
San Francisco Ordinance No. 300-10 requires that land use applications falling under the “medical use” sections of the Planning Code and meeting certain size thresholds be compared for consistency against the HCSMP. While not necessarily exhaustive, the following table and outline define types of projects subject to the HCSMP consistency determination process provided they meet size the size thresholds specified by San Francisco Ordinance No. 300-10. The table also notes some project types which, while not subject to the HCSMP consistency determination process, did inform HCSMP Task Force discussions between July 2011 and May 2012.
Entity Defined as “medical use” in the HCSMP Ordinance?1
Subject to Consistency Determination if they meet size thresholds?2
Relevant to HCSMP Task Force discussion?
Offices of Health Care Professionals Licensed by State Board (e.g.,
physicians, psychologists, acupuncturists, etc.)
Yes Yes Yes
Clinics Providing Outpatient Medical and Psychiatric Care or Other Health
Services
Yes Yes Yes
Public or Private Hospitals, Medical Centers, or Other Medical Institutions
Yes Yes Yes
Massage Therapists No No No
Housing Operated by a Medical Provider (e.g., employee or student
dormitories and other housing operated by and affiliated with the
institution)
No No No
Skilled Nursing Facilities Yes Yes Yes
Residential Care Facilities (RCF), a.k.a. Board and Care
No3 No Yes
Adult Day Health Centers (Due for Elimination March 31, 2012)
Yes Yes Yes
Community Based Adult Services (Replacing Adult Day Health)
Yes Yes Yes
Program for All-Inclusive Care for the Elderly (PACE) Facilities
Yes Yes Yes
Residential Treatment for Mental Health or Substance Use Issues
No No Yes
In-Home Support Services Agencies/Administrative Offices
No No Yes
Permanent Supportive Housing No No Yes
Medical Respite + Sobering No No Yes
Medical Cannabis Dispensaries No4 No No
1 Per San Francisco Ordinance No. 300-10, “’Medical Use’ shall mean a use as defined in Sections 790.114, 790.44,
890.114, 890.44, 209.3(a) and (c) of the Planning Code, excluding any housing operated by a medical provider or any massage use.” 2 Certain land use applications falling under the “medical use” sections of the Planning Code must be compared for
consistency against the Health Care Services Master Plan. Please see San Francisco Ordinance No. 300-10, Section 342.5 for more information. 3 RCFs are listed under Planning Code Sections 209.3 (b) & (c), 790.50 (e), and 890.50 (e).
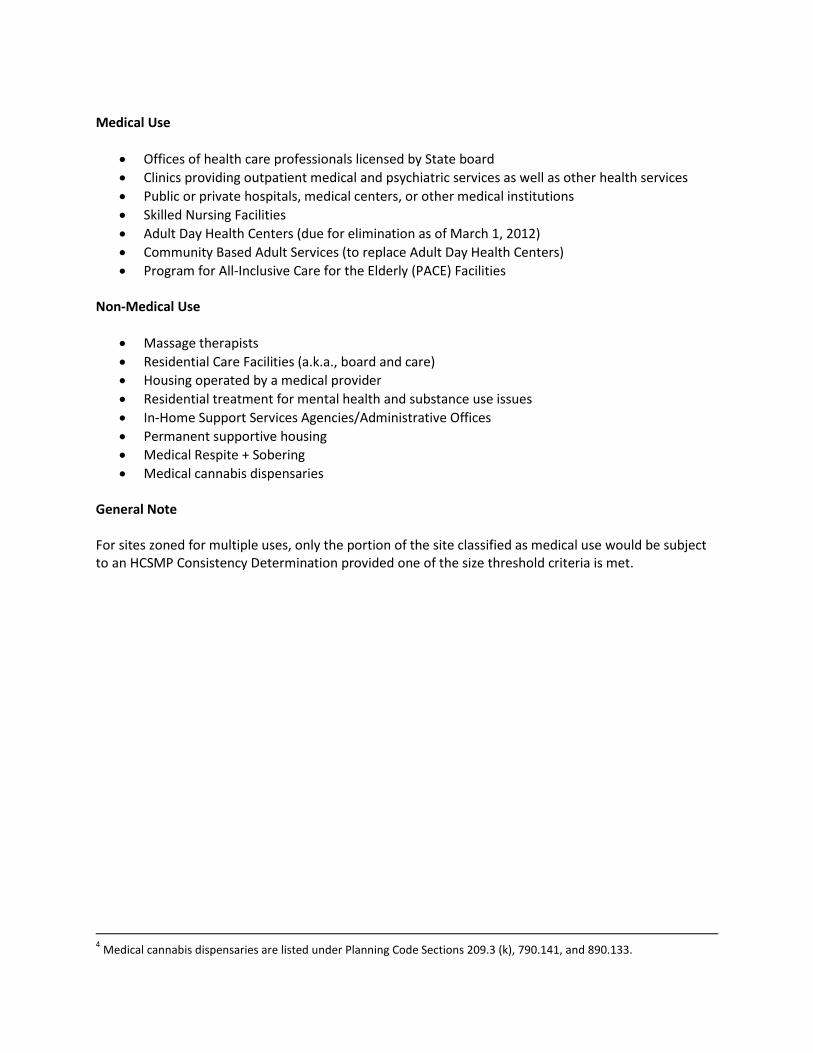
Medical Use
Offices of health care professionals licensed by State board
Clinics providing outpatient medical and psychiatric services as well as other health services
Public or private hospitals, medical centers, or other medical institutions
Skilled Nursing Facilities
Adult Day Health Centers (due for elimination as of March 1, 2012)
Community Based Adult Services (to replace Adult Day Health Centers)
Program for All-Inclusive Care for the Elderly (PACE) Facilities Non-Medical Use
Massage therapists
Residential Care Facilities (a.k.a., board and care)
Housing operated by a medical provider
Residential treatment for mental health and substance use issues
In-Home Support Services Agencies/Administrative Offices
Permanent supportive housing
Medical Respite + Sobering
Medical cannabis dispensaries General Note For sites zoned for multiple uses, only the portion of the site classified as medical use would be subject to an HCSMP Consistency Determination provided one of the size threshold criteria is met.
4 Medical cannabis dispensaries are listed under Planning Code Sections 209.3 (k), 790.141, and 890.133.
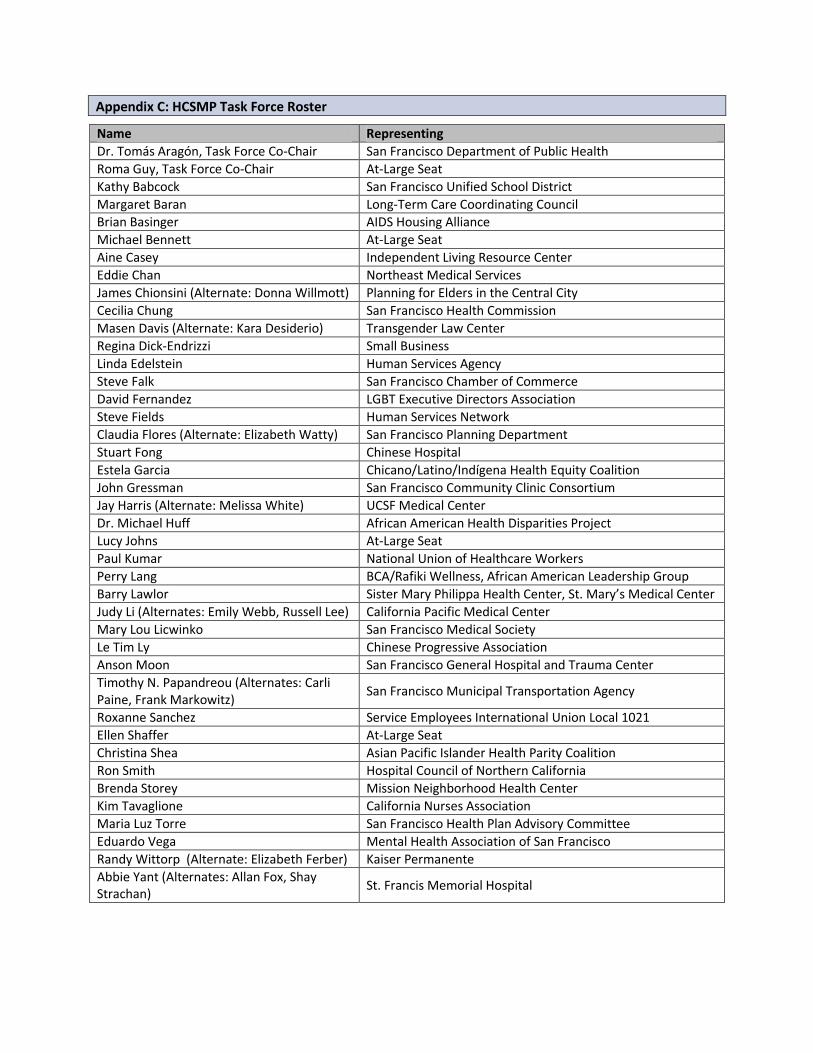
Appendix C: HCSMP Task Force Roster
Name Representing
Dr. Tomás Aragón, Task Force Co-Chair San Francisco Department of Public Health
Roma Guy, Task Force Co-Chair At-Large Seat
Kathy Babcock San Francisco Unified School District
Margaret Baran Long-Term Care Coordinating Council
Brian Basinger AIDS Housing Alliance
Michael Bennett At-Large Seat
Aine Casey Independent Living Resource Center
Eddie Chan Northeast Medical Services
James Chionsini (Alternate: Donna Willmott) Planning for Elders in the Central City
Cecilia Chung San Francisco Health Commission
Masen Davis (Alternate: Kara Desiderio) Transgender Law Center
Regina Dick-Endrizzi Small Business
Linda Edelstein Human Services Agency
Steve Falk San Francisco Chamber of Commerce
David Fernandez LGBT Executive Directors Association
Steve Fields Human Services Network
Claudia Flores (Alternate: Elizabeth Watty) San Francisco Planning Department
Stuart Fong Chinese Hospital
Estela Garcia Chicano/Latino/Indígena Health Equity Coalition
John Gressman San Francisco Community Clinic Consortium
Jay Harris (Alternate: Melissa White) UCSF Medical Center
Dr. Michael Huff African American Health Disparities Project
Lucy Johns At-Large Seat
Paul Kumar National Union of Healthcare Workers
Perry Lang BCA/Rafiki Wellness, African American Leadership Group
Barry Lawlor Sister Mary Philippa Health Center, St. Mary’s Medical Center
Judy Li (Alternates: Emily Webb, Russell Lee) California Pacific Medical Center
Mary Lou Licwinko San Francisco Medical Society
Le Tim Ly Chinese Progressive Association
Anson Moon San Francisco General Hospital and Trauma Center
Timothy N. Papandreou (Alternates: Carli Paine, Frank Markowitz)
San Francisco Municipal Transportation Agency
Roxanne Sanchez Service Employees International Union Local 1021
Ellen Shaffer At-Large Seat
Christina Shea Asian Pacific Islander Health Parity Coalition
Ron Smith Hospital Council of Northern California
Brenda Storey Mission Neighborhood Health Center
Kim Tavaglione California Nurses Association
Maria Luz Torre San Francisco Health Plan Advisory Committee
Eduardo Vega Mental Health Association of San Francisco
Randy Wittorp (Alternate: Elizabeth Ferber) Kaiser Permanente
Abbie Yant (Alternates: Allan Fox, Shay Strachan)
St. Francis Memorial Hospital
Appendix D: Neighborhood-Specific Health Profiles
Between July 2011 and May 2012, the HCSMP Task Force conducted 10 public meetings for the purposes of member discussion, engaging community members in dialogue, and informing the final HCSMP. Of those, four Task Force meetings took place in different community locations to ensure transparency and opportunity for community feedback. SFDPH and Planning selected these four neighborhood areas based on quantitative data indicating that residents in these geographic areas face higher rates of health disparities. These four neighborhood areas were grouped as follows:
Bernal Heights, Mission, Excelsior
Chinatown, Tenderloin, SOMA, Civic Center
Western Addition, Richmond, Sunset
Bayview-Hunters Point, Visitacion Valley To inform Task Force member discussion and community dialogue, consultant Harder + Company Community Research developed health profiles for each of the four neighborhood areas. Please find English versions of the four profiles in the pages that follow. Spanish and Chinese versions of each profile are available via the SFDPH website.
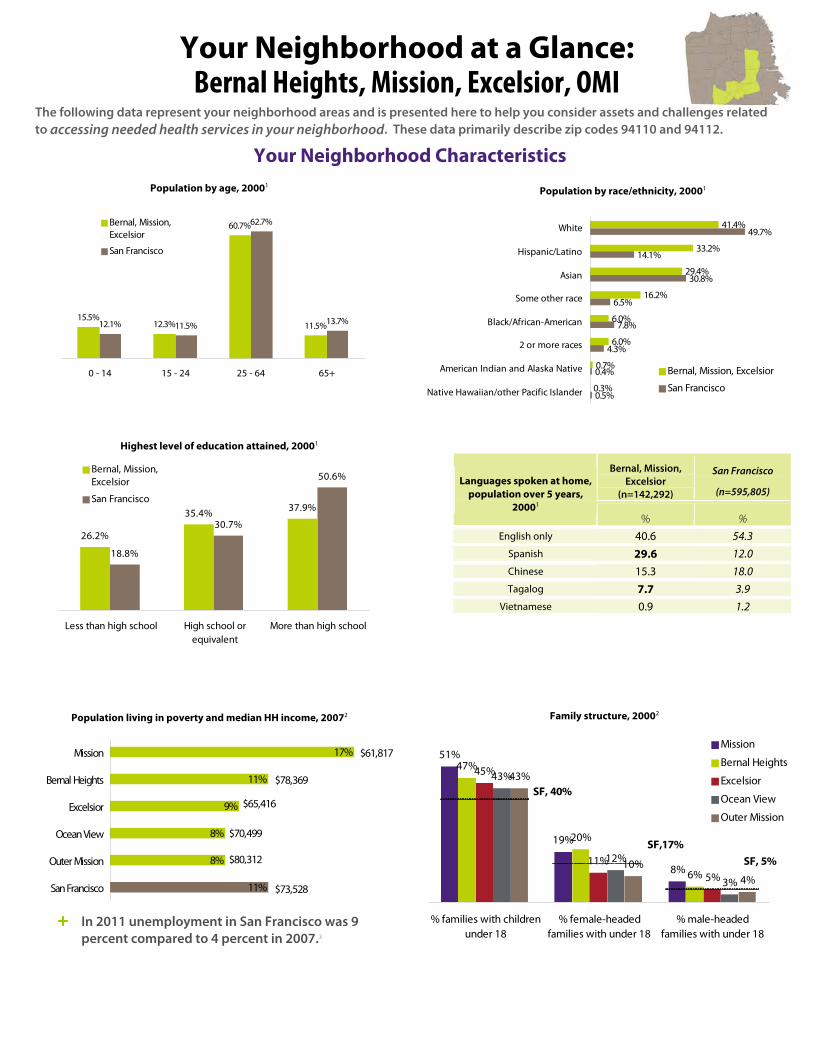
The following data represent your neighborhood areas and is presented here to help you consider assets and challenges related to accessing needed health services in your neighborhood. These data primarily describe zip codes 94110 and 94112.
Bernal, Mission,
Excelsior (n=142,292)
San Francisco
(n=595,805) Languages spoken at home,
population over 5 years, 20001
% % English only 40.6 54.3
Spanish 29.6 12.0 Chinese 15.3 18.0 Tagalog 7.7 3.9
Vietnamese 0.9 1.2
15.5%12.3%
60.7%
11.5%12.1% 11.5%
62.7%
13.7%
0 - 14 15 - 24 25 - 64 65+
Bernal, Mission,Excelsior
San Francisco
Your Neighborhood at a Glance: Bernal Heights, Mission, Excelsior, OMI
17%
11%
9%
8%
8%
11%
Mission
Bernal Heights
Excelsior
Ocean View
Outer Mission
San Francisco
$61,817
$78,369
$65,416
$70,499
$80,312
$73,528
51%
19%
8%
47%
20%
6%
45%
11%5%
43%
12%
3%
43%
10%4%
% families with childrenunder 18
% female-headedfamilies with under 18
% male-headedfamilies with under 18
Mission
Bernal Heights
Excelsior
Ocean View
Outer Mission
SF, 40%
SF,17%SF, 5%
26.2%
35.4% 37.9%
18.8%
30.7%
50.6%
Less than high school High school orequivalent
More than high school
Bernal, Mission,Excelsior
San Francisco
Population living in poverty and median HH income, 20072
Highest level of education attained, 20001
Population by race/ethnicity, 20001Population by age, 20001
+ In 2011 unemployment in San Francisco was 9 percent compared to 4 percent in 2007.3
Family structure, 20002
Your Neighborhood Characteristics
41.4%
33.2%
29.4%
16.2%
6.0%
6.0%
0.7%
0.3%
49.7%
14.1%
30.8%
6.5%
7.8%
4.3%
0.4%
0.5%
White
Hispanic/Latino
Asian
Some other race
Black/African-American
2 or more races
American Indian and Alaska Native
Native Hawaiian/other Pacific Islander
Bernal, Mission, Excelsior
San Francisco
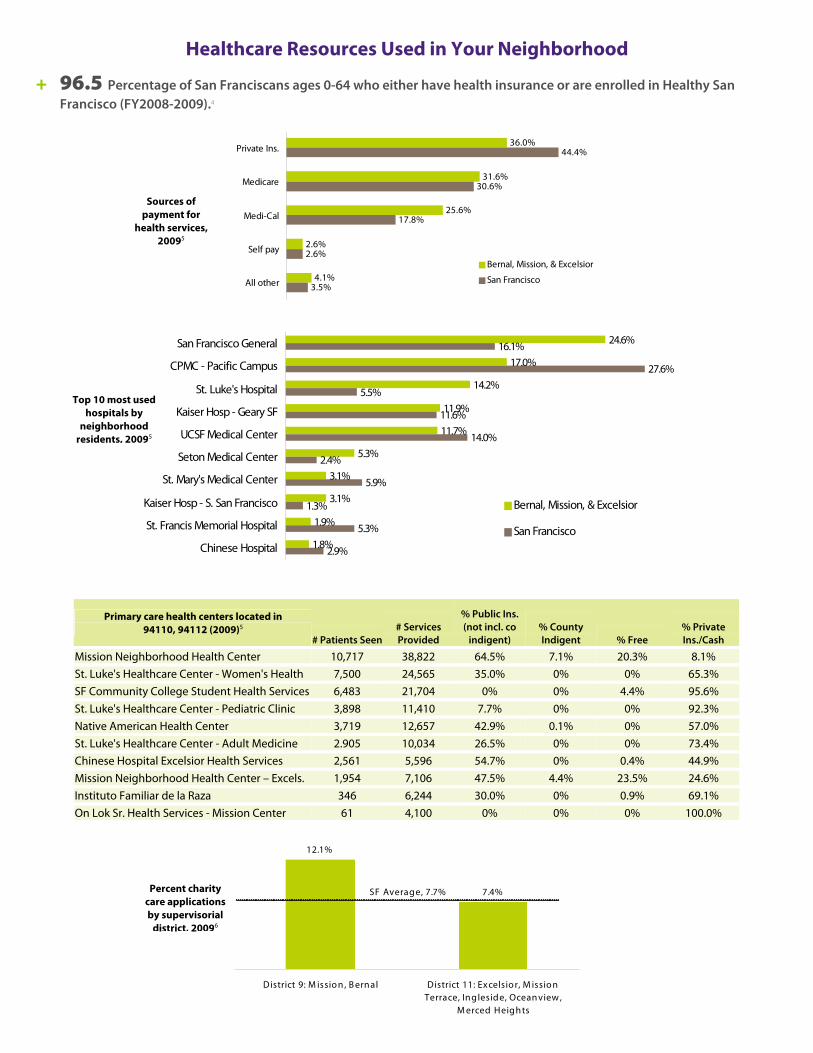
Healthcare Resources Used in Your Neighborhood
+ 96.5 Percentage of San Franciscans ages 0-64 who either have health insurance or are enrolled in Healthy San Francisco (FY2008-2009).4
36.0%
31.6%
25.6%
2.6%
4.1%
44.4%
30.6%
17.8%
2.6%
3.5%
Private Ins.
Medicare
Medi-Cal
Self pay
All other
Bernal, Mission, & Excelsior
San Francisco
24.6%
17.0%
14.2%
11.9%
11.7%
5.3%
3.1%
3.1%
1.9%
1.8%
16.1%
27.6%
5.5%
11.6%
14.0%
2.4%
5.9%
1.3%
5.3%
2.9%
San Francisco General
CPMC - Pacific Campus
St. Luke's Hospital
Kaiser Hosp - Geary SF
UCSF Medical Center
Seton Medical Center
St. Mary's Medical Center
Kaiser Hosp - S. San Francisco
St. Francis Memorial Hospital
Chinese Hospital
Bernal, Mission, & Excelsior
San Francisco
Primary care health centers located in 94110, 94112 (2009)5
# Patients Seen# Services Provided
% Public Ins. (not incl. co
indigent) % County Indigent % Free
% Private Ins./Cash
Mission Neighborhood Health Center 10,717 38,822 64.5% 7.1% 20.3% 8.1% St. Luke's Healthcare Center - Women's Health 7,500 24,565 35.0% 0% 0% 65.3% SF Community College Student Health Services 6,483 21,704 0% 0% 4.4% 95.6% St. Luke's Healthcare Center - Pediatric Clinic 3,898 11,410 7.7% 0% 0% 92.3% Native American Health Center 3,719 12,657 42.9% 0.1% 0% 57.0% St. Luke's Healthcare Center - Adult Medicine 2.905 10,034 26.5% 0% 0% 73.4% Chinese Hospital Excelsior Health Services 2,561 5,596 54.7% 0% 0.4% 44.9% Mission Neighborhood Health Center – Excels. 1,954 7,106 47.5% 4.4% 23.5% 24.6% Instituto Familiar de la Raza 346 6,244 30.0% 0% 0.9% 69.1% On Lok Sr. Health Services - Mission Center 61 4,100 0% 0% 0% 100.0%
12.1%
7.4%
District 9: M issio n , B ernal District 11: Excelsio r, M issio nTerrace, Ingleside, Ocean view ,
M erced Heights
SF Average, 7.7%
Sources of payment for
health services, 20095
Top 10 most used hospitals by
neighborhood residents, 20095
Percent charity care applications by supervisorial
district, 20096
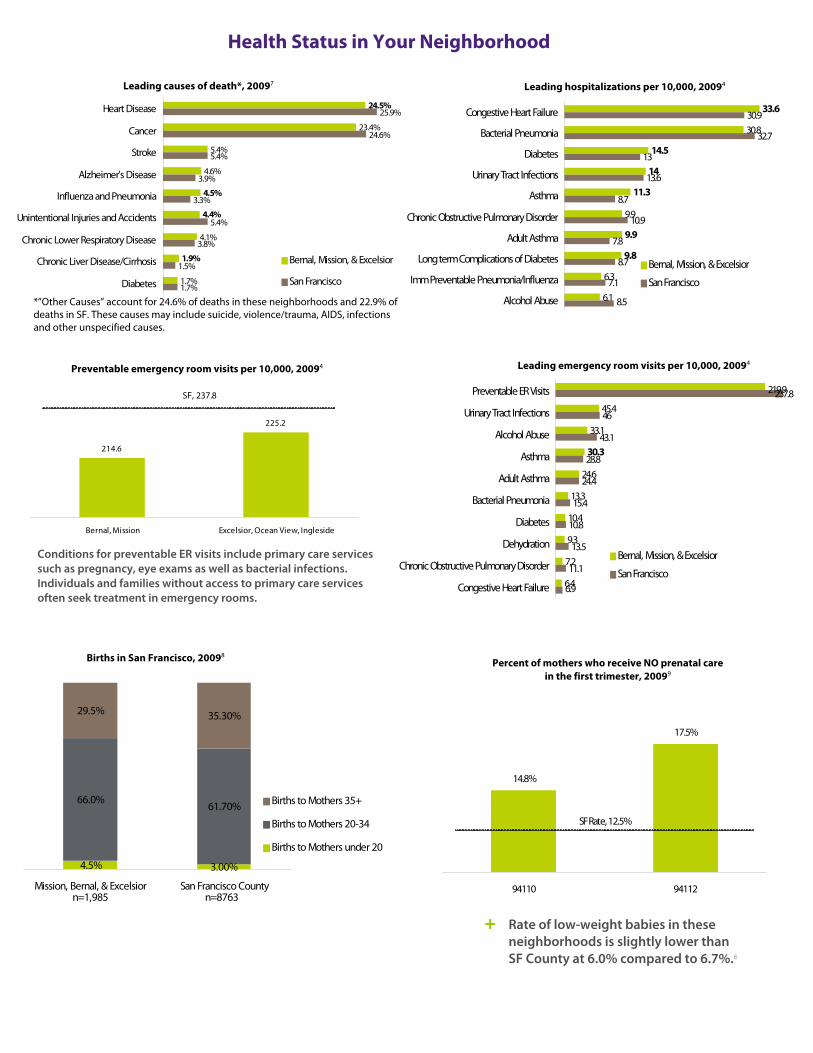
23.4%
5.4%
4.6%
4.1%
1.7%
25.9%
24.6%
5.4%
3.9%
3.3%
5.4%
3.8%
1.5%
1.7%
1.9%
4.4%
4.5%
24.5% Heart Disease
Cancer
Stroke
Alzheimer's Disease
Influenza and Pneumonia
Unintentional Injuries and Accidents
Chronic Lower Respiratory Disease
Chronic Liver Disease/Cirrhosis
Diabetes
Bernal, Mission, & Excelsior
San Francisco
Health Status in Your Neighborhood
Leading causes of death*, 20097
30.8
9.9
6.3
6.1
30.9
13
13.6
8.7
7.8
8.79.8
9.9
11.3
14
14.5
33.6
8.5
7.1
10.9
32.7
Congestive Heart Failure
Bacterial Pneumonia
Diabetes
Urinary Tract Infections
Asthma
Chronic Obstructive Pulmonary Disorder
Adult Asthma
Long term Complications of Diabetes
Imm Preventable Pneumonia/Influenza
Alcohol Abuse
Bernal, Mission, & Excelsior
San Francisco
219.9
45.4
33.1
24.6
13.3
10.4
9.3
7.2
6.4
46
28.8
24.4
10.8
6.9
30.3
11.1
13.5
15.4
43.1
237.8Preventable ER Visits
Urinary Tract Infections
Alcohol Abuse
Asthma
Adult Asthma
Bacterial Pneumonia
Diabetes
Dehydration
Chronic Obstructive Pulmonary Disorder
Congestive Heart Failure
Bernal, Mission, & Excelsior
San Francisco
214.6
225.2
Bernal, Mission Excelsior, Ocean View, Ingleside
SF, 237.8
Conditions for preventable ER visits include primary care services such as pregnancy, eye exams as well as bacterial infections. Individuals and families without access to primary care services often seek treatment in emergency rooms.
4.5% 3.00%
66.0%61.70%
29.5% 35.30%
Mission, Bernal, & Excelsior San Francisco County
Births to Mothers 35+
Births to Mothers 20-34
Births to Mothers under 20
n=1,985 n=8763
14.8%
17.5%
94110 94112
SF Rate, 12.5%
+ Rate of low-weight babies in these neighborhoods is slightly lower than SF County at 6.0% compared to 6.7%.8
Leading hospitalizations per 10,000, 20094
Preventable emergency room visits per 10,000, 20094 Leading emergency room visits per 10,000, 20094
Births in San Francisco, 20098 Percent of mothers who receive NO prenatal care
in the first trimester, 20099
*”Other Causes” account for 24.6% of deaths in these neighborhoods and 22.9% of deaths in SF. These causes may include suicide, violence/trauma, AIDS, infections and other unspecified causes.

US
15.5
11.9
Bernal, Mission, & Excelsior San Francisco
0.3
0.2
0.2
0.1
0.3
0.5Mission
Ocean View
Bernal Heights
Excelsior
Outer Mission
San Francisco County
34
32
32
23
44
69Mission
Bernal Heights
Excelsior
Outer Mission
Ocean View
San Francisco County
Health Status, continued
101
70
48
34
101
109Mission
Outer Mission
Bernal Heights
Excelsior
Ocean View
San Francisco County
4%
15%
6%
16%
21%
10%
81%
64%
84%
District 9: Mission, BernalHeights
District 11: Excelsior,Mission Terrace, Ingleside,
Oceanview, Merced Heights
San Francisco County
Very unsafe or unsafeNeither safe nor unsafVery safe or safe
33%
49%
25%
36%
22%
23%
32%
28%
52%
District 9: Mission, BernalHeights
District 11: Excelsior, MissionTerrace, Ingleside, Oceanview,
Merced Heights
San Francisco County
Very unsafe or unsaf
Neither safe nor unsVery safe or safe
Safety in Your Neighborhood
Pediatric asthma hospitalizations per 10,000, 20084
Obesity in San Francisco by Race/Ethnicity, 200910
Pedestrian injuries and deaths per 100,000 (2004-2008)2
Residents’ perceived safety during day, 20092
Residents’ perceived safety during night, 20092
Physical assaults per 1,000 (2005-2007)2
Homicides per 1,000 (2005-2007)2
REFERENCES 1. US Census Bureau, Census 2000 2. San Francisco Department of Public Health, The Healthy Development
Measurement Tool (HDMT) 3. US Bureau of Labor Statistics 4. Health Matters in San Francisco 5. Office of Statewide Health Planning and Development, Healthcare
Information Division 6. San Francisco Department of Public Health, Charity Care Report Fiscal Year
2009 7. California Department of Public Health, Death Profiles by ZIP Code 8. California Department of Public Health, Birth Profiles by ZIP Code 9. San Francisco Department of Public Health, Maternal, Child and
Adolescent Health 10. California Health Interview Survey (CHIS), CHIS 2009, Adult Public Use File,
UCLA Center for Health Policy Research Prepared by harder+company community research for the San Francisco Department of Public Health, Health Care Services Master Plan Community Meeting held on September 22, 2011.
56.9%
33.4%
13.2%
7.1%
29.9%
27.6%
21.1%
7.2%
Latino
African-American
White
AsianSan Francisco
California
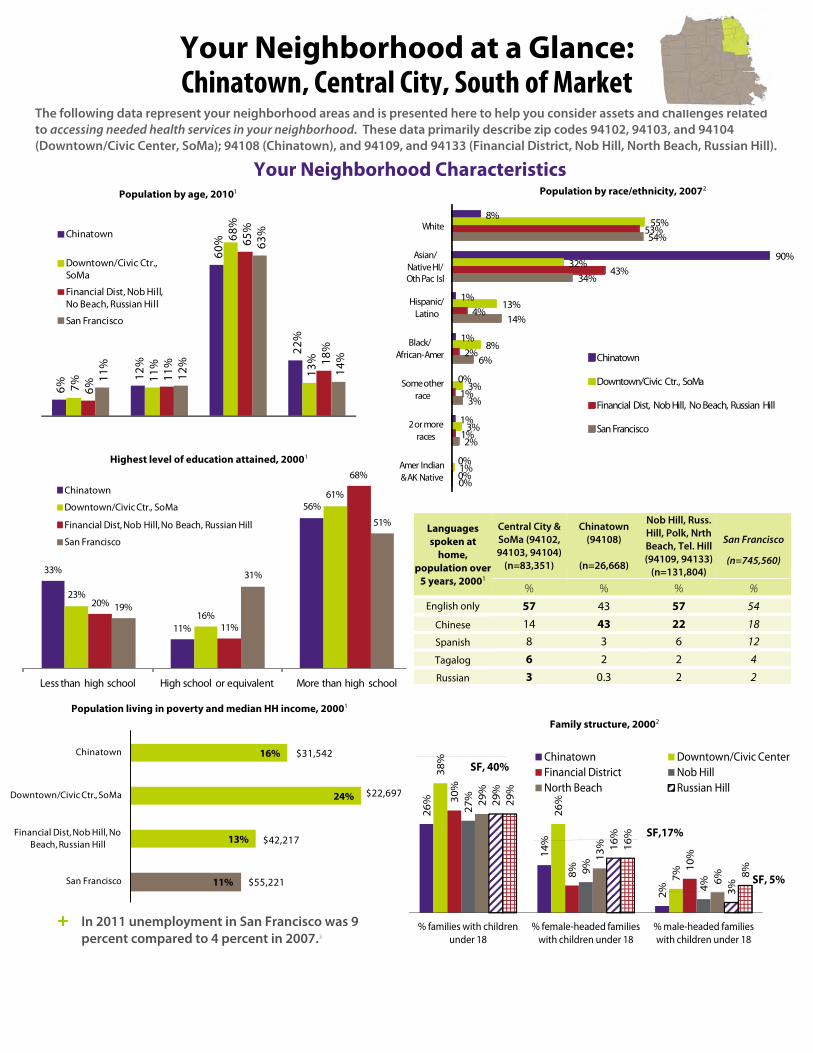
Languages spoken at
home, population over
5 years, 20001
Central City & SoMa (94102, 94103, 94104)
(n=83,351)
Chinatown (94108)
(n=26,668)
Nob Hill, Russ. Hill, Polk, Nrth Beach, Tel. Hill (94109, 94133)
(n=131,804)
San Francisco
(n=745,560)
% % % % English only 57 43 57 54
Chinese 14 43 22 18 Spanish 8 3 6 12
Tagalog 6 2 2 4
Russian 3 0.3 2 2
The following data represent your neighborhood areas and is presented here to help you consider assets and challenges relatedto accessing needed health services in your neighborhood. These data primarily describe zip codes 94102, 94103, and 94104 (Downtown/Civic Center, SoMa); 94108 (Chinatown), and 94109, and 94133 (Financial District, Nob Hill, North Beach, Russian Hill).
Your Neighborhood at a Glance: Chinatown, Central City, South of Market
Your Neighborhood Characteristics Population by race/ethnicity, 20072
6%
12%
60%
22%
7%
11%
68%
13%
6%
11%
65%
18%
11%
12%
63%
14%
Chinatown
Downtown/Civic Ctr., SoMa
Financial Dist, Nob Hill, No Beach, Russian Hill
San Francisco
Population by age, 20101
16%
24%
13%
11%
Chinatown
Downtown/Civic Ctr., SoMa
Financial Dist, Nob Hill, No Beach, Russian Hill
San Francisco
$31,542
$22,697
$42,217
$55,221
26%
14%
2%
38%
26%
7%
30%
8%
10%
27%
9%
4%
29%
13%
6%
29%
16%
3%
29%
16%
8%
% families with children under 18
% female-headed families with children under 18
% male-headed families with children under 18
Chinatown Downtown/Civic CenterFinancial District Nob HillNorth Beach Russian Hill
SF, 40%
SF,17%
SF, 5%
33%
11%
56%
23%
16%
61%
20%
11%
68%
19%
31%
51%
Less than high school High school or equivalent More than high school
8%
90%
1%
1%
0%
1%
0%
55%
32%
13%
8%
3%
3%
1%
53%
43%
4%
2%
1%
1%
0%
54%
34%
14%
6%
3%
2%
0%
White
Asian/Native HI/Oth Pac Isl
Hispanic/Latino
Black/African-Amer
Some other race
2 or more races
Amer Indian & AK Native
Chinatown
Downtown/Civic Ctr., SoMa
Financial Dist, Nob Hill, No Beach, Russian Hill
San Francisco
Highest level of education attained, 20001
Chinatown
Downtown/Civic Ctr., SoMa
Financial Dist, Nob Hill, No Beach, Russian Hill
San Francisco
Population living in poverty and median HH income, 20001 Family structure, 20002
+ In 2011 unemployment in San Francisco was 9 percent compared to 4 percent in 2007.3
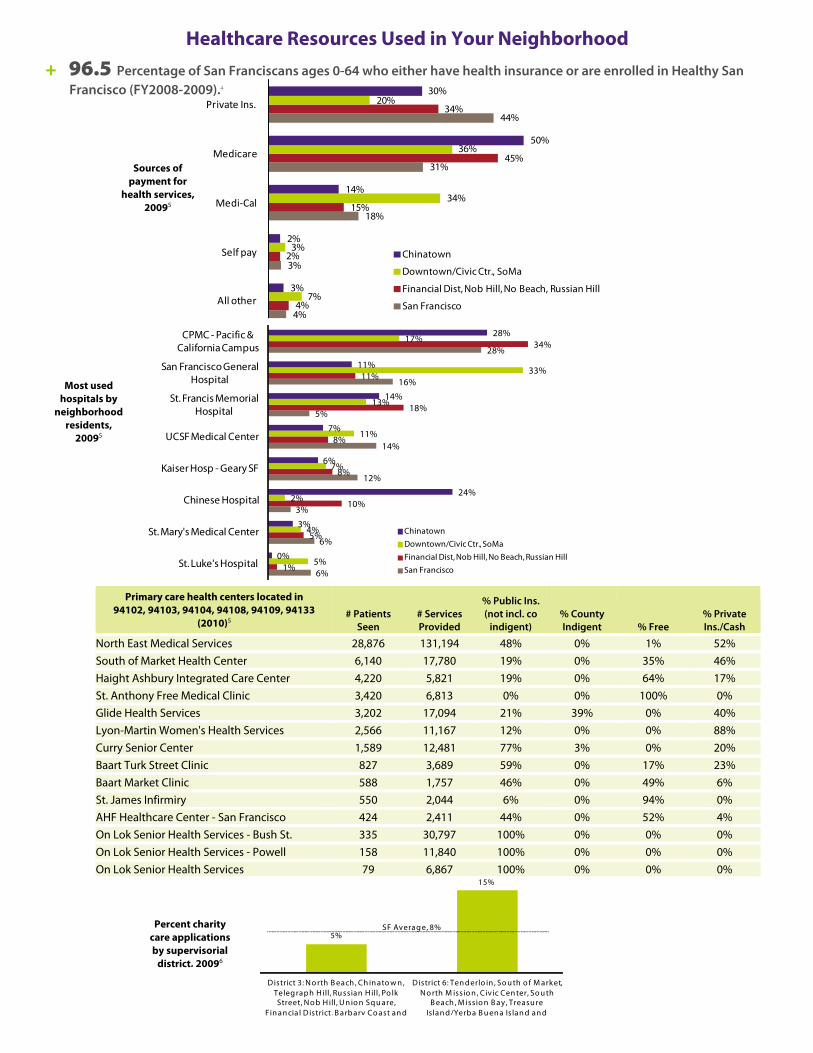
Healthcare Resources Used in Your Neighborhood + 96.5 Percentage of San Franciscans ages 0-64 who either have health insurance or are enrolled in Healthy San
Francisco (FY2008-2009).4
Sources of
payment for health services,
20095
Primary care health centers located in 94102, 94103, 94104, 94108, 94109, 94133
(2010)5 # Patients
Seen # Services Provided
% Public Ins. (not incl. co
indigent) % County Indigent % Free
% Private Ins./Cash
North East Medical Services 28,876 131,194 48% 0% 1% 52% South of Market Health Center 6,140 17,780 19% 0% 35% 46% Haight Ashbury Integrated Care Center 4,220 5,821 19% 0% 64% 17% St. Anthony Free Medical Clinic 3,420 6,813 0% 0% 100% 0% Glide Health Services 3,202 17,094 21% 39% 0% 40% Lyon-Martin Women's Health Services 2,566 11,167 12% 0% 0% 88% Curry Senior Center 1,589 12,481 77% 3% 0% 20% Baart Turk Street Clinic 827 3,689 59% 0% 17% 23% Baart Market Clinic 588 1,757 46% 0% 49% 6% St. James Infirmiry 550 2,044 6% 0% 94% 0% AHF Healthcare Center - San Francisco 424 2,411 44% 0% 52% 4% On Lok Senior Health Services - Bush St. 335 30,797 100% 0% 0% 0% On Lok Senior Health Services - Powell 158 11,840 100% 0% 0% 0%
4%
3%
18%
31%
44%
4%
2%
15%
45%
34%
7%
3%
34%
36%
20%
3%
2%
14%
50%
30%
All other
Self pay
Medi‐Cal
Medicare
Private Ins.
Chinatown
Downtown/Civic Ctr., SoMa
Financial Dist, Nob Hill, No Beach, Russian Hill
San Francisco
6%
6%
3%
12%
14%
5%
16%
28%
1%
5%
10%
8%
8%
18%
11%
34%
5%
4%
2%
7%
11%
13%
33%
17%
0%
3%
24%
6%
7%
14%
11%
28%
St. Luke's Hospital
St. Mary's Medical Center
Chinese Hospital
Kaiser Hosp - Geary SF
UCSF Medical Center
St. Francis Memorial Hospital
San Francisco General Hospital
CPMC - Pacific & California Campus
Most used hospitals by
neighborhood residents,
20095
Chinatown
Downtown/Civic Ctr., SoMa
Financial Dist, Nob Hill, No Beach, Russian Hill
San Francisco
On Lok Senior Health Services 79 6,867 100% 0% 0% 0%
5%
15%
District 3: N o rth B each , Ch in ato w n , Teleg raph H ill, Ru ssian H ill, Po lk Street, N o b H ill, U n io n Sq u are,
Fin an cia l District
Percent charity care applications by supervisorial
district, 20096
SF Averag e, 8%
Co ast an d
District 6: Ten d erlo in , So u th o f M arket, N o rth M issio n , Civic Cen ter, So u th
B each , M issio n B ay , Treasu re Islan d, B arbary /Yerba B u en a Is lan d an d
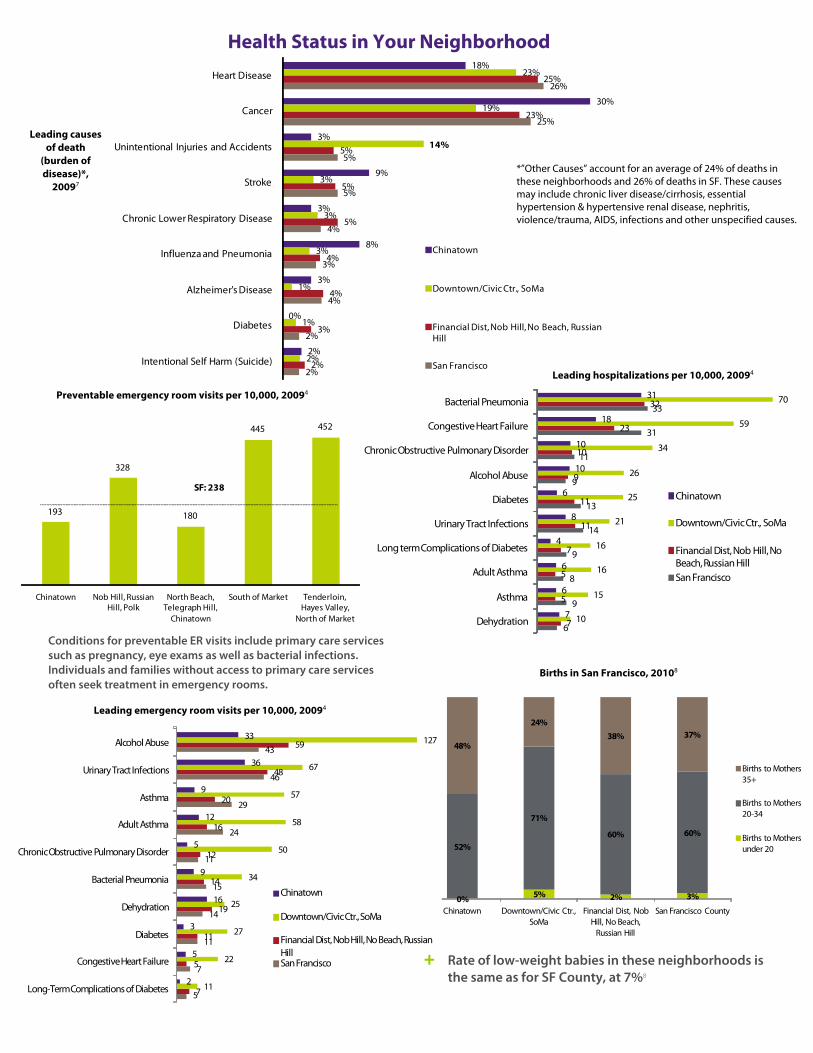
Health Status in Your Neighborhood
Leading causes of death
(burden of disease)*,
20097
*”Other Causes” account for an average of 24% of deaths in these neighborhoods and 26% of deaths in SF. These causes may include chronic liver disease/cirrhosis, essential hypertension & hypertensive renal disease, nephritis, violence/trauma, AIDS, infections and other unspecified causes.
Preventable emergency room visits per 10,000, 20094
18%23%
25%Heart Disease
30%
3%
9%
3%
8%
3%
0%
2%
19%
14%
3%
3%
3%
1%
1%
2%
23%
5%
5%
5%
4%
4%
3%
2%
26%
25%
5%
5%
4%
3%
4%
2%
2%
Cancer
Unintentional Injuries and Accidents
Stroke
Chronic Lower Respiratory Disease
Influenza and Pneumonia
Alzheimer's Disease
Diabetes
Intentional Self Harm (Suicide)
Chinatown
Downtown/Civic Ctr., SoMa
Financial Dist, Nob Hill, No Beach, Russian Hill
San FranciscoLeading hospitalizations per 10,000, 20094
6
9
8
9
14
13
9
11
31
33
7
5
5
7
11
11
9
10
23
32
10
15
16
16
21
25
26
34
59
70
7
6
6
4
8
6
10
10
18
31
Dehydration
Asthma
Adult Asthma
term Complications of Diabetes
Urinary Tract Infections
Diabetes
Alcohol Abuse
ic Obstructive Pulmonary Disorder
Congestive Heart Failure
Bacterial Pneumonia
193
328
180
445 452
Chinatown Nob Hill, Russian Hill, Polk
North Beach, Telegraph Hill,
Chinatown
South of Market Tenderloin, Hayes Valley,
North of Market
SF: 238
Long
Chron
Chinatown
Downtown/Civic Ctr., SoMa
Financial Dist, Nob Hill, No Beach, Russian HillSan Francisco
Births in San Francisco, 20108
0% 5% 2% 3%
52%
71%
60% 60%
48%
24%38% 37%
Chinatown Downtown/Civic Ctr., SoMa
Financial Dist, Nob Hill, No Beach,
Russian Hill
San Francisco County
Births to Mothers 35+
Births to Mothers 20-34
Births to Mothers under 20
Leading emergency room visits per 10,000, 20094
5
7
11
14
15
11
24
29
46
43
7
5
11
19
14
12
16
20
48
59
11
22
27
25
34
50
58
57
67
127
2
5
3
16
9
5
12
9
36
33
Long-Term Complications of Diabetes
Congestive Heart Failure
Diabetes
Dehydration
Bacterial Pneumonia
Chronic Obstructive Pulmonary Disorder
Adult Asthma
Asthma
Urinary Tract Infections
Alcohol Abuse
Chinatown
Downtown/Civic Ctr., SoMa
Financial Dist, Nob Hill, No Beach, Russian HillSan Francisco
+ Rate of low-weight babies in these neighborhoods is the same as for SF County, at 7%8
Conditions for preventable ER visits include primary care services such as pregnancy, eye exams as well as bacterial infections. Individuals and families without access to primary care services often seek treatment in emergency rooms.
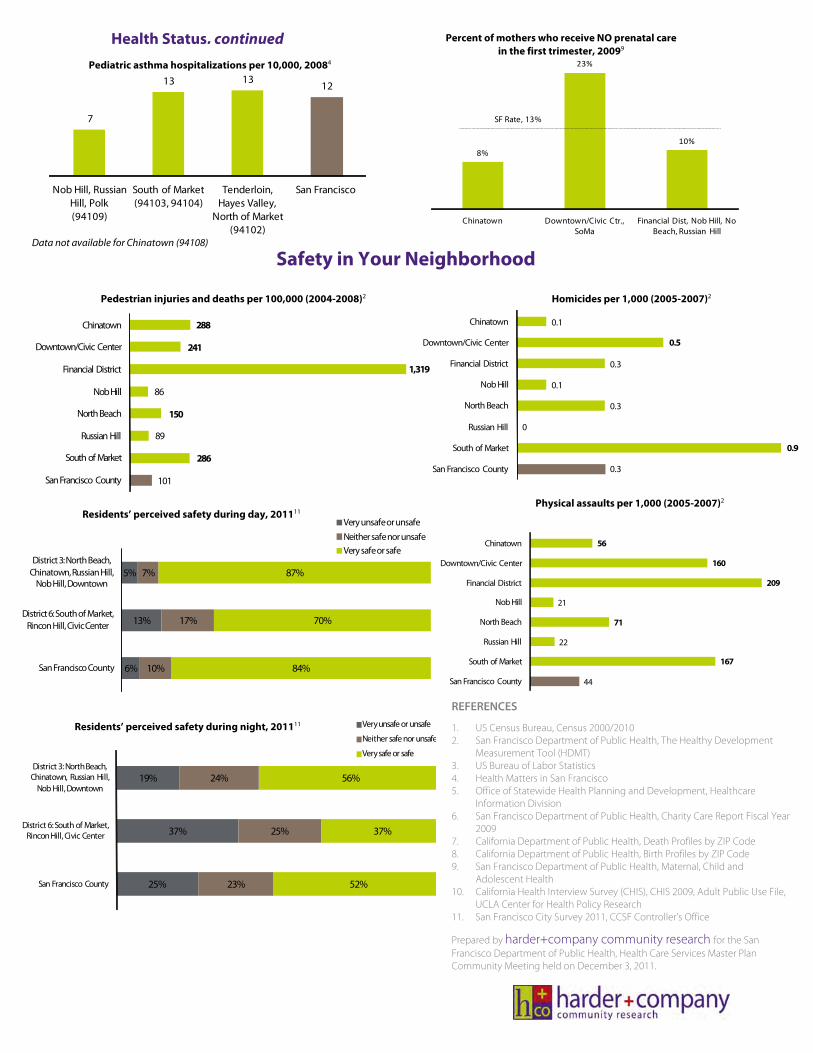
7
13 13 12
Nob Hill, Russian Hill, Polk (94109)
South of Market (94103, 94104)
Tenderloin, Hayes Valley,
North of Market (94102)
San Francisco
Health Status, continued
8%
23%
10%
Chinatown Downtown/Civic Ctr., SoMa
Financial Dist, Nob Hill, No Beach, Russian Hill
SF Rate, 13%
Percent of mothers who receive NO prenatal care in the first trimester, 20099
Pediatric asthma hospitalizations per 10,000, 20084
Data not available for Chinatown (94108)
Safety in Your Neighborhood
288
241
1,319
86
150
89
286
101
Chinatown
Downtown/Civic Center
Financial District
NobHill
NorthBeach
Russian Hill
South of Market
San Francisco County
5%
13%
6%
7%
17%
10%
87%
70%
84%
District 3: North Beach, Chinatown, Russian Hill,
Nob Hill, Downtown
District 6: South of Market, Rincon Hill, Civic Center
San Francisco County
Very unsafe or unsafeNeither safe nor unsafeVery safe or safe
19%
37%
25%
24%
25%
23%
56%
37%
52%
District 3: North Beach, Chinatown, Russian Hill,
Nob Hill, Downtown
District 6: South of Market, Rincon Hill, Civic Center
San Francisco County
Very unsafe
Physical assaults per 1,000 (2005-2007)2
Homicides per 1,000 (2005-2007)2
0.1
0.5
0.3
0.1
0.3
0
0.9
0.3
Chinatown
Downtown/Civic Center
Financial District
Nob Hill
North Beach
Russian Hill
South of Market
San Francisco County
56
160
209
21
71
22
167
44
Chinatown
Downtown/Civic Center
Financial District
Nob Hill
North Beach
Russian Hill
South of Market
San Francisco County
Pedestrian injuries and deaths per 100,000 (2004-2008)2
Residents’ perceived safety during day, 201111
REFERENCES
1. US Census Bureau, Census 2000/2010 2. San Francisco Department of Public Health, The Healthy Development
Measurement Tool (HDMT) 3. US Bureau of Labor Statistics 4. Health Matters in San Francisco 5. Office of Statewide Health Planning and Development, Healthcare
Information Division 6. San Francisco Department of Public Health, Charity Care Report Fiscal Year
2009 7. California Department of Public Health, Death Profiles by ZIP Code 8. California Department of Public Health, Birth Profiles by ZIP Code 9. San Francisco Department of Public Health, Maternal, Child and
Adolescent Health 10. California Health Interview Survey (CHIS), CHIS 2009, Adult Public Use File,
UCLA Center for Health Policy Research 11. San Francisco City Survey 2011, CCSF Controller’s Office
Prepared by harder+company community research for the San Francisco Department of Public Health, Health Care Services Master Plan Community Meeting held on December 3, 2011.
or unsafeResidents’ perceived safety during night, 201111
Neither safe nor unsafe
Very safe or safe
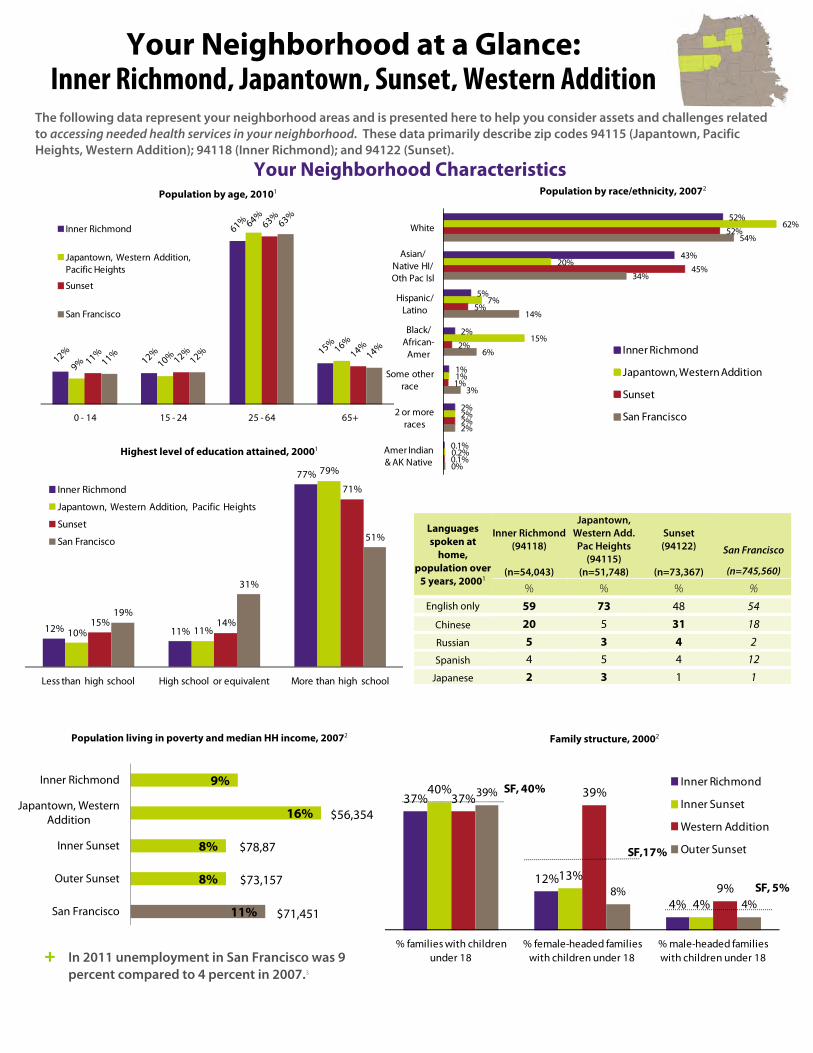
Languages spoken at
home, population over
5 years, 20001
Inner Richmond (94118)
(n=54,043)
Japantown, Western Add. Pac Heights
(94115) (n=51,748)
Sunset (94122)
(n=73,367)
San Francisco
(n=745,560)
% % % % English only 59 73 48 54
Chinese 20 5 31 18
Russian 5 3 4 2 Spanish 4 5 4 12
Japanese 2 3 1 1
The following data represent your neighborhood areas and is presented here to help you consider assets and challenges relatedto accessing needed health services in your neighborhood. These data primarily describe zip codes 94115 (Japantown, Pacific Heights, Western Addition); 94118 (Inner Richmond); and 94122 (Sunset).
0 - 14 15 - 24 25 - 64 65+
Inner Richmond
Japantown, Western Addition, Pacific Heights
Sunset
San Francisco
Your Neighborhood at a Glance: Inner Richmond, Japantown, Sunset, Western Addition
9%
16%
8%
8%
11%
Inner Richmond
Japantown, Western Addition
Inner Sunset
Outer Sunset
San Francisco
$56,354
$78,87
$71,451
$73,157
37%
12%
4%
40%
13%
4%
37% 39%
9%
39%
8%4%
% families with children under 18
% female-headed families with children under 18
% male-headed families with children under 18
Inner Richmond
Inner Sunset
Western Addition
Outer Sunset
SF, 40%
SF,17%
SF, 5%
12% 11%
77%
10% 11%
79%
15% 14%
71%
19%
31%
51%
Less than high school High school or equivalent More than high school
Inner Richmond
Japantown, Western Addition, Pacific Heights
Sunset
San Francisco
Population living in poverty and median HH income, 20072
Highest level of education attained, 20001
Population by race/ethnicity, 20072 Population by age, 20101
+ In 2011 unemployment in San Francisco was 9 percent compared to 4 percent in 2007.3
Family structure, 20002
Your Neighborhood Characteristics
52%
43%
5%
2%
1%
2%
0.1%
62%
20%
7%
15%
1%
2%
0.2%
52%
45%
5%
2%
1%
2%
0.1%
54%
34%
14%
6%
3%
2%
0%
White
Asian/Native HI/Oth Pac Isl
Hispanic/Latino
Black/African-
Amer
Some other race
2 or more races
Amer Indian & AK Native
Inner Richmond
Japantown, Western Addition
Sunset
San Francisco

Primary care health centers located in 94115, 94118, and 94122 (2010)5 # Patients
Seen # Services Provided
% Public Ins. (not incl. co
indigent) % County Indigent % Free
% Private Ins./Cash
North East Medical Services - Noriega 4,421 13,525 47% 0% 0% 53%
Chinese Community Health Services 2,593 8,739 35% 0% 0% 65%
San Francisco Free Clinic 1,632 3,725 0% 0% 100% 0%
On Lok Senior Health by IOA 138 7,661 100% 0% 0% 0%
Institute on Aging 127 6,993 100% 0% 0% 0%
Sources of payment for
hospital services, 20095
Percent charity care applications by supervisorial
district, 20096
Most used hospitals by
neighborhood residents,
20095
Healthcare Resources Used in Your Neighborhood + 96.5 Percentage of San Franciscans ages 0-64 who either have health insurance or are enrolled in Healthy San
Francisco (FY2008-2009).4
35%
45%
15%
3%
2%
52%
35%
9%
2%
2%
48%
39%
10%
2%
2%
44%
31%
18%
3%
4%
Private Ins.
Medicare
Medi-Cal
Self pay
All other
94115 (Japantown, W. Addition, Pac Heights)
94118 (Inner Richmond)
94122 (Sunset)
San Francisco47%
14%
11%
6%
9%
3%
1%
0%
1%
1%
45%
13%
13%
11%
6%
3%
2%
1%
1%
1%
28%
25%
16%
11%
6%
2%
2%
2%
1%
1%
28%
14%
12%
6%
16%
5%
3%
2%
6%
0%
CPMC - Pacific Campus
UCSF Medical Center
Kaiser Hosp - Geary SF
St. Mary's Medical Center
San Francisco General Hospital
St. Francis Memorial Hospital
Chinese Hospital
Seton Medical Center
St. Luke's Hospital
Jewish Home
94115 (Japantown, W. Addition, Pac Heights)
94118 (Inner Richmond)
94122 (Sunset)
San Francisco
3%
4%
6%
District 1: Richmond, Laurel Heights
District 4: Outer Sunset, Parkside
District 5: Western Addition, Haight-
Ashbury, Cole Valley
SF Average, 8%
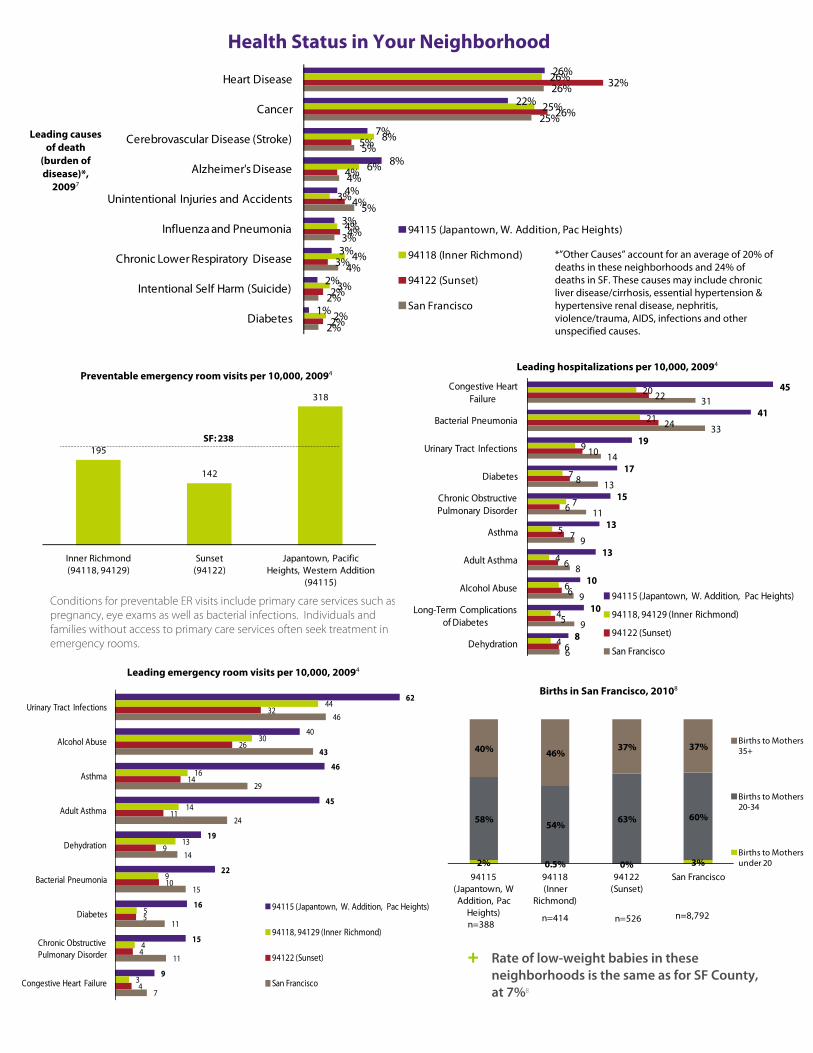
Health Status in Your Neighborhood
Leading causes of death
(burden of disease)*,
20097
Preventable emergency room visits per 10,000, 20094
Leading emergency room visits per 10,000, 20094
Births in San Francisco, 20108
*”Other Causes” account for an average of 20% of deaths in these neighborhoods and 24% of deaths in SF. These causes may include chronic liver disease/cirrhosis, essential hypertension & hypertensive renal disease, nephritis, violence/trauma, AIDS, infections and other unspecified causes.
26%
22%
7%
8%
4%
3%
3%
2%
1%
26%
25%
8%
6%
3%
4%
4%
3%
2%
32%
26%
5%
4%
4%
4%
3%
2%
2%
26%
25%
5%
4%
5%
3%
4%
2%
2%
Heart Disease
Cancer
Cerebrovascular Disease (Stroke)
Alzheimer's Disease
Unintentional Injuries and Accidents
Influenza and Pneumonia
Chronic Lower Respiratory Disease
Intentional Self Harm (Suicide)
Diabetes
94115 (Japantown, W. Addition, Pac Heights)
94118 (Inner Richmond)
94122 (Sunset)
San Francisco
Leading hospitalizations per 10,000, 20094
195
142
318
Inner Richmond (94118, 94129)
Sunset (94122)
Japantown, Pacific Heights, Western Addition
(94115)
SF: 238
+ Rate of low-weight babies in these neighborhoods is the same as for SF County, at 7%8
Conditions for preventable ER visits include primary care services such as pregnancy, eye exams as well as bacterial infections. Individuals and families without access to primary care services often seek treatment in emergency rooms.
45
41
19
17
15
13
13
10
10
8
20
21
9
7
7
5
4
6
4
4
22
24
10
8
6
7
6
6
5
6
31
33
14
13
11
9
8
9
9
6
Congestive Heart Failure
Bacterial Pneumonia
Urinary Tract Infections
Diabetes
Chronic Obstructive Pulmonary Disorder
Asthma
Adult Asthma
Alcohol Abuse
Long-Term Complications of Diabetes
Dehydration
94115 (Japantown, W. Addition, Pac Heights)
94118, 94129 (Inner Richmond)
94122 (Sunset)
San Francisco
62
40
46
45
19
22
16
15
9
44
30
16
14
13
9
5
4
3
32
26
14
11
9
10
5
4
4
46
43
29
24
14
15
11
11
7
Urinary Tract Infections
Alcohol Abuse
Asthma
Adult Asthma
Dehydration
Bacterial Pneumonia
Diabetes
Chronic Obstructive Pulmonary Disorder
Congestive Heart Failure
94115 (Japantown, W. Addition, Pac Heights)
94118, 94129 (Inner Richmond)
94122 (Sunset)
San Francisco
2% 0.5% 0% 3%
58% 54% 63% 60%
40% 46%37% 37%
94115 (Japantown, W Addition, Pac
Heights)
94118(Inner
Richmond)
94122 (Sunset)
San Francisco
Births to Mothers 35+
Births to Mothers 20-34
Births to Mothers under 20
n=388n=414 n=8,792n=526
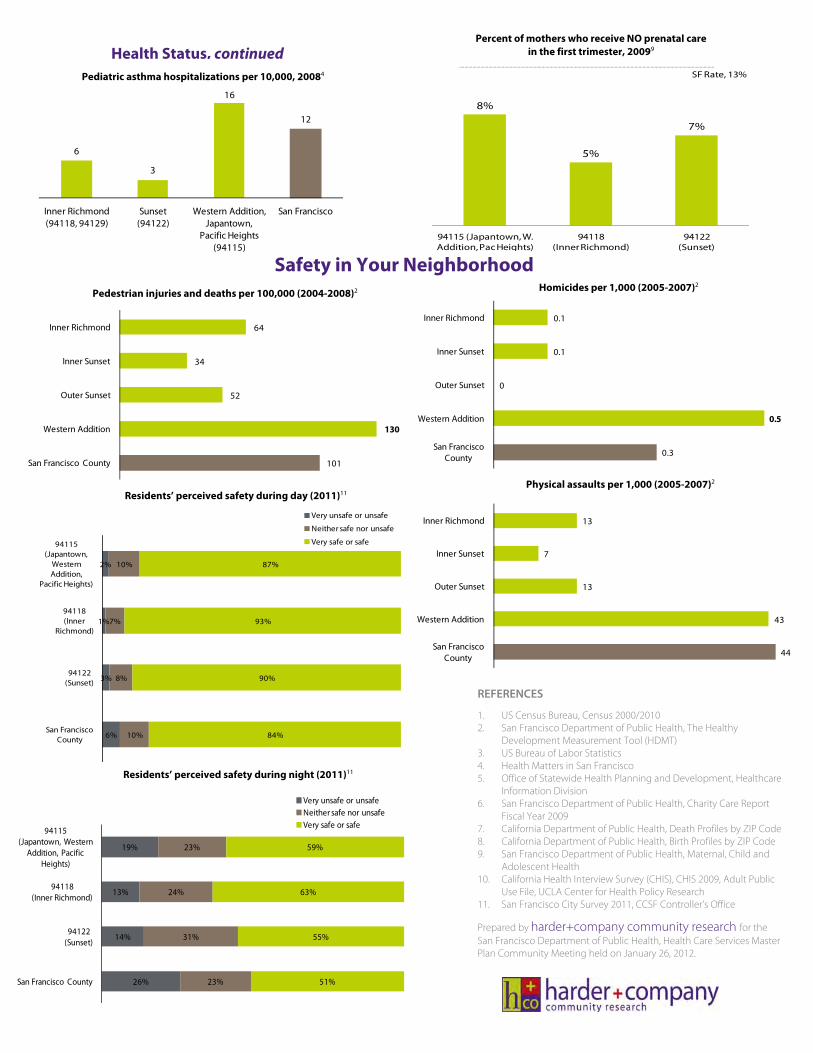
Pediatric asthma hospitalizations per 10,000, 20084
6
3
16
12
Inner Richmond (94118, 94129)
Sunset (94122)
Western Addition, Japantown,
Pacific Heights (94115)
San Francisco
Health Status, continued Percent of mothers who receive NO prenatal care
in the first trimester, 20099
8%
5%
7%
94115 (Japantown, W. Addition, Pac Heights)
94118 (Inner Richmond)
94122 (Sunset)
SF Rate, 13%
Safety in Your NeighborhoodPedestrian injuries and deaths per 100,000 (2004-2008)2
REFERENCES
1. US Census Bureau, Census 2000/2010 2. San Francisco Department of Public Health, The Healthy
Development Measurement Tool (HDMT) 3. US Bureau of Labor Statistics 4. Health Matters in San Francisco 5. Office of Statewide Health Planning and Development, Healthcare
Information Division 6. San Francisco Department of Public Health, Charity Care Report
Fiscal Year 2009 7. California Department of Public Health, Death Profiles by ZIP Code 8. California Department of Public Health, Birth Profiles by ZIP Code 9. San Francisco Department of Public Health, Maternal, Child and
Adolescent Health 10. California Health Interview Survey (CHIS), CHIS 2009, Adult Public
Use File, UCLA Center for Health Policy Research 11. San Francisco City Survey 2011, CCSF Controller’s Office
Prepared by harder+company community research for the San Francisco Department of Public Health, Health Care Services Master Plan Community Meeting held on January 26, 2012.
64
34
52
130
101
Inner Richmond
Inner Sunset
Outer Sunset
Western Addition
San Francisco County
2%
1%
3%
6%
10%
7%
8%
10%
87%
93%
90%
84%
94115 (Japantown,
Western Addition,
Pacific Heights)
94118 (Inner
Richmond)
94122 (Sunset)
San Francisco County
Very unsafe or unsafe
Neither safe nor unsafe
Very safe or safe
19%
13%
14%
26%
23%
24%
31%
23%
59%
63%
55%
51%
94115 (Japantown, Western
Addition, Pacific Heights)
94118 (Inner Richmond)
94122 (Sunset)
San Francisco County
Very unsafe or unsafeNeither safe nor unsafeVery safe or safe
Residents’ perceived safety during day (2011)11
Residents’ perceived safety during night (2011)11
Homicides per 1,000 (2005-2007)2
0.1
0.1
0
0.5
0.3
Inner Richmond
Inner Sunset
Outer Sunset
Western Addition
San Francisco County
13
7
13
43
44
Inner Richmond
Inner Sunset
Outer Sunset
Western Addition
San Francisco County
Physical assaults per 1,000 (2005-2007)2
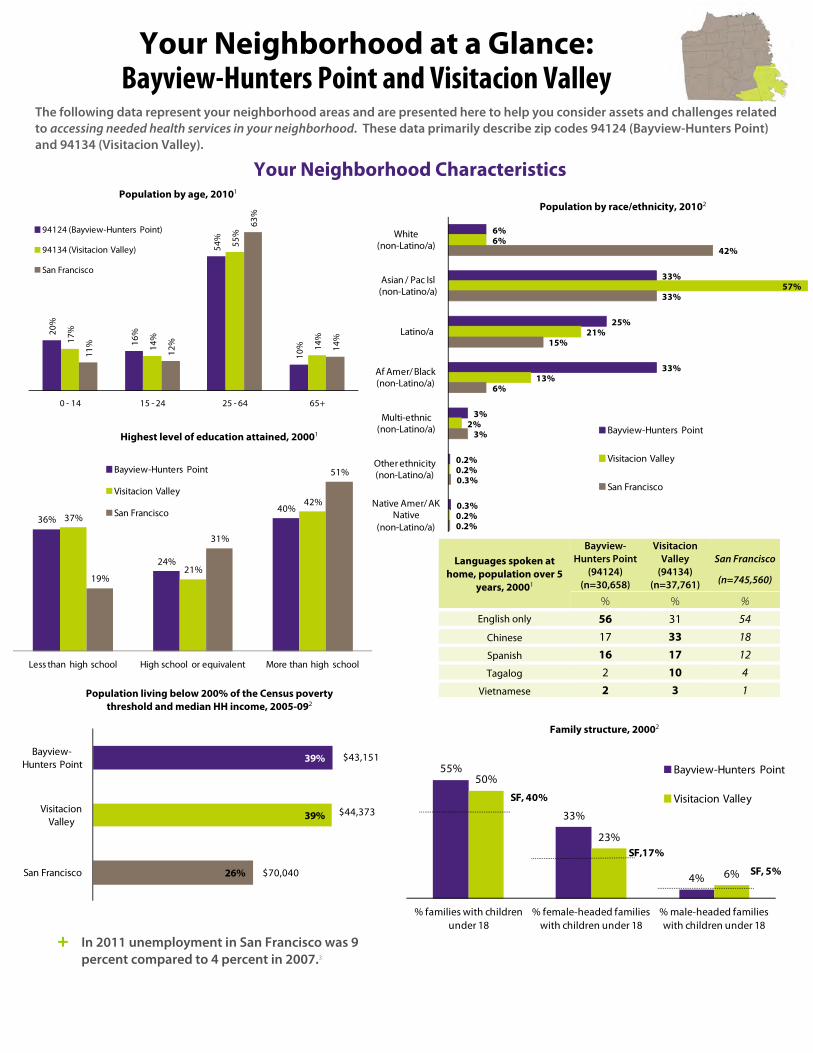
Languages spoken at home, population over 5
years, 20001
Bayview- Hunters Point
(94124) (n=30,658)
Visitacion Valley
(94134) (n=37,761)
San Francisco
(n=745,560)
% % % English only 56 31 54
Chinese 17 33 18
Spanish 16 17 12
Tagalog 2 10 4
Vietnamese 2 3 1
The following data represent your neighborhood areas and are presented here to help you consider assets and challenges related to accessing needed health services in your neighborhood. These data primarily describe zip codes 94124 (Bayview-Hunters Point) and 94134 (Visitacion Valley).
20%
16%
54%
10%
17%
14%
55%
14%
11%
12%
63%
14%
0 - 14 15 - 24 25 - 64 65+
94124 (Bayview-Hunters Point)
94134 (Visitacion Valley)
San Francisco
Your Neighborhood at a Glance: Bayview-Hunters Point and Visitacion Valley
55%
33%
4%
50%
23%
6%
% families with children under 18
% female-headed families with children under 18
% male-headed families with children under 18
Bayview-Hunters Point
Visitacion ValleySF, 40%
SF,17%
SF, 5%
36%
24%
40%37%
21%
42%
19%
31%
51%
Less than high school High school or equivalent More than high school
Bayview-Hunters Point
Visitacion Valley
San Francisco
Population living below 200% of the Census poverty threshold and median HH income, 2005-092
Highest level of education attained, 20001
Population by race/ethnicity, 20102 Population by age, 20101
+ In 2011 unemployment in San Francisco was 9 percent compared to 4 percent in 2007.3
Family structure, 20002
Your Neighborhood Characteristics
6%
33%
25%
33%
3%
0.2%
0.3%
6%
57%
21%
13%
2%
0.2%
0.2%
42%
33%
15%
6%
3%
0.3%
0.2%
White (non-Latino/a)
Asian / Pac Isl (non-Latino/a)
Latino/a
Af Amer/ Black (non-Latino/a)
Multi-ethnic (non-Latino/a)
Other ethnicity (non-Latino/a)
Native Amer/ AK Native
(non-Latino/a)
Bayview-Hunters Point
Visitacion Valley
San Francisco
39%
39%
26%
Bayview-Hunters Point
Visitacion Valley
San Francisco
$43,151
$44,373
$70,040
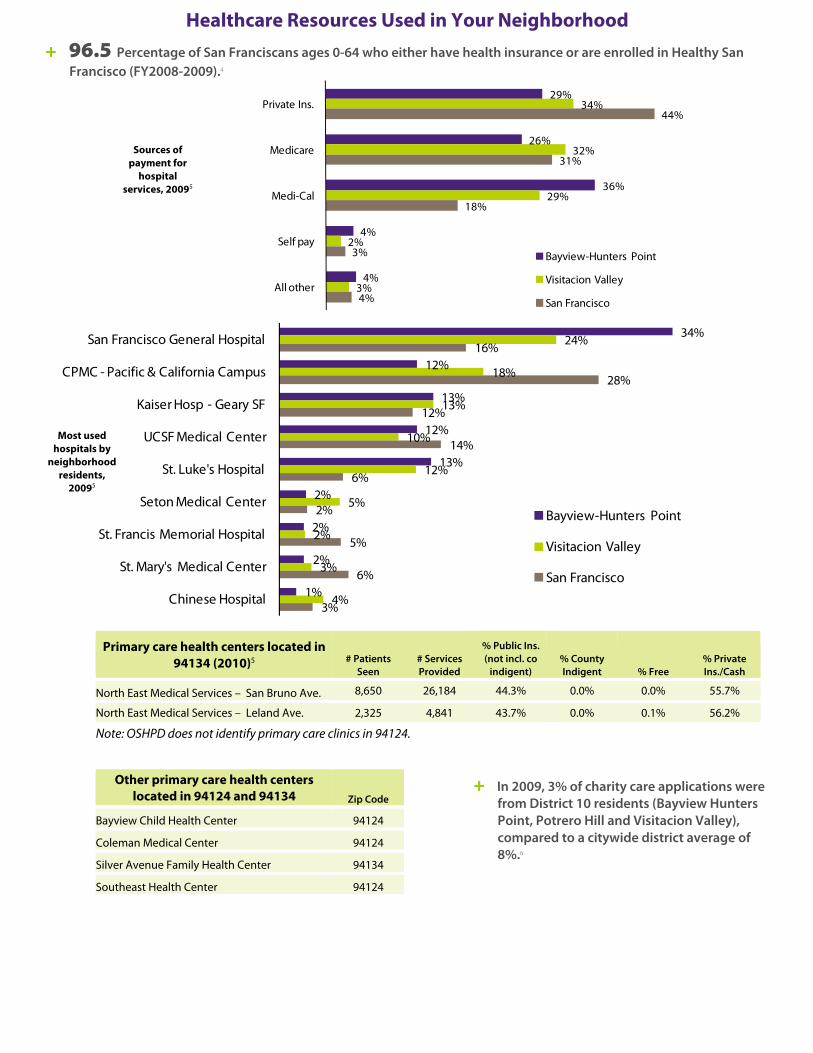
Note: OSHPD does not identify primary care clinics in 94124.
Primary care health centers located in 94134 (2010)5 # Patients
Seen # Services Provided
% Public Ins. (not incl. co
indigent) % County Indigent % Free
% Private Ins./Cash
North East Medical Services – San Bruno Ave. 8,650 26,184 44.3% 0.0% 0.0% 55.7%
North East Medical Services – Leland Ave. 2,325 4,841 43.7% 0.0% 0.1% 56.2%
Other primary care health centers located in 94124 and 94134 Zip Code
Bayview Child Health Center 94124
Coleman Medical Center 94124
Silver Avenue Family Health Center 94134
Southeast Health Center 94124
Sources of payment for
hospital services, 20095
Most used hospitals by
neighborhood residents,
20095
Healthcare Resources Used in Your Neighborhood + 96.5 Percentage of San Franciscans ages 0-64 who either have health insurance or are enrolled in Healthy San
Francisco (FY2008-2009).4
+ In 2009, 3% of charity care applications were from District 10 residents (Bayview Hunters Point, Potrero Hill and Visitacion Valley), compared to a citywide district average of 8%.6
29%
26%
36%
4%
4%
34%
32%
29%
2%
3%
44%
31%
18%
3%
4%
Private Ins.
Medicare
Medi-Cal
Self pay
All other
Bayview-Hunters Point
Visitacion Valley
San Francisco
34%
12%
13%
12%
13%
2%
2%
2%
1%
24%
18%
13%
10%
12%
5%
2%
3%
4%
16%
28%
12%
14%
6%
2%
5%
6%
3%
San Francisco General Hospital
CPMC - Pacific & California Campus
Kaiser Hosp - Geary SF
UCSF Medical Center
St. Luke's Hospital
Seton Medical Center
St. Francis Memorial Hospital
St. Mary's Medical Center
Chinese Hospital
Bayview-Hunters Point
Visitacion Valley
San Francisco
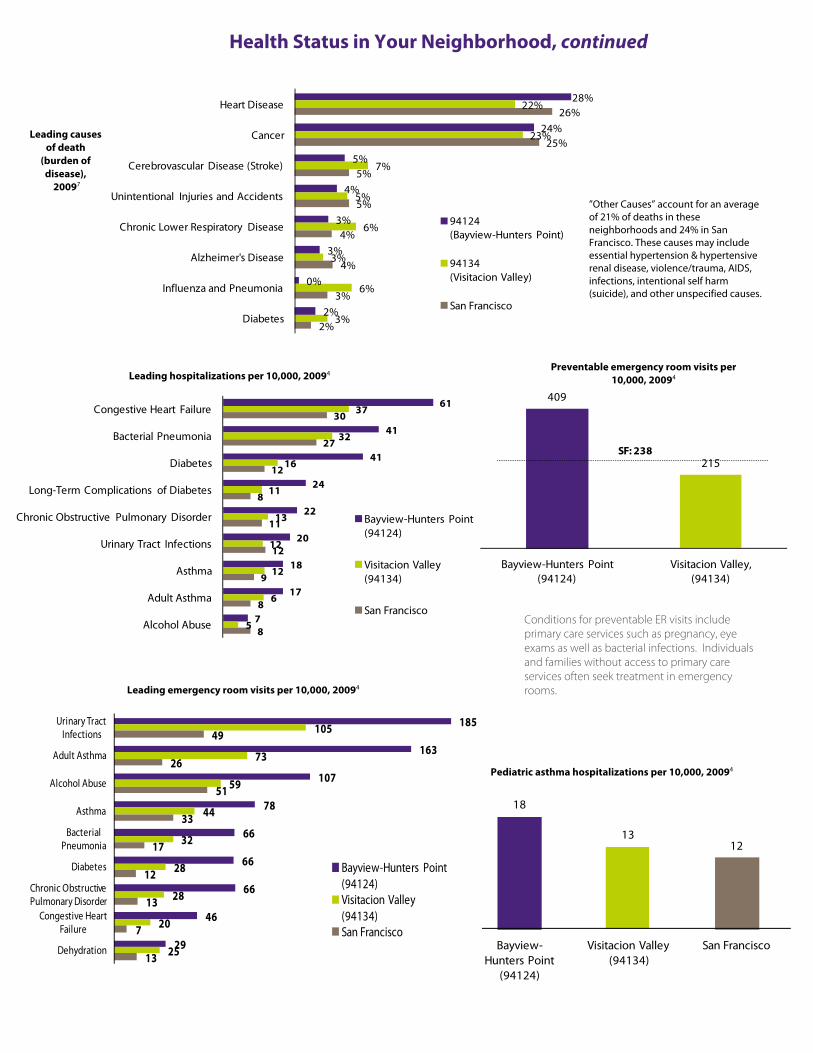
409
215
Bayview-Hunters Point(94124)
Visitacion Valley, (94134)
SF: 238
Health Status in Your Neighborhood, continued
Leading causes of death
(burden of disease),
20097
Preventable emergency room visits per 10,000, 20094
Leading emergency room visits per 10,000, 20094
Pediatric asthma hospitalizations per 10,000, 20094
”Other Causes” account for an average of 21% of deaths in these neighborhoods and 24% in San Francisco. These causes may include essential hypertension & hypertensive renal disease, violence/trauma, AIDS, infections, intentional self harm (suicide), and other unspecified causes.
Leading hospitalizations per 10,000, 20094
Conditions for preventable ER visits include primary care services such as pregnancy, eye exams as well as bacterial infections. Individuals and families without access to primary care services often seek treatment in emergency rooms.
18
1312
Bayview-Hunters Point
(94124)
Visitacion Valley(94134)
San Francisco
61
41
41
24
22
20
18
17
7
37
32
16
11
13
12
12
6
5
30
27
12
8
11
12
9
8
8
Congestive Heart Failure
Bacterial Pneumonia
Diabetes
Long-Term Complications of Diabetes
Chronic Obstructive Pulmonary Disorder
Urinary Tract Infections
Asthma
Adult Asthma
Alcohol Abuse
Bayview-Hunters Point(94124)
Visitacion Valley (94134)
San Francisco
185
163
107
78
66
66
66
46
29
105
73
59
44
32
28
28
20
25
49
26
51
33
17
12
13
7
13
Urinary Tract Infections
Adult Asthma
Alcohol Abuse
Asthma
Bacterial Pneumonia
Diabetes
Chronic Obstructive Pulmonary Disorder
Congestive Heart Failure
Dehydration
Bayview-Hunters Point(94124)Visitacion Valley (94134)San Francisco
28%
24%
5%
4%
3%
3%
0%
2%
22%
23%
7%
5%
6%
3%
6%
3%
26%
25%
5%
5%
4%
4%
3%
2%
Heart Disease
Cancer
Cerebrovascular Disease (Stroke)
Unintentional Injuries and Accidents
Chronic Lower Respiratory Disease
Alzheimer's Disease
Influenza and Pneumonia
Diabetes
94124 (Bayview-Hunters Point)
94134 (Visitacion Valley)
San Francisco
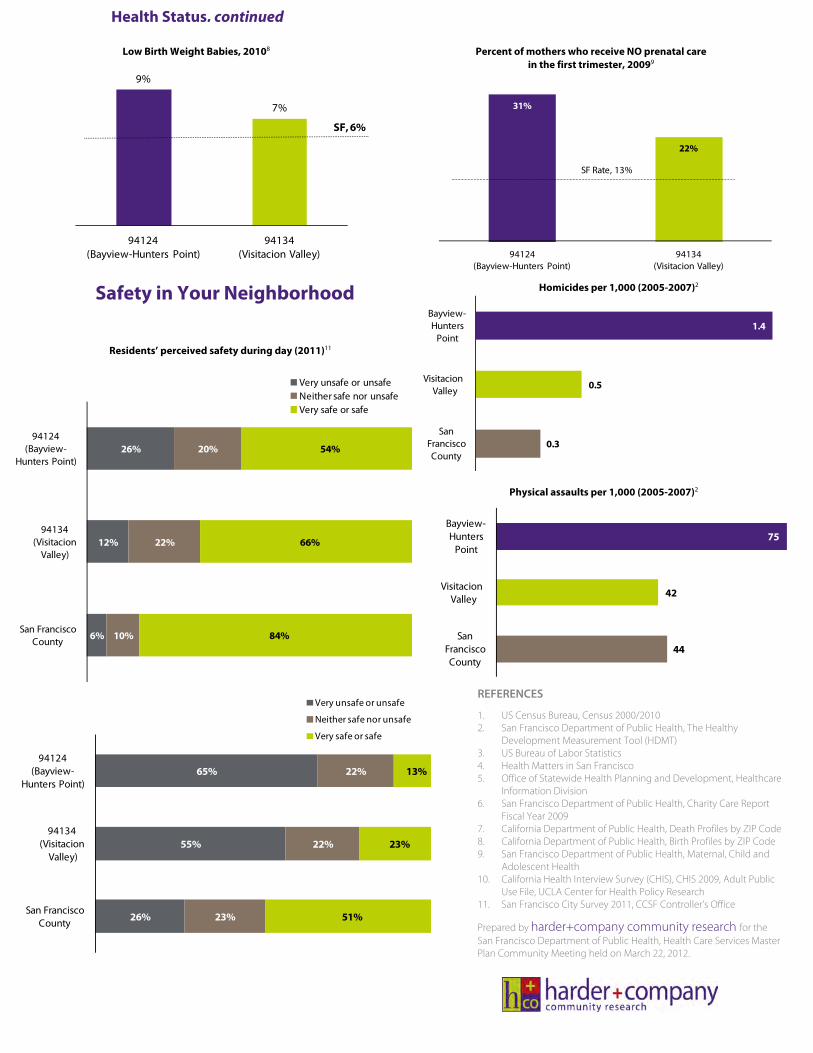
Health Status, continued
Percent of mothers who receive NO prenatal care in the first trimester, 20099
31%
22%
94124 (Bayview-Hunters Point)
94134 (Visitacion Valley)
SF Rate, 13%
Safety in Your Neighborhood
REFERENCES
1. US Census Bureau, Census 2000/2010 2. San Francisco Department of Public Health, The Healthy
Development Measurement Tool (HDMT) 3. US Bureau of Labor Statistics 4. Health Matters in San Francisco 5. Office of Statewide Health Planning and Development, Healthcare
Information Division 6. San Francisco Department of Public Health, Charity Care Report
Fiscal Year 2009 7. California Department of Public Health, Death Profiles by ZIP Code 8. California Department of Public Health, Birth Profiles by ZIP Code 9. San Francisco Department of Public Health, Maternal, Child and
Adolescent Health 10. California Health Interview Survey (CHIS), CHIS 2009, Adult Public
Use File, UCLA Center for Health Policy Research 11. San Francisco City Survey 2011, CCSF Controller’s Office
Prepared by harder+company community research for the San Francisco Department of Public Health, Health Care Services Master Plan Community Meeting held on March 22, 2012.
Residents’ perceived safety during day (2011)11
Residents’ perceived safety during night (2011)11
Homicides per 1,000 (2005-2007)2
Physical assaults per 1,000 (2005-2007)2
Low Birth Weight Babies, 20108
9%
7%
94124 (Bayview-Hunters Point)
94134 (Visitacion Valley)
SF, 6%
26%
12%
6%
20%
22%
10%
54%
66%
84%
94124 (Bayview-
Hunters Point)
94134 (Visitacion
Valley)
San Francisco County
Very unsafe or unsafeNeither safe nor unsafeVery safe or safe
65%
55%
26%
22%
22%
23%
13%
23%
51%
94124 (Bayview-
Hunters Point)
94134 (Visitacion
Valley)
San Francisco County
Very unsafe or unsafe
Neither safe nor unsafe
Very safe or safe
1.4
0.5
0.3
Bayview-Hunters
Point
VisitacionValley
San Francisco County
75
42
44
Bayview-Hunters
Point
VisitacionValley
San Francisco County
Appendix E: References
1 The “Census Poverty Threshold” (CPT) is the means by which the US Census Bureau calculates poverty. The CPT
takes into consideration, not only household income, but also the age of household members. 2 The “Census Poverty Threshold” (CPT) is the means by which the US Census Bureau calculates poverty. The CPT
takes into consideration, not only household income, but also the age of household members. 3 Healthy San Francisco is not health insurance. It is a program part of the San Francisco safety net that enables and
encourages uninsured adult residents (ages 18-64) to access primary and preventive care services. 4 DSH provides special funding to certain hospitals in recognition of the higher operating costs they incur in
treating a large number of low-income patients. 5 Mobilizing Action through Planning and Partnerships:
http://www.naccho.org/topics/infrastructure/MAPP/index.cfm 6 http://www.naccho.org/topics/infrastructure/mapp/upload/chsa.pdf
7 World Health Organization Commission on the Social Determinants of Health. Key Concepts,
http://www.who.int/social_determinants/thecommission/finalreport/key_concepts/en/index.html (accessed 7/8/13) 8 Source: 2006 to 2008 data from County Health Rankings; data reported for 2006 and 2007 accessed through the
Interuniversity Consortium for Political and Social Research (ICPSR) National Archive of Criminal Justice Data; 2008 data requested directly from FBI's Criminal Justice Information Services. 9 Tuberculosis Control Section, SFDPH and CDPH Tuberculosis Control Branch
10 The overall death rate in San Francisco is 601 per 100,000 people, which is lower than California (666 deaths per
100,000) and the United States (741 deaths per 100,000). 11
Health Matters in San Francisco; American Community Survey 2010, 1-Year Estimates 12
HSF is not health insurance, but rather an innovative program of the San Francisco Department of Public Health (SFDPH) designed to make health care services accessible and affordable to uninsured San Francisco adults, aged 18 to 64. Also see section on HSF below. 13
American Community Survey 2010, 1-Year Estimates 14
American Community Survey 2010, 1-Year Estimates 15
Health Resources and Services Administration Area Resource File (ARF), 2009, via 2012 County Health Rankings 16
Health Care Services Master Plan Task Force Process, July 2011 – May 2012 17
Health Resources and Services Administration’s Area Resource File (ARF) 2008 data, via 2012 County Health Rankings 18
Community Health Status Indicators, Community Health Status Report, 2009 19
Maiuro, L. “Emergency Department Visits for Preventable Dental Conditions in California.” California HealthCare Foundation, 2009. 20
OSHPD, Hospital Beds 2010 21
Grant J., Mottet L., Tanis J., Harrison J., Herman J., Keisling M. Injustice at Every Turn: A Report on the National Transgender Discrimination Survey. National Gay and Lesbian Task Force and National Center for Transgender Equality. 2011. http://www.thetaskforce.org/downloads/reports/reports/ntds_full.pdf. (Accessed May 3, 2013.) 22
The University of California at Los Angeles’ Center for Health Policy Studies has conducted the California Health Interview Survey (CHIS) since 2001. Conducted every two years, CHIS released findings from its 2009 survey in February 2011. Because the City and County of San Francisco does not conduct a separate survey to estimate the number of estimate the number of uninsured residents, SFDPH relies on CHIS data to quantify the size of its uninsured population. 23
Lavarreda, S.A., Cabezas, L. “Two-Thirds of California’s Seven Million Uninsured May Obtain Coverage Under Health Care Reform.” UCLA Center for Health Policy Research. February 2011. http://www.healthpolicy.ucla.edu/pubs/files/SHIC%202009%20PB%20REVISED%204-4-11.pdf. 24
There are exceptions to the individual mandate requirement for: undocumented immigrants, financial hardship, religious objections, American Indians, people who have been uninsured for less than three months, incarcerated individuals, those for whom the lowest cost plan option exceeds eight percent of their income, and those with incomes below the tax filing threshold.
25
Henry J. Kaiser Family Foundation. “Implement Heath Insurance Exchanges: California.” August 25, 2011. http://www.kff.org/healthreform/upload/Implementing-Health-Insurance-Exchanges-California.pdf. 26
California HealthCare Foundation. “Public Partner: The California Health Benefit Exchange Aligned with Medi-Cal.” October 2011. http://www.chcf.org/~/media/MEDIA%20LIBRARY%20Files/PDF/C/PDF%20CAExchangePublicPartner.pdf. 27
Henry J. Kaiser Family Foundation. “Policy Brief: California’s ‘Bridge to Reform” Medicaid Demonstration Waiver.’” June 2011. http://kff.org/medicaid/upload/8197-R.pdf. 28
Lavarreda, S.A., Cabezas, L. “Two-Thirds of California’s Seven Million Uninsured May Obtain Coverage Under Health Care Reform.” UCLA Center for Health Policy Research. February 2011. http://www.healthpolicy.ucla.edu/pubs/files/SHIC%202009%20PB%20REVISED%204-4-11.pdf. 29
Kenney G., Lynch V., Cook A., Phong S. “Who And Where Are The Children Yet To Enroll In Medicaid And The Children’s Health Insurance Program?” Health Affairs October 2010 vol. 29 no. 10 1920-1929. 30
Urban Institute, “Who Will Be Uninsured After Health Insurance Reform,” March 10, 2011. http://www.rwjf.org/files/research/71998.pdf 31
County Health Rankings (http://www.countyhealthrankings.org/) 32
Dower C., O’Neil, E. Primary Care Health Workforce in the United States. Robert Wood Johnson Research Synthesis Report No. 22. July 2011. http://www.rwjf.org/files/research/070811.policysynthesis.workforce.rpt.pdf . 33
Bates T., Chapman S. “Physician Assistant and Nurse Practitioner Staffing Patterns in California’s Licensed Community Clinics.” Center for Health Professions at the University of California, San Francisco, 2010. http://www.futurehealth.ucsf.edu/Content/8866/2010-06_Physician_Assistant_and_Nurse_Practitioner_Staffing_Patterns_in_Californias_Licensed_Community_Clinics_2005-2008.pdf . 34
HealthCare.gov. Fact Sheet: “Creating Jobs and Increasing the Number of Primary Care Providers.” http://www.healthcare.gov/news/factsheets/creating_jobs_and_increasing_primary_care_providers.html. 35
“California Physician Facts and Figures.” California Health Care Almanac. California HealthCare Foundation. July 2010. http://www.chcf.org/publications/2010/07/california-physician-facts-and-figures. 36
State of California, Department of Finance. Population Projections for California and Its Counties 2000 – 2050, by Age, Gender, and Race/Ethnicity. Sacramento, California, July 2007. 37
Bindman, A, Chu P, Grumbach K. Physician Participation in Medi-Cal, 2008. Prepared for the California Health Care Foundation. July 2010. http://www.chcf.org/resources/download.aspx?id=%7b90D98D9D-C4A8-4BB5-B1EA-856B8FB7575B%7d . 38
The California Department of Managed Health Care, a first-in the-nation HMO consumer rights organization, helps California consumers resolve problems with their health plan and works to provide a more stable and financially solvent managed care system. 39
HealthCare.gov. Fact Sheet: “Creating Jobs and Increasing the Number of Primary Care Providers.” 40
Sacramento State College of Continuing Education Applied Research Services. Healthcare Workforce Development Regional Focus Groups and Follow-Up Survey: Final Report. June 22, 2011. http://www.cwib.ca.gov/res/docs/special_committees/hwdc/meeting_materials/2011/July%202011/Comprehensive%20Regional%20Focus%20Group%20Report.pdf. 41
Health Resources and Services Administration. Shortage Designation: Health Professional Shortage Areas and Medically Underserved Areas/Populations. http://bhpr.hrsa.gov/shortage/. 42
“Greater Bay Area” includes Alameda, Contra Costa, Marin, Napa, San Francisco, San Mateo, Santa Clara, Solano, and Sonoma Counties. 43
California HealthCare Foundation. “California Health Care Almanac: California Physician Facts and Figures.” July 2010. http://www.chcf.org/~/media/MEDIA%20LIBRARY%20Files/PDF/C/PDF%20CaliforniaPhysicianFactsFigures2010.pdf. 44
Canin L., Wunsch B. “Specialty Care in the Safety Net: Efforts to Expand Timely Access.” Prepared for the California HealthCare Foundation and Kaiser Permanente Community Benefit Programs. May 2009. http://www.chcf.org/~/media/MEDIA%20LIBRARY%20Files/PDF/S/PDF%20SpecialtyCareOverview.pdf.

45
Soloman, N. “Understanding Common Reasons for Patient Referrals in Difficult-to-Access Specialties.” Prepared for the California HealthCare Foundation. May 2009. http://www.chcf.org/~/media/MEDIA%20LIBRARY%20Files/PDF/U/PDF%20UnderstandingSpecialtyReferralsInTheSafetyNet.pdf. 46
Agency for Healthcare Research and Quality. Innovation Profile: Electronic Referrals and Communications Reduce Wait Times for Specialty Appointments and Improve Clinician Communication and Quality of Care.” http://www.innovations.ahrq.gov/content.aspx?id=2759. 47
California HealthCare Foundation. “US Health Care Spending.” California Health Care Almanac Quick Reference Guide. http://www.chcf.org/~/media/MEDIA%20LIBRARY%20Files/PDF/H/PDF%20HealthCareCostsQRG11.pdf. 48
The Centers for Medicare and Medicaid released 2009 national expenditure data in January 2011. 49
California HealthCare Foundation. “Health Care Costs 101.” California Health Care Almanac. May 2011. http://www.chcf.org/~/media/MEDIA%20LIBRARY%20Files/PDF/H/PDF%20HealthCareCosts11.pdf. 50
Bernstein W., Frohlich J., LaPallo F., Patel A., Thompson M. Accountable Care Organizations in California: Programmatic and Legal Considerations. Prepared for the California HealthCare Foundation. July 2011. http://www.chcf.org/~/media/MEDIA%20LIBRARY%20Files/PDF/A/PDF%20ACOProgrammaticLegalConsiderations.pdf. 51
Commonwealth Fund Press Release. “New Study: US Ranks Last Among High-Income Nations on Preventable Deaths, Lagging Behind as Others Improve More Rapidly.” September 23, 2011. http://www.commonwealthfund.org/News/News-Releases/2011/Sep/US-Ranks-Last-on-Preventable-Deaths.aspx. 52
According to the study, the US could save up to 84,000 lives annually if it lowered its preventable death rate to that of the top three performing nations (France, Australia, Italy). 53
Auerbach D., Kellermann A. “A Decade of Health Care Cost Growth Has Wiped Out Real Income Gains for an Average US Family.” Health Affairs, 30, No. 9 (2011): 1630-1636. 54
California HealthCare Foundation. “US Health Care Spending.” California Health Care Almanac Quick Reference Guide. http://www.chcf.org/~/media/MEDIA%20LIBRARY%20Files/PDF/H/PDF%20HealthCareCostsQRG11.pdf. 55
California HealthCare Foundation. “Health Care Costs 101: Slow but Steady.” California Health Care Almanac. August 2012. http://www.chcf.org/~/media/MEDIA%20LIBRARY%20Files/PDF/H/PDF%20HealthCareCosts12.pdf. 56
Keehan S., Cuckler G., Sisko A., Madison A., Smith S., Lizonitz J., Poisal J., and Wolfe C. “National Health Expenditure Projections: Modest Annual Growth Until Coverage Expands and Economic Growth Accelerates.” Health Affairs, 31, no. 7 (2012): 1600-1612. 57
Centers for Medicare and Medicaid Services. “Health Care Spending by State of Residence, 1991 – 2009.” Medicare & Medicaid Research Review. 2001: Vol. 1, No. 4. https://www.cms.gov/MMRR/Downloads/MMRR2011_001_04_A03.pdf. 58
According to CMS, “personal health care spending” includes the “total amount spent to treat individuals with specific medical conditions, but excludes medical expenditures resulting from government administration, net costs of health insurance, government public health activity, non-commercial research, and investment in structures and equipment.” 59
Deloitte Center for Health Solutions. “Accountable Care Organizations: A New Model for Sustainable Innovation.” March 2011. http://www.deloitte.com/assets/Dcom-UnitedStates/Local%20Assets/Documents/US_CHS_AccountableCareOrganizations_070610.pdf. 60
Wennberg J., Fisher E., Baker L., Sharp S., Bronner K. “Evaluating the Efficiency of California Providers in Caring for Patients with Chronic Illness.” Health Affairs, Vol. 24, No. 6. November 16, 2005. 61
Congressional Budget Office. Geographic Variation in Health Care Spending. February 2008. http://www.cbo.gov/ftpdocs/89xx/doc8972/02-15-GeogHealth.pdf. 62
In the 1980s, Medicare began to phase out fee-for-service reimbursement (e.g., cost- and charge-based reimbursement) in favor of a prospective payment system (for hospitals), which is based on a patient’s diagnosis at discharge. Medicare reimburses providers according to a resource-based relative value scale. 63
Baker L. Same Disease, Different Care: How Patient Health Coverage Drives Treatment Patterns in California. Issue Brief, April 2008. California HealthCare Foundation. http://www.chcf.org/~/media/MEDIA%20LIBRARY%20Files/PDF/S/PDF%20SameDiseaseDifferentCareIB.pdf.
64
Helfand D. “Hospital stays cost more in Northern California than Southern California.” Los Angeles Times. March 6, 2011. 65
Health Care Cost Hearing of the Board of Supervisors Government Audit and Oversight Committee. April 28, 2011. http://sanfrancisco.granicus.com/ViewPublisher.php?view_id=11. 66
Spetz J., Seago J.A., Mitchell S. Changes in Hospital Ownership in California. Public Policy Institute of California, 1999. 67
Chen L.M., Jha A.K., Guterman S., et al. “Hospital Cost of Care, Quality of Care, and Readmission Rates: Penny-Wise and Pound-Foolish.” Archives of Internal Medicine. February 22, 2010 170(4): 340-46. 68
Helfand D. “Hospital stays cost more in Northern California than Southern California.” Los Angeles Times. March 6, 2011. 69
Woo C. “Antitrust and California’s New Preferred Provider Organization Legislation: A New Alternative in Health Care Cost Containment.” Pepperdine Law Review. 1985. 70
California HealthCare Foundation. “Los Angeles: Fragmented Health Care Market Shows Signs of Coalescing.” California Health Care Almanac, Regional Markets Issue Brief, January 2013. http://www.chcf.org/~/media/MEDIA%20LIBRARY%20Files/PDF/A/PDF%20AlmanacRegMktBriefLA13.pdf. 71
Phibbs C.S., Bronstein J.M., Buxton E., Phibbs R.H. “The Effects of Patient Volume and Level of Care at the Hospital of Birth on Neonatal Mortality.” The Journal of the American Medical Association, October 2, 1996; 276(13): 1054-1059. 72
Goodell S., Ginsburg P. “High and rising health care costs: Demystifying US health care spending.” Robert Wood Johnson Foundation. Policy Brief No. 16, October 2008. http://www.rwjf.org/pr/product.jsp?id=35368. 73
Goodell S., Ginsburg P. “High and rising health care costs: Demystifying US health care spending.” Robert Wood Johnson Foundation. Policy Brief No. 16, October 2008. http://www.rwjf.org/pr/product.jsp?id=35368. 74
KaiserEDU.org. “US Health Care Costs.” http://www.kaiseredu.org/Issue-Modules/US-Health-Care-Costs/Background-Brief.aspx#What%20is%20driving%20health%20care%20costs?. 75
California HealthCare Foundation. “US Health Care Spending.” California Health Care Almanac Quick Reference Guide. http://www.chcf.org/~/media/MEDIA%20LIBRARY%20Files/PDF/H/PDF%20HealthCareCostsQRG11.pdf. 76
KaiserEDU.org. “US Health Care Costs.” http://www.kaiseredu.org/Issue-Modules/US-Health-Care-Costs/Background-Brief.aspx#What%20is%20driving%20health%20care%20costs?. 77
Goodell S., Ginsburg P. “High and rising health care costs: Demystifying US health care spending.” Robert Wood Johnson Foundation. Policy Brief No. 16, October 2008. http://www.rwjf.org/pr/product.jsp?id=35368. 78
“Medi-Cal Facts and Figures.” California Health Care Almanac, September 2009. California HealthCare Foundation. http://www.chcf.org/~/media/MEDIA%20LIBRARY%20Files/PDF/M/PDF%20MediCalFactsAndFigures2009.pdf. 79
Hunt S., Peters L., Saari J. Capitation Rates in the Medi-Cal Managed Care Program, May 1999. Prepared for the Medi-Cal Policy Institute by Price Waterhouse Coopers. http://www.chcf.org/~/media/MEDIA%20LIBRARY%20Files/PDF/C/PDF%20capitation.pdf. 80
Hurley R., Grossman J., Lake T., Casalino L. “A Longitudinal Perspective on Health Plan-Provider Risk Contracting.” Health Affairs. July 2002. Vol. 21, No. 4, 144-153. 81
Frohlich J., Pawlak B., Smith M., Bernstein W. Implementing National Health Reform in California: Payment and Delivery System Changes. Prepared for the California HealthCare Foundation by Manatt Health Solutions. November 2011. 82
Elhauge E., “The Fragmentation of US Health Care: Causes and Solutions,” Oxford University Press, February 2010. http://www.law.harvard.edu/faculty/elhauge/pdf/Elhauge%20The%20Fragmentation%20of%20US%20Health%20Care%20--%20Introductory%20Chpt.pdf 83
Frohlich J., Pawlak B., Smith M., Bernstein W. Implementing National Health Reform in California: Payment and Delivery System Changes. Prepared for the California HealthCare Foundation by Manatt Health Solutions. November 2011. 84
Only three conditions will be considered in 2013 and 2014: heart attack, heart failure, and pneumonia. This reform will apply to a total of seven conditions as of 2015 and could be expanded beyond that in future years.
85
Chazin S., Friedenzohn I., Martinez-Vidal E., Somers S., The Future of US Charity Care Programs: Implications of Health Reform, Prepared by the Center for Health Care Strategies and AcademyHealth. August 2010. http://www.academyhealth.org/files/publications/FutureofCharityCarePrograms.pdf 86
“Health Centers and Medicaid: Lowering Costs and Improving Health.” National Association of Community Health Centers. http://www.nachc.com/client//Medicaid%20%20PPS%20One-Pager%20with%20Chart%20FINAL%20v2%200%20(3).pdf. 87
Ku L., Richard P., Dor A., Shin P., Rosenbaum S. “Using Primary Care to Bend the Curve: Estimating the Impact of a Health Center Expansion on Health Care Costs.” Geiger Gibson / RCHN Community Health Foundation Research Collaborative. Policy Research Brief No. 14. September 1, 2009. http://www.gwumc.edu/sphhs/departments/healthpolicy/dhp_publications/pub_uploads/dhpPublication_61D685D5-5056-9D20-3DDB6CDE10382393.pdf. 88
“Health Center Related Provisions in Health Reform Legislation.”National Association of Community Health Centers. http://www.nachc.com/client/summary%20of%20health%20reform%20package_final_0420101.pdf. 89
Frohlich J., Pawlak B., Smith M., Bernstein W. Implementing National Health Reform in California: Payment and Delivery System Changes. Prepared for the California HealthCare Foundation by Manatt Health Solutions. November 2011. http://www.chcf.org/~/media/MEDIA%20LIBRARY%20Files/PDF/I/PDF%20ImplementingHealthReformPaymentChanges.pdf. 90
Bindman, A, Chu P, Grumbach K. Physician Participation in Medi-Cal, 2008. Prepared for the California Health Care Foundation. July 2010. http://www.chcf.org/resources/download.aspx?id=%7b90D98D9D-C4A8-4BB5-B1EA-856B8FB7575B%7d . 91
“Long-Term Care.” Medicare.gov. http://www.medicare.gov/LongTermCare/Static/Home.asp. 92
State of California, Department of Finance. Population Projections for California and Its Counties 2000 – 2050, by Age, Gender, and Race/Ethnicity. Sacramento, California, July 2007. 93
“Long-Term Care Facts and Figures.” California Health Care Almanac. November 2009. California HealthCare Foundation. http://www.chcf.org/~/media/MEDIA%20LIBRARY%20Files/PDF/L/PDF%20LTCFactsFigures09.pdf. 94
Streett L., Understanding Medi-Cal: Long-Term Care. Revised Edition, September 2001. Medi-Cal Policy Institute. http://www.chcf.org/~/media/MEDIA%20LIBRARY%20Files/PDF/U/PDF%20UnderstandingMediCalLTCRevisedEd.pdf. 95
Frohlich J., Pawlak B., Smith M., Bernstein W. Implementing National Health Reform in California: Payment and Delivery System Changes. Prepared for the California HealthCare Foundation by Manatt Health Solutions. November 2011. 96
“Certificate of Need Programs: State Health Laws and Programs.” National Conference of State Legislatures. September 6, 2011. http://www.ncsl.org/default.aspx?tabid=14373. 97
Frohlich J., Pawlak B., Smith M., Bernstein W. Implementing National Health Reform in California: Payment and Delivery System Changes. Prepared for the California HealthCare Foundation by Manatt Health Solutions. November 2011. 98
Getzen T. Health Economics: Fundamentals and Flow of Funds. Second Edition, p. 231. John Wiley and Sons, Inc. 2004. 99
Frohlich J., Pawlak B., Smith M., Bernstein W. Implementing National Health Reform in California: Payment and Delivery System Changes. Prepared for the California HealthCare Foundation by Manatt Health Solutions. November 2011. 100
Frohlich J., Pawlak B., Smith M., Bernstein W. Implementing National Health Reform in California: Payment and Delivery System Changes. Prepared for the California HealthCare Foundation by Manatt Health Solutions. November 2011. 101
California HealthCare Foundation. “US Health Care Spending.” California Health Care Almanac Quick Reference Guide. http://www.chcf.org/~/media/MEDIA%20LIBRARY%20Files/PDF/H/PDF%20HealthCareCostsQRG11.pdf. 102
The Centers for Medicare and Medicaid released 2009 national expenditure data in January 2011. 103
Commonwealth Fund Press Release. “New Study: US Ranks Last Among High-Income Nations on Preventable Deaths, Lagging Behind as Others Improve More Rapidly.” September 23, 2011. http://www.commonwealthfund.org/News/News-Releases/2011/Sep/US-Ranks-Last-on-Preventable-Deaths.aspx.
104
Berwick D., Nolan T., Whittington J. “The Triple Aim: Care, Health, and Cost.” Health Affairs 27, no. 3 (2008): 759-769. 105
Beeuwkes Buntin M., Jain S.H., Blumenthal D. “Health Information Technology: Laying the Infrastructure for National Health Reform.” Health Affairs. June 2010. http://content.healthaffairs.org/content/29/6/1214.full.pdf+html . 106
The American Recovery and Reinvestment Act of 2009, http://frwebgate.access.gpo.gov/cgi-bin/getdoc.cgi?dbname=111_cong_bills&docid=f:h1enr.txt.pdf. (Accessed 11/15/10.) 107
Presented in “Snapshot: The State of Health Information Technology in California.” California HealthCare Foundation. 2011. http://www.chcf.org/~/media/MEDIA%20LIBRARY%20Files/PDF/S/PDF%20StateHealthInfoTechnologyCA.pdf . 108
Definition of Electronic Health Record, Healthcare Information and Management Systems, http://www.himss.org/ASP/topics_ehr.asp. (Accessed 11/15/10.) 109
“HIMSS Health Information Exchange: ARRA HITECH FQAs Related to HIE,” Healthcare Information and Management Systems, 2009, http://www.himss.org/content/files/12_04_09_ARRAHITECHHIE_FactSheet.pdf. (Accessed 11/15/10.) 110
“Welcome to the Medi-Cal EHR State Level Registry (SLR) for Provider Incentive Payments — Provider Outreach Page.” California Department of Healthcare Services. http://medi-cal.ehr.ca.gov .(Accessed 1/19/12.) 111
CalHIPSO website, http://www.calhipso.org/. (Accessed 11/15/10.) 112
Please note that retail clinics have not been found to improve health care access for people living in medically underserved areas. 113
Sarasohn-Kahn, J. “Primary Care Everywhere: Connecting the Dots Across the Emerging Health Landscape.” Prepared for the California HealthCare Foundation. November 2011. http://www.chcf.org/~/media/MEDIA%20LIBRARY%20Files/PDF/P/PDF%20PrimaryCareEverywhere.pdf. 114
CMS Innovation Center. http://innovations.cms.gov/ . (Accessed January 17, 2012.) 115
“Practicing Medicine Through Telemedicine Technology.” Medical Board of California. http://www.mbc.ca.gov/licensee/telemedicine.html . (Accessed January 17, 2012.) 116
Telemedicine Reimbursement Handbook. California Telemedicine and eHealthCenter. August 31, 2011. http://www.cteconline.org/sites/main/files/file-attachments/reimbursement_guide_rev._2011.pdf . 117
“California Telehealth Law Could Cut Costs by $1B, Report Concludes.” October 20, 2011. http://www.californiahealthline.org/articles/2011/10/20/california-telehealth-law-could-cut-costs-by-1b-report-concludes.aspx. 118
Sarasohn-Kahn, J. “Primary Care Everywhere: Connecting the Dots Across the Emerging Health Landscape.” Prepared for the California HealthCare Foundation. November 2011. http://www.chcf.org/~/media/MEDIA%20LIBRARY%20Files/PDF/P/PDF%20PrimaryCareEverywhere.pdf . 119
Sarasohn-Kahn, J. “The Connected Patient: charting the Vital Signs of Remote Health Monitoring.” Prepared for the California HealthCare Foundation. February 2011. http://www.chcf.org/~/media/MEDIA%20LIBRARY%20Files/PDF/T/PDF%20TheConnectedPatient.pdf . 120
KaiserEDU.org. “US Health Care Costs.” http://www.kaiseredu.org/Issue-Modules/US-Health-Care-Costs/Background-Brief.aspx#What%20is%20driving%20health%20care%20costs?. 121
Frohlich J., Pawlak B., Smith M., Bernstein W. Implementing National Health Reform in California: Payment and Delivery System Changes. Prepared for the California HealthCare Foundation by Manatt Health Solutions. November 2011. 122
Only three conditions will be considered in 2013 and 2014: heart attack, heart failure, and pneumonia. This reform will apply to a total of seven conditions as of 2015 and could be expanded beyond that in future years. 123
Sandhu J. “Opportunities in Mobile Health.” Innovating for More Affordable Health Care. http://stanford.ebookhost.net/ssir/digital/12/ebook/1/index.php?e=12&user_id=8229&flash=0. 124
Tirado M. “Role of Mobile Health in the Care of Culturally and Linguistically Diverse US Populations.” Perspectives in Health Information Management. Winter 2011. http://perspectives.ahima.org/index.php?option=com_content&view=article&id=205:role-of-mobile-health-in-the-care-of-culturally-and-linguistically-diverse-us-populations&catid=63:telehealth. (Accessed 2/13/12.)
125
California HealthCare Foundation. “Overuse of Emergency Departments Among Insured Californians.” October 2006. http://www.chcf.org/~/media/MEDIA%20LIBRARY%20Files/PDF/E/PDF%20EDOveruse.pdf. 126
Sarasohn-Kahn, J. “Primary Care Everywhere: Connecting the Dots Across the Emerging Health Landscape.” Prepared for the California HealthCare Foundation. November 2011. http://www.chcf.org/~/media/MEDIA%20LIBRARY%20Files/PDF/P/PDF%20PrimaryCareEverywhere.pdf. 127
Sarasohn-Kahn, J. “Primary Care Everywhere: Connecting the Dots Across the Emerging Health Landscape.” Prepared for the California HealthCare Foundation. November 2011. http://www.chcf.org/~/media/MEDIA%20LIBRARY%20Files/PDF/P/PDF%20PrimaryCareEverywhere.pdf. 128
CPMC. “HealthFirst.” http://www.cpmc.org/about/community/healthfirst.html. (Accessed 2/8/12.) 129
Otero-Sabogal R., Arretz D., Siebold S., Hallen E., Lee R., Ketchel A., Li J., Newman J. (2010). “Physician-community health worker partnering to support diabetes self-management in primary care.” Quality in Primary Care. 18(6): 363-372. 130
Etz R., Cohen D., Woolf S., Summers Holtrop J., Donahue K., Isaacson N., Stange K., Ferrer R., Olson A. “Bridging Primary Care Practices and Communities to Promote Healthy Behaviors.” American Journal of Preventive Medicine. 2008. http://www.prescriptionforhealth.org/results/Nov2008Supplement/BridgingPrimaryCare-Etz.pdf . 131
Etz R., Cohen D., Woolf S., Summers Holtrop J., Donahue K., Isaacson N., Stange K., Ferrer R., Olson A. “Bridging Primary Care Practices and Communities to Promote Healthy Behaviors.” American Journal of Preventive Medicine. 2008. http://www.prescriptionforhealth.org/results/Nov2008Supplement/BridgingPrimaryCare-Etz.pdf . 132
World Health Organization. “Social determinants of health.” http://www.who.int/social_determinants/en/. (Accessed 1/31/12.) 133
Agency for Healthcare Research and Quality. “About the National Quality Strategy.” Working for Quality. http://www.ahrq.gov/workingforquality/nqs/. (Accessed 2.14.12.) 134
Brennan-Ramirez L., Baker E., Metzler M. Promoting Health Equity: A Resource to Help Communities Address Social Determinants of Health. Atlanta: US Department of Health and Human Services, Centers for Disease Control and Prevention; 2008. http://www.cdc.gov/nccdphp/dach/chhep/pdf/SDOHworkbook.pdf. 135
US Census Bureau. 2010 Census http://factfinder2.censUSgov/main.html. (Accessed 3/12/12.) 136
Includes data from California Pacific Medical Center - Pacific Campus, Chinese Hospital, Kaiser - Geary, Laguna Honda, Langley Porter, San Francisco General Hospital, St. Francis Memorial Center, St. Mary’s Medical Center, St. Luke’s Hospital, and UCSF Medical Center. 137
Office of Statement Health Planning and Development. Emergency Medical Service Pivot Profile. “2006-2010 EMS Utilization Trends.” http://www.oshpd.ca.gov/hid/Products/Hospitals/Utilization/Hospital_Utilization.html. (Accessed 9/17/12.) 138
According to OSHPD, an EMS treatment station is “a specific place within the EMS Department adequate to treat one patient at a time. Holding or observation beds are not included.” 139
Regional Hazard Vulnerability Assessment. Data gathered from SFDPH-PHEPR email exchange on 9/13/12. 140
US General Accounting Office. Hospital Emergency Departments: Crowded Conditions Vary Among Hospitals and Communities. Report to Ranking Minority Member, Committee on Finance, US Senate. March 2003. http://www.gao.gov/new.items/d03460.pdf. 141
Agency for Healthcare Research and Quality. “Emergency Medicine: Leaving the Emergency Department without being seen more likely at hospitals serving low-income patients.” http://www.ahrq.gov/research/sep11/0911RA9.htm. (Accessed 9/17/12.) 142
Hsia R, Asch S, Weiss R, Zingmond D, Liang L, Han W, McCreath H, Sun B. “Hospital Determinants of Emergency Department Left Without Being Seen Rates.” Annals of Emergency Medicine. 2011 July; 58(1): 24-32. http://www.ncbi.nlm.nih.gov/pmc/articles/PMC3126631/?tool=pubmed. 143
This exclusion applies to patients requiring specialty triage care, patients in imminent or full respiratory or cardiac arrest or a post-arrest resuscitation, or patients originating from a hospital-based clinic. 144
Hsia R, Asch S, Weiss R, Zingmond D, Liang L, Han W, McCreath H, Sun B. “California Hospitals Serving Large Minority Populations Were More Likely Than Others to Employ Ambulance Diversion.” Health Affairs 31, No. 8 (2012). http://content.healthaffairs.org/content/31/8/1767.full.pdf+html (Accessed 8/14/12). 145
Ambulance transport volume was extracted from the 911 Computer Aided Dispatch System. These counts do not represent unique patients (i.e., units may transport more than one patient on occasion) and do not include
non 911 emergency calls dispatched through call centers for private ALS ambulance providers that resulted in transport to a receiving facility. The denominator used (5,551) for the percentage of transports includes the 418 transports not shown for partial receiving hospitals; out-of-county ED transports; SF Sobering Center; CPMC-California Campus; and entries of “missing” for hospital names. As a specialty care receiving center, the CPMC-California Campus ED does not use diversion. 146
Hsia R, Asch S, Weiss R, Zingmond D, Liang L, Han W, McCreath H, Sun B. “California Hospitals Serving Large Minority Populations Were More Likely Than Others to Employ Ambulance Diversion.” Health Affairs 31, No. 8 (2012). http://content.healthaffairs.org/content/31/8/1767.full.pdf+html (Accessed 8/14/12). 147
Please note that the term “surge bed” is not well defined by the State of California. As such, San Francisco chose to equate licensed beds as surge beds, as licensed beds are a standard measure on which all hospitals can report. 148
San Francisco is working with the State Department of Public Health and others toward a more robust definition of “surge bed.” Until a definition is finalized, however, SFDPH opted to equate “licensed beds” with “surge beds,” as all hospitals measure and track licensed beds in the same way. 149
Number provided to San Francisco by the California Department of Public Health. 150
Physician Participation in Medi-Cal, 2008; Andrew Bindman, Phillip Chiu, Kevin Grumbach, California Healthcare Foundation, July 2010 151
The San Francisco Bay Area region for this study included the counties of San Francisco, Alameda, Contra Costa, Marin, Napa, San Mateo, Santa Clara, Santa Cruz, Solano and Sonoma. 152
Online Survey, Certification and Reporting (OSCAR) data. OSCAR is a data network maintained by the Centers for Medicare and Medicaid Services (CMS) in cooperation with state long-term care surveying agencies. www.ahcancal.org/research_data/oscar_data accessed April 2012 153
Resource Development Associates. Institutional Master Plan Update Analysis. Prepared for the Chinese Hospital Association of San Francisco and Commissioned by the San Francisco Department of Public Health. http://zasfplan.sfplanning.org/IMP/IMP_docs/Chinese%20Hospital_2011_05_19.pdf 154
San Francisco Human Services Agency-Department of Aging and Adult Services, Office on the Aging. Assessment of the Needs of San Francisco Seniors and Adults with Disabilities, Part II: Analysis of Needs and Services. April 12, 2012. 155
Office of the State Long Term Care Ombudsman. (2008). Fiscal year 2007/08 Beds and Facilities. 156
Nadell, Benson (2010). Personal correspondence between Benson Nadell, San Francisco Long-Term Care Ombudsman, and Daniel Kelly, Director of Planning, San Francisco Human Services Agency, on October 5, 2010. 157
Data for chart derived from Office of the State Long Term Care Ombudsman for fiscal year 2007-08. Please note that the ombudsman service area for Sacramento also include Placer, Yolo, Yuba, and Sutter counties. Los Angeles has two ombudsman service areas that have been consolidated for this chart. The Fresno service area includes Madera County. 158
Source: California Department of Mental Health, http://www.dmh.ca.gov/Statistics_and_Data_Analysis/Total_Population_by_County.asp (accessed 7-8-13) 159
Source: Health Resources and Services Administration’s Area Resource File (ARF) 2008 data, via 2012 County
Health Rankings 160
Mechanic D. “Mental Health Services Then and Now.” Health Affairs, 26, no.6 (2007):1548-1550. http://content.healthaffairs.org/content/26/6/1548.full.html. Accessed 6/18/13. 161
Substance Abuse and Mental Health Services Administration (SAMHSA). “Health Reform: And Overview of the Affordable Care Act. What Are the Implications for Behavioral Health?” SAMHSA News, May/June 2010, Volume 18, Number 3. http://www.samhsa.gov/samhsanewsletter/Volume_18_Number_3/AffordableHealthCareAct.aspx. Accessed 6/18/13. 162
Ryan, P. 2014 Affordable Care Act: Opportunities and Challenges for Mental Health. Presentation before California State Association of Counties Course, “Behavioral Health, County Responsibilities and Approaches to Drug and Alcohol Treatment.” August 16, 2012. 163
Robinson, J. Phone conversation with SFDPH-Office of Policy and Planning staff on September 24, 2012. 164
San Francisco Department of Mental Health – Community Behavioral Health Services. “San Francisco City and County Mental Health Services Act Prevention and Early Intervention Plan Executive Summary.” January 2009. 165
Robinson, J. Phone conversation with SFDPH-Office of Policy and Planning staff on September 24, 2012.
166
US Census Bureau. State and County Quick Facts for San Francisco, CA. http://quickfacts.censUSgov/qfd/states/06/06075.html. Accessed March 6, 2013. 167
State of California, Department of Finance. Population Projections for California and Its Counties 2000 – 2050. Sacramento, California, July 2007. 168
Association of Bay Area Governments, Projections, Jobs-Housing Connection Scenario, May 2012. 169
Lewin Group. Market Assessment and Benchmarking Project for the City and County of San Francisco Department of Public Health. Prepared for the City and County of San Francisco. December 10, 2007. 170
Ray N, Ebeener S, “AccessMod 3.0: computering geographic coverage and accessibility to health care services using anisotropic movement of patients.” International Journal of Health Geographics 2008, 7:63. http://www.ij-healthgeographics.com/content/7/1/63 (Accessed 3/24/12.) 171
Mo’ Magic focus group conducted by SFDPH on March 15, 2012. 172
Aysola J, Orav EJ, Ayanian JZ, “Neighborhood Characteristics Associated with Access to Patient-Centered Medical Homes for Children.” Health Affairs, November 2011, vol. 30, no. 11 2080-2089. http://content.healthaffairs.org/content/30/11/2080.full#T2. (Accessed 3/24/12.) 173
Ray N, Ebeener S, “AccessMod 3.0: computering geographic coverage and accessibility to health care services using anisotropic movement of patients.” International Journal of Health Geographics 2008, 7:63. http://www.ij-healthgeographics.com/content/7/1/63 (Accessed 3/24/12.) 174
The three remaining key elements of health care accessibility include availability, financial accessibility, and acceptability. These elements were addressed in previous issue briefs and/or are discussed in the pages that follow. 175
Hyndman JC, Holman CD, Dawes VP, “Effect of distance and social disadvantage on the response to invitations to attend mammography screening.” J Med Screen, 2000; 7(3): 141-5. http://jms.rsmjournals.com/content/7/3/141.full.pdf. (Accessed 3/24/12.) 176
Jordan H, Roderick P, Martin D, Barnett S, “Distance and rurality and the need for care: access to health services in South West England.” International Journal of Health Geographics 2004, 3:2 http://www.ij-healthgeographics.com/content/3/1/21 (Accessed 3/24/12.) 177
Probst JC, Laditka SB, Wong J, Johnson AO, “Effects of residence and race on burden of travel for care: cross sectional analysis of the 2001 US National Household Travel Survey.” BMC Health Serv Res. 2007; 7: 40. http://www.biomedcentral.com/1472-6963/7/40 (Accessed 3/24/12). 178
Jordan H, Roderick P, Martin D, Barnett S, “Distance and rurality and the need for care: access to health services in South West England.” International Journal of Health Geographics 2004, 3:2 http://www.ij-healthgeographics.com/content/3/1/21 (Accessed 3/24/12.) 179
Hadley J, Cunningham C, “Availability of Safety Net Providers and Access to Care of Uninsured Persons.” Health Serv Res. 2004 October; 39(5): 1527–1546. http://www.ncbi.nlm.nih.gov/pmc/articles/PMC1361082/?tool=pubmed (Accessed 3/24/12.) 180
Ludwick A, Fu R, Warden C, Lowe R, “Distances to Emergency Department and to Primary Care Provider’s Office Affect Emergency Department Use in Children.” Academy of Emergency Medicine, May 2009, Vol. 16, no. 5. http://onlinelibrary.wiley.com/doi/10.1111/j.1553-2712.2009.00395.x/pdf (Accessed 3/24/12.) 181
Hadley J, Cunningham C, “Availability of Safety Net Providers and Access to Care of Uninsured Persons.” Health Serv Res. 2004 October; 39(5): 1527–1546. http://www.ncbi.nlm.nih.gov/pmc/articles/PMC1361082/?tool=pubmed (Accessed 3/24/12.) 182
Ludwick A, Fu R, Warden C, Lowe R, “Distances to Emergency Department and to Primary Care Provider’s Office Affect Emergency Department Use in Children.” Academy of Emergency Medicine, May 2009, Vol. 16, no. 5. http://onlinelibrary.wiley.com/doi/10.1111/j.1553-2712.2009.00395.x/pdf (Accessed 3/24/12.) 183
San Francisco Department of Public Health. “Proportion of Households Without a Motor Vehicle.” Sustainable Communities Index. http://www.sustainablecommunitiesindex.org/city_indicators/view/22. (Accessed 7/11/13.) 184
California Code of Regulations, Title 22, Section 53885, “Travel Distance Standards.” http://weblinks.westlaw.com/result/default.aspx?cite=22CAADCS53885&db=1000937&findtype=L&fn=%5Ftop&pbc=DA010192&rlt=CLID%5FFQRLT28804265110123&rp=%2FSearch%2Fdefault%2Ewl&rs=WEBL12%2E01&service=Find&spa=CCR%2D1000&sr=TC&vr=2%2E0. (Accessed 3/12/12.)
185
Please note that eligible beneficiaries may elect to seek care beyond the specified time/distance standard if desired. 186
California Health Interview Survey, 2007. https://askchis.org. (Accessed 3/5/12.) 187
Sustainable Communities Index, http://www.sustainablecommunitiesindex.org/city_indicators/view/24). 188
San Francisco Department of Public Health, Sustainable Communities Index, http://www.sustainablecommunitiesindex.org/indicators/view/52. (Accessed 7/11/13.) 189
Chinese Progressive Association. “Creating Healthy Communities: Making Healthcare Services Accessible in San Francisco.” Draft Report, March 2012. 190
Chinese Progressive Association. “Creating Healthy Communities: Making Healthcare Services Accessible in San Francisco.” Draft Report, March 2012. 191191
Sustainable Communities Index. http://www.sustainablecommunitiesindex.org/city_indicators/view/42 (Accessed 7/10/13.) 192
Please note that most people do not use regional transit to access their health providers. 193
A study of children enrolled in Medicaid found that there was a 27 percent reduction in emergency department use among patients who were assigned to a primary care provider located immediately adjacent to a public transit stop.
194 Ludwick A, Fu R, Warden C, Lowe R, “Distances to Emergency Department and to Primary Care Provider’s Office
Affect Emergency Department Use in Children.” Academy of Emergency Medicine, May 2009, Vol. 16, no. 5. http://onlinelibrary.wiley.com/doi/10.1111/j.1553-2712.2009.00395.x/pdf (Accessed 3/24/12.) 195
Neighborhood designations defined by the San Francisco County Transit Authority. 196
Physical Health Committee of the San Francisco African American Community Health Equity Council. “Community Diagnosis Report of the Physical Health Committee of the African American Community Health Equity Council: A Project of the Black Coalition on AIDS/Rafiki Wellness.” December 2011. 197
The Physical Health Committee of the San Francisco African American Community Health Equity Council (AACHEC) surveyed community members to establish their levels of health literacy between April and November 2011. AACHEC conducted this descriptive study at two health clinics located in predominantly African American neighborhoods in San Francisco as well as at community organizations, civic groups, and community events. Survey conductors administered the Rapid Estimate of Adult Health Literacy in Medicine (REALM) to a total of 158 African American respondents living in San Francisco. Please note that REALM was not administered to a random sample, meaning that results may not be representative of San Francisco’s African American population. 198
National Network of Libraries of Medicine. “Health Literacy.” http://nnlm.gov/outreach/consumer/hlthlit.html. (Accessed 1/25/12.) 199
Koh H., Berwick D., Clancy C., Baur C., Brach C., Harris L., and Zerhusen E. “New Federal Policy Initiatives to Boost Health Literacy Can Help the Nation Move Beyond the Cycle of Costly ‘Crisis Care.’” Health Affairs no. 2 (2012). http://content.healthaffairs.org/content/early/2012/01/18/hlthaff.2011.1169.full.pdf+html. 200
The National Assessment of Health Literacy is a project of the US Department of Education. The 2003 assessment was administered to more than 19,000 adults age 16 and older. 201
National Center for Education Statistics. “State and County Estimates of Low Literacy.” http://nces.ed.gov/naal/estimates/index.aspx. (Accessed 1/25/12.) 202
The National Center for Education Statistics explains its calculation of indirect estimates of limited literacy at the state and county level: “These estimates were developed using statistical models that related estimated percentages of adults lacking [basic prose literacy skills (BPLS)] in counties sampled for the 2003 National Assessment of Adult Literacy (NAAL) and the 1992 National Adult Literacy Survey (NALS) to county characteristics, such as levels of educational attainment and race/ethnicity distributions. Based on the results of these models, [the National Center for Education Statistics] derived BPLS literacy estimates for all states and counties in the United States and produced user-friendly tables to compare literacy estimates across states or counties and across years.” http://nces.ed.gov/NAAL/estimates/index.aspx. (Accessed 1/25/12.) 203
National Network of Libraries of Medicine. “Health Literacy.” http://nnlm.gov/outreach/consumer/hlthlit.html. (Accessed 1/25/12.) 204
Kutner M., Greenberg E., Jin Y., Paulsen C., White S. The Health Literacy of America’s Adults: Results from the 2003 National Assessment of Adult Literacy. September 2006. http://nces.ed.gov/pubs2006/2006483.pdf.
205
State of California, Department of Finance. Population Projections for California and Its Counties 2000 – 2050, by Age, Gender, and Race/Ethnicity. Sacramento, California, July 2007. 206
American Community Survey, 2009. 207
Institute of Medicine. “Health Literacy: A Prescription to End Confusion.” Report Brief. April 2004. http://www.iom.edu/~/media/Files/Report%20Files/2004/Health-Literacy-A-Prescription-to-End-Confusion/healthliteracyfinal.pdf. 208
Koh H., Berwick D., Clancy C., Baur C., Brach C., Harris L., and Zerhusen E. “New Federal Policy Initiatives to Boost Health Literacy Can Help the Nation Move Beyond the Cycle of Costly ‘Crisis Care.’” Health Affairs no. 2 (2012). 209
Institute of Medicine. Unequal Treatment: Confronting Racial and Ethnic Disparities in Health Care. National Academy Press, 2002. 210
Hasnain-Wynia R., Yonek J., Cohen A., and Restuccia J. Improving Care for Individuals with Limited English Proficiency: Facilitators and Barriers to Providing Language Services in California Public Hospitals. October 2009. Funded by the California Endowment. 211
Jacobs E., Sanchez-Leos G., Rathouz P., and Fu P. “Shared Networks of Interpreter Services, At Relatively Low Cost, Can Help Providers Serve Patients with Limited English Skills.” Health Affairs. 30, No. 10 (2011): 1930-1938. http://content.healthaffairs.org/content/30/10/1930.full?ijkey=IMlBLJYyuNUbw&keytype=ref&siteid=healthaff. 212
Gans D., Kinane C., Roby D., Graham-Squire D., Needleman J., Jacobs K., Kominski G., Dexter D., and Wu E. Achieving Equity by Building a Bridge from Eligible to Enrolled. Los Angeles, CA: UCLA Center for Health Policy Research and California Pan-Ethnic Health Network, 2012. http://www.healthpolicy.ucla.edu/pubs/files/enrolledpbfeb2012.pdf. 213
California Health Interview Survey, 2009. http://askchis.org/. (Accessed 2/21/12.) 214
California Health Interview Survey, 2009. http://askchis.org/. (Accessed 2/21/12.) 215
Chinese Progressive Association. “Creating Healthy Communities: Making Healthcare Services Accessible in San Francisco.” Draft Report, March 2012. 216
CPA administered its survey to Excelsior and Chinatown residents between April and August 2011. Please note that CPA used a convenience sampling method and that all preliminary findings constitute descriptive statistics. 217
“Health Care Interpreter Network.” California HealthCare Foundation. July 2010. http://www.chcf.org/projects/2009/health-care-interpreter-network. (Accessed 2/21/12.) 218
Jacobs E., Sanchez-Leos G., Rathouz P., and Fu P. “Shared Networks of Interpreter Services, At Relatively Low Cost, Can Help Providers Serve Patients with Limited English Skills.” Health Affairs. 30, No. 10 (2011): 1930-1938. 219
San Francisco General Hospital Foundation. “Interpreter Call Center and Video Medical Interpretation (VMI).” http://sfghf.net/programs/vmi.html. (Accessed 4/9/12.) 220
San Francisco Department of Public Health Certification Statement for Cultural Competence Provisions. http://www.dhcs.ca.gov/provgovpart/Documents/LIHP/Deliv/SanFran/8CulturalCompRevised.pdf. (Accessed 4/9/12.) 221
Agency for Healthcare Research and Quality (AHRQ). “Hospital Provides Non-English-Speaking Patients with Recording of Discharge Instructions in Native Language, Leading to Improved Comprehension and High Satisfaction.” AHRQ Health Care Innovations Exchange. http://www.innovations.ahrq.gov/content.aspx?id=2869. (Accessed 2/21/12.) 222
US Department of Health and Human Services, Office of Minority Health. “What is Cultural Competency?” http://minorityhealth.hhs.gov/templates/browse.aspx?lvl=2&lvlid=11. (Accessed 2/22/12.) 223
Smedly B., Stith A., Nelson A. Unequal Treatment: Confronting Racial and Ethnic Disparities in Healthcare. Institutes of Medicine. 2003. 224
Ngo-Metzger Q., Telfair J., Sorkin D., Weidmer B., Weech-Maldonado R., Hurtado M., Hays R. Cultural Competency and Quality of Care: Obtaining the Patient’s Perspective. Commonwealth Fund pub. No. 963. October 2006. 225
Thornburn B., Bogart L., Delahanty D. “Health-Related Correlates of Perceived Discrimination in HIV Care.” AIDS Patient Care and STDs, 2004 18(1): 19-26. 226
The percentages represent the proportion of the total population that identifies with the corresponding race/ethnicity category. On the US Census, people were able to mark more than one race category. Additionally,
Hispanic origin is an ethnicity that is calculated separately from race categories. The percents, therefore, do not add up to 100%. 227
The 2000 and 2010 Censuses report that people of Hispanic origin may be of any race. People were asked to answer the question on race by marking one or more race categories shown and their percentage is calculated independently from the other race categories. For the US Census, ethnic origin is considered to be a separate concept from race. 228
Perez Rendon A. The Health and Mental Health of Maya Children and Youth in San Francisco. Instituto Familiar de la Raza, Indígena Health and Wellness Collaborative. November 2011. 229
Flynn S., Weber K. Mental Health Needs for At-Risk Youth in the Bayview-Hunters Point Community. Masters of Nonprofit Administration Requirement, University of San Francisco. December 2011. 230
Beach M., Price E., Gary T., Robinson K., Gozu A., Palacio A., Smarth C., Jenckes M., Feuerstein C., Bass E., Powe N., Cooper L. “Cultural Competency: A Systematic Review of Health Care Provider Educational Intervention.” Med Care. 2005 April; 43(4): 356-373. 231
Lie D., Lee-Rey E., Gomez A., Bereknyei S., Braddock C. “Does Cultural Competency Training of Health Professionals Improve Patient Outcomes? A Systematic Review and Proposed Algorithm for Future Research.” Journal of General Internal Medicine. 26(3): 317-325. 2010. 232
US Department of Health and Human Services, Office of Minority Health. “National Standards on Culturally and Linguistically Appropriate Services (CLAS).” http://minorityhealth.hhs.gov/templates/browse.aspx?lvl=2&lvlID=15. (Accessed 3/2/12.) 233
CLAS standards are mandated for federally funded hospitals and clinics. For private facilities not federally funded, CLAS compliance supports accreditation through the Joint Commission on the Accreditation of Healthcare Organizations. 234
San Francisco Department of Public Health. Transgender HIV/AIDS Health Services: Best Practices Guidelines. http://www.careacttarget.org/library/tgguidelines.pdf. (Accessed 3/2/12.) 235
National Prevention Council. National Prevention Strategy: America’s Plan for Better Health and Wellness. June 16, 2011. http://www.healthcare.gov/prevention/nphpphc/strategy/report.pdf. 236
Grumbach K., Odom K., Moreno, G., Chen E., Vercammen-Grandjean C., Mertz E. Physician Diversity in California: New Findings from the California Medical Board Survey. Center for California Health Workforce Studies. University of California, San Francisco. March 2008. 237
Grumbach K., Odom K., Moreno, G., Chen E., Vercammen-Grandjean C., Mertz E. Physician Diversity in California: New Findings from the California Medical Board Survey. Center for California Health Workforce Studies. University of California, San Francisco. March 2008. 238
Bazemore, Andrew, Robert L Phillips, and Thomas Miyoshi. 2010. “Harnessing Geographic Information Systems (GIS) to enable community-oriented primary care.” Journal of the American Board of Family Medicine : JABFM 23(1): 22-31. 239
Dulin, Michael F et al. 2010. “Using Geographic Information Systems (GIS) to understand a community’s primary care needs.” Journal of the American Board of Family Medicine : JABFM 23(1): 13-21. 240
Mullan, Fitzhugh, Robert L Phillips, and Edward L Kinman. 2004. “Geographic retrofitting: a method of community definition in community-oriented primary care practices.” Family medicine 36(6): 440-6. 241
Phillips, R L et al. 2000. “Using geographic information systems to understand health care access.” Archives of family medicine 9(10): 971-8. 242
San Francisco General Plan, Community Facilities Element, Objective 9. 243
Planning Code - Health Care Services Master Plan, Ordinance 300-10 244
San Francisco Board of Supervisors, Ordinance 300-10, Health Care Services Master Plan, 2010. 245
For an overview of the efforts to use GIS to map primary care areas, see Bazemore, Robert L Phillips, and Miyoshi 2010; Dulin et al. 2010; Mullan, Robert L Phillips, and Edward L Kinman 2004; R L Phillips et al. 2000. 246
Medical Uses in the Planning Code can also include some types of dormitories / housing for students and employees of the medical institution and massage uses but those are explicitly excluded from the HCSMP legislation. 247
Per §1204 of the California Health and Safety Code.
248
LiDAR (Light Detection and Ranging) is an optical technique that can be used to estimate topographical information and by extension building sizes where no such information is available from administrative sources. 249
Conditional Uses - a use that is permitted if certain (operational or site) conditions are met. It requires a hearing in front of the Planning Commission, who grants or denies the application for a CU. 250
In the Planning Code, “as-of-right” refers to a use is principally permitted in a given district without a CU or other special entitlement permit. 251
Exhibit 78 specifically shows the number of health services jobs (NAICS 62), as recorded in an establishment-level business dataset, that are accessible within a 30-minute public transit trip during the AM peak, using schedules from the publicly available GTFS feed. For example, it is much easier to reach a larger number of health care professionals by transit from a red parcel than a blue one. 252
The Medical Board of California, http://www.mbc.ca.gov/licensee/stats_license_by_county.html 253
For the point of specialization versus distributed coverage, see statement on CPMC long range plan to the Planning Commission on December 28, 2010, of Mitch Katz, former director of San Francisco Department of Public Health. 254
The Planning Department maintains a parcel-level land use dataset for the city, including information on building size, type, and residential units. 255
OSHPD 256
The procedure is known as Thiessen Polygons. 257
A “patient encounter” is defined as the interaction between a patient and service provider and in which the provider renders any service to the patient. The top three patient encounter categories were, respectively, “Medicine - Special Services Evaluation and Management”, “All Other Services”, and “Medicine - Special Services,” comprising 878,000 of the 984,000 encounters. 258
Data obtained from http://www.oshpd.ca.gov/hid/Products/Hospitals/Utilization/PC_SC_Utilization.html 259
38,000 * .48 * .54 = 9,849 260
We say all other things equal because the need is determined with respect to, and serviced, not just by providing new buildings, but by having a solid service infrastructure in place for current and future residents. 262
Service/Secondary Office and Mixed Use Office districts 263
Chinatown Residential Neighborhood Commercial district 264
Mixed Use General district 265
PDR-1-G denotes “Production Distribution and Repair – General”. 266
NC 20 Looking Back of Twenty Years of Neighborhood Commercial Zoning, SF Planning Department (2009). 267
Supply/Demand Study for Production, Distribution, and Repair (PDR) in San Francisco's Eastern Neighborhoods, SF Planning Department (2005). 268
Industrial Land in San Francisco: Understanding Production, Distribution, and Repair, SF Planning Department (2002). 269
Made in San Francisco, SF Back Street Businesses Advisory Board (2007). 270
Gates, Gary J., Same-sex Couples and the Gay, Lesbian, Bisexual Population: New Estimates from the American Community Survey, The Willams Institute on Sexual Orientation Law and Public Policy, UCLA School of Law, October 2006. 271
Kaplan, A.B., The Prevalence of Transgenderism, Transgender Mental Health, http://tgmentalhealth.com/2010/03/31/the-prevalence-of-transgenderism/, March 31, 2010. 272
The “Census Poverty Threshold” (CPT) is the means by which the US Census Bureau calculates poverty. The CPT takes into consideration, not only household income, but also the age of household members. 273
The “Census Poverty Threshold” (CPT) is the means by which the US Census Bureau calculates poverty. The CPT takes into consideration, not only household income, but also the age of household members.