san marino environmental associates · camm c. swift, ph.d. ... camm c. swift, ph.d. san marino...
TRANSCRIPT

San Marino Environmental Associates
REVISED DRAFT
Results of the Year 3 Implementation of the Santa Ana Sucker Conservation Program
For the Santa Ana River
Thomas R. Haglund, Ph.D. Jonathan N. Baskin, Ph.D. Camm C. Swift, Ph.D.
Prepared for the Santa Ana Sucker Conservation Team SAWPA Task Order SMEA 370-03


San Marino Environmental Associates
Results of the Year 3 Implementation of the Santa Ana Sucker Conservation Program
For the Santa Ana River
Final Report
Prepared For: Santa Ana Sucker Conservation Team
Composed of: City of Riverside (Regional Water Quality Control Plant)
City of San Bernardino Municipal Water Department Orange County Flood Control District
Orange County Water District Riverside County
Riverside County Flood Control and Water Conservation District San Bernardino County Flood Control District
Prepared By: Thomas R. Haglund, Ph.D.
Jonathan N. Baskin, Ph.D. Camm C. Swift, Ph.D. San Marino Environmental Associates 560 South Greenwood Avenue San Marino, CA 91108-1270
2003


Table of Contents
I. Background Page 1 A. Introduction Page 1 1. Saiki (2000) Study Page 1 2. Swift (2001) Study Page 2 B. Conservation Plan Page 4 C. Conservation Agreement Page 5 D. Santa Ana Sucker Page 6 E. General Distribution of the Santa Ana Sucker in the Santa Ana River Page 12
II. Study Plan for Year 3 Implementation of the Conservation Program Page 15 III. Tagging Options Page 17 IV. Tagging Feasibility Study Page 20 V. Pit Tagging Page 24 A. Population Estimates - Sequential Depletion Page 33 B. Population Estimates – Snorkeling Surveys Page 37 C. Population Estimates – River Road 2002 Page 38 D. Riverside County Flood Control Diversion 2003 Page 41 E. Migration/Movement Page 45 F. Growth Page 49 G. Population Structure Page 50 VI. Reproduction Page 55 A. Introduction Page 55 B. Tuberculation Surveillance Page 58 C. Observations of Reproduction Page 62 D. Analysis of Spawning Gravel Page 64 E. Observations on Larvae Page 67 VII. Habitat Preferences of the Life Stages of the Santa Ana sucker Page 77 A. What We Know About Sucker Fry Page 84 VIII. Habitat Utilization by Adult and Juvenile Santa Ana Suckers Page 85 A. Methods Page 86 B. Data Collected Page 88 C. Habitat Availability Page 88 D. Habitat Utilization Page 89 E. Conclusions Page 98 F. Comparison with Uper San Gabriel River Data Page 98 IX. Sunnyslope Creek Breeding Substrate Enhancement Page 99

X. Conclusions Page 101 XI. Questions Page 103 XII. Program Tasks for 2004 Page 104 XIII. Potential Activities for Year 7 of the Conservation Program Page 105 XIV. Literature Cited Page 106 XV. Acknowledgements Page 109 Appendix 1 – 2001 Electrofishing Data Page 110 Appendix 2 – 2002 Electrofishing Data Page 118 Appendix 3 – Population Monitoring Techniques Page 127 Appendix 4 – Communications Regarding Enhancement of Breeding Habitat for Santa Ana Suckers in Sunnyslope Creek Page 136

Year 3 Implementation of the Santa Ana Sucker Conservation Program
Page 1 San Marino Environmental Associates
I. BACKGROUND. A. Introduction. In the spring of 1999, an informal group of concerned local, regional, State and Federal agencies formed the Ad Hoc Santa Ana Sucker Discussion Team (now called the Santa Ana Sucker Conservation Team) to identify and implement conservation measures that would contribute to the survival and recovery of the sucker within the watershed of the Santa Ana River. Research priorities and funding sources were identified, and a three-phase, coordinated effort was initiated and completed during the year 2000. The first phase of the initial scientific studies concentrated on physiochemical variables, including organic and inorganic tissue analysis, and was performed by the U.S. Geological Survey (Saiki 2000). The second phase, which studied migration patterns, predatory fish relationships and reproduction of Santa Ana suckers in tributaries, was conducted by Larry Munsey International (Swift 2001).
1. Saiki (2000) Study.
Saiki (2000) conducted a study of Santa Ana suckers in the Santa Ana River and in the San Gabriel River. In his study he specifically examined fish condition, gut contents (diet), fish-tissue contaminant levels, water quality and environmental measures associated with fish capture.
Saiki (2000) measured length and weight of suckers captured between December 1998 and December 1999. Suckers were captured in the East Fork of the San Gabriel River and at MWD Crossing in the Santa Ana River. Attempts to capture suckers at Imperial Highway failed. The data were used to estimate relative weight, an index of fish body condition (Bagenal and Tesch 1978). These data suggested that the geometric means of relative weight were typically higher in the San Gabriel River; however, the differences were only significant in three of five cases (Saiki 2000). Furthermore, the geometric means for various size classes of Santa Ana suckers were also typically higher in the San Gabriel River than in the Santa Ana River, but again these differences were only statistically significant among intermediate-sized fish, 40-119 mm SL (Saiki 2000). Saiki concluded that these data when combined with abundance data supported the premise that the San Gabriel River supports a healthy population of Santa Ana suckers while the Santa Ana River supports a marginal population of suckers. However, Saiki collected suckers near the downstream boundary of their continuous distribution in the Santa Ana River, clearly not in the area where suckers are most abundant in the Santa Ana River. Also the data suggest only occasionally a statistically significant higher index of fish body condition. Saiki interpreted the length data to indicate that only two distinct size classes were present in the Santa Ana River while three size classes were present in the San Gabriel River. Again the importance of the pattern observed by Saiki can only be determined by studying the Santa Ana sucker where it is abundant in the Santa Ana River. It will be important to determine if Saiki (2000) is correct in suggesting that there are only two age classes representing 0+ and 1+ aged individuals. Based on the detailed study of

Year 3 Implementation of the Santa Ana Sucker Conservation Program
Page 2 San Marino Environmental Associates
Santa Ana suckers in the Santa Clara River by Greenfield et al (1970), suckers first reproduce at 1+, which would mean that the suckers in the Santa Ana River only have one reproductive season. Data from the Santa Clara River suggest that suckers in this system typically reproduce at 1+, 2+, and some at 3+ (Greenfield et al 1970). The San Gabriel River may even contain individuals of age 4+ (Drake and Sasaki 1987), and even Saiki’s data indicate at least 1+ and 2+. Haglund and Baskin (1997) analyzed data from the West Fork of the San Gabriel River, and based on five years of data the population contained 2+, 3+ or 4+ as the maximum age class in different years.
The contaminant studies performed by Saiki (2000) indicate that Santa Ana suckers in the Santa Ana River do not possess persistent environmental contaminants at levels which exceed the average concentrations reported for freshwater fish from throughout the United States.
Saiki also proposed that reproduction occurred earlier in the Santa Ana River than in the San Gabriel River based on the time of initial appearance of fry and observations of breeding tubercles. Saiki did not provide data which were sufficiently specific to actually determine reproduction time during 1999, but his general observations are consistent with those of Haglund and Baskin (unpubl. data from San Gabriel River).
Gut contents of suckers were analyzed from both the San Gabriel River and the Santa Ana River. In both cases the gut contents consisted almost entirely of organic detritus. Insect material was slightly more common in fish from the San Gabriel River than in fish from the Santa Ana River. These data are consistent with the results of Greenfield et al‘s (1970) study of Santa Ana suckers and what is known about Pantosteus suckers in general (Smith 1966).
2. Swift (2001) Study.
Swift’s (2001) study had three major goals: 1. Document possible migration or movement of suckers with reference to the
potential impacts of a stream diversion below River Road, Norco. 2. Document areas and timing of spawning in the main river and its tributaries. 3. Assess the impact of exotic predators on the sucker.
As a result of these studies, Swift (2001) reached a series of conclusions with respect to the primary goals of the study.
Despite significant attempts to capture fish in the study area below River Road, Swift was only able to capture 11 sub-adult suckers. The captures were scattered throughout the year and no seasonal pattern of migration was detected (Swift 2001). A small number of young-of-the-year (YOY) suckers (17 individuals) were captured between May and August, which Swift (2001) attributed to downstream dispersal of YOY from upstream spawning areas. This work was unlikely to be able to determine the presence or absence of migration due to the rarity of adult fish in this stream reach. Furthermore, migration in other sucker species is associated with movement to

Year 3 Implementation of the Santa Ana Sucker Conservation Program
Page 3 San Marino Environmental Associates
and from spawning areas, and there was no suspected spawning area in this reach. Swift’s (2001) capture of YOY in May through August suggests that the downstream post-spawning dispersal of YOY needs to be investigated. Again the capture of 17 YOY over a four-month period is insufficient to establish downstream movement of juveniles as a major life history phenomenon. The results of this portion of Swift’s study are more likely to have a bearing on the potential significance of the diversion on the take of suckers, than to provide significant insights into the importance of movement (adult migration, YOY downstream dispersal) in the life history of Santa Ana suckers in the Santa Ana River.
Swift (2001) examined eight tributaries as potential reproductive sites: Rialto Drain, Rapid Infiltration and Extraction Plant (RIX) outlet, Evans Lake Drain, Mount Rubidoux Creek, Arroyo Tequesquite, Sunnyslope Creek, Anza Park Drain and Hidden Valley Drain. Of these potential tributary spawning sites, Swift (2001) only found larvae in Rialto Drain and Sunnyslope Creek, and concluded that reproduction was only occurring in these two tributaries. Swift also found fry in the mainstem and concluded that there was significant mainstem spawning. Swift (2001) found fry from late March until the first week of May. Based on the assumption that Santa Ana sucker’s reproductive habits would mirror that of other suckers (larval emergence one to two weeks following egg-laying), Swift (2001) concluded that sucker spawning had occurred from mid-March through mid-April in 2000, a period of approximately one month. The mainstem distribution of larvae was primarily from Rialto drain downstream to about 600 meters downstream of Mission Boulevard. Larvae were rare to absent from this point downstream with the exception of the occurrence of larvae in Sunnyslope Creek (Swift 2001).
The gut contents of 121 predatory fish were examined; however, only 79 of these exotics were captured when YOY suckers were known to be present in the vicinity. The gut contents of largemouth bass, green sunfish and bullhead catfish were primarily examined. These comprised about 75% of the exotics captured. Fish were an important component of the diet of largemouth bass and green sunfish. This is consistent with what is known of the diet of these fishes in their native habitat. Largemouth bass feed primarily on fish larvae and insects by the time they reach 50-60 mm SL (Keast 1966), and by the time they exceed 100-125 mm SL they subsist primarily on fish (Lewis et al 1961). Black bullhead and “Tilapia” gut contents were dominated, volumetrically, by algae and non-insect invertebrates. Fish and insects were minor components (Swift 2001). Again, these finding are consistent with the literature on the diets of these fishes within their native habitats (black bullhead, Applegate and Mullan 1967; Mozambique tilapia, Bruton and Boltt 1975). Among the bullheads (Ameiurus) that occur in the Santa Ana River, the yellow bullhead is probably slightly more piscivorous than the black bullhead (Miller 1966). As noted by Swift (2001), the “Mozambique type” cichlid and mosquitofish are the two most common exotics where suckers are abundant. As Swift (2001) recognized, the cichlid could be a food competitor. Studies (Bruton and Boltt 1975, Man and Hodgkiss 1977) indicate that diatoms are a major dietary component to fry and juvenile cichlids, but slightly less important to adults. This ontogenetic dietary pattern is the

Year 3 Implementation of the Santa Ana Sucker Conservation Program
Page 4 San Marino Environmental Associates
same in Santa Ana suckers (Greenfield et al 1974). The mosquitofish is an omnivorous, opportunistic feeder, which will often feed on the most abundant food source, including fish larvae (Harrington and Harrington 1961, Greenfield and Deckert 1973). Despite Swift’s (2001) relatively small sample size, when he combined these data with the distributional data, Swift suggested that exotic predators do not currently have a very significant impact on Santa Ana suckers (except potentially mosquitofish). Baskin and Haglund have argued that the data are not sufficiently robust to support such a conclusion. Further data is needed on the potential predation by various exotics on different life stages of the Santa Ana sucker, including the potential for mosquitofish to act as a larval predator. The potential impact of the Mozambique-type cichlids as a food competitors and other exotic interactions such as habitat modification and space competition need to be examined before a conclusion can be reached on the impact of exotics on the Sana Ana sucker population.
As a further outgrowth of the phase one and two studies discussed above, the Participants funded phase three, the development of a Conservation Plan for the Santa Ana sucker in the Santa Ana River. The Conservation Plan was developed by San Marino Environmental Associates (SMEA – Baskin and Haglund). The Conservation Program was developed based on SMEA’s Conservation Plan, with an initial term of five-years. The Program will promote the conservation of the Santa Ana sucker by implementing necessary research, restoring and creating habitat, and instituting avoidance and minimization measures during “Covered Activities” by the Participants along the Santa Ana River. [Information modified from the U.S. Fish and Wildlife Service Draft Environmental Assessment, 4 October 2001] B. Conservation Plan. A Conservation Program for the in situ recovery of a population of any fish species requires that two basic life history phenomena take place: successful breeding and successful recruitment (maturing of young into the adult reproductive population). If the success of these two features of the fish's life history can be enhanced there will be an increase in the effective population size and genetic heterozygosity can be maintained. This will, in turn, reduce the chances of extirpation, which is the goal of species recovery. The establishment of multiple independent, viable populations or subpopulations of a species is an effective buffer against species extinction and is a frequently used measure of species recovery when only one or a very few populations existed prior to the initiation of recovery efforts. In the case of the Santa Ana sucker, populations exist in all of the drainages within its historic range: Los Angeles River (Big Tujunga), Santa Ana River (lower portion of the drainage) and San Gabriel River (subpopulations in each of the West, North and East forks of the upper San Gabriel River) (Swift et al 1993). In addition, the Santa Ana sucker occurs in the Santa Clara River. This may be an introduced population. However, the conclusion that the Santa Ana sucker is introduced into the Santa Clara River is based entirely on negative evidence. It was absent from incidental field collections in the early part of this century, but it appeared in collections later. No records of an introduction are known. Although the sucker continues to survive within each of the drainages of its historic range, its distribution in each of the drainages to which it is native has become significantly reduced. It was this reduction in the

Year 3 Implementation of the Santa Ana Sucker Conservation Program
Page 5 San Marino Environmental Associates
species historic distribution that has led the U.S. Fish and Wildlife Service to propose listing the Santa Ana sucker as threatened under the Endangered Species Act (Federal Register, Vol. 64, No. 16, 50 CFR Part 17, RIN 1018-AF34, 26 January, 1999). The presence of the sucker within each of its historical drainages means that the typical recovery strategy of creating more independent populations will not be as important as the in situ enhancement, expansion, and protection of existing populations. The implementation of the Conservation Program for the Santa Ana sucker in the Santa Ana River is the first step in the overall recovery of the species. C. Conservation Agreement. The U.S. Fish and Wildlife Service is preparing an Environmental Assessment pursuant to the National Environmental Policy Act (NEPA) to analyze the effects of its proposal to execute (Proposed Action) a Conservation Agreement (Agreement) with various public and private sector agencies and interests (Participants). The agreement would implement the Santa Ana Conservation Program dated 1 September 2000, pursuant to NEPA and the Endangered Species Act of 1973 (ESA), as amended. While the EA is being completed, and prior to the signing of the Conservation Agreement, the Participants have opted to fund the Conservation Program in order to initiate the Program and begin the recovery of the Santa Ana sucker in the Santa Ana River. 1. Summary of the Results of the Year 1 Conservation Program.
SMEA’s data support the importance of Sunnyslope Creek and Rialto Drain as reproductive sites for the Santa Ana sucker.
Our work also supports Swift’s (2001) assertion that the Santa Ana River from
just downstream of Mission Boulevard upstream to Rialto Drain holds the largest, most continuously distributed deme of Santa Ana suckers.
Suckers in the Santa Ana River breed from mid-March through late April based
on the appearance of larvae (Swift 2001, Haglund et al. 2001).
Santa Ana suckers can be successfully tagged with PIT tags.
SMEA’s population estimate for Santa Ana sucker from about 600 meters downstream of Mission Boulevard upstream to Rialto Drain is 6,500-6,800 fish. However, we do not have any idea of the degree of fluctuation in this number.
Suckers spawn over medium gravel in water approximately 0.5 meters in depth
with a flow of 0.20-0.24 m/sec.
Sucker spawning habitat must contain a deeper, more protected area adjacent to the spawning area for fish to utilize when not spawning or between spawning bouts.

Year 3 Implementation of the Santa Ana Sucker Conservation Program
Page 6 San Marino Environmental Associates
Larval suckers utilize shallow (5-10 cm) water in low flow areas with a silt
bottom. Emergent or aquatic vegetation does not appear to be a requirement but is commonly present.
Larval suckers are only present for approximately 1.5 months.
Based on Saiki’s (2000) data, and SMEA’s data, most suckers may not survive
past 1+, meaning that they have only a single reproductive season. Due to annual variability in year class composition in Santa Ana sucker from the San Gabriel River, more data are needed.
These results are presented in more detail in Haglund et al. (2001).
This document is a report on the activities carried out and the data collected during the second year (2001/2002) of the Conservation Program. D. Santa Ana Sucker. The biology of the Santa Ana sucker (Catostomus santaanae Snyder) is poorly documented. The only substantial study on the life history of this species was done on the lowland population in the Santa Clara River (Greenfield et al 1970). Studies are underway which will improve the understanding of this species, but much of the current knowledge is based on the anecdotal observations of a few biologists that have spent many years studying the fishes of southern California. Preliminary results from Haglund and Baskin (2002) on habitat preferences of the Santa Ana sucker in the upper San Gabriel River are presented later in this report. Implementation of this Conservation Program will significantly improve the knowledge of this fish's life history and the parameters that impact population size variation in this species. Catostomus santaanae was originally described as Pantosteus santa-anae by Snyder in 1908, based on specimens collected from the Santa Ana River, Riverside, California. The hyphen was dropped from the specific name, and the species was assigned to the genus Catostomus by Smith in 1966. Smith considers Pantosteus to be a subgenus of Catostomus. The older literature uses the name assigned by Snyder. A complete synonymy is provided in Smith (1966). The Catostomidae are all freshwater fish found in China, northeastern Siberia and North America. The family has thirteen genera and 68 species (Nelson 1994). North America is the center of catostomid diversity. Santa Ana suckers are small catostomids with adults commonly less than 175mm SL (standard length). Their gross morphology (Photo 1) is generally similar to that of mountain suckers (C. platyrhynchus) and they possess notches at the junctions of the lower and upper lips as do mountain suckers (Photo 2). Large papillae are found on the anterior of the lower lip but papillae are poorly developed on the upper lip. The jaws have cartilaginous scraping edges inside the lips. There are 21-28 gill rakers on the external row of the first arch and 27-36 on the internal row. This species has 67-86 lateral

Year 3 Implementation of the Santa Ana Sucker Conservation Program
Page 7 San Marino Environmental Associates
line scales; 9-11 dorsal fin rays, usually 10; and 8-10 pelvic fin rays. The axillary process at the base of the pelvic fins is represented only as a simple fold. They possess a short dorsal fin and a deep caudal peduncle. The fish are silver ventrally while the dorsal surface is darker with irregular blotching. The degree of dorsal darkening and blotching is variable. Breeding males develop breeding tubercles over most of the body, but the tubercles are most dense on the caudal and anal fins and the caudal peduncle. Reproductive females possess tubercles only on the caudal fin and peduncle (Moyle, 1976).
Photo 1. A large Santa Ana sucker.

Year 3 Implementation of the Santa Ana Sucker Conservation Program
Page 8 San Marino Environmental Associates
Photo 2. Note the distinctive morphology of the lips of the Santa Ana sucker.
Santa Ana suckers are endemic to the Los Angeles basin. Their original range included only the Los Angeles, Santa Ana and San Gabriel river systems (Smith, 1966). Today small populations are still found in the Santa Ana River (Photo 4), Tujunga Wash in the Los Angeles River system, and in the upper San Gabriel River system (Figure 5) (Swift et. al., 1993). The Santa Ana sucker is presently listed as a Threatened Species under the federal Endangered Species Act. Large populations are found only in the San Gabriel River (Haglund and Baskin, unpubl. data). For this reason Swift et al. (1990) suggested that the East, West and North Forks of the San Gabriel River be considered for status as a Native Fish Management Area for this species. A potentially introduced population exists in the Santa Clara River (Photo 3); however, this population is in decline and throughout the lower portion of the drainage has hybridized with another introduced sucker, the Owens River sucker, Catostomus fumeiventris (Haglund, unpubl. data).

Year 3 Implementation of the Santa Ana Sucker Conservation Program
Page 9 San Marino Environmental Associates
Photo 3. Sucker habitat in the Santa Clara River near the
Los Angeles/Ventura County line. Note the similarity between the sucker habitat in the Santa Clara River (Photo 3) and in the Santa Ana River (Photo 4) compared to the San Gabriel River (Photo 5).

Year 3 Implementation of the Santa Ana Sucker Conservation Program
Page 10 San Marino Environmental Associates
Photo 4. Santa Ana sucker habitat in the Santa Ana River at Mission Bridge.
Photo 5. Santa Ana sucker habitat in the East Fork of the San Gabriel River.

Year 3 Implementation of the Santa Ana Sucker Conservation Program
Page 11 San Marino Environmental Associates
Collection of data on the Santa Ana sucker population in the Santa Clara River could, as suggested in SMEA’s Conservation Plan (Baskin and Haglund 2000), provide some insights into the Santa Ana River population. Such data might be particularly useful in understanding the carrying capacity for suckers in the Santa Ana River and their population structure. Santa Ana suckers are typically found in small to medium-sized streams, usually less than 7 meters in width, with depths ranging from a few centimeters to over a meter (Smith 1966; Deinstadt et al. 1990). Flow must be present, but it can range from slight to swift. The native streams were all subject to severe periodic flooding; thus, suckers prefer clear water but can tolerate seasonal turbidity. The preferred substrates for adults are gravel and cobble but may also include sand. Although the exact habitat of the juveniles has not been systematically documented, field observations in the Santa Clara River indicate that they are commonly found over sandy substrate and in shallower water than the adults if a choice of such habitats is available (Baskin and Haglund, unpubl. data). During surveys in the San Gabriel River, sucker fry were observed in very shallow water (less than 5 cm) at the very edge of streams (Baskin and Haglund, unpubl. data). This is a microhabitat commonly exploited by very young stream fishes, where they are less vulnerable to larger piscivorous predators and, possibly, where exposure to slightly elevated water temperatures can accelerate development. Santa Ana suckers are associated with algae but not macrophytes. Although the sucker seems to be quite generalized in its habitat requirements, they appear intolerant of highly polluted or highly modified streams. Spawning in this species occurs from April until early July but peaks in late May/early June in the Santa Clara River (Greenfield et al. 1970). The eggs are demersal and are spawned over gravel. Fecundity is high for such a small sucker species, ranging from 4,423 eggs in a 78mm SL (standard length) female to 16,151 in a 158mm SL female. The species is more fecund than most other catostomids. The Santa Ana sucker is relatively short-lived: few individuals survive beyond their second year and none beyond the third year in the Santa Clara River. They are reproductively mature in their first year and thus will typically spawn for two years. Growth rates in the Santa Clara River suggest first year individuals reach 61mm, second years 77-83mm and by the third year 141-153mm SL. Data from the West Fork of the San Gabriel River suggest a similar pattern of growth, but the fish in the West Fork live longer. Aging of Santa Ana suckers from the West Fork of the San Gabriel River by the California Department of Fish and Game (Drake and Sasaki 1987) led to the recognition that Santa Ana suckers could Reach 4+ years in the West Fork. The study suggested the following growth pattern for Santa Ana suckers in the West Fork of the San Gabriel River, young-of-the-year, 0-70mm; 1+, 71-130mm; 2+, 131-160mm; 3+, 161-185mm; and 4+, over 186mm (total length). Development of the eggs and larvae is described by Greenfield et al. (1970). The only substantial life history study done on this species studied the, potentially, introduced Santa Clara River population (Greenfield et al. 1970). Greenfield et al. (1970) found that detritus, algae and diatoms comprised 97% of the stomach contents while aquatic insect larvae, fish scales and fish eggs accounted for the remaining 3%. Larger specimens usually had an increased amount of insect material in their stomachs. The herbivorous trophic status of the Santa Ana sucker is substantiated by it's long intestine with up to 8 coils.

Year 3 Implementation of the Santa Ana Sucker Conservation Program
Page 12 San Marino Environmental Associates
E. General Distribution of the Santa Ana Sucker in the Santa Ana River. The Santa Ana sucker is found in the Santa Ana River from about Imperial Highway bridge upstream to the Rialto Drain. However, within the river the fishes are not evenly distributed. Below Prado Dam, suckers currently are rare. Swift’s (2001) surveys in 2000 failed to produce any suckers below Prado Dam, and Saiki’s (2000) team never captured any suckers during their work at Imperial Highway. However, work by SMEA for the U.S. Army Corps of Engineers (ACOE)(outside the Scope of the SAWPA contract) from 21-28 September located 8 suckers, six adult fish and two fish, which may have been young-of-the-year (YOY). SMEA conducted the surveys in conjunction with ACOE’s diversion of the river between Weir Canyon and Imperial Highway (Baskin and Haglund 2000). The diversion affected about 3 miles of river. Thus, not many suckers were located given the length of stream surveyed. This has been the pattern recently. Surveys find a few fish or none, and the individuals captured are adults or YOY. Surveys sponsored by the California Department of Fish and Game in 1994 located a moderate number of YOY and a few adults in the first 3 miles of stream below Prado Dam. In the early 1990s adult suckers could regularly be taken just upstream of Imperial Highway (Haglund unpubl data), and on one occasion, in excess of 100 adult suckers were trapped by a diversion immediately downstream of Imperial Highway (R. Fisher pers comm.). Although no recent, thorough surveys exist for the river below Prado Dam, in general, Santa Ana suckers appear to have declined in recent years in the river below Prado Dam. The river immediately below Prado Dam is different from the river reaches upstream of the dam. Much of the river is deeper, more slowly flowing with a siltier bottom (Photo 6), and the reach around Imperial Highway has been significantly impacted by construction (Photo 7). It is not known whether there was recently or is a self-sustaining population of Santa Ana suckers downstream of Prado Dam. No reproduction has been documented below Prado, and the population may be sustained solely by immigration from the upstream population.

Year 3 Implementation of the Santa Ana Sucker Conservation Program
Page 13 San Marino Environmental Associates
Photo 6. Habitat in the Santa Ana River near the mouth of Aliso Creek. Juvenile suckers
have been collected from this river reach.
Photo 7. Santa Ana River at Imperial Highway.
From the MWD crossing downstream to Prado Dam, fish are widely scattered and not very abundant. Swift’s (2001) work in 2000 yielded only 11 adult suckers by trapping about 4

Year 3 Implementation of the Santa Ana Sucker Conservation Program
Page 14 San Marino Environmental Associates
days per month for the entire year downstream of River Road. His seining surveys yielded one adult sucker downstream of River Road in 2000. SMEA conducted a one-time, intensive survey upstream and downstream of Van Buren Street bridge (Photo 8) in June of 2001 (outside of SAWPA contract, Baskin and Haglund 2001) and failed to locate any suckers. Swift reported visual sighting of suckers at Hamner Avenue Crossing and upstream almost to California Avenue. Suckers do occur downstream of MWD crossing, but the numbers are low and the fish scattered. The only place where fish may be reliably found is in the vicinity of the Riverside Water Reclamation facility (Chadwick 1991, Susan Ellis (CA DFG) pers comm.; Chadwick 1996, Mike Giusti (CA DFG) pers comm.; Swift 2000).
Photo 8. The Santa Ana River at the Van Buren Street bridge.
Suckers regularly occur at MWD crossing. This was one of Saiki’s (2000) study sites, and he found fish in both 1998 and 1999. USGS collections for the NAQUA program captured suckers at MWD crossing in July 2001 (previously in 1999 and 2000), and SMEA had collected suckers at MWD crossing earlier in the year, March 2001. The river reach upstream of MWD crossing to Mission Boulevard consistently contains fish, but the numbers are relatively low. Swift was able to find adult suckers in the vicinity of Arroyo Tequesquite in both February and June 2000, but no suckers were captured in the Arroyo itself. This stream reach also contains Anza Park Drain and Sunnyslope Creek. Suckers are found in both of these tributaries (Chadwick 1991, Susan Ellis (CA DFG) pers comm., Chadwick 1996, Mike Giusti (CA DFG) pers comm., Swift in 2000 (2001), Haglund et al. this report). Sunnyslope Creek is a well-documented reproductive site for the Santa Ana sucker.

Year 3 Implementation of the Santa Ana Sucker Conservation Program
Page 15 San Marino Environmental Associates
The river reach from just downstream of Mission Boulevard upstream to Rialto Drain contains the greatest number of suckers (Photo 9) (Swift 2001, Haglund et al. this report).
Photo 9. The Santa Ana River upstream of Market Street.
II. STUDY PLAN FOR YEAR 3 OF THE IMPLEMENTATION OF THE SANTA ANA SUCKER CONSERVATION PROGRAM. The work plan submitted by SMEA identified the tasks listed below. These tasks continue to be based to a large extent on the original tasks for a Conservation Program which were suggested in the Conservation Plan prepared by SMEA (Baskin and Haglund 1999). Modifications are primarily due to results of the year 1 and 2 implementation of the Santa Ana sucker conservation program and to a reduced budget compared to that envisioned in the Conservation Plan. Task 1. Prepare to Enhance Sucker Breeding/Spawning Habitat in Sunnyslope Creek during
the 2003/2004 field season. Subtask 1A. Obtain approval from USFWS Subtask 1B. Obtain approval from California Department of Fish and Game Subtask 1C. Obtain approval from County Parks Subtask 1D. Determine measures of success
This task responds to Item II-A-2 of the USFWS Draft Conservation and Recovery Needs of the Santa Ana Sucker in the Santa Ana River. This task is the precursor to the first attempt to actually improve sucker habitat in the Santa Ana River. In addition to obtaining the requisite permission, the project must

Year 3 Implementation of the Santa Ana Sucker Conservation Program
Page 16 San Marino Environmental Associates
be carefully designed in order to facilitate an accurate assessment of the success of the enhancement. The enhancement will be based on data collected at observed reproductive sites in the Santa Ana River.
What do we know? – Based on the two previous field seasons SMEA has been able to collect structural data at two separate reproductive sites in the Santa Ana River Drainage (habitat type, current velocity, substrate, adjacent habitat, depth etc.). These data will be used to select the enhancement site and design the enhancement. Task 2. Studies of Larval Suckers Subtask 2A. Determine movement of larvae particularly downstream drift Subtask 2B. Characterize habitat of larval suckers Subtask 2C. Determine the diet of larval suckers
This task responds to Items II-A-2 and II-C-3 of the USFWS Draft Conservation and Recovery Needs of the Santa Ana Sucker in the Santa Ana River. To the extent that habitat needs must be defined prior to any attempt at enhancement this task will collect the data necessary to define potential habitat enhancement for larval suckers and define habitat that must be restored following perturbation. Data on larval drift will begin to provide insight into the connectivity of different portions of the stream. Dietary data will be a precursor to looking at dietary overlap between Santa Ana suckers and non-native fishes of the Santa Ana River.
What do we know? – Based on preliminary data collected during the 2001/2002 field season, larval suckers are selecting a stream margin site, with particular structure, and substrate characteristics, these data a somewhat preliminary but will be firmed up during the current field season. Diets of the various life stages of Santa Ana sucker have only been generally characterized, and the data may not be applicable to the Santa Ana River. Downstream drift is known to be an important life history characteristic for other sucker species. Task 3. Studies of Young-of-the-Year (YOY) Suckers Subtask 3A. Determine movement of YOY suckers particularly downstream drift Subtask 3B. Characterize habitat of YOY suckers Subtask 3C. Determine the diet of YOY suckers
This task responds to Items II-A-2 and II-C-3 of the USFWS Draft Conservation and Recovery Needs of the Santa Ana Sucker in the Santa Ana River. To the extent that habitat needs must be defined prior to any attempt at enhancement this task will collect the data necessary to define potential habitat enhancement for YOY suckers and define habitat that must be restored following perturbation. Data on YOY drift will begin to provide insight into the connectivity of different portions of the stream, and may help understand occurrences such as the apparently unusually large number of YOY suckers that were found at River Road last summer. Dietary data will be a precursor to looking at dietary overlap between Santa Ana suckers and non-native fishes of the Santa Ana River.
What do we know? – Currently we know very little about these tasks. Preliminary data and anecdotal data from the 2001/2002 field season suggest that YOY may show considerable downstream movement. Our understanding of their habitat preference is very limited. However, studies by SMEA on the San Gabriel River have devised a methodology which proved to be successful in characterizing YOY habitat in the upper San Gabriel River. Diets

Year 3 Implementation of the Santa Ana Sucker Conservation Program
Page 17 San Marino Environmental Associates
of the various life stages of Santa Ana sucker have only been generally characterized, and the data may not be applicable to the Santa Ana River. Task 4. Studies of Adult Suckers Subtask 4A. Determine movement of adult suckers (placed under tagging also) Subtask 4B. Characterize habitat of adult suckers Subtask 4C. Determine the diet of adult suckers
This task responds to Items II-A-2 and II-C-3 of the USFWS Draft Conservation and Recovery Needs of the Santa Ana Sucker in the Santa Ana River. To the extent that habitat needs must be defined prior to any attempt at enhancement this task will collect the data necessary to define potential habitat enhancement for adult suckers and define habitat that must be restored following perturbation. Data on adult sucker movement will begin to provide insight into the connectivity of different portions of the stream. Dietary data will be a precursor to looking at dietary overlap between Santa Ana suckers and non-native fishes of the Santa Ana River.
What do we know? – Currently we know very little about these tasks. Preliminary data and anecdotal data from the last two field seasons suggest that adult suckers may show little movement. Our understanding of their habitat preference is very limited. However, studies by SMEA on the San Gabriel River have devised a methodology which proved to be successful in characterizing adult habitat in the upper San Gabriel River. Diets of the various life stages of Santa Ana sucker have only been generally characterized, and the data may not be applicable to the Santa Ana River. Taken together tasks 2, 3, and 4 will determine the habitat preferences of the various life stages of the Santa Ana sucker in the Santa Ana River, which will allow future attempts at habitat enhancement and restoration. Thus, this information can be used in the future to perform habitat enhancement/restoration experiments/tasks analogous to that proposed in Task 1. The “A and C” components of these tasks begins to address the importance of downstream movement of larva/YOY and adult movement, while the dietary data will provide the groundwork for future tasks which examine dietary overlap between the Santa Ana sucker and non-native fishes.. Task 5. Population Estimate/Tagging Subtask 5A. Estimate population size at the three standard sites Mission Boulevard Highway 60 Riverside Avenue Subtask 5B. Estimate population size at River Road Subtask 5C. Tag all fish captured during population estimates Subtask 5D. Use tagged fish to determine movement patterns of adult suckers
This task responds to Items II-A-2, II-C-1 and II-A of the USFWS Draft Conservation and Recovery Needs of the Santa Ana Sucker in the Santa Ana River.
What do we know? – SMEA currently has two years of population data. Population trends cannot be reliably determined from two data points. In fact, the two years of data that we do have suggest significant differences in population structure have occurred. This year’s data will begin to provide an insight into the result of such a demographic change, but only long

Year 3 Implementation of the Santa Ana Sucker Conservation Program
Page 18 San Marino Environmental Associates
term monitoring will allow an accurate assessment of population trends and population dynamics. Initial recovery of tagged adult Santa Ana suckers suggest some form of site fidelity. The data do not currently allow us to distinguish seasonal site fidelity from the potential that the adults do not move very much within the mainstem. We do possess some data suggesting that adults do move up creeks such as Sunnyslope Creek during reproductive season. Task 6. Snorkeling Surveys Subtask 6A. Snorkeling survey of Sunnyslope Creek Subtask 6B. Snorkeling survey of mainstem
This task responds to Items II-C-1 and II-A of the USFWS Draft Conservation and Recovery Needs of the Santa Ana Sucker in the Santa Ana River.
What do we know? – The snorkeling data provide the broadest coverage of the suckers in the Santa Ana River. These data allow SMEA to determine overall patterns of occurrence/density, and provide another semi-quantitative dataset on the status of the sucker. The snorkeling of Sunnyslope Creek allows SMEA to ascertain the degree to which adults migrate into the creek or are year-round residents (another way of looking at adult movement). Task 7. Determine the Diet of the Adult Stages of Exotic Fishes Subtask 7A. Determine the importance of predation on larvae Subtask 7B. Determine the importance of predation on YOY
This task responds to Item II-B of the USFWS Draft Conservation and Recovery Needs of the Santa Ana Sucker in the Santa Ana River.
What do we know? – Non-native fish species are still considered a threat to the Santa Ana sucker. In other systems where interactions between native fishes and non-natives have been studied, declines in the natives have been attributable to the presence of the non-natives. Preliminary data collected by Swift did not show evidence of predation on the sucker by non-natives, but the dataset was relatively small. The sample size needs to be increased. Gut content analysis will also broadly determine the diets of non-native fish, these data will provide the an initial dataset , which will subsequently be expanded to examine dietary overlap between various life stages of the non-natives and the life stages of the Santa Ana sucker. Exotic control programs are typically time-consuming and costly. Before making exotic fish control a priority, it will be important to try and ascertain the importance of such a program compared to other management alternatives. Modifications and finalization of the work plan were done through negotiations with SAWPA and in consultation with Jim Van Haun. The final Tasks are summarized below. Task 1. Enhancement of Breeding Habitat Move forward on the permitting process. Task 2. Studies of Larval Suckers. Attempt drift netting to begin determining how important downstream larval drift is to the Santa Ana sucker life cycle.

Year 3 Implementation of the Santa Ana Sucker Conservation Program
Page 19 San Marino Environmental Associates
Task 3. Studies of Juvenile and Adult Sucker. This task is the initiation of studies to determine the habitat utilization of juvenile and adult Santa Ana suckers in the Santa Ana River. Task 4. Population Studies. This task includes the sequential depletion population estimates, tagging studies, searching for tagged fish, and the snorkeling survey. Task 5. Determination of the Diets of Exotic Fishes. This task has no budget, but exotics will be collected as they are encountered. No gut content analysis is planned for this year. Task 6. Project Management and Administration. This task includes meeting attendance, preparation of updates, preparation of the annual report, and agency coordination. All work conducted as part of the third year implementation of the Santa Ana sucker Conservation Program was done under USFWS permit TE781377-3, as amended issued to SMEA (Baskin, Haglund and employees) and USFWS permit TE793644-4 issued to Camm Swift. III. TAGGING OPTIONS. In the Conservation Plan, Baskin and Haglund (2000) had recommended tagging suckers. The benefits of tagging to the study of the Santa Ana sucker in the Santa Ana River are extensive. In order to recover the sucker, we need to understand patterns of movement/migration, determine age class survival, document reproductive habitat use and estimate population size. Tagging should be useful in the study of all these parameters. Prior to initiating the tagging during the year 1 implementation of the Santa Ana sucker Conservation Program, SMEA investigated alternative tagging technologies. Specifically, SMEA examined:
Decimal Coded Wire Tag Soft Visible Implant Alphanumeric Passive Integrated Transponder (PIT) Tag Photonic Marking
The following table (Table 1) summarizes the advantages and limitations of the four technologies. Table 1. Summary of the advantages and limitations of four tagging technologies.
ADVANTAGES LIMITATIONS Decimal Coded Wire Tag
Can be used on small animals Capital equipment is expensive Minimal biological impact Tags are not externally visible High retention rate Tags must be excised (lethal)

Year 3 Implementation of the Santa Ana Sucker Conservation Program
Page 20 San Marino Environmental Associates
Enormous code capacity Inexpensive tags
Soft Visible Implant Alphanumeric High retention rate Unsuitable for small fish Low capital costs Requires suitable tissue Readable in live specimens Can become occluded Minimal biological impact
Passive Integrated Transponder (PIT) Tag Positive identification Moderate cost Easy field identification Requires injection Biologically safe Learning curve on injection Passive operation Easily injected
Photonic Marking Non-invasive For placement beneath translucent skin Externally visible Difficult to mark individuals Easily injected applied High retention Ideal for batch marking Based on the table above, it can be easily discerned that PIT tags offered the greatest potential for studies of the Santa Ana sucker. It should also be noted that SMEA investigated the potential use of telemetry to follow fish movement, but determined that sufficiently small transmitters were not available.

Year 3 Implementation of the Santa Ana Sucker Conservation Program
Page 21 San Marino Environmental Associates
The work done by SMEA in 2000-2002 has validated the use of pit tags on the Santa Ana sucker. Photos 10 and 11 show the equipment SMEA used during the sucker tagging.
Photo 10. The PIT tagging equipment, including the reader, injector with needle and
a PIT tag. A folding meter stick is provided for scale.

Year 3 Implementation of the Santa Ana Sucker Conservation Program
Page 22 San Marino Environmental Associates
Photo 11. Close-up of PIT tag and injector needle. Notice the bevel on the injector needle.
A folding meter stick is provided for scale.
IV. TAGGING FEASABILITY STUDY. In 2000, once SMEA had determined the optimal tagging technology, it was decided to conduct a study to ascertain the effect of the tagging on Santa Ana suckers, since no such data existed. Specifically, SMEA wanted to determine if the tagging caused any significant mortality. PIT tagging methods were described for salmonids based on work by the U.S. National Marine Fisheries Service (Prentice et al 1990a, 1990b). The techniques described in these papers combined with a protocol supplied by Howard Burge of the U.S. Fish and Wildlife Service were used to establish a protocol for tagging Santa Ana suckers. Burge indicated that he had found two sources of mortality in PIT tagging fish: 1) inexperienced personnel, and 2) anesthesia and handling. Therefore, a preliminary study served the additional benefit of gaining experience tagging, particularly Baskin, Swift, and Bryant. Only Haglund had previously PIT tagged suckers. SMEA also eliminated the use of MS-222 as an anesthetic, and used CO2 from Alka Seltzer tablets instead. SMEA used the following techniques during the experimental fish tagging. Because of the success of the experiment, the same techniques were used during the tagging of fish on the Santa Ana River.

Year 3 Implementation of the Santa Ana Sucker Conservation Program
Page 23 San Marino Environmental Associates
As suckers were captured, they were placed in buckets containing fresh river water. After several fish were captured they were transferred to coolers containing clean river water and polyaqua (slime stimulant). Coolers were maintained in the shade, and the water was refreshed as necessary. Fish were removed from the holding coolers about 4-6 fish at a time and transferred to an anesthetizing bucket to which Alka Seltzer had been added. No attempt was made to inject fish until they had slowed down. Prior to use and following each use, needles and injectors were soaked in 70% ethanol. Tags were stored in ethanol prior to their injection. A recorder noted the number of each tag and passed the tag to the individual doing the injection. The individual doing the injection measured (standard length) and weighed the fish prior to injection. The fish were injected to the left of the ventral midline, just posterior of the pectoral girdle. The needle was inserted at a low angle to the body. When the needle opening was just occluded by the fish’s tissue, the plunger was pushed. As the plunger was depressed, the needle was withdrawn so that the tag would just slide into the abdomen. The position and low angle insertion were designed to prevent damage to the fishes’ visceral organs. Following tagging, the fish were placed into a recovery cooler with fresh river water and polyaqua. The water was refreshed as necessary. Once fish were recovered, they were returned to the stream (At the Santa Ana River fish are returned to the stream when collection is complete). Fish were returned to the entire stream reach from which they had been captured. Temperature was constantly monitored, and all coolers were oxygenated using bubblers. The Santa Ana suckers from the Santa Clara River provided the perfect surrogates for the Santa Ana River suckers. They are the same species, but as previously mentioned, are specifically excluded from the federal listing. On 9 December 2000, 24 suckers were collected upstream of the Interstate 5 bridge over the Santa Clara River. The fish were split into two groups, a control group, and a group to be PIT tagged. All fish were relaxed with Alka Seltzer then 12 fish were tagged, and the untagged fish were handled to simulate tagging. Tag insertions were performed by Haglund, Baskin and Swift. The fish were tagged in this preliminary experiment and the subsequent experiment with BioMark PIT tags (11.5 mm) in the abdominal cavity. All 24 fish were placed in coolers containing a slime stimulant and transported to the Robinson Ranch golf course. The creek on the golf course was selected as an experimental site because it was thought to be secure. The fish were placed in artificial enclosures (boxes). The boxes had holes drilled in all sides in order to allow the water to flow relatively freely through the boxes. Cobbles were placed in the bottom and the boxes were wired to two pieces of rebar (on either side of the container) that had been driven into the substrate (Photo 12). The boxes were weighted with cobbles from the river in order to help stabilize the boxes and provide a food source for the suckers. Tops were “snap on” tops, which were further secured with bungee cords. Plant debris was used to cover the boxes to make them less obvious to a casual observer.

Year 3 Implementation of the Santa Ana Sucker Conservation Program
Page 24 San Marino Environmental Associates
Photo 12. Notice the two boxes in the center of this photograph; these are the sucker
enclosures. This photo was taken at the Robinson Ranch golf course creek. The fish were first checked on 12 December and it was discovered that the boxes had been tampered with, and 15 of the fish were missing. Nine fish remained in the boxes, 3 PIT tagged fish and 6 untagged fish. These fish were maintained in the golf course creek until 24 December when they were transported to the Santa Clara River and placed in the river just upstream of the Interstate 5 bridge. These fish suffered no mortality following the disturbance of the boxes. On 11 January a large flow in the Santa Clara River washed the box away terminating the experiment. Therefore, the known results are shown in the following table. This experiment lasted 27 days. Table 2. Initial Number Mortality Surviving Number PIT Tagged Fish 3 0 3 Fish Not PIT Tagged 6 0 6
The success of this experiment with respect to the apparent survival of the PIT tagged fish encouraged SMEA to expand the experiment. On 29 December 2000, Haglund, Baskin and Bryant of SMEA began a second phase of the tagging trial. The purpose of the second phase was to repeat the tagging experiment with a larger sample size. 93 suckers were collected upstream of the Interstate 5 bridge during 27 minutes of shocking. Sixty fish ranging in size from 59 mm SL to 113 mm SL were used in the experiment. The

Year 3 Implementation of the Santa Ana Sucker Conservation Program
Page 25 San Marino Environmental Associates
other 33 suckers were released. Twenty-three suckers were released after having been held for slightly over 2 hours, and all individuals appeared “healthy” when they were released. For the experiment, 30 fish were tagged and 30 fish were used as a control group. All fish were relaxed with Alka Seltzer then some fish were tagged, and the untagged fish were handled to simulate tagging. All 60 fish were placed in a cooler containing a slime stimulant. All tag insertions were performed by Haglund and Baskin. An attempt was made to utilize samples (tagged and untagged fish) with equal size distributions. The fish were placed in artificial enclosures (boxes). It took approximately an hour to place the boxes in the river. The boxes were weighted with cobbles from the river in order to help stabilize the boxes and provide a food source for the suckers. Fifteen fish were placed in each of 4 boxes with tagged/untagged ratios as follows: Box 1 - 8 tagged, 7 untagged
Box 2 – 8 tagged, 7 untagged Box 3 – 7 tagged, 8 untagged Box 4 – 7 tagged, 8 untagged
Box 1 was the downstream-most box and Box 4 was the furthest upstream. Box 1 was placed in the same pool as the old experimental box containing the nine fish from the first experiment. The boxes had holes drilled in all sides in order to allow the water to flow relatively freely through the boxes. Rocks were placed in the bottom and the boxes were wired to two pieces of rebar (on either side of the container) that had been driven into the substrate. Tops were “snap on” tops, which were further secured with bungee cords. Plant debris was used to cover the boxes to make them less obvious to a casual observer. The old experimental box was checked at time of installation of the other boxes, all nine fish were present and appeared fine. Two new cobbles, covered with algae, were placed in the box. Once the experiment had been completely set up, the remaining 10 suckers were released. All suckers had recovered and appeared to be swimming normally. There was no apparent damage as a result of electroshocking. All fish placed in the boxes appeared to be swimming normally and no fish were in obvious distress. The experiment was first checked following the set up on 1 January 2001. All the fish in the old experimental box were fine. There were two dead fish in the new experiment, one each in boxes 2 and 3. The dead fish were removed, and the boxes secured. The boxes were checked again on 2 and 7 January, there was no additional mortality. On 10 January flows were high when SMEA personnel went to check the boxes, and it was decided that the boxes shouldn’t be opened. On 11 January there was a very high flow that washed away the boxes, terminating the experiment.

Year 3 Implementation of the Santa Ana Sucker Conservation Program
Page 26 San Marino Environmental Associates
The results of the experiment after 10 days are summarized in the table below. Table 3. Initial Number Mortality Surviving Number PIT Tagged Fish 30 2 28 Fish Not PIT Tagged 30 0 30
The null hypothesis is that there was no association between PIT tagging and death. The null hypothesis is rejected if P<0.05. In a Fisher’s exact test, P = 0.25; so the null hypothesis is accepted. Based on the data presented above, SMEA determined that they could PIT tag Santa Ana suckers and not affect their survival. V. PIT TAGGING On 19 and 21 July 2002, SMEA personnel shocked three 100-meter sections of stream in order to capture and tag the Santa Ana suckers from these stream reaches. These same three stream reaches had been shocked and the captured fish tagged on 15 and 16 June 2001 (Data from the 2001 shocking collections are presented in Appendix 1). The primary goals of these collections were: (1) to provide population estimates of Santa Ana sucker from these three stream sections, (2) to begin to develop a population of tagged suckers, so that their movement/migration in the stream can be recognized and documented, and (3) to examine the population structure of the Santa Ana sucker. Discussion of the data relevant to each of the primary goals is given below. Three 100-meter stream reaches were chosen at random upstream of Mission Boulevard. The three sites are designated as: Site 1, upstream of Mission Boulevard; Site 2, upstream of Highway 60, and Site 3, downstream of Riverside Avenue. The stream sections are shown in Photos 13-15.

Year 3 Implementation of the Santa Ana Sucker Conservation Program
Page 27 San Marino Environmental Associates
Photo 13. A photograph of the tagging site just upstream of Mission Boulevard.
Photo 14. A photograph of the tagging site upstream of Highway 60.

Year 3 Implementation of the Santa Ana Sucker Conservation Program
Page 28 San Marino Environmental Associates
Photo 15. A photograph of the tagging location just downstream of Riverside Avenue
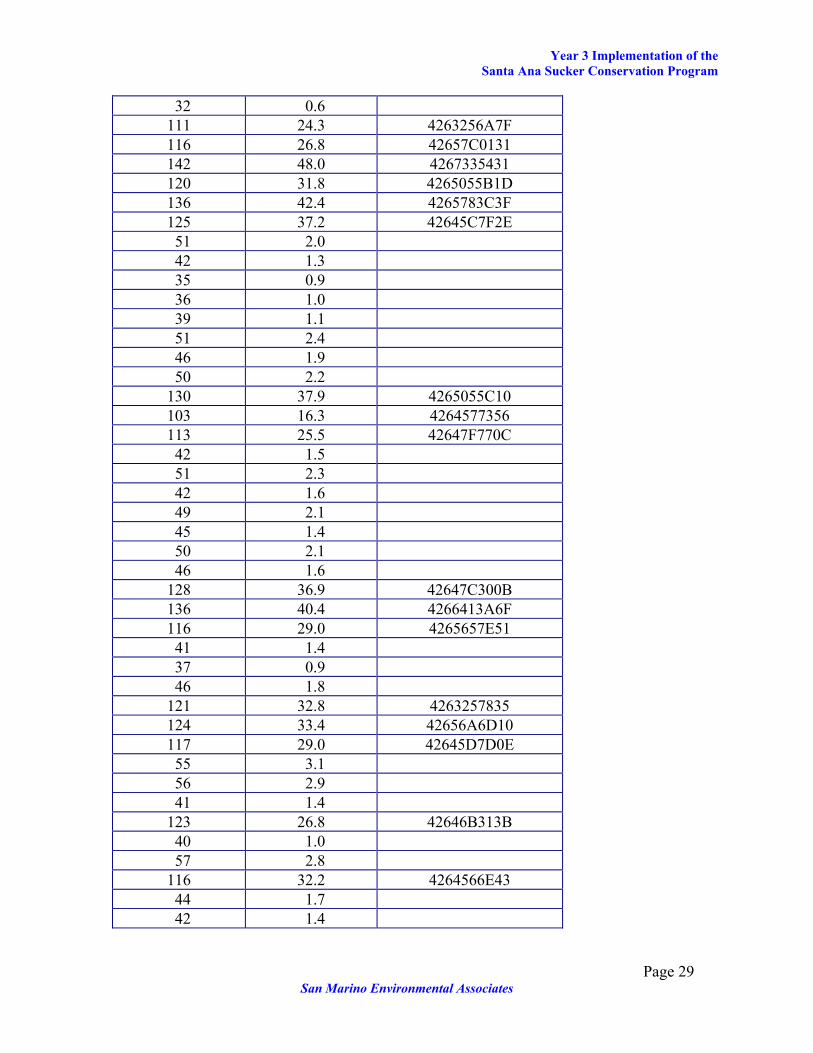
The length (mm SL) and weight (g) of each of the fish captured in the 100-meter sections is shown below in Tables 4-6. Table 4. List of the length (SL mm) and weight (g) of the fish caught (N=60) in the 100-meter stream reach upstream of Mission Boulevard (Site 1) on 26 July 2003.
LENGTH WEIGHT PIT TAG NUMBER 139 44.3 426468390E 141 47.4 4263324633 113 27.4 42655B0E12 121 31.4 42655C107B 126 35.8 42654F0A68 110 24.5 4263295512 49 2.0 51 2.9 113 27.9 42631F532C 160 60.5 426500133A 117 27.3 4264531114 56 3.4 53 2.9 41 1.3 35 0.7 46 2.2 42 1.5
Year 3 Implementation of the Santa Ana Sucker Conservation Program
Page 29 San Marino Environmental Associates
32 0.6 111 24.3 4263256A7F 116 26.8 42657C0131 142 48.0 4267335431 120 31.8 4265055B1D 136 42.4 4265783C3F 125 37.2 42645C7F2E 51 2.0 42 1.3 35 0.9 36 1.0 39 1.1 51 2.4 46 1.9 50 2.2 130 37.9 4265055C10 103 16.3 4264577356 113 25.5 42647F770C 42 1.5 51 2.3 42 1.6 49 2.1 45 1.4 50 2.1 46 1.6 128 36.9 42647C300B 136 40.4 4266413A6F 116 29.0 4265657E51 41 1.4 37 0.9 46 1.8 121 32.8 4263257835 124 33.4 42656A6D10 117 29.0 42645D7D0E 55 3.1 56 2.9 41 1.4 123 26.8 42646B313B 40 1.0 57 2.8 116 32.2 4264566E43 44 1.7 42 1.4

Year 3 Implementation of the Santa Ana Sucker Conservation Program
Page 30 San Marino Environmental Associates
Table 5. List of the length (SL mm) and weight (g) of the fish caught (N=96) in the 100-meter stream reach upstream of Highway 60 (Site 2) on 27 July 2003.
LENGTH WEIGHT PIT TAG NUMBER 111 27.2 4263176A63 120 29.8 426508124E 137 43.7 42657B5767 116 25.5 42654F097F 112 27.9 42656E085F 103 22.8 42657C2528 38 1.0 45 1.6 50 2.6 40 1.2 60 3.8 54 3.3 44 1.5 49 2.4 53 2.6 55 3.2 54 3.2 40 1.5 48 2.0 50 2.5 44 1.6 55 2.8 35 0.9 51 2.5 42 1.7 47 2.4 53 3.0 40 1.6 49 2.2 35 0.7 42 1.5 43 1.7 44 1.7 49 2.4 31 0.4 34 0.8 55 2.9 55 3.1 53 2.9 54 2.8

Year 3 Implementation of the Santa Ana Sucker Conservation Program
Page 31 San Marino Environmental Associates
55 3.0 53 2.8 35 0.8 44 1.7 50 2.5 52 2.7 55 2.9 56 3.3 56 3.3 55 3.1 58 3.7 36 0.9 34 0.7 53 2.7 54 3.0 57 3.4 56 3.3 60 3.9 55 3.0 58 3.6 56 3.3 55 2.9 56 3.1 44 1.9 48 2.2 52 3.0 58 3.6 56 3.2 55 3.0 55 2.8 42 1.8 120 33.8 4265032946 118 31.8 4265572947 112 23.8 4266061342 118 28.1 42660A5360 59 3.3 109 25.7 42657C0305 55 3.3 56 3.6 56 3.2 52 2.8 49 2.1 34 0.8 52 2.5

Year 3 Implementation of the Santa Ana Sucker Conservation Program
Page 32 San Marino Environmental Associates
41 1.2 59 3.3 49 2.2 47 2.2 34 0.7 34 0.8 47 1.9 55 3.4 39 1.2 55 2.9 53 2.8 52 2.1
Table 6. List of the length (SL mm) and weight (g) of the fish caught (N=49) in the 100-meter stream reach downstream of Riverside Avenue (Site 3) on 28 July 2003.
LENGTH WEIGHT PIT TAG NUMBER 110 24.1 42634E7215 147 57.8 42650C4837 110 26.2 4265755B07 127 37.3 42655B141E 114 27.4 4264670C62 129 35.1 4264731214 126 36.6 42645D5365 138 29.1 42650E1225 127 36.1 4265706033 53 - 48 2.0 58 3.4 51 2.2 137 37.0 4265782633 125 37.9 426556627B 150 59.0 42650D4900 124 33.6 42657A0C25 115 29.0 4265622162 55 2.6 56 3.9 72 6.6 51 2.7 53 2.9 68 5.4 126 41.1 42645A0624 55 2.8 55 3.3

Year 3 Implementation of the Santa Ana Sucker Conservation Program
Page 33 San Marino Environmental Associates
56 3.1 64 4.6 113 28.3 4263342C50 120 28.9 4264727743 138 45.1 42647F7235 52 2.4 58 3.4 62 3.6 167 71.6 4263126704 120 28.1 4265041336 116 30.1 42633F710C 65 5.4 60 3.8 56 3.1 125 38.3 4266040C10 110 22.9 42647A2858 56 4.0 57 3.3 61 4.3 61 3.7 55 2.9 48 2.2
In addition to the suckers tagged as part of the population estimate in 1991, additional suckers were tagged to increase the population of tagged suckers in the river. Fish were tagged at the following locations on the specified dates:
16 June 2001, Pool under Riverside Avenue bridge, N=34 18 June 2001, Pool under Riverside Avenue bridge, N=8 18 June 2001, About 100-150 m downstream of Highway 60, N=14 18 June 2001, Site 1 upstream of Mission Boulevard, N=3 22 June 2001, Sunnyslope Creek, N=19 27 July 2001, MWD Crossing, N=5
The length (mm SL), weight (g) and pit tag number of each of the fish captured and tagged in 2001 during the above tagging sessions is presented in Appendix 1. No comparable tagging sessions were conducted in 2002 or 2003. However, fish were tagged during 2003 as part of work on the Riverside Flood Control diversion and during a November field session, which was conducted to look for tagged fish. These data are presented in Tables 16, 19, 20 and 21. A. Population Estimates – Sequential Depletion. SMEA had originally hoped that it would be possible to use a mark-recapture technique to estimate the sucker population, and thus have yet another use for tagged fish as well as an alternative population estimate. However, because it is difficult to meet the assumptions of a

Year 3 Implementation of the Santa Ana Sucker Conservation Program
Page 34 San Marino Environmental Associates
mark-recapture in a riverine system, SMEA preferred the use of a depletion technique. However, a recapture attempt was made following the initial tagging. In order to ascertain the feasibility of mark-recapture in this system, SMEA tagged fish from three localities on 16 June 2001. SMEA returned to these localities on 18 June to attempt to recapture the marked fish, and associated unmarked fish in order to make a population estimate. Too few fish were captured during the recapture phase of the technique to provide a reliable population estimate. As mentioned above, SMEA used a triple pass depletion to collect the fish on 16 June as a back-up to the mark-recapture procedure. It is the triple-pass depletion procedure that SMEA employed during 2002 (See Appendix 2 for a discussion of triple pass depletion procedure and calculations). The three sites used in this study were described above. The 2001 data from the triple pass depletion are presented in Tables 7 and 8; 2002 data from the triple pass depletion are presented in Tables 9 and 10; and 2003 data from the triple pass depletion are presented in Tables 11 and 12. Table 7. The number of suckers captured in each of the three passes, at each of the three sampling sites on 15 and 16 June 2001.
Pass # Site 1 Site 2 Site 3 1 57 123 8 2 21 25 5 3 10 16 0
These data provide the following estimates for the population of Santa Ana suckers at each of the three 100-meter study reaches: Site 1, upstream of Mission Boulevard = 89 fish Site 2, upstream of Highway 60 = 164 fish Site 3, downstream of Riverside Avenue = 13 fish The standard error can be used to calculate the 95% confidence interval (confidence interval = +1.96(SE)). This means that there is only a 5% chance that the “true” population size is outside the confidence interval. The standard errors and confidence intervals for the population estimate from each of the three sites is shown in Table 8. Table 8. Confidence intervals for the population estimates from the three sites.
Locality Population Estimate
Standard Error Confidence Interval
Site 1 89 2.85 83-94 Site 2 164 0 164 Site 3 13 0.60 12-14
Based on the data presented above, one would estimate that there is an average of 86-91 fish per 100 meters. It is assumed that these habitats are representative of the habitat from 600 meter below Mission Boulevard upstream to Rialto Drain. This is a distance of approximately 7.65 kilometers. Therefore, based on the above data this stream reach would be expected to hold approximately 6,579-6,962 Santa Ana suckers.

Year 3 Implementation of the Santa Ana Sucker Conservation Program
Page 35 San Marino Environmental Associates
Table 9. The number of suckers captured in each of the depletion passes, at each of the three sampling sites 26-28 July 2002.
Pass # Site 1 Site 2 Site 3 1 52 62 27 2 38 47 7 3 25 42 11 4 13
These data provide the following estimates for the population of Santa Ana suckers at each of the three 100-meter study reaches: Site 1, upstream of Mission Boulevard = 146 fish Site 2, upstream of Highway 60 = 170 fish Site 3, downstream of Riverside Avenue = 47 fish The standard error can be used to calculate the 95% confidence interval (confidence interval = +1.96(SE)). This means that there is only a 5% chance that the “true” population size is outside the confidence interval. The standard errors and confidence intervals for the population estimate from each of the three sites is shown in Table 10. Table 10. Confidence intervals for the 2002 population estimates from the three sites.
Locality Population Estimate
Standard Error Confidence Interval
Site 1 146 21.56 124-168 Site 2 170 11.56 158-182 Site 3 47 3.92 43-51
Based on the data presented above, one would estimate that there is an average of 108-134 fish per 100 meters. It is assumed that these habitats are representative of the habitat from 600 meter below Mission Boulevard upstream to Rialto Drain. This is a distance of approximately 7.65 kilometers. Therefore, based on the above data this stream reach would be expected to hold approximately 8,262-10,251 Santa Ana suckers. Table 11. The number of suckers captured in each of the depletion passes, at each of the three sampling sites 26-28 July 2002.
Pass # Site 1 Site 2 Site 3 1 32 71 29 2 16 17 12 3 12 8 8
These data provide the following estimates for the population of Santa Ana suckers at each of the three 100-meter study reaches: Site 1, upstream of Mission Boulevard = 63 fish Site 2, upstream of Highway 60 = 96 fish Site 3, downstream of Riverside Avenue = 50 fish

Year 3 Implementation of the Santa Ana Sucker Conservation Program
Page 36 San Marino Environmental Associates
The standard error can be used to calculate the 95% confidence interval (confidence interval = +1.96(SE)). This means that there is only a 5% chance that the “true” population size is outside the confidence interval. The standard errors and confidence intervals for the population estimate from each of the three sites is shown in Table 12. Table 12. Confidence intervals for the 2002 population estimates from the three sites.
Locality Population Estimate
Standard Error Confidence Interval
Site 1 63 4.11 59-67 Site 2 96 0.00 96 Site 3 50 2.20 48-52
Based on the data presented above, one would estimate that there is an average of 68-72 fish per 100 meters. It is assumed that these habitats are representative of the habitat from 600 meter below Mission Boulevard upstream to Rialto Drain. This is a distance of approximately 7.65 kilometers. Therefore, based on the above data this stream reach would be expected to hold approximately 5,202-5,508 Santa Ana suckers. Table 13. Comparison of the 2001, 2002 and 2003 population estimates. 2001 2002 2003 Site 1 - upstream Mission bridge 89 + 2.85 146 + 21.56 63+4.11 Site 2 - upstream Hwy 60 bridge 164 + 0.0 170 + 11.56 96+0.00 Site 3 - downstream Riverside Dr bridge 13 + 0.60 47 + 3.92 50+2.20 Average per 100 meter reach 86-91 108-134 68-72 Estimated suckers in 7.65 km 6,579-6,962 8,262-10,251 5,202-5,508 The data are displayed graphically below. Figure 1. The graph illustrates the population variation at each of the three sites between 2001 and 2003.
020406080
100120140160180
2001 2002 2003
Year
Num
ber o
f Suc
kers
Site 1Site 2Site 3

Year 3 Implementation of the Santa Ana Sucker Conservation Program
Page 37 San Marino Environmental Associates
Figure 2. The graph shows the estimate for the total number of fish in 7.65 miles of the Santa Ana River.
01,0002,0003,0004,0005,0006,0007,0008,0009,000
10,000
2000 2001 2002 2003 2004
Year
Num
ber o
f Suc
kers
PopulationEstimate
Looked at simplistically, the data appear to suggest a decrease in the number of fish in the river, based on sampling at these three sites. However, two cautionary notes apply: 1. No population trend can be robustly defined by three data points. 2. If one looks at the number of fish per meter of stream, the values are 0.89, 1.21 and 0.70, at least 2001 and 2003 are about the same.
3. There were significant changes in the population structure (see discussion of population structure) between 2001 and 2002, which may reflect the exceptionally dry year of 2002. It is clear from the data, that there is considerable annual variation, as one would expect in a Southern California system.
It is essential to remember that robust determinations of population trends require many years of data. Furthermore, the Santa Ana sucker which evolved in the unpredictable hydrological regime of Southern California has evolved to become highly fecund. This allows the fish to exploit optimal conditions when they occur, and to recover rapidly after population drops resulting from years with poor recruitment (e.g. Greenfield et al. 1970). B. Population Estimates – Snorkeling Surveys. During 1999 and 2000, snorkeling surveys were conducted to estimate sucker density/abundance in the Santa Ana River. Because this dataset had been started in 1999, SMEA determined to continue to collect these data in 2001 and 2002. Appendix 3 contains a discussion of this technique as a method of population estimation. The data from 1999 through 2002 are presented in Table 14. This technique, although not as quantitatively reproducible, does provide a broader coverage of the river than can be accomplished using sequential depletion techniques without excessive cost and personnel effort.

Year 3 Implementation of the Santa Ana Sucker Conservation Program
Page 38 San Marino Environmental Associates
Table 14. Results of snorkeling surveys 1999-2003. Year Locality Date Length (m) #YOY #Adult Total Fish/Meter 1999 Below Riverside 22 Dec 645 707 1.096
Arr Tequesquite-Mission 22 Jun 2,100 46 0.022 Market to Riverside 28 Jun 2,600 422 0.162 Riverside to RIX outlet 29 Jun 2,300 125 0.054 Sunnyslope 20 Jun 430 156 0.363
2000
Totals 7,430 749 0.101 Mission to Market 14 Jun 1,700 600 0.353 Market to Riverside 03 Jul 2,600 72 671 743 0.286 Riverside to RIX outlet 03 Jul 2,300 175 223 398 0.173 Sunnyslope 22 Jun 430 51 0.119
2001
Totals 7,030 247 894 1,792 0.255 Mission to Market 26 Jun 1,700 614 1,264 1,868 1.099 Market to Riverside 26,28 Jun 2,600 46 414 460 0.177 Riverside to RIX outlet 28 Jun 2,300 31 87 118 0.051 Rialto Drain 28 Jun 350 29 1 30 0.086 Sunnyslope 29 Jun 430 0 0 0 0.000
2002
Totals 7,380 720 1,766 2,476 0.336 Mission to Market 30 Jun 1,700 1,451 669 2,120 1.247 Market to Riverside 30 Jun 2,600 132 320 452 0.174 Riverside to RIX outlet 02 Jul 2.300 15 193 208 0.090 Rialto Drain 02 Jul 350 69 6 75 0.214 Sunnyslope 02 Jul 430 38 31 69 0.160
2003
Totals 7,380 1,770 1,219 2,924 0.396 What is clear from these data is that there has been a decrease in the number of fish in Sunnyslope Creek over the period of 2000 to 2002. There is an increase in fish in Sunnyslope again in 2003 to approximately level found in 2001. These surveys show that from 2001-2003 the average number of fish/meter of stream stays relatively constant. For the accuracy of this method these numbers are probably all the same. In 2000, however, the population was lower. These data are impossible to compare directly to the sequential depletion data, however, they should be measuring the same pattern of population variation. C. Population Estimates – River Road 2002. During the summer, workers around River Road found what was thought to be a very large number of small suckers. Because of this SMEA was asked to make a population estimate in the area of River Road. On 15 August 2002, a site just upstream of the bridge was selected. This river reach was in the main flow channel and thus somewhat resembled the other 100-meter sections being studied by SMEA. However, two passes with an electroshocker failed to produce any suckers. The area was then snorkeled and examined with a viewing tube. No suckers were found. It was then decided to move upstream of the berm placed in the river by the sand mining operation. A 50 meter site along the berm was selected. Because the water is so wide at this area, a rectangle 50 meters long and 4 meters wide was cordoned off with blocking nets. One edge of the sampling area was the berm. A sequential depletion of this stream reach

Year 3 Implementation of the Santa Ana Sucker Conservation Program
Page 39 San Marino Environmental Associates
produced 304 juvenile suckers most between 40 and 60 mm SL. The estimated population was 304 fish per 50 meters with a standard error of +0. To make the estimate comparable to the other reaches, this would be 608 fish per 100 meters. This is almost twice the number of suckers (YOY and adult combined) as were captured at all three other 100-meter sections. Young-of-the-year suckers were extraordinarily abundant at River Road in 2002. There is virtually no data from other years. The large number of juvenile suckers that had been observed at River Road prompted SMEA to do a young-of–the-year survey on 13 July 2002. In order to obtain a gross idea of the distribution and abundance of YOY suckers, Seven (7) sites were selected and two 50-meter reaches were seined at each. The results are shown in Table 15.
Photo 16. A young-of-the-year (YOY) Santa Ana sucker.

Year 3 Implementation of the Santa Ana Sucker Conservation Program
Page 40 San Marino Environmental Associates
Table 15. Summary of data collected on 13 July 2002 - Santa Ana sucker young-of-the-year survey. Sucker Other Fishes Locality # Seine Hauls
YOY Adult Ga2 Bb3 Yb4 Fm5 Mc6 Lb7 Gf8 Ca9 Ac10
Market Street Upstream 16 1 0 X X Downstream 10 0 0 X X X Mission Boulevard Upstream 10.5 411 8 X X X Downstream 11 3 3 X X X Sunnyslope confluence Section 11 10 8 0 X X X Section 2 10 8 2 X X X MWD Crossing Upstream 11 0 0 X Downstream 13 0 0 X Van Buren Boulevard Upstream 11 0 0 X X Downstream 10 0 0 X Hamner Avenue Upstream 13 0 0 X X Downstream 15 0 0 X River Road Upstream 10.5 50 0 X X X X X Downstream 11 5 0 X X X X
1. Both 50 meter sections were upstream of the confluence of Sunnyslope Creek. 2. Mosquitofish 3. Black bullhead 4. Yellow bullhead 5. Fathead minnow 6. Mozambique cichlid 7. Largemouth bass 8. Goldfish 9. Carp 10. Arroyo chub 11. At this site several large schools were observed, in excess of 100 individuals total, captured 2 to verify that they were suckers.

Year 2 Implementation of the Santa Ana Sucker Conservation Plan
Page 41 San Marino Environmental Associates
The YOY survey demonstrated the presence of YOY suckers in the upstream areas and at River Road. However, none were found at intermediate sites. This raises the question of whether the large number of YOY suckers had been produced at River Road or whether they were the result of downstream drift of larval/YOY fish from the upstream reaches The currently available data do not provide an answer to this question. D. Riverside County Flood Control Diversion – 2003 On 19 November 2003 Riverside County Flood Control (RCFC) found it necessary to divert the low flow channel of the Santa Ana River away from the south levee of the river at a point just upstream (east) of the Riverside Avenue Bridge in Riverside, CA. This flow was considered a threat to the levee in the event of a flood, therefore the diversion was declared to be an emergency. San Marino Environmental Associates (SMEA) was engaged by RCFC to implement protection and relocation for the Santa Ana sucker (Catostomus santaanae) during this diversion activity. This presented an opportunity to obtain data on the Santa Ana suckers occupying the reach that was diverted. During this entire operation and for the following few hours SMEA fishery biologists were positioned along the original channel to rescue stranded fishes. Native fishes, suckers and chubs (Gila orcutti), were rescued, while exotic species (see species list, Table 14) were discarded. The data for size and weight of suckers is given on Table 15. It should be noted that all of these fishes were taken immediately following the diversion, and some fishes were observed swimming downstream, out of the original channel as the water level dropped. Minor modifications to the channel were made both by hand and with mechanized equipment at the direction of SMEA to facilitate the downstream escape of these fishes. These fishes were not captured or counted, so all counts represent an under estimate of the number of fishes present in the original channel. Past experience indicates that fishes normally move downstream or take refuge in the deepest places in a channel when water levels drop. In this channel the deepest places, with the best cover and habitat for these fishes, especially adult suckers, were where the flow extended along the levee and several deep pools (up to about 1.5m deep) with good flow and vegetation cover were found. It is here that most fishes probably took refuge when the water dropped initially. The most downstream area of the original channel consisted largely of shallow water (up to about 0.5m deep) with a sandy substrate (about 70%), 30% gravel/cobble, no boulders or deep spots and only one riffle. This area was the lowest quality sucker habitat in the original channel, and probably held the fewest suckers. The upstream portion of the original channel, in contrast, was made up almost entirely (90%) of an excellent gravel/cobble riffle with good algal growth on the substrate. Large numbers of small suckers, about 90, were found stranded among the rocks in this riffle during the initial drop of the water. Many suckers from this area probably took refuge in the deep pools just downstream. Loose soft sand made it impossible to remove fishes from the deep pools until the water level dropped substantially. SMEA biologists remained on site all day capturing fishes from deep spots. By the end of the day the entire downstream part of the original channel was dry, so all fishes

Year 2 Implementation of the Santa Ana Sucker Conservation Plan
Page 42 San Marino Environmental Associates
remaining in the channel were isolated, unable to move downstream through this area. Consequently, it was necessary to return on the following day, November 20, to rescue additional fishes from the deeper pools as they became further dewatered and the fishes became accessible. Twenty suckers were taken that day, but not all pools were sufficiently accessible to remove all fishes. On November 22, these pools had dewatered sufficiently so that all stranded fishes could be removed with confidence (290 suckers, 794 chubs and numerous non-native fishes were removed). The fishes captured on November 19 were returned to the stream downstream of the diversion channel. Those taken on November 20 and 22 were returned to the water in the diversion channel because they were stressed, and this was the closest habitat available. The entire length of the original channel was 289 m, with an approximate average width of about 13m. About 95% of its bank was densely vegetated with riparian growth of willows, grasses, mule fat, Tamarisk and Arundo. Table 16. Fish species found in original channel, totals for all days. Species Species Status Total Number Counted Santa Ana sucker Native, Federal Threatened
Species 456
arroyo chub Native, State Species of Special Concern
1569
black bullhead Non-native common fathead minnow Non-native present large mouth bass Non-native few mosquito fish Non-native common tilapia Non-native very numerous Table 17. Length and weight of a sample of the Santa Ana suckers captured November 19, 2003 in original channel. Standard L ength (mm) Weight (gms)
50 2.6 54 55 3.8 57 4.5 57 3.2 58 3.2 60 5.5 60 3.2 60 3.6 62 62 5.1 63 5.5 64 64 7.0

Year 2 Implementation of the Santa Ana Sucker Conservation Plan
Page 43 San Marino Environmental Associates
65 4.9 65 5.5 66 6.1 66 5.7 66 4.6 66 5.3 66 6.7 67 67 68 68 68 5.9 68 5.8 68 5.5 69 6.6 70 6.4 70 8.1 70 6.3 70 4.8 72 7.6 72 6.4 72 7.4 72 6.1 72 7.3 72 5.8 73 74 7.7 74 6.1 75 10.0 75 6.3 75 6.8 75 7.1 75 6.4 76 8.7 76 8.6 77 77 8.5 77 8.1 78 78 78 8.7 78 8.3 78 8.1 80 80

Year 2 Implementation of the Santa Ana Sucker Conservation Plan
Page 44 San Marino Environmental Associates
80 9.9 80 8.6 80 11.2 80 9.1 80 9.7 80 9.9 81 8.5 81 9.0 82 11.4 82 10.6 83 83 10.7 83 11.3 83 12.4 83 10.8 84 11.0 84 11.0 85 85 11.2 85 11.1 85 11.6 85 12.7 85 9.4 87 87 13.0 87 7.4 88 88 11.2 89 11.8 94 95 19.0 99 14.4 104 17.4 105 120 30.0 120 28.0 125 125 125 39.5 130 36.0 130 36.5 135 38.0 137 43.2 140 42.5 145

Year 2 Implementation of the Santa Ana Sucker Conservation Plan
Page 45 San Marino Environmental Associates
145 52.0 152 58.3
As part of the mitigation for the channel diversion, RCFC placed two sets of boulders into the new channel. On 23 November, SMEA found 10 suckers in the newly created channel. Two individuals were large enough to tag. The length/weight data for these fishes are presented in Table 16. All ten suckers were captured at the boulders. Table 18. Length and weight of a sample of the Santa Ana suckers captured 23 November 2003 in original channel. Standard Length (mm) Weight (gms) Tag Number
116 30.4 4265550C1A118 29.9 42634F1F04 82 9.0 85 11.0 78 9.1 69 7.3 85 9.5 88 12.0 77 8.0 74 7.2
E. Migration/Movement. Four fish were recaptured during 2001 during the attempted mark-recapture procedure. All four fish had been tagged at Site 2 upstream of Highway 60. One was captured where tagged, one was captured at Site 1, and two were captured 100-150 meters downstream of Highway 60. This information is summarized in Table 17. Table 19. Data on locations of recaptured fish.
Tag Number
Tagging Location
Date of Tagging
Recapture Location Date of Recapture
4264761B69 Site 2 16 June Site 2 18 June 42645F1761 Site 2 16 June Site 1 18 June 42647B200A Site 2 16 June Downstream of Highway 60 18 June 4261660E7A Site 2 16 June Downstream of Highway 60 18 June During the 2002 sequential depletion work at the three 100-meter sites, four fish were recaptured that had been tagged in 2001. Four recaptures is a good return, remembering that recaptures of free-ranging animals typically have a very low return. The following table provides information on the recaptured fish.

Year 2 Implementation of the Santa Ana Sucker Conservation Plan
Page 46 San Marino Environmental Associates
Table 20. Location of initial tagging and recapture for the four Santa Ana suckers recaptured in 2002.
Recaptured Suckers Tagged 2001 Recaptured 2002 Pit Tag Numbers Tagging Location Recapture Location
42655E0062 Site 1 – Mission Blvd Site 1 – Mission Blvd 42645F4F20 Site 1 – Mission Blvd Site 1 – Mission Blvd 4263245D1B Site 1 – Mission Blvd Site 1 – Mission Blvd 4261600774 Site 1 – Mission Blvd Site 1 – Mission Blvd
It is interesting that all four fish were tagged and recaptured at the same site. This raises two possibilities which will need to be addressed in future field work:
1. The fish are relatively sessile and show a degree of site fidelity. 2. The fish return to specific sites for reproduction or post-reproductive holding
habitat. Only future recapture data will allow these questions to be answered. During November 2003 an attempt to locate previously tagged fish was made by collecting fish upstream and downstream of Highway 60 and upstream of Riverside Avenue. One fish captured downstream of Riverside was a recapture: Pit tag # 4263126704 was originally tagged on 28 July 2003 at sequential depletion site 3 just downstream from Riverside Avenue and was recaptured just downstream of Highway 60. Additional fish were tagged during this field activity. The length/weight data and tag numbers (for the tagged fish) are presented in the tables below. Table 21. Length and weight of a sample of the Santa Ana suckers captured 23 November 2003 downstream of Highway 60. Standard Length (mm) Weight (gms) Tag Number
127 35.3 4265560C69 121 33.0 4264783962 111 23.9 42655A0828 67 4.4 85 11.8 73 6.6 81 10.8 87 13.0 60 4.2 64 4.1 58 3.6 74 6.5 70 5.7 119 29.0 4263480B1F 114 24.2 4265710D22 123 34.3 426566350A
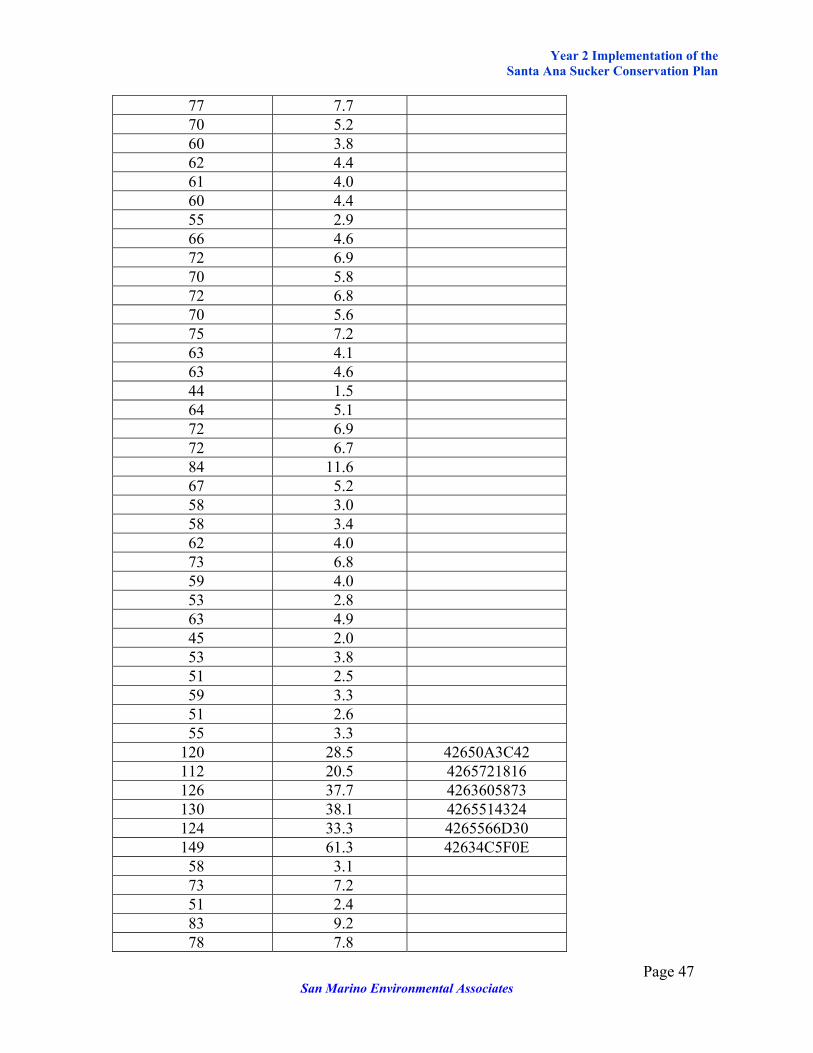
Year 2 Implementation of the Santa Ana Sucker Conservation Plan
Page 47 San Marino Environmental Associates
77 7.7 70 5.2 60 3.8 62 4.4 61 4.0 60 4.4 55 2.9 66 4.6 72 6.9 70 5.8 72 6.8 70 5.6 75 7.2 63 4.1 63 4.6 44 1.5 64 5.1 72 6.9 72 6.7 84 11.6 67 5.2 58 3.0 58 3.4 62 4.0 73 6.8 59 4.0 53 2.8 63 4.9 45 2.0 53 3.8 51 2.5 59 3.3 51 2.6 55 3.3 120 28.5 42650A3C42 112 20.5 4265721816 126 37.7 4263605873 130 38.1 4265514324 124 33.3 4265566D30 149 61.3 42634C5F0E 58 3.1 73 7.2 51 2.4 83 9.2 78 7.8

Year 2 Implementation of the Santa Ana Sucker Conservation Plan
Page 48 San Marino Environmental Associates
63 4.9 47 2.0 65 5.2 53 3.1 54 3.0 55 3.1 62 3.8 88 11.1 57 3.4 56 3.4 48 2.6 70 5.9 68 5.4 67 5.1
170 69.1 4263126704 Recapture
131 40.6 4263330D0F 124 35.5 4266073161 127 32.9 4266012263 119 28.8 42655B7E16 134 43.1 42654F5E75 117 30.1 42657A4965 132 39.7 426347401F 109 20.9 4264761735
Table 22. Length and weight of a sample of the Santa Ana suckers captured 23 November 2003 upstream of Highway 60. Standard Length (mm) Weight (gms) Tag Number
118 29.2 4266033E26 61 4.1 61 4.0 69 5.5 66 4.6 66 4.7
Table 23. Length and weight of a sample of the Santa Ana suckers captured 23 November 2003 upstream of Riverside Avenue (upstream of RCFC diversion). See Table 16 for the fishes captured in the diversion channel. Standard Length (mm) Weight (gms) Tag Number
116 27.5 4265627039 132 44.6 42646F1017 126 31.0 4265682152 126 29.6 4263442D69

Year 2 Implementation of the Santa Ana Sucker Conservation Plan
Page 49 San Marino Environmental Associates
100 16.2 4263133139 130 40.8 4263291C0E 93 15.2 42654E5E61 80 10.3 82 9.5 92 13.4 91 13.3 82 9.2 80 9.5 79 8.5 90 12.5 78 8.7 70 5.3 80 9.1 86 10.5 70 5.5 82 11.0 88 12.3 76 7.4 60 4.7 67 4.8 64 5.3 68 3.6 128 37.1 4266010E3C 120 31.9 42645B164E 99 18.0 426465781B
F. Growth. The recapture data presented above also provided an opportunity to evaluate growth in the Santa Ana sucker. Table 16 below presents the length-weight data for the four recaptured suckers at the time of tagging and at their recapture one year later. Table 24. Length/weight data from the four Santa Ana suckers recaptured in 2002. Length is standard length in millimeters and weight is in grams. Recaptured Suckers 2001 2002 Change
Pit Tag Number Length Weight Length Weight Length Weight 42655E0062 119 29.3 147 53.5 28 24.2 42645F4F20 116 27.9 155 62.6 39 34.7 4263245D1B 132 39.2 161 65.5 29 26.3 4261600774 105 23.8 145 44.7 40 20.9
(AVERAGE) 34 26.5

Year 2 Implementation of the Santa Ana Sucker Conservation Plan
Page 50 San Marino Environmental Associates
G. Population Structure. In order to evaluate the population structure of the Santa Ana sucker in the Santa Ana River it is necessary to know the sizes of the various year classes. These data are particularly important, because Saiki (2000) interpreted his data to suggest that in the Santa Ana River, the Santa Ana sucker lives only two years and therefore has only one reproductive year. This is important because in the San Gabriel River and the Santa Clara River the sucker appears to be longer lived. Greenfield et al. (1970) and Sasaki and Drake (1987) provided date on the approximate size ranges of the various year classes in the Santa Clara River and the San Gabriel River respectively. Saiki’s (2000) data can also be used to estimate size classes of suckers in the Santa Ana River. These data are presented in Table 17. Table 25. Estimated lengths (SL mm) of the various age classes in the Santa Clara River, San Gabriel River and Santa Ana River.
Age Class Santa Clara River San Gabriel River Santa Ana River 0+ 0-51 0-70 0-80 1+ 52-77 71-130 81-120 2+ 77-140 131-160 121+ 3+ 140+ 161-185 4+ 186+
SMEA examined five years of length data from the West Fork of the San Gabriel River. Based on these data the oldest year class ranged from 2+ to 4+ depending on the year, and the strength of the year classes varied considerably. SMEA collected two large samples of suckers during 2001. These were collected on 16 June as part of the tagging activities. The size-frequency histograms for these two samples are shown below. Examination of the Site 2 graph (Figure 4) clearly shows at least three year classes, while the Site 1 histogram (Figure 3) may show one dominant year class with a few individuals from an older year class. A size-frequency histogram for a sample of Santa Ana suckers from the San Gabriel River (Figure 5) clearly shows more year classes. Samples over a period of years will be necessary to determine if Santa Ana sucker die after only one breeding season in the Santa Ana River. If this is the case, it must strongly influence the population dynamics.

Year 2 Implementation of the Santa Ana Sucker Conservation Plan
Page 51 San Marino Environmental Associates
Figure 3. Figure 4.
Santa Ana River upstream of Mission Blvd.,Population Estimate Site 1, 15 June 2001, n=88
0
5
10
15
20
0 20 40 60 80 100 120 140 160 180 200
Standard Length in mm
Num
ber
of F
ish
Santa Ana River upstream of Highway 60,Population Estimate Site 2, 15 June 2001, n=175
0
5
10
15
20
0 20 40 60 80 100 120 140 160 180 200
Standard Length in mm
Num
ber
of F
ish

Year 2 Implementation of the Santa Ana Sucker Conservation Plan
Page 52 San Marino Environmental Associates
Figure 5. An examination of the size (standard length) data presented in Tables 4-6 compared to the data presented in Appendix 1 demonstrates an obvious difference in the population structure. In 2001 the population was dominated by adults, fish greater than about 80mm SL, while in 2002 the population is dominated by younger, smaller fish less than 80 mm SL. Table 17 summarizes the differences which are displayed graphically following the table. Table 26. Comparison of population structure data from 2001 and 2002. For simplicity, suckers less than 80 mm SL are designated as YOY and those greater than 80 mm SL are designated as adult.
SUCKERS CAPTURED IN THE THREE 100-METER SECTIONS 2001 2002 Location
Adult YOY Adult YOY Site 1 - Mission Bridge 88 0 49 71 Site 2 – Hwy 60 Bridge 136 8 31 120 Site 3 - Riverside Dr Bridge 9 4 11 34
Totals 233 12 91 225 Year Totals 245 316
Percent of Population 95.10% 4.90% 28.80% 71.20% Expressed a different way, this means that the population of adult reproductive suckers in 2001 was 6,257-6,621 individuals, while the adult sucker population in 2002 was 2,379-2,952 individuals. The following four figures show the differences graphically. The differences at so extreme that no statistical analysis is required to recognize that there is a significant difference
San Gabriel River, North Fork,10 November 2000, n=113
0
5
10
15
20
0 20 40 60 80 100 120 140 160 180 200
Standard Length in mm
Num
ber
of F
ish

Year 2 Implementation of the Santa Ana Sucker Conservation Plan
Page 53 San Marino Environmental Associates
Figure 6. Histogram showing the standard length (SL) of all suckers captured during electroshocking in 2001.
Figure 7. Histogram showing the standard length (SL) of all suckers captured during electroshocking in 2002.

Year 2 Implementation of the Santa Ana Sucker Conservation Plan
Page 54 San Marino Environmental Associates
Figure 8. Box and whisker graph comparing the lengths of fish captured in 2001 and 2002.
Figure 9. A comparison of the number of young-of-the-year (YOY) and adult Santa Ana suckers at each of the electroshocking sites in 2001, 2002 and 2003.
0
20
40
60
80
100
120
140
160
Site 12001
Site 12002
Site 12003
Site 22001
Site 22002
Site 22003
Site 32001
Site 32002
Site 32003
Study Site/Year
Num
ber o
f Fis
h
YOY
Adult
Figure 9 shows the dramatic shift in the population structure the sucker population. In 2001, the population was dominated by large fish, while in 2002 the population is dominated by small fish. While it is difficult to determine the meaning of this shift, several anecdotal observations apply. In 2001 SMEA observed relatively small numbers of fry, which is reflected in the low number of small fish captured during population sampling. In 2002 there were a large number of fry that were very widespread in the river, this observation is reflected in the strength of year class found when electroshocking. Presumeably, the small

Year 2 Implementation of the Santa Ana Sucker Conservation Plan
Page 55 San Marino Environmental Associates
number of fry in 2001 partially accounts for the lower number of adults in 2002. If that is true and recruitment remains constant, then the large number of juveniles in 2002 should have produced a large adult population in 2003. This was not the case. In fact, the 2003 populations decreased in size. However the relative percentages of adults and juveniles are similar in 2002 and 2003 (Figure 10). Thus the population structure was similar in 2002 and 2003. Figure 10. A comparison of the relative population percentages in 2001, 2002 and 2003.
0
20
40
60
80
100
Perc
enta
ge o
f Po
pula
tion
2001 2002 2003Year
JuvenileAdult
VI. REPRODUCTION. A. Introduction. Reproductive surveillance and studies took place in three tributaries: Rialto Drain, Evans Lake Drain, and Sunnyslope Creek (see Photos 16-18). Surveillance was also conducted in the mainstem, but because of the clarity of water in the tributaries, most work focused in these areas. SMEA determined the timing of appearance of the larvae, made observations on spawning, measured characteristics of the spawning habitat, made observations on larval habitat use, and noted the disappearance of the larval stage.

Year 2 Implementation of the Santa Ana Sucker Conservation Plan
Page 56 San Marino Environmental Associates
Photo 17. Sunnyslope Creek.

Year 2 Implementation of the Santa Ana Sucker Conservation Plan
Page 57 San Marino Environmental Associates
Photo 18. Rialto Drain
Photo 19. Evans Lake Drain

Year 2 Implementation of the Santa Ana Sucker Conservation Plan
Page 58 San Marino Environmental Associates
B. Tuberculation Surveillance. As a mode of tracking reproductive readiness, SMEA periodically captured a sample of Santa Ana suckers and checked the frequency of tuberculate individuals and the degree of tuberculation. Photo 19 shows the tuberculate anal fin of a sucker captured in Rialto Drain.
Photo 20. Tuberculation is visible on the anal fin of this sucker.
Tables 27-33 show the data collected during the reproductive surveillance monitoring the degree and frequency of tuberculation in Santa Ana suckers. For simplicity only four degrees of tuberculation were recognized: (1) No tuberculation, (2) Incipient tuberculation when tubercles were beginning to develop, (3) Moderately well developed tuberculation when tubercles were obvious but not fully developed, and (4) Well develope tuberculation when the tubercles were fully developed. In addition to the data presented in the following tables a sample of 24 suckers was captured at Mission Boulevard on 17 December 2000. None of these fish showed any tuberculation.

Year 2 Implementation of the Santa Ana Sucker Conservation Plan
Page 59 San Marino Environmental Associates
Table 27. Length, weight and tuberculation data collected just downstream of Mission Boulevard on 7 January 2001. In the following table, SL = standard length; WT = total weight; and WF = fish weight. Length (mm SL) Tare
(g) WT (g) WF (g) Tuberculation
109 31 50 19 Incipient tuberculation 117 29 57 28 None 118 29 54.5 25.5 None 108 28 46.5 18.5 None 108 27 49 22 None 102 27 46 19 Incipient tuberculation 103 27.5 45.5 18 None 83 25 34.5 9.5 None 103 23.5 42.0 18.5 None 100 23.5 41.5 18 None 100 23 41.5 18.5 None 102 24 42.5 18.5 None 106 23.5 45.5 22 None 82 24.5 35 10.5 None 102 23.5 41 17.5 None 98 23 38 15 None 91 23.5 36 12.5 None 90 23 37.5 14.5 None 101 23.5 42.5 19 None 101 23.5 42 18.5 None 97 23 37.5 14.5 None 107 23 46 23 Incipient tuberculation 100 22 40.5 18.5 None 86 22 37 15 None 99 20 38 18 None Table 28. Length, weight and tuberculation data collected at the Interstate-5 bridge over the Santa Clara River on 15 January 2001. In the following table, SL = standard length; WT = total weight; and WF = fish weight. Length (mm SL) Tare WeightT WeightF Tuberculation 82 42 51.5 9.5 None 71 40 46 6 None 75 40 45.5 5.5 None 57 39 42 3 None 59 38 42 4 None 69 38 43 5 None 62 37 41 4 None 59 37 40.5 3.5 None

Year 2 Implementation of the Santa Ana Sucker Conservation Plan
Page 60 San Marino Environmental Associates
89 36 47 11 Incipient tuberculation 82 35 43.5 8.5 None 77 34.5 43.5 11 None 75 33.5 40 6.5 None 65 33 38 5 None 65 32.5 37 4.5 None 55 31 34.5 3.5 None 62 30.5 35 4.5 None 63 30.5 34 3.5 None 63 30 34.5 4.5 None 69 29.5 35 5.5 None 52 29 32 3 None 52 28.5 31 2.5 None 72 28.5 35 6.5 None 56 28.5 31 2.5 None 58 27 30.5 3.5 None 61 24 28 4 None 47 24 25.5 1.5 None Table 29. Length, weight and tuberculation data collected in Rialto Drain on 21 January 2001. In the following table, SL = standard length; WT = total weight; and WF = fish weight. Length (mm SL)
Tare (g)
WT (g)
WF (g)
Tuberculation
110 60 79 19 Incipient tubercles 108 52 69 17 Moderately well developed
tubercles 117 44.5 71 26.5 None 106 41.5 63.5 22 Moderately well developed
tubercles 137 40 91.5 51.5 None 69 38 43.5 5.5 None 114 38 61.5 23.5 Well developed tubercles 110 36 58.5 22.5 None 92 34 45.5 11.5 None 121 33 63.5 30.5 Well developed tubercles 116 32.5 61.5 29 Well developed tubercles 95 31.5 47.5 16 None

Year 2 Implementation of the Santa Ana Sucker Conservation Plan
Page 61 San Marino Environmental Associates
Table 30. Length, weight and tuberculation data collected in Sunnyslope Creek on 17 February 2001. In the following table, SL = standard length and WF = fish weight. Length (mm SL) WF (g) Tuberculation
110 23.5 None 86 11.1 None 88 12.2 Moderately well developed tubercles 104 20.6 None 105 19.6 None 90 14.5 None 117 22.4 None 87 10.6 None 98 18.5 Moderately well developed tubercles 95 15.7 Incipient tubercles 98 11.5 None 117 24.0 None
Table 31. Length, weight and tuberculation data collected at Mission Boulevard on 17 February 2001. In the following table, SL = standard length and WF = fish weight. Length (mm SL) WF (g) Tuberculation
95 16.0 Moderately well developed tubercles 97 14.0 Incipient tubercles 100 14.7 None 108 18.4 Well developed tubercles 94 13.1 Moderately well developed tubercles 83 9.2 Moderately well developed tubercles 118 19.0 Well developed tubercles 85 9.2 None 76 6.9 None 92 12.6 Incipient tubercles 75 6.0 None 97 14.7 None 84 8.8 None 90 11.0 None 65 4.9 None 85 8.9 None 75 7.4 None 79 8.6 None

Year 2 Implementation of the Santa Ana Sucker Conservation Plan
Page 62 San Marino Environmental Associates
Table 32. Length, weight and tuberculation data collected at Rialto Drain on 17 February 2001. In the following table, SL = standard length and WF = fish weight. Length (mm SL) WF (g) Tuberculation
108 18.3 Moderately well developed tubercles 116 20.5 Well developed tubercles 115 18.8 Well developed tubercles 111 22.7 Well developed tubercles 110 17.6 Moderately well developed tubercles
A definite trend of increasing tuberculation can be seen in these data, beginning in December 2000 when none of the fish captured showed any tuberculation through 17 February 2001 when tuberculation was significantly more common. This trend is summarized in Table 25 below. Table 33. Frequency of tuberculate fish, at various localities, December 2000 – February 2001. None = No tubercles, Incip = Incipient tubercles, Moderate = Moderately well developed tubercles, Well = Well developed tubercles, and N = sample size
Date Locality None Incip Moderate Well N 17 Dec 00 Mission Blvd 24 0 0 0 24 7 Jan 01 Mission Blvd 22 3 0 0 25 21 Jan 01 Rialto Drain 6 1 2 3 12 17 Feb 01 Sunnyslope Cr 9 1 2 0 12 17 Feb 01 Mission Blvd 11 2 3 2 18 17 Feb 01 Rialto Drain 0 0 2 3 5 The data show a general increase in the degree of tuberculation of the suckers examined. However, between late January and mid February there is little change. Because the fish become tuberculate as they prepare for reproduction, the degree of tuberculation assisted us in tracking the general readiness for reproduction. C. Observations of Reproduction. Considerable field time was spent trying to observe reproduction so that the actual characteristics of reproductive sites could be measured rather than relying on a general description of a stream reach where larvae were found. On 31 March 2001, Haglund observed spawning in Rialto Drain in the pool at the very top of the drain where the water enters the “natural” channel (see Photo 21). The fish were spawning over a gravel bar that had developed near the pool tail. A large sucker (assumed to be a female) took up a position on the gravel bar, from the deeper water adjacent to the bar 1-3 smaller suckers (assumed males) would swim up to the female. All fish were facing upstream. The smaller fish would brush against the female (quiver), then all fish would swim away, however the larger individual returned almost immediately and resumed its (her) position on the gravel bar. This process was repeated three times while Haglund watched. The observations were made using a viewing tube and the water was clear over the gravel bar but there was no visibility into the adjacent deeper water.

Year 2 Implementation of the Santa Ana Sucker Conservation Plan
Page 63 San Marino Environmental Associates
Water over the gravel bar was 49-53 cm deep, and the deep adjacent water was in excess of one meter (no accurate measurement could be obtained). Substrate was a medium gravel. Flow over the spawning area was about 0.20 m/sec. Fry first appeared in Rialto Drain on 7 April. Baskin and an SMEA field technician also observed spawning in Sunnyslope Creek (see Photo 20). The observations were made on 15 April 2001. The creek was 2.2 meters wide at the spawning site. The substrate was mixed fine/medium gravel with coarse sand. Spawning took place over the gravel at a depth of 51-60 cm. Flow over the gravel was 0.77 ft/sec (0.24 m/sec). One edge of the stream was deeper and had an undercut bank with exposed willow roots. The fish moved from the deeper area up onto the gravel then returned to the deeper water.
Photo 21. Sunnyslope Creek, where spawning was observed on 15 April 2001.

Year 2 Implementation of the Santa Ana Sucker Conservation Plan
Page 64 San Marino Environmental Associates
Photo 22 . Rialto Drain, where spawning was observed on 31 March 2001. Based on these two observations it appears that the suckers prefer deeper water adjacent to spawning gravel. The spawning gravel in both cases was approximately 0.5 meter deep and the flows were similar (0.20 and 0.24 m/sec). The substrate in both cases was dominated by medium gravel, modal size 0.5 to 1.6 cm. Typical spawning of suckers is illustrated by the longnose sucker, Catostomus catostomus, a widespread species found east of the Rocky Mountains. Stream spawning by longnose suckers was reported at depths of 15-30 cm. in a current of 30-45 cm/sec. over gravel substrate of 0.5 to 10 cm. diameter (Geen et al. 1966). Our observations of spawning of C. santaanae in the Santa Ana river study area are consistent with this data. D. Analysis of Spawning Gravels A sample of gravel was collected from each of the two spawning sites and analyzed for particle size. The histograms for particle size are shown below (Figures 10 and 11) along with their cumulative percent curves (Figure 12). The graphs clearly show the dominance of the gravel sized particles and the presence of some sand. Sand ranges from 0.0625 mm to 1.00 mm in diameter, while gravel ranges from 1.00 mm to 64 mm in diameter. No significant amount of silt was present, nor were large particles present at either site. These data will be used when “artificial” spawning areas are established

Year 2 Implementation of the Santa Ana Sucker Conservation Plan
Page 65 San Marino Environmental Associates
Figure 10. Histogram showing sediment size composition at an observed spawning site in Rialto drain.
Figure 11. Histogram showing sediment size composition at an observed spawning site in Sunnyslope Creek.
Santa Ana River Spawning Substrate
01020304050
00.0
63 1 2 2.8 45.1
5 16 24.5
41.5
Mesh size in mm
Perc
ent o
f Sub
stra
te
Rialto Drain
Santa Ana River Spawning Substrate
01020304050
00.0
63 1 2 2.8 45.1
5 16 24.5
41.5
Mesh size in mm
Perc
ent o
f Su
bstr
ate
Sunnyslope Drain

Year 2 Implementation of the Santa Ana Sucker Conservation Plan
Page 66 San Marino Environmental Associates
Figure 12. Cumulative percent curves for sediment composition at the two observed spawning sites.
Santa Ana River Spawning Substrate
0
20
40
60
80
100
120
00.0
63 1 2 2.8 45.1
5 16 24.5
41.5
Mesh size in mm
Cum
ulat
ive
Perc
ent o
f Sub
stra
te
Rialto Drain Sunnyslope Drain

Year 2 Implementation of the Santa Ana Sucker Conservation Plan
Page 67 San Marino Environmental Associates
E. Observations on Larvae. As described above, larvae appeared in Sunnyslope Creek on 31 March, Rialto Drain on 7 April. However, larvae were not detected in the mainstem at Mission Boulevard until 29 April, which raises the possibility that the larvae found in the mainstem had drifted out of the tributaries. Larval drift is a common feature of the life history of riverine suckers (Kennedy and Vinyard 1997). Because of the abundance of the larvae, the access, and the ease of viewing, most observations of larvae were made in Sunnyslope Creek. Observations were made from the appearance of larvae on 31 March through mid-May when the larvae disappeared. Larvae were almost always associated with specific habitat characteristics. Flow is low and consequently the bottom substrate is usually silt. Fry are most commonly found in shallow water 5-10 cm deep. They may or may not be associated with emergent vegetation or algae. However, in Rialto Drain they were frequently associated with small pockets of shallow water associated with an algal mat. These habitat characteristics apply to Sunnyslope Creek, Rialto Drain and the mainstem (see Photo 22).
Photo 23. Larval habitat in Sunnyslope Creek.

Year 2 Implementation of the Santa Ana Sucker Conservation Plan
Page 68 San Marino Environmental Associates
As part of the larval investigations SMEA devised a method of reliably recognizing larval suckers based on fin position, post anal distance and distribution of melanophores. This allows capture of larvae, and their identification in a petri dish without any larval mortality. All SMEA personnel were trained in larval identification. This technique will prove beneficial for more detailed larval studies next year. The following three photographs show the development of larval Santa Ana suckers from just post-gravel emergence (6 mm total length (TL)) until they transform and settle to the substrate (15 mm TL).
Photo 24. Santa Ana sucker fry at 6 mm TL from Rialto Drain.

Year 2 Implementation of the Santa Ana Sucker Conservation Plan
Page 69 San Marino Environmental Associates
Photo 25. Santa Ana sucker fry at 10mm TL from Rialto Drain.

Year 2 Implementation of the Santa Ana Sucker Conservation Plan
Page 70 San Marino Environmental Associates
Photo 26. Santa Ana sucker fry at 15mm TL from Evans Lake Drain.
In order to study the fry it is important to be able to identify sucker fry. Three cyprinid fishes potentially reproduce at a similar time and are found sympatrically with the sucker in the Santa Ana River. The arroyo chub is native to the drainage, but the other two cyprinids, the fathead minnow and the carp, are exotics. Although other fishes such as mosquitofish, bullheads and cichlids are present; their larvae are easily distinguished from the sucker larvae. The following three composite photographs illustrate the key characteristics allowing the identification of sucker larvae.

Year 2 Implementation of the Santa Ana Sucker Conservation Plan
Page 71 San Marino Environmental Associates
Photo 27. (following page)
Lateral View of Fry Santa Ana Sucker Larvae are elongate, and later developed specimens show the presence of a sub-terminal mouth (white arrow). Larvae have a row of melanophores that extends forward from the caudal base about three quarters or more of the body along the lateral line (black arrow). Sucker larvae lack a distinct caudal spot at the caudal base but have melanophores extending to the end of the caudal rays. The dorsal fin base has a row of melanophores on each side. Arroyo Chub Larvae have a row of melanophores that extends forward from the caudal base about three quarters or more of the body along the lateral line (black arrow). Chubs have a large caudal spot with multiple rows of melanophores (white arrow). Larvae have a fairly dark dorsal fin base. Carp Carp larvae have a vertical bar (arrow) of melanophores at the base of the caudal fin bounded posteriorly by a depigmented area. Fathead Minnow Larvae lack the pigments and have a single lateral pigment line (arrow) on the posterior half of the body. Fathead larvae have a small caudal spot made of a few melanophores.

Year 2 Implementation of the Santa Ana Sucker Conservation Plan
Page 72 San Marino Environmental Associates

Year 2 Implementation of the Santa Ana Sucker Conservation Plan
Page 73 San Marino Environmental Associates
Photo 28. (following page)
Lateral View of Fry – Anal Fin Sucker larvae can be distinguished by the position of the anal fin, where the distance from anal fin origin to tip of snout, is 66% of the total length or greater. A. Santa Ana Sucker Total Length = 11 mm Anal Distance = 8.5 mm Anal Distance/ Total Length X 100% = 77.3% B. Arroyo Chub Total Length = 15 mm Anal distance = 9.25 mm Anal distance/Total length X 100% = 61.7% C. Carp Total Length = 15.0 mm Anal distance = 8.5 mm Anal distance = 56.7%

Year 2 Implementation of the Santa Ana Sucker Conservation Plan
Page 74 San Marino Environmental Associates

Year 2 Implementation of the Santa Ana Sucker Conservation Plan
Page 75 San Marino Environmental Associates
Photo 29. (following page)
Dorsal View of Fry
Santa Ana Sucker Larvae are very dark with a large number of melanophores found dorsally and laterally. Larvae, up to 15 mm SL, have two separate distinct rows (black arrows) of melanophores on either side of the mid dorsal ridge. Arroyo Chub Larvae are dark with a large number of melanophores found dorsally and laterally. Larvae have a sharp dark single line of melanophores (arrow) extending from the occipital patch. Carp Larvae are robust with thickened bodies, paler, and have a uniform dusting of melanophores on the dorsal and lateral side. Fathead Minnow Larvae are slender and attenuated in body and have paler melanophores dorsally and laterally.

Year 2 Implementation of the Santa Ana Sucker Conservation Plan
Page 76 San Marino Environmental Associates

Year 2 Implementation of the Santa Ana Sucker Conservation Plan
Page 77 San Marino Environmental Associates
Figure 13. This is a diagrammatic representation of an idealized cross-section of the Santa Ana River showing habitat utilization by the Santa Ana sucker.
VII. Habitat Preferences of Various Sucker Life Stages. The following figures show examples of the typical microhabitats shown in the idealized cross-sectional diagram (Figure 13) Photo 30 shows an undercut bank with vegetation adjacent to deep flowing water in Sunnyslope Creek. Within a few meters upstream there is a shallow area of typical spawning gravel. Several ripe adults were found in this spot in February of 2001. Photo 31 shows the fry habitat along the left edge of the stream adjacent to the vegetation. Depths here where the fry were found were about 10cm. with undetectable flow. No fry were found on the right edge of the stream at the same time. This is consistent with our hypothesis that the fry tend to be found at places with maximum sun exposure in the afternoon when water temperatures tend to be higher.

Year 2 Implementation of the Santa Ana Sucker Conservation Plan
Page 78 San Marino Environmental Associates
Photo 30. Adult sucker habitat, Sunnyslope creek, February 2001. Arrows indicate deep area of undercut bank.
Photo 31. Sunnyslope Creek. White arrows indicate areas where fry were found.

Year 2 Implementation of the Santa Ana Sucker Conservation Plan
Page 79 San Marino Environmental Associates
Photo 32 shows the precise places where sucker fry where found on May 11, 2002. This was a year without significant flushing flows and fry appeared to be much more numerous throughout the season than in 2001, when more high flow events occurred. The sticks in the water in the foreground (black arrows) and background indicate the precise location of fry. Fry were found also in the shallow water in the right foreground (white lines) where a set of measurements was taken of depth and distance from the edge at regular intervals, noting the presence or absence of fry at each spot. The depths where fry were found here range from about 3 to 10 cm. None were found at shallower depths and very few deeper (maximum fry depth here was 12cm.).The range of depths in the area measured was 0 to 25cm.
Photo 32. Fry habitat, SAR mouth of Sunnyslope Creek, May 2002. Note also the open sun exposure at this locality. Fry tend to be found on the downstream side of flow obstructions such as vegetation (see Photo 33) and sand bars such as this one where flow is reduced. Note dark silt material on the sandy substrate. This silt material tends to settle out of the water where the water flow rate is reduced, and the darkly pigmented fry match well with this background. We have not been able to test if the fry are picking out the shallow depth, the lack of flow, the dark silt on the substrate, or a combination of these factors.

Year 2 Implementation of the Santa Ana Sucker Conservation Plan
Page 80 San Marino Environmental Associates
Photo 33. Fry habitat, SAR at mouth of Sunnyslope Creek, May 2002 All of the fry found here were over the dark silt material. Photo 34 shows a close up view of the fry in the foreground of Photo 33. The depth at these spots was about 5cm. Note the rippled appearance of the water surface and the strands of green algae, indicating that the position of fry is adjacent to slowly flowing water that could bring plankton food items within reach of the fry without subjecting them to the continuous impact of flowing water. Fry appeared to be usually above the bottom, about midway up the water column.

Year 2 Implementation of the Santa Ana Sucker Conservation Plan
Page 81 San Marino Environmental Associates
Photo 34. Close up view of sucker fry at position of sticks from foreground of Photo 35, SAR at mouth of Sunnyslope Creek, May 2002. In this small patch of stream (205 cm wide by 365 cm along stream flow), sucker fry were found in depths of 5-10 cm primarily on a small shelf between the shore and the deeper water. This is shown graphically in Figure 14.

Year 2 Implementation of the Santa Ana Sucker Conservation Plan
Page 82 San Marino Environmental Associates
Figure 14. The left graph below is a map of the river depths; the graph on the right is the same except that the orange area represents the general area in which sucker fry were found. In this sample, it is clear that fry are not dispersed randomly, but are clustered in a specific area.

Year 2 Implementation of the Santa Ana Sucker Conservation Plan
Page 83 San Marino Environmental Associates
We also hypothesize that exposure to the sun in shallow water could also be a positive factor that the fry may be picking out. Photo 35 shows fry habitat at Mission Blvd Bridge in the afternoon. Note the sticks indicating the location of fry and the shadow of the bridge. Counts of fry in the shade and in the sun may suggest a greater concentration of fry in the sun than in the shade. There were 21 fry in 7.3meters of shaded stream edge (2.9 fry per meter) and 52 fry were found in 12.5 meters of sunny stream edge (4.2 fry/meter). The stream edge observed was judged to be approximately uniform with regard to other probable important factors for fry habitat and the amount fry habitat.
Photo 35. Sucker Fry habitat at Mission Blvd. Bridge, May 2002.

Year 2 Implementation of the Santa Ana Sucker Conservation Plan
Page 84 San Marino Environmental Associates
Figure 36. Juvenile sucker habitat, SAR at mouth of Sunnyslope Creek, May 2002. Pink streamer indicates position of fish at 13.5cm depth A. What We Know About Sucker Fry. The following is a summary of what we know or think we know about Santa Ana sucker fry in the Santa Ana River.
1. Breeding may begin as early as late January, perhaps in response to warm water periods.
2. Breeding may be mainly or even exclusively in side channels (e.g. Sunnyslope
Creek) early in the season because water here warms faster and there may be less chance of eggs/fry being washed out by high flow because rain events may not impact all channels as much as the mainstem.
3. Fry and probably eggs in gravel are eliminated by high flow events.
4. Breeding is in specific sites with spawning gravel of specific characteristics
adjacent to breeding adult holding habitat characterized by deep points in the

Year 2 Implementation of the Santa Ana Sucker Conservation Plan
Page 85 San Marino Environmental Associates
stream, at the edge of stream, or adjacent to some cover such as vegetation or undercut banks.
5. Eggs spend some number of days in gravel, hatch as yolk sack fry and stay in
gravel until at least 12mm SL; so, fry found that are much smaller are probably not suckers.
6. Fry initially appear at this size or larger at the edge of the stream, usually in very
shallow depth (3-10 cm), often over dark silt that matches their color where flow is negligible, and in the proximity of emergent vegetation.
7. Fry are often found along the edge of a sand bar or bank, just down stream from
vegetation that protrudes into the flowing water, producing areas of negligible flow where silt settles out on the bottom.
8. The position of fry is in the approximate middle of the water column, adjacent to
flowing water that may bring planktonic food items within reach. Actual feeding habits are not known.
9. Fry may take refuge in edge vegetation at night and/or during cloudy conditions
and times of increased flow.
10. Fry emerge from vegetation during sunny conditions and “bask” in the sun. Their dark color may serve multiple functions: crypsis, heat absorption, and UV protection.
11. Fry may selectively occupy shallow edgewater habitat that is exposed most
directly to the afternoon sun when water temperatures are highest. In our study area this is the north side of the stream or individual channel of the mainstem.
12. The deeper flowing water of any channel is probably a barrier for fry so they
cannot get across to bask on both sides.
13. Fry may drift at night (or other times) but we have not yet tested this. Other species of suckers are known to drift.
14. SAS newly transformed into juveniles are about the same standard length as the
largest fry, and are found in depths greater than 10cm. on the bottom over sandy substrate, often in small depressions in the bottom contours adjacent to the fry habitat.
VIII. Habitat Utilization by Adult and Juvenile Santa Ana Suckers. During the 2003 field season SMEA initiated the collection of data designed to determine habitat utilization/preferences of adult and juvenile Santa Ana Suckers in the Santa Ana River. It is anticipated that this dataset will be enhanced over the next 2 field seasons.

Year 2 Implementation of the Santa Ana Sucker Conservation Plan
Page 86 San Marino Environmental Associates
A. Methods. The habitat utilization study addresses the question of whether the fish are using the habitat in proportion to the availability of the habitat or whether they are over-utilizing some habitat. If they are over-utilizing some habitats, it suggests there is preferential use of those habitats, and thus these data can provide guidelines for enhancing sucker habitat. The current analysis is based on observations of 137 juvenile and 85 adult Santa Ana suckers. Habitat type availability was based on a visual examination of each stream reach. Substrate, depth and bottom velocity availability was gathered from cross-sectional data. Cross-sections were made every 10 meters in the study reaches, and data was collected every 0.5 meters across the stream. Consequently, total availability for depth, substrate and bottom velocity is based upon approximately 600 point measurements. Habitat utilization observations were made by crawling upstream using a viewing tube (Photo 37). A single observer was used in all cases. When fish were spotted, a color-coded marker was placed to indicate the location of the fish (Photo 38). The marker was a lead sinker with attached flagging material. The color of the flagging material indicated the species and the shape of the sinker indicated whether the individual was an adult, juvenile or fry. The observer zigzagged upstream while making observations, in order to minimize the possibility of observing fish that had recently been disturbed by prior observations. Haglund and Baskin had previously determined that this technique could be used to view fish without disturbing them. Thus, the locations observed were locations selected by undisturbed fish.
Once the observer had finished the stream reach, a data collection crew collected habitat data at the location of each marker. Substrate, habitat type, depth and flow data were taken at each marker.

Year 2 Implementation of the Santa Ana Sucker Conservation Plan
Page 87 San Marino Environmental Associates
Photo 37. An observer crawling upstream to locate fish during the collection of habitat
utilization data.
Photo 38. These two photographs show markers indicating the location of fish marked
during observation. The left photo shows a blue flag indicating an adult sucker, while the right photo shows a pink tag indicating a juvenile sucker.

Year 2 Implementation of the Santa Ana Sucker Conservation Plan
Page 88 San Marino Environmental Associates
B. Data Collected. The following table shows the dates and locations that observations were made, as well as, the number of fish observed (data points).
NUMBER OF FISH OBSERVED DATE LOCATION Juveniles Adults
11 August 2003 Upstream Mission Blvd. 54 28 16 August 2003 Upstream Highway 60 65 20 18 August 2003 Downstream Riverside Dr. 18 37
TOTAL 137 85 C. Habitat Availability. The following tables present the availability of habitat types, substrate, depth, and bottom velocity.
Habitat Type Availability
Individual Sites Surveyed
Availability as Percent of Total Habitat Type
Mission Blvd Highway 60 Riverside Dr
Total Availabilty All Sites Combined
Edgewater 10 15 10 11.7 Glide 4 12 3 6.3 Riffle 70 61 81 70.7 Run 15 10 5 10.0 Pool 1 2 1 1.3
Substrate Availability
Individual Sites Surveyed Availability as Percent of Total
Substrate Type
Mission Blvd Highway 60 Riverside Dr
Total Availabilty All Sites Combined
Silt 2.4 1.9 2.4 2.2 Silt/sand 7.2 4.5 15.9 7.7
Sand 68.3 76.0 22.2 62.6 Sand/gravel 19.2 13.6 48.4 22.5
Gravel 1.2 0.3 4.8 1.5 Sand/cobble 0.0 2.9 5.6 2.7
Gravel/cobble 0.0 0.6 0.8 0.5 Cobble 0.6 0.0 0.0 0.2 Boulder 1.2 0.0 0.0 0.3

Year 2 Implementation of the Santa Ana Sucker Conservation Plan
Page 89 San Marino Environmental Associates
Depth Availability
Individual Sites Surveyed Availability as Percent of Total
Depth (cm)
Mission Blvd Highway 60 Riverside Dr
Total Availabilty All Sites Combined
0-5 1.8 5.6 7.1 4.8 6-10 4.2 18.0 6.3 11.7 11-15 10.2 25.9 10.3 18.2 16-20 16.2 16.4 14.3 15.9 21-25 15.0 14.8 11.1 14.0 26-30 19.8 8.2 9.5 11.7 31-35 12.0 6.9 10.3 9.0 36-40 15.0 1.3 11.1 7.2 41-45 1.8 1.0 10.3 3.2 46-50 1.2 0.7 1.6 1.0 51-55 1.8 0.7 2.4 1.3 56-60 0.6 0.0 2.4 0.7 61-65 0.6 0.3 1.6 0.7 66-70 0.0 0.3 1.6 0.5
Bottom Velocity Availability
Individual Sites Surveyed Availability as Percent of Total
Bottom Velocity (fps)
Mission Blvd Highway 60 Riverside Dr
Total Availability All Sites Combined
0.00 – 0.50 15.1 17.2 26.6 18.6 0.51 – 1.00 16.9 20.8 16.9 18.9 1.01 – 1.50 18.7 27.9 27.4 25.3 1.51 – 2.00 24.1 19.2 20.2 20.7 2.01 – 2.50 18.7 14.0 6.5 13.7 2.51 – 3.00 6.6 1.0 2.4 2.8
D. Habitat Utilization. The following tables present the data on the habitat utilization of juvenile and adult Santa Ana suckers with respect to habitat type, substrate type, depth and bottom velocity.

Year 2 Implementation of the Santa Ana Sucker Conservation Plan
Page 90 San Marino Environmental Associates
Juvenile Sucker Habitat Type Utilization
Individual Sites Surveyed Utilization as Percent of Total
Habitat Type
Mission Blvd N=54
Highway 60N=65
Riverside DrN=18
Total Utilization All Sites Combined
N=137
Edgewater 42.6 0.0 0.0 16.8 Glide 22.2 0.0 0.0 8.8 Riffle 33.3 95.4 94.4 70.8 Run 1.9 4.6 5.6 3.6 Pool 0.0 0.0 0.0 0.0
Adult Sucker Habitat Type Utilization
Individual Sites Surveyed Utilization as Percent of Total
Habitat Type
Mission Blvd N=28
Highway 60N=20
Riverside DrN=37
Total Utilization All Sites Combined
N=85
Edgewater 0.0 0.0 0.0 0.0 Glide 0.0 0.0 0.0 0.0 Riffle 10.7 55.0 32.4 30.6 Run 89.3 10.0 40.5 49.4 Pool 0.0 35.0 27.0 20.0
Juvenile Sucker Substrate Type Utilization
Individual Sites Surveyed Utilization as Percent of Total
Substrate Type
Mission BlvdN=54
Highway 60N=65
Riverside DrN=18
Total Utilization All Sites Combined
N=137
Silt 0.0 0.0 0.0 0.0 Silt/sand 38.9 0.0 0.0 15.3
Sand 38.9 10.8 0.0 20.4 Sand/gravel 5.6 78.5 83.3 50.4
Gravel 0.0 0.0 16.7 2.2 Sand/cobble 0.0 0.0 0.0 0.0
Gravel/cobble 0.0 10.8 0.0 5.1 Cobble 0.0 0.0 0.0 0.0 Boulder 0.0 0.0 0.0 6.6

Year 2 Implementation of the Santa Ana Sucker Conservation Plan
Page 91 San Marino Environmental Associates
Adult Sucker Substrate Type Utilization
Individual Sites Surveyed Utilization as Percent of Total
Substrate Type
Mission BlvdN=28
Highway 60N=20
Riverside DrN=37
Total Utilization All Sites Combined
N=85
Silt 0.0 0.0 0.0 0.0 Silt/sand 0.0 0.0 0.0 0.0
Sand 35.7 40.0 0.0 21.2 Sand/gravel 35.7 25.0 54.1 41.2
Gravel 10.7 35.0 45.9 31.8 Sand/cobble 0.0 0.0 0.0 0.0
Gravel/cobble 0.0 0.0 0.0 0.0 Cobble 0.0 0.0 0.0 0.0 Boulder 17.9 0.0 0.0 5.9
Juvenile Sucker Depth Utilization
Individual Sites Surveyed Utilization as Percent of Total
Depth (cm)
Mission Blvd N=54
Highway 60N=65
Riverside DrN=18
Total Utilization All Sites Combined
N=137
0-5 0.0 0.0 0.0 0.0 6-10 0.0 0.0 0.0 0.0 11-15 0.0 0.0 22.2 2.9 16-20 9.3 9.2 33.3 12.4 21-25 5.6 10.8 16.7 9.5 26-30 11.1 16.9 27.8 16.1 31-35 66.7 12.3 0.0 32.1 36-40 0.0 4.6 0.0 2.2 41-45 0.0 41.5 0.0 19.7 46-50 7.4 0.0 0.0 2.9 51-55 0.0 0.0 0.0 0.0 56-60 0.0 4.6 0.0 2.2 61-65 0.0 0.0 0.0 0.0 66-70 0.0 0.0 0.0 0.0

Year 2 Implementation of the Santa Ana Sucker Conservation Plan
Page 92 San Marino Environmental Associates
Adult Sucker Depth Utilization
Individual Sites Surveyed Utilization as Percent of Total
Depth (cm)
Mission Blvd N=28
Highway 60N=20
Riverside DrN=37
Total Utilization All Sites Combined
N=85
0-5 0.0 0.0 0.0 0.0 6-10 0.0 0.0 0.0 0.0 11-15 0.0 0.0 0.0 0.0 16-20 3.6 0.0 0.0 1.2 21-25 0.0 0.0 0.0 0.0 26-30 0.0 0.0 0.0 0.0 31-35 0.0 5.0 5.4 3.5 36-40 7.1 0.0 2.7 3.5 41-45 10.7 10.0 10.8 10.6 46-50 0.0 10.0 18.9 10.6 51-55 28.6 30.0 0.0 16.5 56-60 0.0 10.0 21.6 11.8 61-65 0.0 0.0 0.0 0.0 66-70 0.0 0.0 10.8 4.7 71+ 50.0 35.0 29.7 37.7
Juvenile Sucker Bottom Velocity Utilization
Individual Sites Surveyed Utilization as Percent of Total
Bottom Velocity (fps)
Mission BlvdN=54
Highway 60N=65
Riverside DrN=18
Total Utilization All Sites Combined
N=137
0.00 – 0.50 66.7 38.7 0.0 44.8 0.51 – 1.00 13.0 17.7 27.8 17.2 1.01 – 1.50 1.9 29.0 50.0 20.9 1.51 – 2.00 14.8 11.3 22.2 14.2 2.01 – 2.50 3.7 3.2 0.0 3.0 2.51 – 3.00 0.0 0.0 0.0 0.0

Year 2 Implementation of the Santa Ana Sucker Conservation Plan
Page 93 San Marino Environmental Associates
Adult Sucker Bottom Velocity Utilization
Individual Sites Surveyed Utilization as Percent of Total
Bottom Velocity (fps)
Mission BlvdN=28
Highway 60N=20
Riverside DrN=37
Total Utilization All Sites Combined
N=85
0.00 – 0.50 25.0 0.0 40.5 28.2 0.51 – 1.00 21.4 61.5 54.1 43.6 1.01 – 1.50 50.0 23.1 5.4 24.4 1.51 – 2.00 0.0 15.4 0.0 2.6 2.01 – 2.50 3.6 0.0 0.0 1.3 2.51 – 3.00 0.0 0.0 0.0 0.0
On the following pages the habitat availability data are graphically compared to the habitat utilization of juvenile and adult Santa Ana suckers with respect to the four criteria shown above: habitat type, substrate, depth, and bottom velocity.

Year 2 Implementation of the Santa Ana Sucker Conservation Plan
Page 94 San Marino Environmental Associates
Habitat Type Availability versus Utilization
0
10
20
30
40
50
60
70
80%
of T
otal
Edgewater Glide Riffle Run PoolHabitat Type
Juvenile Utilization Adult Utilization Availability

Year 2 Implementation of the Santa Ana Sucker Conservation Plan
Page 95 San Marino Environmental Associates
Substrate Availability versus Utilization
0
10
20
30
40
50
60
70
% o
f Tot
al
Silt Silt/Sand Sand Sand/Gravel Gravel Sand/Cobble Gravel/Cobble Cobble Boulder
Substrate Type
Juvenile Utilization Adult Utilization Availability

Year 2 Implementation of the Santa Ana Sucker Conservation Plan
Page 96 San Marino Environmental Associates
Depth Availability versus Utilization
0
5
10
15
20
25
30
35
40%
of T
otal
0.0-5.0
5.1-10.0
10.1-15.0
15.1-20.0
20.1-25.0
25.1-30.0
30.1-35.0
35.1-40.0
40.1-45.0
45.1-50.0
50.1-55.0
55.1-60.0
60.1-65.0
65.1-70.0
70.1+
Depth (cm)
Juvenile Utilization Adult Utilization Availability

Year 2 Implementation of the Santa Ana Sucker Conservation Plan
Page 97 San Marino Environmental Associates
Bottom Velocity Availability versus Utilization
0
5
10
15
20
25
30
35
40
45%
of T
otal
0.00-0.50 0.51-1.00 1.01-1.50 1.51-2.00 2.01-2.50 2.51-3.00Bottom Velocity (fps)
Juvenile Utilization Adult Utilization Availability

Year 2 Implementation of the Santa Ana Sucker Conservation Plan
Page 98 San Marino Environmental Associates
E. Conclusions Although the data set will be enhanced over the next 2 field seasons, the data presented here show a statistically significant difference (p<0.05) between habitat availability and habitat utilization for both juvenile and adult suckers. All comparisons are statistically significant with the exception of the habitat type availability and the habitat utilization by juvenile suckers. Therefore, the current data suggest the following:
Juvenile Santa Ana suckers utilize habitats types roughly in proportion to their availability. The juveniles heavily utilize riffle habitat which is the most common habitat available.
Adult Santa Ana suckers show a significant over-utilization of run and pool habitat. Note that these are deeper water habitats, which correlates with the depth utilization data.
Juvenile Santa Ana suckers show an over-utilization of coarser substrates and an under-utilization of sand, the most abundant substrate in the stream areas examined.
Adult Santa Ana suckers also show an over-utilization of coarser substrates and an under-utilization of sand, the most abundant substrate in the stream areas examined. The adults have a strong relationship to gravel.
The depth data show a striking pattern in which both juvenile and adult Santa Ana suckers over-utilize deeper water than the modal available depth.
Adult Santa Ana suckers use deeper water than do the juveniles. Because Santa Ana suckers swim near the bottom of the stream, just above the
substrate, bottom velocity may be an important habitat parameter. Both juvenile and adult Santa Ana suckers over-utilize slower bottom
velocities than the modal available velocity. Adult Santa Ana suckers use somewhat more rapidly flowing water than do
the juveniles. F. Comparison with Data Collected in the Upper San Gabriel River. The following are the conclusions from two other multi-year habitat utilization studies performed by SMEA in the upper San Gabriel River drainage. One study was conducted on the West Fork of the San Gabriel River in the USFS OHV area and the other was conducted in the East Fork of the San Gabriel River at Heaton Flat. The West Fork study area had less flow and less overall substrate heterogeneity than the East Fork study site. Despite these differences both studies found that:
Adult Santa Ana suckers preferred depths greater than 40 cm Adult Santa Ana suckers preferred run habitat Juvenile Santa Ana suckers preferred riffles and runs Juvenile Santa Ana suckers preferred depths greater than 30 cm Both life stages preferred a low bottom velocity Both life stages preferred coarser substrates
These findings are consistent with the initial findings in the Santa Ana River.

Year 2 Implementation of the Santa Ana Sucker Conservation Plan
Page 99 San Marino Environmental Associates
IX. Sunnyslope Creek Breeding Substrate Enhancement. We have proposed over the past two years that sucker breeding habitat be enhanced by adding appropriate gravel substrate to Sunnyslope Creek, below the concrete lined channel in Louis Rubidoux Nature Center, in the Santa Ana River Wildlife Area, near the City of Riverside. This proposed enhancement activity is described in the attached memos to Juan Hernandez of the California Department of Fish and Game, Lucy Caskey of the U.S. Fish and Wildlife Service and Ron Baxter of Riverside County (see Appendix 4). Discussions have also been held with Robert Smith of the Army Corps of Engineers, and Barbara Ire of the Nature Center. All have informally expressed strong support. Mr. Smith has indicated that the amounts of gravel we will add are far below the amount necessary for a Corps permit. We plan to proceed with obtaining a state permit and to implement this project within the 2005 field season. We have determined the appropriate characteristics of the breeding gravels for the sucker as described in this report (see pp. 56-58). Over the past 2 years we have noted many fewer very young suckers (fry) in the creek, and much less appropriate gravel substrate. Instead there is much more sand and silt substrate, and the gravel present is much more highly imbedded. This means that the gravel is at least partially buried in sand/silt, making it unsuitable for holding fish eggs and yolk-sac larvae. We believe this increase in sand/silt is due to a lack of flushing water flow events in Sunnyslope Creek in the past 2 years. We intend to add gravel of a similar nature to that found at the breeding site in Sunnyslope Creek, anticipating that this will increase the area available for sucker spawning. We will implement this in a manner and time to avoid impacts to the suckers already present in the stream. Photos 39 and 40 show the present poor spawning substrate in Sunnyslope Creek as compared to Photo 21 in this report.

Year 2 Implementation of the Santa Ana Sucker Conservation Plan
Page 100 San Marino Environmental Associates
Photo 39. Sunnyslope Creek, January 17, 2004. Note gravel heavily imbedded with sand.
Photo 40. Sunnyslope Creek, January 17, 2004. Note sand/silt dominated substrate.

Year 2 Implementation of the Santa Ana Sucker Conservation Plan
Page 101 San Marino Environmental Associates
X. Conclusions.
Summary of SMEA’s Approach The primary questions that SMEA has been attempting to answer relate to three major issues:
What is the status of the Santa Ana Sucker in the Santa Ana River? This is a fundamental question. We need to know the distribution of the sucker, its population size, population structure, and population trends. These data will ultimately be important in determining the current status of the sucker, but the data will also provide a baseline against which success and failure of enhancement and restoration efforts can be measured.
What habitat(s) is/are preferred by the various life stages of the Santa Ana sucker? One of the critical goals of the conservation program is to be able to enhance and restore Santa Ana sucker habitat. This goal serves two functions: (1) it will allow the enhancement/restoration of stream reaches to aid in the recovery of the sucker, and (2) if projects necessitate work in the channel, we will be able to determine what channel characteristics are the most import to restore or maintain in order to support a healthy sucker population.
What are the critical life history attributes of the Santa Ana sucker? It is important to understand critical life history attributes such as: (1) time of reproduction, (2) dispersal of fry or young-of-the-year, and (3) adult migration. Such data will provide insight into such diverse concerns as project timing and connectivity (patterns of gene flow) within the Santa Ana River.
Current Status of Our Knowledge A. What is the Status of the Santa Ana sucker in the Santa Ana River?
The Santa Ana River from just downstream of Mission Boulevard upstream to Rialto Drain holds the largest most continuously distributed deme of Santa Ana suckers.
Sunnyslope Creek and Rialto Drain were important reproductive sites for the Santa Ana sucker during 2001, but were not so important during 2002.
Quality of the reproductive habitat in Sunnyslope Creek appears to be declining. There was considerable mainstem reproduction in 2002 and 2003. Santa Ana suckers can be successfully pit tagged, which will provide a useful tool
in studying the Santa Ana sucker. SMEA’s population estimate for Santa Ana sucker from about 600 meters
downstream of Mission Boulevard upstream to Rialto Drain was 6,503-6,809 fish in 2001 and 8,262-10,251 in 2002.

Year 2 Implementation of the Santa Ana Sucker Conservation Plan
Page 102 San Marino Environmental Associates
There were an estimated 6,288-6,584 adult fish in 2001, but only 2,379-2,952 adult fish in 2002.
There was a major demographic shift between 2001 and 2002: In 2001 96.7% of the fish captured during the population estimate were adults and 3.3% were YOY, but in 2002 only 28.8% were adult and 71.2% were YOY. 2003 results were similar to 2002 with 30.7% adult and 69.3% YOY.
Larval production was higher in 2002 than in 2001. In 2003 larval production was higher than 2001 but seemed to be lower than in 2002.
An apparently abnormally large number of Santa Ana sucker YOY appeared at River Road during 2002, this was not repeated in 2003
B. What habitats are preferred by the various life stages of the Santa Ana sucker?
Suckers spawn over medium gravel in water approximately 0.5 meters in depth, and with a flow of 0.20-0.24 m/sec.
Sucker spawning habitat must contain a deeper, more protected area adjacent to the spawning area for fish to utilize when not spawning or between spawning bouts.
Larval suckers utilize shallow (5-10 cm) water in low flow areas with a silt bottom. Emergent or aquatic vegetation does not appear to be a requirement but is commonly present.
Recently transformed young are found in slightly deeper water than are the larvae, and they are associated with a particular habitat structure – the bottom sand is rippled and the young are found in the depression.
Larval suckers may be selecting a position relative to the sun, basking? Juvenile suckers are often found over mid-channel gravel, but in areas such as
River Road where the water is shallow, they are found in the deeper channels along the river margin. Juvenile suckers are also found in the deeper holes along with adults.
Adult suckers are most frequently encountered in deeper holes along the margins of the river.
Juvenile Santa Ana suckers utilize habitats types roughly in proportion to their availability. The juveniles heavily utilize riffle habitat which is the most common habitat available.
Adult Santa Ana suckers show a significant over-utilization of run and pool habitat. Note that these are deeper water habitats, which correlates with the depth utilization data.
Juvenile Santa Ana suckers show an over-utilization of coarser substrates and an under-utilization of sand, the most abundant substrate in the stream areas examined.
Adult Santa Ana suckers also show an over-utilization of coarser substrates and an under-utilization of sand, the most abundant substrate in the stream areas examined. The adults have a strong relationship to gravel.
The depth data show a striking pattern in which both juvenile and adult Santa Ana suckers over-utilize deeper water than the modal available depth.
Adult Santa Ana suckers use deeper water than do the juveniles.

Year 2 Implementation of the Santa Ana Sucker Conservation Plan
Page 103 San Marino Environmental Associates
Because Santa Ana suckers swim near the bottom of the stream, just above the substrate, bottom velocity may be an important habitat parameter.
Both juvenile and adult Santa Ana suckers over-utilize slower bottom velocities than the modal available velocity.
Adult Santa Ana suckers use somewhat more rapidly flowing water than do the juveniles.
C. What are the critical life history attributes of the Santa Ana sucker?
The timing of larval appearance and observations of spawning indicate that suckers in the Santa Ana River, typically, breed from mid-March through late April.
This is somewhat dependent on annual conditions. In early February of 2003 a larval sucker was found. Subsequent high flows removed any fry that were present and fry did not appear again until late March.
Larval suckers are only present for approximately 1.5 months. Based on Saiki’s (2000) data, and SMEA’s 2001 data, most suckers may not
survive past 1+, meaning that they have only a single reproductive season. Due to annual variability in year class composition in Santa Ana sucker from the San Gabriel River, more data are needed. 2002 data suggest an additional year class.
In 2001 there was evidence of adult migration into Sunnyslope Creek Based on the recapture in 2002 of fish marked in 2001, the adults show, at least,
seasonal site fidelity and migrate; or they are resident to a short stretch of stream. Based on the adult recapture data, the adults that were tagged in 2001 and
recaptured in 2002 had grown an average of 34mm SL and increased in weight by 26.5 grams.
XI. QUESTIONS.
Is there significant sucker reproduction in the mainstem? Swift (2001) argued mainstem reproduction because of the broad larval distribution in the mainstem. In 2001, larvae appeared in the mainstem significantly later than they appeared in the tributaries. This raises the potential of larval drift accounting for larvae in the mainstem.
Can we increase larval production? Now that SMEA has been able to characterize
Santa Ana sucker spawning habitat in the tributaries, there is the potential to create more spawning habitat and increase larval production.
Where were the juveniles (see Photo 22) in 2001? Swift (2001) reported large
numbers of juveniles, but such large numbers were not observed in 2001 by SMEA.
To what degree does the size of the sucker deme upstream of Mission Boulevard fluctuate from year to year, and is it stable? SMEA made three population estimates based on three 100-meter sections. As this is repeated year after year the question will be answered. The current data do not provide a robust answer.

Year 2 Implementation of the Santa Ana Sucker Conservation Plan
Page 104 San Marino Environmental Associates
What are the specific characteristics of preferred adult habitat? Even upstream of Mission Boulevard where suckers are common, there is considerable variation in sucker density. What determines this mosaic of habitat occupation? SMEA has some data on this question but more is needed. Initial observations coupled with data collected in the San Gabriel River, and observations associated with Riverside County Flood Control’s diversion of the Santa Ana River upstream of Riverside Avenue suggest the placement of boulders in the stream may be a beneficial habitat enhancement for suckers. However, more data are needed.
Do suckers in the Santa Ana River normally survive only two years? Based on
SMEA’s experience in the West Fork of the San Gabriel River, several years of data will be necessary to answer this question without sacrificing fish to examine otoliths.
Do the cichlids in the Santa Ana River compete for algal resources with the Santa
Ana sucker? The potential for competition over food resources exists. XII. PROGRAM TASKS FOR 2004. The following are the recommended focal tasks for the 2004 field season for the Santa Ana Sucker Conservation Program. As always SMEA will use its discretion (in coordination with SAWPA) in order to take advantage of any unique opportunities that arise during the field season. Task #1. Enhancement of breeding habitat in Sunnyslope Creek
Subtask 1A. Evaluate adult sucker population status in Creek February/March 2004 Subtask 1B. Examine status of fry in creek in 2004 breeding season as a basis for evaluation of restoration project Subtask 1C. Implementation of restoration in creek (incl. permitting, develop measures of success, obtain and prepare gravel, install gravel)
Task #2. Studies of young-of-the-year and adult suckers Subtask 2A. Habitat utilization/preference Task #3. Population estimates/tagging Subtask 3A. Sequential depletion at three standard sites (Summer) Subtask 3B. Sampling for tagging and detection of tagged fish to determine movement patterns (Fall)
Task #4. Detect predation by exotic fishes on young suckers Collection and preservation of exotics will be done in conjunction w/other activities, and no funds are allocated for the analysis of gut contents this year. Exotics will have to be collected when fry and juveniles are present. Analysis is postponed until additional funds are available.

Year 2 Implementation of the Santa Ana Sucker Conservation Plan
Page 105 San Marino Environmental Associates
Task #5. Project Management and Administration Subtask 5A. Coordination with SAWPA Subtask 5B. Agency coordination/response Subtask 5C. Project management Subtask 5D. Data management Subtask 5E. Meeting attendance Subtask 5F. Preparation of materials for meetings Subtask 5G. Preparation of draft and final annual report Subtask 5H. Miscellaneous administration such as, assistance to SAWPA consultant (Jim Van Haun), other project or project development review. This year SMEA has also provided SAWPA with two optional tasks should additional funding become available. SAWPA indicated an interest in having these tasks performed. OPTIONAL TASKS Task #6. Restoration planning for following year. Task #7. Population estimation by snorkeling. This will provide data comparable to previous years, and give us a means to validate the depletion method of population estimation. It is not expected that all goals or definitive answers to the questions proposed for investigation in the above Tasks will be fully achieved this year. All of the Tasks will be pursued to the extent that time, access to sites, environmental conditions, permit restrictions and budgetary constraints allow. XIII. POTENTIAL ACTIVITIES FOR YEAR 8 OF THE CONSERVATION PROGRAM. The year 8 implementation activities as currently envisioned are the year 5 activities outlined in the Conservation Plan (Baskin and Haglund 1999). Funding restrictions during years 1-3 have resulted in a delay in completing the tasks as originally conceived. The primary focus in year 8 should be the evaluation of the success of created habitat and the refinement of habitat design. This should be coupled with annual monitoring.

Year 2 Implementation of the Santa Ana Sucker Conservation Plan
Page 106 San Marino Environmental Associates
XIV. LITERATURE CITED. Baskin, J.N. and T.R. Haglund. 1999. Conservation program for the Santa Ana sucker in the
Santa Ana River, Southern California. Unubl. report for SAWPA. Baskin, J.N. and T.R. Haglund. 2000. Santa Ana sucker survey/seining in the Santa Ana
River. Unpubl. report prepared for USACOE, Los Angeles District, under subcontract to Aspen Environmental Group. 8p.
Baskin, J.N. and T.R. Haglund. 2001. Survey for the Santa Ana sucker at the Van Buren
bridge, Riverside County, California. Unpubl. report for the Riverside Co. Dept of Transportation, under subcontract to LSA Associates. 4p.
Bruton, M.N. and R.E. Boltt. 1975. Aspects of the biology of Tilapia mossambica Peters
(Pisces: Cichlidae) in a natural freshwater lake (Lake Sibaya, South Africa). J. Fish Biol. 7:423-445.
Deinstadt, J.M., E.J. Pratt, F.G. Hoover and S. Sasaki. 1990. Survey of fish populations
in southern California streams:1987. Calif. Dept. Fish and Game, Inland Fish. Div. Admin. Rpt. 90-1. 56p.
Drake, D.P. and S. Sasaki. 1987. West Fork San Gabriel River Los Angeles County,
field study report. Unpubl. Report, Calif. Dept. Fish, Game. Inland Fisheries Branch, Long Beach.
Greenfield, D.W. 1973. Introgressive hybridization between Gila orcutti and
Herperoleucus symmetricus (Pisces: Cyprinidae) in the Cuyama River basin, California. II: Ecological Aspects. Copeia 1973:417-427.
Greenfield, D.W., S.T. Ross, and D.G. Deckert. 1970. Some aspects of the life history
of the Santa Ana Sucker, Catostomus (Pantosteus) santaanae (Snyder). Calif. Fish Game 56:166-179.
Haglund, T.R. and J.N. Baskin. 1997. Fish population and gravel studies during Cogswell Reservoir sediment removal – phase 2. 1996 Status Report. Unpubl. report for Los Angeles County Dept. of Public Works, Hydraulic/Water Conservation Division. Haglund, T.R., J.N. Baskin, and C.C. Swift. 2001. Results of the year 1 implementation of
the Santa Ana sucker conservation program for the Santa Ana River. Unpubl. Report, SAWPA.
Harrington, R.W. and E.S. Harrington. 1961. Food selection among fishes invading a
high subtropical salt marsh from the onset of flooding through the progress of a mosquito brood. Ecology 42:646-656.

Year 2 Implementation of the Santa Ana Sucker Conservation Plan
Page 107 San Marino Environmental Associates
Keast, A. 1966. Trophic relationships in the fish fauna of a small stream. Univ. Mich. Great Lakes Res. Div. Pub. 15:51-79.
Kennedy, T.B. and G.L. Vinyard. 1997. Drift ecology of western catostomid larvae with
emphasis on Warner suckers, Catostomus warnerensis (Teleostei). Env. Biol. Fish. 49:187-195.
Lewis, W.M., G.E. Gunning, E. Lyles, and W.L. Bridges. 1961. Food choice of
largemouth bass as a function of availability and vulnerability of food items. Trans. Amer. Fish. Soc. 90(3):277-280.
Man, H.S.H. and I.J. Hodgkiss. 1977. Studies on the ichthyofauna in Plover Cove
Reservoir, Hong Kong: feeding and food relations. J. Fish. Biol. 11:1-13. Miller, E.E. 1966. Yellow bullhead. p. 479-480. In A. Calhoun (ed.) Inland Fisheries Management, Calif. Dept. Fish, Game. Moyle, P.B. 1976. Inland Fishes of California. University of California Press, Berkeley. 405p. Nelson, J.S. 1994. Fishes of the World. John Wiley & Sons, Inc., New York. 600p. Prentice, E.F., T.A. Flagg, C.S. McCutcheon. 1990a. Feasibility of using implantable
Passive integrated transponder (PIT) tags in salmonids. Amer. Fish Soc. Symposium 7:317-322.
Prentice, E.F., T.A. Flagg, C.S. McCutcheon, D.F. Brastow, and D.C. Cross. 1990b.
Equipment, methods, and an automated data-entry station for PIT tagging. Amer. Fish Soc. Symposium 7:335-340.
Saiki, M.K. 2000. Water quality and other environmental variables associated with
variations in population densities of the Santa Ana sucker. Unpubl report to SAWPA from USGS/BRD, Western Fisheries Research Center. 117p.
Smith, G.R 1966. Distribution and evolution of the North American catostomid fishes of
the subgenus Pantosteus, genus Catostomus. Univ. Mich. Mus. Zool. Misc. Publ. 129:1-33.
Snyder, J.O. 1908. Description of Pantosteus santa-anae, a new species of fish from the Santa Ana River, California. Proc.U.S. Natl. Mus. 59:23-28. Swift, C.C. 2001. The Santa Ana sucker in the Santa Ana River: distribution, relative
abundance, spawning areas, and the impact of exotic predators. Unpubl report to SAWPA from Larry Munsey International. 94p.

Year 2 Implementation of the Santa Ana Sucker Conservation Plan
Page 108 San Marino Environmental Associates
Swift, C.C., T.R. Haglund and M. Ruiz. 1990. Status of freshwater fishes of southern California with recommendations for preserves to maintain their existence. Unpubl. report Calif.Dept. Fish and Game, Inland Fish. Div. 215p.
Swift, C.C., T.R. Haglund and M. Ruiz. 1993. The status and distribution of the
freshwater fishes of southern California. Bull. Southern California Acad. Sci. 92(3): 101-167.

Year 2 Implementation of the Santa Ana Sucker Conservation Plan
Page 109 San Marino Environmental Associates
XV. ACKNOWLEDGEMENTS. San Marino Environmental Associates wishes to acknowledge the proactive leadership of the Santa Ana Sucker Conservation Team has taken in the funding and implementation of the Conservation Program for the Santa Ana Sucker in the Santa Ana Watershed. Created in 1998, two years before the listing of the Santa Ana sucker as Threatened by the U.S. Fish and Wildlife Service, the Team began funding studies which have been instrumental in developing an understanding of the biology of the Santa Ana sucker. The Santa Ana Watershed Project Authority serves as the overall administrator of the Team’s efforts, but the funding comes from the Conservation Program participants:
City of Riverside (Regional Water Quality Control Plant) City of San Bernardino Municipal Water Department (Rapid Infiltration & Extraction Facility) Orange County Flood Control District Orange County Water District, County of Orange Public Facilities & Resources
Department Riverside County Riverside County Flood Control and Water Conservation District San Bernardino County Flood Control District
We also wish to acknowledge the following people who participated in the fieldwork on this project: Albert Gonzales, Amanda Harrington, Edward Hewitt, Jason Lambert, Kathy Lynde, Diane Morales, James Morales, Bryan Reese and Jack Suthisayem. A special acknowledgement is due to Steve Bryant, Ph.D. who participated in many aspects of this work. In addition, valuable field assistance was provided by Lucy Caskey (USFWS), Barbara Ire (Rubidoux Nature Center), and Patrick Tennent (Orange County Water District). Valuable comments on the draft of this report were received from Jeff Beehler, Lucy Caskey, Rod Cruz, and Jin Van Haun. Many others have provided assistance, support, and encouragement for this ongoing study of the Santa Ana sucker. We gratefully acknowledge all those others who were not specifically named above.

Year 2 Implementation of the Santa Ana Sucker Conservation Plan
Page 110 San Marino Environmental Associates
Appendix 1
Length-weight data and pit tag numbers from the fish captured in 2001

Year 2 Implementation of the Santa Ana Sucker Conservation Plan
Page 111 San Marino Environmental Associates
List of the length (SL mm) and weight (g) of the fish caught (N=88) in the 100-meter stream reach upstream of Mission Boulevard (Site 1) on 15 June 2001.
LENGTH WEIGHT PIT TAG NUMBER 102 18.8 4264610758 113 25.9 426502050D 140 40.4 4263187801 107 27.4 425F623D68 113 29.8 42616B2D21 109 21.0 4264603D43 98 19.5 42656F2620
110 27.1 42631A7519 102 22.5 42645F0977 119 33.9 42645B1060 116 20.6 4261784118 116 33.7 4264743268 115 28.0 4262014F3A 113 27.6 4264525A28 107 24.8 4265707F06 118 25.7 42645E2D7A 102 21.4 4264533E5C 111 27.5 4264666E38 109 23.1 4261627E72 114 28.0 426204114D 113 27.0 426200201F 118 29.5 4262104704 118 32.9 4262006820 102 19.1 426210684C 115 22.9 4261561F5C 116 29.0 42620E2865 109 22.8 4264712F71 112 28.5 4265041E49 107 25.5 42615B5215 132 39.2 4263245D1B 119 29.3 42655E0062 112 26.9 426600274E 126 36.3 4262032A1E 99 21.4 4261680723
115 30.6 426578585F 111 28.2 42632A2F17 105 23.2 42616F102F 103 23.5 426204190B 110 27.7 4264595B2F 101 21.8 426205324D 105 21.4 4262076B48
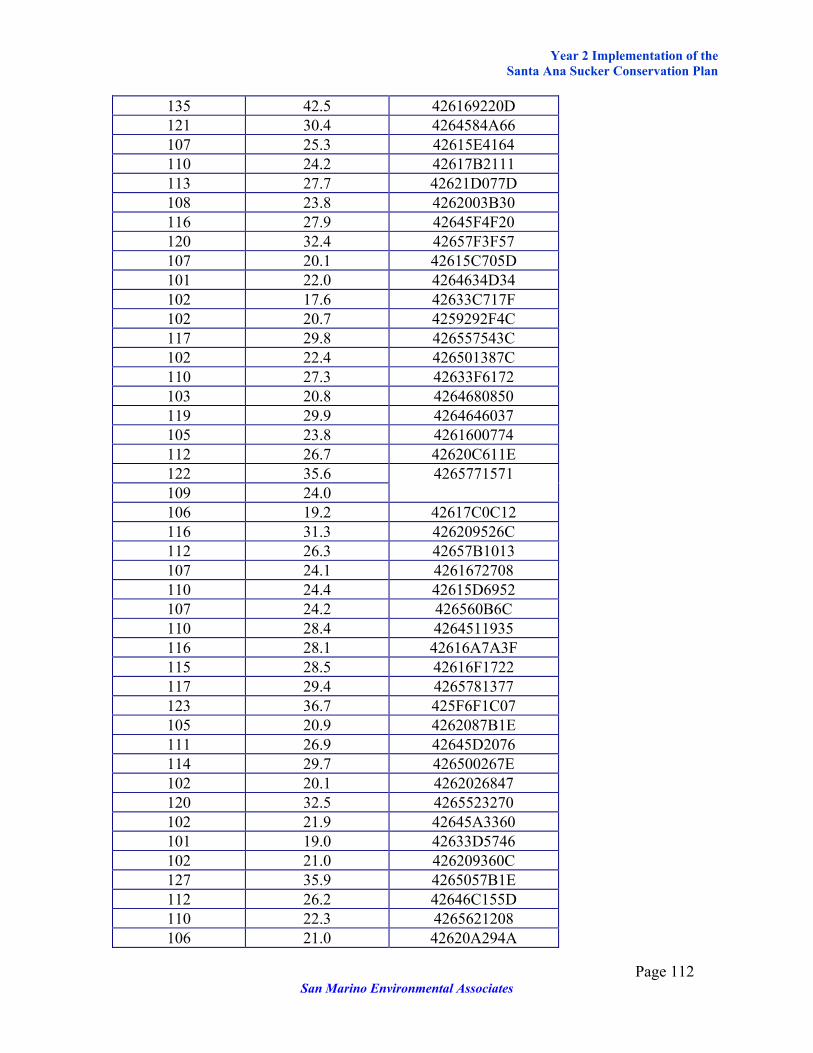
Year 2 Implementation of the Santa Ana Sucker Conservation Plan
Page 112 San Marino Environmental Associates
135 42.5 426169220D 121 30.4 4264584A66 107 25.3 42615E4164 110 24.2 42617B2111 113 27.7 42621D077D 108 23.8 4262003B30 116 27.9 42645F4F20 120 32.4 42657F3F57 107 20.1 42615C705D 101 22.0 4264634D34 102 17.6 42633C717F 102 20.7 4259292F4C 117 29.8 426557543C 102 22.4 426501387C 110 27.3 42633F6172 103 20.8 4264680850 119 29.9 4264646037 105 23.8 4261600774 112 26.7 42620C611E 122 35.6 109 24.0
4265771571
106 19.2 42617C0C12 116 31.3 426209526C 112 26.3 42657B1013 107 24.1 4261672708 110 24.4 42615D6952 107 24.2 426560B6C 110 28.4 4264511935 116 28.1 42616A7A3F 115 28.5 42616F1722 117 29.4 4265781377 123 36.7 425F6F1C07 105 20.9 4262087B1E 111 26.9 42645D2076 114 29.7 426500267E 102 20.1 4262026847 120 32.5 4265523270 102 21.9 42645A3360 101 19.0 42633D5746 102 21.0 426209360C 127 35.9 4265057B1E 112 26.2 42646C155D 110 22.3 4265621208 106 21.0 42620A294A

Year 2 Implementation of the Santa Ana Sucker Conservation Plan
Page 113 San Marino Environmental Associates
123 33.4 4266012D28 110 28.2 4264655C02 100 19.8 4261665970
List of the length (SL mm) and weight (g) of the fish caught (N=144) in the 100-meter stream reach upstream of Highway 60 (Site 2) on 15 June 2001.
LENGTH WEIGHT PIT TAG NUMBER 104 18.9 426505004B 152 65.8 4265610D4E 108 25.5 42617A4268 103 20.1 42650A4139 110 25.7 42615A635F 110 29.3 4261641E63 112 25.3 4262001907 98 15.7 42617E3343
125 35.7 42620E1B0F 101 18.1 4261663641 110 22.3 4264775F1E 108 26.3 4264517604 111 22.3 4265083A0B 94 16.5 4262110064
111 24.3 4262131467 99 19.1 4261775D12
102 18.3 4261614B45 114 25.2 4265092A61 107 19.5 4261796949 120 28.0 42645D1128 108 21.2 42620A7A5A 98 18.1 4262002859
133 40.7 426207776A 109 20.9 426604580D 111 22.4 4267106F79 161 69.9 42634F4571 125 37.4 42645F1761 99 16.4 4264726F7B
122 32.2 42617D517E 120 29.3 426472792B 120 33.5 42645C064F 96 16.6 4262127D6C
110 28.6 42617B542C 108 18.8 426179075B 116 32.0 4262027F34

Year 2 Implementation of the Santa Ana Sucker Conservation Plan
Page 114 San Marino Environmental Associates
118 31.1 4264571615 116 29.8 426460066F 111 25.7 42645E391E 105 17.8 42616B151A 122 29.5 426466644A 106 19.9 4262007C44 112 28.7 42600A5939 105 24.0 42615B6E34 112 26.8 4261582175 103 21.1 42616D2F7E 119 32.7 4263220F43 114 28.7 42647B712E 120 29.9 4264761B69 104 18.9 4264765E29 103 20.3 425F6B356D 104 22.2 4261616017 116 28.0 426508436A 117 28.4 42620E7107 109 23.8 426608125D 113 28.9 426162230A 101 17.8 4264725B1C 104 17.8 4262021A77 106 19.3 42620A594E 126 33.7 42645B3B32 110 23.9 4262112A15 111 26.2 42615A7321 107 24.1 42620A1052 110 21.7 42617C4D48 103 19.4 426164184D 107 24.7 4265734459 110 23.8 426461486A 122 33.7 4264625D5E 105 24.0 42563D6B0A 100 16.8 42645B0713 121 30.8 42546A1179 120 31.0 42620B7D43 105 21.7 4264622D5A 116 27.2 426458452D 116 31.8 426502604E 122 36.2 42615A7115 103 20.2 426479237A 110 27.0 4261777474 111 25.2 42620C6613 108 19.8 4263355D63

Year 2 Implementation of the Santa Ana Sucker Conservation Plan
Page 115 San Marino Environmental Associates
123 34.4 42647D6018 109 21.3 425F686945 105 20.5 42647B200A 115 28.2 42617A126F 101 20.2 425F7F5F05 107 22.9 4262087742 117 26.4 4264585B3B 100 19.1 4265794150 102 20.1 42616D6D33 112 25.2 4262011658 98 20.8 4264745860
106 24.7 4264687977 96 19.4 42617A772C
108 26.7 4262033B43 99 18.0 4265661A42
109 20.3 42650A622D 118 36.8 425F627D11 120 39.4 4261731715 115 26.8 42617C4320 111 24.6 4262003558 41 1.2 48 2.1
110 23.9 426453342E 112 24.1 42620A467B 109 28.9 4261660E7A 96 20.4 4264667868
112 20.3 426165330B 100 17.4 42633C2756 107 18.0 4264766D43 100 17.6 42616F1D50 116 25.6 42645D7507 107 23.4 42645C5A14 127 33.0 4262055C5F 105 20.3 42616D0D49 109 19.4 4264550C7E 116 29.4 426213241A 113 26.5 4264563721 107 20.6 42646D7D75 123 34.3 4265581360 117 28.7 4262112253 117 30.8 425F7A2B03 113 23.6 4264596F48 104 21.4 4266015449 106 28.4 4265633431

Year 2 Implementation of the Santa Ana Sucker Conservation Plan
Page 116 San Marino Environmental Associates
107 26.5 42654E3247 105 21.5 4262007402 127 39.0 426501632A 135 44.0 4262092672 115 31.3 4264694158 119 31.4 4265584C2C 117 33.4 42617B5A44 101 20.7 4265031C02 57 4.0 40 1.1
122 32.7 4261684C0B 121 36.4 42620B3920 122 34.9 42616C7026 117 25.0 4262091E49 132 37.6 42615B2106 121 35.0 42633C6A50 102 20.2 42646C0E72 118 30.0 4264574612 106 22.7 4264711D38 127 36.0 4261790D29 49 2.4 49 1.9 52 2.2
105 20.4 4265777111 41 1.4
113 24.6 4262113714 113 25.3 42616B6B76 114 23.5 4265035D58 94 15.5 4265660808
116 27.0 42647A4B35 112 26.2 42617B0031 102 18.6 42655C0A77 102 18.4 42617D1F6F 105 17.6 42620C2B15 100 17.1 42646E4E6C 103 24.0 426460266C 99 19.2 42647A5A68
113 30.1 4266093C22 108 26.1 4264542A47 109 24.2 42650B2E1C 112 26.9 42660A7074 105 21.5 4265656922 130 40.2 4261634A01 112 28.6 4265541B7D

Year 2 Implementation of the Santa Ana Sucker Conservation Plan
Page 117 San Marino Environmental Associates
116 31.0 4262104C55 105 20.9 426001170C 103 18.7 4264666935 124 36.9 4265504609 127 34.7 42616F2345 99 20.9 4265006056 92 19.7
153 60.8 List of the length (SL mm) and weight (g) of the fish caught (N=9) in the 100-meter stream reach downstream of Riverside Avenue (Site 3) on 16 June 2001.
LENGTH WEIGHT PIT TAG NUMBER 124 37.5 4261646702 115 32.6 4261710538 113 31.8 4261566C4F 124 45.1 4265060501 121 33.8 4264757877 113 33.8 42650D6903 116 33.3 4261597748 131 42.5 4265591479 129 39.5 4262075D18 54 2.8 42 1.4 60 4.4 61 3.8

Year 2 Implementation of the Santa Ana Sucker Conservation Plan
Page 118 San Marino Environmental Associates
Appendix 2
Length-weight data and pit tag numbers from the fish captured in 2002

Year 2 Implementation of the Santa Ana Sucker Conservation Plan
Page 119 San Marino Environmental Associates
List of the length (SL mm) and weight (g) of the fish caught (N=120) in the 100-meter stream reach upstream of Mission Boulevard (Site 1) on 19 July 2002.
LENGTH WEIGHT PIT TAG NUMBER 66 5.6
142 59.4 42645C697E 119 32.8 4264791C4C 39 1.1 39 1.1 37 0.9 47 1.7 60 4.1 36 0.8 45 1.7 34 0.6
151 53.4 4266074800 148 51.7 4264636A3A 147 52.3 4264772172 125 35.0 4265070602 125 36.8 42620D5D2B 130 39.8 4261657B34 141 70.3 4263343B23 78 9.1 66 6.1 52 2.7 58 3.9 47 2.0
132 6.2 42617F6047 146 50.1 4261605464 64 4.2 62 4.2 72 8.7 62 4.9 65 4.7 61 4.3 36 0.9 77 8.2 66 5.9 59 4.2 76 8.0 76 8.4 55 3.0 67 4.2
137 49.3 42616C560B 131 40.1 4265510573

Year 2 Implementation of the Santa Ana Sucker Conservation Plan
Page 120 San Marino Environmental Associates
30 0.5 40 1.6 67 5.4 36 0.8 46 1.7 59 3.7 60 4.2 56 2.9 49 2.3 46 2.2 91 14.2 42617F6A35
119 31.1 426210431E 147 39.7 4265521922 147 53.5 42655E0062 76 9.7 31 0.5 51 2.0 87 12.4 426179775F
151 55.6 4261792342 147 50.4 42620D567A 155 62.6 42645F4F20 39 0.9 49 1.8 31 0.5 42 1.2 31 0.6 30 0.6 40 1.8 28 0.2 49 2.0 55 3.2
146 54.5 4260163132 169 79.8 4262087C13 135 41.8 4264733865 123 32.4 4265592E76 81 11.9 4262061627
117 29.7 4264733100 68 5.2 64 5.1 74 7.6 68 5.6
158 73.3 4264614436 51 2.5
161 61.8 42615F0109
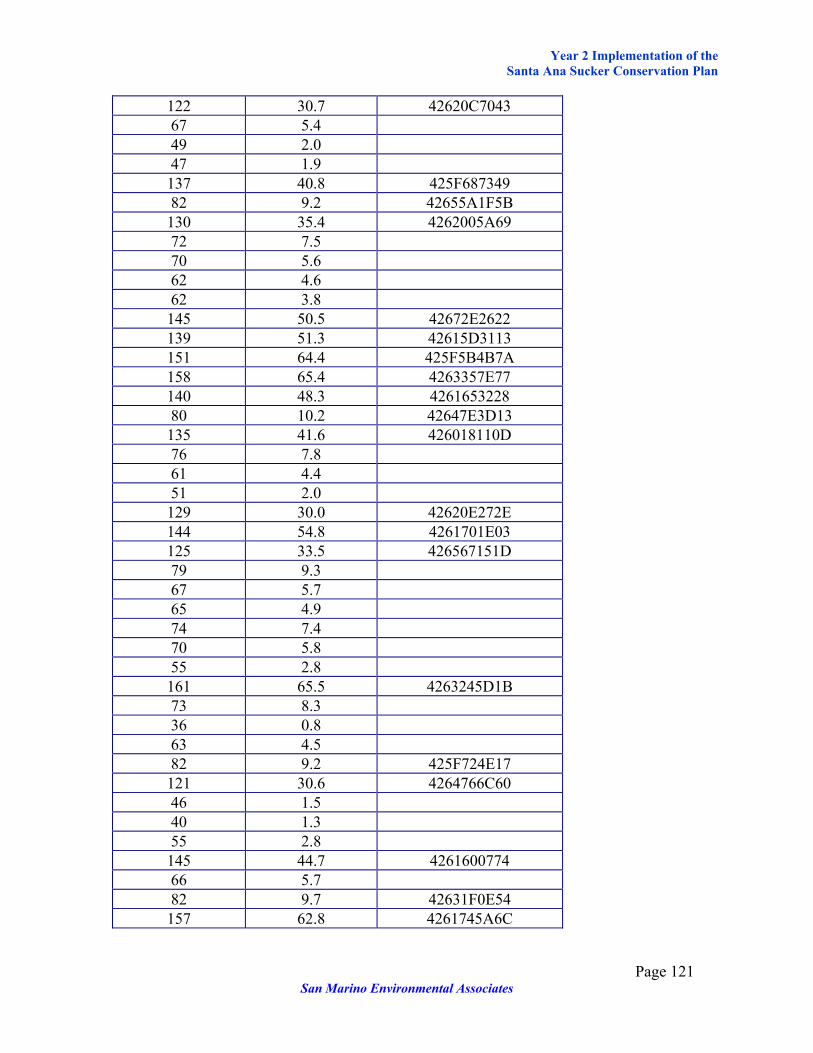
Year 2 Implementation of the Santa Ana Sucker Conservation Plan
Page 121 San Marino Environmental Associates
122 30.7 42620C7043 67 5.4 49 2.0 47 1.9
137 40.8 425F687349 82 9.2 42655A1F5B
130 35.4 4262005A69 72 7.5 70 5.6 62 4.6 62 3.8
145 50.5 42672E2622 139 51.3 42615D3113 151 64.4 425F5B4B7A 158 65.4 4263357E77 140 48.3 4261653228 80 10.2 42647E3D13
135 41.6 426018110D 76 7.8 61 4.4 51 2.0
129 30.0 42620E272E 144 54.8 4261701E03 125 33.5 426567151D 79 9.3 67 5.7 65 4.9 74 7.4 70 5.8 55 2.8
161 65.5 4263245D1B 73 8.3 36 0.8 63 4.5 82 9.2 425F724E17
121 30.6 4264766C60 46 1.5 40 1.3 55 2.8
145 44.7 4261600774 66 5.7 82 9.7 42631F0E54
157 62.8 4261745A6C

Year 2 Implementation of the Santa Ana Sucker Conservation Plan
Page 122 San Marino Environmental Associates
List of the length (SL mm) and weight (g) of the fish caught (N=151) in the 100-meter stream reach upstream of Highway 60 (Site 2) on 21 July 2002.
LENGTH WEIGHT PIT TAG NUMBER 128 37.1 4265025324 138 42.5 42645F325B 63 4.2 66 5.3 59 4.4 69 6.0 67 5.7 64 5.5 55 3.3 59 4.2
165 72.5 42615F4344 171 77.4 4265006F62 122 34.2 4261634916 122 29.7 4261653979 133 41.8 426475561C 143 49.6 4261594B69 141 46.5 4261641706 139 45.3 426505704F 140 51.5 42620A4F16 141 49.8 42617F3274 145 58.5 42615F4A21 69 5.6 74 7.5 67 6.1 68 5.2 59 3.9 65 4.7 65 4.6 49 2.1 69 5.9 62 3.7 68 5.5 67 5.1
141 43.9 4265025F78 155 62.0 4261767F31 146 51.2 426509071D 127 33.3 4255717B5D 65 5.4 40 1.0 62 4.2

Year 2 Implementation of the Santa Ana Sucker Conservation Plan
Page 123 San Marino Environmental Associates
68 6.2 54 2.9 58 4.0 63 4.9 60 4.5 63 4.7 74 7.7 63 4.6 48 2.1 68 6.2 65 4.7 59 3.8 69 6.1 55 3.1 61 5.0 55 3.3 54 3.0 52 3.1 62 4.8 55 3.3 55 3.3 63 5.0
151 62.6 4261644B5D 124 34.3 4261717A77 128 35.5 4261612379 67 5.2 63 4.6 67 6.3 65 5.1 86 11.7 4264793D6C
140 44.7 425F630A0C 128 35.7 42633F3E3E 76 7.5 73 7.7 62 4.1 56 3.3 67 5.2 61 4.4 56 3.1 45 1.6
132 37.2 42620D3C72 63 4.8 68 5.5 56 3.4

Year 2 Implementation of the Santa Ana Sucker Conservation Plan
Page 124 San Marino Environmental Associates
64 4.5 71 6.1 61 3.8 46 1.6 62 5.3 58 4.0 61 4.7 59 3.5 55 3.0 66 4.8 69 5.3 45 1.6 52 2.8 34 0.8 45 1.9 46 2.0 52 2.6 55 3.5 63 4.9 58 3.3 59 3.8 45 1.7 52 2.7 62 4.4 64 5.0 84 10.2 4265026F05 58 3.8 57 3.7 66 5.1 70 5.9 72 6.2 45 1.5
124 35.8 42633C151F 78 8.9 59 3.3 50 2.6 60 4.0 68 5.6 66 6.0 68 5.1 68 5.4 59 3.4 60 4.2 62 4.6

Year 2 Implementation of the Santa Ana Sucker Conservation Plan
Page 125 San Marino Environmental Associates
54 2.7 45 1.9 65 5.4 63 5.0 61 4.5 66 4.8 82 10.0 4261594A4A
161 66.9 42616F7A27 147 55.3 4265036440 124 33.2 4261704909 65 4.6 75 7.2 71 6.0 65 4.9 65 4.9 79 8.7 63 4.0 48 1.8
155 63.0 4264704E3C 74 6.9 61 4.0 67 5.1 62 4.4
List of the length (SL mm) and weight (g) of the fish caught (N=45) in the 100-meter stream reach downstream of Riverside Avenue (Site 3) on 21 July 2002.
LENGTH WEIGHT PIT TAG NUMBER 175 89.1 4261782B10 63 4.9
145 56.3 4264717427 160 79.0 4264671A32 142 51.0 4261704555 62 4.6
162 76.5 4264524D5B 78 9.2
153 66.3 426168533E 133 44.7 426156082F 136 40.6 4264706D67 66 5.3 61 3.7 69 5.6 72 6.9 70 6.0

Year 2 Implementation of the Santa Ana Sucker Conservation Plan
Page 126 San Marino Environmental Associates
70 7.1 68 6.0 70 6.6 71 5.2 71 7.4 73 7.0 68 5.8 77 7.0 89 12.5 42616A5808 68 5.4 68 5.8 67 6.1 71 5.7
120 31.7 74 7.5 70 5.8 67 5.3 57 3.2
152 58.5 4264570D3A 73 6.5 72 6.3 68 5.2 72 7.3 77 7.3 68 5.2 69 5.4 68 5.1 60 4.1 70 6.5

Year 2 Implementation of the Santa Ana Sucker Conservation Plan
Page 127 San Marino Environmental Associates
Appendix 3
Discussion of the triple pass sequential depletion method of population estimation

Year 2 Implementation of the Santa Ana Sucker Conservation Plan
Page 128 San Marino Environmental Associates
The following discussion was presented to a group of agency personnel and concerned scientists that wanted to standardize Santa Ana sucker monitoring techniques throughout its range.
Discussion of Proposed Santa Ana Sucker Monitoring Protocol
By Thomas R. Haglund, Ph.D. Jonathan N. Baskin, Ph.D.
Introduction. The following is a discussion of the potential alternatives considered in establishing a Santa Ana sucker monitoring protocol and a recommendation for establishing a protocol. Population Estimation Methods To Be Considered.
1. Electrofishing 2. Snorkeling 3. Mark-Recapture 4. Seining 5. Underwater Camera
General Considerations. Estimation of population sizes in streams presents significant sampling problems when the entire stream must be censused. Since it is seldom feasible to survey the entire stream, two-stage sampling designs are necessary. A random or systematic selection of sampling units is selected during the first stage, and the population of fish within each of these is estimated during the second stage. Hankin (1984) concluded that errors in the estimation of fish numbers within selected units (second stage errors) are likely to be small compared with errors that arise due to variation in fish numbers between these units (first stage errors). The necessity of stratification by habitat type and location could be evaluated following one or more sampling rounds. Observations by Haglund and Baskin (unpubl. data) clearly indicate stratification by habitat type is necessary, and surveys conducted by Haglund and Baskin in 1991 throughout the upper San Gabriel River drainage suggest that location may be relevant because fish abundance appears to decrease with gradient. In concept, all methods of population estimation are simple, but their application to natural populations has stimulated the development of a large body of statistical and mathematical models (e.g. Seber, 1973; Ricker, 1975). Electrofishing – Sequential Removal Electrofishing is an efficient capture method that is widely used to obtain reliable population estimates of salmonid fishes. Although it has been used less frequently on smaller nonsalmonid fishes, it can be an effective technique for the study of small nonsalmonids if properly used. The technique tends to collect larger fishes more readily than smaller ones but the controls on the newer electrofishers allow adjustments that reduce size selectivity and enhance the efficacy of this technique for use on smaller riverine fish species. Stream

Year 2 Implementation of the Santa Ana Sucker Conservation Plan
Page 129 San Marino Environmental Associates
conditions such as conductivity of the water, temperature, and depth can affect the efficiency of electroshocking. However, it still remains a technique of choice for salmonids, and is becoming so for other fishes occupying similar habitats because it is less affected by boulder-rubble substrates, aquatic vegetation and undercut banks - all conditions likely to be encountered in a productive trout stream (where Santa Ana suckers occur). Standard censusing with an electrofisher involves the use of successive removal-depletion techniques. The removal-depletion method of population analysis (Zippin, 1958) assumes that: 1. No animal can move in or out of the sampling area. 2. Each animal has an equal chance of being captured. 3. The probability of capture is constant over all removal passes. These assumptions are readily reached if (1) size selectivity is reduced through proper adjustment of the electrofisher, (2) the sample area is blocked to prevent fish from leaving the area, (3) a consistent proportion of the population is captured during each pass, and (4) timing devices are used on the electrofishers to insure that capture effort is the same on all removals (Platts et al, 1983). During electrofishing it is imperative that a downstream blocking net be in place, as well as an upstream blocking net to insure that fish did not leave the sampling area; in our experience fish will attempt to leave the area. Although a two-step removal method (Seber and LeCren, 1967) is frequently used to reduce effort, and because of the simplicity of population estimate calculations, it is less reliable than methods using additional removals. Multiple-removal methods provide more accurate estimates of the population size (Zippin, 1958). A three-step removal procedure is a good compromise between reliability of the population estimate and effort. The Zippin method is based on a maximum likelihood model (Moran, 1951) which has the probabilities reduced to easily read graphs or to computer programs. In order to calculate a population estimate the following quantities must be calculated: k T = Σ Ui (T = U1 + U2 + ... + Uk) i=1 where: T = total number of fish collected Ui = number of fish collected in the ith removal k = the number of removals

Year 2 Implementation of the Santa Ana Sucker Conservation Plan
Page 130 San Marino Environmental Associates
Next the ratio (R) must be determined from the following formula: k Σ (i-1) Ui i = 1 R = . T The population estimate is then determined by : eN = T Q where: Q = the proportion of the fish captured during all removals. Q can be determined from a graph (Platts et al, 1983) or it is calculated by the computer program. This method allows the measurement of length-weight data which can be used to determine fish condition (Saiki 2000) and age class distribution. In the case of the Santa Ana sucker, the sizes of Santa Ana sucker age classes were determined by Drake and Sasaki (1987) for the West Fork of the San Gabriel River. Age class Santa Ana sucker Length (mm) YOY 0 - 70 1+ 71 - 130 2+ 131 - 160 3+ 161 - 185 4+ 186 - These data are relatively similar to the data presented in Greenfield et al. (197) for the lowland Santa Clara River population. Thus age class structure of the population can be determined if length data are collected. This technique has been criticized due to potential injury related mortality of electroshocked fish. However, in our experience mortality is minimal if electrofishers are carefully adjusted and the fish are properly held during the removal period. In fact, Santa Ana suckers are less subject to injury than are rainbow trout. Snorkeling Counts. Hankin and Reeves’ (1988) snorkeling surveys of salmonids in Cummins Creek, Oregon is a frequently used example of a snorkeling study design. Habitat units must be classified (e.g. riffle, pool, glide), and the stream may be further stratified based on location (e.g. lower,

Year 2 Implementation of the Santa Ana Sucker Conservation Plan
Page 131 San Marino Environmental Associates
middle or upper). The second order of stratification is only necessary if sampling occurs over significant changes in stream orders or physical changes (i.e. gradient or channel conformation). Habitat units must be classified over the stream length to be studied, and their areas estimated/calculated. Next, units to be sampled must be determined. Multiple units of each habitat type must be sampled within each stream unit. Independent counts of fish should be made by a team of two observers in each unit to be sampled. Observers enter downstream of the unit to be counted and proceed upstream, identifying species and age class (rough estimate) and counting individual fish. Observers should position themselves along the stream midline and coordinate their upstream movements. Counts must be made at a time of day when visibility is good. In the Hankin and Reeves’ (1988) study the technique was variably effective dependent on species and age class. Observer counts must be standardized for each species/age class and habitat type. Standardization is accomplished by selecting a subsample of each habitat type (using about one of every three or four of each habitat type as the subsample). Standardization is accomplished by electrofishing using a Moran-Zippin successive removal method (Seber 1973), which provides a population estimate independent of the diver counts. This is considered the optimal standardization method because many authors consider sequential removal by electroshocking a more accurate method of population size estimation (e.g. Gunderson 1993). The number of fish in habitat unit i can be estimated by: Pi = diR Where Pi = estimated population size in habitat unit i di = mean observer count in habitat unit i R = ∑i
P ei/∑ id where Pei is the population estimate obtained in selected units
by electrofishing
An analysis of the data in the Hankin and Reeves (1988) study demonstrated that the number of fish present was poorly correlated with the area of each habitat unit, so the total number of fish within a habitat type/location stratum (Ph) was estimated using the formula below:
Ph = ∑ =
n
iP
nN
1
Where P = estimated population size for the ith sampling unit in habitat type h N = total number of habitat units of type h present in the survey area n = number of habitat units of type h in the systematic sample

Year 2 Implementation of the Santa Ana Sucker Conservation Plan
Page 132 San Marino Environmental Associates
The variance of this estimate is a function of the variance of R, between-observer variance, and the variance in population size between habitat units. Hankin and Reeves (1988) an estimator for Var(P), which takes all these sources of variance into account. A more complex estimator, incorporating a measure of the size of each primary unit selected, may be preferable to the one presented above if the population size in the habitat units is highly correlated with area (Hankin 1984). The potential advantage of snorkeling is that the total number of habitat units for which fish numbers can be estimated is increased by the use of the technique. This increased first stage sampling fraction can result in a reduction of total errors of estimation because the variance contributions associated with second stage sampling (within habitat units) are expected to be relatively small. The potential drawbacks with snorkeling surveys are that the suckers are highly substrate associated so they are more difficult to locate, and experienced observers will be required. In the Hankin and Reeves (1988) study steelhead trout in pools were more closely associated with the substrate, this was interpreted as making them more difficult to observe; the result was that observer counts were not highly correlated with removal estimates. Additionally, snorkeling surveys do not allow collection of length-weight data, which may be used to evaluate fish condition. The length data can also be used to examine age class composition, and such data may be valuable in evaluating the status of the population, particularly over time. Mark-Recapture Estimates. Mark/recapture is one of the most common, easily performed and reliable methods of estimating fish population size. Mark/recapture is based on a simple principle. A sample of fish, n1, is taken from the population at time 1, each fish is given a recognizable, nondeliterious mark that will distinguish it from uncaptured individuals, and then the sample is returned to the population. At time 2, another sample, n2, is taken. The separation between time 1 and time 2 samples must be sufficient for the marked individuals to redistribute themselves among the population in the sampling area. We have found collection of the two samples 24 hours apart is appropriate. In the second sample m individuals are found which were previously marked. It is then assumed that the proportion of marked fish in the second sample is the same as the proportion of marked fish in the total population, N. Therefore: n1/N = m/n2 and an estimate of N, eN, can be calculated as: eN = n1n2/m This is the Petersen estimate of population size. It is the simplest form of mark/recapture, requiring only two samples and one type of mark. This method avoids the stress, and potential mortality, associated with the multiple captures that are necessary for other

Year 2 Implementation of the Santa Ana Sucker Conservation Plan
Page 133 San Marino Environmental Associates
mark/recapture methods. The method makes the following assumptions (Seber, 1973; Bejon, 1979):
1. The marks are not lost in the period between the two samples and are correctly recognized in recaptured specimens.
2. Being caught, handled and marked has no effect on the probability that the individual will be recaptured. 3. Capture, handling and marking have no effect on the probability that the individual will die or emigrate. 4. All fish, marked and unmarked, have the same probability of dying or
emigrating. 5. The population is sampled at random. These assumptions may be difficult to meet in a riverine system if emigration is high. The fish can be marked with Sudan Brown Y, a vital dye that is taken up by all tissues but rapidly metabolized from muscle while remaining for several days in the bony elements. This dye persists sufficiently to allow recognition of individuals of these species for several days following staining (Baskin and Haglund, Unpubl. data). In laboratory tests the dye did not induce mortality in stained fishes over a seven day examination period (Baskin, Unpubl. data). Using this method, the fish are stained by placing them in a container and allowing them to swim in water containing the dye (2ml saturated aqueous solution/liter water) for approximately one hour. This methodology reduces the handling of the fish to an absolute minimum. It is difficult to determine if the probability of capture is affected by previous encounter, but either seining or electroshocking can provide a random sample of fishes from the area being studied. Previous experience with this technique has shown that 24 hours allows a sufficient time interval for the fish to redistribute themselves within the capture area (the fish are manually released throughout the capture area following marking). Furthermore, mortality and emigration are minimized by using a 24 hour recapture period. This technique allows the collection of length-weight data, however seining would be a difficult capture technique, so electroshocking would be necessary. As a result, this technique doesn’t offer an advantage over depletion with an electroshocker. Seining Estimates. Seining will not be discussed in any detail here. Seining as a technique in the frequently swift, deep cobble substrate areas occupied by Santa Ana suckers is not an efficient capture technique, and reproducibility of effort is difficult. Techniques requiring seining are not recommended. Population Estimates Using Underwater Cameras. Although this sounds like a nice high tech solution to the sampling problem, it will likely be expensive, and there are many unknowns. Camera sleds have been successfully used in deepwater marine environments. Success is based on the assumption that there is neither avoidance of or attraction to the camera sled. Therefore reports of successful surveys usually involve sedentary species. Because this technique was largely developed as a marine

Year 2 Implementation of the Santa Ana Sucker Conservation Plan
Page 134 San Marino Environmental Associates
technique, transects were used. In a small stream two cameras (equivalent to two underwater observers) would have to be moved upstream. The cameras could either be mounted to provide two slightly different views as with the underwater observers or the two cameras could be forward facing and mounted in stereo configuration. Unless the cameras used are video cameras, there is the problem of photo interval and area calculation. Additionally because of the stratification recommended in the introduction, there would have to be surveys of different habitat boundaries, and we are not sure that habitat type boundaries would be readily discernable, particularly in still photos. Additionally, as previously mentioned, a technique that can produce length-weight data instead of just population size will be more useful in studying and understanding short and long term population trends. Conclusion. Based on the preceding discussion we recommend the use of a sequential removal technique using a backpack electroshocker to monitor Santa Ana sucker populations. If accord can be reached on this point, we will provide a more detailed protocol based on the recommended methodology. Literature Cited. Begon, M. 1979. Investigating Animal Abundance. Edward Arnold, London. Drake, D.P. and S. Sasaki. 1987. West Fork San Gabriel River Los Angeles County, field
study report. Unpubl. Report, California Dept of Fish and Game, Inland Fisheries, Long Beach.
Gunderson, D.R. 1993. Surveys of Fisheries Resources. John Wiley and Sons, New York. Haglund, T.R. and J.N. Baskin. 1991. Distribution of native fishes and trout in the West
Fork of the San Gabriel River, October, 1991. Unpubl. Rpt., L.A. Co. Dept. Public Works. 53p.
Hankin, D.G. 1984. Multistage sampling designs in fisheries research: Applications in small streams. Can. J. Aquat. Sci. 41:1575-1591. Hankin, D.G. and G.H. Reeves. 1988. Estimating total fish abundance and total habitat
area in small streams based on visual estimation methods. Can. J. Aquat. Sci. 45:834-844.
Moran, P.A. 1951. A mathematical theory of animal trapping. Biometrika 6:250-258. Platts, W.S., W.F. Megahan, and G.W. Minshall. 1983. Methods for evaluating stream, riparian, and biotic conditions. U.S. Forest Service Gen. Tech. Rpt. INT-138. Ricker, W.E. 1975. Computation and interpretation of biological statistics of fish populations. Bull. Fish. Res. Bd. Can. 191: 1-382

Year 2 Implementation of the Santa Ana Sucker Conservation Plan
Page 135 San Marino Environmental Associates
Seber, G.A.F. 1973. The Estimation of Animal Abundance and Related Parameters. Griffin, London. Seber, G.A.F. and E.D. LeCren. 1967. Estimating population parameters from catches large relative to the population. J. Anim. Ecol. 36: 631-643. Zippin, C. 1958. The removal method of population estimation. Wildl. Manage. 22: 82-90.

Year 2 Implementation of the Santa Ana Sucker Conservation Plan
Page 136 San Marino Environmental Associates
Appendix 4
Communications Regarding the Enhancement of Santa Ana Sucker Breeding Substrate in Sunnyslope Creek

Year 2 Implementation of the Santa Ana Sucker Conservation Plan
Page 137 San Marino Environmental Associates
San Marino Environmental Associates
MEMO
March 14, 2002 To: Mr. Juan Hernandez, Fishery Biologist California Department of Fish and Game From: Jonathan Baskin, Ph.D. Thomas Haglund, Ph.D. Principal Senior Scientists Re: Sunnyslope Creek – Santa Ana sucker habitat enhancement This is to follow through on our phone conversation last week in which I requested a Streambed Alteration Agreement to do habitat enhancement for the Santa Ana sucker (Catostomus santaanae) in Sunnyslope Creek, at the Louis Rubidoux Nature Center, in the Santa Ana River Wildlife Area, near the City of Riverside. The specific proposed activity is to add additional substrate gravel to the stream bottom in the creek to increase the amount of appropriate spawning habitat for the sucker. This species, along with most to the species in the family Catostomidae, is known to spawn in a gravel substrate. In 2001, as part of a study of the biology of this species in the Santa Ana River, sponsored by Santa Ana Water Project Authority, we observed spawning at two sites. One of these was in Sunnyslope Creek and the other in Rialto Drain, which were also sites where we observed sucker fry. At both of these sites, samples of the gravel substrate were taken at the exact spot where the spawning was observed, and analyzed for particle size distribution. The results of this analysis are attached here. We intend to add gravel of a similar nature to Sunnyslope Creek, anticipating that this will increase the area available for sucker spawning. We will implement this in a manner and time to avoid impacts to the suckers already present in the stream. This project is also sponsored by SAWPA. We have gotten verbal approval for this from the people at the Nature Center, which is of course contingent upon the approval of your department.
560 South Greenwood Avenue San Marino, California 91108-1270 (626) 792-2382

Year 2 Implementation of the Santa Ana Sucker Conservation Plan
Page 138 San Marino Environmental Associates
SMEA San Marino Environmental Associates
560 South Greenwood Avenue San Marino, California 91108 (626) 792-2382 fax 792-8233
Memo To: Lucy Caskey, U.S. Fish and Wildlife Service From: Jonathan N. Baskin and Thomas R. Haglund
Cc: Santa Ana Sucker Discussion Group
Date: June 10, 2002
Re: Sucker Breeding Habitat Enhancement Proposal - Revised
We propose to enhance and increase breeding habitat for Santa Ana suckers in Sunnyslope Creek of the Santa Ana River by adding appropriate gravel substrate. Suckers are known to be gravel spawners, as described in our 1999 Conservation Program. We directly observed sucker spawning and fry in Sunnyslope and Rialto creeks last year, and sampled the gravel where this spawning was observed. Analysis of this gravel (see attached graph) provides us with a good estimate of the characteristics of the substrate used by the suckers for spawning. We plan to place up to 15 cubic meters of river gravel of a similar size composition into specific spots in the lower approximately 300 meters of Sunnyslope Creek presently dominated by silt and sand, which is not used for spawning. These areas are downstream from the sites where we observed spawning and fry in the past two years. During this period we have always found fry in proximity to spawning gravels, which are not presently found in this lower part of the creek where we propose putting the gravel. The appearance of fry in this lower area during the breeding season following the addition of gravel here would be an indication that the suckers could have used the new gravel for spawning, and that our activities could be enhancing sucker breeding. We plan to implement this proposal after breeding has ended this year, but before flushing flows have begun in the fall. The site is located on the grounds of the Louis Rubidoux Nature Center, in the Santa Ana River Wildlife Area, near the City of Riverside. We have discussed this proposal with the authorities at the Nature Center and received their verbal approval. A written proposal has also been submitted to the Department of Fish and Game requesting Streambed Alteration Agreement, if it is necessary.

Year 2 Implementation of the Santa Ana Sucker Conservation Plan
Page 139 San Marino Environmental Associates
SMEA San Marino Environmental Associates
560 South Greenwood Avenue San Marino, California 91108 (626) 792-2382 fax 792-8233
Memo To: Lucy Caskey, U.S. Fish and Wildlife Service From: Jonathan N. Baskin and Thomas R. Haglund
Cc: Santa Ana Sucker Discussion Group
Date: September 16, 2002
Re: Sucker Breeding Habitat Enhancement Proposal - Revised
We propose to enhance and increase breeding habitat for Santa Ana suckers in Sunnyslope Creek of the Santa Ana River by adding appropriate gravel substrate. Suckers are known to be gravel spawners, as described in our 1999 Conservation Program. We directly observed sucker spawning and fry in Sunnyslope and Rialto creeks last year, and sampled the gravel where this spawning was observed. Analysis of this gravel (see attached graph) provides us with a good estimate of the characteristics of the substrate used by the suckers for spawning. We plan to place up to 5 cubic meters of river gravel of a similar size composition into specific spots in the lower approximately 300 meters of Sunnyslope Creek presently dominated by silt and sand, which is not presently used for spawning. The two specific spots we have tentatively selected have a maximum depth of about 0.5 meters, a with of 1.5 m and a length of about 5m. We plan to place the gravel into the stream by hand, and at time just after initial flushing flows in the upcoming wet season. We anticipate that the high flow will remove a large part of the sediment now present. The exact amount of gravel placed in to the stream will be determined by the depth of the water, flow and stream conditions at the time. The following questions remain to be resolved, based mainly on the funding resources available for this activity and anticipated environmental conditions:
1. Exact timing of gravel placement.
2. Source of the gravel to be used.
These areas are downstream from the sites where we observed spawning and fry in the past two years. During this period we have always found fry in proximity to spawning gravels, which are not presently found in this lower part of the creek where we propose putting the gravel. The appearance of fry in this lower area during the breeding season following the

Year 2 Implementation of the Santa Ana Sucker Conservation Plan
Page 140 San Marino Environmental Associates
addition of gravel here would be an indication that the suckers could have used the new gravel for spawning, and that our activities could be enhancing sucker breeding. The site is located on the grounds of the Louis Rubidoux Nature Center, in the Santa Ana River Wildlife Area, near the City of Riverside. We have discussed this proposal with the authorities at the Nature Center and received their verbal approval. A written proposal has also been submitted to the Department of Fish and Game requesting Streambed Alteration Agreement, if it is necessary. Preliminary discussions with Robert Smith of the Army Corps of Engineers indicate that no Corps permits will be necessary because the amount of gravel to be placed in the stream is small.

Year 2 Implementation of the Santa Ana Sucker Conservation Plan
Page 141 San Marino Environmental Associates
SMEA San Marino Environmental Associates
560 South Greenwood Avenue San Marino, California 91108 (626) 792-2382 fax 792-8233
Memo To: Mr. Ron Baxter Natural Resources Manager Riverside County Regional Parks and Open-space District
From: Jonathan Baskin, Ph.D. Thomas R. Haglund, Ph.D. Principal Senior Scientists
Date: January 18, 2004
Re: Sunnyslope Creek – Santa Ana sucker breeding habitat enhancement This is to follow through on our meeting last week in which we discussed our plan to do habitat enhancement for the Santa Ana sucker (Catostomus santaanae) in Sunnyslope Creek, at the Louis Rubidoux Nature Center, in the Santa Ana River Wildlife Area, near the City of Riverside. The specific proposed activity is to add additional substrate gravel to the stream bottom in the creek to increase the amount of appropriate spawning habitat for the sucker. This species, along with most to the species in the family Catostomidae, is known to spawn in a gravel substrate. We are requesting the approval of your department to implement this plan. In 2001, as part of an ongoing study of the biology of this species in the Santa Ana River, sponsored by Santa Ana Water Project Authority (SAWPA), Santa Ana Sucker Conservation Team, we observed spawning at two sites. One of these was in Sunnyslope Creek and the other in Rialto Drain, which were also sites where we observed very young suckers (fry). At both of these sites, samples of the gravel substrate were taken at the exact spot where the spawning was observed, and analyzed for particle size distribution. The results of this analysis are in our 2002 report (enclosed, pp. 54-58). Over the past 2 years we have noted many fewer sucker fry in the creek, and much less appropriate gravel substrate. Instead there is much more sand and silt substrate, and the gravel present is much more highly imbedded. This means that the gravel is at least partially buried in sand/silt, making it unsuitable for holding fish eggs and yolk-sac larvae. We

Year 2 Implementation of the Santa Ana Sucker Conservation Plan
Page 142 San Marino Environmental Associates
believe this increase in sand/silt is due to a lack of flushing water flow events in Sunnyslope creek in the past 2 years. We intend to add gravel of a similar nature to that found at the breeding site in Sunnyslope Creek, anticipating that this will increase the area available for sucker spawning. We will implement this in a manner and time to avoid impacts to the suckers already present in the stream. Barbara Ire, of the Rubidoux Nature Center is aware of our activities and plans. We have been in communication with the Department of Fish and Game (Raul Rodriquez and Juan Hernandez), U. S. Fish and Wildlife Service (Lucy Caskey) and the Army Corps of Engineers (Robert Smith) about this, and they have informally indicated support for this project. Mr. Smith has indicated that the amounts of gravel we intend to use are below the amount necessary for an Army Corps permit. The exact amounts and point of placement of the gravel in the creek, below the concrete lined channel will be determined by conditions at the time of implementation. .