san miguel corporation€¦ · · 2016-12-20san miguel corporation may 16, 2011 ... c o v e r s h...
TRANSCRIPT

SAN MIGUEL CORPORATION
May 16, 2011 The Philippine Stock Exchange, Inc. Disclosure Department 3rd Floor, Tower One and Exchange Plaza Ayala Triangle, Ayala Avenue Makati City Attention: Ms. Janet A. Encarnacion Head - Disclosure Department Gentlemen: We submit herewith the attached quarterly report (SEC Form 17-Q) of the Company for the period ended March 31, 2011.
C O V E R S H E E T
P W - 2 7 7 S. E. C. Registration Number
S A N
M I G U E L
C O R P O R A T I O N
(Company’s Full Name)
N o. 4 0 S a n M i g u e l A v e.
M a n d a l u y o n g C i t Y (Business Address: No. Street City/Town/Province)
Atty. Mary Rose S. Tan (632) 632-3000 Contact Person Company Telephone Number
SEC FORM 1 2 3 1 1 7 - Q Month Day FORM TYPE Month Day Annual Meeting
Secondary License Type, If Applicable
Dept. Requiring this Doc. Amended Articles Number/Section Total Amount of Borrowings Total No. of Stockholders Domestic Foreign ------------------------------------------------------------------------------------------------------------
To be accomplished by SEC Personnel concerned
____________________________ File Number LCU
____________________________ Document I. D. Cashier - - - - - - - - - - - - - - - - - - S T A M P S - - - - - - - - - - - - - - - - - - Remarks = pls. Use black ink for scanning purposes

SECURITIES AND EXCHANGE COMMISSION SEC FORM 17-Q
QUARTERLY REPORT PURSUANT TO SECTION 17 OF THE SECURITIES REGULATION CODE AND SRC RULE 17(2)(b) THEREUNDER
1. For the quarterly period ended March 31, 2011 2. Commission identification number PW00000227 3. BIR Tax Identification No 041-000-060-741 4. Exact name of issuer as specified in its charter SAN MIGUEL CORPORATION 5. Philippines Province, country or other jurisdiction of incorporation or organization 6. Industry Classification Code: (SEC Use Only) 7. No. 40 San Miguel Avenue, Mandaluyong City 1550 Address of issuer’s principal office Postal Code 8. (632) 632-3000 Issuer's telephone number, including area code
9. N/A Former name, former address and former fiscal year, if changed since last report 10.Securities registered pursuant to Sections 8 and 12 of the Code, or Sections 4 and 8 of the RSA Number of shares of common stock and
Debt outstanding (as of March 31, 2011) Common Shares 2,331,973,215 Preferred Shares 970,506,353 Total 3,302,479,568
Total Liabilities P566,857 million 11. Are any or all of the securities listed on a Stock Exchange? Yes [ x ] No [ ] If yes, state name of such Stock Exchange and the class/es of securities listed herein. Common Shares and Series “1” Preferred Shares - Philippine Stock Exchange 12. Indicate by check mark whether the registrant:
(a) has filed all reports required to be filed by Section 17 of the Code and SRC Rule 17 thereunder or Sections 11 of the RSA and RSA Rule 11(a)-1 thereunder, and Sections 26 and 141 of the Corporation Code of the Philippines, during the preceding twelve (12) months.
Yes [ x ] No [ ] (b) has been subject to such filing requirements for the past ninety (90) days. Yes [ x] No [ ]


- 1 -
SAN MIGUEL CORPORATION AND SUBSIDIARIES SELECTED NOTES TO THE CONSOLIDATED FINANCIAL STATEMENTS (Amounts in Millions, Except Per Share Data)
1. Summary of Significant Accounting and Financial Reporting Policies
The Group prepared its consolidated interim financial statements as of and for the period ended March 31, 2011 and comparative financial statements for the same period in 2010 following the new presentation rules under Philippine Accounting Standard (PAS) No. 34, Interim Financial Reporting. The consolidated financial statements of the Group have been prepared in compliance with Philippine Financial Reporting Standards (PFRS). The consolidated financial statements are presented in Philippine peso and all values are rounded to the nearest million (P=000,000), except when otherwise indicated.
The principal accounting policies and methods adopted in preparing the interim consolidated financial statements of the Group are the same as those followed in the most recent annual audited financial statements.
Adoption of New Standards, Amendments to Standards and Interpretations The Financial Reporting Standards Council (FRSC) approved the adoption of new or revised standards, amendments to standards, and interpretations as part of PFRS. Amendments to Standard and Interpretations Adopted in 2011 Starting January 1, 2011, the Group adopted the following amended PAS and Philippine Interpretations from International Financial Reporting Interpretation Committee (IFRIC):
Amendment to PAS 32, Financial Instruments: Presentation - Classification of Rights Issues, permits rights, options or warrants to acquire a fixed number of the entity’s own equity instruments for a fixed amount of any currency to be classified as equity instruments provided the entity offers the rights, options or warrants pro rata to all of its existing owners of the same class of its own non-derivative equity instruments. The amendment is effective for annual periods beginning on or after February 1, 2010.
Philippine Interpretation IFRIC 19, Extinguishing Financial Liabilities with Equity
Instruments, addresses issues in respect of the accounting by the debtor in a debt for equity swap transaction. It clarifies that equity instruments issued to a creditor to extinguish all or part of a financial liability in a debt for equity swap are consideration paid in accordance with PAS 39 paragraph 41. The interpretation is effective for annual periods beginning on or after July 1, 2010.
Revised PAS 24, Related Party Disclosures (2009), amends the definition of a
related party and modifies certain related party disclosure requirements for government-related entities. The revised standard is effective for annual periods beginning on or after January 1, 2011.
Prepayments of a Minimum Funding Requirement (Amendments to Philippine Interpretation IFRIC 14: PAS 19 - The Limit on a Defined Benefit Asset, Minimum Funding Requirements and their Interaction). These amendments remove unintended consequences arising from the treatment of prepayments where there is a minimum funding requirement and result in prepayments of contributions in certain circumstances being recognized as an asset rather than an expense. The amendments

- 2 -
are effective for annual periods beginning on or after January 1, 2011. Improvements to PFRSs 2010 contain 11 amendments to 6 standards and 1
interpretation, of which only the following are applicable to the Group. o PFRS 3. The amendments: (i) clarify that contingent consideration arising in a
business combination previously accounted for in accordance with PFRS 3 (2004) that remains outstanding at the adoption date of PFRS 3 (2008) continues to be accounted for in accordance with PFRS 3 (2004); (ii) limit the accounting policy choice to measure non-controlling interests upon initial recognition at fair value or at the non-controlling interest’s proportionate share of the acquiree’s identifiable net assets to instruments that give rise to a present ownership interest and that currently entitle the holder to a share of net assets in the event of liquidation; and (iii) expand the current guidance on the attribution of the market-based measure of an acquirer’s share-based payment awards issued in exchange for acquiree awards between consideration transferred and post-combination compensation cost when an acquirer is obliged to replace the acquiree’s existing awards to encompass voluntarily replaced unexpired acquiree awards. The amendments are effective for annual periods beginning on or after July 1, 2010.
o PAS 27. The amendments clarify that the consequential amendments to PAS 21, The Effects of Changes in Foreign Exchange Rates, PAS 28, Investments in Associates, and PAS 31, Interests in Joint Ventures, resulting from PAS 27 (2008) should be applied prospectively, with the exception of amendments resulting from renumbering. The amendments are effective for annual periods beginning on or after July 1, 2010.
o PFRS 7, Financial Instruments: Disclosures. The amendments add an explicit
statement that qualitative disclosure should be made in the context of the quantitative disclosures to better enable users to evaluate an entity’s exposure to risks arising from financial instruments. In addition, the IASB amended and removed existing disclosure requirements. The amendments are effective for annual periods beginning on or after January 1, 2011.
o PAS 1. The amendments clarify that disaggregation of changes in each
component of equity arising from transactions recognized in other comprehensive income also is required to be presented either in the statement of changes in equity or in the notes. The amendments are effective for annual periods beginning on or after January 1, 2011.
o PAS 34, Interim Financial Reporting. The amendments add examples to the list
of events or transactions that require disclosure under PAS 34 and remove references to materiality in PAS 34 that describes other minimum disclosures. The amendments are effective for annual periods beginning on or after January 1, 2011.
o Philippine Interpretation IFRIC 13, Customer Loyalty Programmes. The amendments clarify that the fair value of award credits takes into account the amount of discounts or incentives that otherwise would be offered to customers that have not earned the award credits. The amendments are effective for annual periods beginning on or after January 1, 2011.
The adoption of these foregoing new or revised standards, amendments to standards and Philippine Interpretations of IFRIC did not have a material effect on the interim consolidated financial statements.

- 3 -
2. Segment Information
Operating Segments The reporting format of the Group’s operating segments is determined by the Group’s risks and rates of return which are affected predominantly by differences in the products and services produced. The operating businesses are organized and managed separately according to the nature of the products produced and services provided, with each segment representing a strategic business unit that offers different products and serves different markets. The Group’s reportable segments are beverage, food, packaging, power, fuel and oil, infrastructure and telecommunications. The beverage segment produces and markets alcoholic and nonalcoholic beverages. The food segment includes, among others, poultry, feeds production and selling, livestock farming, processing and selling of basic meat products, processing and marketing of refrigerated and canned meat products, manufacturing and marketing of flour product, premixes and flour-based products, dairy-based products, breadfill desserts, cooking oil, importation and marketing coffee and coffee-related products and processed meats. The packaging segment is involved in the production and marketing of the following packaging products, among others, glass containers, glass molds, polyethylene terephthalate (PET) bottles and preforms, PET recycling, plastic closures, corrugated cartons, woven polypropylene, kraft sacks and paperboard, pallets, flexible packaging, plastic crates, plastic floorings, plastic films, plastic trays, plastic pails and tubs, crate and plastic pallet leasing, metal closures and two-piece aluminum cans, woven products, industrial laminates and radiant barriers. It is also involved in PET bottle filling graphics design, packaging research and testing, packaging development and consultation, contract packaging and trading. The power segment is engaged in power generation and mining. The power generation assets supply electricity to a variety of customers, including the Manila Electric Company (Meralco), electric cooperatives, industrial customers and the Philippine Wholesale Electricity Spot Market (WESM). The fuel and oil segment is engaged in refining and marketing of petroleum products. The infrastructure segment is engaged in the business of construction and development of various infrastructure projects such as roads, highways, toll roads, freeways, skyways, flyovers, viaducts and interchanges.
The telecommunications segment is engaged in rendering all types of domestic and international telecommunications services.
Inter-segment Transactions Segment revenues, expenses and performance include sales and purchases between operating segments. Transfer prices between operating segments are set on an arm’s length basis in a manner similar to transactions with third parties. Such transfers are eliminated in consolidation.
- 4 -
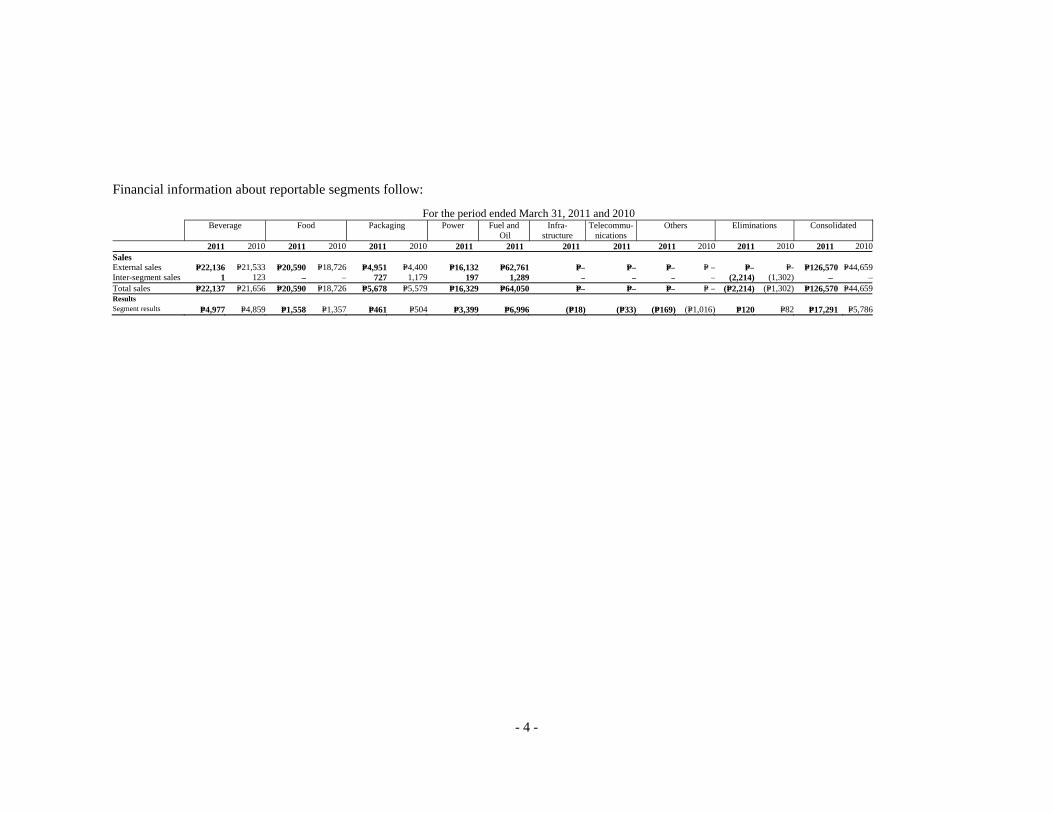
Financial information about reportable segments follow:
For the period ended March 31, 2011 and 2010 Beverage Food Packaging Power Fuel and
Oil Infra-
structure Telecommu-
nications Others Eliminations Consolidated
2011 2010 2011 2010 2011 2010 2011 2011 2011 2011 2011 2010 2011 2010 2011 2010Sales External sales P=22,136 P=21,533 P=20,590 P=18,726 P=4,951 P=4,400 P=16,132 P=62,761 P=– P=– P=– P= – P=– P=- P=126,570 P=44,659Inter-segment sales 1 123 – – 727 1,179 197 1,289 – – – – (2,214) (1,302) – –Total sales P=22,137 P=21,656 P=20,590 P=18,726 P=5,678 P=5,579 P=16,329 P=64,050 P=– P=– P=– P= – (P=2,214) (P=1,302) P=126,570 P=44,659Results Segment results P=4,977 P=4,859 P=1,558 P=1,357 P=461 P=504 P=3,399 P=6,996 (P=18) (P=33) (P=169) (P=1,016) P=120 P=82 P=17,291 P=5,786

- 5 -
3. Related Party Transactions
Transactions with related parties are made at normal market prices.
a. The Parent Company has advances to San Miguel Corporation Retirement Plan (SMCRP) amounting to P5,344 and P3,997 as of March 31, 2011 and December 31, 2010, respectively, subject to interest of 5.75% per annum included as part of “Trade and other receivables” account.
b. The Parent Company has advances to Top Frontier Investment Holdings, Inc. (Top Frontier) amounting to P2,517 and P2,543 as of March 31, 2011 and December 31, 2010, included as part of “Trade and other receivables” account.
c. San Miguel Properties, Inc. (SMPI) has advances from SMCRP amounting to P1,800 as of March 31, 2011 and December 31, 2010, included as part of “Accounts payable and accrued expenses” account. SMPI used the proceeds of the advances mainly for the acquisition of additional Bank of Commerce (BOC) shares of stock. As of March 31, 2011 and December 31, 2010, SMPI also has outstanding receivables from SMCRP amounting to P2 included as part of “Trade and other receivables” account.
d. The significant transactions of the Group and the Manila Electric Company (Meralco) include the following:
Sales
Purchases of
Utilities
Included under “Trade and other
receivables” account
Included under “Accounts
payable and accrued
expenses” account
March 31, 2011 P8,697 P136 P4,718 P30
December 31, 2010 P17,103 P490 P4,548 P43
As of March 31, 2011 and December 31, 2010, the Group has noncurrent receivables from and deposits to Meralco amounting to P84 and P87, respectively.
e. As of March 31, 2011 and December 31, 2010, the Group has outstanding receivables
from Liberty Telecommunications Holdings, Inc. amounting to P165 and P145, respectively, included as part of “Trade and other receivables” account.
f. As of March 31, 2011 and December 31, 2010, the Group has outstanding receivables from BOC amounting to P3 and P4, respectively, included as part of “Trade and other receivables” account.
g. As of March 31, 2011 and December 31, 2010, Petron Corporation (Petron) has noncurrent receivables of P21,003 and P22,435 from Petron Corporation Employee Retirement Plan. Such advance is subject to interest of 4% per annum.
h. As of March 31, 2011, Petron has noncurrent receivables of P650 from Petrochemical Asia (HK) Limited included as part of and “Other noncurrent assets” account.

- 6 -
4. Property, Plant and Equipment
Property, plant and equipment consist of:
March 31, 2011
January 1, 2011 Additions and
Transfers Disposals and
Reclassifications
CurrencyTranslation
Adjustments March 31, 2011 Cost:
Land and land improvements P=15,277 P=370 (P=107) (P=18) P=15,522 Buildings and improvements 32,224 235 5,788 (84) 38,163 Power plants 214,899 - - - 214,899 Refinery and plant equipment 37,286 3 6 - 37,295 Service stations and other equipment 5,319 71 34 - 5,424 Machinery and equipment 86,765 413 (4,227) (246) 82,705 Transportation equipment 8,615 68 (396) (1) 8,286 Tools and small equipment 2,327 115 (21) (24) 2,397 Office equipment, furniture and fixtures 4,194 57 (1,171) (5) 3,075 Molds 702 65 (28) - 739 Leasehold improvements 1,237 1 - - 1,238 Construction in progress 6,097 1,933 (32) 3 8,001
414,942 3,331 (154) (375) 417,744 Accumulated depreciation
and amortization: Land improvements P=2,462 P=35 (P=3) P=1 P=2,495 Buildings and improvements 10,732 256 (3,941) (31) 7,016 Power plants 5,611 1,344 - - 6,955 Refinery and plant equipment 16,545 515 (6) - 17,054 Service stations and other equipment 3,742 142 (14) - 3,870 Machinery and equipment 47,330 869 2,430 (133) 50,496 Transportation equipment 2,389 156 331 - 2,876 Tools and small equipment 1,691 (14) 42 (16) 1,703 Office equipment, furniture and fixtures 3,585 64 1,373 (3) 5,019 Molds 510 205 (165) - 550 Leasehold improvements 555 44 6 (1) 604 95,152 3,616 53 (183) 98,638
Accumulated impairment losses: Land improvements 412 - - - 412
Buildings and improvements 3,829 - - (9) 3,820 Machinery and equipment 7,403 - (8) (5) 7,390 Transportation equipment 12 - - - 12 Tools and small equipment 20 - - - 20 Office equipment, furniture
and fixtures 41
- - -
41 11,717 - (8) (14) 11,695 Net book value P= 308,073 (P=285) (P=199) (P=178) P=307,411
March 31, 2010
January 1, 2010 Additions and
Transfers Disposals and
Reclassifications
CurrencyTranslation
Adjustments March 31, 2010 Cost:
Land and land improvements P=10,627 P=24 (P=10) (P=12) P=10,629 Buildings and improvements 24,406 693 169 (396) 24,872 Machinery and equipment 78,891 634 370 (898) 78,997 Transportation equipment 3,305 458 - (11) 3,752 Tools and small equipment 2,354 39 (1) (31) 2,361 Office equipment, furniture and fixtures 2,542 15 7 (15) 2,549 Molds 657 39 (120) (3) 573 Leasehold improvements 921 30 17 (1) 967 Construction in progress 5,674 (766) 31 (21) 4,918
129,377 1,166 463 (1,388) 129,618 (forward)

- 7 -
January 1, 2010 Additions and
Transfers Disposals and
Reclassifications
CurrencyTranslation
Adjustments March 31, 2010 Accumulated depreciation
and amortization: Land improvements 1,154 24 (8) (2) 1,168 Buildings and improvements 6,731 243 40 (93) 6,921 Machinery and equipment 40,884 871 105 (327) 41,533 Transportation equipment 1,987 51 (10) (8) 2,020 Tools and small equipment 1,668 48 (6) (6) 1,704 Office equipment, furniture and fixtures 2,178 41 (1) (10) 2,208 Molds 511 23 (73) (2) 459 Leasehold improvements 372 12 18 - 402 55,485 1,313 65 (448) 56,415
Accumulated impairment losses: Land improvements 208 - 124 - 332
Buildings and improvements 2,313 - 61 (102) 2,272 Machinery and equipment 5,410 - 103 (229) 5,284 Transportation equipment 6 - - - 6 Tools and small equipment 13 - 1 (1) 13 Office equipment, furniture
and fixtures 20
- - (1)
19 Molds 3 - (3) - - 7,973 - 286 (333) 7,926
Depreciation and amortization charged to operations amounted to P=3,616 and P=1,313 in March 2011 and 2010, respectively.
5. Assets Held for Sale
Petron has an investment property consisting of office units located at Petron Mega Plaza which has a floor area of 21,216 square meters covering the 28th - 44th floors and 209 parking lots. On December 1, 2010, Petron’s BOD approved the sale of these properties to provide cash flows for various projects. The carrying amount of the investment property as of March 31, 2011 and December 31, 2010 of P823 is presented as “Assets held for sale” in the consolidated statement of financial position.
Total estimated fair value of the properties amounted to P1,242. Management expects to sell the properties within the next 12 months from the reporting date.
6. Basic and Diluted Earnings Per Share (EPS)
Basic EPS is computed by dividing the net income for the period attributable to equity holders of the Parent Company, net of dividends on preferred shares, by the weighted average number of issued and outstanding common shares during the period, with retroactive adjustment for any stock dividends declared. Diluted EPS is computed in the same manner, adjusted for the effects of the shares issuable to employees and executives under the Parent Company’s ESPP and LTIP, respectively, which are assumed to be exercised at the date of grant. Where the effect of the assumed conversion of shares issuable to employees and executives under the Parent Company’s stock purchase and option plans would be anti-dilutive, diluted EPS is not presented.

- 8 -
Basic and Diluted EPS is computed as follows: March 2011 2010Income attributable to equity holders of the
Parent Company P7,138 P2,896Less dividends on preferred shares for the period ((a) 1,456 1,456 Net income attributable to common
shareholders of the Parent Company (b) P5,682 P1,440
Weighted average number of common shares outstanding (in millions) - basic (c) 2,331 2,299Effect of dilution - common 14 17Weighted average number of common shares
outstanding (in millions) - diluted (d) 2,345 2,316
Weighted average number of preferred shares outstanding (in millions) (e) 971 971
Common: Basic EPS (b/c) P2.44 P0.63 Diluted EPS (b/d) P2.42 P0.62Preferred: Basic/Diluted EPS (a/e) P1.50 P1.50
7. Dividends
Cash dividends declared by the Parent Company’s Board of Director (BOD) to common shareholders amounted to P0.35 per share on March 14, 2011 (which was subsequently paid on April 11, 2011), and P1.05 per share as of March 2010. On January 20, 2011, the Parent Company’s BOD declared cash dividends at P1.50 per share, payable on February 18, 2011 to all preferred shareholders as of February 4, 2011. On January 6, 2010, the Parent Company’s BOD declared cash dividend of P1.50 per share to preferred shareholders of record as of October 5, 2009 (issue date). For preferred shareholders of record after issue date, dividend rate was adjusted proportionately. These dividends were paid on February 15, 2010 to all preferred stockholders of record as of January 22, 2010.
8. Financial Risk Management Objectives and Policies
Objectives and Policies The Group has significant exposure to the following financial risks primarily from its use of financial instruments:
• Interest rate risk • Foreign currency risk • Commodity price risk • Liquidity risk • Credit risk
This note presents information about the Group’s exposure to each of the foregoing risks, the Group’s objectives, policies and processes for measuring and managing these risks, and the Group’s management of capital.
- 9 -
The Group’s principal non-trade related financial instruments include cash and cash equivalents, available-for-sale (AFS) financial assets, short-term and long-term loans, and derivative instruments. These financial instruments, except derivative instruments, are used mainly for working capital management purposes. The Group’s trade-related financial assets and financial liabilities such as trade and other receivables, noncurrent receivables and deposits, accounts payable and accrued expenses, finance lease liabilities and other noncurrent liabilities arise directly from and are used to facilitate its daily operations. The Group’s outstanding derivative instruments such as commodity and currency options, forwards and swaps are intended mainly for risk management purposes. The Group uses derivatives to manage its exposures to foreign currency, interest rate and commodity price risks arising from the Group’s operating and financing activities. The BOD has the overall responsibility for the establishment and oversight of the Group’s risk management framework. The BOD has established the Risk Management Committee, which is responsible for developing and monitoring the Group’s risk management policies. The committee reports regularly to the BOD on its activities. The Group’s risk management policies are established to identify and analyze the risks faced by the Group, to set appropriate risk limits and controls, and to monitor risks and adherence to limits. Risk management policies and systems are reviewed regularly to reflect changes in market conditions and the Group’s activities. The Group, through its training and management standards and procedures, aims to develop a disciplined and constructive control environment in which all employees understand their roles and obligations. The Group’s Audit Committee oversees how management monitors compliance with the Group’s risk management policies and procedures, and reviews the adequacy of the risk management framework in relation to the risks faced by the Group. The Group Audit Committee is assisted in its oversight role by Internal Audit. Internal Audit undertakes both regular and ad hoc reviews of risk management controls and procedures, the results of which are reported to the Audit Committee. The Group’s accounting policies in relation to derivatives are set out in Note 9 to the consolidated financial statements. Interest Rate Risk Interest rate risk is the risk that future cash flows from a financial instrument (cash flow interest rate risk) or its fair value (fair value interest rate risk) will fluctuate because of changes in market interest rates. The Group’s exposure to changes in interest rates relates primarily to the Group’s long-term borrowings and investment securities. Investment acquired or borrowings issued at fixed rates expose the Group to fair value interest rate risk. On the other hand, investment securities acquired or borrowings issued at variable rates expose the Group to cash flow interest rate risk. The Group manages its interest cost by using an optimal combination of fixed and variable rate debt instruments. Management is responsible for monitoring the prevailing market-based interest rate and ensures that the mark-up rates charged on its borrowings are optimal and benchmarked against the rates charged by other creditor banks. On the other hand, the Group’s investment policy is to maintain an adequate yield to match or reduce the net interest cost from its borrowings pending the deployment of funds to their intended use in the Group’s operations and working capital management. However, the Group invests only in high-quality securities while maintaining the necessary diversification to avoid concentration risk.

- 10 -
In managing interest rate risk, the Group aims to reduce the impact of short-term fluctuations on the Group’s earnings. Over the longer term, however, permanent changes in interest rates would have an impact on profit or loss. The management of interest rate risk is also supplemented by monitoring the sensitivity of the Group’s financial instruments to various standard and non-standard interest rate scenarios. Interest rate movements affect reported equity in the following ways:
• retained earnings arising from increases or decreases in interest income or interest expense as well as fair value changes reported in profit or loss, if any;
• fair value reserves arising from increases or decreases in fair values of AFS financial assets reported as part of other comprehensive income; and
• hedging reserves arising from increases or decreases in fair values of hedging instruments designated in qualifying cash flow hedge relationships reported as part of other comprehensive income.
The sensitivity to a reasonably possible 1% increase in the interest rates, with all other variables held constant, would have decreased the Group’s profit before tax (through the impact on floating rate borrowings) by P897 and P464 in March 31, 2011 and 2010, respectively. A 1% decrease in the interest rate would have had the equal but opposite effect. These changes are considered to be reasonably possible given the observation of prevailing market conditions in those periods. There is no impact on the Group’s other comprehensive income.

Interest Rate Risk Table As at March 31, 2011 and December 31, 2010, the terms and maturity profile of the interest-bearing financial instruments, together with its gross amounts, are shown in the following tables:
March 31, 2011 <1 year 1-<2 years >2-<3 years >3-<4 years >4-<5 years >5 years Total Fixed rate
Philippine peso-denominated P7,918 P14,067 P1,747 P27,978 P1,062 P27,322 P80,094 Interest rate 6.5% - 9.33% 6.73% - 9.33% 7.25% - 9.33% 7.25% - 9.33% 5.4885% - 9.33% 7% - 10.5% Foreign currency-denominated
(expressed in Philippine peso) - - - - 13,017 - 13,017 Interest rate - - - - 7% -
Floating rate Philippine peso-denominated 2,500 1,000 850 800 11,550 - 16,700 Interest rate PDST-F + margin PDST-F + margin PDST-F + margin PDST-F + margin PDST-F + margin Foreign currency-denominated
(expressed in Philippine peso) 4,035 3,841 3,545 16,440 45,102 - 72,963
Interest rate LIBOR, THBFIX and
VNIBOR + margin LIBOR, THBFIX and
VNIBOR + margin LIBOR and THBFIX
+ margin LIBOR + margin LIBOR + margin P14,453 P18,908 P6,142 P45,218 P70,731 P27,322 P182,774
December 31, 2010 <1 year 1-<2 years >2-<3 years >3-<4 years >4-<5 years >5 years Total Fixed rate
Philippine peso-denominated P6,963 P15,004 P476 P29,249 P1,234 P27,322 P80,248 Interest rate 6.73% - 9.33% 6.5% - 9.33% 7.25% - 9.33% 7.25% - 9.33% 5.4885% - 9.33% 7% - 10.5%
Floating rate Philippine peso-denominated 1,667 2,000 1,000 800 11,550 - 17,017 Interest rate PDST-F +margin PDST-F +margin PDST-F +margin PDST-F +margin PDST-F +margin Foreign currency-denominated
(expressed in Philippine peso) 4,092 4,080 3,583 3,520 58,721 - 73,996
Interest rate LIBOR, THBFIX and
VNIBOR +margin LIBOR, THBFIX and
VNIBOR +margin LIBOR and THBFIX
+margin LIBOR and THBFIX
+margin LIBOR +margin P12,722 P21,084 P5,059 P33,569 P71,505 P27,322 P171,261

10
Foreign Currency Risk The Group’s functional currency is the Philippine peso, which is the denomination of the bulk of the Group’s revenues. The Group’s exposure to foreign currency risk results from significant movements in foreign exchange rates that adversely affect the foreign currency-denominated transactions of the Group. The Group’s risk management objective with respect to foreign currency risk is to reduce or eliminate earnings volatility and any adverse impact on equity. The Group enters into foreign currency hedges using a combination of non-derivative and derivative instruments such as foreign currency forwards, options or swaps to manage its foreign currency risk exposure. Short-term currency forward contracts (deliverable and non-deliverable) are entered into to manage foreign currency risks arising from importations, revenue and expense transactions, and other foreign currency-denominated obligations. Currency swaps are entered into to manage foreign currency risks relating to long-term foreign currency-denominated borrowings. Information on the Group’s foreign currency-denominated monetary assets and liabilities and their Philippine peso equivalents are as follows:
March 31, 2011 December 31, 2010
US
Dollar Peso Equivalent US
Dollar Peso Equivalent Assets Cash and cash equivalents US$1,553 US$67,345 US$1,456 P63,812 Trade and other receivables 877 38,008 297 13,042 AFS financial assets 30 1,303 50 2,188 Noncurrent receivables 7 296 4 151 2,467 106,952 1,807 79,193
Liabilities Drafts and loans payable 251 10,886 139 6,065 Accounts payable and accrued
expenses 1,780 77,236 965 42,290 Long-term debt (including current
maturities) 1,981 85,979 1,688 73,995 Finance lease liabilities 2,597 112,705 2,636 115,556 Other noncurrent liabilities 2 85 1 35 6,611 286,891 5,429 237,941
Net foreign currency- denominated monetary assets (liabilities) (US$4,144) (P179,939) (US$3,622) (P158,748)
The Group reported net foreign exchange gains (losses) amounting to P1,623 and (P244) in March 31, 2011 and 2010, respectively, with the translation of its foreign currency-denominated assets and liabilities. These mainly resulted from the movements of the Philippine peso against the US dollar as shown in the following table:
Peso to US DollarDecember 31, 2009 46.20March 31, 2010 45.17December 31, 2010 43.84March 31, 2011 43.39
The management of foreign currency risk is also supplemented by monitoring the sensitivity of the Group’s financial instruments to various foreign currency exchange rate scenarios. Foreign exchange movements affect reported equity in the following ways: • retained earnings arising from increases or decreases in unrealized and realized foreign
exchange gains or losses;

11
• translation reserves arising from increases or decreases in foreign exchange gains or losses recognized directly as part of other comprehensive income; and
• hedging reserves arising from increases or decreases in foreign exchange gains or losses of the hedged item and the hedging instrument.
The following table demonstrates the sensitivity to a reasonably possible change in the US dollar exchange rate, with all other variables held constant, of the Group’s profit before tax (due to changes in the fair value of monetary assets and liabilities) and the Group’s equity (due to changes in the fair value of monetary assets and liabilities, net of tax and due to translation of results and financial position of foreign operations) as of March 31, 2011 and December 31, 2010:
March 31, 2011 P1 decrease in the US dollar
exchange rate P1 increase in the US dollar
exchange rate
Effect on Income before
Income Tax Effect on
Equity
Effect on Income before
Income Tax Effect on
Equity Cash and cash equivalents (P1,417) (P1,127) P1,417 P1,127 Trade and other receivables (103) (846) 103 846 AFS financial assets - (46) - 46 Noncurrent receivables - (7) - 7 (1,520) (2,026) 1,520 2,026 Drafts and loans payable 7 261 (7) (261)Accounts payable and accrued
expenses 1,184 1,412 (1,184) (1,412)Long-term debt (including
current maturities) 1,963 1,393 (1,963) (1,393)Finance lease liabilities 2,597 1,818 (2,597) (1,818) Other noncurrent liabilities 1 1 (1) (1)
5,752 4,885 (5,752) (4,885)
P4,232 P2,859 (P4,232) (P2,859)
December 31, 2010
P1 decrease in the US dollar exchange rate
P1 increase in the US dollar exchange rate
Effect on Income before
Income Tax Effect on Equity
Effect on Income before
Income Tax Effect on Equity Cash and cash equivalents (P1,245) (P1,046) P1,245 P1,046 Trade and other receivables (105) (263) 105 263 AFS financial assets - (10) - 10 Noncurrent receivables - (4) - 4 (1,350) (1,323) 1,350 1,323 Drafts and loans payable 7 151 (7) (151)Accounts payable and accrued
expenses 915 486 (915) (486)Long-term debt (including
current maturities) 1,665 1,189 (1,665) (1,189)Finance lease liabilities 2,636 1,845 (2,636) (1,845)Other noncurrent liabilities - 1 - (1)
5,223 3,672 (5,223) (3,672)
P3,873 P2,349 (P3,873) (P2,349)
Exposures to foreign exchange rates vary during the period depending on the volume of overseas transactions. Nonetheless, the analysis above is considered to be representative of the Group’s currency risk.

12
Commodity Price Risk Commodity price risk is the risk that future cash flows from a financial instrument will fluctuate because of changes in commodity prices. The Group enters into various commodity derivatives to manage its price risks on strategic commodities. Commodity hedging allows stability in prices, thus offsetting the risk of volatile market fluctuations. Through hedging, prices of commodities are fixed at levels acceptable to the Group, thus protecting raw material cost and preserving margins. For hedging transactions, if prices go down, hedge positions may show marked-to-market losses; however, any loss in the marked-to-market position is offset by the resulting lower physical raw material cost. The Parent Company enters into commodity derivative transactions on behalf of its subsidiaries and affiliates to reduce cost by optimizing purchasing synergies within the Group and managing inventory levels of common materials. Commodity Swaps, Futures and Options. Commodity swaps, futures and options are used to manage the Group’s exposures to volatility in prices of certain commodities such as fuel oil, crude oil, aluminum, soybean meal and wheat. Commodity Forwards. The Group enters into forward purchases of various commodities. The prices of the commodity forwards are fixed either through direct agreement with suppliers or by reference to a relevant commodity price index. Liquidity Risk Liquidity risk pertains to the risk that the Group will encounter difficulty in meeting obligations associated with financial liabilities that are settled by delivering cash or another financial asset. The Group’s objectives to manage its liquidity risk are as follows: a) to ensure that adequate funding is available at all times; b) to meet commitments as they arise without incurring unnecessary costs; c) to be able to access funding when needed at the least possible cost; and d) to maintain an adequate time spread of refinancing maturities. The Group constantly monitors and manages its liquidity position, liquidity gaps or surplus on a daily basis. A committed stand-by credit facility from several local banks is also available to ensure availability of funds when necessary. The Group also uses derivative instruments such as forwards and swaps to manage liquidity.

13
The table below summarizes the maturity profile of the Group’s financial assets and financial liabilities based on contractual undiscounted payments used for liquidity management as of March 31, 2011 and December 31, 2010.
March 31, 2011
Carrying Amount
Contractual Cash Flow
1year or less
> 1 year - 2 years
>2 years - 5 years
Over 5 years
Financial Assets Cash and cash equivalents P126,403 P126,403 P126,403 P - P - P - Trade and other
receivables - net 75,934 75,934 75,934 - - - Derivative assets
(included under “Prepaid expenses and other current assets” account in the consolidated statements of financial position) 300 300 300 - - -
Financial assets at FVPL (included under “Prepaid expenses and other current assets” account in the consolidated statements of financial position) 177 177 177 - - -
AFS financial assets 2,722 2,722 - 2,722 - - Noncurrent receivables
and deposits - net (included under “Other noncurrent assets” account in the consolidated statements of financial position) 23,912 23,912 - 23,912 - -
Financial Liabilities Drafts and loans payable 67,652 68,119 68,119 - - - Accounts payable and
accrued expenses (excluding current retirement liabilities and IRO) 80,535 80,535 80,535 - - -
Derivative liabilities (included under “Accounts payable and accrued expenses” account in the consolidated statements of financial position) 234 234 234 - - -
Long-term debt (including current maturities) 180,435 212,292 23,895 25,540 134,563 28,294
Finance lease liabilities (including current portion) 207,158 282,853 12,668 17,187 57,051 195,947
Other noncurrent liabilities (excluding noncurrent retirement liabilities, ARO and IRO) 2,511
2,511 - 2,511 - -

14
December 31, 2010
Carrying Amount
Contractual Cash Flow
1year or less
> 1 year - 2 years
>2 years - 5 years
Over 5 years
Financial Assets Cash and cash equivalents P125,188 P125,188 P125,188 P - P - P - Trade and other
receivables - net 75,904 75,904 75,904 - - - Derivative assets
(included under “Prepaid expenses and other current assets” account in the consolidated statements of financial position) 249 249 249 - - -
Financial assets at FVPL (included under “Prepaid expenses and other current assets” account in the consolidated statements of financial position) 193 193 193 - - -
AFS financial assets 3,597 3,597 - 3,597 - - Noncurrent receivables
and deposits - net (included under “Other noncurrent assets” account in the consolidated statements of financial position) 24,783 24,783 - 24,783 - -
Financial Liabilities Drafts and loans payable 74,128 75,057 75,057 - - - Accounts payable and
accrued expenses (excluding current retirement liabilities and IRO) 69,198 69,198 69,198 - - -
Derivative liabilities (included under “Accounts payable and accrued expenses” account in the consolidated statements of financial position) 71 71 71 - - -
Long-term debt (including current maturities) 168,927 209,335 22,250 28,947 126,378 31,760
Finance lease liabilities (including current portion) 208,407 314,678 11,794 18,479 60,458 223,947
Other noncurrent liabilities (excluding noncurrent retirement liabilities, ARO and IRO) 16,168 16,168 - 16,168 - -
Credit Risk Credit risk is the risk of financial loss to the Group if a customer or counterparty to a financial instrument fails to meet its contractual obligations, and arises principally from the Group’s trade receivables and investment securities. The Group manages its credit risk mainly through the application of transaction limits and close risk monitoring. It is the Group’s policy to enter into

15
transactions with a wide diversity of creditworthy counterparties to mitigate any significant concentration of credit risk. The Group has regular internal control reviews to monitor the granting of credit and management of credit exposures. Trade and Other Receivables The Group’s exposure to credit risk is influenced mainly by the individual characteristics of each customer. However, management also considers the demographics of the Group’s customer base, including the default risk of the industry and country in which customers operate, as these factors may have an influence on the credit risk. Goods are subject to retention of title clauses so that in the event of default, the Group would have a secured claim. Where appropriate, the Group obtains collateral or arranges master netting agreements. The Group has established a credit policy under which each new customer is analyzed individually for creditworthiness before the Group’s standard payment and delivery terms and conditions are offered. The Group ensures that sales on account are made to customers with appropriate credit history. The Group has detailed credit criteria and several layers of credit approval requirements before engaging a particular customer or counterparty. The Group’s review includes external ratings, when available, and in some cases bank references. Purchase limits are established for each customer and are reviewed on a regular basis. Customers that fail to meet the Group’s benchmark creditworthiness may transact with the Group only on a prepayment basis. The Group establishes an allowance for impairment that represents its estimate of incurred losses in respect of trade and other receivables. The main components of this allowance are a specific loss component that relates to individually significant exposures, and a collective loss component established for groups of similar assets in respect of losses that have been incurred but not yet identified. The collective loss allowance is determined based on historical data of payment statistics for similar financial assets. Investments The Group recognizes provision for impairment losses based on specific and collective impairment tests, when objective evidence of impairment has been identified either on an individual account or on a portfolio level. Financial information on the Group’s maximum exposure to credit risk as of March 31, 2011 and December 31, 2010, without considering the effects of collaterals and other risk mitigation techniques, is presented below.
March 31, 2011 December 31, 2010 Cash and cash equivalents P126,403 P125,188 Trade and other receivables - net 75,934 75,904 Derivative assets 300 249 Financial assets at FVPL 177 193 AFS financial assets 2,722 3,597 Noncurrent receivables and deposits - net 23,912 24,783 P229,448 P229,914

16
The credit risk for cash and cash equivalents, derivative assets, financial assets at FVPL and AFS financial assets is considered negligible, since the counterparties are reputable entities with high quality external credit ratings. The Group’s exposure to credit risk arises from default of counterparty. Generally, the maximum credit risk exposure of receivables is its carrying amount without considering collaterals or credit enhancements, if any. The Group has no significant concentration of credit risk since the Group deals with a large number of homogenous trade customers. The Group does not execute any credit guarantee in favor of any counterparty.
Financial and Other Risks Relating to Livestock The Group is exposed to financial risks arising from the change in cost and supply of feed ingredients and the selling prices of chicken, hogs and cattle and related products, all of which are determined by constantly changing market forces of supply and demand, and other factors. The other factors include environmental regulations, weather conditions and livestock diseases for which the Group has little control. The mitigating factors are listed below. • The Group is subject to risks affecting the food industry, generally, including risks posed by
food spoilage and contamination. Specifically, the fresh meat industry is regulated by environmental, health and food safety organizations and regulatory sanctions. The Group has put into place systems to monitor food safety risks throughout all stages of manufacturing and processing to mitigate these risks. Furthermore, representatives from the government regulatory agencies are present at all times during the processing of dressed chicken in all dressing plants and issue certificates accordingly. The authorities, however, may impose additional regulatory requirements that may require significant capital investment at short notice.
• The Group is subject to risks relating to its ability to maintain animal health status
considering that it has no control over neighboring livestock farms. Livestock health problems could adversely impact production and consumer confidence. However, the Group monitors the health of its livestock on a daily basis and proper procedures are put in place.
• The livestock industry is exposed to risk associated with the supply and price of raw
materials, mainly grain prices. Grain prices fluctuate depending on the harvest results. The shortage in the supply of grain will result in adverse fluctuation in the price of grain and will ultimately increase the Group’s production cost. If necessary, the Group enters into forward contracts to secure the supply of raw materials at reasonable price.
Other Market Price Risk The Group’s market price risk arises from its investments carried at fair value (FVPL and AFS financial assets). The Group manages its risk arising from changes in market price by monitoring the changes in the market price of the investments. Capital Management The primary objective of the Group’s capital management is to ensure that it maintains a strong credit rating and healthy capital ratios in order to support its business and maximize shareholder value. The Group manages its capital structure and makes adjustments, in the light of changes in economic conditions. To maintain or adjust the capital structure, the Group may adjust the
17
dividend payment to shareholders, pay-off existing debts, return capital to shareholders or issue new shares. The Group defines capital as paid-in capital stock, additional paid-in capital and retained earnings, both appropriated and unappropriated. Other components of equity such as treasury stock and cumulative translation adjustments are excluded from capital for purposes of capital management. The BOD has overall responsibility for monitoring capital in proportion to risk. Profiles for capital ratios are set in the light of changes in the Group’s external environment and the risks underlying the Group’s business, operation and industry. The Group monitors capital on the basis of debt-to-equity ratio, which is calculated as total debt divided by total equity. Total debt is defined as total current liabilities and total noncurrent liabilities, while equity is total equity as shown in the consolidated statements of financial position. There were no changes in the Group’s approach to capital management during the period.
9. Financial Assets and Financial Liabilities Date of Recognition. The Group recognizes a financial asset or a financial liability in the consolidated statements of financial position when it becomes a party to the contractual provisions of the instrument. In the case of a regular way purchase or sale of financial assets, recognition is done using settlement date accounting. Initial Recognition of Financial Instruments. Financial instruments are recognized initially at fair value of the consideration given (in case of an asset) or received (in case of a liability). The initial measurement of financial instruments, except for those designated at fair value through profit or loss (FVPL), includes transaction costs. The Group classifies its financial assets in the following categories: held-to-maturity (HTM) investments, AFS financial assets, financial assets at FVPL and loans and receivables. The Group classifies its financial liabilities as either financial liabilities at FVPL or other liabilities. The classification depends on the purpose for which the investments are acquired and whether they are quoted in an active market. Management determines the classification of its financial assets and financial liabilities at initial recognition and, where allowed and appropriate, re-evaluates such designation at every reporting date. Determination of Fair Value. The fair value for financial instruments traded in active markets at the reporting date is based on their quoted market price or dealer price quotations (bid price for long positions and ask price for short positions), without any deduction for transaction costs. When current bid and ask prices are not available, the price of the most recent transaction provides evidence of the current fair value as long as there is no significant change in economic circumstances since the time of the transaction. For all other financial instruments not listed in an active market, the fair value is determined by using appropriate valuation techniques. Valuation techniques include the discounted cash flow method, comparison to similar instruments for which market observable prices exist, options pricing models and other relevant valuation models.

18
Day 1 Profit. Where the transaction price in a non-active market is different from the fair value of the other observable current market transactions in the same instrument or based on a valuation technique whose variables include only data from observable market, the Group recognizes the difference between the transaction price and fair value (a ‘Day 1’ profit) in profit or loss unless it qualifies for recognition as some other type of asset. In cases where use is made of data which are not observable, the difference between the transaction price and model value is only recognized in profit or loss when the inputs become observable or when the instrument is derecognized. For each transaction, the Group determines the appropriate method of recognizing the ‘Day 1’ profit amount. Financial Assets Financial Assets at FVPL. A financial asset is classified at FVPL if it is classified as held for trading or is designated as such upon initial recognition. Financial assets are designated at FVPL if the Group manages such investments and makes purchase and sale decisions based on their fair value in accordance with the Group’s documented risk management or investment strategy. Derivative instruments (including embedded derivatives), except those covered by hedge accounting relationships, are classified under this category. Financial assets are classified as held for trading if they are acquired for the purpose of selling in the near term. Financial assets may be designated by management at initial recognition as at FVPL, when any of the following criteria is met: the designation eliminates or significantly reduces the inconsistent treatment that would
otherwise arise from measuring the assets or recognizing gains or losses on a different basis; the assets are part of a group of financial assets which are managed and their performances are
evaluated on a fair value basis, in accordance with a documented risk management or investment strategy; or
the financial instrument contains an embedded derivative, unless the embedded derivative does
not significantly modify the cash flows or it is clear, with little or no analysis, that it would not be separately recognized.
The Group carries financial assets at FVPL using their fair values. Attributable transaction costs are recognized in profit or loss as incurred. Fair value changes and realized gains or losses are recognized in profit or loss. Fair value changes from derivatives accounted for as part of an effective accounting hedge are recognized in other comprehensive income and presented under the “Hedging reserve” account in equity. Any interest earned shall be recognized as part of “Interest income” in the consolidated statements of income. Any dividend income from equity securities classified as FVPL shall be recognized in profit or loss when the right to receive payment has been established. The Group’s derivative assets and financial assets at FVPL are classified under this category. The combined carrying amounts of financial assets under this category amounted to P477 and P442 as of March 31, 2011 and December 31, 2010, respectively. Loans and Receivables. Loans and receivables are non-derivative financial assets with fixed or determinable payments and maturities that are not quoted in an active market. They are not entered

19
into with the intention of immediate or short-term resale and are not designated as AFS financial assets or financial assets at FVPL. Subsequent to initial measurement, loans and receivables are carried at amortized cost using the effective interest rate method, less any impairment in value. Any interest earned on loans and receivables shall be recognized as part of “Interest income” in the consolidated statements of income on an accrual basis. Amortized cost is calculated by taking into account any discount or premium on acquisition and fees that are integral part of the effective interest rate. The periodic amortization is also included as part of “Interest income” in the consolidated statements of income. Gains or losses are recognized in profit or loss when loans and receivables are derecognized or impaired, as well as through the amortization process. Cash includes cash on hand and in banks which are stated at face value. Cash equivalents are short-term, highly liquid investments that are readily convertible to known amounts of cash and which are subject to an insignificant risk of changes in value. The Group’s cash and cash equivalents, trade and other receivables and noncurrent receivables and deposits are included in this category. The combined carrying values of financial assets under this category amounted to P226,249 and P225,875 as of March 31, 2011 and December 31, 2010, respectively. HTM Investments. HTM investments are quoted non-derivative financial assets with fixed or determinable payments and fixed maturities for which the Group’s management has the positive intention and ability to hold to maturity. Where the Group sells other than an insignificant amount of HTM investments, the entire category would be tainted and reclassified as AFS financial assets. After initial measurement, these investments are measured at amortized cost using the effective interest rate method, less impairment in value. Any interest earned on the HTM investments shall be recognized as part of “Interest income” in the consolidated statements of income on an accrual basis. Amortized cost is calculated by taking into account any discount or premium on acquisition and fees that are integral part of the effective interest rate. The periodic amortization is also included as part of “Interest income” in the consolidated statements of income. Gains or losses are recognized in profit or loss when the HTM investments are derecognized or impaired, as well as through the amortization process. As of March 31, 2011 and December 31, 2010, the Group has no investments accounted for under this category. AFS Financial Assets. AFS financial assets are non-derivative financial assets that are either designated in this category or not classified in any of the other financial asset categories. Subsequent to initial recognition, AFS financial assets are measured at fair value and changes therein, other than impairment losses and foreign currency differences on AFS debt instruments, are recognized in other comprehensive income and presented in the “Fair value reserve” in equity. The effective yield component of AFS debt securities is reported as part of “Interest income” in the consolidated statements of income. Dividends earned on holding AFS equity securities are recognized as “Dividend income” when the right to receive payment has been established. When individual AFS financial assets are either derecognized or impaired, the related accumulated unrealized gains or losses previously reported in equity are transferred to and recognized in profit or loss. AFS financial assets also include unquoted equity instruments with fair values which cannot be reliably determined. These instruments are carried at cost less impairment in value, if any.
20
The Group’s investments in equity securities included under “Available-for-sale financial assets” account are classified under this category. The carrying amounts of financial assets under this category amounted to P2,722 and P3,597 as of March 31, 2011 and December 31, 2010, respectively. Financial Liabilities Financial Liabilities at FVPL. Financial liabilities are classified under this category through the fair value option. Derivative instruments (including embedded derivatives) with negative fair values, except those covered by hedge accounting relationships, are also classified under this category. The Group carries financial liabilities at FVPL using their fair values and reports fair value changes in profit or loss. Fair value changes from derivatives accounted for as part of an effective accounting hedge are recognized in other comprehensive income and presented under the “Hedging reserve” account in equity. Any interest expense incurred shall be recognized as part of “Interest expense” in the consolidated statements of income. The Group’s derivative liabilities are classified under this category. The carrying amounts of financial liabilities under this category amounted to P234 and P71 as of March 31, 2011 and December 31, 2010, respectively. Other Financial Liabilities. This category pertains to financial liabilities that are not designated or classified as at FVPL. After initial measurement, other financial liabilities are carried at amortized cost using the effective interest rate method. Amortized cost is calculated by taking into account any premium or discount and any directly attributable transaction costs that are considered an integral part of the effective interest rate of the liability. Included in this category are the Group’s liabilities arising from its trade or borrowings such as drafts and loans payable, accounts payable and accrued expenses, long-term debt, finance lease liabilities and other noncurrent liabilities. The combined carrying amounts of financial liabilities under this category amounted to P538,291 and P536,828 as of March 31, 2011 and December 31, 2010, respectively. Debt Issue Costs Debt issue costs are considered as an adjustment to the effective yield of the related debt and are deferred and amortized using the effective interest rate method. When a loan is paid, the related unamortized debt issue costs at the date of repayment are recognized in profit or loss. Derecognition of Financial Assets and Financial Liabilities Financial Assets. A financial asset (or, where applicable, a part of a financial asset or part of a group of similar financial assets) is derecognized when: the rights to receive cash flows from the asset expired;
the Group retains the right to receive cash flows from the asset, but has assumed an obligation to
pay them in full without material delay to a third party under a “pass-through” arrangement; or

21
the Group has transferred its rights to receive cash flows from the asset and either: (a) has transferred substantially all the risks and rewards of the asset; or (b) has neither transferred nor retained substantially all the risks and rewards of the asset, but has transferred control of the asset.
When the Group has transferred its rights to receive cash flows from an asset and has neither transferred nor retained substantially all the risks and rewards of the asset nor transferred control of the asset, the asset is recognized to the extent of the Group’s continuing involvement in the asset. Continuing involvement that takes the form of a guarantee over the transferred asset is measured at the lower of the original carrying amount of the asset and the maximum amount of consideration that the Group could be required to repay. Financial Liabilities. A financial liability is derecognized when the obligation under the liability is discharged, cancelled or expired. When an existing financial liability is replaced by another from the same lender on substantially different terms, or the terms of an existing liability are substantially modified, such an exchange or modification is treated as a derecognition of the original liability and the recognition of a new liability. The difference in the respective carrying amounts is recognized in profit or loss. Impairment of Financial Assets The Group assesses at reporting date whether a financial asset or group of financial assets is impaired. A financial asset or a group of financial assets is deemed to be impaired if, and only if, there is objective evidence of impairment as a result of one or more events that have occurred after the initial recognition of the asset (an incurred loss event) and that loss event has an impact on the estimated future cash flows of the financial asset or the group of financial assets that can be reliably estimated. Assets Carried at Amortized Cost. For assets carried at amortized cost such as loans and receivables, the Group first assesses whether objective evidence of impairment exists individually for financial assets that are individually significant, or collectively for financial assets that are not individually significant. If no objective evidence of impairment has been identified for a particular financial asset that was individually assessed, the Group includes the asset as part of a group of financial assets pooled according to their credit risk characteristics and collectively assesses the group for impairment. Assets that are individually assessed for impairment and for which an impairment loss is, or continues to be, recognized are not included in the collective impairment assessment. Evidence of impairment for specific impairment purposes may include indications that the borrower or a group of borrowers is experiencing financial difficulty, default or delinquency in principal or interest payments, or may enter into bankruptcy or other form of financial reorganization intended to alleviate the financial condition of the borrower. For collective impairment purposes, evidence of impairment may include observable data on existing economic conditions or industry-wide developments indicating that there is a measurable decrease in the estimated future cash flows of the related assets. If there is objective evidence of impairment, the amount of loss is measured as the difference between the asset’s carrying amount and the present value of estimated future cash flows (excluding future credit losses) discounted at the financial asset’s original effective interest rate (i.e., the effective interest rate computed at initial recognition). Time value is generally not considered when the effect of discounting the cash flows is not material. If a loan or receivable has a variable rate, the discount rate for measuring any impairment loss is the current effective interest rate, adjusted for the

22
original credit risk premium. For collective impairment purposes, impairment loss is computed based on their respective default and historical loss experience. The carrying amount of the asset shall be reduced either directly or through use of an allowance account. The impairment loss for the period shall be recognized in profit or loss. If, in a subsequent period, the amount of the impairment loss decreases and the decrease can be related objectively to an event occurring after the impairment was recognized, the previously recognized impairment loss is reversed. Any subsequent reversal of an impairment loss is recognized in profit or loss, to the extent that the carrying amount of the asset does not exceed its amortized cost at the reversal date. AFS Financial Assets. If an AFS financial asset is impaired, an amount comprising the difference between the cost (net of any principal payment and amortization) and its current fair value, less any impairment loss on that financial asset previously recognized in profit or loss, is transferred from equity to profit or loss. Reversals in respect of equity instruments classified as AFS financial assets are not recognized in profit or loss. Reversals of impairment losses on debt instruments are recognized in profit or loss, if the increase in fair value of the instrument can be objectively related to an event occurring after the impairment loss was recognized in profit or loss. In the case of an unquoted equity instrument or of a derivative asset linked to and must be settled by delivery of an unquoted equity instrument, for which its fair value cannot be reliably measured, the amount of impairment loss is measured as the difference between the asset’s carrying amount and the present value of estimated future cash flows from the asset discounted using its historical effective rate of return on the asset. Classification of Financial Instruments Between Debt and Equity From the perspective of the issuer, a financial instrument is classified as debt instrument if it provides for a contractual obligation to: deliver cash or another financial asset to another entity;
exchange financial assets or financial liabilities with another entity under conditions that are
potentially unfavorable to the Group; or satisfy the obligation other than by the exchange of a fixed amount of cash or another financial
asset for a fixed number of own equity shares. If the Group does not have an unconditional right to avoid delivering cash or another financial asset to settle its contractual obligation, the obligation meets the definition of a financial liability. Offsetting Financial Instruments Financial assets and financial liabilities are offset and the net amount is reported in the consolidated statements of financial position if, and only if, there is a currently enforceable legal right to offset the recognized amounts and there is an intention to settle on a net basis, or to realize the asset and settle the liability simultaneously. This is not generally the case with master netting agreements, and the related assets and liabilities are presented gross in the consolidated statements of financial position.

23
The table below presents a comparison by category of carrying amounts and fair values of the Group’s financial instruments as of March 31, 2011 December 31, 2010:
March 31, 2011 December 31, 2010
Carrying
Amount Fair
Value Carrying
Amount Fair
Value Financial Assets Cash and cash equivalents P126,403 P126,403 P125,188 P125,188 Trade and other receivables - net 75,934 75,934 75,904 75,904 Derivative assets (included under “Prepaid
expenses and other current assets” account in the consolidated statements of financial position) 300 300 249 249
Financial assets at FVPL (included under “Prepaid expenses and other current assets” account in the consolidated statements of financial position) 177 177 193 193
AFS financial assets 2,722 2,722 3,597 3,597 Noncurrent receivables and deposits - net
(included under “Other noncurrent assets” account in the consolidated statements of financial position) 23,912 23,912 24,783 24,783
Financial Liabilities Drafts and loans payable 67,652 67,652 74,128 74,128 Accounts payable and accrued expenses
(excluding current retirement liabilities and IRO) 80,535 80,535 69,198 69,198
Derivative liabilities (included under “Accounts payable and accrued expenses” account in the consolidated statements of financial position) 234 234 71 71
Long-term debt (including current maturities) 180,435 194,243 168,927 182,030 Finance lease liabilities (including current
portion) 207,158 207,158 208,407 208,407 Other noncurrent liabilities (excluding
noncurrent retirement liabilities, ARO and IRO) 2,511 2,511 16,168 15,764
The following methods and assumptions are used to estimate the fair value of each class of financial instruments: Cash and Cash Equivalents, Trade and Other Receivables and Noncurrent Receivables and Deposits. The carrying amount of cash and cash equivalents and receivables approximates fair value primarily due to the relatively short-term maturities of these financial instruments. In the case of long-term receivables, the fair value is based on the present value of expected future cash flows using the applicable discount rates based on current market rates of identical or similar quoted instruments. Derivatives. The fair values of forward exchange contracts are calculated by reference to current forward exchange rates. In the case of freestanding currency and commodity derivatives, the fair values are determined based on quoted prices obtained from their respective active markets. Fair values for stand-alone derivative instruments that are not quoted from an active market and for embedded derivatives are based on valuation models used for similar instruments using both observable and non-observable inputs.

24
Financial Assets at FVPL and AFS Financial Assets. The fair values of publicly traded instruments and similar investments are based on quoted market prices in an active market. For debt instruments with no quoted market prices, a reasonable estimate of their fair values is calculated based on the expected cash flows from the instruments discounted using the applicable discount rates of comparable instruments quoted in active markets. Unquoted equity securities are carried at cost less impairment. Drafts and Loans Payable and Accounts Payable and Accrued Expenses. The carrying amount of drafts and loans payable and accounts payable and accrued expenses approximates fair value due to the relatively short-term maturities of these financial instruments. Long-term Debt, Finance Lease Liabilities and Other Noncurrent Liabilities. The fair value of interest-bearing fixed-rate loans is based on the discounted value of expected future cash flows using the applicable market rates for similar types of instruments as of reporting date. As of March 31, 2011 and December 31, 2010, discount rates used for Philippine peso-denominated loans range from 1.3% to 6.9% and 1.3% to 5.7%, respectively. The discount rates used for foreign currency-denominated loans range from 0.3% to 2.8% as of March 31, 2011. The Group has no foreign currency-denominated fixed-rate loans as of December 31, 2010. The carrying amounts of floating rate loans with quarterly interest rate repricing approximate their fair values. Derivative Financial Instruments The Group’s derivative financial instruments according to the type of financial risk being managed and the details of freestanding and embedded derivative financial instruments that are categorized into those accounted for as hedges and those that are not designated as hedges are discussed below. The Group enters into various currency and commodity derivative contracts to manage its exposure on foreign currency and commodity price risk. The portfolio is a mixture of instruments including forwards, swaps and options. Derivative Instruments Accounted for as Hedges Freestanding Derivatives For the purpose of hedge accounting, hedges are classified as either: a) fair value hedges when hedging the exposure to changes in the fair value of a recognized asset or liability or an unrecognized firm commitment (except for foreign currency risk); b) cash flow hedges when hedging exposure to variability in cash flows that is either attributable to a particular risk associated with a recognized asset or liability or a highly probable forecast transaction or the foreign currency risk in an unrecognized firm commitment; or c) hedges of a net investment in foreign operations. At the inception of a hedge relationship, the Group formally designates and documents the hedge relationship to which the Group wishes to apply hedge accounting and the risk management objective and strategy for undertaking the hedge. The documentation includes identification of the hedging instrument, the hedged item or transaction, the nature of the risk being hedged and how the entity will assess the hedging instrument’s effectiveness in offsetting the exposure to changes in the hedged item’s fair value or cash flows attributable to the hedged risk. Such hedges are expected to be highly effective in achieving offsetting changes in fair value or cash flows and are assessed on an on-going basis to determine that they actually have been highly effective throughout the financial reporting periods for which they were designated.

25
Fair Value Hedge. Derivatives classified as fair value hedges are carried at fair value with corresponding change in fair value recognized in profit or loss. The carrying amount of the hedged asset or liability is also adjusted for changes in fair value attributable to the hedged item and the gain or loss associated with that remeasurement is also recognized in profit or loss. When the hedge ceases to be highly effective, hedge accounting is discontinued and the adjustment to the carrying amount of a hedged financial instrument is amortized immediately. The Group discontinues fair value hedge accounting if the hedging instrument expires, is sold, terminated or exercised, the hedge no longer meets the criteria for hedge accounting or the Group revokes the designation. As of March 31, 2011 and December 31, 2010, the Group has no outstanding derivatives accounted for as fair value hedges. Cash Flow Hedge. Changes in the fair value of a hedging instrument that qualifies as a highly effective cash flow hedge are recognized in other comprehensive income and presented under the “Hedging reserve” account in equity. The ineffective portion is immediately recognized in profit or loss. If the hedged cash flow results in the recognition of an asset or a liability, all gains and losses previously recognized directly in equity are transferred from equity and included in the initial measurement of the cost or carrying value of the asset or liability. Otherwise, for all other cash flow hedges, gains and losses initially recognized in equity are transferred from equity to profit or loss in the same period or periods during which the hedged forecasted transaction or recognized asset or liability affect profit or loss. When the hedge ceases to be highly effective, hedge accounting is discontinued prospectively. The cumulative gain or loss on the hedging instrument that has been reported directly in equity is retained in equity until the forecasted transaction occurs. When the forecasted transaction is no longer expected to occur, any net cumulative gain or loss previously reported in equity is recognized in profit or loss. As of March 31, 2011 and December 31, 2010, the Group has no outstanding derivatives accounted for as cash flow hedge. Net Investment Hedge. As of March 31, 2011 and December 31, 2010, the Group has no hedge of a net investment in a foreign operation.

26
Other Derivative Instruments Not Designated as Hedges The Group enters into certain derivatives as economic hedges of certain underlying exposures. These include freestanding and embedded derivatives found in host contracts, which are not designated as accounting hedges. Changes in fair value of these instruments are accounted for directly in profit or loss. Details are as follows: Freestanding Derivatives Freestanding derivatives consist of commodity and currency derivatives entered into by the Group. Currency Forwards As of March 31, 2011 and December 31, 2010, the Group has outstanding foreign currency forward contracts with aggregate notional amount of US$552 and US$110, respectively, and with various maturities up to December 2011. As of March 31, 2011 and December 31, 2010, the net negative fair value of these currency forwards amounted to P36 and P8, respectively. Currency Options The Group entered into short-term currency options with an aggregate notional amount of US$690 and with net negative fair value of P40 as of March 31, 2011. The Group has no outstanding currency option agreements as of December 31, 2010. Commodity Swaps The Group has outstanding swap agreements covering its aluminum requirements, with various maturities in 2011. Under the agreement, payment is made either by the Group or its counterparty for the difference between the agreed fixed price of aluminum and the price based on the relevant price index. The outstanding equivalent notional quantity covered by the commodity swaps as of December 31, 2010 is 450 metric tons. As of December 31, 2010, the positive fair value of these swaps amounted to P16. As of March, 31, 2011, there were no outstanding swaps on the purchase of aluminum. The Group has outstanding swap agreements covering its oil requirements, with various maturities in 2011. Under the agreement, payment is made either by the Group or its counterparty for the difference between the hedged fixed price and the relevant monthly average index price. The outstanding equivalent notional quantity covered by the commodity swaps as of March 31, 2011 and December 31, 2010 is 5.0 and 1.5 million barrels, respectively. As of March 31, 2011 and December 31, 2010, the negative fair value of these swaps amounted to P584 and P32, respectively. Commodity Options The Group has outstanding bought and sold options covering its wheat requirements with notional quantities as of March 31, 2011 and December 31, 2010 of 97,296 and 49,532 metric tons, respectively. These options can be exercised at various calculation dates in 2011 with specified quantities on each calculation date. As of March 31, 2011 and December 31, 2010, the net positive fair value of these options amounted to P34 and P54, respectively. As of March 31, 2011 and December 31, 2010, the Group has outstanding commodity options covering its crude oil requirements with notional quantity of 1.7 and 2.8 million barrels, respectively. These call and put options can be exercised at various calculation dates in 2011 with specified quantities on each calculation date. The net negative fair value of these options as of March 31, 2011 and December 31, 2010 amounted to P839 and P234, respectively.

27
Embedded Derivatives The Group assesses whether embedded derivatives are required to be separated from host contracts when the Group becomes a party to the contract. An embedded derivative is separated from the host contract and accounted for as a derivative if all of the following conditions are met: a) the economic characteristics and risks of the embedded derivative are not closely related to the economic characteristics and risks of the host contract; b) a separate instrument with the same terms as the embedded derivative would meet the definition of a derivative; and c) the hybrid or combined instrument is not recognized at FVPL. Reassessment only occurs if there is a change in the terms of the contract that significantly modifies the cash flows that would otherwise be required. The Group’s embedded derivatives include currency derivatives (forwards and options) embedded in non-financial contracts. Embedded Currency Forwards As of March 31, 2011 and December 31, 2010, the total outstanding notional amount of currency forwards embedded in non-financial contracts amounted to US$176 and US$244, respectively. These non-financial contracts consist mainly of foreign currency-denominated purchase orders, sales agreements and capital expenditures. The embedded forwards are not clearly and closely related to their respective host contracts. As of March 31, 2011 and December 31, 2010, the net positive fair value of these embedded currency forwards amounted to P120 and P127, respectively. Embedded Currency Options As of March 31, 2011 and December 31, 2010, the total outstanding notional amount of currency options embedded in non-financial contracts amounted to US$29 and US$26, respectively. These non-financial contracts consist mainly of sales agreements. These embedded options are not clearly and closely related to their host contracts. As of March 31, 2011 and December 31, 2010, the net negative fair value of these embedded currency options amounted to P12 and P11, respectively. For the periods ended March 31, 2011 and 2010 and December 31, 2010 and 2009, the Group recognized marked-to-market gains (losses) from freestanding and embedded derivatives amounting to (P1,662), P166, P660, and P962, respectively. Fair Value Hierarchy The table below analyzes financial instruments carried at fair value, by valuation method as of March 31, 2011 and December 31, 2010. The different levels have been defined as follows:
• Level 1: quoted prices (unadjusted) in active markets for identical assets or liabilities. • Level 2: inputs other than quoted prices included within Level 1 that are observable for the
asset or liability, either directly or indirectly. • Level 3: inputs for the asset or liability that are not based on observable market data.
March 31, 2011
Level 1 Level 2 Total Financial Assets Derivative assets P5 P295 P300 Financial assets at FVPL 177 - 177 AFS financial assets 1,602 1,120 2,722 Financial Liabilities Derivative liabilities 4 230 234

28
December 31, 2010
Level 1 Level 2 Total Financial Assets Derivative assets P3 P246 P249 Financial assets at FVPL 193 - 193 AFS financial assets 2,477 1,120 3,597 Financial Liabilities Derivative liabilities - 71 71
As of March 31, 2011 and December 31, 2010, the Group has no financial instruments valued based on Level 3. During the period, there were no transfers between Level 1 and Level 2 fair value measurements, and no transfers into and out of Level 3 fair value measurements.
10. Events After the Reporting Date
a. Offer and Sale of Common Shares of Stock of the Parent Company (the “Offer”) and Issuance of Exchangeable Bonds
The Offer consists of 110,320,000 common shares of stock of the Parent Company (the “Offer Shares”), consisting of 27,580,000 common shares from the treasury stock of the Parent Company and 82,740,000 common shares from Top Frontier. In addition, Top Frontier sold to ATR Kim Eng Capital Partners, Inc., BDO Capital & Investment Corporation and SB Capital Investment Corporation an additional 27,580,000 Offer Shares. The Parent Company likewise granted Credit Suisse (Singapore) Limited, Standard Chartered Securities (Singapore) Pte. Limited, Goldman Sachs (Singapore) Pte., and UBS AG an option, exercisable in whole or in part for thirty (30) days from the date of allotment of Offer Shares in the international offer, to procure purchasers for up to 7,880,000 additional Common Shares, solely to cover over-allotments under the Offer, if any. The Offer Shares were priced at P=110.00 per share on April 20, 2011. Based on the final reports submitted to the Parent Company by the designated global coordinators and bookrunners, the total number of common shares sold thru the international and domestic offers are as follows: International Offer: 78,800,000 common shares consisting of:
(i) 19,700,000 common shares from the treasury stock of the Parent Company; and
(ii) 59,100,000 common shares held by Top Frontier
Domestic Offer: A) 31,520,000 common shares consisting of: (i) 7,880,000 common shares from the treasury stock of the Parent
Company; and (ii) 23,640,000 common shares held by Top Frontier
B) 27,580,000 additional shares held by Top Frontier
Over-allotment: 7,880,000 common shares from the treasury stock of the Parent Company The Parent Company has likewise earmarked 189,120,000 common shares from its treasury stock for the US$600 denominated exchangeable bonds.

29
On May 5, 2011, a total of 145,780,000 common shares of the Parent Company, worth US$370 were crossed at the Philippine Stock Exchange while US$600 worth of exchangeable bonds were simultaneously listed at the Singapore Stock Exchange. The exchangeable bonds have a maturity of three years, a coupon of 2% per annum and a conversion premium of 25% to the offer price. The exchangeable bonds will be exchangeable for Common Shares from the treasury stock of SMC. The initial exchange price for the exchange of the exchangeable bonds into Common Shares is P=137.50 per share. b. Declaration of Cash Dividends for Series “1” Preferred Shares On May 12, 2011, the Parent Company’s BOD declared cash dividends at P1.50 per share, payable on June 14, 2011 to all preferred shareholders as of May 26, 2011.
11. Other Matters
a. There are no unusual items as to nature and amount affecting assets, liabilities, equity, net income or cash flows, except those stated in Management’s Discussion and Analysis of Financial Position and Performance.
b. There were no material changes in estimates of amounts reported in prior interim periods of the
current year or changes in estimates of amounts reported in prior financial years. c. There were no known trends, demands, commitments, events or uncertainties that will have a
material impact on the Group’s liquidity. d. There were no known trends, events or uncertainties that have had or that are reasonably expected
to have a favorable or unfavorable impact on net sales or revenues or income from continuing operation.
e. There were no known events that will trigger direct or contingent financial obligation that is
material to the Group, including any default or acceleration of an obligation and there were no changes in contingent liabilities and contingent assets since the last annual statements of financial position date, except for Note 26 (c) of the 2010 Audited Consolidated Financial Statements that remain outstanding as of March 31, 2011. No material contingencies and any other events or transactions exist that are material to an understanding of the current interim period.
f. There were no material off-statements of financial position transactions, arrangements, obligations
(including contingent obligations), and other relationship of the Group with unconsolidated entities or other persons created during the reporting period, except for the outstanding derivative transactions entered by the Group as of and for the period ended March 31, 2011.
g. The effects of seasonality or cyclicality on the interim operations of the Group’s businesses are not
material.

30
h. The Group’s material commitments for capital expenditure projects have been approved during the current year but are still ongoing and not yet completed as of end of March 31, 2011. These consist of construction, acquisition, upgrade or repair of fixed assets needed for normal operations of the business. The said projects will be carried forward to the next quarter until its completion. The fund to be used for these projects will come from available cash, short and long-term loans.


Management Discussion and Analysis Page 2
On March 3, 2011, SMPFC’s 15,000,000 preferred shares with par value of P=10.00 per share were listed with the PSE.
On March 8, 2011, SMPFC paid the Parent Company P=2,880 million, representing the remaining 90% balance of the purchase price of the food-related brands and intellectual property rights acquired in July 2010. On May 9, 2011, SMPFC paid the Parent Company US$16.8 million or equivalent to P=721 million, representing the remaining 90% balance on the purchase of the Parent Company’s 51% stake in San Miguel Pure Foods Investment (BVI) Limited.
On February 2, 2011, the BOD of Top Frontier Investment Holdings, Inc. (Top Frontier) declared cash dividends amounting to P=139.50 per share or a total of P=363 million to preferred shareholders of record as of February 2, 2011. The cash dividend was paid to the Parent Company on February 10, 2011. On March 16, 2011, Top Frontier exercised its option to purchase from Q-Tech Alliance Holdings, Inc. (“Q-Tech”) a 12.9% equity interest in the Parent Company held by Q-Tech, which increased Top Frontier’s equity interest in SMC’s issued and outstanding common shares of stock to 67.2%.
II. FINANCIAL PERFORMANCE
2011 vs. 2010 San Miguel Corporation’s consolidated sales revenue for first quarter of 2011 amounted to P=126,570 million, nearly three times higher than last year’s level. The consolidation of Petron and SMC Global brought in additional revenue of P=78,893 million in the first quarter while most of the existing businesses showed revenue growth versus last year. Correspondingly, first quarter 2011 consolidated operating income amounted to P=17,291 million, almost three times higher than last year’s level. Equity in net earnings of associates decreased in 2011 mainly due to consolidation of San Miguel Energy Corp. (SMEC) and Strategic Power Devt. Corp. (SPDC), formerly associates of SMC in the first quarter of 2010, net of SMC Global’s share in net income of the Manila Electric Company (Meralco) in the first quarter of 2011. Net financing charges increased to P=5,306 million from P=1,081 million mainly due to higher debt balance in 2011 and the interest expense on finance lease liabilities of SMC Global. With the equity in net earnings of associates, net of financing and other charges, the Group’s resulting consolidated net income attributable to equity holders of the Parent Company amounted to P=7,138 million, more than twice that of last year’s net income. 2010 vs. 2009 For the first quarter of 2010, the Group generated consolidated sales revenues of P=44,659 million, 7% higher than 2009. Revenue growth was led by Ginebra San Miguel, Inc. (GSMI) and San Miguel Brewery Inc. (SMB).

Management Discussion and Analysis Page 3
With the increased sales coupled with improved margins and managed fixed costs, consolidated operating income for the first quarter ended at P=5,786 million, 35% above 2009. Most businesses were able to perform above 2009’s levels. Interest expense and other financing charges increased by 44% compared to the same period in 2009 due to higher debt balance. Equity in net earnings of associates is significantly higher than 2009 mainly due to the Group’s share in net income of Meralco, SMEC, SPDC and BOC, net of the equity in net loss of Liberty Telecoms Holdings, Inc. (LTHI). Gain on sale of investments and property and equipment in 2009 represents mainly the sale of certain parcels of land to Brewery Landholdings, Inc. With the equity in net earnings and other income from our new businesses, net of financing charges incurred by the Group and the increase in non-controlling interests, the resulting net income attributable to equity holders of the Parent Company is P=2,896 million, 7% higher than 2009. The following are the highlights of the performance of the individual business segments: 1. BEVERAGES
2011 vs. 2010 a. Beer
The consolidated statement of income of SMB Group for the first quarter of 2011 reflects the financial performance of SMB Group’s domestic and international businesses including Iconic Beverages Inc., Brewery Properties Inc. (BPI), San Miguel Brewing International Limited (SMBIL) and the subsidiaries of BPI and SMBIL while the first quarter 2010 statement of income reflects the consolidated results of both domestic and international operations excluding BPI and its subsidiary. SMB Group posted first quarter consolidated revenues at P=17,530 million, 9% higher than last year’s level. This was due to volumes of about 56 million cases, surpassing year-ago level by 9%. With increased volumes, consolidated operating income improved at P=5,063 million, higher by 9% versus last year.
b. GSMI
Ginebra San Miguel, Inc.’s 2011 first quarter consolidated sales revenue ended at P=4,552 million, 18% below last year’s level. This is on hard liquor sales volume of about 8 million cases. With lower domestic liquor volumes, first quarter consolidated operating income amounted to P=85 million, significantly lower than previous year’s level.
Management Discussion and Analysis Page 4
2010 vs. 2009 a. Beer
SMB’s first quarter revenue amounted to P=13,356 million, 7% higher than 2009. With higher volumes and increased selling prices, operating income for the quarter amounted to P=4,647 million, up by 20% versus 2009. SMBIL registered sales revenue of $59.7 million for the first quarter, 5% above 2009’s level on account of a 25% increase in Indonesia’s domestic volume and an 11% increase in SMBIL exports. SMBIL’s consolidated operating loss for the quarter is US$0.77 million, favorable versus 2009. This was on the back of higher gross margins resulting from improved mix and reduction in discounts coupled with contained fixed costs.
b. GSMI GSMI turned in good results for the first quarter of 2010 with domestic liquor volume reaching 10.1 million cases, 4% above 2009 level. This resulted to consolidated sales revenue of P=5,574 million, 22% higher than 2009. With higher revenues and stable fuel and molasses costs, consolidated operating income for the quarter reached P=474 million, 14% higher than 2009.
2. PACKAGING
2011 vs. 2010 San Miguel Yamamura Packaging Group’s (SMYPG) March 2011 year-to-date sales revenue amounted to P=5,678 million, 2% higher than last year. Increase in revenues was led by higher glass volume brought by new Australian and other export markets, new accounts for paper business and higher sales in the international operations. However, due to higher cost of fuel, raw materials and competitive pricing in the export market, consolidated operating income amounted to P=461 million, 8% lower than last year. 2010 vs. 2009
SMYPG posted consolidated revenues for the quarter at P=5,579 million, 11% higher than 2009. The consolidation of the Cospak Group, the largest packaging trading company in Australasia with sales offices in Australia, New Zealand and South Africa, led the increase versus 2009. The corresponding SMYPG’s consolidated operating income for first quarter is P= 504 million, 20% lower than 2009, with the higher material costs for the plastic business, lower volume from Coca-Cola Bottlers Philippines, Inc. and higher fixed costs.

Management Discussion and Analysis Page 5
3. FOOD 2011 vs. 2010 For the first quarter, San Miguel Pure Foods Group posted consolidated revenues of P=20,590 million, 10% higher than last year. Significant volume growth was seen in poultry; basic meats; butter, milk and cheese; ice cream; coffee; and regional operations; while better prices were noted in the feeds and flour businesses. Although higher cost of raw materials tempered margin growth, this did not prevent the Food Group from reaching consolidated operating income of P=1,558 million, 15% greater than last year. Largely driven by poultry, flour and value added meats businesses; the group continues to derive margin improvements from product innovations and higher operating efficiencies. 2010 vs. 2009 For the first quarter of 2010, San Miguel Food Group (Food Group) sustained its strong performance with operating income reaching P=1,360 million, significantly higher than 2009. This was achieved on consolidated revenues of P=18,726 million, slightly higher than 2009. Modest volume growth is noted across the group, with double-digit increases in flour, milk, coffee and some of the regional businesses.
4. POWER
The four power plants – Sual, Limay, San Roque and Ilijan dispatched energy totaling 3.51 million megawatt hours as of March 2011. This is more than double of last year with the addition of the Ilijan Power Plant to the group’s portfolio and increased generation of Sual Plant. Consolidated revenue was 43% higher than last year at P=16,329 million. Despite lower WESM prices, consolidated operating income reached P=3,399 million for the first quarter, 59% higher than last year. This is mainly due to the increased generation of Sual plant given adequate coal inventory and better plant utilization coupled with the additional income contribution of the Ilijan plant.
5. FUEL AND OIL
Petron Corporation delivered first quarter revenues of P=64,050 million, 15% higher than last year. This was achieved with continued better selling prices on sales volume of 11.5 million barrels. Correspondingly, year-to-date operating income ended at P= 6,996 million, significantly higher than last year’s level.

Management Discussion and Analysis Page 6
III. FINANCIAL POSITION
2011 vs. 2010 The Group’s consolidated total assets as of March 31, 2011 amounted to P=854,686 million, P= 24,886 million or 3% higher than 2010, mainly due to the higher inventories balance. Inventories increased by 40% to P=80,328 million in 2011 mainly due to increase in volume and price of crude oil inventory of Petron; early arrival of soybean meal shipment and increase in prices of feeds costs, wheat and meat materials of SMPFC; and increase in molasses and cassava chips inventory of GSMI. Current biological assets increased by 10% to P=3,593 million in 2011 due to the increase in volume of growing poultry livestock and hogs coupled with higher feed costs. Prepaid expenses and other current assets increased by 11% to P=18,783 million in 2011 mainly due to additional excess input tax of the Group. Available-for-sale financial assets decreased by 24% from P=3,597 million in 2010 mainly due to the fair value and translation adjustments of the investment in shares of stock of Indophil Resources NL. Drafts and loans payable decreased by 9% from P= 74,128 million in 2010 mainly due to payments made by Petron and the Parent Company. Accounts payable and accrued expenses increased by 16% from P=69,774 million in 2010 mainly due to increase in liabilities of Petron for: a) crude oil and petroleum product importation (due to higher cost and volume of crude importation in March 31, 2011) and b) purchases for the Petron refinery project, and reclassification to current portion of the amount due next year for the acquisition of Meralco shares of stock, net of payments made during the period. Finance lease liabilities decreased by P=1,249 million mainly due to payments made during the period and translation adjustments, net of interest expense for the period. The increase in income and other taxes payable of P=2,558 million, represents the income tax due for the first quarter of 2011 of SMC Global, SMB, Petron and SMPFC. Dividends payable increased by 194% mainly due to a) the dividends payable of the Parent Company to its common shareholders (which was subsequently paid on April 11, 2011) and b) SMB’s dividends payable to its non-controlling stockholders (which was subsequently paid on April 11, 2011), net of the dividends payable in 2010 subsequently paid by PF-Hormel in 2011 to its non-controlling stockholder. Long-term debt increased by P=11,508 million from P=168,927 million in 2010 mainly due to issuance of bonds by SMC Global, net of payments made by Petron, San Miguel Foods and Beverage International Limited and GSMI and translation adjustments.

Management Discussion and Analysis Page 7
Deferred tax liabilities decreased by 13% from P=13,752 million in 2010 to P=11,988 million in 2011 mainly due to utilization of NOLCO by Petron and the recognition of deferred tax for the depreciation expense of SMC Global due to timing differences. Other noncurrent liabilities decreased by 79% in 2011 mainly due to reclassification to current liabilities of the amount due next year related to the acquisition of Meralco shares of stock. Cumulative translation adjustments decreased by 9% from P=5,365 million in 2010 mainly due to the translation of foreign subsidiaries’ net assets. The exchange rates used for net assets in March 31, 2011 were P=43.39 to US$1 (P=43.84 in December 31, 2010) and P=43.785 to US$1 as of March 31, 2011 (P=45.996 as of March 31, 2010) for income and expense items. Appropriated retained earnings increased by 16% mainly due to additional appropriation made by GSMI, for capital expenditures which include, among others, distillery replacement and maintenance projects and bottling plants’ building and equipment rehabilitation and maintenance. Non-controlling interests (NCI) increased by P= 16,382 million in 2011 mainly due to the preferred shares issued by SMPFC, which is presented as part of NCI, and share of non-controlling stockholders in the net income of SMB and Petron, net of dividends declared. 2010 vs. 2009
Cash and cash equivalents decreased by 42% from P=209,411 million in 2009 to P=121,074 million in 2010 mainly due to advances for future stock subscription in shares of stock of Top Frontier and Universal LRT Corporation (BVI) Limited (ULC), net payment of short-term loans, payment of dividends and additional advances to a related party, net of the proceeds from loan availment of SMB. Trade and other receivables increased by 8% to P=53,017 million in 2010 due to consolidation of PanAsia's receivable balance, on the sale of electricity to Wholesale Electricity Spot Market and additional advances to a related party, net of the collection of December 2009 trade receivable balances. Inventories increased by 7% to P=27,315 million in 2010 due to purchase of local and imported alcohol and increase in production volume of local liquor of GSMI. Current biological assets increased by 6% to P=2,682 million in 2010 due to the increase in volume of poultry livestock. Investments increased from P= 39,356 million to P= 134,004 million in 2010 mainly due to advances for future stock subscription in shares of stock of Top Frontier and ULC, equity in net earnings of Meralco, SMEC and SPDC, net of equity in net loss of LTHI. Drafts and loans payable decreased by 6% from P=56,789 million in 2009 mainly due to net payments and translation adjustments. The increase in income and other taxes payable of P=1,022 million from P=4,186 million in 2009 to P=5,208 million in 2010, is mainly due to the increase in income tax payable for the first quarter of 2010 as a result of higher income for the period.

Management Discussion and Analysis Page 8
Dividends payable increased by 268% mainly due to declaration of dividends by the Parent Company to its common and preferred shareholders in March 2010. Long-term debt increased by P=12,492 million from P=72,962 million in 2009 mainly due to availment of an unsecured loan facility by SMB, net of payments made by SMIL and GSMI, additional debt issue costs-net and translation adjustments.
Cumulative translation adjustments decreased by 13% from P=5,845 million in 2009 mainly due to the translation of foreign subsidiaries’ net assets. The exchange rates used for net assets in March 31, 2010 were P=45.17 to US$1 (P=46.2 in December 31, 2009) and P=45.996 to US$1 as of March 31, 2010 (P=47.785 as of March 31, 2009) for income and expense items. Equity The increase (decrease) in equity is due to:
(In millions) March 31
2011 2010 Addition to non-controlling interest P=14,906 P= -Income during the period 10,036 4,496 Issuance of capital stock 240 779 Effect of translation adjustments (562) (1,057)Cash dividends (3,616) (4,734) P=21,004 (P=516)
Current ratio was 1.61 in 2011 and 1.57 in 2010. Debt to equity ratio was 1.97 and 2.11 as of 2011 and 2010, respectively.
IV. SOURCES AND USES OF CASH A brief summary of cash flow movements is shown below:
(In millions) March 31 2011 2010Net cash flows provided by operating activities P=3,894 P=3,765 Net cash flows used in investing activities (4,146) (98,366)Net cash flows provided by financing activities 1,642 7,218
Net cash flows from operations for the period basically consists of income for the period less changes in noncash current assets (mainly inventories), certain current liabilities and others.

Management Discussion and Analysis Page 9
Net cash flows used in investing activities included the following:
(In millions) March 31 2011 2010Interest received P=1,481 P=1,073 Dividends received 362 - Proceeds from sale of investments and property and
equipment 71 18 Additions to investments and advances (840) (93,925)Advances to related parties (1,506) (3,079)Additions to property, plant and equipment (3,331) (1,166)Increase in other noncurrent assets and others (383) (1,287)
Major components of net cash flows provided by financing activities are as follows:
(In millions) March 31 2011 2010Net proceeds from issuance of preferred shares P=14,828 P= -Proceeds from long-term debt - net 12,155 13,010Proceeds from issuance of capital stock 181 562Payments of dividends (2,015) (3,194)Payment of finance lease liabilities (2,979) -Payment of short-term loans - net (6,446) (3,160)Payment of other liabilities (14,082) -
The effect of exchange rate changes on cash and cash equivalents amounted to (P=175 million) and (P=954 million) in March 31, 2011 and 2010, respectively.
V. KEY PERFORMANCE INDICATORS The following are the major performance measures that the Group uses. Analyses are employed by comparisons and measurements based on the financial data of the current period against the same period of previous year. Please refer to Item II “Financial Performance” of the MD&A for the discussion of the computed certain Key Performance Indicators.
March December 2011 2010 Liquidity:
Current Ratio 1.61 1.57Solvency:
Debt to Equity Ratio 1.97 2.11Profitability:
Return on Average Equity Attributable to Equity Holders of the Parent Company 13.08% 9.35%

Management Discussion and Analysis Page 10
Period Ended March 31 2011 2010 Operating Efficiency:
Volume Growth 1% 2%Revenue Growth 183% 7%Operating Margin 13.66% 12.96%
The manner by which the Group calculates the indicators is as follows:
KPI Formula
Current Ratio Current Assets Current Liabilities
Debt to Equity Ratio Total Liabilities (Current + Noncurrent) Non-controlling Interests + Equity
Return on Average Equity Attributable to Equity Holders of the Parent Company
Net Income* Average Equity Attributable to Equity Holders of the Parent
Company
Volume Growth Sum of all Businesses’ Revenue at Prior Period Prices Prior period Net Sales
Revenue Growth Current Period Net Sales Prior Period Net Sales
Operating Margin Income from Operating Activities Net Sales
* Annualized for quarterly reporting
-1
-1