san pedro bay ports’ - epa
TRANSCRIPT

Case Study of the
San Pedro Bay Ports’
Clean Air Action Plan 2006–2018 Best Practices and Lessons Learned
EPA-420-R-21-011 | March 2021
&EPA United States Environmental Protection Agency
i
TABLE OF CONTENTS
Abbreviations ................................................................................................................................................. ii
1. Introduction and Background .............................................................................................................. 1
Key Conclusions .......................................................................................................................................................................... 1
Case Study Outline .................................................................................................................................................................... 3
2. A Brief History of the CAAP .................................................................................................................. 5
Context ........................................................................................................................................................................................... 5
Air Quality ..................................................................................................................................................................................... 5
Balancing Economic and Environmental Goals .............................................................................................................. 6
Public Health and Environmental Justice Concerns ..................................................................................................... 7
A Comprehensive Approach ............................................................................................................................................... 10
2010 CAAP Update ................................................................................................................................................................. 15
2017 CAAP Update ................................................................................................................................................................. 18
3. Environmental Justice and Levers of Community Influence ........................................................... 21
4. Technologies and Practices: Development and Deployment ......................................................... 23
5. The Art of the Possible: The 2017 Clean Truck Program ................................................................ 25
6. Conclusions and Lessons Learned ...................................................................................................... 27
Community-Port Collaboration ......................................................................................................................................... 27
Emission Inventories, Quantified Targets, and Technical Innovations ............................................................... 28
Partnerships with Government and Industry ............................................................................................................... 29
Acknowledgments ........................................................................................................................................ 31
LIST OF TABLES
Table 2-1. Emission Reduction Estimates by Pollutant, 2001-2002 Baseline, 2006 CAAP .................................... 12
Table 2-2. Emission Reduction Estimates by Pollutant, 2005 baseline, 2010 CAAP Update ............................... 18
LIST OF FIGURES
Figure 2-1. SPBP emissions by source type, 2001–2002. ................................................................................................... 11
Figure 2-2. SPBP contributions to regional DPM and NOx emissions in 2009 and expected contributions in
2023 in the absence of CAAP measures. .................................................................................................................................. 17

ii
Abbreviations
CAAP Clean Air Action Plan
CARB California Air Resources Board
CEQA California Environmental Quality Act
CHE cargo handling equipment
CTP Clean Truck Program
DPM diesel particulate matter
EIR environmental impact report
EPA U.S. Environmental Protection Agency
GHG greenhouse gas
MATES Multiple Air Toxics Exposure Study
MY model year
NGO nongovernmental organization
NNI No Net Increase (Task Force)
NOx nitrogen oxides
NRDC Natural Resources Defense Council
PDTR Ports Drayage Truck Registry
PM2.5 fine particulate matter
POLA Port of Los Angeles
POLB Port of Long Beach
SCAQMD South Coast Air Quality Management District
SOx sulfur oxides
SPBP San Pedro Bay Ports
TAP Technology Advancement Program
VSR vessel speed reduction
1
1. Introduction and Background
The development and implementation of the Clean Air Action Plan (CAAP) at the Ports of Los Angeles and
Long Beach—collectively known as the San Pedro Bay Ports (SPBP or Ports)—is a groundbreaking and
ongoing project with significant environmental benefits. The CAAP, a living document, was adopted in
2006 and updated in 2010 and 2017. It originated from an enormous community mobilization to address
acute air quality impacts from port operations, as well as growing awareness in the early 2000s that the
expanding port complex was affecting regional air quality. Because of the difficult air quality situation in
Southern California and strong community pressure and political support, the SPBP was able to take
aggressive and early air quality actions compared to other U.S. ports. The CAAP experience can now serve
as a map for other port authorities considering their own air quality actions and near-port communities
interested in promoting clean air programs.
Although every port’s situation is unique, the objective of this case study is to highlight key CAAP history,
programs, and lessons learned to serve as a building block. The case study project originated from
conversations between EPA and the Moving Forward Network1 and was developed as part of the EPA
Ports Initiative, which is a collaborative effort with the port industry, communities, and all levels of
government to improve air quality and increase economic prosperity.2 In addition to researching CAAP
documents, EPA staff and contractors conducted four focus group interviews with community and
environmental nongovernmental organization (NGO) representatives, near-port residents, and
environmental staff at the Port of Los Angeles (POLA) and the Port of Long Beach (POLB). This case study
is not intended to be a detailed study of all CAAP measures and strategies, but it includes references to
CAAP documents for readers who want further information.
Key Conclusions
This case study recognizes three key conclusions from the CAAP experience that other port authorities
and near-port communities may find useful when implementing air quality actions: the importance of
community-port collaboration, emission reduction targets and innovations, and partnerships with
government and industry.
Community-port collaboration
Southern California near-port residents and their allies were instrumental in drawing sustained attention
to air pollution issues at the SPBP and the effects of that air pollution on community health. Local
community support has been crucial to building political support for the CAAP’s development and
maintaining budgetary support for its implementation. Community collaboration is also an essential
element in shaping the CAAP’s environmental programs and measures to achieve ambitious emission
1 From the Moving Forward Network “About Us” webpage (http://www.movingforwardnetwork.com/about-us-2/): “The Moving Forward Network is a national network of over 50 member organizations that centers grassroots, frontline-community knowledge, expertise and engagement from communities across the US that bear the negative impacts of the global freight transportation system. MFN builds partnerships between these community leaders, academia, labor, big green organizations and others to protect communities from the impacts of freight. Its diverse membership facilitates an integrated and geographically dispersed advocacy strategy that incorporates organizing, communications, research, legal and technical assistance, leadership development and movement building. This strategy respects multiple forms of expertise and builds collective power.” 2 For more information on EPA’s Ports Initiative, visit http://www.epa.gov/ports-initiative.

2
reductions and environmental benefits for near-port residents and the entire region. Community and
environmental groups continue to exert strong pressure on the SPBP, regulatory agencies, and industry to
quickly develop and deploy low-polluting equipment technologies, address operational practices that
exacerbate pollution, and increase community involvement.
Near-port communities elsewhere can build upon this infrastructure to facilitate collaboration with their
own neighboring port authorities. Port authorities and environmental agencies can also use these
structures and practices to facilitate collaboration, while making participation as easy as possible for
community members. In turn, community members can support air quality programs’ project proposals
and incentive funding programs. Ports just beginning their outreach and communication efforts will likely
have to take incremental steps. Port-community engagement may also take place through other
processes, such as regional air quality and transportation planning.
Emission inventories, quantified targets, and technical innovations
The CAAP (as of the 2010 update) was the first U.S. port air quality program to include quantitative air
emission reduction targets. The adoption of these quantitative targets was possible because the SPBP
instituted annual emission inventories several years prior. The inventory data enabled the Ports to
determine where they needed to reduce emissions and to develop quantitative targets to address those
needs.
Beyond characterizing the overall scope of the air quality challenge, inventories can identify significant
sources of emissions (perhaps resulting in surprises and changes in emphasis for community advocates
and port managers), point toward the best solutions for reducing pollution levels, and enable informed
decision-making. When combined with equipment replacement and/or remediation cost information,
inventory data—or alternative metrics such as vessel and truck counts, vessel speeds, and gate
management system data—can point toward cost-effective emission reductions. Ports and communities
nationwide can also use the SPBP assessments of trucking and cargo handling equipment (CHE)
technologies,3 as well as technical resources available through the EPA Ports Initiative.4
Finally, technology demonstration initiatives such as the CAAP’s Technology Advancement Program (TAP)5
can provide a mechanism for port authorities to signal their interest in various pollution reduction
technologies, evaluate proposals from technology developers, and support the development and
demonstration of such technologies with local funds and leveraged resources.
Partnerships with government and industry
The CAAP required careful partnership and coordination among numerous stakeholders, including the
shipping industry; technology developers and manufacturers; near-port residents; environmental
organizations; and local, state, and federal governments. To implement and achieve meaningful emission
reduction targets, it was particularly crucial for port authorities to work with a full range of partners to
create ambitious yet achievable CAAP targets that help the ports meet their mandated air quality goals.
3 See https://cleanairactionplan.org/2019/04/03/ports-issue-final-clean-trucks-assessment/ and
https://cleanairactionplan.org/2019/09/20/cargo-handling-equipment-assessment-released/.
4 See https://www.epa.gov/ports-initiative/technical-resources-ports.
5 See http://www.cleanairactionplan.org/technology-advancement-program/.

3
The SPBP experience demonstrates the effectiveness of dedicating government resources beyond the port
authority level to help implement and assess emission reduction strategies. A combination of state and
local government initiatives created an array of regulatory and voluntary programs along with funding
mechanisms conducive to the CAAP’s development. Government programs thus complemented specific
CAAP measures, providing the Ports and industry with economic incentives for creative emission
reduction strategies, as well as a regulatory backstop ensuring environmental progress. Community
support was crucial to these programs, including testimony that supported regulations and incentives, as
well as support letters for specific projects that needed funding.
Collaboration with the shipping industry and technology developers and manufacturers has also been
crucial for CAAP development and implementation. Data on vessel, terminal, truck, and train operations is
fundamental to building credible inventories that accurately characterize emissions related to port
operations. Port authorities must closely cooperate and coordinate with industry partners to evaluate new
freight technologies and to test and demonstrate emerging technologies while continuing normal port
operations. Finally, as with community stakeholders, industry backing for government funding and
incentive programs has been crucial to building support for those programs.
Case Study Outline
This case study consists of a summary of the CAAP’s background and history, followed by the three
focused discussions described below.
Environmental justice6 and levers of community influence
Overburdened communities7 near the SPBP have borne the most direct air quality impacts of port
operations. However, as part of the broader environmental justice movement, these communities have
deployed numerous strategies that compelled the development of the CAAP and influenced its
subsequent cycles of implementation and revision. These community strategies laid the groundwork for
community involvement processes that can be models for port authorities and agencies, as well as near-
port communities, across the country.
Technologies and practices: development and deployment
Ports have been very successful at spurring the development of new clean air technologies through
funding/leveraging resources (TAP), hosting demonstrations, and—most recently—conducting formal
technology assessments. Partnerships with industry have been crucial here, as have targeted efforts based
on comprehensive emission inventories. The CAAP also established early/accelerated deployment of clean
6 From EPA’s “Learn About Environmental Justice” webpage (https://www.epa.gov/environmentaljustice/learn-about-
environmental-justice): “Environmental justice (EJ) is the fair treatment and meaningful involvement of all people
regardless of race, color, national origin, or income with respect to the development, implementation and
enforcement of environmental laws, regulations and policies.”
7 From EPA’s Plan EJ 2014 report (linked at https://www.epa.gov/environmentaljustice/plan-ej-2014): “In Plan EJ 2014,
EPA uses the term ‘overburdened’ to describe the minority, low-income, tribal, and indigenous populations or
communities in the United States that potentially experience disproportionate environmental harms and risks as a
result of greater vulnerability to environmental hazards. This increased vulnerability may be attributable to an
accumulation of both negative and lack of positive environmental, health, economic, or social conditions within these
populations or communities” (p. 1, footnote 1).

4
technologies as a goal, as with the first Clean Truck Program (CTP). Ports elsewhere may be able to quickly
advance their own technologies because of the work done through the CAAP.
The art of the possible: the 2017 Clean Truck Program
The 2017 revision of the CTP provides a useful case study for ports outside of California, because the SPBP
and partners developed it with fewer “backstop” environmental requirements (state or federal regulatory
requirements with strong legal authority that matched the CTP requirements, perhaps with different
deadlines) than the original 2006 CTP. Given that policy circumstance, the development of the revised
program required careful evaluation of the Ports’ authorities and levers of influence, as well as ongoing
coordination with industry and labor stakeholders. It also required measures that fit the Ports’ mandates
and legal authorities. As the Ports move forward with implementation, ongoing evaluation of authority
and coordination with stakeholders will be critical.

5
2. A Brief History of the CAAP
The Ports and partners developed the CAAP in 2006, with subsequent revisions in 2010 and 2017. The
CAAP was designed to be a living document, with each version building upon the last to reduce air
emissions from port activities. Each CAAP featured unique elements, including the following:
▪ 2006 CAAP: measure-based emission reduction targets.
▪ 2010 CAAP Update: quantifiable nitrogen oxide (NOx), sulfur oxide (SOx), and diesel particulate
matter (DPM) emission reduction targets; health-risk reduction targets; and updated
implementation strategies.
▪ 2017 CAAP Update: quantifiable greenhouse gas (GHG) emission reduction targets and new and
updated implementation strategies.
This summary does not attempt to describe CAAP strategies in comprehensive detail, but rather focuses
on the environmental and community circumstances underpinning the plan, key building blocks and
program elements, and results to date. Readers can find full details in the comprehensive documents on
the CAAP website.8
Context
With a combined 2018 cargo volume of 17.55 million twenty-foot-equivalent units (TEUs), the Ports
comprise the largest port complex in the United States.9 They account for $300 billion in combined annual
trade and are the port of entry for up to 40 percent of the nation’s containerized cargo. To accept and
move this freight, hundreds of ships and large numbers of CHE are constantly operating in and around
the SPBP.10 Thousands of trucks and railcars also move freight in and out of the Ports, traveling near or
through surrounding neighborhoods on local roads, connecting freeways (particularly Interstate 710), and
rail lines. At times, the Ports also become major construction sites as new terminals and facilities are built
or expanded.
As city government agencies, formally designated as the Harbor Departments of Los Angeles and Long
Beach, the Ports do not own or operate any of this equipment and are not involved directly in day-to-day
goods movement. Instead, they are landlord ports that administer public facilities and lease terminal lands
to tenant operators, who run cargo operations. Nevertheless, these agencies facilitate an extensive trade
network for the public benefit, including the reduction of harmful air emissions from port-related
operations.11
Air Quality
Given the magnitude and nature of activity at the Ports, they have historically been significant drivers of
economic growth and employment as well as a significant source of air pollution.
8 See https://cleanairactionplan.org/; plan documents available at https://cleanairactionplan.org/about-the-plan/.
9 World Shipping Council. 2020. Top 50 world container ports. http://www.worldshipping.org/about-the-
industry/global-trade/top-50-world-container-ports.
10 Port of Los Angeles and Port of Long Beach. 2006. Final 2006 San Pedro Bay Ports clean air action plan: Technical report. https://cleanairactionplan.org/documents/2006-clean-air-action-plan-update-tech-report.pdf/. 11 Port of Long Beach. 2020. Environment. https://www.polb.com/environment.
6
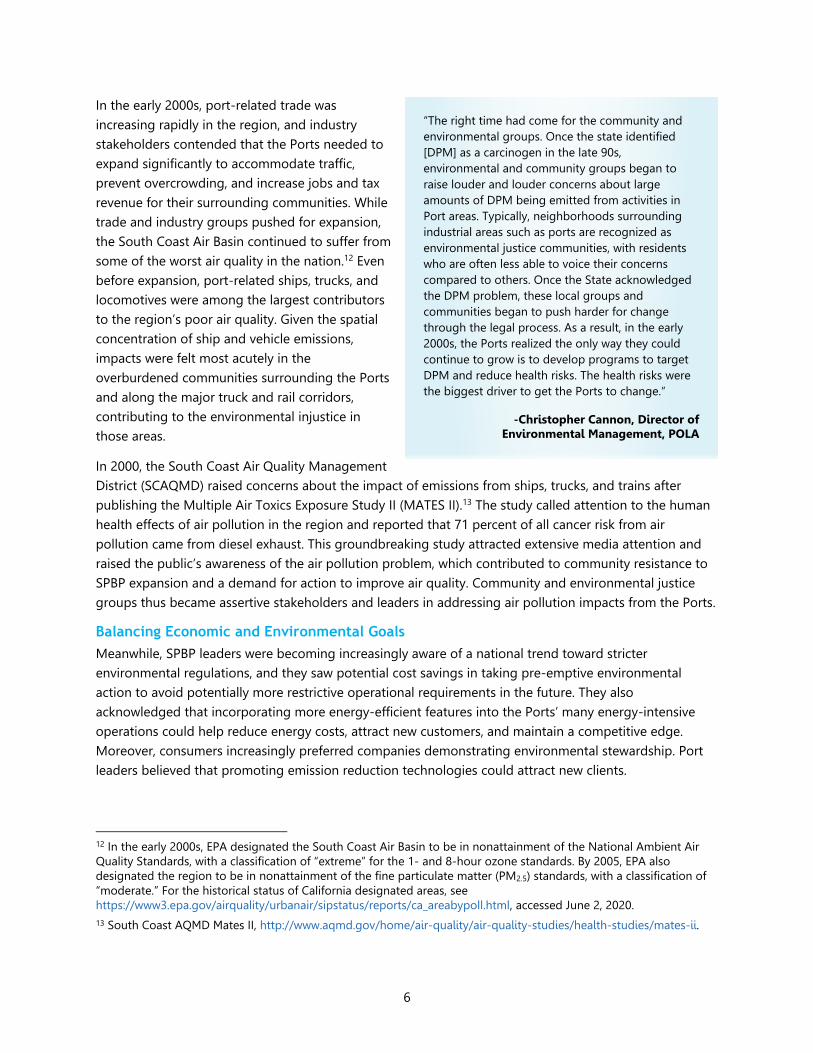
In the early 2000s, port-related trade was
increasing rapidly in the region, and industry
stakeholders contended that the Ports needed to
expand significantly to accommodate traffic,
prevent overcrowding, and increase jobs and tax
revenue for their surrounding communities. While
trade and industry groups pushed for expansion,
the South Coast Air Basin continued to suffer from
some of the worst air quality in the nation.12 Even
before expansion, port-related ships, trucks, and
locomotives were among the largest contributors
to the region’s poor air quality. Given the spatial
concentration of ship and vehicle emissions,
impacts were felt most acutely in the
overburdened communities surrounding the Ports
and along the major truck and rail corridors,
contributing to the environmental injustice in
those areas.
In 2000, the South Coast Air Quality Management
District (SCAQMD) raised concerns about the impact of emissions from ships, trucks, and trains after
publishing the Multiple Air Toxics Exposure Study II (MATES II).13 The study called attention to the human
health effects of air pollution in the region and reported that 71 percent of all cancer risk from air
pollution came from diesel exhaust. This groundbreaking study attracted extensive media attention and
raised the public’s awareness of the air pollution problem, which contributed to community resistance to
SPBP expansion and a demand for action to improve air quality. Community and environmental justice
groups thus became assertive stakeholders and leaders in addressing air pollution impacts from the Ports.
Balancing Economic and Environmental Goals
Meanwhile, SPBP leaders were becoming increasingly aware of a national trend toward stricter
environmental regulations, and they saw potential cost savings in taking pre-emptive environmental
action to avoid potentially more restrictive operational requirements in the future. They also
acknowledged that incorporating more energy-efficient features into the Ports’ many energy-intensive
operations could help reduce energy costs, attract new customers, and maintain a competitive edge.
Moreover, consumers increasingly preferred companies demonstrating environmental stewardship. Port
leaders believed that promoting emission reduction technologies could attract new clients.
12 In the early 2000s, EPA designated the South Coast Air Basin to be in nonattainment of the National Ambient Air
Quality Standards, with a classification of “extreme” for the 1- and 8-hour ozone standards. By 2005, EPA also
designated the region to be in nonattainment of the fine particulate matter (PM2.5) standards, with a classification of
“moderate.” For the historical status of California designated areas, see
https://www3.epa.gov/airquality/urbanair/sipstatus/reports/ca_areabypoll.html, accessed June 2, 2020.
13 South Coast AQMD Mates II, http://www.aqmd.gov/home/air-quality/air-quality-studies/health-studies/mates-ii.
“The right time had come for the community and
environmental groups. Once the state identified
[DPM] as a carcinogen in the late 90s,
environmental and community groups began to
raise louder and louder concerns about large
amounts of DPM being emitted from activities in
Port areas. Typically, neighborhoods surrounding
industrial areas such as ports are recognized as
environmental justice communities, with residents
who are often less able to voice their concerns
compared to others. Once the State acknowledged
the DPM problem, these local groups and
communities began to push harder for change
through the legal process. As a result, in the early
2000s, the Ports realized the only way they could
continue to grow is to develop programs to target
DPM and reduce health risks. The health risks were
the biggest driver to get the Ports to change.”
-Christopher Cannon, Director of Environmental Management, POLA
7
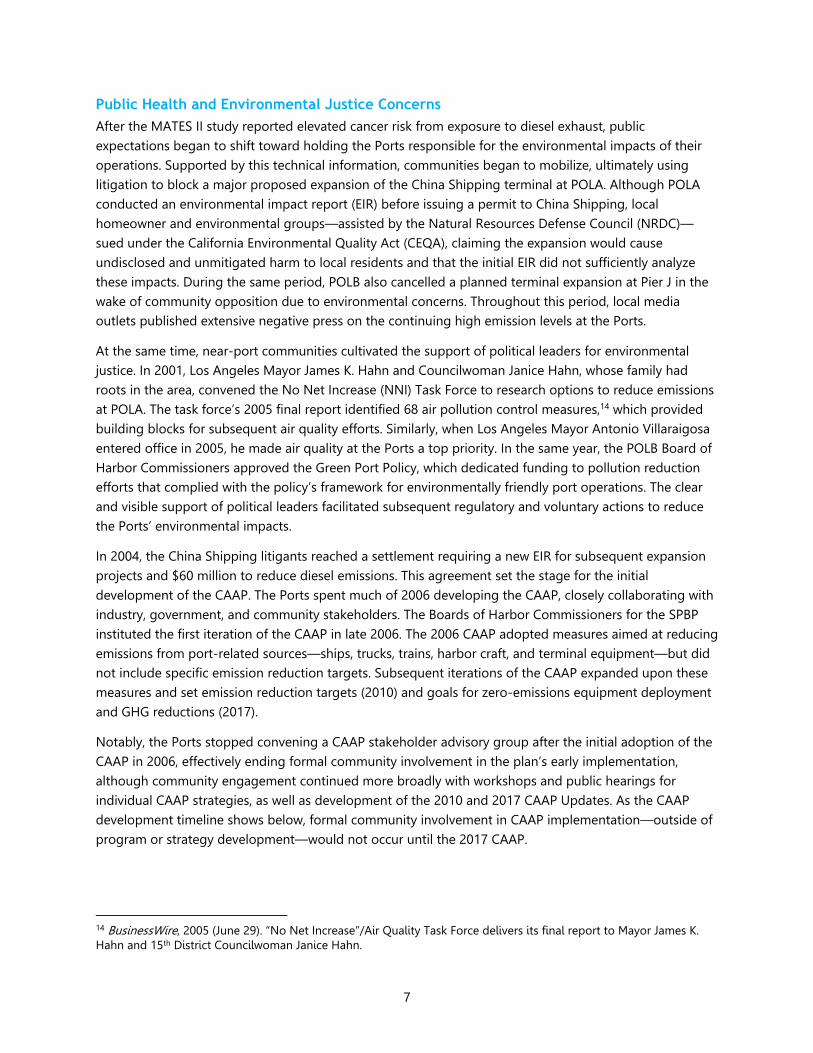
Public Health and Environmental Justice Concerns
After the MATES II study reported elevated cancer risk from exposure to diesel exhaust, public
expectations began to shift toward holding the Ports responsible for the environmental impacts of their
operations. Supported by this technical information, communities began to mobilize, ultimately using
litigation to block a major proposed expansion of the China Shipping terminal at POLA. Although POLA
conducted an environmental impact report (EIR) before issuing a permit to China Shipping, local
homeowner and environmental groups—assisted by the Natural Resources Defense Council (NRDC)—
sued under the California Environmental Quality Act (CEQA), claiming the expansion would cause
undisclosed and unmitigated harm to local residents and that the initial EIR did not sufficiently analyze
these impacts. During the same period, POLB also cancelled a planned terminal expansion at Pier J in the
wake of community opposition due to environmental concerns. Throughout this period, local media
outlets published extensive negative press on the continuing high emission levels at the Ports.
At the same time, near-port communities cultivated the support of political leaders for environmental
justice. In 2001, Los Angeles Mayor James K. Hahn and Councilwoman Janice Hahn, whose family had
roots in the area, convened the No Net Increase (NNI) Task Force to research options to reduce emissions
at POLA. The task force’s 2005 final report identified 68 air pollution control measures,14 which provided
building blocks for subsequent air quality efforts. Similarly, when Los Angeles Mayor Antonio Villaraigosa
entered office in 2005, he made air quality at the Ports a top priority. In the same year, the POLB Board of
Harbor Commissioners approved the Green Port Policy, which dedicated funding to pollution reduction
efforts that complied with the policy’s framework for environmentally friendly port operations. The clear
and visible support of political leaders facilitated subsequent regulatory and voluntary actions to reduce
the Ports’ environmental impacts.
In 2004, the China Shipping litigants reached a settlement requiring a new EIR for subsequent expansion
projects and $60 million to reduce diesel emissions. This agreement set the stage for the initial
development of the CAAP. The Ports spent much of 2006 developing the CAAP, closely collaborating with
industry, government, and community stakeholders. The Boards of Harbor Commissioners for the SPBP
instituted the first iteration of the CAAP in late 2006. The 2006 CAAP adopted measures aimed at reducing
emissions from port-related sources—ships, trucks, trains, harbor craft, and terminal equipment—but did
not include specific emission reduction targets. Subsequent iterations of the CAAP expanded upon these
measures and set emission reduction targets (2010) and goals for zero-emissions equipment deployment
and GHG reductions (2017).
Notably, the Ports stopped convening a CAAP stakeholder advisory group after the initial adoption of the
CAAP in 2006, effectively ending formal community involvement in the plan’s early implementation,
although community engagement continued more broadly with workshops and public hearings for
individual CAAP strategies, as well as development of the 2010 and 2017 CAAP Updates. As the CAAP
development timeline shows below, formal community involvement in CAAP implementation—outside of
program or strategy development—would not occur until the 2017 CAAP.
14 BusinessWire, 2005 (June 29). “No Net Increase”/Air Quality Task Force delivers its final report to Mayor James K. Hahn and 15th District Councilwoman Janice Hahn.

8
CAAP Development Timeline
Year Activities
1997 ▪ POLA calls for an analysis of the environmental impacts of the West Basin Terminal
Improvements Program.
2000
▪ SCAQMD releases MATES II, which found that 71 percent of all cancer risk from air pollution in the South Coast Air Basin comes from diesel exhaust, drawing attention to air quality around the Ports.
2001
▪ EPA adopts Final Rule for Control of Air Pollution from New Motor Vehicles: Heavy-Duty Engine and Vehicle Standards and Highway Diesel Fuel Sulfur Control Requirements.
▪ California introduces a plan to widen the I-710 freeway, the main roadway connecting to the SPBP. Communities unite in strong opposition.
▪ Community organizations Wilmington Coalition for A Safe Environment (renamed Coalition for a Safe Environment in 2002) and East Yard Communities for Environmental Justice founded in response to SPBP expansion projects and other environmental health impacts of local industrial pollution.15
▪ Two San Pedro homeowners’ groups and the Coalition for Clean Air, with NRDC assistance, file a lawsuit against POLA to stop expansion of the China Shipping terminal.16
▪ Los Angeles Mayor James K. Hahn and Councilwoman Janice Hahn convene NNI Task Force to consider reducing emissions at POLA.
The SPBP, EPA Region 9, California Air Resources Board (CARB), SCAQMD, Pacific Merchant Shipping Association, and Marine Exchange of Southern California establish a four-year program to voluntarily reduce vessel speeds to reduce emissions.
▪ POLA develops its first emission inventory.
2002
▪ Longshore labor contract dispute results in a nine-day shutdown of all West Coast ports. Reduced congestion illustrated the impact of truck activity in and around ports.17
▪ POLB develops its first emission inventory. Both ports develop annual emission inventories starting in 2003.
2003
▪ CARB adopts ultra-low sulfur diesel requirement for all on-road and most non-road equipment to lower particulate emissions.
▪ EPA adopts Final Rule for Control of Emissions from New Marine Compression-Ignition Engines at or Above 2.5 Liters Per Cylinder.
2004
▪ Settlement is reached in China Shipping lawsuit, including $60 million to reduce diesel truck emissions, use CHE powered by cleaner fuels, and use electric power for vessels while in port.
▪ An unanticipated surge in port-related trade leads to shortages of longshore and railroad labor, long waits for arriving ships, severe delays, and a diversion of 100
15 Coalition for a Safe Environment, http://www.coalitionfase.org/; East Yard Communities for Environmental Justice,
http://eycej.org/about/.
16 Perrella, M.L., Matsuoka, M., Logan, A. 2019. Working together to clean up freight Transportation. In Haberle, M.,
Kurniawan, H. (eds.). Strategies for health justice: Lessons from the field, pp. 37–44. Poverty & Race Research Action
Council. https://prrac.org/pdf/health_justice_rpt.pdf.
17 Giuliano, G., Agarwal, A., Li, C., Linder, A. 2005. Caltrans/MTA/METRANS Port Impact Study: Final report. METRANS Transportation Center, University of Southern California.
9
Year Activities
vessels to other ports, underscoring the need to expand capacity and highlighting the pollution impacts of congestion.18
▪ CARB adopts a low sulfur fuel requirement for harbor craft (500 parts per million [ppm]).
2005
▪ NNI Task Force submits its final report, which includes specific initiatives and technologies to achieve zero increase in emissions from port-related sources.
▪ CARB adopts CHE regulations to further limit emissions.
▪ POLB approves $33 million for Green Port Policy projects and $100 million for a Green Port Fund.
2006
▪ CARB adopts an ultra-low sulfur fuel (15 ppm) requirement for harbor craft.
▪ The SPBP and SCAQMD commit to jointly develop and implement a CAAP. EPA and
state and regional environmental agencies participate in the development process,
along with industry and community representatives.
▪ Ports collect and incorporate public comments on the draft CAAP, releasing the final
CAAP for public review.
▪ The SPBP Boards of Harbor Commissioners adopt the CAAP, establishing near-term
goals, emission reduction targets, and budgetary needs for fiscal years 2006–2011.
2008 ▪ EPA adopts Final Rule for Control of Emissions of Air Pollution from Locomotive
Engines and Marine Compression-Ignition Engines Less Than 30 Liters per Cylinder.
2010
▪ Ports adopt 2010 CAAP Update, which for the first time includes emission reduction targets for 2014 and 2023 and a health-risk reduction goal for 2020.
▪ EPA adopts Final Rule for Control of Emissions from New Marine Compression-Ignition Engines at or Above 30 Liters per Cylinder.
▪ The International Maritime Organization officially designates waters off North American coasts as an Emission Control Area in which stringent international emission standards apply to ships. The first-phase fuel sulfur standard began in 2012, the second phase began in 2015, and stringent NOx engine standards began in 2016.
2011 ▪ EPA adopts Final Rule for Phase 1 Greenhouse Gas Emissions Standards and Fuel
Efficiency Standards for Medium- and Heavy-Duty Engines and Vehicles.
2016
▪ EPA adopts Final Rule for Phase 2 Greenhouse Gas Emissions Standards and Fuel Efficiency Standards for Medium- and Heavy-Duty Engines and Vehicles.
▪ Findings from the 2016 EPA National Port Strategy Assessment confirm that effective air quality improvement strategies are available for every type and size of port. EPA launches Ports Initiative.
2017
▪ Ports meet and exceed the 2014 emission reduction targets and achieve the 2023 targets for all pollutants but NOx.
▪ Ports adopt the 2017 CAAP Update with new strategies, a zero-emissions goal, and GHG reduction goals.
18 Singh, M., Phuleria, H.C., Bowers, K., Sioutas, C. 2006. Seasonal and spatial trends in particle number concentrations and size distributions at Children’s Health Study sites in southern California. Journal of Exposure Science and Environmental Epidemiology 16: 3–18. https://www.nature.com/articles/7500432.

10
A Comprehensive Approach
The CAAP takes a broad, comprehensive and quantitative approach to reducing emissions at the SPBP,
setting “San Pedro Bay Standards” to reduce public health risks from toxic air contaminants and
addressing the Ports’ “fair share” of criteria pollutant emissions that contribute to regional
nonattainment.19 The CAAP also instituted project-specific standards for major SPBP projects through a
CEQA lens, as well as source-specific standards for port-related source categories, including heavy-duty
vehicles/trucks, ocean-going vessels, CHE, harbor craft, and locomotives. These three levels of standards
are described in detail in CAAP Section 2.2. Because most of the source-specific performance standards
and their related control measures accelerated or exceeded existing regulatory requirements, the Ports
also identified workable implementation strategies that they could use to implement control measures
and meet overall public health goals. Those strategies are outlined in CAAP Section 5.
Inventories, targets, and goals
Accurate, reliable emission estimates provide the foundation for identifying key pollution sources and
establishing equitable emission reduction measures for future port operations. To this end, the SPBP
conducted emission inventories for all significant sources of air pollution operating within their
boundaries during the 2001–2002 timeframe.20 These initial inventories helped the Ports formulate the
2006 CAAP measures; however, the Ports continued to refine and enhance these inventories in
consultation with air quality regulatory agencies, ultimately resulting in the highly detailed 2005 emission
inventories, which became the basis for measuring CAAP progress. Figure 2-1 shows the results of the
initial 2001–2002 inventories for each major source category for DPM, NOx, and SOx.
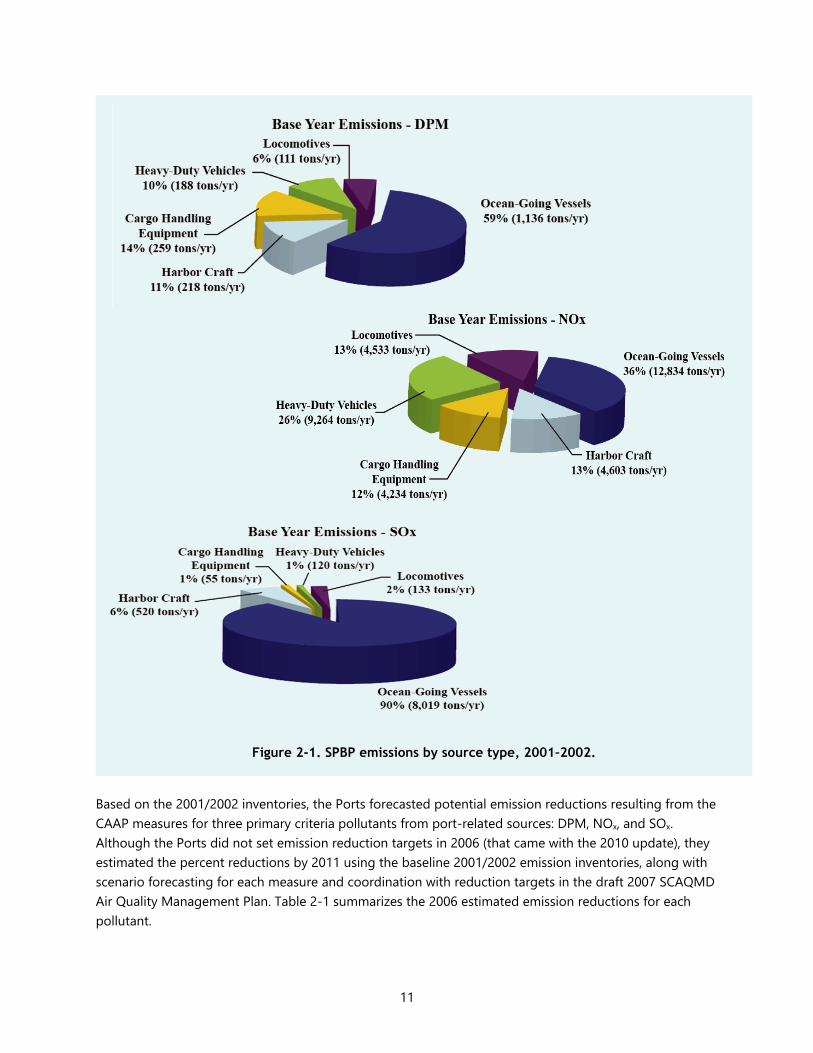
Ocean-going vessels were responsible for most DPM emissions at 59 percent and completely dominated
SOx emissions at 90 percent in the early 2000s. Although their NOx emissions were relatively lower, these
vessels were again the largest single source at 36 percent of the total. DPM and NOx emissions were
distributed relatively evenly across the remaining source categories, meaning that truly extensive
reductions of these pollutants would require an all-inclusive approach with control strategies tailored to
each source type.
19 Port of Los Angeles and Port of Long Beach. 2006. Final 2006 San Pedro Bay Ports clean air action plan: Overview. https://cleanairactionplan.org/documents/2006-clean-air-action-plan-update-final-overview.pdf.
20 Data for the POLA and POLB emission inventories from 2001 and 2002, respectively.
11
Figure 2-1. SPBP emissions by source type, 2001–2002.
Based on the 2001/2002 inventories, the Ports forecasted potential emission reductions resulting from the
CAAP measures for three primary criteria pollutants from port-related sources: DPM, NOx, and SOx.
Although the Ports did not set emission reduction targets in 2006 (that came with the 2010 update), they
estimated the percent reductions by 2011 using the baseline 2001/2002 emission inventories, along with
scenario forecasting for each measure and coordination with reduction targets in the draft 2007 SCAQMD
Air Quality Management Plan. Table 2-1 summarizes the 2006 estimated emission reductions for each
pollutant.
12
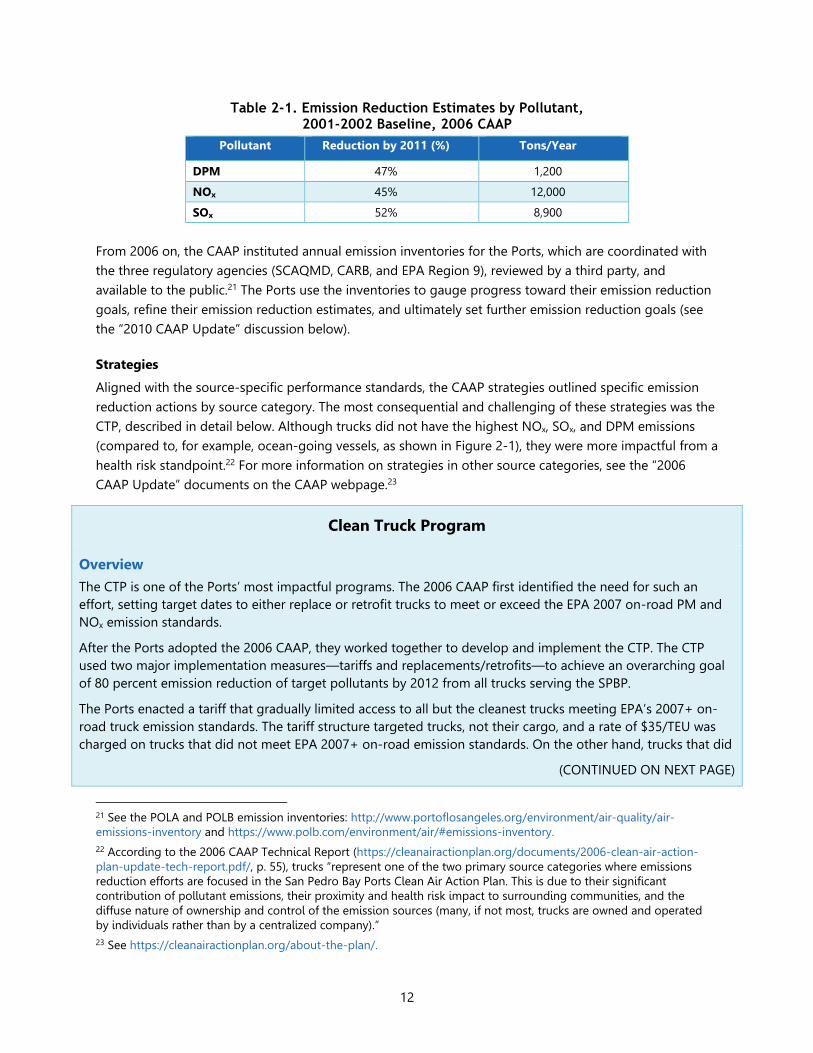
Table 2-1. Emission Reduction Estimates by Pollutant, 2001-2002 Baseline, 2006 CAAP
Pollutant Reduction by 2011 (%) Tons/Year
DPM 47% 1,200
NOx 45% 12,000
SOx 52% 8,900
From 2006 on, the CAAP instituted annual emission inventories for the Ports, which are coordinated with
the three regulatory agencies (SCAQMD, CARB, and EPA Region 9), reviewed by a third party, and
available to the public.21 The Ports use the inventories to gauge progress toward their emission reduction
goals, refine their emission reduction estimates, and ultimately set further emission reduction goals (see
the “2010 CAAP Update” discussion below).
Strategies
Aligned with the source-specific performance standards, the CAAP strategies outlined specific emission
reduction actions by source category. The most consequential and challenging of these strategies was the
CTP, described in detail below. Although trucks did not have the highest NOx, SOx, and DPM emissions
(compared to, for example, ocean-going vessels, as shown in Figure 2-1), they were more impactful from a
health risk standpoint.22 For more information on strategies in other source categories, see the “2006
CAAP Update” documents on the CAAP webpage.23
Clean Truck Program
Overview
The CTP is one of the Ports’ most impactful programs. The 2006 CAAP first identified the need for such an
effort, setting target dates to either replace or retrofit trucks to meet or exceed the EPA 2007 on-road PM and
NOx emission standards.
After the Ports adopted the 2006 CAAP, they worked together to develop and implement the CTP. The CTP
used two major implementation measures—tariffs and replacements/retrofits—to achieve an overarching goal
of 80 percent emission reduction of target pollutants by 2012 from all trucks serving the SPBP.
The Ports enacted a tariff that gradually limited access to all but the cleanest trucks meeting EPA’s 2007+ on-
road truck emission standards. The tariff structure targeted trucks, not their cargo, and a rate of $35/TEU was
charged on trucks that did not meet EPA 2007+ on-road emission standards. On the other hand, trucks that did
(CONTINUED ON NEXT PAGE)
21 See the POLA and POLB emission inventories: http://www.portoflosangeles.org/environment/air-quality/air-
emissions-inventory and https://www.polb.com/environment/air/#emissions-inventory.
22 According to the 2006 CAAP Technical Report (https://cleanairactionplan.org/documents/2006-clean-air-action-
plan-update-tech-report.pdf/, p. 55), trucks “represent one of the two primary source categories where emissions reduction efforts are focused in the San Pedro Bay Ports Clean Air Action Plan. This is due to their significant contribution of pollutant emissions, their proximity and health risk impact to surrounding communities, and the diffuse nature of ownership and control of the emission sources (many, if not most, trucks are owned and operated by individuals rather than by a centralized company).” 23 See https://cleanairactionplan.org/about-the-plan/.
13
meet the EPA standards were exempted from paying the rate. An annual registration fee of $100 was charged
to all trucks to cover the cost of monitoring compliance. The Ports used the funds from collecting fees to clean
up older trucks through retrofits or truck replacements. The Ports stopped collecting tariffs in 2012, when all
trucks serving the SPBP met the 2007+ emission standards.
Additionally, the Ports banned older trucks following a tight schedule:
▪ Phase 1: By October 1, 2008, banned all pre-1989 model year (MY) engines.
▪ Phase 2: By January 1, 2010, banned all 1989–1993 MY engines. Also required 1994–2003 MY engines to achieve an 85 percent DPM reduction and a 25 percent NOx reduction using CARB-approved Level 3 technologies, plus NOx verified diesel emission control strategies.
▪ Phase 3: By January 1, 2012, banned all drayage truck engines that did not meet 2007 federal on-road standards.
Despite the CTP’s success in reducing emissions, numerous challenges arose throughout its implementation.
The Ports and other stakeholders had many concerns about the trucking sector’s financial ability to upgrade its
equipment and feared that enough clean trucks would not be available to meet their operational needs. Many
of the drayage trucks in use were decades old, and truck owners generally were not well positioned to invest in
newer, more expensive trucks. Industry challenged some aspects of the program, such as requirements for truck
maintenance, but these were ultimately upheld in court.24
At the same time, however, new state and federal regulations provided opportunities for aggressive action.
CARB was developing new requirements for trucks servicing ports and rail yards in California—the State
Drayage Truck Rule—with the intention that once the requirements came into full effect in 2014, the state
would supplant the Ports’ program. This regulation served as a basis for the Ports’ emission reduction
requirements, which implemented the state’s requirements on an accelerated timeline, with incentives to help
the industry comply. Finally, EPA had already promulgated emission standards for new heavy-duty on-road
truck engines manufactured in 2007 and 2010, providing assurances that truck engines meeting the emission
requirements would be available.
Through the Ports’ combined efforts, the availability of grant funding to purchase new trucks, and the
impending turnover requirements of the State Drayage Truck Rule in 2014, the CTP was implemented to
dramatic effect. The 2010 CAAP Update provided the first results and analysis of the CTP, and the 2017 CAAP
Update provided some additional program revisions.
Timeline
In 2007, both Ports began developing the CTP. Each Port’s Board of Harbor Commissioners approved the CTP
tariff in November 2007 and the truck environmental fee in December 2007. Throughout the next few years, the
Ports adhered to the following timeline:25
▪ March 2008: Each Port adopted concession program requirements.26
(CONTINUED ON NEXT PAGE)
24 NRDC. 2010 (August 27). Court ruling: Los Angeles Clean Truck Program legally sound. https://www.nrdc.org/media/2010/100827. 25 Throughout this time, HDV2 also supported new, complementary developments for alternative fuel sources and other clean technologies. In 2008, POLA completed a successful prototype test of a zero-emission, Class 8, all-electric truck. From 2009 to 2010, POLA received 25 electric trucks operating with advanced lithium-ion battery systems for use between marine terminals and near-dock rail facilities and within terminals. Additionally, Clean Energy Fuels Corp. constructed a liquefied natural gas fueling facility in the port area for on-road trucks in 2009; by mid-2010, natural gas powered over 9 percent of the truck fleet. 26 “Concession” refers to a written agreement between the Ports and licensed motor carriers to allow drayage trucks to access port terminals for drayage services under specified terms and conditions.

14
▪ October 2008: Ports implemented first ban date for the oldest trucks (pre-1989 MY).
▪ February 2009: Ports initiated truck environmental fee of $35 for each loaded 20-foot (or less) container and $70 for each loaded container longer than 20 feet for all non-exempt trucks. Also, all trucks operating in the Ports were required to register in the Ports Drayage Truck Registry (PDTR).
▪ September 2009: First anniversary of the CTP; clean trucks meeting the 2007 EPA on-road standards made over half of all truck trips.
▪ June 2010: Trucks meeting EPA’s 2007+ standards comprised an average of 90 percent of container cargo moves to terminals at both Ports.
▪ January 2012: All (100 percent) of the Ports’ fleets consisted of 2007 EPA-compliant trucks or newer.
By 2016, the CTP had achieved a 97 percent decrease in DPM emissions. With the first iteration of the CTP a
success, the Ports wanted to continue the program while adapting it to support the 2017 CAAP Update’s new
goals, advancements in zero- and near-zero-emission truck technologies, and recent changes in state
regulations. The updated CTP timeline has the following targets:
▪ Mid-2018: New trucks entering the PDTR must have a 2014 MY or newer engine. Trucks already registered in the PDTR can continue to operate. The PDTR charges registration fees to carriers and annual fees for each truck.
▪ Early 2020: All heavy-duty trucks will be charged a new tariff to enter the Ports’ terminals, except for trucks that are certified to meet or exceed the near-zero-emission standard.27
▪ 2023: New trucks entering the PDTR must have engines that meet or exceed the near-zero-emission standard. Trucks already registered in the PDTR can continue to operate.
▪ 2035: Only trucks that are certified to meet zero emissions will be exempt from the tariff.
Progress Toward Zero Emissions
Although the CTP exceeded the 2006 CAAP emission reduction goals, plenty of opportunities for further
reduction remain. Initial progress was notable: while heavy-duty trucks operating at both Ports contributed 33
percent of DPM and 39 percent of NOx compared to emissions from all port-related sources in 2008, heavy-
duty trucks decreased their contributions to 20 percent of DPM and 32 percent of NOx by the end of 2009.
However, according to the 2016 POLA and POLB emission inventories, trucks are still the largest contributor of
port-related GHG emissions, representing 40 percent of the SPBP-wide total.
The 2017 CAAP Update includes a goal to transition the current drayage truck fleet to near-zero-emission
technologies in the near term and zero-emission technologies by 2035. As of September 2017, 53 percent of
the engines in the Ports’ drayage fleet met the 2007 EPA standard and 47 percent met the 2010 EPA standard.
Importantly, few zero- and near-zero-emission trucks are commercially available; however, several recent
demonstration projects using a variety of technology and fuel types have shown great promise.28
27 The term “near-zero emissions” has not been precisely defined or standardized at this time. In March 2020, the
Boards of Harbor Commissioners of Los Angeles and Long Beach voted to approve a resolution adopting a Clean
Truck Fund Rate of $10 per TEU; see https://cleanairactionplan.org/2020/03/09/boards-vote-to-adopt-clean-truck-
fund-rate/.
28 On April 3, 2019, the SPBP issued a Drayage Trucks Feasibility Assessment, which “examined the current state of
technology, operational characteristics, economic considerations, infrastructure availability and commercial readiness
relating to cleaner drayage trucks.” See http://www.cleanairactionplan.org/2019/04/03/ports-issue-final-clean-trucks-
assessment/.
15
Technology Advancement Program
Because many low- and zero-emission heavy-duty
equipment technologies were nascent in 2006, the Ports
instituted a first and only port-specific TAP under the
CAAP. The TAP evaluates, demonstrates, pilots, and
incorporates new technologies into the suite of existing
CAAP standards and control measures. This initiative
builds on the successes and synergies among the Ports
and their tenants, CARB, SCAQMD, EPA Region 9, and other stakeholders involved in implementing the
2006 CAAP. Several successful projects occurred in the years following the first CAAP. The TAP builds on
those early successes using funding allocated by the SPBP and additional funding from industry and
government partners. The TAP initially focused on four areas: specific control measure requirements,
“green-container” transport systems, emerging technology testing, and emission inventory improvements.
Port and participating agency staff consult regularly as part of the TAP Advisory Committee. From its
inception in 2007 to 2017, the TAP has been a catalyst for identifying, evaluating, and demonstrating new
technologies for potential commercialization and deployment. During that period, the Ports committed
almost $15 million to over 30 projects, many of which have led to commercialized technologies now used
throughout the SPBP complex.29
2010 CAAP Update
The CAAP was designed to be a living document that the SPBP could update as emission inventory data
accumulated and vehicle and low-emission equipment technologies improved. When the 2006 CAAP was
finalized, community and environmental leaders acknowledged the achievement while also making it clear
that more work remained to be done, including the adoption of a measurable goal for pollutant
reductions and greater public participation in CAAP implementation.30
The 2010 CAAP Update31 assessed the SPBP’s progress toward achieving the original 2006 forecasts and,
for the first time, set quantitative emission reduction targets. Between 2006 and the writing of the 2010
CAAP Update, SPBP staff met regularly to assess progress, review the status of existing control measures,
and evaluate new measures. EPA, CARB, and SCAQMD also continued to work with Port staff to
implement the CAAP. However, the Ports did not employ a formal stakeholder group during the period
between CAAP updates, which community leaders highlighted as an agency shortcoming.32
29 See “2006 CAAP Update” documents at https://cleanairactionplan.org/about-the-plan/.
30 “RE: 2006 final San Pedro Bay Ports Clean Air Action Plan,” joint letter of 28 organizations and individuals to the
POLA and POLB Boards of Harbor Commissioners, November 15, 2006.
31 Port of Los Angeles and Port of Long Beach. 2010. San Pedro Bay Ports Clean Air Action Plan: 2010 update. https://cleanairactionplan.org/documents/2010-final-clean-air-action-plan-update.pdf.
32 Responding to this feedback from communities, the Ports added ongoing quarterly CAAP stakeholder meetings as
a permanent feature of the 2017 CAAP Update (see “2017 CAAP Update” in this report).
“The [2006] CAAP process created markets
and technology much faster than it would
have otherwise. The Ports couldn’t obtain
emission reductions without the technology
elements in the [2006] CAAP.”
-Joseph Lyou, Executive Director, Coalition
for Clean Air
16
Inventories, targets, and goals
The Ports developed the 2010 CAAP Update emission reduction goals based on actual 2005 emission
inventory results. For the first time, the Ports set quantifiable targets for NOx, SOx, DPM, and health risk
reductions through extensive consultations with EPA, CARB, and the SCAQMD, consistent with their
commitment to meet their fair share of mass emission reductions of air pollutants. Figure 2-2 shows the
SPBP contributions to regional DPM and NOx emissions in 2009 and expected contributions in 2023 in the
absence of CAAP measures. The CAAP 2010 Update states that, “The [Ports] acknowledge that if port-
related sources are not controlled to their ‘fair share’ with respect to the other sources in the [South Coast
Air Basin] by the CAAP’s continued implementation and further state regulation, port-related
contributions to the basin’s total emissions… will increase significantly beyond the [2009] levels.”33
33 Port of Los Angeles and Port of Long Beach. 2010. San Pedro Bay Ports Clean Air Action Plan: 2010 update. pp. 25–
27. https://cleanairactionplan.org/documents/2010-final-clean-air-action-plan-update.pdf.

17
Figure 2-2. SPBP contributions to regional DPM and NOx emissions in 2009 and expected contributions in 2023 in the absence of CAAP measures34.
With these data and considerations in mind, the 2010 CAAP Update established a health risk standard of
reducing population-weighted cancer risk from port-related DPM by 85 percent by 2020 (compared to
2005 baseline), as well as the emission reduction standards in Table 2-2.
34 2010 CAAP Update (pp. 25–27).
2009 Emissions - DPM
2023 Expected Emissions - DPM
2009 Emissions - NOx
2023 Expected Emissions - NOx
18
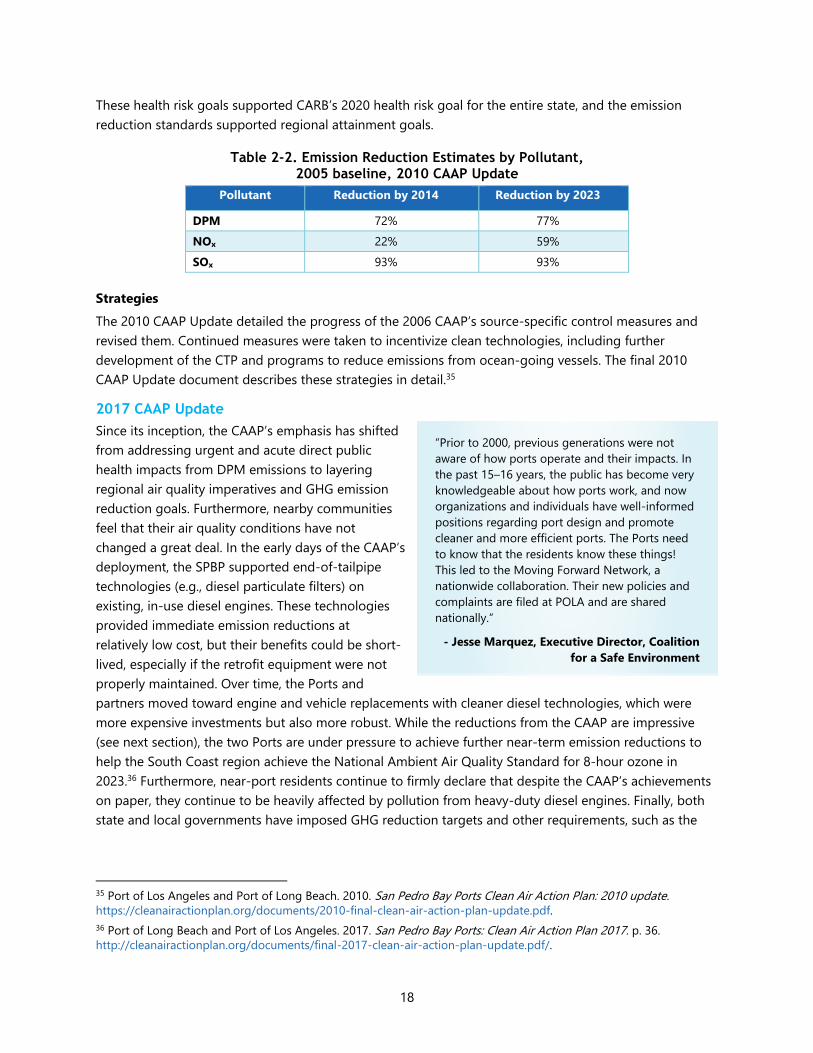
These health risk goals supported CARB’s 2020 health risk goal for the entire state, and the emission
reduction standards supported regional attainment goals.
Table 2-2. Emission Reduction Estimates by Pollutant, 2005 baseline, 2010 CAAP Update
Pollutant Reduction by 2014 Reduction by 2023
DPM 72% 77%
NOx 22% 59%
SOx 93% 93%
Strategies
The 2010 CAAP Update detailed the progress of the 2006 CAAP’s source-specific control measures and
revised them. Continued measures were taken to incentivize clean technologies, including further
development of the CTP and programs to reduce emissions from ocean-going vessels. The final 2010
CAAP Update document describes these strategies in detail.35
2017 CAAP Update
Since its inception, the CAAP’s emphasis has shifted
from addressing urgent and acute direct public
health impacts from DPM emissions to layering
regional air quality imperatives and GHG emission
reduction goals. Furthermore, nearby communities
feel that their air quality conditions have not
changed a great deal. In the early days of the CAAP’s
deployment, the SPBP supported end-of-tailpipe
technologies (e.g., diesel particulate filters) on
existing, in-use diesel engines. These technologies
provided immediate emission reductions at
relatively low cost, but their benefits could be short-
lived, especially if the retrofit equipment were not
properly maintained. Over time, the Ports and
partners moved toward engine and vehicle replacements with cleaner diesel technologies, which were
more expensive investments but also more robust. While the reductions from the CAAP are impressive
(see next section), the two Ports are under pressure to achieve further near-term emission reductions to
help the South Coast region achieve the National Ambient Air Quality Standard for 8-hour ozone in
2023.36 Furthermore, near-port residents continue to firmly declare that despite the CAAP’s achievements
on paper, they continue to be heavily affected by pollution from heavy-duty diesel engines. Finally, both
state and local governments have imposed GHG reduction targets and other requirements, such as the
35 Port of Los Angeles and Port of Long Beach. 2010. San Pedro Bay Ports Clean Air Action Plan: 2010 update. https://cleanairactionplan.org/documents/2010-final-clean-air-action-plan-update.pdf.
36 Port of Long Beach and Port of Los Angeles. 2017. San Pedro Bay Ports: Clean Air Action Plan 2017. p. 36.
http://cleanairactionplan.org/documents/final-2017-clean-air-action-plan-update.pdf/.
“Prior to 2000, previous generations were not
aware of how ports operate and their impacts. In
the past 15–16 years, the public has become very
knowledgeable about how ports work, and now
organizations and individuals have well-informed
positions regarding port design and promote
cleaner and more efficient ports. The Ports need
to know that the residents know these things!
This led to the Moving Forward Network, a
nationwide collaboration. Their new policies and
complaints are filed at POLA and are shared
nationally.”
- Jesse Marquez, Executive Director, Coalition
for a Safe Environment
19
California Sustainable Freight Action Plan, increasing the urgency of the Ports’ drive toward zero
emissions and strengthening the justifications for that push.
The 2017 CAAP Update identifies near-term actions to continue to improve air quality and evaluates new
long-term strategies to achieve the goal of zero emissions at the Ports. Since the Ports adopted the
original CAAP in 2006 and updated it in 2010, they have fully implemented most of the outlined strategies
and are well underway to completing the remainder. Because of the Ports’ past success, the 2017 CAAP
Update does not address the original implementation strategies and control measures but instead focuses
on new strategies and measures.
Throughout the 2017 CAAP Update process, the Ports conducted extensive public outreach and
communication in response to stakeholder feedback from prior CAAP developments. They also stepped
up regulatory and funding advocacy efforts, calling on regulatory agencies and political leaders to provide
adequate resources and strengthen regulatory requirements to support both the Ports’ emission
reduction goals and those of the Southern California Air Basin as a whole.37
Progress since the 2010 CAAP Update
By implementing the 2010 CAAP Update measures, the Ports and surrounding community benefited from
improved air quality through reduced emissions. Cumulatively, the Ports reduced DPM emissions by 87
percent, NOx emissions by 56 percent, and SOx emissions by 97 percent. They also achieved nearly half of
the health risk standard, which called for an 85 percent reduction in cancer risk from air pollution.38 While
port sources significantly reduced emissions, communities near ports continued to experience high
pollution levels.
Public outreach
The 2017 CAAP Update’s outreach process was more robust than previous efforts, with regulators, port
operators, businesses, community organizations, NGOs, energy suppliers, and technology developers all
contributing. The Ports used various outreach strategies, including small focus groups, presentations to
business organizations and neighborhood groups, calls for formal comment, and several presentations to
each Port’s Board of Harbor Commissioners. They publicized updates on CAAP progress and
opportunities for community interaction through press releases and website and social media posts.
Additionally, the Ports held three public workshops that drew more than 375 people total. During two of
these workshops, which included Spanish translation, the Ports used small breakout sessions to drive
more focused and detailed discussions on the proposed CAAP concepts. Based on the input received
throughout this process, the Ports continue to refine, clarify, and modify the CAAP strategies.
37 Port of Long Beach and Port of Los Angeles. 2017. San Pedro Bay Ports: Clean Air Action Plan 2017. pp. 29–31.
http://cleanairactionplan.org/documents/final-2017-clean-air-action-plan-update.pdf/.
38 For example, population-weighted carcinogenic incidence risk in the area fell from 853 per million in 2005 to 367
per million in 2012, as determined by the MATES III and IV studies, respectively. (Port of Long Beach and Port of Los
Angeles. 2017. San Pedro Bay Ports: Clean Air Action Plan 2017. pp. 19–21.
http://cleanairactionplan.org/documents/final-2017-clean-air-action-plan-update.pdf/.)

20
In another significant expansion, the Ports continued the public process into the implementation phase
after adopting the 2017 CAAP Update, holding quarterly public meetings to provide updates and take
informal questions and comments from stakeholders.
In one focus group for this case study, local community members also suggested that the Ports and local
governments continue to improve their public participation methods by varying meeting times to
accommodate different household schedules and translating presentations into plain language.
Targets and goals
The 2017 CAAP Update maintains the criteria pollutant goals from the 2010 CAAP Update while also
identifying long-term GHG reduction goals consistent with state legislation and policy. It also adopts
zero-emission operations as the Ports’ ultimate goal.
For the first time in the CAAP’s history, the Ports incorporated targets for reducing GHG emissions based
on California statewide mandates:
▪ By 2020, reduce GHGs to 1990 levels.
▪ By 2030, reduce GHGs to 40 percent below 1990 levels.
▪ By 2050, reduce GHGs to 80 percent below 1990 levels.
Additionally, the mayors of Los Angeles and Long Beach signed a joint declaration affirming their
commitment to move toward zero emissions, including specific goals for zero-emission CHE by 2030 and
zero-emission drayage trucks by 2035. The Ports also incorporated these goals into the 2017 CAAP
Update.
The 2017 CAAP Update supports the goal of deploying 100,000 zero-emission vehicles by 2030 and
reducing port-related air quality impacts in general. Through a combination of requirements and
incentives, the Ports aim to deploy feasible, cutting-edge technologies in a timely manner.39
Strategies in progress
The implementation strategies for the 2017 CAAP
Update include significant revisions to the CTP (see the
CTP box on page 12 for details). The CAAP
documentation discusses other strategies by source type.
As a necessary first step for achieving their targeted GHG
emission reductions, the Ports developed feasibility
assessments for drayage trucks and CHE, which
examined the “technical readiness levels” of various
powertrain technologies in those sectors.40
39 Although the CAAP is technology-neutral, discussions continue regarding the selection of near-zero emission or
zero-emission technologies for different applications. Evaluations must examine the tradeoffs between continuing
earlier adoption of near-zero emissions, for which technologies are immediately available, and prioritizing the future
development and deployment of zero-emissions technologies, with their associated uncertainties. 40 See https://cleanairactionplan.org/2019/04/03/ports-issue-final-clean-trucks-assessment/ and
https://cleanairactionplan.org/2019/09/20/cargo-handling-equipment-assessment-released/ for more information
and links to each technology assessment.
“What I have seen change throughout the
process, and what was most beneficial, was
the stakeholder involvement. We involved
stakeholders in the initial process, but it was
more to update them about what was going
on throughout the process. For the latest
iteration, we conducted stakeholder
meetings the entire time and asked for a lot
of input.”
-Tim DeMoss, Air Quality
Environmental Affairs Officer, POLA
21
3. Environmental Justice and Levers of Community Influence
Overburdened communities near the SPBP have borne the most direct air quality impacts of port
operations. However, along with the broader environmental justice movement, these communities have
deployed numerous strategies that resulted in the CAAP’s development and influenced its subsequent
cycles of implementation and revision.
Community activists built and used relationships with local politicians to elevate port air quality issues to
city, county, and state political discussions, as well as environmental agency deliberations. They also
formed alliances with mainstream environmental NGOs (e.g., NRDC) as those organizations turned their
attention to environmental justice issues, thereby gaining access to considerable technical and legal
resources. Southern California near-port communities had great success with strategies such as “toxic
tours,” where local organizations invited government decision-makers, agency staff, and other interested
parties to walk the streets and experience local environmental conditions firsthand. Community members
and participating stakeholders credit these in-person experiences with increasing understanding of local
health concerns.
Ultimately, communities in Southern California successfully drew attention to their concerns and
accelerated actions resulting in the CAAP by filing a lawsuit against POLA that threatened to bring
expansion (via a China Shipping terminal) to a halt. That lawsuit was based on CEQA, a state law, so
communities outside of California must identify appropriate legal frameworks within their own regions if
they want to pursue legal remedies for unresolved port violations. Legal action is a potential avenue if
communicating with a port is unproductive over time. While litigation has the potential to create change,
it may also exacerbate adversarial relationships and cost more time and money than other strategies, so
communities should carefully consider lawsuits from several perspectives. In any case, the China Shipping
lawsuit built upon a strong foundation of national movement building and local relationships and
partnerships; other port communities may also find these networks and partnerships to be valuable
sources of policy expertise and political support.
Community representation during the CAAP implementation phase, not just the development phase, is
crucial. The 2010 CAAP Update development process included a stakeholder advisory group, but that
group did not continue into implementation. Development of the 2017 CAAP Update also emphasized
community participation, with regulators, port operators, businesses, community organizations, NGOs,
energy suppliers, and technology developers providing extensive input to refine, clarify, and modify the
plan. In response to community feedback on the 2010 update, the 2017 CAAP Update requires periodic
stakeholder advisory meetings as a component of plan implementation, an improvement that will
facilitate consistent, ongoing community engagement.41 As of January 2020, the Ports held a total of eight
formal stakeholder meetings, one meeting each quarter since adopting the 2017 CAAP Update. Under
immense pressure to produce meaningful and politically viable air quality improvements, SPBP staff and
leadership have moved toward institutionalized community involvement, which has enabled productive
discussions as CAAP implementation continues.
41 For example, http://www.cleanairactionplan.org/2018/03/01/clean-air-action-plan-advisory-meeting-set-for-march-
29/.
22
Increased community involvement has also supported the Ports’ environmental efforts, especially for
issues outside the Ports’ jurisdiction as municipal agencies, a huge limitation when attempting to
comprehensively address port-related air emissions. Funding and incentives are also a major need, given
the high costs of developing, demonstrating, and implementing new freight technologies. Community
groups within the South Coast Air Basin have supported joint advocacy efforts with state and federal
agencies to develop legislation that would advance zero-emission equipment certification and shore
power, for example. Moreover, many community groups have written letters of support for the Ports on
funding applications, which has been critical in bringing grant dollars to San Pedro Bay. Community
groups in other parts of the country can consider providing these types of support for their ports.
Nevertheless, from a community perspective, the SPBP air pollution problem is far from resolved.
Southern California community leaders point out the continued high incidence of asthma in near-port
neighborhoods, particularly among children. Accordingly, they press for increased incentive funding,
stronger regulatory requirements, and accelerated deployment of new technologies.42
Near-port residents highlight real-world operational practices and related compliance and enforcement
issues, including occurrences of dray-off, whereby clean trucks haul cargo off port property and then
transfer them to older trucks at a nearby location, often within the neighboring community. This practice
limits the benefits of new low-emission technologies and compounds the impacts on communities from
idling and local truck traffic.43
Communities also highlight problems that, while obviously related to port operations, are outside the
direct jurisdiction of the SPBP, such as damage to roadways and neighborhood traffic congestion. Finally,
community leaders point out that port, freight, and logistics operations are by no means the only
environmentally damaging activities going on in near-port neighborhoods. Activists note that several
petroleum extraction sites, refineries, and related operations near the SPBP contribute to the cumulative
environmental burden that nearby residents shoulder.
Local communities also continue to have process-related concerns, including the ongoing need to hold
public meetings in locations that are accessible to community members (ideally by public transportation);
at workable hours of the day; and with adequate translation, food, notetaking, and other infrastructure.44
To date, community efforts have successfully pushed the SPBP and other agencies to adopt more
proactive community engagement models, which could serve as models for other port authorities.
42 See “Final 2017 Clean Air Action Plan Update (10/23/17)” and “Response to Comments (10/23/2017)” for specific
community comments and SPBP staff responses.
43 Environmental agencies are aware of the use of “defeat devices,” which unlawfully deactivate emissions control
systems or alter them for reasons of alleged performance or efficiency improvements. (For example, see
https://www.epa.gov/enforcement/national-compliance-initiative-stopping-aftermarket-defeat-devices-vehicles-and-
engines). For information on how the state of California is addressing the dray-off phenomenon, see
https://ww2.arb.ca.gov/drayage-truck-regulation-dray-information.
44 During the near-port resident focus group, community members directed responsibility for these inadequacies not
only at the Ports, but at other agencies and levels of government.

23
4. Technologies and Practices: Development and Deployment
The SPBP has successfully spurred the development of new clean air technologies through local
funds/leveraged resources (i.e., through the TAP), demonstrations, and—most recently—formal
technology assessments. Early/accelerated deployment of clean technologies has also been a goal, as with
the first CTP. Ports and communities, as well as other levels of government, have leveraged civic pride by
celebrating local, homegrown clean technology developers and manufacturers, recalling Southern
California’s industrial history and reinforcing the idea that economic development and environmental
protection are compatible rather than mutually exclusive.
Clean air technology choice is a complex issue in Southern California port and regional air quality
contexts, with strongly held views on all sides. With ongoing impacts to near-port communities, looming
air quality regulatory deadlines, and California state mandates to act on GHG emissions, the Ports are
under pressure to move quickly on CAAP clean air measures. However, that pressure, and the shared
ultimate goal of implementing technologies with zero tailpipe emissions, raises the question of how to
distribute resources at any given moment. At the time of this writing, the SPBP and agencies are
supporting the development and deployment of both low-NOx and zero-emission equipment. Community
advocates closely monitor and publicize the state of various technologies,45 a move that boosts zero-
emission technology providers and increases pressure on the Ports, port industries, and policymakers.
They use this information to contest assertions that technologies are not commercially available or not yet
feasible, pushing SPBP and agency staff to consider alternative pathways to zero-emission adoption—for
example, using zero-emission trucks for full-time, short-haul drayage use—even if those pathways diverge
from current operational practices.46
As noted in the 2017 CAAP Update, “The issue of the best path to zero emissions was one of the most
hotly debated issues during the Draft CAAP Update comment period.”47 For example, many comments
during the development process expressed opposition to SPBP and regional investment in low-NOx/near-
zero-emission combustion technologies fueled by natural gas or diesel. They point out that committing to
natural gas fuels, even for the short term, would require preserving and expanding fossil fuel
infrastructure, with possible environmental impacts including GHG emissions and health effects on nearby
communities. Commenters argued that the CAAP, as well as other state and regional policy and incentive
mechanisms, should focus on accelerating the transition to zero-emission technologies. Other
commenters expressed confidence that combustion fuels could be derived from renewable sources,
increasing their environmental benefits.48 In the 2017 CAAP Update and subsequent technology
assessments, the Ports note that if immediately reducing air emissions is a priority, then low-NOx
technologies are necessary for now, as few zero-emission technologies are commercially available.
45 For example, see the Coalition for a Safe Environment’s “Zero Emission Transportation Vehicles, Cargo Handling Equipment & Construction Equipment Commercial Availability Survey,” available by email from the Coalition at
46 Conversation with Jesse Marquez, Coalition for a Safe Environment, March 13, 2020.
47 Port of Long Beach and Port of Los Angeles. 2017. San Pedro Bay Ports: Clean Air Action Plan 2017. p. 33.
http://cleanairactionplan.org/documents/final-2017-clean-air-action-plan-update.pdf/.
48 Port of Long Beach and Port of Los Angeles. 2017. San Pedro Bay Ports: Clean Air Action Plan 2017. pp. 12–14.
http://cleanairactionplan.org/documents/final-2017-clean-air-action-plan-update.pdf/.

24
For some applications, ports and their stakeholders have identified interim or alternative air pollution
mitigation technologies that may provide more flexibility in planning permanent technology upgrades. At
the SPBP, this discussion has been most prevalent in the context of shore power. New shore power
installations can be expensive, requiring costly upgrades to electrical infrastructure on both shore and
ships to enable safe connection. As an interim or alternative solution, end-of-smokestack “bonnet”
technologies have emerged that can capture and treat some ship emissions from the smokestack,
mitigating pollution released to the atmosphere. Such emission capture technologies can be shore- or
barge-mounted and, unlike shore power, do not require the installation of permanent infrastructure. In
accordance with California At-Berth Regulations,49 CARB has approved two bonnet systems for certain
vessels as alternatives to shore power. Such interim technology choices emerging from TAP efforts can
open multiple pathways to low-emission operations, enabling flexibility in decision-making by port
authorities and stakeholders.50
Standards, particularly for battery electric vehicle charging, are moving targets. The entrepreneurial nature
of technological developments at the Ports have resulted in various manufacturers using different
methods and specifications for vehicle charging. As the 2017 CAAP Update states, “This incompatibility
will lead to potentially significant challenges in the long run. In order to deploy electric equipment on a
large scale, the Ports must adopt charging standards so uniform infrastructure can be built throughout
the port complex and so that a variety of equipment built by multiple manufacturers can be successfully
deployed.”51 In 2015, the Ports began working with stakeholders to develop charging standards for yard
tractors and other CHE types, a project that is still underway.
Partnerships have been crucial, not only with new technology developers and equipment manufacturers,
but with local utility companies and regulators. As non-diesel technologies move into the demonstration
phase, the Ports and terminal operator partners have needed to assess and upgrade electrical
infrastructure and/or arrange for temporary natural gas infrastructure to test zero-emission technologies.
This increases the price tag for demonstration projects but has also impelled close partnerships between
the Ports, regional utilities, the California Energy Commission, and other related entities. In addition to—
or instead of—directly providing financial resources, port authorities can work with tenants (if applicable)
to host or provide space or other in-kind resources for technology demonstrations.
The specific pathway to zero emissions in Southern California ports is still unclear, but the technological
and policy dividends are apparent. With ports and numerous other agencies and organizations devoting
financial and human resources to this problem, technology development, demonstration, and deployment
is proceeding at an accelerated (if somewhat uneven and unpredictable) pace. Ports and communities
outside of this region may be able to take advantage of this accelerated development to “leapfrog” to
cleaner technologies based on the work done in Los Angeles and Long Beach, with the additional option
of modeling policy structures after those at CARB and SCAQMD.
49 California Air Resources Board, Shore Power for Ocean-going Vessels, https://ww3.arb.ca.gov/ports/shorepower/shorepower.htm. 50 See TAP annual and final reports on technology demonstrations at https://cleanairactionplan.org/technology-
advancement-program/reports/ 51 Port of Long Beach and Port of Los Angeles. 2017. San Pedro Bay Ports: Clean Air Action Plan 2017. p. 74.
http://cleanairactionplan.org/documents/final-2017-clean-air-action-plan-update.pdf/.
25
5. The Art of the Possible: The 2017 Clean Truck Program
The 2017 revision of the CAAP CTP provides a useful case study for ports outside of California, because it
was developed as an independent port initiative with fewer “backstop” environmental regulations that
would have enabled strict fleet turnover than the original 2006 CTP. The 2006 CAAP set target dates to
either replace or retrofit trucks to meet or exceed the EPA 2007 on-road air pollutant emission standards.
Also in 2006, new state regulations provided opportunities for action. CARB was in the process of
developing a regulation for trucks servicing ports and rail yards in California, which served as a basis for
the Ports’ emission reduction requirements. In particular, the Ports had to implement the state’s
requirements locally on an accelerated timeline of between two and six years, drawing on financial
support from grants, incentives, and bulk purchase pricing to help the industry comply. Finally, EPA had
already promulgated emission standards for new heavy-duty on-road truck engines manufactured in 2007
and 2010, providing assurances that truck engines meeting the emission requirements would be
available.52
During development of the 2017 CTP Update, these opportunities and assurances were less evident.
Recently enacted legislation prevented state agencies, and by extension the Ports, from imposing truck
bans by model year as the CTP did in 2006. As of this writing, CARB plans to impose a standard that will
require all new heavy-duty engines manufactured in 2023 to meet the near-zero-emissions level.
Equipment manufacturers are currently producing heavy-duty natural gas engines that meet an emission
limit of 0.02 g NOx/brake horsepower-hour. Diesel engines meeting similarly low standards may also be in
production soon. However, fully zero-emission trucks were not yet commercially available in 2017.53 Given
that policy circumstance, the development and implementation of the revised program required careful
evaluation of the Ports’ authorities and levers of influence, and ongoing coordination with industry and
labor stakeholders. It also required measures that fit the Ports’ mandates and legal authorities.
52 Port of Long Beach and Port of Los Angeles. 2017. San Pedro Bay Ports: Clean Air Action Plan 2017. p. 33.
http://cleanairactionplan.org/documents/final-2017-clean-air-action-plan-update.pdf/.
53 The Ports came to a similar conclusion in a Feasibility Assessment for Drayage Trucks. (Port of Long Beach and Port
of Los Angeles. 2020. San Pedro Bay Ports: Clean Air Action Plan: 2018 feasibility assessment for drayage trucks. https://cleanairactionplan.org/documents/final-drayage-truck-feasibility-assessment.pdf/). Some community
members disagree with this assessment; see discussion in previous section.
26
With those factors in mind, the CTP relies on the upcoming 2023 CARB regulatory deadline, economic
incentives and disincentives and the resulting accelerated truck fleet turnover to move toward a greater
share of near-zero- and zero-emission truck cargo moves at the ports. Key milestones include:
▪ Beginning in mid-2018, new trucks entering the Ports Drayage Truck Registry (PDTR) must have a
2014 engine model year or newer. Existing trucks already registered in the PDTR can continue to
operate.
▪ Beginning in early 2020, following promulgation of the state’s near-zero-emission heavy-duty
engine standard, all heavy-duty trucks will be charged a rate to enter the Ports’ terminals, with
exemptions for trucks that are certified to meet a near-zero standard or better.54
▪ Beginning in 2023, or when the state’s near-zero-emission heavy-duty engine standard is required
for new truck engine manufacturers, new trucks entering the PDTR must have engines that meet
the near-zero-emission standard or better. Existing trucks already registered in the PDTR can
continue to operate.
The CTP also modified the truck rate so that by 2035, only trucks that are certified to meet zero emissions
will be exempt from the rate.
Importantly, finalizing and moving toward implementation of the 2017 CAAP Update required not only a
firm milestone—zero emissions by 2035—but also a flexible framework that left numerous questions to
investigate and measures to develop. The Ports released a Clean Trucks Assessment in early 2019 to
address questions about the “technical readiness level” of numerous near-zero- and zero-emission
technologies. At the same time, the Ports continue to devote significant resources to technology
development and demonstration through the TAP and partnerships with technology developers; original
equipment manufacturers; truck fleet and terminal operators; and regional, state, and federal agencies.
54 In March 2020, the Boards of Harbor Commissioners of Los Angeles and Long Beach approved a resolution
adopting a Clean Truck Fund Rate of $10 per TEU; see https://cleanairactionplan.org/2020/03/09/boards-vote-to-
adopt-clean-truck-fund-rate/.

27
6. Conclusions and Lessons Learned
Community-Port Collaboration
The strategies, relationships, and alliances formed by Southern California near-port communities paved
the way for active community-port collaboration through the CAAP. Community members’ ongoing
relationships with local policymakers, environmental NGOs, labor organizations, and agency and SPBP
staff form an infrastructure that allows for active communication and collaboration on port-related
environmental issues. They have also formed alliances with other communities (most recently though
organizations like the Moving Forward Network) to elevate common issues and amplify environmental
justice perspectives on ports and freight movement nationwide. The SPBP and other government agencies
have established their own practices to facilitate collaboration with communities, such as the CAAP
stakeholder advisory group. Community and environmental groups continue to exert strong pressure on
the SPBP, regulatory agencies, and industry to quickly develop and deploy low-polluting equipment
technologies, address operational practices that exacerbate pollution, and increase community
involvement. Among other lessons, the CAAP experience has made it clear that community representation
during the plan implementation phase, not just the development phase, is crucial.
Near-port communities elsewhere can build upon this infrastructure to facilitate collaboration with their
own neighboring port authorities. Port authorities and environmental agencies can also use these
structures and practices, with the understanding that as organizations with budgets and paid staff, they
can and should make participation easier for community members—for example, by offering flexible
meeting times, food and/or childcare, and other measures. Built on engagement, collaboration, and
information sharing, productive port-community working relationships are fluid, time-intensive, and
essential to the success of port environmental programs.55 Port-community engagement may also take
place through other government processes, such as regional air quality and/or transportation planning.
Such processes usually incorporate public participation and can give communities and port authorities an
opportunity to raise issues outside of the local port decision-making process.56
Community-port collaborations do not need to start with a fully comprehensive clean air plan. In the San
Pedro Bay area, collaborative efforts date back to 2001, when the City of Los Angeles convened the NNI
Task Force, made up of regulatory agency representatives, the maritime industry, labor unions,
environmental organizations, and community representatives. The NNI Task Force’s report recommended
initiatives and technologies for achieving zero increase in port-related emissions. While preliminary and
incomplete, the effort provided a basis for more extensive strategies and achievements under the CAAP.
Ports just beginning their outreach and communication efforts will likely need to take incremental steps;
however, if these efforts are sustained, they may lead to more robust community participation, more
55 One focus group comment noted that many near-port residents are not familiar with or even aware of the CAAP,
indicating that some decisions are being made without adequate community participation. Accordingly, agencies and
port authorities should continually evaluate and improve their community engagement efforts to ensure adequate
participation and meaningful public input. See the “Acknowledgments” section for more information on the focus
groups convened for this case study.
56 In the SPBP case, discussions have recently taken place through the California Sustainable Freight Management
Plan (https://dot.ca.gov/programs/transportation-planning/freight-planning/csfap) and SCAQMD Facility-Based
Mobile Source Measure (http://www.aqmd.gov/home/air-quality/clean-air-plans/air-quality-mgt-plan/facility-based-
mobile-source-measures) processes.

28
innovative projects and programs, and ultimately better environmental outcomes. The EPA Ports
Initiative’s resources for community-port collaboration contain additional case studies, lessons learned,
and information on funding sources for developing successful collaborative relationships.57
Emission Inventories, Quantified Targets, and Technical Innovations
The CAAP (as of the 2010 update) was the first U.S. port air quality program to include quantitative air
emission reduction targets. The adoption of these quantitative targets was possible because the SPBP
instituted annual emission inventories several years prior. The SPBP has developed and published detailed
emission inventories each year since 2003. These regular reports provide timely information for technical
air quality managers and are essential for demonstrating the CAAP’s ongoing effectiveness to the
surrounding community. Other ports can use the methodologies for the POLA and POLB inventories as an
example for data collection and emission inventory estimation.58
While developing detailed inventories can require significant resources, inventories help determine the
best ways to reduce emissions from a specific port and provide an important benchmark against which to
measure progress toward a port’s emission reduction goals. Beyond characterizing the overall scope of
the air quality challenge, inventories can identify significant sources of emissions, perhaps resulting in
surprises and changes in emphasis for community advocates and port managers. Moreover, when
combined with equipment replacement and/or remediation cost information, inventory data can show
ports and communities how to achieve the most cost-effective emission reductions with available funding
and put quantitative emission reduction targets within reach.
Even when ongoing emission inventories are not possible at a given port, port authorities can still set
goals and track progress toward lower emissions using other metrics and indicators. For example, ports
regularly record vessel counts and speed data to determine participation rates for vessel speed reduction
(VSR) programs. Ports implementing their own VSR programs can track these rates over time to assess
progress toward meeting emission reduction goals and identify opportunities for further improvements.
POLA achieved over 90 percent compliance with its VSR program within 20 nautical miles in 201759 and
seeks to further increase participation under the 2017 CAAP Update.
The SPBP truck registry and gate management systems were critical in ensuring compliance with CTP
requirements, and the Ports successfully diverted approximately 50 percent of their truck traffic away from
peak congestion periods. Where available, other ports may use data from gate management systems to
track truck traffic throughput and engine model year/emission standard distributions to help estimate
how truck emission contributions change over time. Ports can also utilize existing ranking systems such as
the Environmental Ship Index and the Green Ship Incentive Program, adopted by POLA and POLB,
respectively, to encourage and track progress toward vessel efficiency and emission improvements.
57 See https://www.epa.gov/community-port-collaboration.
58 See http://www.portoflosangeles.org/environment/air-quality/air-emissions-inventory and
https://www.polb.com/environment/air/#emissions-inventory.
59 See Port of Los Angeles, Vessel Speed Reduction Program, https://www.portoflosangeles.org/environment/air-
quality/vessel-speed-reduction-program.

29
Technology demonstration initiatives such as the SPBP TAP60 can provide a mechanism for port
authorities to signal their interest in various pollution reduction technologies, evaluate proposals from
technology developers, and support the development and demonstration of such technologies with local
funds and leveraged resources. Since 2006, the SPBP TAP has issued requests for proposals, calls for
projects, and port-initiated projects to identify potential demonstration projects, and the program has
accepted unsolicited proposals for consideration.
Future SPBP technology decisions will be supported by the Ports’ technology assessments,61 which
analyze the technical readiness levels of various trucking and CHE technologies; these assessments may
be useful to ports seeking to implement alternative technologies. EPA’s Ports Initiative provides additional
technical resources to help ports estimate emissions and assess reduction strategies, including the Shore
Power Technology Assessment, the National Port Strategy Assessment, findings from the EPA and Port
Everglades Partnership: Emission Inventories and Reduction Strategies, and the updated 2009 Port
Emissions Inventory Guidance.62
As demonstrated by the initial CAAP and its subsequent updates, emission reductions can occur while
maintaining a balance with economic viability. Through effective integration of more energy-efficient and
cleaner technologies, ports can minimize cost impacts while simultaneously reducing emissions. By
prioritizing equipment that generates the most emissions, identified through emission inventories, ports
can achieve reductions in the quickest amount of time. In some cases, changes in operational practices
can also result in significant emission benefits and fuel savings.
Partnerships with Government and Industry
The CAAP required careful partnership and coordination among numerous stakeholders, including the
shipping industry; technology developers and manufacturers; near-port residents; environmental
organizations; and local, state, and federal governments. To implement and achieve meaningful emission
reduction targets, it was particularly crucial for the Ports to work with a full range of partners to ensure
that CAAP targets could be ambitious and achievable and contribute to attaining regional air quality
requirements.
The SPBP experience demonstrates the effectiveness of dedicating government resources beyond the port
authority level to implement and monitor emission reduction strategies over time. Coordination with local
governments and planning agencies, state governments, and federal agencies such as EPA can help
secure funding and develop infrastructure conducive to emission reductions.
A combination of state and local government initiatives created an array of regulatory and voluntary
programs and funding mechanisms conducive to the CAAP’s development. For example, CARB
requirements for ultra-low sulfur diesel fuel use and enhanced emission standards for CHE before 2006
focused industry and public attention on specific emission sources and control strategies that the CAAP
later expanded upon. Additional emission control measures continued to support CAAP goals, such as the
2012 SCAQMD plan for ports to develop at-berth regulation amendments and CHE requirements to
60 See http://www.cleanairactionplan.org/technology-advancement-program/.
61 See https://cleanairactionplan.org/2019/04/03/ports-issue-final-clean-trucks-assessment/ and
https://cleanairactionplan.org/2019/09/20/cargo-handling-equipment-assessment-released/.
62 See https://www.epa.gov/ports-initiative/technical-resources-ports.
30
achieve zero-emission targets by 2030. In this way, government programs complemented CAAP measures,
providing the Ports and industry with economic incentives for creative emission reduction strategies, as
well as a backstop ensuring environmental progress. Community support was crucial to all these
programs, including testimony that supported regulations and incentives, as well as support letters for
specific projects that needed funding.
The experience in San Pedro Bay illustrates that state and local governments can play a significant role in
reducing air pollution at ports. Governments can direct money toward port projects that reduce
emissions, develop voluntary incentive programs, partner with port entities to obtain additional resources,
and—when appropriate—develop cost-effective regulations to reduce emissions.
Collaboration with the shipping industry and technology developers and manufacturers has also been
crucial for CAAP development and implementation. Data on vessel, terminal, truck, and train operations
are fundamental to building credible emission inventories that accurately characterize emissions related to
port operations. Ports need to closely cooperate and coordinate with industry partners to evaluate new
freight technologies and to test and demonstrate emerging technologies while continuing normal
operations. Finally, as with community stakeholders, industry backing for government funding and
incentive programs has been crucial to building support for those programs.

31
Acknowledgments
Creating the Case Study of the San Pedro Bay Ports’ Clean Air Action Plan 2006–2018: Best Practices and
Lessons Learned would not have been possible without the enthusiastic cooperation and participation of
several organizations and individuals. The U.S. Environmental Protection Agency (EPA) would like to thank:
The Coalition for a Safe Environment and Jesse Marquez, Executive Director.
The Coalition for Clean Air and Joseph Lyou, President and CEO.
The Long Beach Alliance for Children with Asthma and Sylvia B. Betancourt, Project Manager.
The Natural Resources Defense Council and Melissa Lin Perrella, Senior Director, Environmental Justice,
Healthy People, and Thriving Communities Program.
The Port of Long Beach and Rick Cameron, Deputy Executive Director of Planning and Development;
Heather Tomley, Director of Environmental Planning; and Renee Moilanen, Manager of Air Quality
Programs.
The Port of Los Angeles and Christopher Cannon, Director of Environmental Management; Lisa Wunder,
Marine Environmental Manager; and Tim DeMoss, Air Quality Environmental Affairs Officer.
These organizations took the time to participate in three focus discussion groups that EPA Region 9
representatives held throughout March and April 2018. The Long Beach Alliance for Children with Asthma
hosted an additional focus group with near-port residents in September 2018, with assistance from Skeo
Solutions and EPA Region 9. The focus group outcomes contributed greatly to this report.