sandia capabilities for the measurement, characterization...
TRANSCRIPT

SANDIA REPORT SAND2013-5492 Unlimited Release Printed July 2013
Sandia Capabilities for the Measurement, Characterization, and Analysis of Heliostats for CSP Charles E. Andraka, Joshua M. Christian, Cheryl M. Ghanbari, David D. Gill, Clifford K. Ho, William J. Kolb, Timothy A. Moss, Edward J. Smith, and Julius Yellowhair Prepared by Sandia National Laboratories Albuquerque, New Mexico 87185 and Livermore, California 94550 Sandia National Laboratories is a multi-program laboratory managed and operated by Sandia Corporation, a wholly owned subsidiary of Lockheed Martin Corporation, for the U.S. Department of Energy's National Nuclear Security Administration under contract DE-AC04-94AL85000. Approved for public release; further dissemination unlimited.

2
Issued by Sandia National Laboratories, operated for the United States Department of Energy by Sandia Corporation. NOTICE: This report was prepared as an account of work sponsored by an agency of the United States Government. Neither the United States Government, nor any agency thereof, nor any of their employees, nor any of their contractors, subcontractors, or their employees, make any warranty, express or implied, or assume any legal liability or responsibility for the accuracy, completeness, or usefulness of any information, apparatus, product, or process disclosed, or represent that its use would not infringe privately owned rights. Reference herein to any specific commercial product, process, or service by trade name, trademark, manufacturer, or otherwise, does not necessarily constitute or imply its endorsement, recommendation, or favoring by the United States Government, any agency thereof, or any of their contractors or subcontractors. The views and opinions expressed herein do not necessarily state or reflect those of the United States Government, any agency thereof, or any of their contractors. Printed in the United States of America. This report has been reproduced directly from the best available copy. Available to DOE and DOE contractors from U.S. Department of Energy Office of Scientific and Technical Information P.O. Box 62 Oak Ridge, TN 37831 Telephone: (865) 576-8401 Facsimile: (865) 576-5728 E-Mail: [email protected] Online ordering: http://www.osti.gov/bridge Available to the public from U.S. Department of Commerce National Technical Information Service 5285 Port Royal Rd. Springfield, VA 22161 Telephone: (800) 553-6847 Facsimile: (703) 605-6900 E-Mail: [email protected] Online order: http://www.ntis.gov/help/ordermethods.asp?loc=7-4-0#online
3
SAND2013-5492 Unlimited Release Printed July 2013
Sandia Capabilities for the Measurement, Characterization, and Analysis of Heliostats for
CSP
Charles E. Andraka, Joshua M. Christian, Cheryl M. Ghanbari, David D. Gill, Clifford K. Ho, William J. Kolb, Timothy A. Moss, Edward J. Smith, and Julius Yellowhair
Concentrating Solar Technologies Sandia National Laboratories
P.O. Box 5800 Albuquerque, New Mexico 87185-1127
Abstract
The Concentrating Solar Technologies Organization at Sandia National Laboratories has a long history of performing important research, development, and testing that has enabled the Concentrating Solar Power Industry to deploy full-scale power plants. Sandia continues to pursue innovative CSP concepts with the goal of reducing the cost of CSP while improving efficiency and performance. In this pursuit, Sandia has developed many tools for the analysis of CSP performance. The following capabilities document highlights Sandia’s extensive experience in the design, construction, and utilization of large-scale testing facilities for CSP and the tools that Sandia has created for the full characterization of heliostats. Sandia has extensive experience in using these tools to evaluate the performance of novel heliostat designs.

4
This page intentionally left blank
5
CONTENTS
1. A Summary of Sandia National Laboratories’ Instrumentation and Analytical Methods for Concentrating Solar Power ............................................................................................................. 9
1.1. Beam Characterization System and Flux Map.................................................................. 9 1.1.1. Beam Characterization System ........................................................................... 9 1.1.2. PHLUX Mapping Method ................................................................................. 11
1.2 Long Range Flux Array ................................................................................................... 12 1.3. Meteorological Station .................................................................................................... 14 1.4 Reflectometry and Soiling ............................................................................................... 15 1.5. Heliostat Aerodynamic Assessment ............................................................................... 16 1.6. Surface Slope Error ......................................................................................................... 20 1.7. State-of-the-Art ............................................................................................................... 21
1.7.1. In-Field Heliostat Alignment – HFACET ......................................................... 21 1.7.2. Compensation of Gravity Induced Heliostat Deflections for Improved Optical Performance .................................................................................................................. 23 1.7.3. Heliostat Tracking Error Estimation ................................................................. 23
2. Track Record and Experience with Design and Execution of Similar Projects ...................... 24 2.1. Experience Operating a Solar Thermal Test Facility ...................................................... 24 2.2. Experience Operating a Heliostat Test Facility .............................................................. 27 2.3. Experience with Project Implementation from Conceptual Design Through Testing of Hardware ................................................................................................................................. 29
2.3.1. Advanced Dish Development System ............................................................... 29 2.3.2. Molten Salt Test Loop (MSTL) ......................................................................... 30
3. Previous Experience with the Fabrication of Proprietary Equipment ..................................... 31 3.1. SOFAST/AIMFAST ....................................................................................................... 32 3.2. TOPCAT ......................................................................................................................... 33
4. Track Record and Experience with Instrumentation and Analytical Methods ........................ 34
5. Disciplines, Engineering Capacity, Skill Level, and Experience in Design of the Required Systems ......................................................................................................................................... 34
6. References ................................................................................................................................ 35
6
FIGURES Figure 1. A Screenshot of Sandia's BCS System Illustrates Some of the BCS Capabilities. ...... 10 Figure 2. Left: Collimated LI-COR pryanometer [1]. Middle: Photo of trailer-mounted mobile heliostat target with NSTTF central receieiver tower in background. Right: close-up of collimated pyranometers mounted on aluminum tower [2]. ......................................................... 12 Figure 3. Qualitative comparison of beam shape as rendered by three methods at different times of day [2]. ...................................................................................................................................... 13 Figure 4. An Ideal Meteorological Platform Is Positioned to be Above Obstructions and Positioned Near the Point of Interest. ........................................................................................... 15 Figure 5. Left: Anemometer groups. Right: Photo of heliostat-mounted anemometers [13]. ... 16 Figure 6. Left: Data acquisition system and interface for dynamic heliostat monitoring. Right: sensor placement for well-instrumented heliostat (11W14) [13]. ................................................ 17
Figure 7. Right: Simulated modal shape for mode 4 (torque-tube bending at 3.45 Hz). Right: Experimental mode shape derived from accelerometer data at 3.57 Hz (red lines denote vertical trusses, the green line denotes the torque tube, and the yellow line denotes the upper-left facet) [13]. ............................................................................................................................................... 17 Figure 8. Heliostat deformed shapes and corresponding beam shapes, beam shapes are located on tower with the positive direction to the left and up [13]. ......................................................... 18 Figure 9. Structure locations with accumulated fatigue damage for selected mode shapes [13]. 19 Figure 10. Schematic of the HFACET System for In-Field Heliostat Alignment Assessment. .. 22 Figure 11. Image of the tower-top high-resolution digital camera looking down on the NSTTF field (left), and a camera’s view of the heliostat with a target in reflection. ................................ 23 Figure 12. Sandia’s 214 Heliostats, as Seen From the Tower, Are Used for a Broad Range of Solar Thermal Testing................................................................................................................... 25 Figure 13. Sandia's Solar Tower Has 3 Test Bays on the Front and Infrastructure for Tower Top Testing As Well. ........................................................................................................................... 26 Figure 14. Sandia's Central Receiver Test Facility Control Room with (left to right) Heliostat Control, Test Director, and DAQ Stations. ................................................................................... 27 Figure 15. A Small Sampling of the Many Heliostat Designs Tested at Sandia's NSTTF Using Sandia-Developed Tools and Methods [18]. ................................................................................ 28 Figure 16. The Molten Salt Test Loop (foreground) and the Central Receiver Test Facility (background) at Sandia. ................................................................................................................ 30 Figure 17. MSTL Customer Test Interface Stations Provide Flexibility in Meeting Customer's Needs for Electrical Power, Compressed Air, Control System Interactions, and Data Acquisition........................................................................................................................................................ 31 Figure 18. TOPCAT Measurements of Trough Optics Are Performed in a SEGS Plant. ........... 33

7
NOMENCLATURE ADDS – Advanced Dish Development System AIMFAST – Alignment Implementation for Manufacturing Fringe Analysis Slope Technique BCS – Beam Characterization System CFD – Computational Fluid Dynamics CRTF – Central Receiver Test Facility CSP – Concentrating Solar Power DAQ – Data AcQuisition system FEA – Finite Element Analysis HFACET – Heliostat Focusing and Canting Enhancement Technique LCOE – Levelized Cost Of Electricity LRHT – Long Range Heliostat Target MSTL – Molten Salt Test Loop NSTTF – National Solar Thermal Test Facility at Sandia National Laboratories OPC – Open Process Control PHLUX - PHotographic fLUX ROM – Rough Order of Magnitude Sandia – Sandia National Laboratories, Concentrating Solar Technologies Group SOFAST – Sandia Optical Fringe Analysis Slope Tool
TOPCAT – Theoretical Overlay Photographic Collector alignment Technique

8
This page intentionally left blank.
9
1. A SUMMARY OF SANDIA NATIONAL LABORATORIES’ INSTRUMENTATION AND ANALYTICAL METHODS FOR
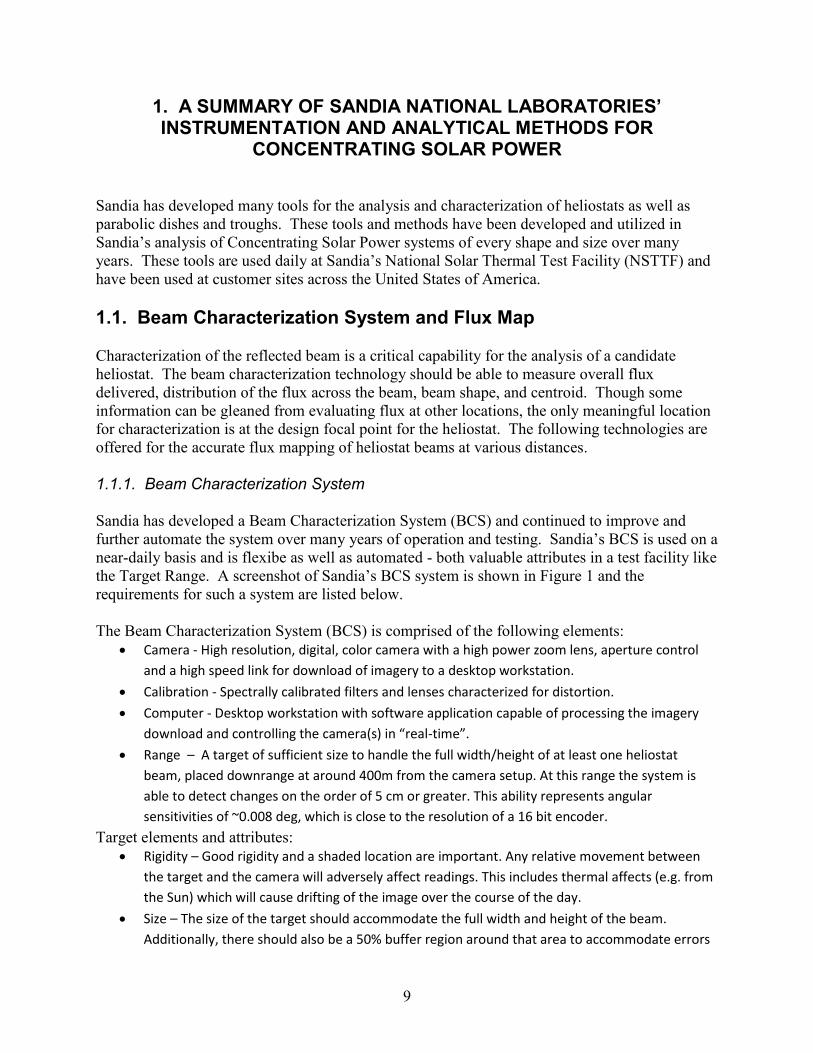
CONCENTRATING SOLAR POWER Sandia has developed many tools for the analysis and characterization of heliostats as well as parabolic dishes and troughs. These tools and methods have been developed and utilized in Sandia’s analysis of Concentrating Solar Power systems of every shape and size over many years. These tools are used daily at Sandia’s National Solar Thermal Test Facility (NSTTF) and have been used at customer sites across the United States of America. 1.1. Beam Characterization System and Flux Map Characterization of the reflected beam is a critical capability for the analysis of a candidate heliostat. The beam characterization technology should be able to measure overall flux delivered, distribution of the flux across the beam, beam shape, and centroid. Though some information can be gleaned from evaluating flux at other locations, the only meaningful location for characterization is at the design focal point for the heliostat. The following technologies are offered for the accurate flux mapping of heliostat beams at various distances. 1.1.1. Beam Characterization System Sandia has developed a Beam Characterization System (BCS) and continued to improve and further automate the system over many years of operation and testing. Sandia’s BCS is used on a near-daily basis and is flexibe as well as automated - both valuable attributes in a test facility like the Target Range. A screenshot of Sandia’s BCS system is shown in Figure 1 and the requirements for such a system are listed below. The Beam Characterization System (BCS) is comprised of the following elements:
Camera - High resolution, digital, color camera with a high power zoom lens, aperture control
and a high speed link for download of imagery to a desktop workstation.
Calibration - Spectrally calibrated filters and lenses characterized for distortion.
Computer - Desktop workstation with software application capable of processing the imagery
download and controlling the camera(s) in “real-time”.
Range – A target of sufficient size to handle the full width/height of at least one heliostat
beam, placed downrange at around 400m from the camera setup. At this range the system is
able to detect changes on the order of 5 cm or greater. This ability represents angular
sensitivities of ~0.008 deg, which is close to the resolution of a 16 bit encoder.
Target elements and attributes: Rigidity – Good rigidity and a shaded location are important. Any relative movement between
the target and the camera will adversely affect readings. This includes thermal affects (e.g. from
the Sun) which will cause drifting of the image over the course of the day.
Size – The size of the target should accommodate the full width and height of the beam.
Additionally, there should also be a 50% buffer region around that area to accommodate errors

10
in pointing, wind effects or other beam anomalies. The required target width will depend on
the slant range and the size and format of the heliostats. Heliostats that have flat, full-width
mirrors are often less expensive and complicated, but produce a very large beam in at least one
direction. The heliostat requirements will influence the design of the target.
Material – material of the target should have a Lambertian surface and, when combined with
the appropriate paint covering, able to withstand at least 50 suns for 5 minutes with no
detectable change in optical quality of the target. If the goal is to put all 10 heliostats on the
target at one time, the target will likely require active cooling with a closed loop glycol-water
system. This requirement should be carefully evaluated to determine the utility as it will
significantly increase the cost of the target system and will only add incremental value for
heliostat analysis.
Flux target (the “BCS Hole”) – In Sandia’s BCS system, this is a hole covered by a plate, 0.6m
diameter, with a calibrated flux gauge at its center. The relative center of the flux gauge is
known to 1 cm. The plate is a water cooled, serpentine target of specific design determined
through years of experience. The size of the plate would depend on the number of heliostats to
be put on target and the relative size and shape (Gaussian or tophat) of the concentrated
sunlight impinging on the target.
Figure 1. A Screenshot of Sandia's BCS System Illustrates Some of the BCS Capabilities.
11
Essential BCS software features include:
Centroid Calculation - The ability to calculate the beam centroid and illustrate its position on the
image (real-time). The centroid position is based on a “center of mass” calculation using pixel
intensity values.
Thresholding - The ability to adjust the image intensity threshold to remove the effects of
background noise in corrupting the beam centroid.
Scaling - Based on the W/cm^2 detected at the flux gauge, the image flux distribution is
determined by scaling to the relative pixel intensities. In this way, the maximum flux (W/cm2) is
determined. By integrating over the total area of the image the total power of the beam (Watts)
can be determined.
Many other features are included in the BCS software are being driven by levels of automation
required. Examples include interaction with other pointing and tracking programs, the number
of beams to be processed simultaneously, the need for tracking correction, etc.
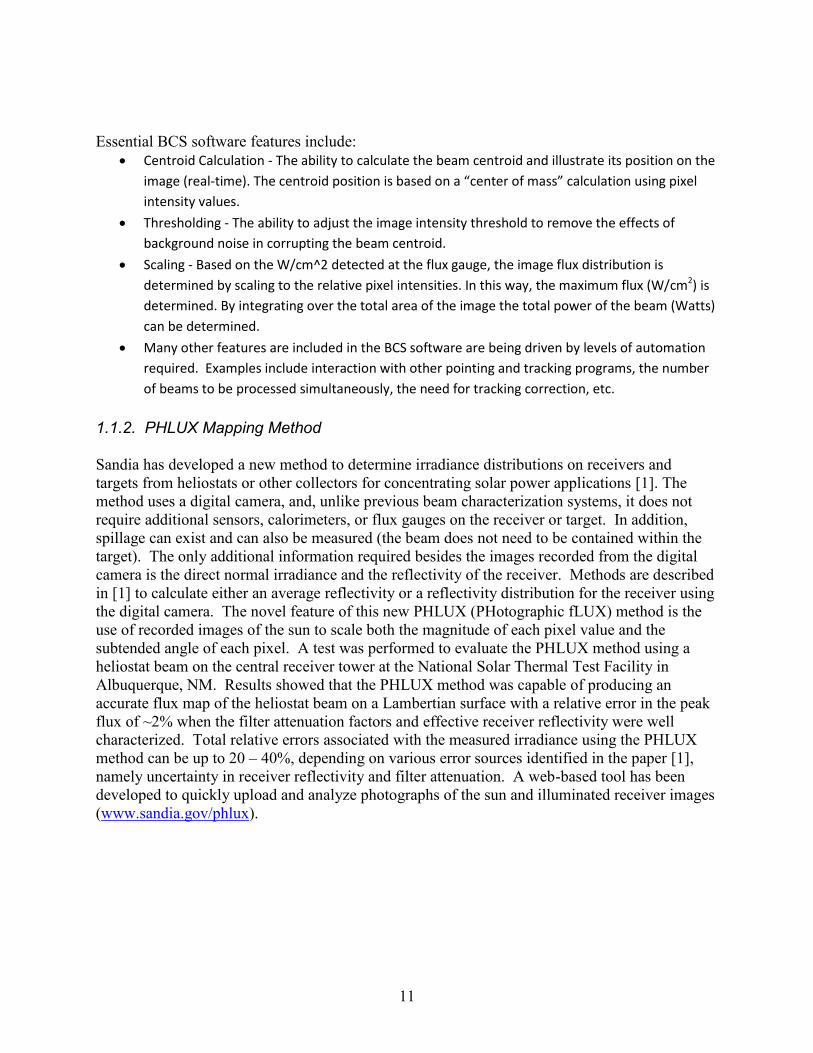
1.1.2. PHLUX Mapping Method Sandia has developed a new method to determine irradiance distributions on receivers and targets from heliostats or other collectors for concentrating solar power applications [1]. The method uses a digital camera, and, unlike previous beam characterization systems, it does not require additional sensors, calorimeters, or flux gauges on the receiver or target. In addition, spillage can exist and can also be measured (the beam does not need to be contained within the target). The only additional information required besides the images recorded from the digital camera is the direct normal irradiance and the reflectivity of the receiver. Methods are described in [1] to calculate either an average reflectivity or a reflectivity distribution for the receiver using the digital camera. The novel feature of this new PHLUX (PHotographic fLUX) method is the use of recorded images of the sun to scale both the magnitude of each pixel value and the subtended angle of each pixel. A test was performed to evaluate the PHLUX method using a heliostat beam on the central receiver tower at the National Solar Thermal Test Facility in Albuquerque, NM. Results showed that the PHLUX method was capable of producing an accurate flux map of the heliostat beam on a Lambertian surface with a relative error in the peak flux of ~2% when the filter attenuation factors and effective receiver reflectivity were well characterized. Total relative errors associated with the measured irradiance using the PHLUX method can be up to 20 – 40%, depending on various error sources identified in the paper [1], namely uncertainty in receiver reflectivity and filter attenuation. A web-based tool has been developed to quickly upload and analyze photographs of the sun and illuminated receiver images (www.sandia.gov/phlux).
12
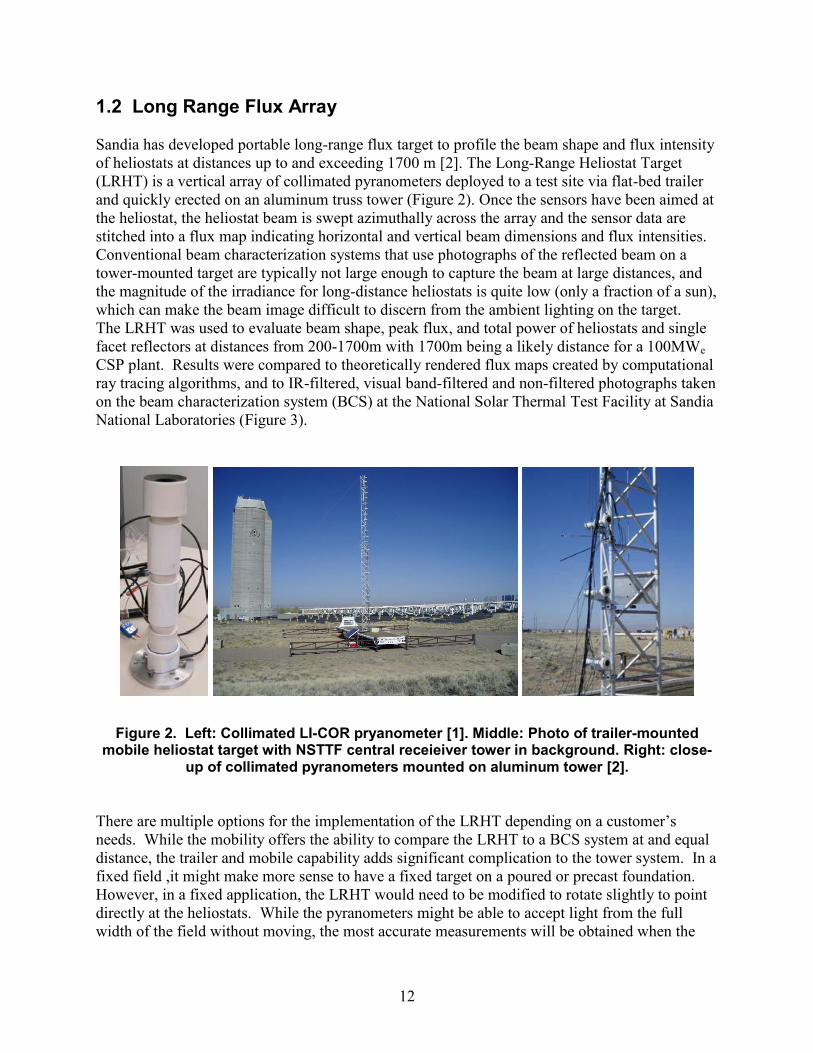
1.2 Long Range Flux Array Sandia has developed portable long-range flux target to profile the beam shape and flux intensity of heliostats at distances up to and exceeding 1700 m [2]. The Long-Range Heliostat Target (LRHT) is a vertical array of collimated pyranometers deployed to a test site via flat-bed trailer and quickly erected on an aluminum truss tower (Figure 2). Once the sensors have been aimed at the heliostat, the heliostat beam is swept azimuthally across the array and the sensor data are stitched into a flux map indicating horizontal and vertical beam dimensions and flux intensities. Conventional beam characterization systems that use photographs of the reflected beam on a tower-mounted target are typically not large enough to capture the beam at large distances, and the magnitude of the irradiance for long-distance heliostats is quite low (only a fraction of a sun), which can make the beam image difficult to discern from the ambient lighting on the target. The LRHT was used to evaluate beam shape, peak flux, and total power of heliostats and single facet reflectors at distances from 200-1700m with 1700m being a likely distance for a 100MWe CSP plant. Results were compared to theoretically rendered flux maps created by computational ray tracing algorithms, and to IR-filtered, visual band-filtered and non-filtered photographs taken on the beam characterization system (BCS) at the National Solar Thermal Test Facility at Sandia National Laboratories (Figure 3).
Figure 2. Left: Collimated LI-COR pryanometer [1]. Middle: Photo of trailer-mounted
mobile heliostat target with NSTTF central receieiver tower in background. Right: close-up of collimated pyranometers mounted on aluminum tower [2].
There are multiple options for the implementation of the LRHT depending on a customer’s needs. While the mobility offers the ability to compare the LRHT to a BCS system at and equal distance, the trailer and mobile capability adds significant complication to the tower system. In a fixed field ,it might make more sense to have a fixed target on a poured or precast foundation. However, in a fixed application, the LRHT would need to be modified to rotate slightly to point directly at the heliostats. While the pyranometers might be able to accept light from the full width of the field without moving, the most accurate measurements will be obtained when the

13
axis of the pyranometer is normal to the incoming beam. Sandia’s current implementation does not directly join the heliostat and actuator, but wireless communication would be implemented to fully coordinate the activities and data collection for the entire system. Sandia’s LRHT utilizes a PV panel for power since the tower is so far from the heliostats, control room, and primary target. In commercial implementation, the number of PV panels would be increased to allow for increased on-board computing power. Sandia has done extensive safety analysis of the LRHT, especially for wind. The safety analysis would be supplied with an LRHT purchase and could be shared if desired. LRHT BCS Image on Central
Receiver Tower Ray Trace
8am
11am
1pm (Solar Noon)
2pm
Figure 3. Qualitative comparison of beam shape as rendered by three methods at
different times of day [2].

14
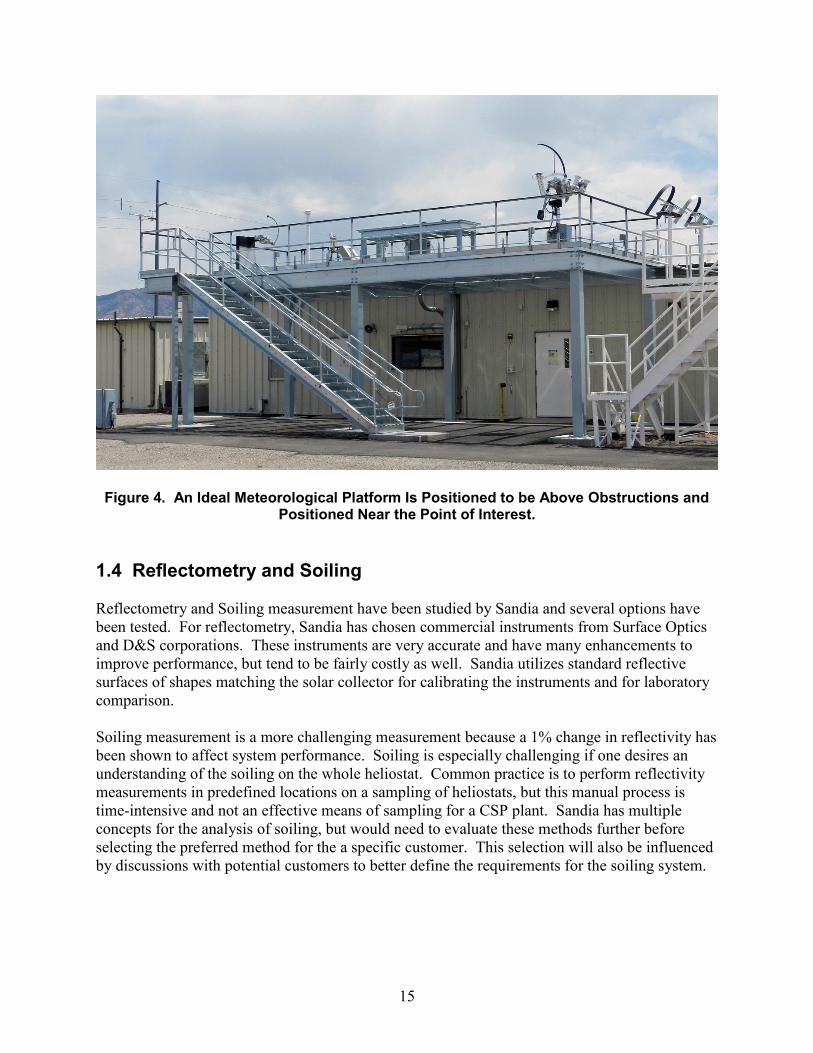
1.3. Meteorological Station Sandia recently conducted a study to find an optimized solution for an affordable but very effective meteorological station. The study selected instrumentation, enclosures, data loggers, and a tower. The instrumentation is not listed here. An important measurement for CSP installations is wind velocity and direction at multiple altitudes. Sandia has significant experience with high-sampling frequency anemometers from the team’s work on wind-driven heliostat vibration. From this work, it was found that 3-D ultrasonic anemometers were the best fit and Sandia has utilized and rigorously tested some of these anemometers. It is important to have 3-D capability because the vertical winds and gusts have a tremendous effect on heliostats and are not measured with traditional cup anemometers. Also, the tower must have 3 anemometers to sufficiently measure wind variation with altitude. For atmospheric attenuation, Sandia would propose to use a flat tracking mirror and to evaluate the sun image in the mirror with cameras at 3 distances to achieve a quadratic fit to the attenuation. The system would utilize Sandia’s camera-based PHLUX analysis and use comparative measurements to evaluate attenuation. Sandia has utilized a single tower/platform system for wind analysis and also small mobile towers that are regularly used at Sandia to evaluate wind effects across the field. These inexpensive towers do not have the high-sampling frequency of the main meteorology tower, but give a picture of conditions from across the field and have been very useful in gust analysis. In addition to the tower, Sandia would suggest the use of an elevated platform for the solar assessment meteorology. A raised platform reduces dust on the optics and eliminates the effects of people and vehicles from blocking the sun. An example of an ideal raised platform is shown in Figure 4, though the platform need not be this large.
15
Figure 4. An Ideal Meteorological Platform Is Positioned to be Above Obstructions and Positioned Near the Point of Interest.
1.4 Reflectometry and Soiling Reflectometry and Soiling measurement have been studied by Sandia and several options have been tested. For reflectometry, Sandia has chosen commercial instruments from Surface Optics and D&S corporations. These instruments are very accurate and have many enhancements to improve performance, but tend to be fairly costly as well. Sandia utilizes standard reflective surfaces of shapes matching the solar collector for calibrating the instruments and for laboratory comparison. Soiling measurement is a more challenging measurement because a 1% change in reflectivity has been shown to affect system performance. Soiling is especially challenging if one desires an understanding of the soiling on the whole heliostat. Common practice is to perform reflectivity measurements in predefined locations on a sampling of heliostats, but this manual process is time-intensive and not an effective means of sampling for a CSP plant. Sandia has multiple concepts for the analysis of soiling, but would need to evaluate these methods further before selecting the preferred method for the a specific customer. This selection will also be influenced by discussions with potential customers to better define the requirements for the soiling system.
16
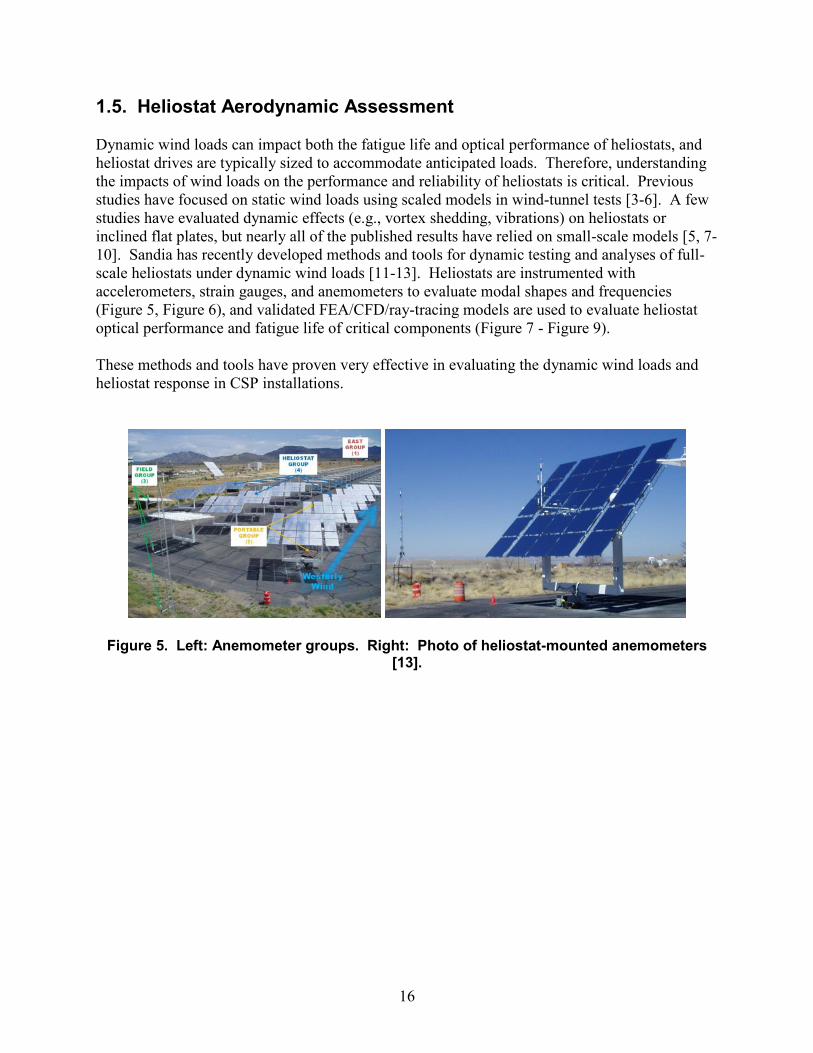
1.5. Heliostat Aerodynamic Assessment Dynamic wind loads can impact both the fatigue life and optical performance of heliostats, and heliostat drives are typically sized to accommodate anticipated loads. Therefore, understanding the impacts of wind loads on the performance and reliability of heliostats is critical. Previous studies have focused on static wind loads using scaled models in wind-tunnel tests [3-6]. A few studies have evaluated dynamic effects (e.g., vortex shedding, vibrations) on heliostats or inclined flat plates, but nearly all of the published results have relied on small-scale models [5, 7-10]. Sandia has recently developed methods and tools for dynamic testing and analyses of full-scale heliostats under dynamic wind loads [11-13]. Heliostats are instrumented with accelerometers, strain gauges, and anemometers to evaluate modal shapes and frequencies (Figure 5, Figure 6), and validated FEA/CFD/ray-tracing models are used to evaluate heliostat optical performance and fatigue life of critical components (Figure 7 - Figure 9). These methods and tools have proven very effective in evaluating the dynamic wind loads and heliostat response in CSP installations.
Figure 5. Left: Anemometer groups. Right: Photo of heliostat-mounted anemometers [13].

17
Figure 6. Left: Data acquisition system and interface for dynamic heliostat monitoring. Right: sensor placement for well-instrumented heliostat (11W14) [13].
Figure 7. Right: Simulated modal shape for mode 4 (torque-tube bending at 3.45 Hz). Right: Experimental mode shape derived from accelerometer data at 3.57 Hz (red lines
denote vertical trusses, the green line denotes the torque tube, and the yellow line denotes the upper-left facet) [13].

18
Model Description Deformed Image (Exaggerated Scale)
Beam Shape (Legend: 0-9000 W/m2)
No Deformation
Mode Shape 1
Mode Shape 2
Mode Shape 3
Mode Shape 12
Figure 8. Heliostat deformed shapes and corresponding beam shapes, beam shapes are
located on tower with the positive direction to the left and up [13].

19
Mode shape Fatigue Affected Areas
Reported Life (Number of
Cycles to Failure)
Mode 1
Yoke Beam Corner
Yoke Beam to Drive
Connection
Mode 2
Truss Cross Members at Torque Tube
Figure 9. Structure locations with accumulated fatigue damage for selected mode
shapes [13].

20
1.6. Surface Slope Error While a BCS system provides a snapshot of the overall quality of the heliostat, the data is limited to the reflected light pattern on a flat plane. No directional data is provided, which may give clues as to the sources of poor performance. Some have used BCS imagery combined with optimal models with random error distributions and matched the size of the image to various error level models in order to characterize an overall error value. However, this approach does not accommodate “systematic” errors such as individually poor canting or facet focal length errors. In some cases, a systematic “error” can actually make the image appear better than a given model, particularly if the BCS target is not at the design slant range of the heliostat (focus and canting). Therefore, for detailed optical evaluation of sources of error, deflectometry is a primary diagnostic tool. This tool should be combined with cone optics or ray tracing techniques to map the reflective surface, with actual sunshape, to the flat BCS target for evaluation of the optical performance. Sandia utilizes a modified HELIOS cone optics program, adjusted to accept raw SOFAST/AIMFAST data for performance evaluation. In addition, focusing (for designs that have adjustable focus) and canting be performed with the help of the deflectometry systems Fringe reflection (deflectometry) tools can provide detailed mapping of surface slope errors, relative to design condition or other models. This data can be used to evaluate single facet quality as well as in-field evaluation of multiple facets installed on a heliostat frame. In the ultimate implementation, the output not only characterizes the heliostat, but provides adjustment values to improve the canting of the heliostat. It is critically important in a development environment that the deflectometry system have user-flexibility in specifying the collector or facet geometry, without re-coding the software. This is a key difference when comparing to systems developed for production line evaluation with fixed collector geometries. Sandia is working to implement the SOFAST system for evaluation of facets and AIMFAST for evaluation of whole heliostats. Both tools use deflectometry approaches. However, SOFAST is used to evaluate a single continuous surface (facet) against a design shape at a high density of data. A key to SOFAST is extreme flexibility of facet definition and placement of the data into the facet coordinate system without surveying through the use of various photogrammetric techniques. AIMFAST evaluates a multiple-facet collector and parses the data per facet placing the data into a global coordinate system. This provides mean facet rotation data useful for re-canting the collector system or evaluating structural deflections of the system. AIMFAST also provides a flexible user-definition interface. Deflectometry uses a camera as a “source” (pinhole model), reflected off the collector, and onto a flat “active” target. Since the heliostats are nearly flat, the active target must be twice the size of the heliostat or facet plus room for errors. This means a high-power projector must be used (and characterized) to project the active target elements. Sandia’s tools have incorporated straightforward user-capable approaches for system calibration without detailed painful surveying.

21
Sandia is developing multi-camera approaches for heliostats that will reduce the size of the target, however, the target will be at least as large as the heliostat. The use of a projector means that the ambient lighting must be reasonably controlled which means nighttime evaluation. Basic evaluation of a heliostat by AIMFAST is best with an FEA model of the heliostat so that elevation impacts can be factored in, resulting in a “more perfect” canting at an appropriate elevation angle. It is important that the BCS target be sufficiently sized such that in-field evaluation of the heliostat can be performed using the BCS target at night. The SOFAST facet characterization tool, if desired, would be installed in a tent or large building. The projection screen would be on the order of 12 x 24 feet (3.65x7.3 m) and can be vertical, horizontal, or on the ceiling. The screen can be a flat sheetrock wall painted flat white with housepaint. Both systems provide visual and summary data output, as well as a detailed map of the surface slope error. Both systems also output the localized data (x,y,z coordinates, x,y,z surface normal vector, and surface area for each camera pixel), which is suitable for analytical reprojection via ray tracing or cone optics. Evaluation of a heliostat at various elevation angles with deflectometry is difficult to perform. Typically, the camera and target are co-located and the flat heliostat means a rather large target must then be lifted and accurately positioned in 6 DOF above the heliostat. While we have done this with a dish system, the target is substantially smaller due to placement at the 2-f location of the dish. Deflectometry can be performed at a limited range of motion by positioning the camera above the heliostat, but continuing to use the fixed BCS target as a fringe projection target. We would have to develop the photogrammetry tools to accurately determine camera location relative to the target “on the fly”. We believe this is relatively straightforward and would provide elevation-dependent data for heliostat positions from 0 (horizon) to about 60 degrees elevation. Higher elevations may be possible with more limited data quality. We have found that combining a single horizontal (horizon) measurement with accurate FEA data a suitable alternative for predictive evaluation, but we understand the desire to evaluate the systems physically. 1.7. State-of-the-Art Sandia has developed many tools for the analysis of heliostats and other CSP collectors. This development has resulted in tools used by Sandia for the analysis, alignment, and canting for our own heliostats. These tools are capabilities that may be of interest to customers. 1.7.1. In-Field Heliostat Alignment – HFACET Sandia is improving a Sandia-developed, in-field heliostat alignment assessment tool called HFACET. The goal of HFACET is to assess the canting and focus of the heliostat facets in-field and make adjustments to the facets if necessary to achieve an optimal collection and concentration of the solar energy on the receiver from the heliostat field. Unlike a fringe

22
reflection measurement system, however, HFACET does not have the fidelity for accurate, localized surface slope characterization of the facets. HFACET [14, 15] uses camera look-back techniques and imaging of targets with known patterns to access the canting and focusing qualities of the facets, which are provided visually and in real-time on a computer monitor as shown in Figure 10. The in-field targets can be existing heliostats (Figure 11) or a mobile target that can be designed and built. In canting mode, the HFACET software allows for selection of either an on-axis or off-axis alignment strategy to slant range or a specified aimpoint location. HFACET was demonstrated recently to re-cant replacement facets on the 212 heliostats at Sandia’s National Solar Thermal Test Facility (NSTTF). Our characterization of the system showed facet alignment accuracies of about 0.3 mrad. The largest benefit of HFACET is its efficiency. Application of past alignment methods/tools to NSTTF heliostats took 4-6 hours for complete alignment on a single heliostat. HFACET reduced the alignment time to less than 1 hour per heliostat. HFACET has the option to assess facet focus, and make focus adjustments on the facets can be made, if necessary – facets must be adjustable for focus. The focusing feature was tested on a few heliostats at NSTTF with encouraging results. This feature needs further refinement. HFACET is modular and can be adapted to any heliostat and field geometry.
Figure 10. Schematic of the HFACET System for In-Field Heliostat Alignment Assessment.
23
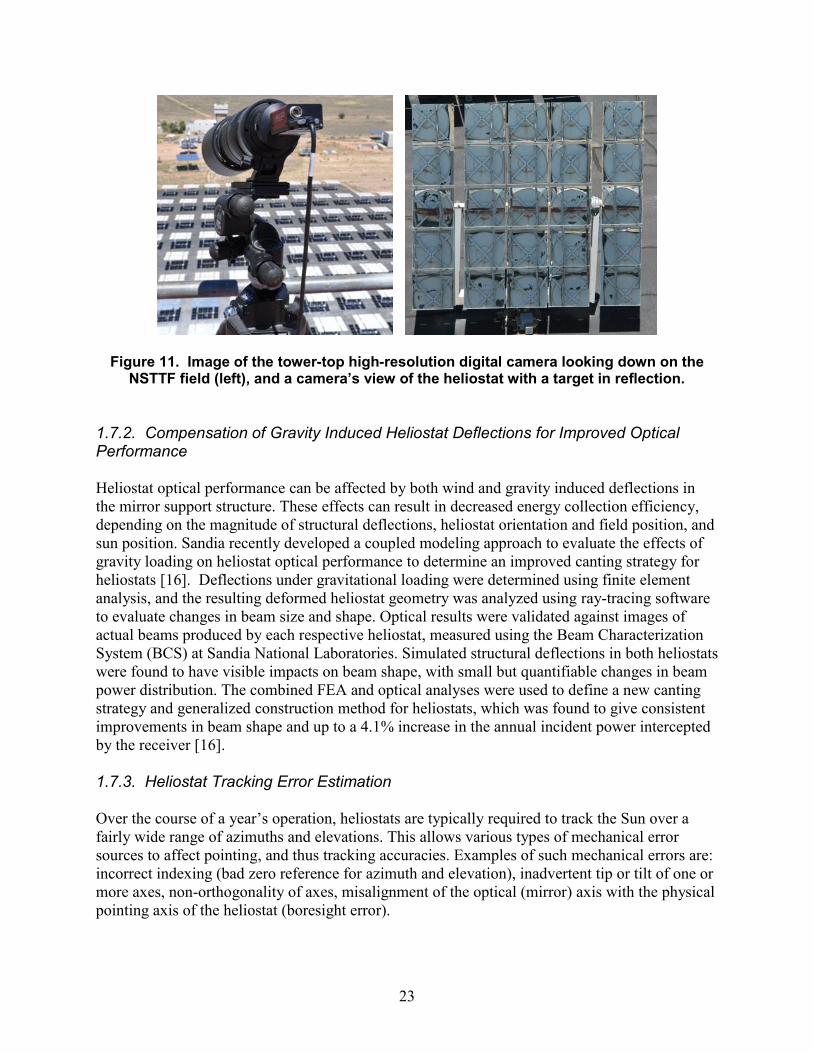
Figure 11. Image of the tower-top high-resolution digital camera looking down on the NSTTF field (left), and a camera’s view of the heliostat with a target in reflection.
1.7.2. Compensation of Gravity Induced Heliostat Deflections for Improved Optical Performance Heliostat optical performance can be affected by both wind and gravity induced deflections in the mirror support structure. These effects can result in decreased energy collection efficiency, depending on the magnitude of structural deflections, heliostat orientation and field position, and sun position. Sandia recently developed a coupled modeling approach to evaluate the effects of gravity loading on heliostat optical performance to determine an improved canting strategy for heliostats [16]. Deflections under gravitational loading were determined using finite element analysis, and the resulting deformed heliostat geometry was analyzed using ray-tracing software to evaluate changes in beam size and shape. Optical results were validated against images of actual beams produced by each respective heliostat, measured using the Beam Characterization System (BCS) at Sandia National Laboratories. Simulated structural deflections in both heliostats were found to have visible impacts on beam shape, with small but quantifiable changes in beam power distribution. The combined FEA and optical analyses were used to define a new canting strategy and generalized construction method for heliostats, which was found to give consistent improvements in beam shape and up to a 4.1% increase in the annual incident power intercepted by the receiver [16]. 1.7.3. Heliostat Tracking Error Estimation Over the course of a year’s operation, heliostats are typically required to track the Sun over a fairly wide range of azimuths and elevations. This allows various types of mechanical error sources to affect pointing, and thus tracking accuracies. Examples of such mechanical errors are: incorrect indexing (bad zero reference for azimuth and elevation), inadvertent tip or tilt of one or more axes, non-orthogonality of axes, misalignment of the optical (mirror) axis with the physical pointing axis of the heliostat (boresight error).

24
For those errors deriving from non-random physical problems in the mount and drive/encoder systems, it is usually possible to create mathematical models that can “correct out” most of the error. The NSTTF has been involved in studying some of these modeling techniques to assess their efficacy in improving tracking performance. There was an initial study conducted on one heliostat back in 2011. The results of the study are captured in a paper and presentation [17]. A continuing study (of that particular modeling approach) across the entire field of 216 heliostats and over the better part of a year, is just now wrapping up.
2. TRACK RECORD AND EXPERIENCE WITH DESIGN AND EXECUTION OF SIMILAR PROJECTS
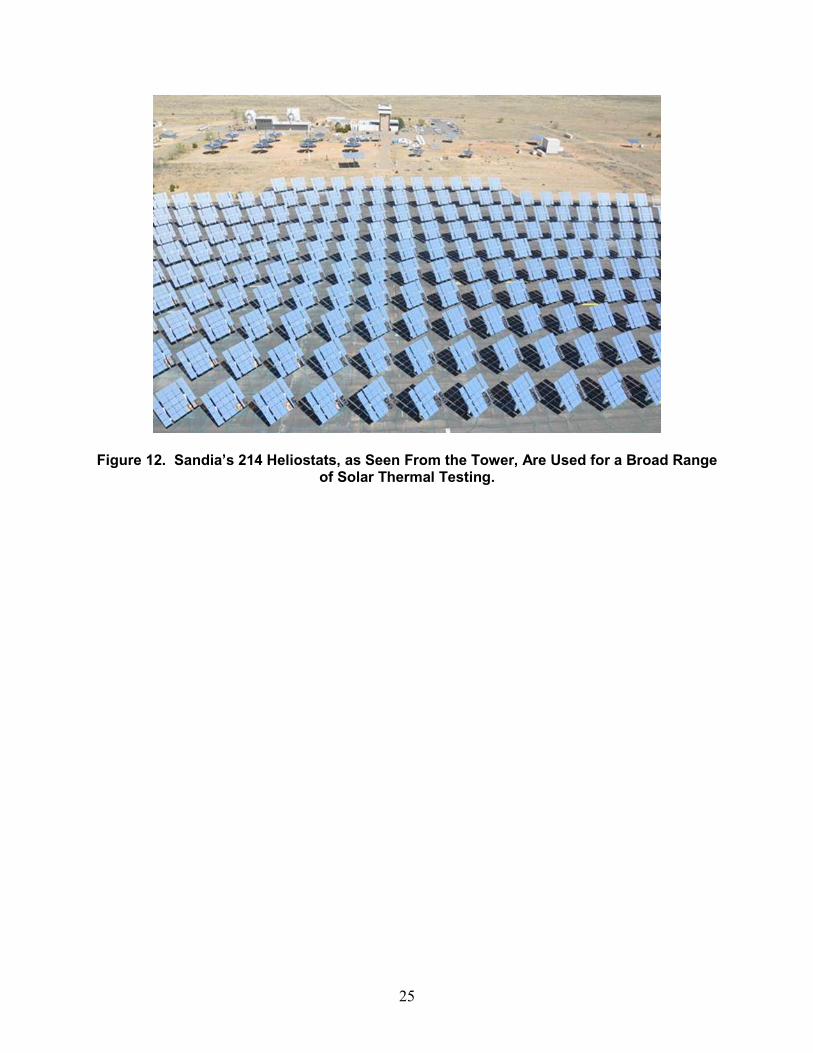
Sandia National Laboratories has relevant experience with the design and execution of CSP projects on three levels. First, Sandia has over 35 years’ experience of operating a test facility for solar thermal research at the National Solar Thermal Test Facility located in Albuquerque, NM, USA. Secondly, Sandia has significant experience performing heliostat analysis and. Finally, Sandia has very recent experience in the Conceptual Design, Detailed Design, Construction, Commissioning, and Startup of unique test facilities with budgets from $10k to $10M US. The following sections detail each of these three areas of experience and expertise. 2.1. Experience Operating a Solar Thermal Test Facility Sandia National Laboratories has extensive experience in operating a Solar Thermal testing facility and also in planning and executing the construction of large-scale solar thermal test facilities. Sandia has been operating the National Solar Thermal Test Facility (NSTTF) for 35 years. The NSTTF has many solar thermal test capabilities, but the key facility is the Central Receiver Test Facility (CRTF) which consists of a 61m tower and 216 heliostats. The heliostats are37 m^2 and give a thermal input capability of 6.0MWth. The CRTF heliostat field is shown in an image from the top of the tower in Figure 12. The CRTF has a Beam Characterization target located at the 29m height, and test bays at 37.5m, 42.7m and 48.8m, and on the tower top at the 61m altitude. The tower has an integrated cooling water/glycol system for the cooling of targets under test. Figure 13 (top of tower, left side) shows the tower-top flux gage system that permits flux measurement for the full power of the field.
25
Figure 12. Sandia’s 214 Heliostats, as Seen From the Tower, Are Used for a Broad Range
of Solar Thermal Testing.

26
Figure 13. Sandia's Solar Tower Has 3 Test Bays on the Front and Infrastructure for Tower Top Testing As Well.
The heliostat field and test tower are controlled from an elevated control room at the rear of the heliostat field. The control room, shown in Figure 14, contains the computer systems that control the heliostats in addition to full meteorological station, cameras for flux analysis and field operation, and a centralized Data Acquisition system that collects real-time data from the heliostats, beam characterization system, meteorological instrumentation, tower-top flux gage, and from the customer’s test receiver or target.

27
Figure 14. Sandia's Central Receiver Test Facility Control Room with (left to right) Heliostat Control, Test Director, and DAQ Stations.
2.2. Experience Operating a Heliostat Test Facility The CRTF has been used to test many heliostat designs for both internal and external customers. Heliostats tested include designs from Martin Marrieta Co., McDonnell Douglas Aeronautics, Atlantic Richfield Co. and Advanced Thermal Systems. For the testing of these designs, heliostat foundations with power and controls have been provided with some customers utilizing the centralized control system and others by utilizing stand-alone or localized control systems. Figure 15 [18] shows a montage of some of the heliostats tested at the CRTF. Note that this the Figure includes only a few of the heliostats tested and that others are not shown here due to proprietary requirements of the testing agreements. Sandia has tested stretched membrane, rim-drive, and traditional heliostats with a multitude of reflector designs and mounting technologies.

28
Figure 15. A Small Sampling of the Many Heliostat Designs Tested at Sandia's NSTTF Using Sandia-Developed Tools and Methods [18].

29
While the text above highlights Sandia’s experience operating a heliostat and receiver test facility, Sandia’s experience in planning and executing large scale thermal solar test facilities and devices is also very significant. Sandia has had a key role in Solar One and Solar Two central receiver demonstration sites, the Advanced Dish Development System, several Molten Salt Test Loops, a solar furnace, and a rotating platform for trough and receiver tube analysis. Solar One and Solar Two were seminal demonstrations of the ability of a central receiver power tower to produce grid-tied electricity. Solar Two was also an important demonstration of the ability of thermal energy storage to extend solar electricity production outside of daylight hours. Sandia’s role in Solar One and Solar Two included planning, pre-design testing, performance testing, data analysis, operations and maintenance planning and evaluation, and documentation of test results. While the original Solar One and Solar Two engineers are no longer in the group, the lessons of this testing have been passed down to the current solar team and consultations with the pioneers still occurs frequently. 2.3. Experience with Project Implementation from Conceptual Design Through Testing of Hardware Sandia has conducted large-scale projects that demonstrate the ability of the Sandia group to perform every stage of projects from Conceptual Design, to Detailed Design, to Construction Oversight, to startup and commissioning, to acceptance and testing using the new capability. To highlight this capability, three projects of different scales are presented. 2.3.1. Advanced Dish Development System Sandia developed the Advanced Dish Development System (ADDS) in order to gain systems-level experience with a dish-Stirling implementation. The 10kW system was taken from design to working hardware in just over 10 months. The system was built around the Solo Klienmoteren V161 Stirling engine. Sandia performed system (conceptual) design, optical design, and hardware implementation. We worked with subcontractors to perform the detailed design of the support structure, drives, and controls. The ADDS performed well quickly, and met the requirement for 50 hours of no-faults testing within the first month of operation. The initial system was 47 m², and produced 9kW. This compared favorably against the Eurodish system, which produced 9kW at 56m². Through a concentrated effort of improvement on the controls and optics, we improved the system performance to the point it regularly produced 10kW with a reduced area of 41m² of dish intercept. These efforts were based on a systematic data and error root-cause analysis process that led to maximal effort on the appropriate areas for greatest improvement. The approaches used also led to far greater understanding of the impacts of optics (alignment, primarily) and controls approaches on system performance as well as availability. Many key concepts were incorporated by Solo in their upgraded engine controls, as well as Stirling Energy Systems (SES) in their dish controls and optics. The systems-level approach to design, implementation, and continuous improvement led to superb performance over a very short development period, and the system become the basis for

30
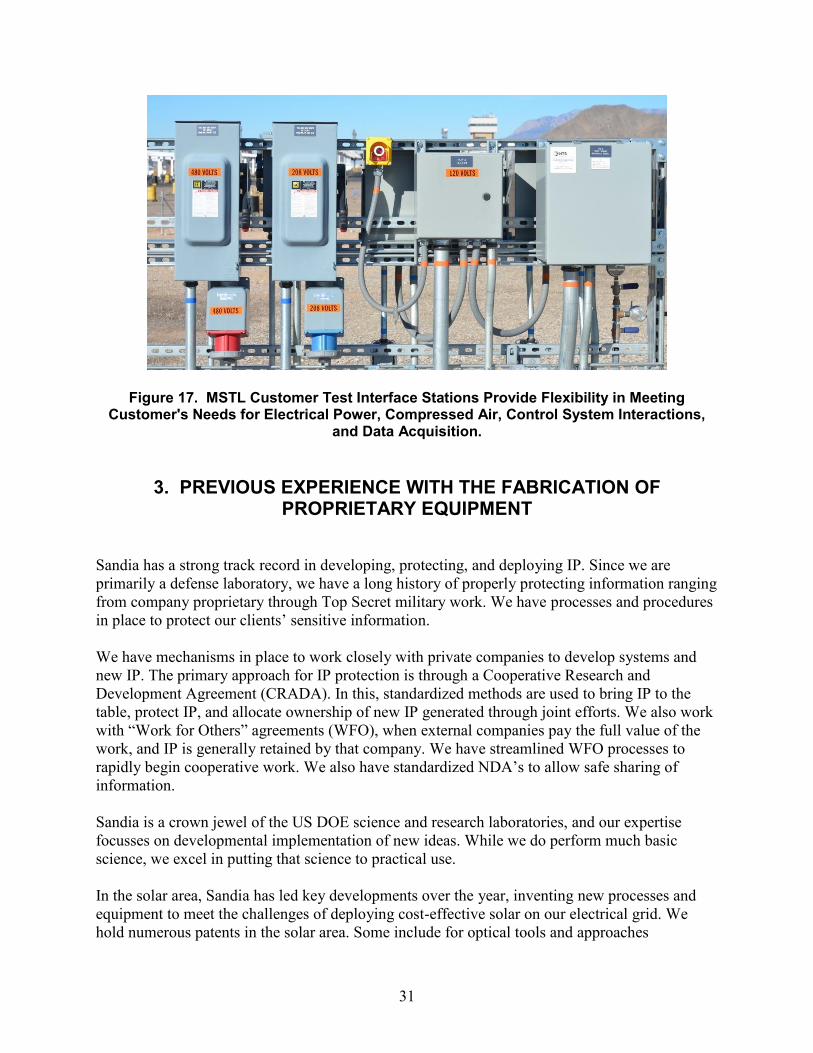
several modern dish Stirling systems. The same systems approaches were used to help SES rapidly improve their 25kW dish Stirling system. The optical tools and approaches were also applied to heliostat focusing and canting at Sandia’s test facility. 2.3.2. Molten Salt Test Loop (MSTL) A recently completed test facility is the Molten Salt Test Loop (MSTL) which provides 3 parallel test loops where customers can test components, subsystems, and even on-sun tests of full-scale solar collection modules with molten salt flowing at realistic power plant conditions of 585°C, 40bar, and 50kg/s. MSTL, shown in Figure 16, has 3 parallel test loops providing customers molten flowing salt. The system provides each customer’s test with test stand (Figure 17) delivering power, compressed air, and a connection for centralized data collection that is time-synched with the process and control data [19]. The system is designed as a user facility and provides unique test capabilities that are contracted for multiple customers’ testing. MSTL was a $10M US project completed in October 2013. Sandia developed the system requirements and a conceptual design. Sandia provided technical oversight of the detailed design and construction, was fully integrated in the facility commissioning, and developed all operating procedures and safety assessments of the design and deployed system.
Figure 16. The Molten Salt Test Loop (foreground) and the Central Receiver Test Facility
(background) at Sandia.
31
Figure 17. MSTL Customer Test Interface Stations Provide Flexibility in Meeting Customer's Needs for Electrical Power, Compressed Air, Control System Interactions,
and Data Acquisition.
3. PREVIOUS EXPERIENCE WITH THE FABRICATION OF PROPRIETARY EQUIPMENT
Sandia has a strong track record in developing, protecting, and deploying IP. Since we are primarily a defense laboratory, we have a long history of properly protecting information ranging from company proprietary through Top Secret military work. We have processes and procedures in place to protect our clients’ sensitive information. We have mechanisms in place to work closely with private companies to develop systems and new IP. The primary approach for IP protection is through a Cooperative Research and Development Agreement (CRADA). In this, standardized methods are used to bring IP to the table, protect IP, and allocate ownership of new IP generated through joint efforts. We also work with “Work for Others” agreements (WFO), when external companies pay the full value of the work, and IP is generally retained by that company. We have streamlined WFO processes to rapidly begin cooperative work. We also have standardized NDA’s to allow safe sharing of information. Sandia is a crown jewel of the US DOE science and research laboratories, and our expertise focusses on developmental implementation of new ideas. While we do perform much basic science, we excel in putting that science to practical use. In the solar area, Sandia has led key developments over the year, inventing new processes and equipment to meet the challenges of deploying cost-effective solar on our electrical grid. We hold numerous patents in the solar area. Some include for optical tools and approaches

32
(including AIMFAST, SOFAST, PhLUX, TOPCAT (for trough alignment)), heat pipe technologies (primarily for dish engine systems), and controls approaches. Sandia regularly publishes new work in the scientific journals and at scientific conferences. At our test facility, we have erected and participated in the assembly of a wide variety of customer- and joint-designed equipment for one-off and/or long-term testing. Listed below are some of the significant projects we have been involved in the design, installation, evaluation, and product improvement:
Small Community dish systems, including stretched membrane, stamped steel, and Fresnel dish arrangements
Advanced heliostat concepts, including stretched membrane, multi-facet stretched membrane, the (now baseline) ATS, and several customer heliostats for very recent (ongoing) development for major deployments
16KW solar furnace, including redesign and implementation of improved optics on both the heliostat and dish portions, and total modernization of the controls system
11 Stirling energy Systems dishes of various vintages, including deep immersion into the design and evaluation processes, including extensive reliability improvement processes and optics calibration
3 ADDS systems, including a one-of-a-kind off-grid synchronous system driving a water well pump
212 25-facet heliostats for our test facility, including substantial optical redesign and implementation under recent restoration funding, complete controls system re-design and implementation, and continuous maintenance and improvement
A trough rotating platform, for testing a trough segment “square to the sun” throughout the day, for trough performance evaluation without an entire string. This system included a complete redesign of the trough platform, controls, oil loop, and data systems.
Molten Salt Test Loop (MSTL), taken form concept, through design and construction (contractors implanted construction with our oversight), and customer interface. We now have a flexible salt loop for testing of salt plumbing components up to full systems.
In addition, we have utilized tools at customer sites and customers have used these tools in their own evaluation of their own products. TOPCAT, and example of Sandia’s IP tools, and its utilization for the measurement of customer collectors is detailed below. In addition to TOPCAT, SOFAST and AIMFAST (see Section 0) have been used by customers for the evaluation of their heliostats and parabolic dishes. 3.1. SOFAST/AIMFAST SOFAST and AIMFAST optical fringe analysis tools have been deployed by customers for critical use in the manufacturing and field alignment of collector systems. SOFAST was deployed on the manufacturing line of one customer to evaluate in real-time any manufacturing errors in the surface of dish reflector sections. The implementation of this Sandia tool directly in the customer’s manufacturing line allowed the customer to quickly and accurately identify manufacturing problems and to determine the cause of the errors. AIMFAST was deployed by a customer as the means of aligning a reflector field in a 1MW plant. The customer was producing grid power and had to meet Power Purchase Agreement

33
specified delivery of power. To ensure that the field would achieve the contractual performance, the customer used a truck-mounted version of AIMFAST to align their reflector optics. This important tool was used in conjunction with Sandia developed color-lookback methods to align all of the optics and to achieve reliable performance of the reflectors and the power cycle. 3.2. TOPCAT
Most troughs utilize a large number of mirror panels to form parabolic concentrators. To minimize intercept losses and to enable high concentration, it is desirable to accurately align the mirrors. Currently mirror panels are aligned by the use of fixtures which, within manufacturing tolerances, position the mirror panels, typically at four mirror mounts. Optical alignment techniques, which inherently sample mirror alignment at many points and eliminate the impacts of manufacturing tolerances are capable of alignment errors that are small compared to mirror slope errors. They can also potentially reduce the cost and complexity of precise fixtures. Sandia developed the Theoretical Overlay Photographic Collector Alignment Technique (TOPCAT) system to optically align the mirrors to the receiver that could be used during construction, to improve the performance of existing power plants, or for routine maintenance. Test results from mirror alignment of an LS-3 loop aligned with the TOPCAT system in a commercial parabolic trough power plant in southern California indicate a 3.5% increase in thermal performance [20, 21]. The performance improvements were measured using a comparative calorimetric technique which inherently accounts for variations in insolation levels, sun incident angle, and mirror and heat collection element (HCE) glass envelope cleanliness. Benchmarking results of labor hours and materials show that the TOPCAT system is an extremely cost effective tool for improving the performance of existing parabolic trough power plants.
Figure 18. TOPCAT Measurements of Trough Optics Are Performed in a SEGS Plant.

34
4. TRACK RECORD AND EXPERIENCE WITH INSTRUMENTATION AND ANALYTICAL METHODS
Because all of the instrumentation was either developed at Sandia or specified by Sandia through study and analysis, there is significant experience by Sandia’s staff with each of the instrumentation solutions. Sandia’s daily operation of a full heliostat field, central receiver tower, and other CSP facilities shows the familiarity of the research and operational staff with each of these instruments and methods. More information about Sandia’s use or development of the individual methods and instruments is found in Sections 0 through 0.
5. DISCIPLINES, ENGINEERING CAPACITY, SKILL LEVEL, AND EXPERIENCE IN DESIGN OF THE REQUIRED SYSTEMS
Dr. Subhash Shinde Manager, Concentrating Solar Technologies Group Charles Andraka Optical characterization methods, dish-Stirling technology Dr. Clifford Ho Receiver analysis, CFD modeling, heliostat wind analysis, flux
characterization Dr. David Gill Thermal energy storage, molten salt testing, corrosion testing Dr. Alan Kruizenga Corrosion analysis, thermal energy storage Dr. Julius Yellowhair Optical analysis and characterization, heliostat optics Timothy Moss Trough systems, performance measurement and analysis Joshua Christian CFD modeling, Finite element modeling of vibration and deflection Cheryl Ghanbari On-sun tower testing of receivers and materials, development of solar
selective absorber material William Kolb Solar thermal testing, molten salt testing, CSP electrical test design,
project management, capital project management Dr. Andrea Ambrosini Development of CSP materials and coatings, Solar-selective absorbers Edward Smith Robust control and characterization of concentrating solar systems John Kelton Test system fabrication, molten salt technology application &
component maintenance Daniel Ray Phase change technology, heat pipe fabrication, high temperature
testing Kye Chisman Heat trace & cal-rod design, application, and maintenance Michael Usher Design and application of CSP control electronics

35
6. REFERENCES 1. Ho, C.K. and S.S. Khalsa, A Photographic Flux Mapping Method for Concentrating Solar
Collectors and Receivers. Journal of Solar Energy Engineering-Transactions of the Asme, 2012. 134(4).
2. Sment, J., et al., Flux Characterization System for Long-Distance Heliostats, in SolarPACES 20122012: Marrakech, Morocco.
3. Peterka, J.A. and R.G. Derickson, Wind Load Design Methods for Ground-Based Heliostats and Parabolic Dish Collectors, 1992, Sandia National Laboratories: Albuquerque, NM.
4. Pfahl, A., M. Buselmeier, and M. Zaschke, Wind loads on heliostats and photovoltaic trackers of various aspect ratios. Solar Energy, 2011. 85(9): p. 2185-2201.
5. Wu, Z.Y., et al., An experimental and numerical study of the gap effect on wind load on heliostat. Renewable Energy, 2010. 35(4): p. 797-806.
6. Rebolo, R., J. Lata, and J. Vazquez, Design of Heliostats Under Extreme and Fatigue Wind Loads, in in proceedings of SolarPACES 20112011: Granada, Spain.
7. Chen, J.M. and Y.C. Fang, Strouhal numbers of inclined flat plates. Journal of Wind Engineering and Industrial Aerodynamics, 1996. 61(2-3): p. 99-112.
8. Gong, B., et al., Wind-induced dynamic response of Heliostat. Renewable Energy, 2012. 38(1): p. 206-213.
9. Wang, Y.G., et al., Wind Pressure and Wind-induced Vibration of Heliostat. Advances in Concrete and Structures, 2009. 400-402: p. 935-940.
10. Huss, S., et al., Evaluating Effects of Wind Loads in Heliostat Design, in in proceedings of SolarPACES 20112011: Granada, Spain.
11. Griffith, D.T., et al., Modal Analysis of a Heliostat for Concentrating Solar Power, in in Proceedings of the 30th International Modal Analysis Conference (IMAC XXX)2012: Jacksonville, FL.
12. Griffith, D.T., et al., Structural Dynamics Testing and Analysis for Design Evaluation and Monitoring of Heliostats, in Proceedings of ASME 2011 5th International Conference on Energy Sustainability & 9th Fuel Cell Science, Engineering and Technology Conference2011, ASME: Washington, DC.
13. Ho, C.K., et al., Dynamic Testing and Analysis of Heliostats to Evaluate Impacts of Wind on Optical Performance and Structural Fatigue, in SolarPACES 20122012: Marrakech, Morocco.
14. Sproul, E., K. Chavez, and J. Yellowhair. Development of heliostat focusing and canting enhancement technique: an optical heliostat alignment tool for the NSTTF. in ASME Energy Sustainability 2011. 2011. Washington, DC, USA: ASME.
15. Chavez, K., E. Sproul, and J. Yellowhair. Heliostat Facet Focusing and Characterization Using the Heliostat Focusing and Canting Enhancement Technique. in ASME Energy Sustainability Conference 2012. 2012. San Diego, CA, USA: ASME.
16. Yuan, J.K., J.M. Christian, and C.K. Ho, Compensation of Gravity Induced Heliostat Deflections for Improved Optical Performance, in ASME 2013 7th International Conference on Energy Sustainability2013: Minneapolis, MN.
17. Khalsa, S.S., C.K. Ho, and C. Andraka, An Automated Method To Correct Heliostat Tracking Errors, in SolarPACES 20112011: Granada, Spain.

36
18. Kenig, D., Beam Quality and Tracking accuracy Evaluation for second-Generation and Barstow Production Heliostats, 1982, Sandia National Laboratories: Albuquerque, NM, USA.
19. Gill, D.D., et al., Customer Interface Document for the Molten Salt Test Loop (MSTL) System, 2012, Sandia National Laboratories: Albuquerque, NM, USA.
20. Diver, R.B. and T.A. Moss. Test results and status of the top alignment system for parabolic trough solar collectors. in ASME 2010 4th International Conference on Energy Sustainability, ES 2010, May 17, 2010 - May 22, 2010. 2010. Phoenix, AZ, United states: American Society of Mechanical Engineers.
21. Diver, R.B. and T.A. Moss, Practical field alignment of parabolic trough solar concentrators. Journal of Solar Energy Engineering, Transactions of the ASME, 2007. 129(2): p. 153-159.

37
DISTRIBUTION 1 MS1127 Charles E. Andraka 06123 (electronic copy) 1 MS1127 Joshua M. Christian 06123 (electronic copy) 1 MS1127 Cheryl M. Ghanbari 06123 (electronic copy) 1 MS1127 David D. Gill 06123 (electronic copy) 1 MS1127 Clifford K. Ho 06123 (electronic copy) 1 MS1127 William J. Kolb 06123 (electronic copy) 1 MS1127 Timothy A. Moss 06123 (electronic copy) 1 MS1127 Edward J. Smith 06123 (electronic copy) 1 MS1127 Julius Yellowhair 06123 (electronic copy) 1 MS1127 Subhash L. Shinde 06123 (electronic copy) 1 MS0899 Technical Library 9536 (electronic copy)

38
This page intentionally left blank.