sands tailings draft - university of toronto t-space · permeability function for oil sands...
TRANSCRIPT

Draft
Permeability function for oil sands tailings undergoing
volume change during drying
Journal: Canadian Geotechnical Journal
Manuscript ID cgj-2016-0486.R2
Manuscript Type: Article
Date Submitted by the Author: 19-May-2017
Complete List of Authors: Zhang, Feixia; University of Alberta, Civil and Environmental Engineering Wilson, Ward; University of Alberta, Civil & Environmental Engineering Fredlund, Delwyn; Golder Associates Ltd., Geotechnical Engineering
Keyword: permeability function, SWCC, degree of saturation, volume change, oil sands tailings
https://mc06.manuscriptcentral.com/cgj-pubs
Canadian Geotechnical Journal

Draft
1
Permeability function for oil sands tailings undergoing volume change during drying
Feixia Zhang1, G. Ward Wilson2 and D.G. Fredlund3
1 PhD Candidate, Department of Civil and Environmental Engineering, University of Alberta,
Edmonton, AB, [email protected]
2 Professor, Department of Civil and Environmental Engineering, University of Alberta,
Edmonton, AB, [email protected]
3 Senior Geotechnical Engineer, Golder Associates Ltd., Saskatoon, SK., Canada,
Corresponding author: Feixia Zhang
Address: Department of Civil & Environmental Engineering, University of Alberta, Markin/CNRL
Natural Resources Engineering Facility, 9105-116th ST, Edmonton, Alberta, Canada, T6G 2W2
Telephone number: 5879367383
E-mail Address: [email protected]
Page 1 of 53
https://mc06.manuscriptcentral.com/cgj-pubs
Canadian Geotechnical Journal

Draft
2
Abstract:
The coefficient of permeability function is an important unsaturated soil property required when
modeling seepage and contaminant transport phenomena. Inaccuracies in the estimation of the
permeability function can lead to significant errors in numerical modeling results. Changes in
void ratio and degree of saturation are factors that influence the permeability function. Presently
available methodologies for estimating the unsaturated permeability function make the
assumption that there is no volume change as soil suction is changed. As a result, volume
changes are interpreted as changes in degree of saturation. The commonly used estimation
techniques for the permeability function are reasonable for soils such as sands that experience
little volume change as soil suction is changed. On the other hand, inaccurate results are
generated when soils undergo volume change as is the case with oil sands tailings. Revisions to
previous methodologies are proposed to render the estimation of the permeability function more
suitable for simulating the drying process associated with high volume-change soils. The
revised methodology independently analyzes the effect of volume changes (i.e., changes in void
ratio), and degree of saturation changes (i.e., changes in S-SWCC). Laboratory data on
thickened oil sands tailings are presented and interpreted within the context of the proposed
methodology.
Key words: permeability function, SWCC, degree of saturation, volume change, oil sands
tailings.
Page 2 of 53
https://mc06.manuscriptcentral.com/cgj-pubs
Canadian Geotechnical Journal

Draft
3
Glossary
e = void ratio,
Gs = specific gravity of the solids,
S = degree of saturation,
S0 = initial degree of saturation,
w = gravimetric water content,
ws = initial saturated gravimetric water content,
θ = volumetric water content where the volume of water is referenced to the initial total
volume of the tested soil,
θi = instantaneous volumetric water content where the volume of water is referenced to
the instantaneous total volume of the tested soil,
θs = saturated volumetric water content,
ψ = soil suction,
Page 3 of 53
https://mc06.manuscriptcentral.com/cgj-pubs
Canadian Geotechnical Journal

Draft
4
Introduction
The oil sands bitumen extraction process in northern Alberta produces large volumes of high
water content tailings composed of sand, silt, clay, and a small amount of unrecovered bitumen.
Significant portions of the fines remain in suspension after deposition resulting in a tailings
management challenge for the industry. Various processes and technologies have been
suggested to improve the water release characteristics of the tailings. One of the disposal
methodologies advanced to improve the dewatering behavior of the tailings is thin lift deposition
of thickened oil sands tailings (TT) (Sobkowicz and Morgenstern 2009; BGC Engineering Inc
2010). The design of tailings disposal often involves numerical modeling of TT at various sand-
to-fines ratios, (SFRs) (Zhang et al. 2014). Numerical modeling of the dewatering process
requires the use of an appropriate permeability function and water storage function.
Research has shown that changes in the void ratio and changes in the degree of saturation are
factors that influence the permeability function of a soil (Zhang et al. 2014). The effect of
changing void ratio on changes in the saturated coefficient of permeability has previously been
given consideration (Chapuis 2012; Taylor 1948). Methodologies for the estimation of the
permeability function for an unsaturated soil are usually based on the assumption that no
volume change occurs as soil suction is changed. In other words, changes in the permeability of
an unsaturated soil are assumed to occur as a result of changes in degree of saturation.
Reasonable permeability functions can be obtained for unsaturated soils that do not undergo
volume change as soil suction is changed (Fredlund et al. 2012). Oil sands tailings have been
found to undergo significant volume change as soil suction is increased during drying (Fredlund
et al. 2011). Commonly used unsaturated permeability estimation methodologies cannot
adequately represent the permeability function for oil sands tailings subjected to drying.
This paper proposes a methodology for the estimation of the permeability function for soils that
undergo volume change as soil suction is increased. Changes in void ratio and degree of
Page 4 of 53
https://mc06.manuscriptcentral.com/cgj-pubs
Canadian Geotechnical Journal
Draft
5
saturation are taken into account as two independent factors of significance. Laboratory test
results are used to illustrate the application of the proposed methodology for oil sands tailings.
The extreme nonlinearity in the gravimetric water content versus soil suction relationship (i.e.,
w-SWCC) can make it difficult to accurately best-fit a laboratory dataset with any of the
commonly used equations for the SWCC (Fredlund et al. 2011). One means of circumventing
this problem is to use a bimodal form of the Fredlund-Xing (1994) SWCC equation. The soil-
water characteristic curve, SWCC, forms the basis for the estimation of various unsaturated soil
property functions. Research has shown that the soil-water characteristic curve, SWCC,
strongly influences the estimation of the permeability function for an unsaturated soil (Rahimi et
al. 2015).
Background on SWCC, shrinkage curve and permeability functions
Literature review on the role of the SWCC
The SWCC describes the relationship between the amount of water in the soil and its
corresponding soil suction, and the drying relationship differs from the wetting relationship (Tami
et al. 2004). One of several variables can be used to designate the amount of water in the soil
(e.g., gravimetric water content, volumetric water content and degree of saturation). The SWCC
has become pivotal to the estimation of unsaturated soil property functions such as the
permeability function and the water storage function (Fredlund et al. 2012). The direct
measurement on the SWCC is a common practice in geotechnical engineering, providing a
means of better understanding unsaturated soil properties. Much of the original laboratory
testing equipment for measuring the SWCC was developed in the agricultural related disciplines.
Laboratory equipment for measuring the SWCC can be broadly divided into equipment that
provides an applied matric suction to a soil specimen and equipment that provides a controlled
or measured total suction environment (Fredlund et al. 2012). The measured SWCC can be
represented by a mathematical function and then used to determine the unsaturated soil
Page 5 of 53
https://mc06.manuscriptcentral.com/cgj-pubs
Canadian Geotechnical Journal
Draft
6
property functions. A number of equations for SWCC have been proposed in the literature by
various researchers.
The Brooks and Corey (1964) equation, the Gardner (1974) equation, various forms of the van
Genuchten (1980) equation and the Fredlund-Xing (1994) equation appear to be the most
commonly used SWCC equations in geotechnical engineering. The original van Genuchten
(1980) is a 3-parameter equation that has the ability to best-fit data from a wide range of soils.
The van Genuchten (1980) equation has been simplified by prescribing a fixed relationship
between the m and n fitting parameters. The proposed simplification made it possible to obtain a
closed-form permeability function for an unsaturated soil when substituting a simplified van
Genuchten (1980) SWCC equation into the Burdine (1953) equation or the Mualem (1976)
integral equation for the unsaturated permeability function. The simplified van Genuchten (1980)
equations resulted in less mathematical flexibility than the original van Genuchten (1980)
equation when best-fitting the experimental SWCC data. The Fredlund-Xing (1994) equation is
a four-parameter equation that provides increased flexibility in fitting SWCC data over the
complete range of soil suction values (i.e., up to 1,000,000 kPa). Leong and Rahardjo (1997)
evaluated various proposed sigmoidal SWCC equations and identified the Fredlund-Xing (1994)
equation as performing best for fitting all soil types.
Aforementioned sigmoidal SWCC equations are intended for unimodal SWCCs for soils that are
well-graded with one dominant continuous series of pore sizes. When two or more pore series
exist, the corresponding SWCC tends to be bimodal or multimodal (Zhang and Chen 2005). A
modification to the fitting equation is required to properly represent the bimodal or multimodal
SWCC for a gap-graded soil, where there is more than one pore series. Burger and Shackelford
(2001a; 2001b) presented piecewise-continuous forms of the Brooks-Corey (1964), van
Genuchten (1980), and Fredlund-Xing (1994) SWCC functions to account for the bimodal
patterns of experimental SWCCs. The piecewise-continuous forms for the SWCC were tested
on pelletized diatomaceous earth and sand-diatomaceous earth mixtures with dual porosity.
Page 6 of 53
https://mc06.manuscriptcentral.com/cgj-pubs
Canadian Geotechnical Journal
Draft
7
Zhang and Chen (2005) proposed a method to predict bimodal or multimodal SWCCs for
bimodal or multimodal soils using the unimodal SWCCs for the characteristic components
corresponding to respective pore series.
Literature review on the shrinkage curve
The shrinkage curve establishes a relationship between the instantaneous void ratio and
gravimetric water content. The shrinkage curve can play an important role in estimating
unsaturated soil property functions for soils that exhibit significant volume change as soil suction
is changed. Researchers have investigated the character of the shrinkage of soils since the
early 1900s (Tempany 1917). An interpretation of the shrinkage curve was presented by Haines
(1923) that included the concept of normal shrinkage and residual shrinkage. Terzaghi (1925)
noted that the shrinkage behavior could be compared to the isotropic compression of a soil.
Sridharan and Rao (1971) discussed the physical mechanism involved in the process of
shrinkage using a modified effective stress concept. Kim et al. (1992) studied shrinkage
processes and the geometry of volume shrinkage with respect to the physical ripening naturally
occurring in a marine clay soil. Marinho (1994) carried out a comprehensive study of shrinkage
curve functions. Fredlund (2000) presented a mathematical equation for the shrinkage curve as
well as a theoretical procedure for estimating the shrinkage curve. Cornelis et al. (2006)
proposed a simplified parametric model and assessed the magnitude and geometry of soil
shrinkage. Some other relatively recent work that has been published on shrinkage of tailings is
Rodriguez (2006) and Saleh-Mbemba et al. (2016). The Fredlund (2000) shrinkage equation
accurately represents the shrinkage behavior for the drying of soils from a near-saturated state.
The shrinkage curve equation proposed by Fredlund (2000) is used in this study as the basis for
separating the effects of volume change and degree of saturation effects when estimating the
permeability function for high volume change soils.
Page 7 of 53
https://mc06.manuscriptcentral.com/cgj-pubs
Canadian Geotechnical Journal

Draft
8
Literature review related to the permeability function
Direct measurement of the permeability function of an unsaturated soil in the laboratory is time-
consuming, expensive and technically demanding. Measurements of the SWCC and the
subsequent estimation of permeability functions have become the more common approach in
geotechnical engineering for determining an acceptable permeability function (Zhang et al.
2016).
There are four main categories of models that have been proposed for the estimation of
unsaturated permeability function; namely, empirical models, statistical models, correlation
models and regression models (Leong and Rahardjo 1997; Fredlund et al. 2012). Empirical
models and statistical models are most common. Empirical models estimate the unsaturated
permeability function from the SWCC by utilizing the similarities between the SWCC and the
unsaturated permeability function. The Brooks and Corey (1964) equation is one of the
empirical estimation equations. Statistical models are based on the assumption that both the
permeability function and the SWCC are primarily influenced by the pore-size distribution of the
soil.
Childs and Collis-George (1950), Burdine (1953) and Mualem (1976) respectively proposed an
integral formula for the estimation of the unsaturated permeability function based on different
physical models. Various statistical models have been further developed from one of three
integral formulas. The three well-known statistical models can be presented in the form of
relative permeability equations and can be referred to as the van Genuchten-Burdine (1980)
equation, the van Genuchten-Mualem (1980) equation and the Fredlund-Xing-Huang (1994)
permeability function. These permeability equations were developed by introducing, i.) the van
Genuchten SWCC (1980) equation into the Burdine (1953) formula, ii.) the van Genuchten
SWCC (1980) equation into the Mualem (1976) formula, and iii.) the Fredlund-Xing SWCC
equation (1994) into the Childs and Collis-George (1950) formula. A constant saturated
coefficient of permeability is generally combined with the relative permeability functions to
Page 8 of 53
https://mc06.manuscriptcentral.com/cgj-pubs
Canadian Geotechnical Journal

Draft
9
generate a continuous unsaturated soil permeability function. Historically, the estimation
methods for these permeability functions have been based on the assumption that the soil does
not undergo volume change as soil suction is increased.
Studies on deformable soils have been conducted for various purposes. Croney and Coleman
(1954) measured soil suction and volume change for several compressible soils. Mbonimpa et
al. (2006) proposed a model for the soil-water characteristic curve of deformable clayey soils by
introducing the volumetric shrinkage curve in the formulation of the modified Kovacs (MK) model.
Parent et al. (2007) conducted SWCC tests on “deinking by-product” (DBP), a highly
compressible industrial by-product which has been used as a cover material for landfills and
mining applications as well as a soil structural enhancement material in agricultural applications.
Nuth and Laloui (2008) developed an innovative modeling framework for the SWCC based on
kinematic hardening considering both capillary hysteresis and void ratio dependency. Tripathy
et al. (2014) studied in detail the SWCCs of three deformable clays in terms of the water content
and the degree of saturation. Huang et al. (1998) developed a coefficient of permeability model
for a deformable unsaturated porous medium considering volume change prior to desaturation.
Huang et al. (1998) suggested accounting for the effect of void ratio change on the saturated
permeability, while the relative permeability was obtained using the volumetric water content
SWCC (θ-SWCC). More recently, theoretical and previous experimental studies have been
undertaken to observe the influence of both desaturation and volume change on the
permeability function for deformable soils (Fredlund and Zhang 2013).
Existing methods are not adequate for estimating the permeability function for soils that undergo
significant volume change both before and after the applied suction exceeds the air-entry value.
It is necessary to develop a permeability function for a volume change soil that considers both
the influence of volume change and desaturation during drying from saturation to oven-dry
conditions.
Page 9 of 53
https://mc06.manuscriptcentral.com/cgj-pubs
Canadian Geotechnical Journal

Draft
10
A revised methodology for estimating the permeability function for a soil that undergoes volume
change during a drying process is presented in this paper.
Modification to permeability function to integrate volume change
General information on the permeability function theory
The permeability theory is limited to using the soil-water characteristic curve in the case where
significant volume changes occur as suction is increased. The SWCC has been used in a
general sense to describe the amount of water in a soil as a function of soil suction. The
designation for the amount of water in the soil defines the character of the SWCC. There are
four different designations that have been used for defining the amount of water in a soil;
namely, gravimetric water content w, volumetric water content (referenced to the initial total
volume) θ, instantaneous volumetric water content (referenced to the instantaneous total
volume) θi and degree of saturation S. However, volumetric water content referenced to the
initial volume of soil has no value when considering the case of volume change with respect to
suction change. Only the instantaneous volumetric water content is discussed in this paper and
used for comparison with gravimetric water content and degree of saturation.
The SWCC can accordingly take on three different forms; namely, gravimetric water content-
SWCC (w-SWCC), instantaneous volumetric water content-SWCC (θi -SWCC), and degree of
saturation-SWCC (S-SWCC). For soils that undergo insignificant volume change as soil suction
is increased (e.g., sands and dense silts), all three SWCC designations provide the same
information to geotechnical engineers for estimating unsaturated soil property functions. Figure
1 shows that the three SWCCs (i.e., w-SWCC, θi-SWCC and S-SWCC) produce the same curve
when plotted in terms of dimensionless water content versus soil suction. However, for a soil
that undergoes volume change as soil suction is increased during a drying process, the three
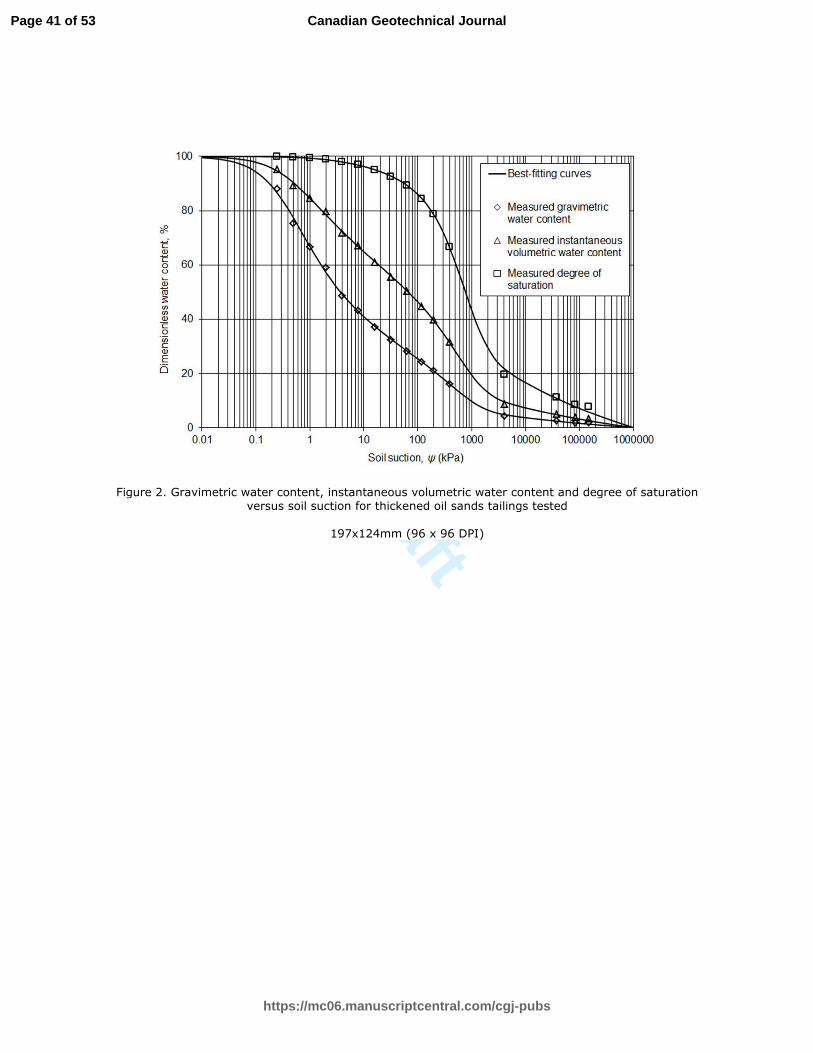
SWCCs are different from one another. Figure 2 presents the results of SWCC tests performed
on oil sands tailings and shows that there is a difference amongst the w-SWCC, θi-SWCC and
Page 10 of 53
https://mc06.manuscriptcentral.com/cgj-pubs
Canadian Geotechnical Journal
Draft
11
S-SWCC. Oil sands tailings represents a material that undergoes significant volume change as
soil suction is increased during drying.
Figure 1. Fredlund-Xing (1994) SWCC fit to experimental data for Columbia sandy silt (Data
from Brooks and Corey (1964)).
Figure 2. Gravimetric water content, instantaneous volumetric water content and degree of
saturation versus soil suction for thickened oil sands tailings tested
Relationship between volume-mass variables
Gravimetric water content constitutes the standard measurement used in the laboratory when
performing a SWCC test. The degree of saturation and the instantaneous volumetric water
content are indirectly calculated from the gravimetric water content measurements along with a
shrinkage curve for the soil. The basic volume-mass relationships that relate the three
designations of the amount of water in a soil are as below:
[1]
[2]
The shrinkage curve test involves the measurement of volume and mass of water in the soil as
drying occurs. This allows to describe the relationship between void ratio and gravimetric water
content. The following hyperbolic equation proposed by Fredlund (2000) can be used to
represent the shrinkage curve.
[3]
where:
swGS
e=
si1 1
wGSe
e eθ =
+ +=
( )sh sh
1
sh
sh
1
c cw
e w ab
= +
Page 11 of 53
https://mc06.manuscriptcentral.com/cgj-pubs
Canadian Geotechnical Journal

Draft
12
ash = minimum void ratio, emin,
ash/bsh = slope of the asymptotic line,
csh = curvature of the shrinkage curve, and
ash, bsh and csh are three fitting parameters of the shrinkage equation Eq. [3], which can be
obtained by a regression analysis. The Fredlund (2000) equation has the following relationship
between the fitting parameters and the volume-mass properties.
[4]
The equation forms a continuous function with as its asymptotic line. The shrinkage
curve moves closer and closer to a straight asymptotic line of constant degree of saturation as
gravimetric water content increases.
The shrinkage curve becomes an important mathematical relationship when solving
geotechnical engineering problems where drying produces significant volume change. Eq. [3] is
used as the basis for the development of a revised methodology for estimating the permeability
function for high volume change materials.
Various forms of SWCC
The Fredlund-Xing (1994) equation has been used to provide a reasonable fit of SWCC
laboratory data over the entire suction range. The SWCC equation, written in terms of
gravimetric water content versus soil suction, is as follows.
[5]
where:
af, nf, mf, and ψr = mathematical fitting parameters,
sh s
sh 0
a G
b S=
( ) sh
sh
ae w w
b=
w ψ( ) =ws1− ln 1+ψ ψ
r( ) ln 1+106 ψr( )( )ln exp 1( )+ ψ a
f( )nf
mf
Page 12 of 53
https://mc06.manuscriptcentral.com/cgj-pubs
Canadian Geotechnical Journal
Draft
13
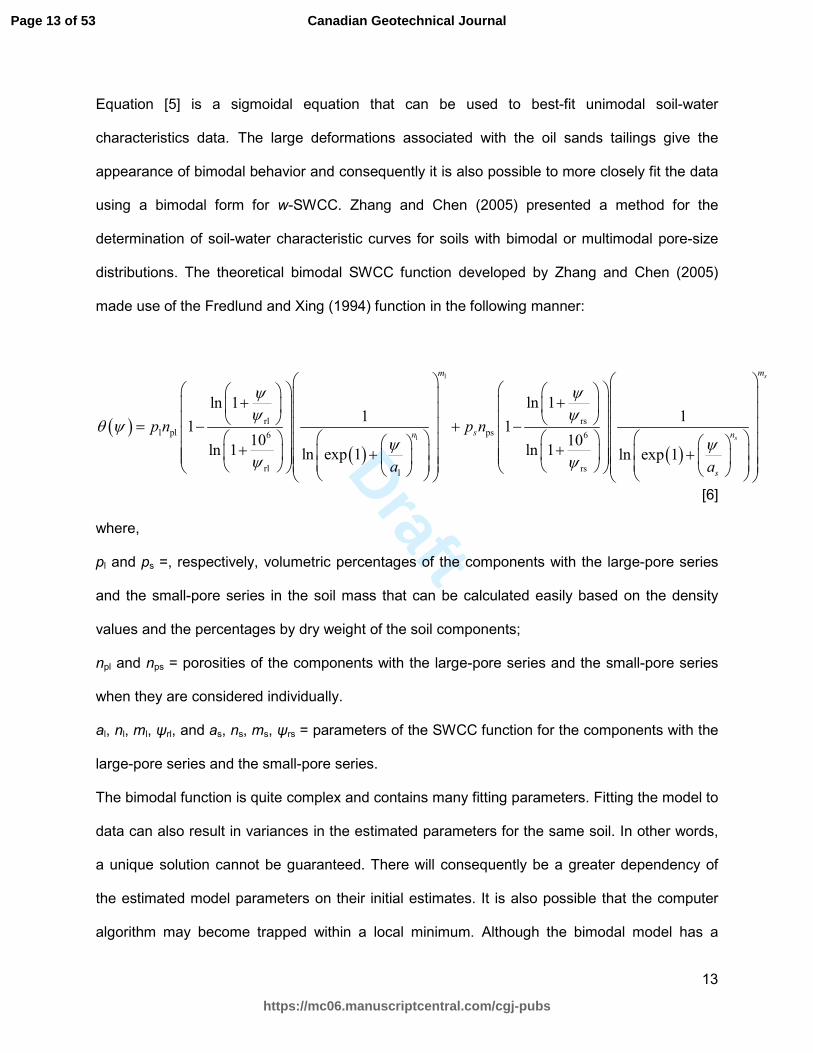
Equation [5] is a sigmoidal equation that can be used to best-fit unimodal soil-water
characteristics data. The large deformations associated with the oil sands tailings give the
appearance of bimodal behavior and consequently it is also possible to more closely fit the data
using a bimodal form for w-SWCC. Zhang and Chen (2005) presented a method for the
determination of soil-water characteristic curves for soils with bimodal or multimodal pore-size
distributions. The theoretical bimodal SWCC function developed by Zhang and Chen (2005)
made use of the Fredlund and Xing (1994) function in the following manner:
( )( ) ( )
l
l
rsrl
l pl ps6 6
rl rsl
ln 1ln 11 1
1 110 10
ln 1 ln 1ln exp 1 ln exp 1
s
s
mm
sn n
s
p n p n
a a
ψψψψ
θ ψψ ψ
ψ ψ
++ = − + − + + + + [6]
where,
pl and ps =, respectively, volumetric percentages of the components with the large-pore series
and the small-pore series in the soil mass that can be calculated easily based on the density
values and the percentages by dry weight of the soil components;
npl and nps = porosities of the components with the large-pore series and the small-pore series
when they are considered individually.
al, nl, ml, ψrl, and as, ns, ms, ψrs = parameters of the SWCC function for the components with the
large-pore series and the small-pore series.
The bimodal function is quite complex and contains many fitting parameters. Fitting the model to
data can also result in variances in the estimated parameters for the same soil. In other words,
a unique solution cannot be guaranteed. There will consequently be a greater dependency of
the estimated model parameters on their initial estimates. It is also possible that the computer
algorithm may become trapped within a local minimum. Although the bimodal model has a
Page 13 of 53
https://mc06.manuscriptcentral.com/cgj-pubs
Canadian Geotechnical Journal

Draft
14
sound theoretical base, it is preferable to keep the SWCC expression as simple as possible. It
should be noted that it is the mathematical form of analytical expressions that determines the
accuracy of the estimated permeability function rather than the physical meaning of the fitting
parameters as was demonstrated by Cornelis et al. (2006). On the other hand, empirical models
have limitations when compared to the deterministic models that they do not allow for better
understanding of the real process. The original theoretical bimodal equation by Zhang and Chen
(2005) (Eq. [6]) has two correction functions. The role of the correction function is to bring the
calculated water content to zero at the limiting point where ψ is equal to 106 kPa. Therefore, it is
possible to use one correction function rather than two correction functions. In the original
theoretical bimodal, there is a correlation between the fitting parameters as shown below:
s l pl s psp n p nθ = + [7]
Where:
plnpl and psnps are the saturated volumetric water content of each pore series, plnpl and psnps
denotes the proportions of two pore series.
A weighting factor p between 0 and 1.0 can be used to represent the proportion of the large
pore series, and 1-p the small pore series. The saturated volumetric water content of the large
pore series is θsp, which is represented by plnpl. The saturated volumetric water content of the
small pore series is θs(1-p), which is represented by psnps. It is possible to use a simplified
bimodal equation to that proposed by Zhang and Chen (2005). The simplified bimodal equation
written in terms of gravimetric water content versus soil suction is.
[8]
where:
( )
( ) ( )f1 f2
f1 f2
rb
s 6
rbf1 f2
ln 11
110
ln 1ln exp 1 ln exp 1
m mn n
p pw w
a a
ψψ
ψψ ψ
ψ
+ − = − + + + +
Page 14 of 53
https://mc06.manuscriptcentral.com/cgj-pubs
Canadian Geotechnical Journal
Draft
15
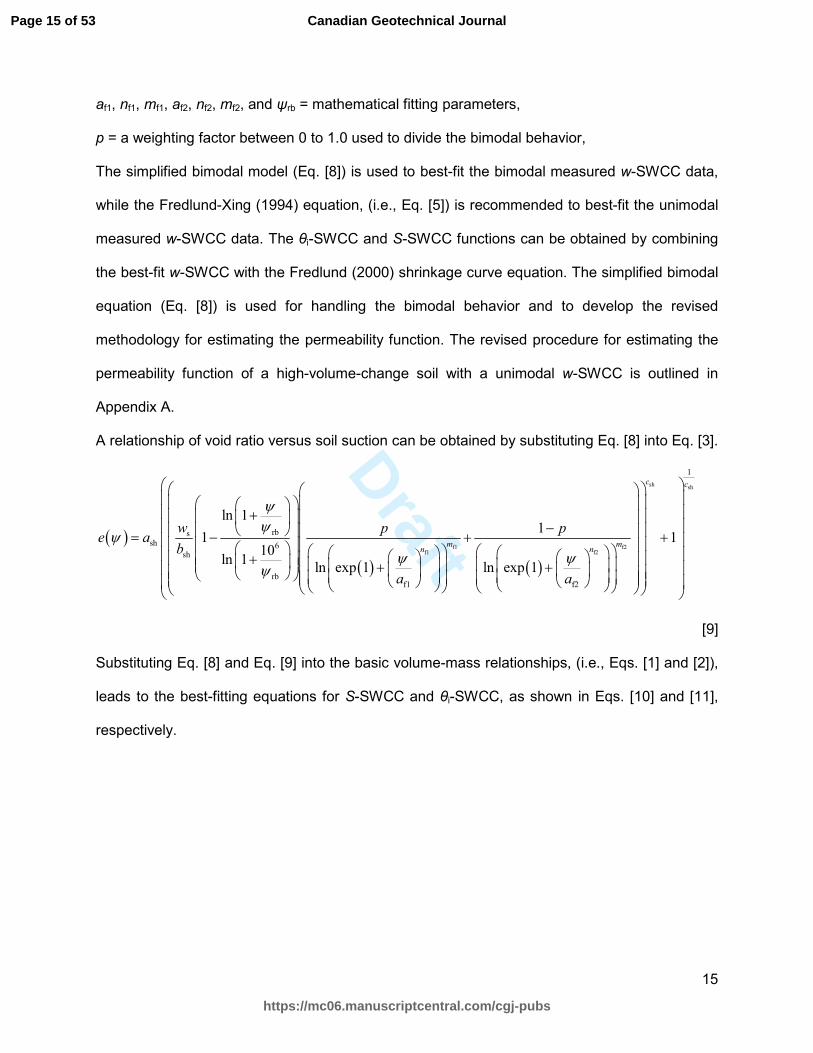
af1, nf1, mf1, af2, nf2, mf2, and ψrb = mathematical fitting parameters,
p = a weighting factor between 0 to 1.0 used to divide the bimodal behavior,
The simplified bimodal model (Eq. [8]) is used to best-fit the bimodal measured w-SWCC data,
while the Fredlund-Xing (1994) equation, (i.e., Eq. [5]) is recommended to best-fit the unimodal
measured w-SWCC data. The θi-SWCC and S-SWCC functions can be obtained by combining
the best-fit w-SWCC with the Fredlund (2000) shrinkage curve equation. The simplified bimodal
equation (Eq. [8]) is used for handling the bimodal behavior and to develop the revised
methodology for estimating the permeability function. The revised procedure for estimating the
permeability function of a high-volume-change soil with a unimodal w-SWCC is outlined in
Appendix A.
A relationship of void ratio versus soil suction can be obtained by substituting Eq. [8] into Eq. [3].
[9]
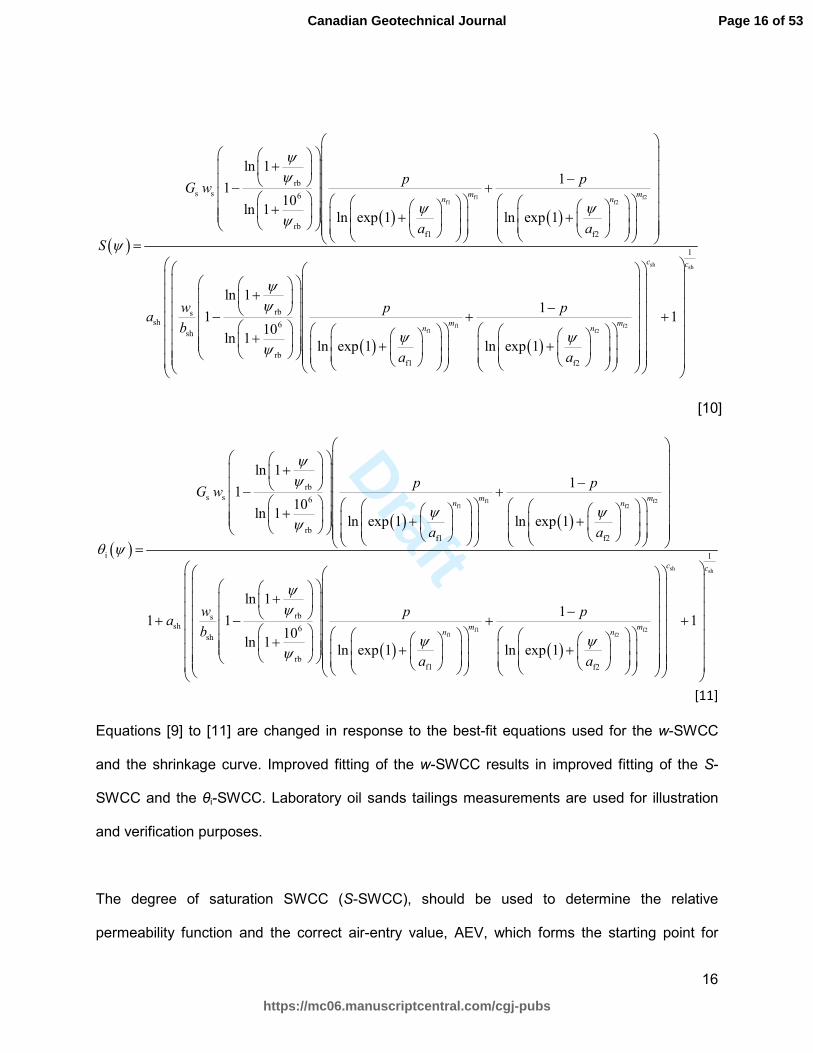
Substituting Eq. [8] and Eq. [9] into the basic volume-mass relationships, (i.e., Eqs. [1] and [2]),
leads to the best-fitting equations for S-SWCC and θi-SWCC, as shown in Eqs. [10] and [11],
respectively.
( )
( ) ( )
sh
f1 f2f1 f2
1
rbssh 6
sh
rbf1 f2
ln 11
1 110
ln 1ln exp 1 ln exp 1
c
m mn n
w p pe a
b
a a
ψψ
ψψ ψ
ψ
+ − = − + + + + +
shc
Page 15 of 53
https://mc06.manuscriptcentral.com/cgj-pubs
Canadian Geotechnical Journal
Draft
16
[10]
[11]
Equations [9] to [11] are changed in response to the best-fit equations used for the w-SWCC
and the shrinkage curve. Improved fitting of the w-SWCC results in improved fitting of the S-
SWCC and the θi-SWCC. Laboratory oil sands tailings measurements are used for illustration
and verification purposes.
The degree of saturation SWCC (S-SWCC), should be used to determine the relative
permeability function and the correct air-entry value, AEV, which forms the starting point for
( )
( ) ( )f1 f2
f1 f2
rb
s s 6
rbf1 f2
rbssh 6
sh
rb
ln 11
110
ln 1ln exp 1 ln exp 1
ln 1
110
ln 1
m mn n
p pG w
a a
S
wa
b
ψψ
ψ ψψ
ψ
ψψ
ψ
+ − − + + + + =
+
− +
( ) ( )
sh sh
f1 f2f1 f2
1
f1 f2
11
ln exp 1 ln exp 1
c c
m mn n
p p
a a
ψ ψ
− + + + +
( )
( ) ( )f1 f2
f1 f2
rb
s s 6
rbf1 f2
i
rbssh 6
sh
rb
ln 11
110
ln 1ln exp 1 ln exp 1
ln 1
1 110
ln 1
m mn n
p pG w
a a
wa
b
ψψ
ψ ψψ
θ ψ
ψψ
ψ
+ − − + + + + =
+
+ − +
( ) ( )
sh sh
f1 f2f1 f2
1
f1 f2
11
ln exp 1 ln exp 1
c c
m mn n
p p
a a
ψ ψ
− + + + +
Page 16 of 53
https://mc06.manuscriptcentral.com/cgj-pubs
Canadian Geotechnical Journal
Draft
17
integration for the relative permeability function (Zhang and Fredlund 2015; Fredlund and Zhang
2013). Likewise, the θi –SWCC should be used for the calculation of the water storage function.
Misuse of SWCCs when estimating unsaturated soil property functions can result in significant
errors. Demonstration of the importance of using the appropriate form of SWCC is presented
later in the paper.
Revised methodology for estimating the permeability function
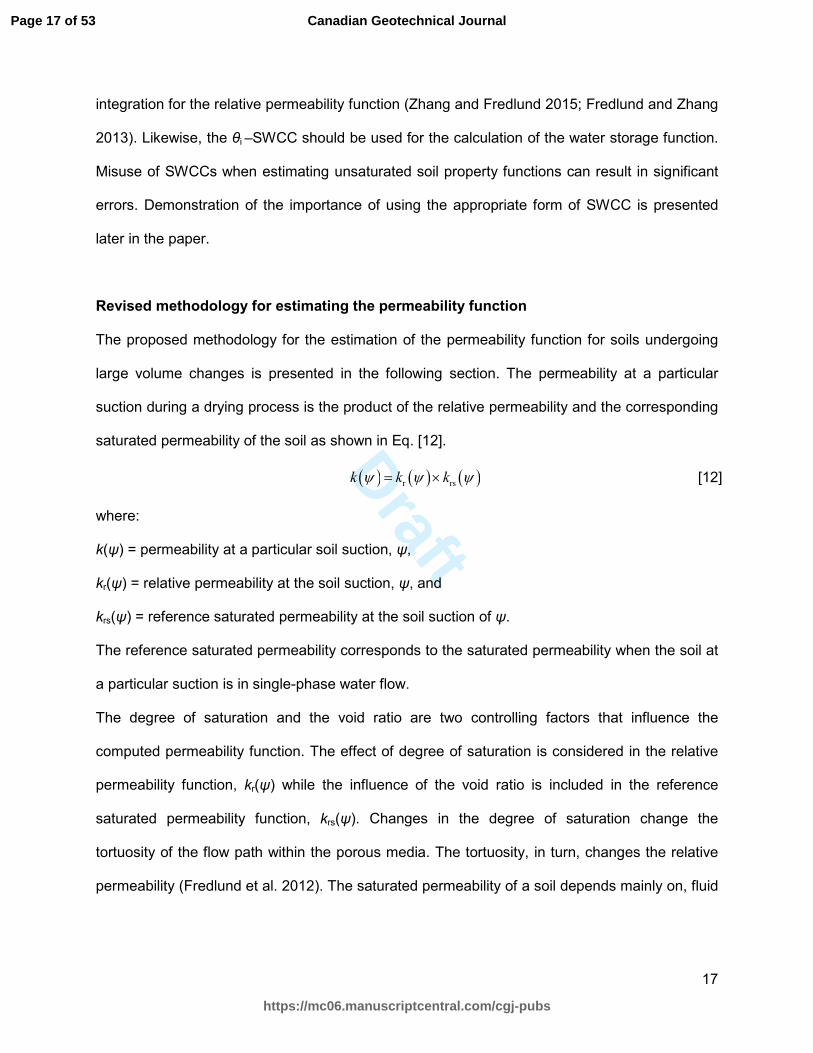
The proposed methodology for the estimation of the permeability function for soils undergoing
large volume changes is presented in the following section. The permeability at a particular
suction during a drying process is the product of the relative permeability and the corresponding
saturated permeability of the soil as shown in Eq. [12].
[12]
where:
k(ψ) = permeability at a particular soil suction, ψ,
kr(ψ) = relative permeability at the soil suction, ψ, and
krs(ψ) = reference saturated permeability at the soil suction of ψ.
The reference saturated permeability corresponds to the saturated permeability when the soil at
a particular suction is in single-phase water flow.
The degree of saturation and the void ratio are two controlling factors that influence the
computed permeability function. The effect of degree of saturation is considered in the relative
permeability function, kr(ψ) while the influence of the void ratio is included in the reference
saturated permeability function, krs(ψ). Changes in the degree of saturation change the
tortuosity of the flow path within the porous media. The tortuosity, in turn, changes the relative
permeability (Fredlund et al. 2012). The saturated permeability of a soil depends mainly on, fluid
( ) ( ) ( )r rsk k kψ ψ ψ= ×
Page 17 of 53
https://mc06.manuscriptcentral.com/cgj-pubs
Canadian Geotechnical Journal
Draft
18
properties, the pore sizes and the pore size distribution (Chapuis 2012). A change in void ratio
changes the pore sizes, thereby influencing the reference saturated permeability of the soil.
The two components in Eq. [12], kr(ψ) and krs(ψ) can be separately calculated. The relative
permeability function, kr(ψ) is estimated from the S-SWCC. The reference saturated
permeability function, krs(ψ) is calculated based on two relationships, the relationship of void
ratio versus soil suction and the relationship of saturated permeability versus void ratio. Studies
on the relationship between the void ratio and the saturated permeability of a soil have been
undertaken by numerous researchers (Chapuis 2012). Equation [13] (Taylor 1948) and Eq. [14]
(Somogyi 1980) are two mathematical equations that describe the relationship of the saturated
coefficient of permeability, ksat, to void ratio, e.
[13]
[14]
where:
ksat = saturated permeability,
C, x = fitting parameters for Eq. [13], and
A, B = fitting parameters for Eq. [14].
Each of these equations (i.e., Eqs. [13] and [14]) can be used in conjunction with the
relationship between void ratio and soil suction (Eq. [9]) to generate the reference saturated
permeability function, krs(ψ). Equation [14] is used in this paper to illustrate how to obtain the
reference saturated permeability function, krs(ψ). By substituting Eq. [9] into Eq. [14], the term of
the reference saturated permeability function, krs(ψ) in Eq. [12] can be obtained, as shown by
Eq. [15].
( )sat1
xCek e
e=
+
( )sat
Bk e Ae=
Page 18 of 53
https://mc06.manuscriptcentral.com/cgj-pubs
Canadian Geotechnical Journal

Draft
19
[15]
Considerable research has also been undertaken on the estimation of the relative permeability
function. Its prediction is usually based on the volumetric water content SWCC (θ-SWCC) under
the assumption of no volume change during a drying process. The original Fredlund-Xing-
Huang (1994) permeability function takes the following form:
[16]
where:
b = ln(1,000,000), and
y = a dummy variable of integration representing the logarithm of soil suction.
The original Fredlund-Xing-Huang (1994) permeability function produces appropriate relative
permeability estimations for no volume change materials such as sands or silts because the θ-
SWCC provides essentially the same information as the S-SWCC when there is no volume
change. When a soil undergoes volume change, the degree of saturation SWCC, (S-SWCC)
should be used to estimate the relative permeability function. Therefore, the Fredlund-Xing-
Huang (1994) permeability function should be modified and the S-SWCC used for estimation
purposes:
( )
( ) ( )
sh
f1 f2f1 f2
rs
rbssh 6
sh
rbf1 f2
ln 11
1 110
ln 1ln exp 1 ln exp 1
c
m mn n
k
w p pA a
b
a a
ψ
ψψ
ψ ψψ
=
+ − − + + + + +
sh
1B
c
( )
( ) ( ) ( )( )
( ) ( ) ( )( )aev
b
ln
r
aev
ln
'
'
y
y
y
yb
y
y
ee dy
e
ee dy
e
kψ
ψ
θ θ ψθ
θ θ ψθ
ψ
−
−=
∫
∫
Page 19 of 53
https://mc06.manuscriptcentral.com/cgj-pubs
Canadian Geotechnical Journal

Draft
20
[17]
where:
krs = the relative coefficient of permeability and the superscript “s” denotes that the S-SWCC is
used as the basis for the permeability estimation.
A different relative permeability function is obtained when using different forms of SWCC as the
basis for calculating the permeability functions. The following two equations (i.e., Eqs [18] and
[19]) are based on the w-SWCC and the θi-SWCC and are used in the following section to
illustrate the errors that can occur when the wrong SWCC designations are used. The correct
equation to use is Eq. [17] when estimating the unsaturated permeability function. It should also
be noted that the AEV should be used as the lower limit of integration for the integral in the
denominator (Zhang and Fredlund 2015).
[18]
where:
krw = the relative coefficient of permeability with the superscript “w” denoting that the w-SWCC
is used as the basis for calculating the permeability function.
[19]
( )
( ) ( ) ( )( )
( ) ( ) ( )( )
r
aev
b
ln
aev
ln
'
'
S
y
y
y
yb
y
y
S e SS e dy
e
S e SS e dy
e
kψ
ψ
ψ
ψψ
−
−=
∫
∫
( )
( ) ( ) ( )( )
( ) ( ) ( )( )
r
aev
b
ln
aev
ln
'
'
w
y
y
y
yb
y
y
w e ww e dy
e
w e ww e dy
e
kψ
ψ
ψ
ψψ
−
−=
∫
∫
( )
( ) ( ) ( )( )
( ) ( ) ( )( )
i
r
aev
bi i
i
ln
aev
i
ln
'
'
y
y
y
ybi i y
y
ee dy
e
ee dy
e
k θ ψ
ψ
θ θ ψθ
θ θ ψθ
ψ
−
−=
∫
∫
Page 20 of 53
https://mc06.manuscriptcentral.com/cgj-pubs
Canadian Geotechnical Journal
Draft
21
where:
krθi = the relative coefficient of permeability with the superscript θi denoting that the θi-SWCC is
used as the basis for the permeability function.
S-SWCC best-fitted by Eq. [10] is suggested to be used in the function for the estimation
of the relative permeability function of a high-volume-change soil with bimodal w-SWCC such as
oil sands tailings. For a high-volume-change soil with unimodal w-SWCC such as Regina clay,
S-SWCC best-fitted by Eq. [A-5] in the Appendix A can be used in the function for the
estimation of the relative permeability function.
The overall permeability function for a high-volume-change material can be determined by
multiplying the reference saturated permeability function by the relative permeability function as
shown in Eq. [12]. By substituting the function (Eq. [17]) and Eq. [15] into Eq. [12], a
function can be obtained for the estimation of the permeability function for a soil that undergoes
volume change as soil suction changes during a drying process. The simplified form of the
computed permeability function is shown as Eq. [20].
[20]
The fitting parameters in Eq. [20] are obtained from the shrinkage curve, (i.e., Eq. [3]), the w-
SWCC, (i.e., Eq. [8]) and the best-fitting curve for the relationship of the saturated permeability
versus the void ratio, (i.e., Eq. [14]). Equation [20] changes when the best-fitting equation for the
w-SWCC changes. An appropriate best-fitting curve for w-SWCC is important for obtaining a
desirable permeability function using Eq. [20]. Equation [5] is recommended for best-fitting
unimodal measured w-SWCC data while Eq. [8] is suggested to best-fit bimodal measured w-
SWCC data. Both Equations [5] and [8] are used to best-fit w-SWCC and estimate the relative
( )r
Sk ψ
( )r
Sk ψ
( )r
Sk ψ
( )( )( ) ( ) ( ) ( )
( )
( ) ( ) ( )( )aev
b
ln
aev
ln
'
'
yB y
y
yb
y
y
S e SA e S e dy
ek
S e SS e dy
e
ψ
ψ
ψψ
ψψ
−
=−
∫
∫
Page 21 of 53
https://mc06.manuscriptcentral.com/cgj-pubs
Canadian Geotechnical Journal
Draft
22
permeability function for oil sands tailings for comparison. The steps for estimating the
permeability function of a soil exhibiting unimodal w-SWCC that changes volume as soil suction
increases are presented with the corresponding equations in Appendix A.
Application of the modified permeability function to oil sands tailings
Experimental data for oil sands tailings
The experimental data used for analysis purposes were previously published by Fredlund et al.
(2011). The data was part of a research study undertaken for the oil company, TOTAL. An
experimental procedure was developed to measure the entire shrinkage curve for a soil. Each
soil specimen was prepared at high water contents in a slurry state and placed into shrinkage
rings and allowed to slowly dry by exposure to air. Rings (brass rings) with no bottom were used
to contain each soil specimen. The rings with the soil were placed onto wax paper and drying
was commenced. The dimensions of rings were selected such that cracking of the soil was
unlikely to occur during the drying process. The ring dimensions selected for the shrinkage
curve specimens had a diameter of 3.7 cm and a thickness of 1.2 cm.
The mass and volume of each soil specimen were measured on a daily basis. A digital
micrometer was used to measure the volume of the specimen at various stages of drying. Four
to six measurements of the diameter and thickness of the specimen were made at different
locations on the specimens. Figure 3 shows typical measurements of water content and void
ratio as the soil dried. It was observed that as the specimen diameter began to decrease, with
the specimen pulling away from the brass ring, the rate of evaporation increased significantly.
The increase in the evaporation rate was related to the increased surface area from which
evaporation was occurring. Consequently, it is recommended that the measurements of mass
and volume should be increased to once every two to three hours once the soil shows signs of
pulling away from the sides of the ring.
Page 22 of 53
https://mc06.manuscriptcentral.com/cgj-pubs
Canadian Geotechnical Journal
Draft
23
Figure 3. Shrinkage curve for thickened oil sands tailings
The SWCC test is an important laboratory test conducted to determine the relationship between
soil suction and the amount of water in the soil. The measured soil-water characteristic curve is
usually plotted as gravimetric water content versus soil suction. Pressure plate cells and
desiccators with saturated salt solutions were used to measure the SWCC over the entire range
of suctions. Small pressure cells were used to apply suctions in the range from 0 to 400 kPa
and controlled relative humidity cells were used for suctions from 4,000 kPa to 300,000 kPa,
using various salt solutions.
The experimental data is used to test the proposed theory for the estimation of the permeability
function. The oil sands tailings results presented are for thickened tailings with a sand-to-fine
ratio (SFR) of 0.8 (Fredlund et al. 2011). The oil sands thickened tailings had a liquid limit of 35%
and a plastic limit of 15%. The shrinkage curve and the soil-water characteristic curves were
measured. The shrinkage curve results are presented in Figure 3. The best-fitting parameters of
the shrinkage curve for the oil sands tailings are, ash = 0.394, bsh = 0.162, and csh = 3.208. The
average specific gravity (Gs) was 2.43. The gravimetric water content, w, plotted versus soil
suction for oil sands tailings is shown in Figure 4. The oil sands w-SWCC data are best-fit using
both of the Fredlund-Xing (1994) unimodal equation (Eq. [5]) and the simplified bimodal w-
SWCC equation (Eq. [8]) for the purpose of comparison. The best-fit parameters of the
Fredlund-Xing (1994) equation are af = 1.250 kPa, nf = 0.982, mf = 0.612, and ψr = 107.4 kPa.
The best-fit parameters of the simplified bimodal equation are af1 = 0.306 kPa, af2 = 10355 kPa,
nf1 = 1.181, nf2 = 0.946, mf1 = 0.794, mf2 = 35.773 and ψrb = 1.875 kPa, p = 0.767. The initial
gravimetric water content was 73.8%. The measured w-SWCC data for the thickened oil sands
tailings display a bimodal feature as shown in Figure 4. Thus, the best-fitting curve obtained by
the simplified bimodal equation (Eq. [8]) represents the measured data points more closely than
the best-fitting curve obtained by the unimodal Fredlund-Xing (1994) equation as shown in
Figure 4. The w-SWCC is used in conjunction with the shrinkage curve to calculate S-SWCC
Page 23 of 53
https://mc06.manuscriptcentral.com/cgj-pubs
Canadian Geotechnical Journal
Draft
24
and θi-SWCC. The quality of the fitting of the w-SWCC can influence the closeness of the fitting
of the subsequent other forms of SWCCs (i.e., θi-SWCC and S-SWCC).
Figure 4. Gravimetric water content versus soil suction for thickened oil sands tailings.
The relationship between the saturated coefficient of permeability and void ratio was also
measured in the laboratory by constant head tests. Constant head tests were conducted on 100
mm diameter samples in a modified Proctor mould. A constant head hydraulic gradient was
applied across the sample, and the outflow of water was measured and recorded. The
experimental data were best-fitted using Eq. [14]. Figure 5 shows the measured results and the
best-fitting curve. Equation [14] produces a reasonable fitting curve for the saturated
permeability versus void ratio relationship for thickened oil sands tailings with the fitting
parameters A = 1.263×10⁻⁹ and B = 3.042.
The shrinkage curve (Figure 3), the w-SWCC (Figure 4) and the curve of saturated permeability
versus void ratio (Figure 5), form the basis for the subsequent calculation for the permeability
function for thickened oil sands tailings.
Figure 5. Measured data of saturated permeability versus void ratio and its best-fitting curves for
thickened oil sands tailings
Interpretation of the experimental data
The gravimetric water content SWCC, (w-SWCC) is combined with the shrinkage curve to
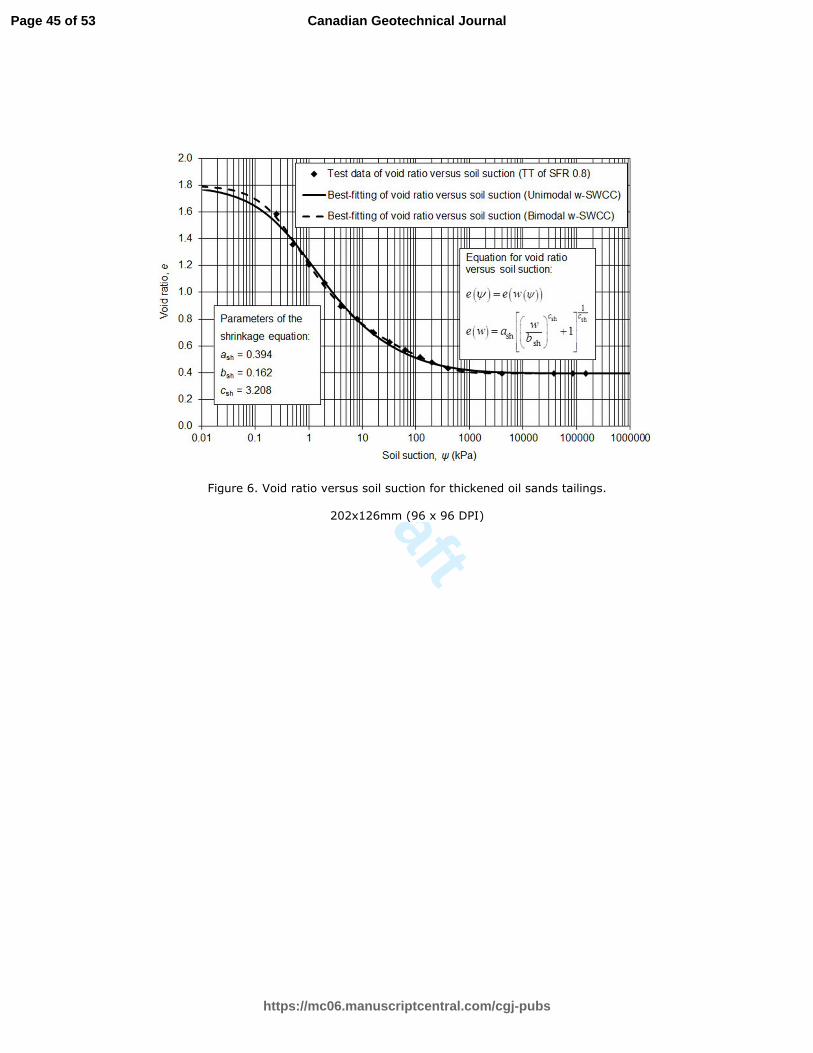
obtain the S-SWCC and θi-SWCC (i.e., Eq. [10] and Eq. [11]). Figure 6 shows a relationship of
the void ratio versus soil suction, which is calculated from the w-SWCC and the shrinkage curve.
Page 24 of 53
https://mc06.manuscriptcentral.com/cgj-pubs
Canadian Geotechnical Journal

Draft
25
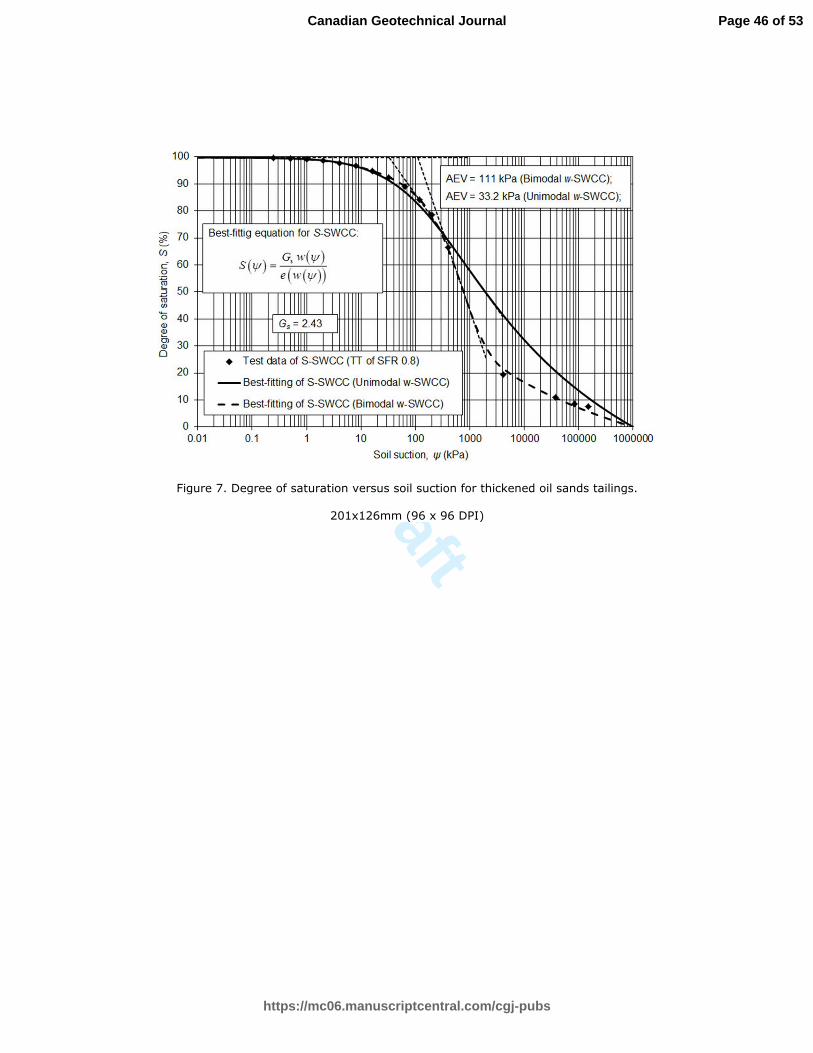
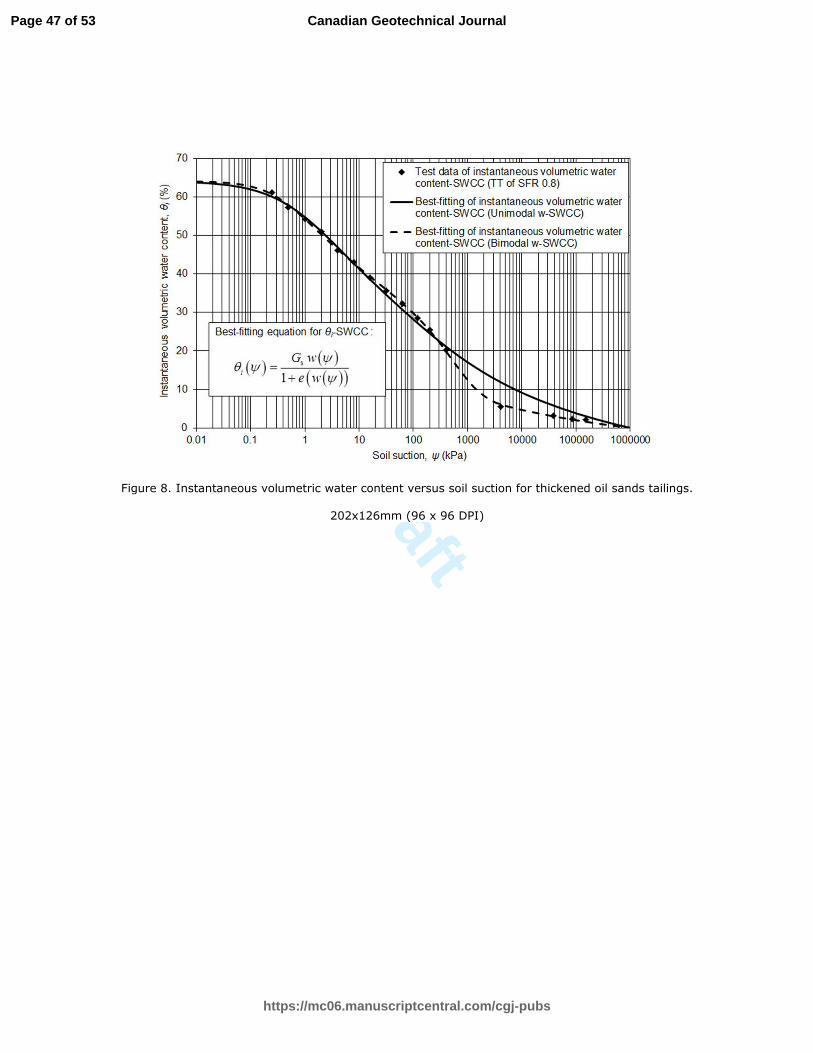
The resulting plot of degree of saturation versus soil suction is shown in Figure 7. The plot of θi-
SWCC is shown in Figure 8. The dash fitting curves on Figures 6 to 8 are calculated on the
basis of the fitting curve for the w-SWCC obtained using the simplified bimodal Eq. [8]. The solid
fitting curves on Figures 6 to 8 are obtained using w-SWCC best-fitted by the unimodal Eq. [5].
The dash lines are closer fits to the data than the solid lines for the relationship between void
ratio and soil suction, S-SWCC and θi-SWCC. Plots of Figures 6 to 8 illustrate the superior fit
that can be obtained as a consequence of a better fit of the w-SWCC.
Figure 6. Void ratio versus soil suction for thickened oil sands tailings.
Figure 7. Degree of saturation versus soil suction for thickened oil sands tailings.
Figure 8. Instantaneous volumetric water content versus soil suction for thickened oil sands
tailings.
The best-fit curves for the SWCCs obtained using the simplified bimodal equation for the w-
SWCC are used to illustrate the importance of applying the correct form of SWCC in the
estimation of the correct air-entry value and the relative permeability function. Table 1 lists the
breaking points on various SWCCs. The breaking point along a SWCC is the matric suction at
which the curve starts to bend down. The breaking point on the S-SWCC is called air-entry
value, the matric suction where air starts to enter the largest pores in the soil. Breaking points
are obtained by finding the point of intersection of two straight lines. One is the horizontal line
passing the maximum water content, while the other line is the steepest slope line passing the
first inflection point on the SWCC. For soils that undergo large volume changes such as
thickened oil sands tailings, the breaking points on different SWCCs appear at different soil
suctions (Table 1). The breaking point on the w-SWCC is at a soil suction of 0.113 kPa. The
Page 25 of 53
https://mc06.manuscriptcentral.com/cgj-pubs
Canadian Geotechnical Journal

Draft
26
breaking point on the S-SWCC is at a soil suction of 111 kPa. The breaking point on the θi-
SWCC is at a soil suction of 0.183 kPa. The air-entry value, AEV, of the soil must be estimated
from the S-SWCC. The degree of saturation versus soil suction plot (Figure 7) indicates that the
AEV is 111 kPa.
The relative permeability function is an important component constituting the permeability
function for a soil that undergoes volume change as soil suction changes. Different permeability
functions are obtained when using different forms of SWCC for estimation. Figure 9 shows three
curves of the relative permeability function obtained respectively from w-SWCC, θi-SWCC, and
S-SWCC. These three curves are obtained using Eqs. [17] to [19]. Soil suction at the breaking
point on each SWCC was used as the lower limit of integration for the integral in the
denominator of each estimation equation. The correct estimation of the relative permeability is
the one obtained from the S-SWCC. Figure 9 shows that the results obtained from the w-SWCC
under-estimated the relative permeability by 6.38 orders of magnitude, while the results
obtained from the θi-SWCC under-estimated the relative permeability by 5.07 orders of
magnitude. The differences shown in Figure 9 are substantial.
Figure 9. Relative permeability versus soil suction for thickened oil sands tailings.
Figure 10 illustrate the importance of the AEV when estimating the relative permeability function.
The results show that the relative permeability versus soil suction obtained from S-SWCC differs
when different values are used for the lower limit of integration. Table 2 presents the difference
that could result when using a smaller value as the lower limit of integration. The difference in
the resulting estimation for the relative permeability caused by using a lower limit of integration
different than the AEV is significant (Zhang and Fredlund 2015). The function (Eq. [17])
specifies that the AEV should be used as the lower limit of integration for the integral in the
( )r
Sk ψ
Page 26 of 53
https://mc06.manuscriptcentral.com/cgj-pubs
Canadian Geotechnical Journal
Draft
27
denominator of the equation. The most reasonable curve for the relative permeability function is
the one obtained when using the AEV as the lower limit of integration.
Figure 10. Relative permeability versus soil suction obtained from S-SWCC using different lower
limits of integration for thickened oil sands tailings.
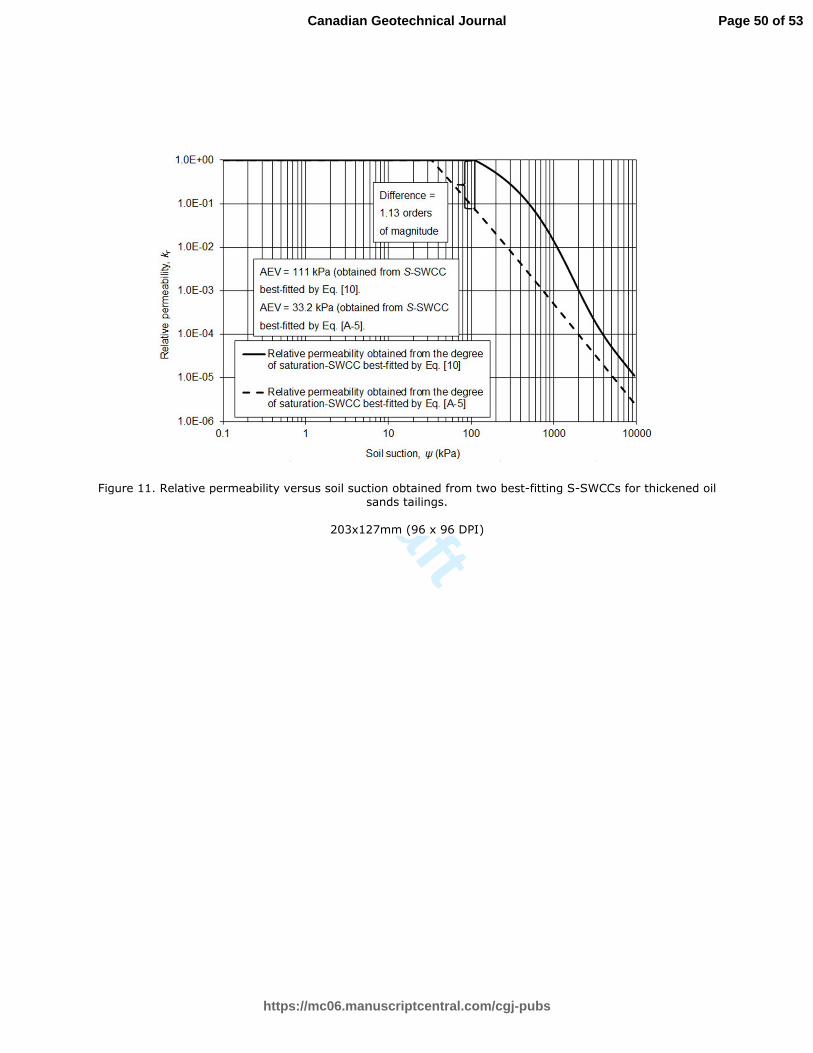
The quality of the best-fit for the S-SWCC also influences the correctness of the estimation
results of the relative coefficient of permeability (Figure 11). Two curves of the relative
coefficient of permeability in Figure 11 are estimated respectively from the two best-fitting
curves of the S-SWCCs shown in Figure 7. The difference between two relative permeability
curves at an AEV of 111 kPa is about 1.13 orders of magnitude. A superior fitting of the S-
SWCC results in a more accurate estimation of the AEV and subsequently the relative
permeability function. In the case of thickened oil sands tailings, the data are more closely fit
when using the simplified bimodal w-SWCC equation and the corresponding subsequent forms
of SWCCs. The AEV obtained from the S-SWCC best-fitted by the Eq. [A-5] is 33.2 kPa. The
more accurate AEV is 111 kPa, the value obtained from the S-SWCC best-fitted by Eq. [10]
(Figure 7). Eq. [10] is derived from the simplified bimodal w-SWCC equation, while Eq. [A-5] is
derived from the unimodal Fredlund and Xing (1994) w-SWCC equation.
Figure 11. Relative permeability versus soil suction obtained from two best-fitting S-SWCCs for
thickened oil sands tailings.
Figure 12. Relative permeability versus soil suction for thickened oil sands tailings.
Page 27 of 53
https://mc06.manuscriptcentral.com/cgj-pubs
Canadian Geotechnical Journal

Draft
28
Figure 12 shows the curve of the relative permeability versus soil suction obtained when using
the superior fit of the S-SWCC and the AEV as the lower limit of integration. The curve shown in
Figure 12 is used for the subsequent calculation of the permeability function with Eq. [12].
The saturated permeability is a function of void ratio as shown in Figure 5. Equation [14] is used
to best-fit the measured data to obtain the mathematical relationship between the saturated
permeability and the void ratio. The void ratio changes with soil suction during the drying
process as shown in Figure 6. The relationship of the void ratio and soil suction can be
represented by Eq. [9]. As a result, the saturated permeability can be related to soil suction.
When the saturated permeability is related to soil suction, it is referred to the reference
saturated permeability. The reference saturated permeability is the corresponding saturated
permeability related to the void ratio at a particular soil suction as shown in Figure 13. The
reference saturated permeability versus soil suction is mathematically represented by Eq. [15].
Figure 13. Reference saturated permeability versus soil suction for thickened oil sands tailings.
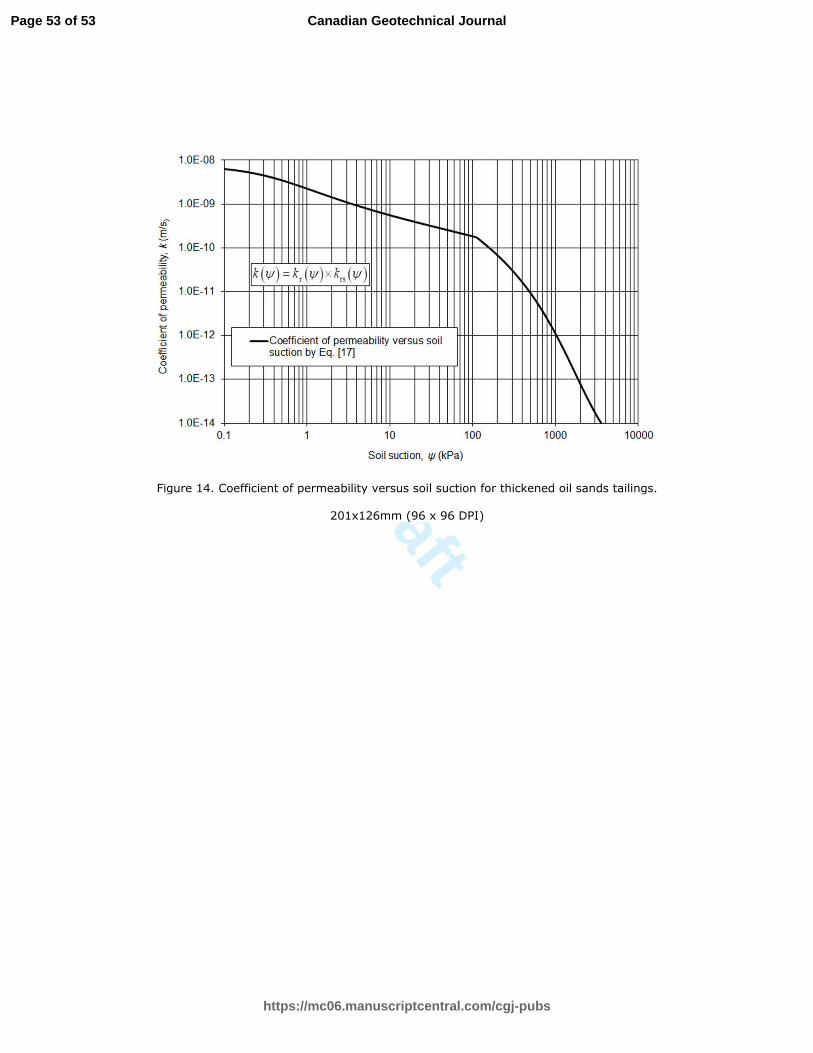
After obtaining the relative permeability function shown in Figure 12 and the reference saturated
permeability function shown in Figure 13, the coefficient of permeability function can be
obtained by multiplying the relative permeability function by the reference saturated permeability
function in accordance with Eq. [12]. The relationship of the coefficient of permeability to soil
suction for thickened oil sands tailings is shown in Figure 14.
Figure 14. Coefficient of permeability versus soil suction for thickened oil sands tailings.
Conclusions
The void ratio and the degree of saturation are variables that influence the coefficient of
permeability for a soil. Only the degree of saturation affects the coefficient of permeability when
the soil does not change volume during a drying process. This paper presents a revised
Page 28 of 53
https://mc06.manuscriptcentral.com/cgj-pubs
Canadian Geotechnical Journal
Draft
29
methodology for the estimation of the coefficient of permeability for a drying soil where both void
ratio and degree of saturation change with soil suction. The proposed permeability function is
the product of the reference saturated permeability function and the relative permeability
function.
The effect of a change in void ratio on the coefficient of permeability function is presented as the
reference saturated permeability function. The reference saturated permeability is the saturated
permeability corresponding to a particular void ratio. The influence of a change in the degree of
saturation is presented as a relative permeability function. The relative coefficient of
permeability and the AEV should be estimated from the S-SWCC. The AEV should be used as
the lower limit of integration in the integral of the denominator in the proposed permeability
equation. Using other forms of the SWCC or other values as the lower limit of integration can
lead to large estimation errors for the permeability function.
The quality of the fit of the S-SWCC affects the quality of the estimated permeability function. A
superior fitting of the S-SWCC results in a more accurate estimation of the relative permeability
function. The laboratory data for thickened oil sands tailings illustrate the detailed calculation
procedure associated with the estimation of the coefficient of permeability function. The
measured w-SWCC of thickened oil sands tailings exhibited a bimodal feature. A simplified
bimodal w-SWCC equation was proposed and used to obtain a close fit for the w-SWCC. The
shrinkage curve, the gravimetric water content versus soil suction and the saturated
permeability versus void ratio are three basic experimental measurements required for the
estimation of the coefficient of permeability function for soils that undergo volume change as soil
suction is increased.
Acknowledgements
The authors want to acknowledge to contribution of TOTAL in support of the study that provided
the laboratory test results that gave rise to the detailed analysis of the oil sands tailings material.
Page 29 of 53
https://mc06.manuscriptcentral.com/cgj-pubs
Canadian Geotechnical Journal
Draft
30
The sponsorship of this study has led to improvements in the estimation of nonlinear soil
property functions for large strain modeling of high volume change materials such as oil sands
tailings.
References
BGC Engineering Inc. 2010. Oil sands tailings technology review (OSRIN Report No. TR-1).
Retrieved from http://hdl.handle.net/10402/era.17555
Brooks, R.H., and Corey, A.T. 1964. Hydraulic properties of porous media. Hydrology Paper 3,
Civil Engineering Department, Colorado State University, Fort Collins, CO.
Burdine, N. 1953. Relative permeability calculations from pore size distribution data. Journal of
Petroleum Technology, 5 (03): 71–78.
Burger, C.A., and Shackelford, C.D. 2001a. Evaluating dual porosity of pelletized diatomaceous
earth using bimodal soil–water characteristic curve functions. Can. Geotech. J., 38(1): 53–66.
Burger, C.A., and Shackelford, C.D. 2001b. Soil–water characteristic curves and dual porosity of
sand-diatomaceous earth mixtures. J. Geotech. Geoenviron. Eng., 127(9): 790–800.
Chapuis, R.P. 2012. Predicting the saturated hydraulic conductivity of soils: a review. Bulletin of
Engineering Geology and the Environment, 71(3): 401-434.
Childs, E.C., and Collis-George, N. 1950. The permeability of porous materials. In Proceedings
of the Royal Society of London A: Mathematical, Physical and Engineering Sciences. The
Royal Society, 201(1066): 392-405.
Cornelis, W. M., Corluy, J., Medina, H., Hartmann, R., Van Meirvenne, M., and Ruiz, M. E. 2006.
A simplified parametric model to describe the magnitude and geometry of soil shrinkage.
European Journal of Soil Science, 57(2): 258-268.
Croney, D., and Coleman, J. D. 1954. Soil structure in relation to soil suction (pF). Journal of
Soil Science, 5(1): 75-84.
Page 30 of 53
https://mc06.manuscriptcentral.com/cgj-pubs
Canadian Geotechnical Journal

Draft
31
Fredlund, D.G., and Xing, A. 1994. Equations for the soil-water characteristic curve. Canadian
geotechnical journal, 31(4): 521-532.
Fredlund, D.G., Xing, A. and Huang, S. 1994. Predicting the permeability function for
unsaturated soils using the soil-water characteristic curve. Canadian Geotechnical Journal,
31(4): 533-546.
Fredlund, D.G., Stone, J., Stianson, J., and Sedgwick, A. 2011. Determination of water storage
and permeability functions for oil sands tailings. Proceedings of the 15th International
Conference on Tailings and Mine Waste, Vancouver, BC, Canada, November 6th to 9th, 2011.
Fredlund, D.G., Rahardjo, H., and Fredlund, M.D. 2012. Unsaturated soil mechanics in
engineering practice. John Wiley & Sons, New York.
Fredlund, D.G., and Zhang, F-X. 2013. Combination of shrinkage curve and soil-water
characteristic curves for soils that undergo volume change as soil suction is increased.
Proceedings of the 18th International Conference on Soil Mechanics and Geotechnical
Engineering, Paris, France.
Fredlund, M.D. 2000. The role of unsaturated soil property functions in the practice of
unsaturated soil mechanics. Dissertation, University of Saskatchewan, Saskatoon,
Saskatchewan.
Gardner, W. R. 1974. The permeability problem. Soil Science, 117(5): 243-249.
Haines, W. B. 1923. The volume-changes associated with variations of water content in soil.
The Journal of agricultural science, 13(03): 296-310.
Huang, S., Barbour, S.L., and Fredlund, D.G. 1998. Development and verification of a
coefficient of permeability function for a deformable unsaturated soil. Canadian Geotechnical
Journal, 35(3): 411-425.
Kim, D.J., Vereecken, H., Feyen, J., Boels, D., and Bronswijk, J.J.B. 1992. On the
characterization of properties of an unripe marine clay soil: I. Shrinkage processes of an
unripe marine clay soil in relation to physical ripening, Soil Science, 153(6): 471-481.
Page 31 of 53
https://mc06.manuscriptcentral.com/cgj-pubs
Canadian Geotechnical Journal
Draft
32
Leong, E.C., and Rahardjo, H. 1997. Permeability functions for unsaturated soils. Journal of
Geotechnical and Geoenvironmental Engineering, 123(12): 1118-1126.
Marinho, F.A.M. 1994. Shrinkage behaviour of some plastic soils. Doctoral dissertation,
University of London, UK.
Mbonimpa, M., Aubertin, M., Maqsoud, A., and Bussière, B. 2006. Predictive model for the
water retention curve of deformable clayey soils. Journal of Geotechnical and
Geoenvironmental Engineering, 132(9): 1121-1132.
Mualem, Y. 1976. A new model for predicting the hydraulic conductivity of unsaturated porous
media. Water Resources Research, 12(3): 513-522.
Nuth, M., and Laloui, L. 2008. Advances in modeling hysteretic water retention curve in
deformable soils. Computers and Geotechnics, 35(6): 835-844.
Parent, S.E., Cabral, A., and Zornberg, J.G. 2007. Water retention curve and hydraulic
conductivity function of highly compressible materials. Canadian Geotechnical Journal,
44(10): 1200-1214.
Rahimi, A., Rahardjo, H., and Leong, E.C. 2015. Effects of soil–water characteristic curve and
relative permeability equations on estimation of unsaturated permeability function. Soils and
Foundations, 55(6): 1400-1411.
Rodriguez, R. 2006. Hydrogeotechnical characterization of a metallurgical waste. Canadian
Geotechnical Journal, 43(10): 1042-1060.
Saleh-Mbemba, F., Aubertin, M., Mbonimpa, M., and Li, L. 2016. Experimental characterization
of the shrinkage and water retention behavior of tailings from hard rock mines. Geotechnical
and Geological Engineering, 34(1): 251-266.
Sobkowicz, J.C., and Morgenstern, N.R. 2009. A geotechnical perspective on oil sands tailings.
Proceedings of the Thirteenth International Conference on Tailings and Mine Waste, xvii–xl.
Page 32 of 53
https://mc06.manuscriptcentral.com/cgj-pubs
Canadian Geotechnical Journal
Draft
33
Somogyi, F. 1980. Large-strain consolidation of fine-grained slurries. Proceedings of the
Canadian Society for Civil Engineering 1980 Annual Conference, Winnipeg, Manitoba,
Canada.
Sridharan, A., and Rao, G.V. 1971. Effective stress theory of shrinkage phenomena. Canadian
Geotechnical Journal, 8(4): 503-513.
Tami, D., Rahardjo, H, and Leong, E.C. 2004. Effects of hysteresis on steady-state infiltration in
unsaturated slopes. Journal of Geotechnical and Geoenvironmental Engineering, ASCE, 130
(9): 956-967.
Taylor, D.W. 1948. Fundamentals of soil mechanics. J. Wiley & Sons; London: Chapman & Hall.
Tempany, H.A. 1917. The shrinkage of soils. The Journal of Agricultural Science, 8(03): 312-
330.
Terzaghi, K. 1925. Principles of soil mechanics, IV -- Settlement and consolidation of clay.
Engineering News-Record, 95(3): 874-878.
Tripathy, S., Tadza, M.Y.M., and Thomas, H.R. 2014. Soil-water characteristic curves of clays.
Canadian Geotechnical Journal, 51(8): 869-883.
Van Genuchten, M.T. 1980. A closed-form equation for predicting the hydraulic conductivity of
unsaturated soils. Soil science society of America journal, 44(5): 892-898.
Zhang, F-X, Fredlund, D. G., Wilson, G. W., and Sedgwick, A. 2014. Determination of the
permeability function for drying oil sands tailings undergoing volume change and
desaturation. Proceedings of the 4th International Oil Sands Tailings Conference, Banff,
A.B.Dec 7th-10th, 2014.
Zhang, F-X, and Fredlund, D.G. 2015. Examination of the estimation of relative permeability for
unsaturated soils. Canadian Geotechnical Journal, 52(12): 2077-2087.
Zhang, F., Fredlund, D.G., and Wilson, G.W. 2016. “Water Permeability Function for Soils that
Undergo Volume Change as Suction Changes”. Indian Geotechnical Journal. 46 (3): 210-
227. doi:10.1007/s40098-016-0187-5.
Page 33 of 53
https://mc06.manuscriptcentral.com/cgj-pubs
Canadian Geotechnical Journal

Draft
34
Zhang, L., and Chen, Q. 2005. Predicting bimodal soil–water characteristic curves. Journal of
Geotechnical and Geoenvironmental Engineering, 131(5): 666-670.
Page 34 of 53
https://mc06.manuscriptcentral.com/cgj-pubs
Canadian Geotechnical Journal
Draft
35
Figures
Figure 1. Fredlund-Xing (1994) SWCC fit to experimental data for Columbia sandy silt (Data
from Brooks and Corey 1964).
Figure 2. Gravimetric water content, instantaneous volumetric water content and degree of
saturation versus soil suction for thickened oil sands tailings tested
Figure 3. Shrinkage curve for thickened oil sands tailings
Figure 4. Gravimetric water content versus soil suction thickened oil sands tailings.
Figure 5. Measured data of saturated permeability versus void ratio and its best-fitting curves for
thickened oil sands tailings
Figure 6. Void ratio versus soil suction for thickened oil sands tailings.
Figure 7. Degree of saturation versus soil suction for thickened oil sands tailings.
Figure 8. Instantaneous volumetric water content versus soil suction for thickened oil sands
tailings.
Figure 9. Relative permeability versus soil suction for thickened oil sands tailings.
Figure 10. Relative permeability versus soil suction obtained from S-SWCC using different lower
limits of integration for thickened oil sands tailings.
Figure 11. Relative permeability versus soil suction obtained from two best-fitting S-SWCCs for
thickened oil sands tailings.
Figure 12. Relative permeability versus soil suction for thickened oil sands tailings.
Figure 13. Reference saturated permeability versus soil suction for thickened oil sands tailings.
Figure 14. Coefficient of permeability versus soil suction for thickened oil sands tailings.
Page 35 of 53
https://mc06.manuscriptcentral.com/cgj-pubs
Canadian Geotechnical Journal
Draft
1
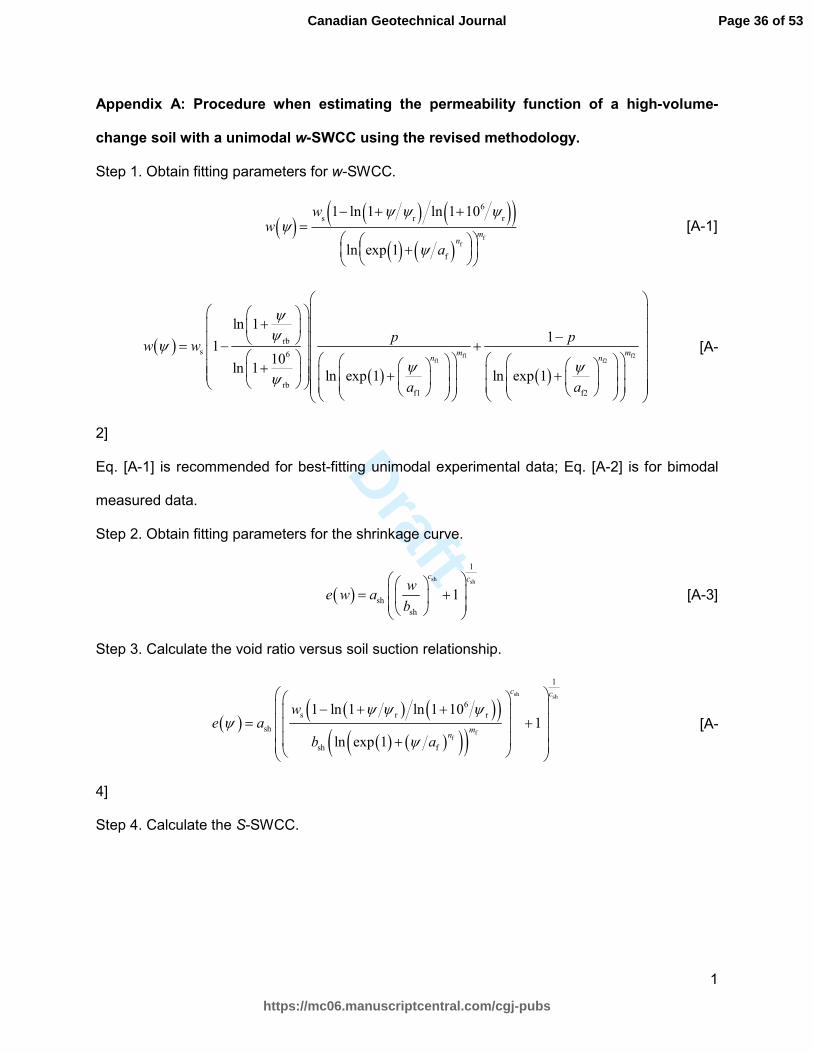
Appendix A: Procedure when estimating the permeability function of a high-volume-
change soil with a unimodal w-SWCC using the revised methodology.
Step 1. Obtain fitting parameters for w-SWCC.
[A-1]
[A-
2]
Eq. [A-1] is recommended for best-fitting unimodal experimental data; Eq. [A-2] is for bimodal
measured data.
Step 2. Obtain fitting parameters for the shrinkage curve.
[A-3]
Step 3. Calculate the void ratio versus soil suction relationship.
[A-
4]
Step 4. Calculate the S-SWCC.
w ψ( ) =ws1− ln 1+ψ ψ
r( ) ln 1+106 ψr( )( )ln exp 1( )+ ψ a
f( )nf
mf
( )
( ) ( )f1 f2
f1 f2
rb
s 6
rbf1 f2
ln 11
110
ln 1ln exp 1 ln exp 1
m mn n
p pw w
a a
ψψ
ψψ ψ
ψ
+ − = − + + + +
( )sh sh
1
sh
sh
1
c cw
e w ab
= +
( )( ) ( )( )
( ) ( )( )( )
sh sh
ff
1
6
s r r
sh
sh f
1 ln 1 ln 1 101
ln exp 1
c c
mn
we a
b a
ψ ψ ψψ
ψ
− + + = + +
Page 36 of 53
https://mc06.manuscriptcentral.com/cgj-pubs
Canadian Geotechnical Journal
Draft
2
[A-
5]
Step 5. Calculate the θi-SWCC.
[A-
6]
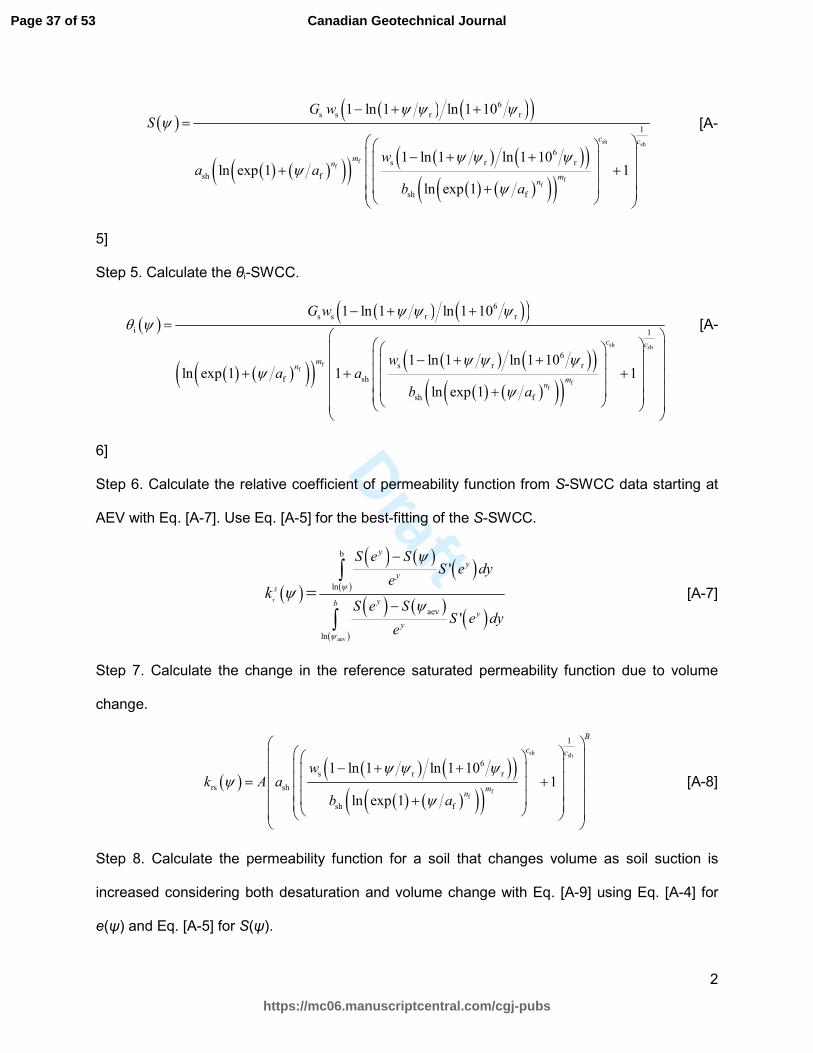
Step 6. Calculate the relative coefficient of permeability function from S-SWCC data starting at
AEV with Eq. [A-7]. Use Eq. [A-5] for the best-fitting of the S-SWCC.
[A-7]
Step 7. Calculate the change in the reference saturated permeability function due to volume
change.
[A-8]
Step 8. Calculate the permeability function for a soil that changes volume as soil suction is
increased considering both desaturation and volume change with Eq. [A-9] using Eq. [A-4] for
e(ψ) and Eq. [A-5] for S(ψ).
( )( ) ( )( )
( ) ( )( )( ) ( ) ( )( )( ) ( )( )( )
sh sh
ff
ff
6
s s r r
1
6
s r r
sh f
sh f
1 ln 1 ln 1 10
1 ln 1 ln 1 10ln exp 1 1
ln exp 1
c c
mn
mn
G wS
wa a
b a
ψ ψ ψψ
ψ ψ ψψ
ψ
− + +=
− + + + + +
( )( ) ( )( )
( ) ( )( )( ) ( ) ( )( )( ) ( )( )( )
sh sh
ff
ff
6
s s r r
i 1
6
s r r
f sh
sh f
1 ln 1 ln 1 10
1 ln 1 ln 1 10ln exp 1 1 1
ln exp 1
c c
mn
mn
G w
wa a
b a
ψ ψ ψθ ψ
ψ ψ ψψ
ψ
− + +=
− + + + + + +
( )
( ) ( ) ( )( )
( ) ( ) ( )( )
r
aev
b
ln
aev
ln
'
'
S
y
y
y
yb
y
y
S e SS e dy
e
S e SS e dy
e
kψ
ψ
ψ
ψψ
−
−=
∫
∫
( )( ) ( )( )
( ) ( )( )( )
sh sh
ff
1
6
s r r
rs sh
sh f
1 ln 1 ln 1 101
ln exp 1
B
c c
mn
wk A a
b a
ψ ψ ψψ
ψ
− + + = + +
Page 37 of 53
https://mc06.manuscriptcentral.com/cgj-pubs
Canadian Geotechnical Journal

Draft
3
[A-9]
( )( )( ) ( ) ( ) ( )
( )
( ) ( ) ( )( )aev
b
ln
aev
ln
'
'
yB y
y
yb
y
y
S e SA e S e dy
ek
S e SS e dy
e
ψ
ψ
ψψ
ψψ
−
=−
∫
∫
Page 38 of 53
https://mc06.manuscriptcentral.com/cgj-pubs
Canadian Geotechnical Journal
Draft
Tables
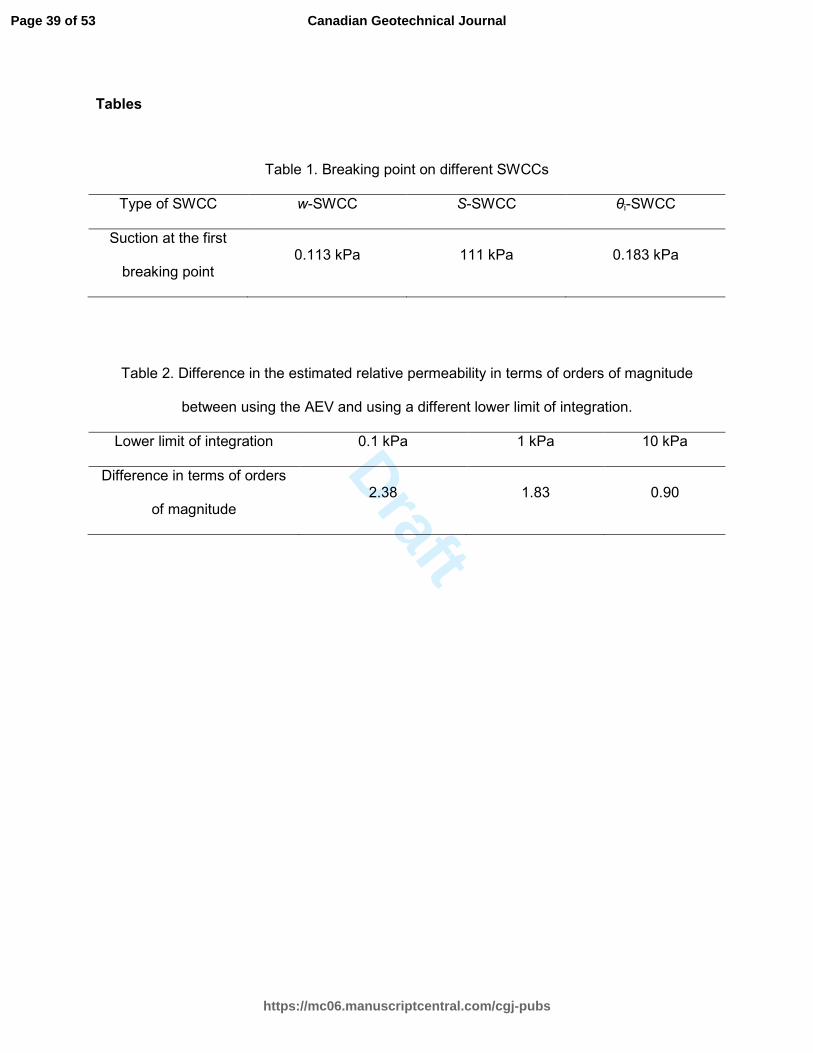
Table 1. Breaking point on different SWCCs
Type of SWCC w-SWCC S-SWCC θi-SWCC
Suction at the first
breaking point 0.113 kPa 111 kPa 0.183 kPa
Table 2. Difference in the estimated relative permeability in terms of orders of magnitude
between using the AEV and using a different lower limit of integration.
Lower limit of integration 0.1 kPa 1 kPa 10 kPa
Difference in terms of orders
of magnitude 2.38 1.83 0.90
Page 39 of 53
https://mc06.manuscriptcentral.com/cgj-pubs
Canadian Geotechnical Journal

Draft
Figure 1. Fredlund-Xing (1994) SWCC fit to experimental data for Columbia sandy silt (Data from Brooks and Corey (1964)).
202x126mm (96 x 96 DPI)
Page 40 of 53
https://mc06.manuscriptcentral.com/cgj-pubs
Canadian Geotechnical Journal
Draft
Figure 2. Gravimetric water content, instantaneous volumetric water content and degree of saturation versus soil suction for thickened oil sands tailings tested
197x124mm (96 x 96 DPI)
Page 41 of 53
https://mc06.manuscriptcentral.com/cgj-pubs
Canadian Geotechnical Journal

Draft
Figure 3. Shrinkage curve for thickened oil sands tailings
202x126mm (96 x 96 DPI)
Page 42 of 53
https://mc06.manuscriptcentral.com/cgj-pubs
Canadian Geotechnical Journal

Draft
Figure 4. Gravimetric water content versus soil suction thickened oil sands tailings.
202x126mm (96 x 96 DPI)
Page 43 of 53
https://mc06.manuscriptcentral.com/cgj-pubs
Canadian Geotechnical Journal

Draft
Figure 5. Measured data of saturated permeability versus void ratio and its best-fitting curves for thickened oil sands tailings
202x126mm (96 x 96 DPI)
Page 44 of 53
https://mc06.manuscriptcentral.com/cgj-pubs
Canadian Geotechnical Journal
Draft
Figure 6. Void ratio versus soil suction for thickened oil sands tailings.
202x126mm (96 x 96 DPI)
Page 45 of 53
https://mc06.manuscriptcentral.com/cgj-pubs
Canadian Geotechnical Journal
Draft
Figure 7. Degree of saturation versus soil suction for thickened oil sands tailings.
201x126mm (96 x 96 DPI)
Page 46 of 53
https://mc06.manuscriptcentral.com/cgj-pubs
Canadian Geotechnical Journal
Draft
Figure 8. Instantaneous volumetric water content versus soil suction for thickened oil sands tailings.
202x126mm (96 x 96 DPI)
Page 47 of 53
https://mc06.manuscriptcentral.com/cgj-pubs
Canadian Geotechnical Journal

Draft
Figure 9. Relative permeability versus soil suction for thickened oil sands tailings.
202x127mm (96 x 96 DPI)
Page 48 of 53
https://mc06.manuscriptcentral.com/cgj-pubs
Canadian Geotechnical Journal

Draft
Figure 10. Relative permeability versus soil suction obtained from S-SWCC using different lower limits of integration for thickened oil sands tailings.
202x126mm (96 x 96 DPI)
Page 49 of 53
https://mc06.manuscriptcentral.com/cgj-pubs
Canadian Geotechnical Journal
Draft
Figure 11. Relative permeability versus soil suction obtained from two best-fitting S-SWCCs for thickened oil sands tailings.
203x127mm (96 x 96 DPI)
Page 50 of 53
https://mc06.manuscriptcentral.com/cgj-pubs
Canadian Geotechnical Journal

Draft
Figure 12. Relative permeability versus soil suction for thickened oil sands tailings.
201x127mm (96 x 96 DPI)
Page 51 of 53
https://mc06.manuscriptcentral.com/cgj-pubs
Canadian Geotechnical Journal

Draft
Figure 13. Reference saturated permeability versus soil suction for thickened oil sands tailings.
202x127mm (96 x 96 DPI)
Page 52 of 53
https://mc06.manuscriptcentral.com/cgj-pubs
Canadian Geotechnical Journal
Draft
Figure 14. Coefficient of permeability versus soil suction for thickened oil sands tailings.
201x126mm (96 x 96 DPI)
Page 53 of 53
https://mc06.manuscriptcentral.com/cgj-pubs
Canadian Geotechnical Journal