saneatins state of tocantins, brazil - esmap case study.pdf · saneatins – state of tocantins,...
TRANSCRIPT
SANEATINS – State of Tocantins, Brazil
Background
The Sanitation Company of Tocantins (Companhia de Saneamento de Tocantins) –
SANEATINS – was established in 1989 when the State of Goiás was divided and the new State
of Tocantins was created. SANEATINS was broken out of the state-owned utility of Goías at
the time – SANEAGO.
In 1998 the government of the State of Tocantins transformed the previously state-owned
utility into a company of mixed private-public ownership: 76.5% of the shares belong to EMSA
(Empresa Sul-Americana de Montagem S.A); 23.4% to the State of Tocantins and the remainder
to other shareholders.
When SANEATINS was formed in 1989, it served 33 municipalities with a total water
supply network of 216 km. There were about 12,000 connections providing treated water
covering about 12 percent of the urban population at that time. Among the early challenges was
providing the infrastructure for the new state capital in Palmas, besides expanding service in
municipalities throughout the state – including a large number previously without access to any
service. The population of Tocantins has been growing faster than the national average, though
the state is still relatively sparsely populated.
By 1998 there were 151,000 connections providing treated water. At the end of 2008
there were 291,400 connections in 124 of Tocantin’s 139 municipalities, while SANEATINS
also provided services to 5 municipalities in the neighboring state of Pará. By the end of 2009
the number of connections had increased to 313,400. Approximately 96 percent of the urban
population is served. All connections are metered.
The rapid expansion of water supply infrastructure is also reflected in the length of the
water supply network, which grew by almost 40 percent between 2002 and 2008 (from 3,567 km
to 5,017 km in 2008), though the growth of the network has slowed down considerably since
2006. Raw water is provided from 56 surface water inlets and 443 wells. The large number of
supply points is unsurprising given that the utility serves widely dispersed and usually relatively
small cities. Figure 1 shows the geographic distribution of surface water supply (green),
subterranean water supply (blue) and systems with mixed sources of supply.
It is interesting to contrast SANEATINS with another utility in this series of case studies
– SANASA – which serves the city of Campinas in São Paulo. The total length of
SANEATINS’ water supply networks is 36% longer than that of SANASA even though they
supply only 66% of the water.

2
Figure 1: Distribution of systems by type of water supply Legend: Wells (blue); Surface Water (green); Mixed supply (yellow); No concession (blank)
Source: SANEATINS
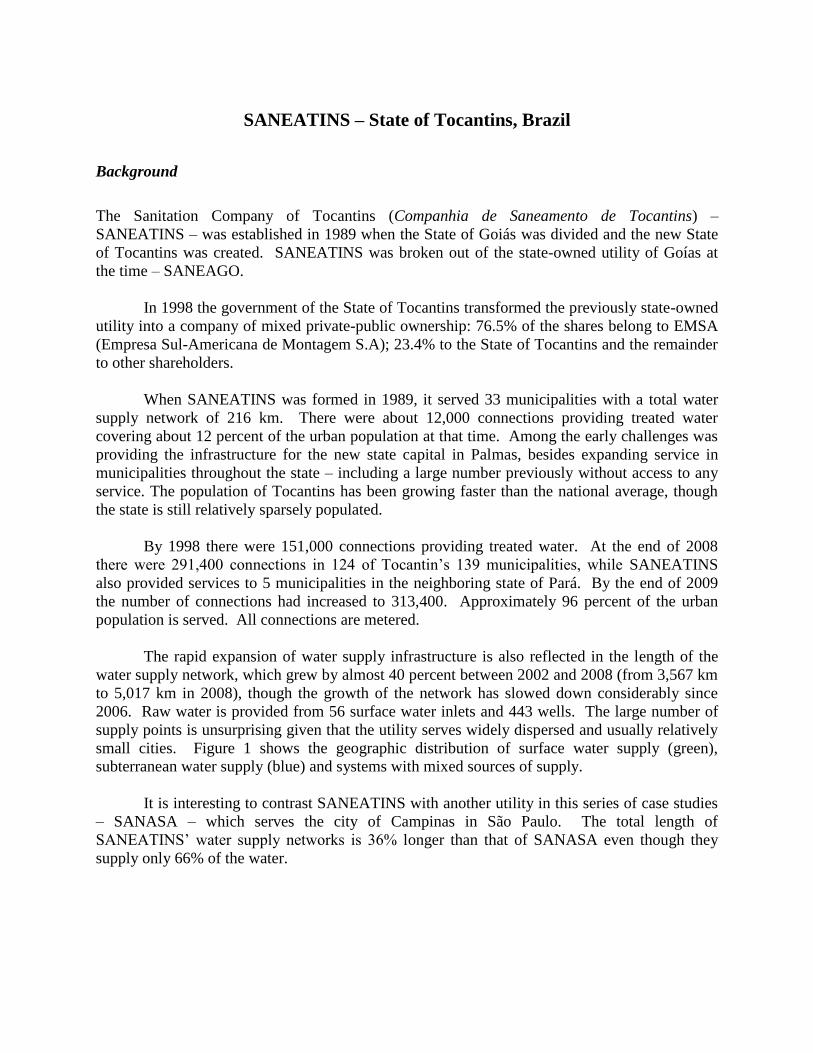
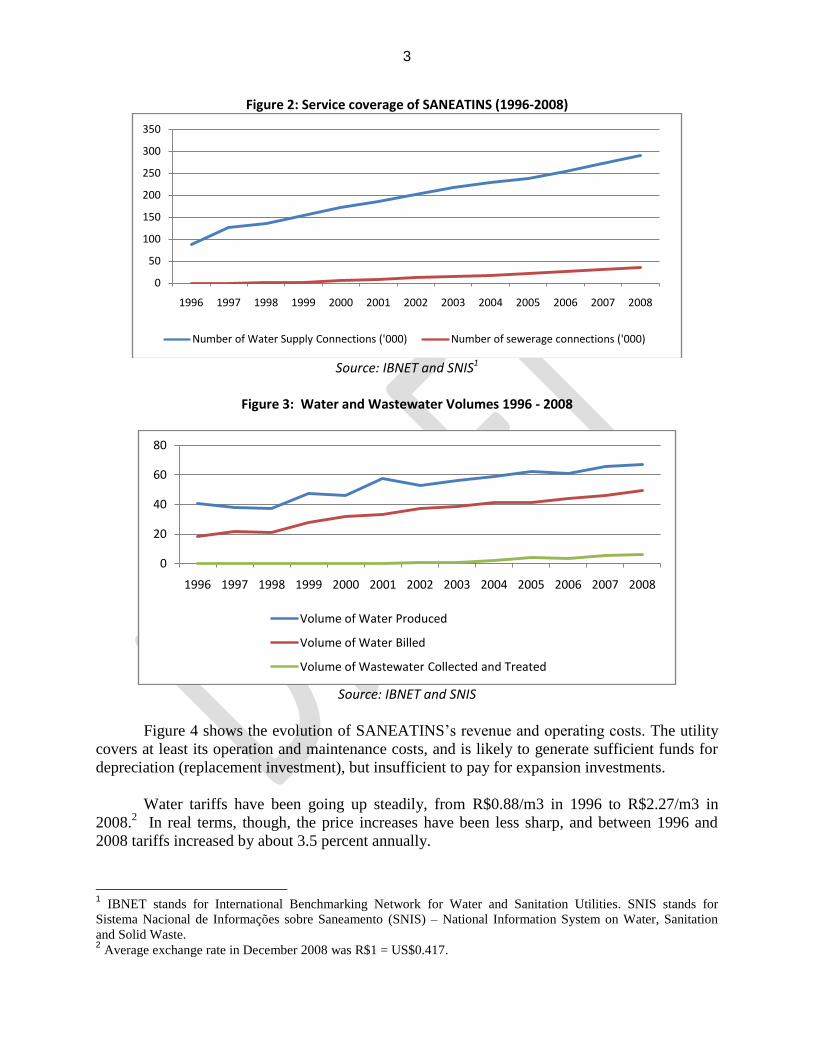
The expansion of the collection and treatment of wastewater has lagged far behind the
supply of treated water as SANEATINS only started to collect wastewater in 2002 (Figures 2
and 3). In 2008 less than 15 percent of the water sold is actually collected and the sewerage
network is significantly smaller than the length of the water supply network. However, all the
collected wastewater is treated in 16 wastewater treatment plants. SANEATINS appears to have
had problems reaching targets to expand the collection of wastewater. It was supposed to reach
60% of the urban population by 2007.
3
Figure 2: Service coverage of SANEATINS (1996-2008)
Source: IBNET and SNIS1
Figure 3: Water and Wastewater Volumes 1996 - 2008
Source: IBNET and SNIS
Figure 4 shows the evolution of SANEATINS’s revenue and operating costs. The utility
covers at least its operation and maintenance costs, and is likely to generate sufficient funds for
depreciation (replacement investment), but insufficient to pay for expansion investments.
Water tariffs have been going up steadily, from R$0.88/m3 in 1996 to R$2.27/m3 in
2008.2 In real terms, though, the price increases have been less sharp, and between 1996 and
2008 tariffs increased by about 3.5 percent annually.
1 IBNET stands for International Benchmarking Network for Water and Sanitation Utilities. SNIS stands for
Sistema Nacional de Informações sobre Saneamento (SNIS) – National Information System on Water, Sanitation
and Solid Waste. 2 Average exchange rate in December 2008 was R$1 = US$0.417.
0
50
100
150
200
250
300
350
1996 1997 1998 1999 2000 2001 2002 2003 2004 2005 2006 2007 2008
Number of Water Supply Connections ('000) Number of sewerage connections ('000)
0
20
40
60
80
1996 1997 1998 1999 2000 2001 2002 2003 2004 2005 2006 2007 2008
Volume of Water Produced
Volume of Water Billed
Volume of Wastewater Collected and Treated

4
Figure 4: Average water and wastewater tariffs, average O&M costs (in R$ per m3) and
Operating Cost Coverage Ratio (OCCR) 3
Source: IBNET and SNIS
Compared with its peer utilities, SANEATINS has significantly lower electricity intensity
for water supply, much lower NRW, and much lower wastewater collection (Table 2.1).
Table 1 SANEATINS Benchmarked Against Its Peers * Year = 2008 Unit SANEATINS Others*
Households with direct water connection % 75% 75%
Percentage of households with sewer connection % 9% 14%
Total annual water production per capita Liters/capita/day 185.80 250.75
Total annual water consumption per capita Liters/capita/day 137.69 132.01
Percentage of total connections metered % 96% 62%
Non-Revenue Water % 26% 46%
Wastewater collected million m3/year 6.45 32.62
Wastewater receiving primary treatment % 100% 97%
Average water tariff R$/m3 2.29 2.04
Average wastewater tariff R$/m3 2.12 2.03
Operating cost coverage % 1.24 1.18
Electricity use per m3 water (produced volume) kWh/m3 0.59 0.65
Electricity use per m3 wastewater (collection volume) kWh/m3 0.16 0.16
Share of electricity costs in total O&M costs % 14% 18%
Source: IBNET * Medium values calculated across utilities of similar size operating in the same region.
3 OCCR measures how far operating revenues cover O&M costs. The rule of thumb is that if the OCCP is below 1,
the utility would not be able to cover its O&M costs with its revenues. If the OCCR is between 1 and 2, the revenue
would be able to cover O&M, partial to full depreciation, and even capital costs as the margin increases. In reality
much depends on the actual capital costs and the types of depreciation for instance.
0.00
1.00
2.00
3.00
1996 1997 1998 1999 2000 2001 2002 2003 2004 2005 2006 2007 2008
OCCR O&M Cost per m3 Billed
Average Revenues per m3 Billed

5
Energy Consumption
SANEATINS purchases all of its electricity from the local electric utility, CELTINS.
SANEATINS has more than 660 points of consumption which are billed separately. Of these, 82
percent of the accounts are for water supply, 7 percent for wastewater and 11 percent for
administrative facilities. In terms of electricity tariff categories, 84 percent of accounts are for
low-voltage connections, 13 percent are medium voltage (A4: 2.3 to 25 kV) with the Green time
of day/seasonal tariff and 3 percent are the “conventional” medium voltage (A4: 2.3 to 25 kV)
tariff. The cost per kWh of electricity purchased at a low voltage is considerably higher than for
electricity purchased under either of the medium voltage options, as can be seen in Table 2.
Table 2: Energy consumption and cost in 2008 Type of Tariff Accounts Energy
Consumption in MWH
Energy Cost in R$
Energy cost R$/kWh
Medium voltage Conventional 20 4,834 1,847,005 0.38
Medium voltage Green 86 27,392 7,814,252 0.29
Low voltage 554 8,056 4,546,474 0.56
Total 660 40,282 14,207,730 0.35
Source: IBNET and SNIS
Table 3 shows the evolution of energy use and costs at SANEATINS for water supply
and wastewater treatment. Electricity has been a significant part of annual operating costs,
varying between 13 and 16 percent in recent years. Energy consumption for wastewater
collection and treatment is still less than 3 percent of that for the supply of treated water, due to
the relatively small coverage (hence a much smaller volume of water) and the much lower
coefficient of energy intensity.
Table 3: Energy use and costs of SANEATINS 2000 - 2008
Year Share of electricity cost in total O&M Costs
Total electricity costs in R$
Total annual electricity consumption for water supply
Total annual electricity consumption for sanitation
Average electricity tariff
2000 10% 4,038,708 NA NA NA
2001 8% 3,711,002 NA NA NA
2002 10% 5,671,408 NA NA NA
2003 13% 6,635,192 34,934 122 0.19
2004 10% 7,284,662 34,390 217 0.21
2005 13% 8,591,523 36,530 329 0.23
2006 16% 10,620,692 36,224 514 0.29
2007 13% 12,654,216 37,942 637 0.33
2008 14% 14,207,730 39,254 1,028 0.35
Source: IBNET and SNIS
6
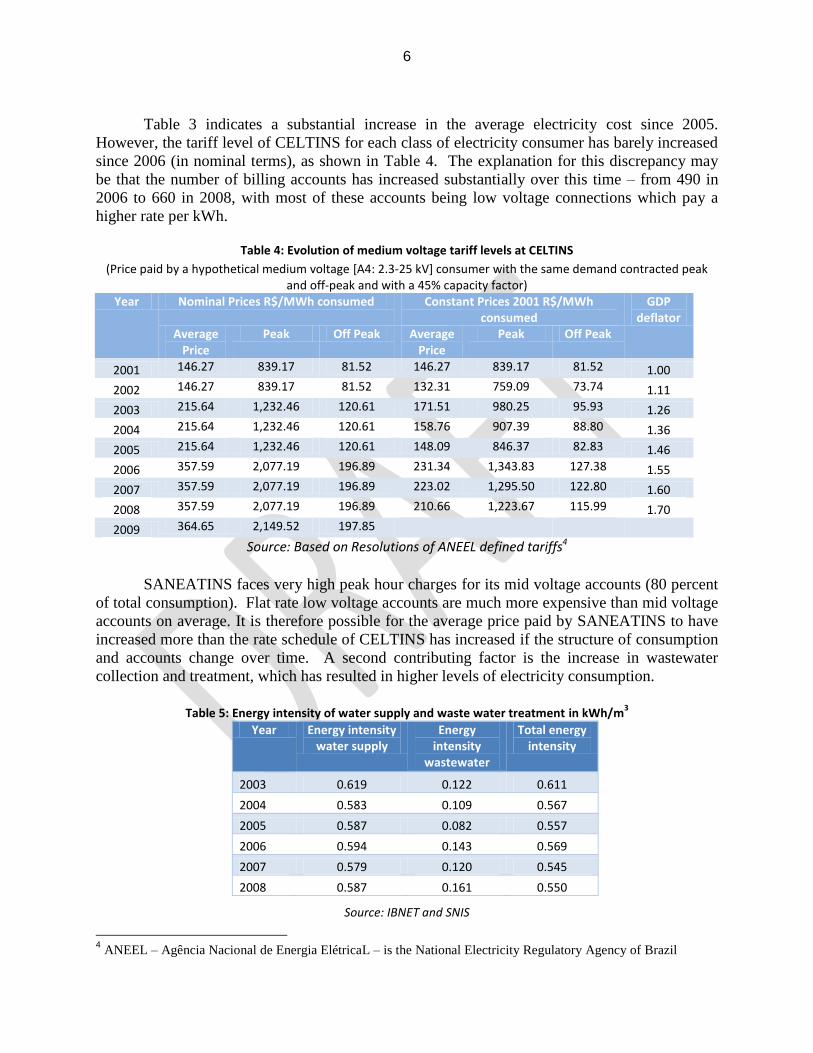
Table 3 indicates a substantial increase in the average electricity cost since 2005.
However, the tariff level of CELTINS for each class of electricity consumer has barely increased
since 2006 (in nominal terms), as shown in Table 4. The explanation for this discrepancy may
be that the number of billing accounts has increased substantially over this time – from 490 in
2006 to 660 in 2008, with most of these accounts being low voltage connections which pay a
higher rate per kWh.
Table 4: Evolution of medium voltage tariff levels at CELTINS
(Price paid by a hypothetical medium voltage [A4: 2.3-25 kV] consumer with the same demand contracted peak and off-peak and with a 45% capacity factor)
Year Nominal Prices R$/MWh consumed Constant Prices 2001 R$/MWh consumed
GDP deflator
Average Price
Peak Off Peak Average Price
Peak Off Peak
2001 146.27 839.17 81.52 146.27 839.17 81.52 1.00
2002 146.27 839.17 81.52 132.31 759.09 73.74 1.11
2003 215.64 1,232.46 120.61 171.51 980.25 95.93 1.26
2004 215.64 1,232.46 120.61 158.76 907.39 88.80 1.36
2005 215.64 1,232.46 120.61 148.09 846.37 82.83 1.46
2006 357.59 2,077.19 196.89 231.34 1,343.83 127.38 1.55
2007 357.59 2,077.19 196.89 223.02 1,295.50 122.80 1.60
2008 357.59 2,077.19 196.89 210.66 1,223.67 115.99 1.70
2009 364.65 2,149.52 197.85
Source: Based on Resolutions of ANEEL defined tariffs4
SANEATINS faces very high peak hour charges for its mid voltage accounts (80 percent
of total consumption). Flat rate low voltage accounts are much more expensive than mid voltage
accounts on average. It is therefore possible for the average price paid by SANEATINS to have
increased more than the rate schedule of CELTINS has increased if the structure of consumption
and accounts change over time. A second contributing factor is the increase in wastewater
collection and treatment, which has resulted in higher levels of electricity consumption.
Table 5: Energy intensity of water supply and waste water treatment in kWh/m
3
Year Energy intensity water supply
Energy intensity
wastewater
Total energy intensity
2003 0.619 0.122 0.611
2004 0.583 0.109 0.567
2005 0.587 0.082 0.557
2006 0.594 0.143 0.569
2007 0.579 0.120 0.545
2008 0.587 0.161 0.550
Source: IBNET and SNIS
4 ANEEL – Agência Nacional de Energia ElétricaL – is the National Electricity Regulatory Agency of Brazil
7
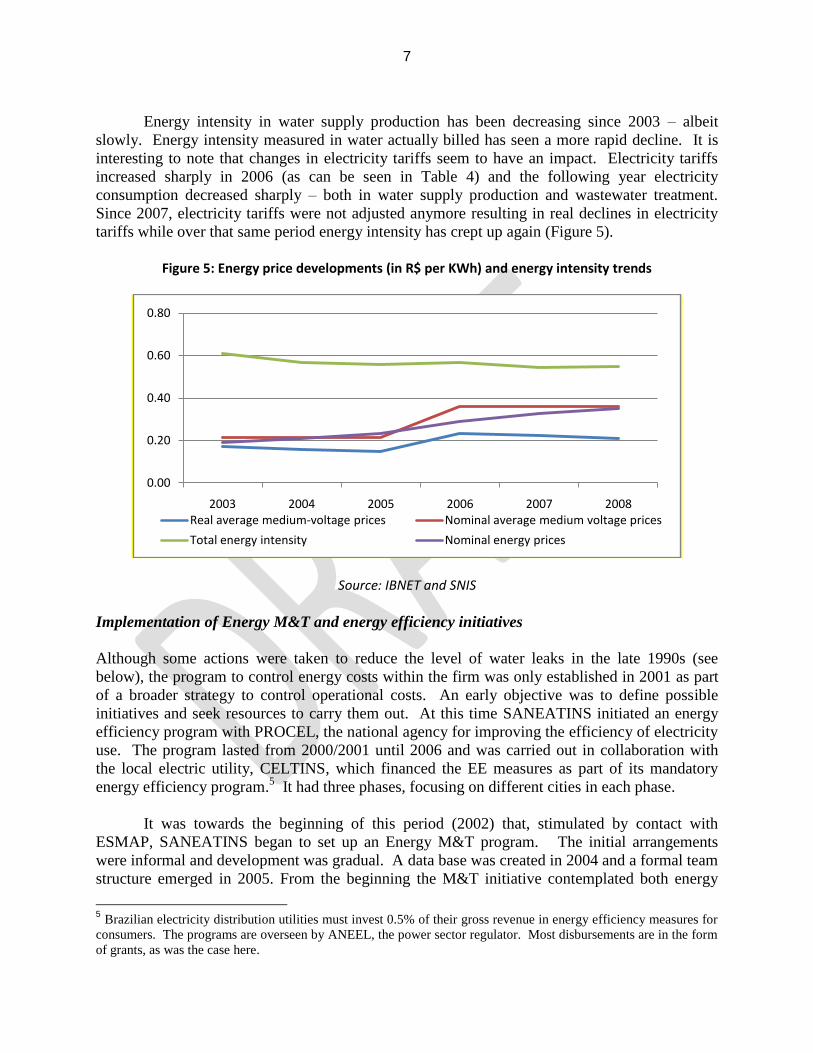
Energy intensity in water supply production has been decreasing since 2003 – albeit
slowly. Energy intensity measured in water actually billed has seen a more rapid decline. It is
interesting to note that changes in electricity tariffs seem to have an impact. Electricity tariffs
increased sharply in 2006 (as can be seen in Table 4) and the following year electricity
consumption decreased sharply – both in water supply production and wastewater treatment.
Since 2007, electricity tariffs were not adjusted anymore resulting in real declines in electricity
tariffs while over that same period energy intensity has crept up again (Figure 5).
Figure 5: Energy price developments (in R$ per KWh) and energy intensity trends
Source: IBNET and SNIS
Implementation of Energy M&T and energy efficiency initiatives
Although some actions were taken to reduce the level of water leaks in the late 1990s (see
below), the program to control energy costs within the firm was only established in 2001 as part
of a broader strategy to control operational costs. An early objective was to define possible
initiatives and seek resources to carry them out. At this time SANEATINS initiated an energy
efficiency program with PROCEL, the national agency for improving the efficiency of electricity
use. The program lasted from 2000/2001 until 2006 and was carried out in collaboration with
the local electric utility, CELTINS, which financed the EE measures as part of its mandatory
energy efficiency program.5 It had three phases, focusing on different cities in each phase.
It was towards the beginning of this period (2002) that, stimulated by contact with
ESMAP, SANEATINS began to set up an Energy M&T program. The initial arrangements
were informal and development was gradual. A data base was created in 2004 and a formal team
structure emerged in 2005. From the beginning the M&T initiative contemplated both energy
5 Brazilian electricity distribution utilities must invest 0.5% of their gross revenue in energy efficiency measures for
consumers. The programs are overseen by ANEEL, the power sector regulator. Most disbursements are in the form
of grants, as was the case here.
0.00
0.20
0.40
0.60
0.80
2003 2004 2005 2006 2007 2008Real average medium-voltage prices Nominal average medium voltage prices
Total energy intensity Nominal energy prices

8
optimization and water loss reduction measures, as evidenced by the composition and
attributions of the original team which included an electrical engineer (as sector manager), a
civil engineer responsible for initiatives to reduce NRW and a maintenance manager to oversee
the implementation of the different activities.
As part of the Energy M&T program, the utility prepared an implementation plan and a
communication strategy. Training was provided to operational staff. Subsequently, during the
implementation of the different energy efficiency projects, the utility produced an initial
diagnosis and situation, progress reports on development and final reports on results.
The level of commitment of senior management has been high from the beginning. Both
the President and Director of Operations participated in all the meetings setting up the M&T
program with ESMAP, although there is no written document regarding the establishment of the
energy management team. Various measures have been undertaken over time on the basis of the
team’s recommendations, that included (i) monthly review of energy bills in each operating unit;
(ii) accompaniment of installed loads, their capacity factors and other variables in each operating
unit; and (iii) review of the power factor (reactive energy).
The monitoring of electricity consumption has been mostly restricted to the use of the
electric distribution utility’s meters and analyzing the monthly electricity bills. Thus they only
accompany the total load in each operating unit, not specific energy consuming equipment.
SANEATINS has gradually accumulated three portable electricity meters (in 2001, 2004 and
2006) in order to carry out temporary parallel measurements when necessary. In contrast,
SANEATINS has invested in continuous measurement of water flows in the various networks.
From 2005 until now the number of macro-meters for water has been constantly increased.
Software tools have been acquired over time, as part of the overall process to collect and
analyze information in the utility and to achieve specific M&T objectives. The first integrated
software system was SIP/SAP (System for providing services and attending the public/Sistema
de Prestação de Serviços e Atendimento ao Público) which was acquired in 1997 and helped to
identify and control leaks in the water mains. Subsequently, in 2004, the utility began to receive
its electricity bills and information in electronic files from CELTINS and installed energy
management software to process this information and assist in analyzing strategies to reduce
costs. In addition, two more integrated systems were installed: SIGER (System for Management
Information / Sistema de Informações Gerenciais) to improve control of performance indicators;
and SIGOP (System for Operational Management / Sistema de Gestão Operacional) to improve
the control of operational indicators. Also in 2004, the company began to systematically
accompany and control maintenance measures and their costs. Based on these tools, the actions
taken to reduce energy costs have included:
peak load reduction - such as using timers to control the time of operation of some
pumps and building reservoir capacity to increase flexibility to shed load during peak
hours;
increasing the power factor by installing capacitors;
renegotiating contracts with the electric utility, using the analyses and software
described above.
9
The actions highlighted by SANEATINS which have been taken to specifically improve
the energy efficiency of water supply operations include:
Substituting existing pumps with better designed pumps having high efficiency
motors.
Installation of variable speed drives to control pressure in the distribution network.
Replace under-dimensioned pipelines.
Both pump and well rehabilitation and maintenance.
Unfortunately only scattered and illustrative information was available on the investments in
these different categories of measures or the physical parameters involved.
Another major area of action that has a direct bearing on energy consumption has been
the reduction of water losses. Although NRW has been a concern of the company since the
1990s, a new effort was organized in 2004. A pilot program was begun in Palmas (the capital) in
neighborhoods where losses varied between 30 and 60 percent of water production. The
following measures were implemented:
Identify and repair leaks;
Identify and stop theft of water;
Micrometer and connection structure for consumers
Substitution of old water meters
After an initial decline in water losses, subsequent monitoring showed a tendency for
losses to increase again and the need for a more careful cost/benefit analysis of the actions to be
taken. Thus SANEATINS started a smaller pilot project in late 2005 in a neighborhood with
losses of over 50 percent. The specific objectives were to: (i) identify which actions to reduce
losses in the distribution network bring the highest returns; (ii) analyze the viability of a new
technical standard for connection of households to the network, (iii) evaluate the results obtained
by substituting old water meters – in both physical and financial terms, and (iv) analyze the
effect of pressure on leaks throughout the network in that neighborhood. Apart from the
technical actions described above, this second pilot also systematically re-registered all
connections, while closely monitoring results. Within a few months the second program
achieved more enduring results, with a reduction of losses to about 30 percent. The company has
since expanded this program to other neighborhoods.
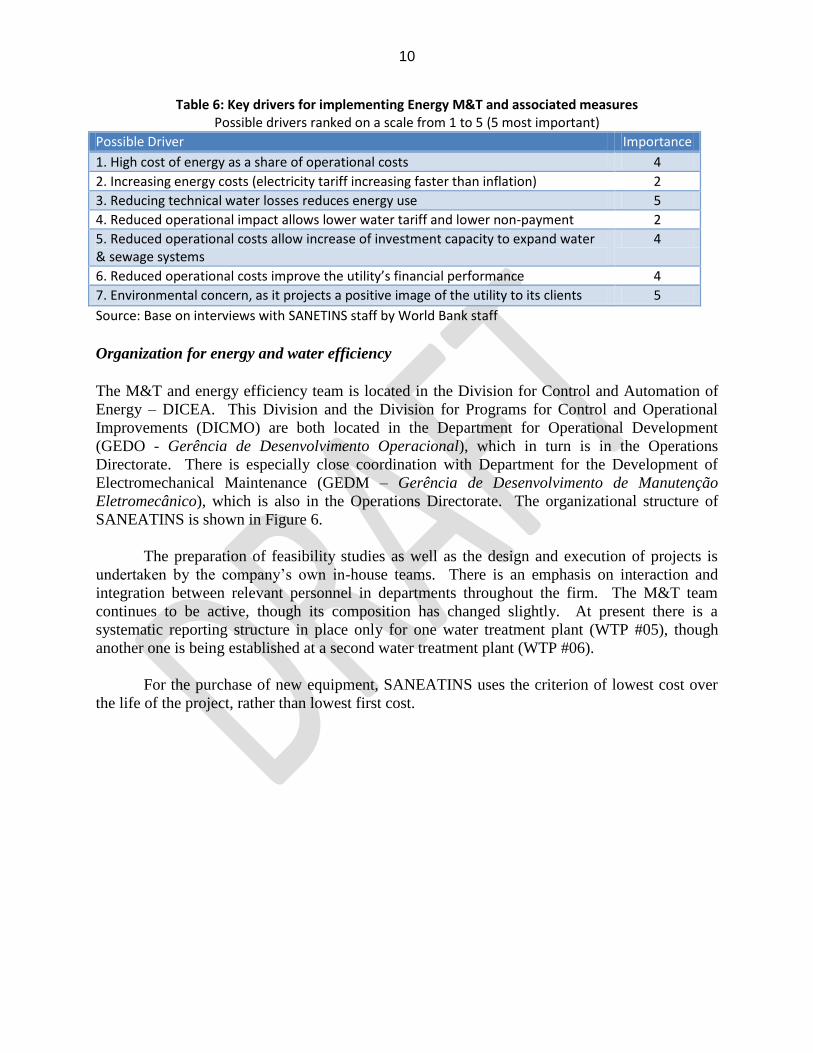
Motivations for undertaking Energy M&T and associated energy optimizations
The key motivations for undertaking the M&T program and associated energy optimization and
water loss reduction measures, were to reduce technical water losses and environmental
concerns, whereas the high share of energy in total operational costs and the consequences on the
financial viability of the utility also played an important role as summarized in Table 6
The regulatory environment ensures that the utility can retain the benefits from any
reduction in the operational costs. This means that this provides the utility with an incentive to
undertake energy and other efficiency programs as the efficiency gains translate into increased
resources for replacement or expansion investment or into an improved financial performance of
the utility.
10
Table 6: Key drivers for implementing Energy M&T and associated measures Possible drivers ranked on a scale from 1 to 5 (5 most important)
Possible Driver Importance
1. High cost of energy as a share of operational costs 4
2. Increasing energy costs (electricity tariff increasing faster than inflation) 2
3. Reducing technical water losses reduces energy use 5
4. Reduced operational impact allows lower water tariff and lower non-payment 2
5. Reduced operational costs allow increase of investment capacity to expand water & sewage systems
4
6. Reduced operational costs improve the utility’s financial performance 4
7. Environmental concern, as it projects a positive image of the utility to its clients 5
Source: Base on interviews with SANETINS staff by World Bank staff
Organization for energy and water efficiency
The M&T and energy efficiency team is located in the Division for Control and Automation of
Energy – DICEA. This Division and the Division for Programs for Control and Operational
Improvements (DICMO) are both located in the Department for Operational Development
(GEDO - Gerência de Desenvolvimento Operacional), which in turn is in the Operations
Directorate. There is especially close coordination with Department for the Development of
Electromechanical Maintenance (GEDM – Gerência de Desenvolvimento de Manutenção
Eletromecânico), which is also in the Operations Directorate. The organizational structure of
SANEATINS is shown in Figure 6.
The preparation of feasibility studies as well as the design and execution of projects is
undertaken by the company’s own in-house teams. There is an emphasis on interaction and
integration between relevant personnel in departments throughout the firm. The M&T team
continues to be active, though its composition has changed slightly. At present there is a
systematic reporting structure in place only for one water treatment plant (WTP #05), though
another one is being established at a second water treatment plant (WTP #06).
For the purchase of new equipment, SANEATINS uses the criterion of lowest cost over
the life of the project, rather than lowest first cost.

11
Figure 6: Organogram of SANEATINS – Overall
Expenditure on Energy and Water Efficiency Activities
Since 2001 SANEATINS has embarked on regular monitoring and control of energy
consumption and costs and has implemented measures to address inefficiencies. Yet, it was not
possible to identify all the investments for energy efficiency that were undertaken from 2001
onwards. Complete cost information is available for 2009 only. In 2009, overall expenditures
on energy management and control and energy efficiency reached R$ 3 million, with investments
accounting for two thirds of the total (Table 7). Investments included RS$ 1.1 million allocated
to construction of reservoirs to avoid pumping during peak hours; R$ 600,000 spent on
CONSELHO
ADMINISTRATIVO
PRESIDÊNCIA
DIRETORIA
ADMINISTRATIVA
FINACEIRA
DIRETORIA DE
PLANEJAMENTO
DIRETORIA
TÉCNICA
DIRETORIA DE
OPERAÇÕES
ASSESSORIA JURÍDICA
AUDITORIA
ASSESSORIA DE GESTÃO
E CONTROLE
ASSESSORIA DE COMUNICAÇÃO
CONSELHO
FISCAL
Diretoria de
Operações
PÓLO
PALMAS
DISTRITOS
SUPERVISOR
SUL
PÓLOS
DISTRITOS
SUPERVISOR
NORTE
PÓLOS
DISTRITOS
GEDO
DICEA
DICMO
GEDM
DICME
DIMRE
GEDQ
DICPA
DICPE
GEDEC
DIDEM
DIREC
DIGER

12
equipment, computers and software for energy data collection and analysis and automated
operational control; and RS$ 150,000 spent on tools and technologies leading to more energy
efficient water pumping operations. Maintenance of high efficiency motors, pumps, power
transformers and water wells, account for the remaining R$ 1 million.
Table 7: SANEATINS overall expenditures on energy management and control and energy efficiency (2009; R$)
Energy Efficiency Investment and Maintenance Program R$ 2009
Investments
Bank of capacitors (for power factor correction) 9,212
Radio communications for remote controls 55,859
Variable speed drives 46,994
Timers 9,864
Electric level controllers 6,728
High efficiency motors 76,928
Construction of reservoirs for water storage (2,300m³) 1,136,000
Energy control and management software 155,861
Computers, notebooks and new servers 382,536
Environmental education campaign 53,525
Sub-total 1,933,508
Maintenance
High efficiency motors 80,052
Motor-pumps set (submersible and submerse) 706,382
Power transformers 16,348
Water wells 203,754
Sub-total 1,006,536
TOTAL 2,940,044
Source: SANETINS
Among these measures, the construction of reservoirs and the installation of a bank of
capacitors helped save energy costs but did not reduce energy consumption or improve energy
efficiency. Overall, expenditures strictly related to energy efficiency improvements amounted to
R$1.7 million in 2009, of which close to 60 percent was related to maintenance.
Financing for energy efficiency and NRW investments
Almost all measures were financed from the internal cash flow of the utility. Some energy
efficiency measures between 2001 and 2006 were financed by the local electric utility CELTINS
under its mandatory demand side management program. There is limited availability of resources
for energy efficiency and water loss reduction measures. Such investments must compete with
SANEATINS’ overall priority to expand wastewater collection and treatment as fast as possible.
However, there is a commitment to invest in efficiency since it reduces operational costs.
Depending on the project, the company can approve implementation of projects with simple
payback periods of up to five years.

13
Impacts of the Energy M&T and energy efficiency programs
The energy and water efficiency programs undertaken by SANETINS are analyzed for their
impact on the energy intensity coefficients of the utility for water supply and wastewater
treatment. A first rapid analysis is to determine what happened since 2003, the first year on
which energy consumption data are available, making a before and after analysis assuming that
the trends of 2003 would have continued. Table 8 shows the impact of energy efficiency
measures over the period 2003 to 2008 (as for earlier years no data is available about the actual
energy consumption).
Table 8: Estimation of Energy Efficiency Impacts expressed in percentage increase between 2003 and 2008
Energy Efficiency Impacts
Total Nominal Energy Cost Increase
Price Effect o Effect of Nominal Price Increases (assuming medium o Effect of Change in Electricity Tariff Structure
66 12
114 86
Volume Effect o Net Production volume increase o Gross Production volume increase o Decline in NRW o Energy Intensity Improvements
28 37 -7
-10
19
Price Effects. A large part of the increase in energy costs was the result of price effects. A
nominal electricity price increase was effectuated in 2006 of 66 percent (assuming that this price
increase was similar along all different electricity tariffs since there were only data on medium
voltage tariffs), this means that the overall energy prices increased by 86 percent, the remainder
of the effect was caused by a change in the electricity tariff structure. Apart from 2006, in every
other year, the average electricity tariff paid increased more than the nominal tariff, suggesting a
change in the structure of the electricity rates that adds to the overall energy costs.
As can be seen in Table 9, electricity cost increased more than the nominal rates would
apply, costing the utility about R$700,000 per year. Only in 2006, when the nominal electricity
tariffs increased significantly was SANEATINS capable of achieving energy cost savings.
Table 9: Estimation of Energy Efficiency Impacts
Year Actual Energy Costs Energy Cost without changes in tariff
structure
Actual Energy Cost Savings (plus = cost
savings)
2003 6,635,192 6,635,192 0
2004 7,284,662 6,550,208 -734,454
2005 8,591,523 6,976,453 -1,615,070
2006 10,620,692 11,542,895 922,203
2007 12,654,216 12,121,328 -532,888
2008 14,207,730 12,656,402 -1,551,328

14
Total Additional Costs
-3,511,538
Annual Additional Costs
-702,308
Source: IBNET and SNIS
Volume or Consumption Effect. At the same time, a volume or consumption effect can be
estimated. Apart from changes in the energy prices, changes in energy consumption or volumes
can also be observed. These volumes are affected by two factors: water production (and
wastewater collection and treatment) and energy intensity (energy use per cubic meter of water
produced (and wastewater collected and treated).
Because of decreases in NRW, less water needs to be produced. The NRW effect
resulted in a decline of energy use of 7 percent6. It should be noted that this is a hypothetical
benefit in the sense that it is assumed what would have happened in the case the trends of 2003
would have continued. It is quite likely that in the case of SANEATINS, which still is
expanding its water supply and wastewater services, any decline in NRW would have allowed
SANEATINS to expand water supply without increasing water production, with overall energy
consumption remaining unchanged.
The other effect is the decline in the energy intensity as measured by energy consumption
per cubic meter of water produced or wastewater treated. Energy intensity declined by 10
percent over the period between 2003 and 2008.
Obviously, this consumption effect can be translated in energy consumption saved. As
can be seen in Table 10, the overall consumption savings have been large. They amount to
annual savings of about more than 5 GWh. Assuming the current nominal energy tariffs, these
savings translate to average annual savings of R$ 1.5 million.
Table 10: Energy Savings in MWh and in cost savings (in R$)
Year Energy Savings in MWh Energy Cost Savings
Decline in NRW
Decline in Energy
Intensity
Total Decline in NRW
Decline in Energy
Intensity
Total
2003 0 0 0 0 0 0
2004 608 2,648 3,256 128,021 557,318 685,339
2005 -1,181 3,571 2,390 -275,275 832,472 557,197
2006 1,855 2,715 4,570 536,314 784,964 1,321,278
2007 1,157 4,649 5,805 379,358 1,524,775 1,904,132
2008 3,147 4,448 7,595 1,109,815 1,568,835 2,678,649
Total Savings 5,585 18,031 23,616 1,878,233 5,268,364 7,146,597
Annual Savings 1,117 3,606 4,723 375,647 1,053,673 1,429,319 Source: IBNET and SNIS
6 This decrease looks relatively limited, but that is because most of the decrease in non-revenue water took place
before 2003. In 1996, SANEATINS had a NRW index of 54 percent which declined to 31 percent in 2003 and decreased to 26 percent in 2008.
15
Most of the savings are related to declines in energy intensity. Improvements in NRW
can also have big impacts, but bringing down NRW has often turned out to be difficult – because
the changes are not always sustainable. In fact, SANEATINS noticed that the effect of its NRW
program was eroding (NRW was actually inching up again between 2004 and 2005)7. As a
result a new NRW pilot was started in 2005 (as detailed on page 9).
Conclusions and Lessons learned
Serving a large number of cities in a sparsely populated state SANEATINS has unique
challenges in providing efficient water and wastewater services. The utility has strived to
increase water supply coverage. But wastewater collection rate still lags far behind the more
urbanized and more densely populated states in the southern part of Brazil.
Compared with its peers in the same region, SANETINS stands out as a significantly
more efficient operator, using 10 percent less energy for water production and with 40 percent
lower non revenue water. But its wastewater collection rate is 30 percent lower.
Electricity is a significant part of SANEATINS’ operational cost, accounting for 13 to 16
percent of the total operational cost in recent years. There was a major (over 50%) increase of
electricity tariffs in 2006. But the company seemed to have managed it well.
SANEATINS has maintained an active program in energy and water efficiency since the
early 2000s and has managed to reduce the electricity intensity of its operations and sustain the
gains achieved. The company also has had a more organized approach toward energy
management with a core team embedded in the Operations Directorate, compared with the other
two utilities in this case study series. The key lessons from SANEATINS’ efforts in energy and
water efficiency include:
1. Creating a designated management team responsible for energy and water efficiency
programs is likely to be critical for an expansive WSU like SANEATINS. This requires
commitment of corporate management.
2. Sustaining energy efficiency programs depends on the involvement of all levels of the
firm, from top management to operational teams. The interaction between maintenance
and production teams is especially important. Last but not the least, the WSU can see
and receive immediate financial returns on expenditures for energy and water efficiency
activities. It is a testimony that SANEATINS has used mostly its own equity to support
these activities.
3. Acquiring capability for monitoring operations and capacity for analyzing monitoring
data and information is critical for effective management of energy use and non revenue
water reduction.
7 There could be multiple reasons for a rebound in NRW, including new and undetected leakages.

16
4. Non-revenue water programs can have a large impact on energy efficiency and hence
energy cost savings, but these programs require careful design, implementation and
continuous follow-up. It is a continuous learning process. SANEATINS staff indicated
that they were to start over again, they would use different solutions and materials to
reduce water losses than they originally employed. They also state that the outsourcing
of projects to ESCOs would be an interesting alternative to the in-house approach used
until now to develop projects.
This case study was prepared by Alan D. Pool, Caroline Van Den Berg, and Feng Liu, with contributions from
Elvira Morella and Pedro Paulo da Silva Filho.