sanitary and phytosanitary measures: the case of … bakshi thesis submitted to the faculty of the...
TRANSCRIPT

Sanitary and Phytosanitary Measures: The Case of Mexican Avocados
Nishita Bakshi
Thesis submitted to the faculty of the
Virginia Polytechnic Institute and State University
In partial fulfillment of the requirements for the degree of
Master of Science
In Agriculture and Applied Economics
David Orden, Co-chairperson
Everett Peterson, Co-chairperson
Michael Hilmer
17 July 2003
Blacksburg, Virginia
Keywords: Sanitary and Phytosanitary issues, avocados, partial equilibrium trade model
Copyright 2003, Nishita Bakshi

Sanitary and Phytosanitary Measures: The Case of Mexican Avocados
Nishita Bakshi
(Abstract)
This thesis examines the effects on demand, supply, imports, and prices of partial
easing of sanitary and phytosanitary (SPS) barriers to trade in the U.S. market in the case
of Mexican avocados. The SPS Agreement plays a role in the avocado market studied
here through its implications for negotiations between countries that have not utilized the
formal channels of the WTO for resolving disputes.
A quarantine in place from 1914 until very recently banned entry of Mexican
avocados into the U.S. market on grounds of risk of pest infestation. Since the early
1970s this quarantine has been a cause of dispute between the Mexican and U.S.
governments, resulting in elaborate evaluations of possible pest risks and risk mitigation
procedures that might be carried out.
However, after the initiation of negotiations for the North American Free Trade
Agreement (NAFTA) in 1991, the import ban was partially eased in 1995 allowing
Mexico access to the Northeastern part of the U.S. during four winter months. After three
years of successfully exporting without any pest outbreaks, Mexico requested increased
access to an additional part of the U.S. market, which it was granted in 2001. This study
develops a partial equilibrium trade model to investigate the effects that this increased
access will have on the avocados markets. Hypothesized further increases in access are
described, and their potential effects are evaluated as well.

iii
Acknowledgements
I would like to express my sincere and heartfelt gratitude to my advisor, Professor
David Orden for his insightful guidance and invaluable patience, support and
encouragement during the entire course of this study. Working with him has been an
enriching and holistic learning experience for me and I wholeheartedly appreciate
the time, energy and diligent efforts he has put in with me in developing this thesis and
also his faith in my abilities.
Sincere thanks also go to Dr. Everett Peterson, my co-chairperson for his help
with the empirical work in this thesis. Without his guidance this thesis could not have
been completed. I would also like to thank Dr. Michael Hilmer for his support as my
committee member.
I would also like to thank my parents for their unconditional love and support
through successes and failures and in all my accomplishments ever. My husband, Aman
Walia has been a constant source of encouragement, love, understanding and patience
especially over long distances.
And off course Dot Wnorowski, for all her help with the word processor. I would
have been lost without her to sort out my formatting problems.

iv
Table of Contents Page
List of Tables ………………………………………………………………………….…vi
List of Figures ………………………………………………………………………..…viii
Acronyms ……………………………………………………………………………..….ix
Chapter 1: Introduction ………………………………………………………...…………1
1.1 Avocados .…………………………………………………………………………….1
1.2 Problem Statement ……………………………………………………………………2
1.3 Objectives and Methodology …..……………………………………………………..3
1.4 Conclusions of the study ……………..……………………………………………….4
Chapter 2: The U.S. Avocado market …………………………………………………….5
2.1 Introduction ……………………………….…………………………………………..5
2.2 SPS Agreement ……………………………………………………………………….5
2.2.1 Legal Aspects of WTO SPS Agreement ……….…………………………………5
2.2.2 Implications of the SPS Agreement ………….………………………………....10
2.3 The U.S. Avocado Market …………………………………………………………..11
2.3.1 Domestic Production of Avocados and the Industry ………..………………..11
2.3.2 Avocado Consumption ………….………………………………………………..13
2.3.3 Avocado Trade ……………………………………………………………………14
2.3.4 Chilean Avocados ………………………………………………………… ……..16
2.3.5 New Zealand Avocados ………………………………………..………………...18
2.4 The Special Case of Mexico .………………………………………………………..19
2.4.1 The U.S. Mexico Avocado Dispute ……………………………………………..19
2.4.2 NAFTA and Developments Leading to Approval of Imports ………………..20
2.4.3 Market Developments since the 1997 Import Rule……………………………25
2.4.4. Mexican Request in 2001 for Additional Market Access ……………………27
2.5 Economic Assessment Studies ………………………………………………………28
2.5.1 Economic Evaluation Studies by USDA prior to Imports……..….………….28
2.5.2 Economic Evaluation with Risk Assessment ………..…………………………30
2.5.3 Economic Evaluation Studies by USDA for Expansion of Imports ………...33

v
2.6 Summary and Conclusions ……….………………………………………………………...36
Chapter 3: Empirical Analysis using a Partial Equilibrium Trade Model ……………....37
3.1 Model Description …………………………………………………………………..37
3.1.1 Data………………………………….……………………………………………...37
3.1.2 Calibration ………………………………………………………………………...39
3.1.3 Base Model ………….…………………………………………………………….40
3.2 Experiments …………………………………………………………………………43
3.2.1 Increased Geographical Access to Mexico …………..………………………..43
3.2.2 Increased Seasonal Access to Mexico ………………..………………………..47
3.3 Sensitivity Analysis …………………………………………………………………53
Chapter 4: Discussion and Conclusions …………………………………………………57
4.1 Summary of Results …………………………………………………………………58
4.1.1 Comparisons with Other Economic Analysis Studies ………………………..59
4.1.2 Comparisons of Results with Current Data …………………………………...59
4.2 Further Policy Changes and Research ………………………………………………61
References ………………………………………………………………………………63
Appendix ………………………………………………………………………………..67
Vita ……………………………………………………………………………………...69

vi
List of Tables
Table 2.1: California Avocado Acreage, Production and Grower Prices, 1989-1990
to 2000-2001 …………………………………………………...……….…...12 Table 2.2: U.S. Domestic Production and Imports of Avocados, 1990-2001 ………….15 Table 2.3: Current and Projected Hass Avocado Production, 2001 and 2006:
Mexico, Chile, New Zealand and U.S…………………………….…..……...16 Table 2.4: Chilean Avocados Acreage, Production, Exports, and Import
Price, 1973-2001 ……………………………………………..………....……17 Table 2.5: New Zealand Avocado Exports and Import Price in U.S. Markets, 1995-2001 …………………………………....………………………………19 Table 2.6: Regional Shipments of Californian Hass Avocados Before and After Imports from Mexico, 1986-1994 Average Versus 1999-2000 Season …..…26 Table 2.7: Mexican Hass Avocados Exports to U.S. Markets, 1997-2001 ……………..27 Table 3.1: Benchmark Data, Averages of 1997-1998 to 1999-2000 ……………………38 Table 3.2: Calculated Demand Elasticities for the U.S. Demand Regions ……………...40 Table 3.3: Simulated Supply and Price Results for Increased Access to U.S. West Central Region………………………………………………………………..44 Table 3.4: Simulated Supply and Price Results for Increased Access to U.S. West Central and Southwest Regions….…………….………………………...……46 Table 3.5: Simulated Supply and Price Results for Increased Seasonal Access to U.S. Northeast Region ………………..……………………………………...49 Table 3.6: Simulated Supply and Price Results for Increased Seasonal and Geographical Access (West Central Region added)…..…….………………..50 Table 3.7: Simulated Supply and Price Results for Increased Seasonal and Geographical Access (West Central and Southwest Regions added)…...…....52 Table 3.8: Sensitivity Analysis Results for Increased Access to U.S. West Central Region ………………………………………………………………………..54
Table 3.9: Sensitivity Analysis Results for Increased Access to U.S. West Central

vii
and Southwest Regions ...…………………………………………………….54 Table 3.10: Sensitivity Analysis Results for Increased Seasonal and Geographical Access (West Central Region added) .……………………………………...55 Table 3.11: Sensitivity Analysis Results for Increased Seasonal and Geographical Access (West Central and Southwest Regions added)……………………...56 Table 4.1: Current data for U.S. Avocado production and Imports …………………….60

viii
List of Figures
Figure 2.1: Definition of SPS Measures …………………………………………………8
Figure 2.2: U.S. Domestic Production and Imports of Avocados in million dollars,
1990-2001 ………………………………………………………..…..……...15
Figure 2.3: Seasonality of Avocados: Intensity of Supply to the U.S. Market …….……16
Figure 2.4: Quantity of Imports from Chile and Import Prices, 1990-2001 …………….18
Figure 2.5: Systems Approach to Pest Risk Management for Mexican Avocados..…….24
Figure 2.6: Price of Imported and Domestic Avocados, 1997-2001 ..…...……………...27

ix
Acronyms
APHIS Animal and Plant Health Inspection Service
CAC California Avocado Commission
EC European Community
GATT General Agreement on Trade and Tariffs
NAFTA North American Free Trade Agreement
N.Z. New Zealand
SPS Sanitary and Phytosanitary
U.S. United States
USDA United States Department of Agriculture
WTO World Trade Organization

1
Chapter 1: Introduction
1 .1 Avocados
The Avocado industry in the United States is an important one, especially for the
state of California as the annual sales revenue from this highly nutritious fruit are among
the top ten Californian fruit and nut crops (Carman and Craft, 1998). Avocado is an
ancient fruit and archaeologists have reportedly discovered avocado seeds buried along
with mummies in Peru dating back to as far as 750 B.C. According to a legend, a Mayan
princess in Mexico first ate avocado around 291 B.C (CAC, 2002).
European sailors have also used avocados as the “midshipman’s butter,” a spread
of mashed avocados as part of their rations. Early Americans coined the term alligator
pear for avocados, which was easier to pronounce than the Spanish name of “aguacate.”
The term avocado was first used by Henry Sloane in 1669. The Hass avocado in
particular was named after a postman called Rudolf Hass who discovered this tree in his
backyard in La Habra, California (CAC, 2002).
Recent University of California, Los Angeles research findings show that
California avocados have nearly twice as much Vitamin E as previously reported.
Avocados are now the highest fruit source of this powerful antioxidant, known to slow
the aging process and protect against heart disease and common forms of cancer by
neutralizing cell damage-causing free radicals (CAC, 2002).
The domestic production of avocados was 362.6 million pounds in 1999-2000,
valued at $391.9 million, and of these approximately 288.9 million pounds were Hass
avocados. Average U.S. consumption is around 425 million pounds per year. The U.S.
exports of avocados are negligible at 5.5 million pounds in 2000 as compared to 173
million pounds of imported fresh avocados. The U.S. is thus a net importer of avocados.
The major suppliers of Hass avocados to the U.S. and their shares of total imports in
2000-2001 are Chile (63.1 percent), Mexico (16.9 percent), and New Zealand (5.6
percent) (USDA, 2001). Imports occur throughout the year but mainly during September
to December. During these months, only 9 percent of the U.S. supply of avocados is from
domestic sources, while about 75 percent of annual imports are received during this
period.

2
1.2 Problem Statement
This thesis examines the effects on demand, supply, imports, and prices of partial
easing of sanitary and phytosanitary (SPS) barriers to trade in the U.S. market in the case
of Mexican avocados. Historically, tariffs have been the most important barriers to trade
while also serving as protectionist devices for domestic industries (Schuh, 2000). The
Uruguay Round of the General Agreement on Trade and Tariffs / World trade
Organization (GATT/WTO) negotiations concluded in 1994 led to a commitment by
member countries to decrease tariff rates in agriculture. As the protectionist tariff barriers
to trade are reduced, non-tariff barriers gain importance. One form of these non-tariff
barriers is SPS regulations on trade (Schuh, 2000).
The SPS issues in international trade are mainly managed under the Agreement on
Sanitary and Phytosanitary Measures (the “SPS Agreement”), negotiated in the Uruguay
Round of the GATT and administered by the WTO. The SPS Agreement lays out a
framework for countries to base their SPS measures upon. It is based on the idea that a
risk assessment must demonstrate the impact of an SPS measure, and stipulates that a
country’s regulations should be based on such studies (Caswell, 2000).
The SPS Agreement plays a role in the avocado market studied in this thesis
through its implications for negotiations between countries that have not utilized the
formal channels of the WTO for resolving disputes. The Mexican avocados case is an
example of a successfully negotiated removal of non-tariff SPS barriers though it was
never brought into the WTO dispute settlement process. Yet the negotiated outcome
adheres to the provisions of the WTO SPS Agreement, which makes this Agreement all
the more important in the international context.
A quarantine in place from 1914 until very recently, banned entry of Mexican
avocados into the U.S. market on grounds of risk of pest infestation. Since the early
1970s this quarantine has been a cause of dispute between the Mexican and U.S.
governments, resulting in elaborate evaluations of possible pest risk and risk mitigation
procedures being carried out. Although the Animal and Plant Health Inspection Service
(APHIS) of the U.S. Department of Agriculture (USDA) was convinced in the 1970s that
technical procedures could be developed and achieved for importation of Mexican Hass

3
avocados into the Northeastern part of the country with negligible risk of pest infestation,
the ban was not reversed due to pressure from the Californian industry. The domestic
avocado industry, with nearly a billion dollar investment in avocado crop acreage stood
to gain under the quarantine because of a favorable price differential between the
domestic and the imported avocados.
Since the initiation of negotiations for the North American Free Trade Agreement
(NAFTA) in 1991, and after further negotiations, long investigations, and despite
industry pressure, the import ban was partially eased in 1995 allowing Mexico access to
the Northeastern part of the country during four winter months. There were no outbreaks
of pest infestations in the following three seasons and Mexico as a result requested
increased access to the U.S. markets, which it was granted in 2001. This study
investigates the effects that this increased access will have on the avocados markets.
Hypothesized further increases in access are described, and their potential effects are
evaluated as well.
1.3 Objectives and Methodology
The objective of this study is to use a partial equilibrium model of the U.S.
avocado market to capture the impacts of a partial easing of the ban against Mexican
imports on domestic supply, consumption, the quantity of imports from alternative
suppliers, and prices. Various scenarios are analyzed with partial easing of the quarantine
ban on Mexican Hass avocados. The model measures the empirical magnitudes of the
effects on price, quantities of imports, consumption, and domestic production as a result
of changes in the technical barrier against imports of avocados from Mexico, in the case
where there is no pest infestation.
The major exporters of Hass avocados to the U.S. market are Chile, Mexico, and
New Zealand and the model analyzes the effects of the entry of Mexican avocados in the
Northeastern part of the country on the status of imports from these other countries as
well as on the domestic supply from California. Other possible scenarios where the
Mexican geographical access and/or seasonal access to the U.S. market are increased are
also studied.

4
1.4 Conclusions of the Study
The model developed in this study simulates the domestic production and
avocado imports into the U.S. With increased geographical and seasonal access granted
to Mexico, imports of Hass avocados from Mexico increase in the approved season and
states. Domestic supply and that from Chile and New Zealand to the approved states
decreases during this period but increases to the other states. The price of Mexican
avocados rises while that of the U.S. avocados and those from Chile and New Zealand
fall in comparison. Overall consumption of avocados in the U.S. increases while total
supply of U.S., Chilean and New Zealand avocados fall or these are displaced by
Mexican avocados.
This study thus provides a positive case for further trade liberalization by opening
up the U.S. market for imports from Mexico as long as the pest risks remain negligible.
Trade expansion occurs as a result of partial easing of the ban and further trade
liberalization would increase it.

5
Chapter 2: The U.S. Avocado Market
2.1 Introduction
The SPS Agreement, which came into effect along with the creation of the World
Trade Organization in January 1, 1995, lays out basic rules for food safety and human,
animal, and plant health standards. Under this Agreement, countries have the sovereign
right to decide upon their own risk standards as long as these are based on scientific risk
assessment studies and there is no discrimination between countries adhering to the same
set of standards.
SPS measures are of various types and might require products to come from
disease-free regions, be inspected, treated or processed specifically, or set permissible
maximum levels of pesticide residues or permitted use of certain additives in foods.
Health and safety standards usually apply to domestically produced as well as imported
food products, but SPS measures may result in restrictions on trade. Some of these
restrictions might be necessary in order to ensure food safety and animal and plant health
protection. At times though, governments are pressured by domestic industry for
protection from economic competition, and SPS restrictions may be used unjustifiably in
such cases. These restrictions can lead to protectionism when not fully required for health
and safety reasons and create unnecessary barriers to trade (WTO, 1994).
2.2 Agreement on SPS Measures
The SPS Agreement primarily seeks to ensure that countries do not misuse their
sovereign rights to decide their own level of health protection and food safety standards
to create unnecessary barriers to international trade (WTO, 1994).
2.2.1 Legal Aspects of the SPS Agreement
The SPS measures as defined by the SPS Agreement are given in Figure 1. The
Agreement basically allows for:
a) Basic rights and obligations: The Agreement grants countries the right to adopt
their own measures as deemed necessary for the protection of human, animal and
plant life and health as long as the measures adhere to the provisions of the

6
Agreement and are applied to the appropriate level backed by science and do not
discriminate between their own territories and other members [Article 2]
b) Harmonization: The Agreement seeks to bring about conformity in the adoption
of standards by countries by basing them on international standards. Countries can
adopt standards more stringent than these international standards provided they
are based on some scientific assessment, rules for which are laid down in Article
5 [Article 3]
c) Equivalence: Member countries shall recognize the standards adopted by other
countries as equivalent to their own provided it meets their requirements. Based
on this recognition, countries can enter into bilateral or multilateral agreements or
negotiations for the same [Article 4]
d) Assessment of Risk and Determination of the Appropriate Level of Sanitary and
Phytosanitary Protection: A Member country can deem the ‘appropriate’ level for
establishing an SPS measure within its territory [Annex A]. Members need to
assure that their standards are based on a scientific risk assessment study based on
techniques developed by international agencies. This risk assessment seeks to
evaluate the likelihood of entry, establishment or spread of a pest or disease
within the territory of an importing Member according to the SPS measures which
might be applied, and of the associated potential biological and economic
consequences; or the evaluation of the potential for adverse effects on human or
animal health arising from the presence of additives, contaminants, toxins or
disease-causing organisms in food, beverages or feedstuffs [Annex A]. These
studies can incorporate an economic cost-benefit analysis, including assessments
of technical and economic feasibility, but measures need not be based on the
results of such an analysis though they should aim towards minimizing “negative
trade effects.” In case proper scientific information is lacking, standards might be
based on information gathered from international agencies and on standards in
other countries. If a country has reason to question the standards of another
country it has the right to enquire about the reasons for adoption of such standards
[Article 5]

7
e) Regionalization: Member countries need to recognize concepts of pest or disease
free areas, based on geographic, ecosystem, epidemiological surveillance and
effectiveness of SPS controls [Article 6]1
f) Transparency: Member countries have to ensure that all SPS measures and
changes therein are notified, to provide transparency and establish one national
point of enquiry where all interested Member countries can obtain information
[Article 7 and Annex B]
g) Control, Inspection and Approval Procedures: Member countries have to treat
imported products just like the domestic products and use similar control,
inspection and approval procedures for both imported and domestic products
[Article 8 and Annex C]
Other important provisions of the SPS Agreement encourage countries to provide
technical assistance to other countries, especially developing countries either directly or
through international organizations. It also allows for special and differential treatment
for developing countries allowing them time to build up their capacities to meet the
standards of the more developed country. The Agreement also provides for the general
WTO dispute settlement mechanism to apply. This dispute settlement procedure consists
of timetables for resolution of disputes by consultations or hearings before adjudicatory
panels, an appeal process, as well as a follow-up process to ensure implementation. The
complaining Member country seeks a formal consultation with the disputed Member
through the WTO Dispute Settlement Body. In case of the failure of these talks, the
complaining country can request the establishment of a dispute resolution panel,
composed of a chairperson and two members who need to be approved by both countries.
The panel holds meetings with both parties allowing them to present their arguments and
also uses the expertise of technical and scientific authorities to prepare a report
1 A pest or disease-free area, whether all of a country, part of a country, or all or parts of several countries, is an area as identified by the competent authorities, in which a specific pest or disease does not occur.�A pest or disease-free area may surround, be surrounded by, or be adjacent to an area - whether within part of a country or in a geographic region which includes parts of or all of several countries -in which a specific pest or disease is known to occur but is subject to regional control measures such as the establishment of protection, surveillance and buffer zones which will confine or eradicate the pest or disease in question [Annex A].

8
Figure 1: Definition of Sanitary and Phytosanitary measures
Figure 2.1. Definition of SPS Measures Source: Annex A and Footnote 4 of the Agreement on the Application of Sanitary
and Phytosanitary Measures (GATT, 1994) and Swinbank (1999).
SPS measures are applied:
(a) to protect animal or plant life or health within the territory of the Member from risks arising from the entry, establishment or spread of pests, diseases, disease-carrying organisms or disease-causing organisms;
(b) to protect human or animal life or health within the territory of the Member from risks arising from additives, contaminants, toxins or disease-causing organisms in foods, beverages or feedstuffs;
(c) to protect human life or health within the territory of the Member from risks arising from diseases carried by animals, plants or products thereof, or from the entry, establishment or spread of pests; or
(d) to prevent or limit other damage within the territory of the Member from the entry, establishment or spread of pests.
Sanitary or phytosanitary measures include all relevant laws, decrees, regulations, requirements and procedures including, inter alia, end product criteria; processes and production methods; testing, inspection, certification and approval procedures; quarantine treatments including relevant requirements associated with the transport of animals or plants, or with the materials necessary for their survival during transport; provisions on relevant statistical methods, sampling procedures and methods of risk assessment; and packaging and labelling requirements directly related to food safety.
For the purpose of these definitions, “animal” includes fish and wild fauna; “plant” includes forests and wild flora; “pests” include weeds; and “contaminants” include pesticide and veterinary drug residues and extraneous matter.

9
containing their findings and conclusions. The Dispute Settlement Body adopts the report
within 60 days of its issuance, unless the decision is appealed by one of the countries. A
permanent body established by the WTO, the Appellate Body, is composed of seven
judges. They have the powers to uphold, modify, or reverse any or all of a panel’s legal
findings and conclusions as long as the review is limited to issues of law. The Dispute
Settlement Body then adopts the Appellate Body report. If it is found that the defending
countries actions were not in consonance with one or more WTO agreements, they
provide a reasonable period of time for the country to bring its actions into conformity
with the agreements. If the defending country does not implement compliance measures
within the stipulated period of time the complaining country can negotiate compensation
in the form of reduced tariffs or easier access to products from the complaining country
into the market of the other (Stanton, 2001). If no compensation is negotiated, the WTO
can sanction retaliatory tariffs on imports by the complaining country from the country
out of conformity.
The SPS Agreement in Article 5 contains terms such as “appropriate” and “not
more trade restrictive than necessary,” but the interpretation of these concepts is open to
ambiguity (Nairn, Allen, Inglis and Turner, 1996; Swinbank, 1999). The Agreement
mentions taking into account “economic factors” when carrying out a risk analysis, but it
does not refer to the cost-benefit impact of imposing an import ban or other SPS
measures on the exporting or importing country. Even though the SPS Agreement does
not specify standards to be used in setting the SPS measures, it does suggest basing the
measures on international standards thus advocating the norm of a common code of
levels for the whole world (Swinbank, 1999).
SPS measures are an important issue for developing countries. Henson and
Loader (1999) recommend that it is beneficial for developing countries to join in the SPS
Agreement and help define international standards. Developing countries are
handicapped by the level of science required in the negotiations and so may not have
much influence in determining international standards, as well as face problems in trying
to achieve those standards. Demand for food products in developed countries is
becoming more stringent and the major products exported from developing countries

10
have to face these standards with little chances of their being lowered in the future.
Developing countries need to negotiate in the setting of international standards and then
adapt to them in order to take advantage of the export opportunities in markets for safe
food products in developed countries.
2.2.2 Implications of the SPS Agreement
Since the WTO agreements came into force, over 200 cases have been formally
raised in the WTO dispute settlement system (Stanton, 2001). Twenty two of these were
formal complaints related to food regulation trade barriers (Josling, Roberts and Orden,
forthcoming). Decisions have been taken on 5 cases, 3 out of which are SPS issues, while
the rest have been settled or are pending. The other 2 food-related decided cases dealt
with technical barriers to trade and other issues.
During 1998-99, the WTO Appellate Body came out with reports on the three first
and also noteworthy SPS cases, namely the EC – Hormones, Australia – Salmon and
Japan – Varietals cases, each case dealing with the different aspects of the SPS issues –
human, animal, and plant health, respectively. In all the three cases, the WTO ruling was
against the countries employing the measures on at least some grounds and they were
issued a time period within which to comply with the proposed recommendations. The
EC on the elapse of the time period in the Hormones case acknowledged their failure to
implement the report. As a result, the aggrieved countries, (U.S. and Canada) were
allowed to take retaliatory measures by imposing 100 percent tariffs on certain products
imported from the EC to the annual traded value of US$ 116.8 and CDN$ 11.3 million
(Roberts, 1998; Pauwelyn, 1999). As for the Australian Salmon case, Australia proposed
some new measures regarding import of salmonids/salmonid products that Canada
challenged again in further dispute settlement panel proceedings. The panel ruled against
Australia on only one of the 11 specific conditions laid down by them. This dispute was
resolved through negotiations, but Australia, until the year 2000, has imported only 200
tons of salmon, consisting of negligible imports from Canada, the bulk coming from New
Zealand (Gascoine, 2000). Negotiations are still ongoing between Japan and the U.S. on
the Varietals case (WT/DS245, 2002).

11
These three cases provide insight into the decision-making procedures of the
WTO dispute settlement panels and the Appellate Body and their interpretations of the
Agreement on SPS Measures. On the other hand these cases also reflect on the actual
implementation of the recommendations offered by the panels and shed light on the
inability of the WTO to form ‘hard laws’ about disputed issues. Hard laws are a set of
rules to which compliance can be largely enforced (Abbott, 1997). Unfortunately in SPS
issues and trade disputes, the WTO has no means to ensure compliance and a country can
opt to compensate the aggrieved country, or allow sanctions, instead of changing the
standards or policies under question.
Though it has been stated that the existence of the SPS Agreement would not
necessarily bring about greater discipline in the use of SPS barriers, many countries have
reconsidered their SPS measures or tried to bilaterally resolve trade issues without
involving the formal dispute settlement procedures of the WTO or other regional
agreements like the NAFTA (Abbott, 1997; Roberts, 1998). One such case is that of
import of Mexican avocados into the U.S. markets where bilateral technical exchanges
helped in reaching mutually acceptable standards between the U.S. and Mexico that led
to the partial easing of an 83-year old quarantine ban.
2.3 The U.S. Avocado Market
2.3.1 Domestic Production of Avocados and the Industry
Avocados in the United States are mainly grown in the states of California and
Florida. California accounts for 85 to 95 per cent of the annual avocado production with
Florida accounting for the rest. California has been producing more than 20 varieties of
avocados commercially since 1950. Four of the most important varieties are the Bacon,
Fuerte, Hass and Zutano. The Fuerte variety had nearly 80 percent share of the acreage
during the 1950’s but has been steadily replaced by the Hass avocado and today has
barely 10 percent of the total acreage. The reasons for the success of the Hass avocado
over other varieties are primarily twofold: one that the average yield is higher than the
other varieties and secondly that the average prices per pound commanded by the Hass
avocado again are the highest (CAC, 2002).

12
Commercial avocado production began around 1910 and saw periods of growth in
the mid 1940s and then again through the 1950s and once more in the late 1980s. The
acreage reached a peak of 76,307 acres in 1987-88 but since then has decreased due to
growing urban pressures, rising land costs, and high water costs (Roberts and Orden,
1996). The changing acreage and production of avocados are shown in Table 2.1 as per
the crop year from November to October. Currently, the acreage is placed at 58,601 acres
for 2000-2001.
About 80 percent of the avocado growers have annual sales of less than $25,000
per year but there are a few large producers as well. Two percent of the producers in
California had sales more than $500,000 in 1987 and harvested nearly 38 percent of the
71,007 bearing acres in California in 1990 (USDA/ERS, 1995; Roberts and Orden, 1996).
Table 2.1: California Avocado Acreage, Production and Grower Prices, 1989-1990 to 2000-2001
Acreage Production
Year (Nov – Oct)
Bearing Non-bearing Million pounds percent change
Grower Price (cents per pound )
1989-1990 73,368 2,395 207.9 -36.9 114.23 1990-1991 71,007 1,126 271.5 30.6 71.16 1991-1992 69,582 819 310.9 14.5 58.73 1992-1993 68,159 644 569.8 83.3 20.70 1993-1994 66,865 505 271.0 -52.4 92.67 1994-1995 61,254 987 304.2 12.2 74.73 1995-1996 61,125 740 340.4 11.9 69.10 1996-1997 60,674 488 329.1 -3.3 78.71 1997-1998 59,895 1478 304.9 -7.3 85.64 1998-1999 59,385 1109 271.5 -11.0 121.09 1999-2000 58,987 739 321.1 18.3 105.71 2000-2001 58,601 370 422.3 31.5 74.57
Source: Industry Statistics 1971-1972 to 1999-2000, California Avocado Commission, 2000 and USDA/APHIS, 2001
To start an avocado orchard is a cost-intensive activity requiring investments to
clear land, grade access roads, install drip irrigation systems and propagate new trees.
The trees start producing fruit in as few as two to three years but mature to their full
potential in about seven years and remain productive for as long as 40 years. The crop

13
can also stay on the tree for eight months before harvesting. In this regard, it is not easy
to change short run supply by increasing acreage, but to some extent it can be controlled
by delaying or hastening fruit harvest. The accumulated cost of establishing an avocado
orchard in the Southern Coast Region of California was estimated at $15,372 per acre for
the initial six years by the California Cooperative Extension Service (USDA/ERS, 1995).
These calculations help substantiate the claims of the chairman of California Avocado
Commission (CAC) that the avocado industry is a billion dollar industry (Roberts and
Orden, 1996).
Hass avocado prices are inversely related to seasonal supply patterns and thus
vary during the year. The prices are higher during the low production months of
September to January and lower during the peak production months in summer, from
April to August. From Table 2.1, the inverse pattern can be observed in relation to the
total production as well over years of high and low output.
2.3.2 Avocado Consumption
The average consumption of avocados in the U.S. over 1995-2000 was 426
million pounds (213,000 tons). It is not a staple food in most households yet fresh
avocado consumption is higher than many other fruits such as limes, apricots, cherries,
cranberries, kiwifruit, plums, and prunes. Much of the consumption occurs in the
Southwestern and Western states. Nearly 78 percent of households purchase avocados in
these regions while less than 30 percent households purchase them in other parts of the
country. The total per capita consumption of fresh avocados averages 1.58 pounds over
1995-2000. The per capita consumption is larger in the Southwest and Pacific regions
averaging 4.29 pounds per capita and lower in the other parts such as Northeastern, East
and West Central and Southeastern, at 0.51 pounds per capita (USDA/APHIS, 2001).
There is no statistically significant difference between Californian wholesale prices in
different regions of the country (USDA/APHIS, 2001).

14
2.3.3 Avocado Trade
Table 2.2 and Figure 2.2 compare the domestic production of avocados in the
U.S. to imports from various countries during the years 1990 to 2001. From this table, it
can be seen that imports into the U.S. are slowly increasing as a percentage of total
production from less than 25 percent in 1998 to more than 33 percent in 2000-2001. Of
the imported avocados in year 2001, Chile holds nearly 63 percent of the market share
whereas Mexico has 17 percent. New Zealand has a smaller share of the market but it has
been growing since 1997. Other countries like the Dominican Republic have an important
share of 12.5 percent but the avocados that they export are not Hass avocados but a larger
green skinned variety not considered in this study and comprising only a small portion of
the total avocado market.
There are seasonal variations in the import patterns as well (Figure 2.3). Chile and
New Zealand mainly supply the U.S. market during the months of August/September to
December. The Mexican imports until 2002 have been restricted between November to
February, as will be discussed below. The domestic production peaks between March and
September.
Table 2.3 provides a summary of the current and projected domestic and foreign
global production and U.S. trade of avocados. There is an estimated increase in the
production of avocados in Chile and New Zealand (N.Z.) of over 135 million pounds,
which amounts to about 35 percent of the recent U.S. avocado consumption. These
figures indicate the increasing competition that domestic U.S. avocados will face in the
future from rising productions in exporting countries. In this table, production in Mexico
is assumed to be constant.

15
Table 2.2: U.S. Domestic Production and Imports of Avocados, 1990-2001
Year U.S. Chile N.Z. Mexico Total
million pounds 1990 182.9 25.6 - - 208.5 1991 223.1 31.3 - - 254.4 1992 276.7 35.5 - - 312.2 1993 516.8 3.9 - - 520.7 1994 201.7 40.5 - - 242.2 1995 259.9 25.1 0.16 - 285.2 1996 292.1 35.9 0.15 - 328.2 1997 285.2 33.4 0.72 9.1 324.8 1998 255.1 98.7 0.91 20.5 372.3 1999 243.9 70.0 6.75 26.1 343.9 2000 295.0 112.8 9.60 28.8 441.5 2001 389.2 108.4 4.98 28.3 530.9
Source:CAC (2003), USDA/FAS(2002)
0
100
200
300
400
500
600
1990
1991
1992
1993
1994
1995
1996
1997
1998
1999
2000
2001
Year
mill
ion
poun
ds U.S.ChileN.Z.Mexico
Figure 2.2 U.S. Domestic Production and Imports in million pounds, 1990-2001 Source:CAC (2003), USDA/FAS(2002)

16
Jan Feb March April May June July Aug Sept Oct Nov Dec California Mexico Chile New Zealand
Little or no supply Some supply Large supply
Figure 2.3. Seasonality of Avocados: Intensity of Supply to the U.S. Market
Source: U.S. Census and Fintrac 2001-2002 and USDA, 2002
Table 2.3: Current and Projected Hass Avocado Production, 2001and 2006: Mexico, Chile, New Zealand and U.S.
Country of Origin Mexico
Chile
New Zealand
United States
U.S. Market Access limited unlimited unlimited unlimited Acreage (ha)
Current 86,000 20,500 2,750 24,000 Projected (2006) 86,000 25,000 5,450 22,550
Production (million pounds)
Current 1543.2 176.4 35.3 297.6 Projected (2006) 1543.2 275.6 74.95 <297.6 Expected change - 99.2 39.65 -
Source: Browne (2001)
2.3.4 Chilean Avocados
Chile is currently the largest exporter of Hass avocados to all states in the U.S.
Table 2.4 contains historical information about the Chilean avocado planted area,
production, and exports. Avocado production in Chile has been expanding by 1,000
hectares per year since 1999 and even more before that, and as a result avocado

17
production in Chile has shown major increases, as seen in Table 2.4. Most of this increase
is in Hass avocado production, which is around 75 percent of total production. About 95
percent of the commercial avocado crop is planted in the central region of the country,
namely, Quillota, Aconcagua Valley and La Ligua, Petorca and the Metropolitan region
(USDA/FAS, 2000). The Chilean export market is largely dependent on the U.S. with
nearly all exports targeted towards the U.S. market. The prices are somewhat “supply
driven” as is shown from the pattern over various years with prices higher when quantity
of exports is low and lower when the exports are high as per Figure 2.4.
Table 2.4: Chilean Avocados Acreage, Production, Exports, and Import Price, 1973-2001
Year Planted area (ha)
Production Exports million pounds
Import Price in U.S. markets
(cents per pound)
1973 4,490 32.0 - N.A.
1980 6,180 55.1 0.02 N.A.
1985 7,605 63.7 2.6 N.A.
1990 8,315 85.5 25.5 70
1995 11,560 105.8 26.5 43 1996 12,850 112.8 36.9 46 1997 16,919 112.4 34.1 48 1998 18,307 190.7 98.1* 47 1999 19,800 177.5 77.2 55 2000 20,800 198.4 100.3* 62 2001 21,800 220.5 114.6 49 Note: There seems to be a discrepancy in the data since from Table 2.2 the exports to the U.S. are larger than the total Chilean exports for these two years Source: GAIN Report (USDA/FAS, 2000)

18
0
20
40
60
80
100
120
140
1990 1995 1996 1997 1998 1999 2000 2001
Year
Mill
ion
Pou
nds
and
Cen
ts p
er P
ound
Quantity ofimportsPrice ofimports
Figure 2.4. Quantity of Imports from Chile and Import Price, 1990 - 2001
Source: GAIN Report (USDA/FAS, 2000), USDA/FAS 2002
2.3.5 New Zealand Avocados
New Zealand is the third largest exporter of Hass avocados to the U.S. Avocados
have been grown in New Zealand for more than 30 years but it is only of late that the
country has developed as a major exporter to the U.S. market. New Zealand avocado
growers have recognized the potential of the U.S. markets and have increased acreage in
avocado production. The peak season of production in New Zealand is October to March.
The export figures and the value in the U.S. market for the New Zealand fruit are
given in Table 2.5. New Zealand exports are less than the Chilean and Mexican exports
to the U.S. There is no clear pattern between the price of the New Zealand avocados and
the quantity imported into the U.S. markets. The price of the imports per pound though is
higher than the value of Chilean imports as given in Table 2.4 or the grower price of the
domestic avocados as per Table 2.1.

19
Table 2.5: New Zealand Avocado Exports and Import Price in U.S. Markets, 1995-2001
Year Exports to U.S. (millions of
pounds)
Import Price in U.S. markets
(cents per pound) 1995 0.16 109 1996 0.15 121 1997 0.72 124 1998 0.91 138 1999 6.75 136 2000 9.60 90 2001 4.98 86
Source: USDA/FAS, 2002
2.4 The Special Case of Mexico
2.4.1 The U.S. Mexico Avocado Dispute
Imports of Mexican avocados into the U.S. were banned in 1914 in order to avoid
spread of avocado seed weevils for which there was no known chemical or biological
control. The seed weevils do not cause much damage to the tree or its foliage, but they
oviposit on the fruits, the larvae burrow into the fruit resulting in scarring of the outer
peel, contamination of the flesh and destruction of the seed. These insects are not found
in the U.S. as the northern rough terrain of Mexico creates a geographical barrier to the
spread of these insects (Roberts and Orden, 1996).
Between 1914 and the 1970s, modern pesticides and cultivation practices resulted
in control of this pest. As a result, Mexico began to export avocados to Japan, Canada,
and other countries meeting their safety standards and with no evidence of pest
transmission. Since the U.S. persisted with the ban, the Mexican producers regarded the
quarantine as a non-tariff barrier to protect the domestic industry.
The domestic industry, stood to benefit with the ban in place. A study suggested
that the orchard development costs in Mexico were only 25 percent of the costs in
California (American Farm Bureau, 1991) giving Mexico a competitive edge over the
domestically produced avocados. Production costs for bearing trees were $600 - $900 per
acre in Mexico compared to $5200- $5700 per acre in California. Further, all through the
year, the wholesale prices of export quality Mexican avocados are much lower than those
for Californian avocados. These cost and price differentials provide a strong economic

20
basis for the domestic industry wanting the ban to remain in place (Roberts and Orden,
1996).
The political economy associated with regulation refers to what is known as the
“capture theory” where the regulatory processes are influenced by specific interest groups
to serve their own purpose. It has been suggested that capture is more prone to occur
when there is high economic gain to an interest group that can garner support and is able
to assert political pressure (Roberts and Orden, 1996).
In the early 1970s, the Mexican government requested permission to export
avocados grown in the state of Michoacan to the U.S. This request was denied based on
a literature review showing that Mexican avocados were host to a number of significant
pests including host-specific seed weevils and seed moths, and non-specific fruit flies. In
1973, after carrying out a field study and unable to find more than two fruit flies in the
district, APHIS reversed its decision, suggesting imports of four varieties of avocados
from Michocan district of Mexico to the states to the north and east of Colorado, Idaho,
Kansas, Kentucky, Missouri, Utah and Virginia. It was believed that by limiting the
imports to the northeastern states, outbreaks of pest infestations in the U.S. could be
avoided due to the large geographical distances from likely pest-susceptible areas.
Stringent protocol was also laid out about the necessities at the ports of entry, notice of
arrival, inspections, and shipping requirements. In spite of positive signs from the senior
policymakers in APHIS, no decision was taken and finally in 1975 Mexico was informed
that APHIS would not change the status of the ban (Roberts and Orden, 1996). Thus this
round of the avocado dispute was won by the domestic growers. The story was similarly
repeated for the Mexican district of Sinaloa. Because of acute industry pressure APHIS
could not revoke the ban even though risks of pest infestation were assessed to be
negligible.
2.4.2 NAFTA and Developments Leading to Approval of Imports
The 1980 – 1990 period was relatively a period of quiet with no major requests
from the Mexican government, but APHIS continued to maintain its conservative stand.
Mexico requested a free trade area with the U.S. and Canada in 1990, and this led to the
trilateral negotiations between the countries. The negotiations ended in 1992 and the

21
NAFTA came into force from January 1993. The NAFTA agreement between the U.S.
and Mexico included removing non-technical trade barriers on all farm products but
allowing a 15-year period for adjustment for the most sensitive commodities. The
NAFTA agreement also mentioned the SPS-related trade issues in one section of the
chapter on agriculture, where six principals were agreed to by the three participating
countries. These principals were (NAFTA, 1993):
• Each country had the right to adopt any SPS measure necessary to protect
human, animal, and plant life and health
• Each country had the right to establish appropriate levels of protection
• These measures should be supported by scientific evidence
• These measures cannot discriminate between domestic and foreign goods
• Each measure adopted should be applied only to the extent necessary to
achieve the proper level of protection
• SPS measures should not create disguised restriction on trade
A dispute settlement procedure similar to the WTO was also arrived at, whereby
if an arbitral panel ruled that an import regulation violated NAFTA provisions, then the
non-compliant country could either change the measure or retain the measure and provide
compensation to the complaining country amounting to the value of the trade that had
been harmed.
As a part of the NAFTA regulations, the avocado issue was taken up once more in
1990 with renewed efforts by the Mexican growers to meet standards necessary to
receive entry to the U.S. markets. For nearly five years, the Mexican and the U.S.
governments debated the issue, with deliberations regarding data requirements, research
design, and interpretation of research results concerning possible lifting of the ban, and
over assessments of pest populations, host status of Hass avocados for fruit flies, and the
appropriateness of possible pest–risk mitigation strategies. All this was closely followed
by the industry, policymakers as well as elected officials in both the countries (Roberts
and Orden, 1997).

22
Through these consultations and negotiations, Mexico came up with a “systems
approach” method for pest risk management, which met the standards required by
APHIS. A number of control measures in orchards, packing houses, and the transport
system, when integrated are known as a systems approach and help to prevent pest
infestation in a pest-free country or zone. It is a modern approach towards less restrictive
trade practices and at the same time ensuring quarantine security in the importing
country. It has also been defined as a scientific approach involving pest biology and
ecology along with infrastructure towards pest management (Hoeflich, 2000).
Finally, on November 15, 1994, an “Advanced Notice of Proposed Rulemaking
and Public Meetings” was published in the Federal Register. This notice announced that
APHIS was evaluating a request from the Government of Mexico regarding export of
Hass avocados from approved orchards in approved municipalities in the State of
Michoacan to 19 states in the Northeastern part of U.S. Public comment was invited and
hearings were planned for the end of November in California and Florida. In these two
public meetings stretching over a total of nine hours, growers, industry representatives,
state and local government officials and scientific consultants protested against the
proposed rule (Roberts and Orden, 1997).
Despite these objections, a proposed rule on the imports of avocados from Mexico
was published in the Federal Register on July 3, 1995. The proposed rule recommended
the amendment of the quarantine regulations in order to allow “fresh Hass avocado fruit
grown in approved orchards in approved municipalities in Michoacan, Mexico to be
imported into certain areas of the United States, subject to certain conditions” (Federal
Register, 1995). Notice of five public hearings to be held on the proposed rule in August
1995 was also provided and public comments were invited till October 1995. The
proposed rule carried the APHIS evaluations of the work plan submitted by Mexico and
responses to comments received in the hearings held after the advanced notice of the
proposed rule. The use of the systems approach towards mitigation of pest-risk (Figure
2.5) was defended in this proposed rule.
The proposed rule was met with continued opposition from the domestic industry,
which claimed that the avocado quarantine had been sacrificed on the altar of political
need for a successful trade agreement (Roberts and Orden, 1997). Even though the

23
geographic and seasonal restrictions in USDA’s proposed ruling advocating partial easing
of the ban opened up less than five percent of the annual domestic market to Mexican
avocados, the opposition, led by the CAC, made arguments that the proposed systems
approach would lead to unacceptable risk of pest infestation to the domestic fruit
production.
The industry refused to accept the results of the pest survey and maintained that
the risks were much higher than thought. The conditions, under which the industry was
willing to accept Mexican imports were so stringent that they might have effectively
removed all chances of the imports for quite some time to come (Roberts and Orden,
1997). This opposition temporarily succeeded in blocking the change to the quarantine
when the USDA announced that the decision on the final rule would not be made in time
to allow imports for the 1995-96 winter shipping season.
The CAC maintained the pressure on USDA throughout 1996 by threatening legal
action to block the lifting of the ban and placing full page advertisements in certain
national newspapers announcing “Mr. President: The USDA is about to sign the death
warrant for a billion dollar American industry,” against the backdrop of a hangman’s
noose or smoking gun. They further alleged procedural irregularities in the rulemaking
process involving violation of federal conflict-of-interest law. They demanded another
comment period before the final ruling was decided (Orden, 2002).
In February 1997, in spite of the prolonged industry opposition, USDA issued a
final rule, allowing limited importation of avocados from Mexico provided the systems
approach was followed. The industry reaction was not as vehement as threatened, in that
no court case was filed to block the decision. Under this ruling, Mexican avocados began
to enter the U.S. market in the winter of 1997-98. It is believed though, that scientific
evidence and arguments alone did not bring about this trade liberalization but it was a
political impetus in the form of NAFTA that made the lifting of the ban possible (Vogel,
1995, 1999). According to Vogel (1999) NAFTA ended the “monopoly” of the California
avocado growers over policy making at the USDA. Thus, the avocado case is a good
example of a success of trade liberalization: The changing of a regulation protecting the
economic interests of American producers to one leading to improved global welfare
(Vogel, 1999).

24
Figure 2.5. Systems Approach for Pest Risk Management for Mexican Avocados
Source: USDA, 1995
The final rule came as a domestic regulatory reform initiative that has some
commonalities with an SPS Agreement dispute in the WTO. Although there was no
formal dispute process, the bilateral regulation was formulated along lines elaborated in
the WTO and NAFTA SPS Agreements. Both advocate transparency of regulatory
The Systems Approach to Pest-Risk Management for Importation of Avocados into the U.S. consisted of the following nine steps:
1. Field Surveys – 300 hectares from each municipality be surveyed for avocado seed weevils and avocado seed moth
2. Fruit Fly Trapping Activities – Trapping be conducted in the approved municipalities
for the Mediterranean fruit fly (I trap per 1 to 4 square miles) and in the approved orchards for Anastrepha fruit flies (1 trap per 10 hectares)
3. Field Sanitation – Regulation requires that fallen fruit must be removed from the
orchard at least once every 7 days and that dead branches be pruned and removed 4. Host Resistance – Export is limited to Hass avocados only as evidence shows that this
variety is either not a host or a poor Anastrepha fruit fly host prior to harvest
5. Post harvest Safeguards – Regulation requires that the harvested fruit be protected from fruit fly infestation within three hours of harvest
6. Winter shipping only – The imports of Mexican avocados is permitted only during the
months of November, December, January and February, and this helps mitigate the risk for the Anastrepha fruit flies
7. Packing house Inspection and Fruit Cutting – The regulation demands that before a
culling process a sample of 300 fruit per shipment be selected, cut, and inspected by Sanidad Vegetal (SV – The Mexican equivalent of APHIS). This provides protection against all the targeted pests
8. Port of arrival Inspection and Clearance Activities – This helps reduce risk for all
targeted pests 9. Limited US Distribution – The distribution is limited to 19 Northeast U.S. States in
order to mitigate risk for all targeted pests.

25
rulemaking to provide equal access of information amongst all stakeholders be they
agricultural producers, processors, consumers, or trading partners. Both also necessitate a
careful assessment of risks that the regulatory measure would seek to mitigate and
include costs of control programs as a factor in the decision making process leading to
the creation of a regulation (Roberts, 1999).
2.4.3 Market Developments since the 1997 Import Rule
In the four years since Mexican avocados were finally introduced into the U.S.
market in the winter of 1997-1998, there have been no cases of pest infestations. As
expected shipments of Californian avocados to the northeast part of the country were
displaced by the Mexican imports during November to February. During 1986-1994,
Hass avocado shipments from California averaged nearly 245 million pounds per year
(November to October), as shown in Table 2.6. This rose to 296 million pounds shipped
during the 1999-2000 season. Nearly 77 percent of all shipments went to the Pacific and
Southwest region during 1986-1994. The Northeast regions received around 14.1 percent
while 3.8 per cent went to the Southeast and 5.1 percent to the West Central. In 1999-
2000, the regional differences still existed with 50.8 percent of the shipments still going
to the Pacific and 20.1 percent to the Southwest regions. The West Central continued to
receive 5.1 percent while the shipments to the Northeast and East Central comprised 7.8
percent and 8.2 percent respectively and the Southeast region accounted for 7.9 percent.
Californian shipments during November to February to the East Central and
Northeast (which together comprise the “Northeast” to which Mexico has access under
the APHIS rule) regions fell from 7.7 million pounds during 1986-94 to 1.1 million
pounds in 1999-2000 after Mexican imports were allowed into the region. Mexican
shipment details are given in Table 2.7. For the year it can also be observed that the
overall shipments of the California Hass avocados did not decline but increased, in spite
of the significant decrease during the months of November – February to the Northeast
regions, since the importation of Mexican avocados began. The annual total shipments
during the 1999-2000 season to the Northeast regions show an increase from 34.3 million
pounds to 47.5 million pounds indicating that the California producers have increased
shipments to these two regions during the remaining part of the year and this has more

26
than countered the decrease during the period that Mexican imports are allowed
(USDA/APHIS, 2001). Shipments to the Southeastern region have increased by a larger
percentage (from 9.2 million pounds to 23.5 million pounds) suggesting a general shift in
the eastern U.S. towards higher consumption levels. Other important observations reflect
that Chile has been a major source of avocados during the September to December period
accounting for nearly 5 times the level of Mexican imports to the U.S as can be seen in
Table 2.2. Chilean imports have grown from an average of 8.7 million pounds during the
months of November to February of 1989-1994 to an average of 26.1 million pounds
during the same months in 1997-2000. New Zealand imports were negligible before 1997
and since then have grown to an average of 2.0 million pounds during the months of
November to February over 1997-2000 (USDA/FAS, 2002). All this adds to the above
suggestion that avocado consumption levels in the eastern U.S. are becoming higher.
The average wholesale price for U.S. avocados during the months of November to
February from 1997-1998 to 1999-2000 has been $1.79 per pound. The price of Mexican
avocados averaged nearly 25 percent lesser at $1.34 per pound. The prices of Mexican,
Chilean, New Zealand and Californian avocados are compared in Figure 2.6. New
Zealand avocados appear to have enjoyed a premium above the U.S. avocados till 1999,
losing it with the price falling below the level of U.S. avocados by 2000 but then again
rising in 2001 to more than the price of the U.S. avocados.
Table 2.6: Regional Shipments of Californian Hass Avocados Before and After Imports from Mexico, 1986-1994 Average Versus 1999-2000 Season
Regions Average 1986 - 1994 1999-2000 season Total
Shipment Shipment (Nov-Feb)
Shipment (Nov – Apr)
Total Shipment
Shipment (Nov – Feb)
Shipment (Nov – April)
Pacific 128,851,875 22,788,019 51,736,850 150,306,026 24,960,500 58,680,650 Southwest 59,979,978 14,719,891 26,701,613 59,482,176 11,330,800 24,903,575 West Central 12,461,366 2,858,658 5,154,394 15,172,675 2,874,226 6,114,300 East Central 17,562,534 4,143,584 7,523,972 23,084,525 678,700 5,743,700 Northeast 16,859,097 3,618,194 6,665,941 24,380,950 331,675 6,022,300 Southeast 9,208,750 2,222,900 4,035,869 23,502,650 4,817,950 9,724,325 Total 244,923,600 50,351,244 101,818,639 295,929,002* 44,963,851 111,188,850
*There is a difference between the shipment figures here and in Table 2.1 since the latter seem to contain information about all avocados produced in California and not just Hass avocados. Source: California Avocado Commission, 1999-2000, USDA/APHIS, 2001

27
Table 2.7: Mexican Hass Avocados Exports to the U.S., 1997-2001
Quantity of Exports November December January February Total
Year
Millions of pounds percent change
1997-1998 2.23 3.30 3.91 4.57 14.01 - 1998-1999 5.00 4.12 5.50 5.67 20.29 45 1999-2000 7.02 5.01 6.66 6.25 24.94 23 2000-2001 7.11 4.12 6.28 6.21 23.72 -5
Source: USDA/FAS, 2002
0
0.2
0.4
0.6
0.8
1
1.2
1.4
1.6
1997 1998 1999 2000 2001
Year
$/po
und U.S.
ChileMexicoNew Zealand
Figure 2.6: Price of Imported and Domestic Avocados, 1997-2001
Source: USDA/FAS, 2002; CAC, 2002
2.4.4 Mexican Request for Additional Market Access
Based on the success of the Mexican Hass avocados importation program, Mexico
requested increased geographic and seasonal access to the U.S. markets in September
1999. The USDA invited public comments and by November 2001 an amended final rule
was issued which allowed for the expansion of regional access for Mexican avocados to
31 states adding the West Central region and the seasonal access from 15th October to
15th April. The domestic industry did not respond as vehemently as before in the public
arena: for example, and no full-page advertisements or much media attacks against the

28
USDA were seen. However, in December 2001, the CAC filed a lawsuit against the
USDA in a Fresno court claiming that the USDA had allowed entry of Mexican avocados
into the country in spite of their bring a potential pest risk. The lawsuit claims that the
USDA did not have a Congressional mandate to remove the quarantine ban against
importation of Mexican avocados in 1997 or to expand geographic and seasonal access of
Mexico in 2001. It claims that an Environmental Impact Study (EIS) should have been
conducted before making any changes in the regulations since the amended rule has put
domestic producers under considerable risk (Field Talk, 2002).
2.5 Economic Assessments
2.5.1 Economic Evaluation Studies by USDA
The 1995 Proposed Rule contained details of a cost benefit analysis study
evaluating the effects of the partial lifting of the ban against importation of Mexican
avocados (USDA, Federal Register, 1995). The demand for avocados in the United States
was assumed to be inelastic at –0.48 and it was suggested that the quality of the fruit
played an important role in the purchase decision rather than the price. This study put the
affected number of avocado growers in California at 7,300 of which 6,729 were small
growers. It was expected that the importation of Hass avocados from Mexico would
increase the supply of avocados in the U.S. by 12 percent causing a reduction in the
weighted average wholesale price of Californian avocados between 1991-1993 of $0.48
to about $0.42 per pound.2 Even with the low elasticity of demand, consumer welfare was
expected to increase due to more competition and choice of varieties.
The Final Rule contained a much more detailed analysis, a “regulatory
flexibility analysis” of the economic impacts of the new ruling allowing importation of
Mexican avocados into 19 Northeastern states during four months of the year (USDA,
Federal Register, 1997).3 This new study used models more complex than the initial
2 The average weighted wholesale price of $0.48 used by the USDA in their calculations is lower than even the average price to Californian growers from Table 2.1 during the same period of $0.51 per pound. It is difficult to accept that the average wholesale price was lower than the grower price during the same period, but it has not been possible to reconcile these two sources. 3 Regulatory Flexibility Analyses are required for all federal government rules affecting internal revenue laws and should contain a statement about the need for and objectives of the rule, summary of public comments, description and estimate of small entities affected by the rule, and description of steps taken to minimize significant economic impacts on small entities.

29
simple conclusions of the first study and runs scenarios in both the approved and non-
approved states where the U.S. shipments would be displaced by the Mexican avocados
entering the Northeastern regions.
According to this study, the 19 approved states received 12 to 18 percent of the
Californian avocado shipments annually and only 2.3 to 4.6 percent of total annual
supply during the four months (November to February) when Mexican imports are
allowed into the region. Before approval of Mexico the domestic shipments from
California to the approved states during this time period were nearly 36 percent of the
supply, shipments from Florida 22 percent, and imports (primarily from Chile) were 42
percent of the supply.
The regulatory flexibility analysis deals primarily with two scenarios first where
the domestic shipments are partially displaced by the Mexican imports and the ‘unlikely’
case where total displacement occurs. In the first case, when 10 percent of the Mexican
shipments are redirected from other countries into the U.S. Northeastern markets, a price
decrease of 8 percent in the approved states and a price decrease of 1 percent in the non-
approved states is seen as a result of the partial displacement of Californian shipments.
The domestic producers would lose $1.37 million while consumers would gain $3.31
million resulting in a net welfare gain of $1.94 million. Were the redirection to be 50
percent of the Mexican exports to other countries, the resulting price fall would be around
41 percent in the approved States and 3 percent in the non-approved States. Producer loss
in such a scenario would be $6.44 million and consumer gain $18.98 million, leading to a
net welfare gain of $12.54 million. The total producer loss ranges from 0.5 percent to 5.4
percent of the crop’s farm value.
In the second case which is described as unlikely, all of the domestic production
is displaced from the Northeastern market and Mexican imports provide the seasonal
supply, during November to February and no impact would be observed in these states.4
In such a case, if 10 percent of Mexican avocados were redirected from other countries
4 This implies that though the Mexican avocados command a lower price than the domestically produced avocados in the U.S., they would sell at a higher price similar to the U.S. avocados, if the domestic avocados are totally displaced from the Northeastern markets. This conclusion does not seem to be a likely one, especially since partial displacement were assumed to lower prices in the Northeastern market. With the Mexican avocados totally replacing the domestic supply, price cannot be expected to remain as high as that for the domestic avocados.

30
and imported to the U.S. Northeastern markets, with a price elasticity of –1.07, the
resulting price decrease in the non-approved states would be 3 percent. Producer loss
would be $2.31 million and consumer gain $2.63 million resulting in a net welfare gain
of $0.32 million. Were 50 percent redirection of Mexican avocados from other markets to
occur, a price decrease of 17 percent in the non-approved states could be expected. The
producer loss would stand at $11.14 million and consumer gain at $14.03 million in the
non-approved states resulting in a net welfare gain of $2.89 million. The losses and gains
are both higher for more price elastic demand. The producer loss in this scenario ranges
from 0.9 percent to 9.4 percent of the crop’s farm value while consumer gains outweigh
these losses.
This USDA regulatory flexibility analysis assumes a zero risk outcome in which
the opening up of the market to the Mexican avocados does not create any risks of pest
infestations to the domestic crop. The next economic evaluation study takes risk into
account while carrying out the welfare analysis.
2.5.2 Economic Evaluation with Risk Assessment
Orden and Romano (1996) and Romano (1998), carried out an economic analysis
that includes pest infestation risk into the economic evaluation of the avocado ruling.
They analyzed the effects of either full or partial easing of the quarantine on U.S.
importation of Mexican avocados and American consumers and producers by considering
alternative assumptions about the risk of a pest infestation and its effects on the domestic
production and costs incurred thereof, in terms of pest-control expenses and reduced
yields.
The model assumed that the supply of avocados from Mexico was perfectly
elastic while the domestic supply was inelastic in the short run and elastic in the long run.
Demand elasticities also ranged from the inelastic to the elastic. The probabilities of the
pest infestations have been the subject of major disputes in the decision making over
lifting the ban. The pest infestation probabilities used by APHIS were estimated by Firko
(1995). As per him, the maximum risk of pest infestation was for stem weevils, and this
was πAM = 0.00345, under the partial lifting of the import ban following a systems

31
approach to risk mitigation. The minimum value of the probability of stem weevil
infestation was πAm = 1.35 x 10⁻⁶.
These estimates have been dismissed by the domestic industry as being too low.
Nyrop (1995) calculated the expected frequency of infestations to be 1 year to 20 years
when the ban was partially lifted. The two probabilities of pest infestation in a year as per
Nyrop’s calculations were taken as πNM = 1.0 and πNm = 0.05. Orden and Romano thus
considered 4 alternative probabilities in their model ranging from zero to certainty risk of
pest infestation associated with the complete or partial removal of the ban on avocado
importations. Orden and Romano also assumed that there could be a range of effects on
production costs after a pest infestation and assumed that the largest effects would be a
60 percent increase in marginal costs and a 20 percent decrease in yield.
The domestic avocado market was divided into submarkets – the Northeastern
winter regional market where the ban was lifted and the national aggregate for all other
regions as well as seasons. It was assumed that the domestic price in the Northeastern
winter regional market would fall to the free trade level for imports from Mexico, leading
to increased consumption as compared to before. The aggregate price for the rest of the
U.S. market was determined by the equilibrium of domestic supply and demand without
the Northeastern region.
The initial equilibrium as evaluated by Orden and Romano, with the imports of
avocados from Mexico banned stood at a domestic price of $1,385 per ton and output of
132,430 tons.5 The consumer surplus was estimated to be $134.4 million and producer
surplus $91.6 million. In a hypothetical scenario (not under consideration by USDA in
the 1990s) were trade fully liberalized and with no pest infestation occurring, the
domestic price fell to $878, consumption increased by 68 percent to 222,722 tons,
domestic productions showed a slump by 47 percent to 83,904 tons. Consumer surplus
rose by $87.5 million, producer surplus fell by $55.2 million and the net gain in welfare
was $32.3 million, nearly 14 percent of the initial welfare. Thus free trade led to
increased benefits for consumers but would have serious effects on the domestic
production. If a pest infestation were to occur this would increase the negative effect on 5 The equilibrium price works out to $0.63 per pound, which is essentially the average of growers prices from 1990-1995 of $0.634 per pound while the equilibrium quantity is 291.75 million pounds while the average quantity for the period was 277.53 million pounds.

32
the domestic avocado production and reduce the net welfare gain of the U.S. from trade.
In the worst case scenario, with total certainty of a pest infestation occurring and highest
costs, the producer surplus falls by another $18.4 million in the long run model. The net
welfare gain is still positive, though much reduced to $13.9 million. So even with a full
certainty of pest risk infestation, free trade still increases net national welfare.
If the ban were to be partially eased, opening the Northeastern region of the
United States to imports from Mexico for four winter months, the economic effects
would be considerably smaller than free trade if no pest infestation were to occur. In the
domestic market excluding the Northeastern winter part, the prices fell by 1.2 percent to
$1,368 because of the displacement of the domestic avocados from the northeastern
regions and their absorption in the other parts by means of expanded consumption and
reduced domestic supply. There is an increase in consumer surplus by $2.2 million in the
rest of the U.S. excluding the Northeast while the producer surplus on the other hand falls
by a similar magnitude. Outside of the Northeastern region winter market, the net welfare
gain is only $33,337. In the Northeastern region, winter consumption rises and consumer
surplus increases by $2.5 millions as the price falls to that of imports from Mexico. The
net national welfare shows a gain of $2.5 million. So even the partial easing of the ban as
in the 1997 ruling has positive effects on the Northeastern winter consumer surplus, and
limited positive effects on other consumers and net welfare while the domestic output
decreased slightly and the profits of domestic producers show a fall.
If a pest infestation occurs, it affects the domestic market in a large way if the ban
is partially eased. In the worst case, increased marginal costs and low yields decrease the
producer surplus by $45.8 million, much more than simply the price effect of limited
trade without the pest infestation. The domestic price also shows an increase because of
the decrease in total supply. In the longrun model with elastic supply of 1.6, this offsets
some of the producer surplus loss, which is still much larger than because of limited trade
alone. The consumers outside the Northeastern region are also affected. The increased
domestic price in the non-approved states because of less supply owing to the pest
infestation causes a fall in the consumer surplus giving the result that much of the
economic effect of the pest risk is absorbed by consumers outside the Northeastern winter
market and not by the producers when the trade is partially opened up as per the

33
ordinances of the 1997 ruling and there be a resulting pest infestation (Orden and
Romano, 1996, Romano, 1998 and Roberts, Josling and Orden, 1998).
2.5.3 Economic Evaluation Studies by USDA for Expansion of Imports
For the 2001 Final Rule the USDA carried out another regulatory flexibility
analysis to evaluate the potential economic impacts on U.S. producers and
consumers/merchandisers of the expanded imports of avocados from Mexico. This
economic impact on the domestic producers and consumers/merchandisers would arise as
a direct result of the increased supply of Hass avocadoes from Mexico and the resulting
decline in prices (Federal Register, 2002 and USDA/APHIS, 2001).
Two models were used to estimate impacts. The first is a nationwide model that
does not distinguish between the approved and non-approved states. The rationale
provided for this model is that in sufficient time, a single price for avocados would be
obtained in the two regions. Although Mexico would supply only in the approved states
and in specific months, Californian and other foreign suppliers could move in and out of
the two markets in search of profits until prices in both the approved and non approved
states would equalize.
In the second model though the approved and non-approved states are treated as
two different regions. Estimated economic losses include direct market loss for
Californian producers in approved States and losses related to increased supply in non
approved states because of the diversion of Californian Hass avocados to non-approved
States lowers prices. The major difference between the regional model and the
nationwide model is the assumed price differential between the approved and the non-
approved States.
Both models use a partial equilibrium economic surplus framework to consider
benefits and costs of the rule. Potential producer losses and consumer/merchandiser gains
are quantified in terms of changes in producer and consumer surplus that result from the
increased imports expected from Mexico. For simplification, the demand curve is
assumed to have a constant elasticity while the U.S. supply is assumed to be fixed or
vertical, that is, perfectly inelastic at least in the short run and not responding to changes
in price.

34
In the national model additional Hass avocado imports from Mexico totaling
16.87 million pounds are estimated to result in a 12 percent drop in the wholesale price,
from $1.34 per pound to $1.18 per pound.6 Consumers/merchandisers would gain by
$27.65 million per year and California Hass avocado producers would lose by $17.93
millions per year for a net benefit of $9.72 million per year.
For the regional model with the same level of additional Mexican Hass avocado
imports assumed, an amount equivalent to the maximum quantity assumed could be
wholly diverted from approved to non-approved states. Impacts are examined using three
scenarios. In the first scenario, 70 per cent of California Hass avocados affected by the
rule that would otherwise be sold in the approved states are displaced to non-approved
states. The second scenario envisages 85 per cent displacement and the third scenario
assumes 100 per cent are displaced. The 85 per cent is considered to be the most likely
scenario, given historic changes in quantity.
The first scenario of the regional diversion thus means that 6.07 million pounds of
California Hass avocados remain in the approved States, and 11.81 million pounds are
diverted to the non-approved states. The additional supply of Mexican Hass avocadoes
results in a price decline that benefits consumers/merchandisers in the approved States by
about $10.12 million per year. California producers selling Hass avocados in the
approved states face a revenue loss of $17.15 million per year. The net loss in the
approved states is $7.03 million per year.
In the non-approved states, the 11.81 million pounds of California Hass avocados
diverted from the approved states result in a price decline that causes a revenue loss of
$0.35 million per year for California producers. Consumers/merchandisers in the non-
approved states benefit by $19.31 million per year resulting in a net welfare gain of
$18.96 million per year.
Net losses in the approved states and net gains in the non-approved states yield an
overall gain of $11.94 million per year in the first scenario. The second scenario yields
6 California growers shipped 17.88 million pounds of Hass avocados to the East Central, Northeast and West Central during November to April, 1999-2000 while the amount shipped during November to February of the same year was 1.01 million pounds. Assuming that this amount would be unaffected by the rule, the maximum quantity that could be partially or wholly diverted from the now approved states was calculated to be 16.87 million pounds.

35
producers losses and consumer/merchandiser gains comparable to the first one. An
overall net gain is estimated at $8.87 million per year.
In the third scenario, a combined net benefit of $5.50 million per year is obtained.
The net benefit estimated using the national model is $9.72 million per year. In
conclusion, if the price elasticity of demand is larger than that used in this analysis
(-0.86), losses to the California producers and consumer/merchandiser benefits will be
lesser than those reported but the net impact still remains positive. Another factor that
might reduce losses to California producers would be activities to increase the demand of
Hass avocados.
According to the analysis of the 2001 rule, there are around 6000 producers and
100 handlers of Hass avocados in southwestern California that could be affected by this
rule, as well as 200 importers. Size distribution of the Hass producers was not obtained
by APHIS. Thus for analysis purpose, it is assumed that the size distribution of the 6000
producers is the same as the size distribution of the avocado farms as reported in the 1997
Census of Agriculture, or, 98 per cent are small entities ($750,000 or less in annual
receipts). Most Hass avocado importers are also small entities, while most handlers are
large (more than $5 million in annual receipts). From the declines in revenue described in
the three scenarios of the regional model, average annual losses for small entity
California Hass avocado producers are estimated to range between $1870 and $2593.
Two variations of the new rule are presented as examples of rule modifications
that would help mitigate the adverse impacts on small entity California Hass avocado
producers. Alternative A is to extend the four-month period of import by two months,
March and April, but not expand the region of approved States. Alternative B is to
maintain the current four-month period but expand the approved region by the same
states in the rule. For both these alternatives the losses to California’s Hass avocado
producers is less than that have been calculated for the rule. Under the 85 per cent
diversion scenario, the losses to the producers would be $12.46 million per year and
$2.50 million per year for alternatives A and B, compared to an annual producer loss of

36
$20.55 million under the proposed rule.7 However, consumer/merchandiser gains would
also be reduced in both cases. Net benefits are estimated at $6.52 million per year for A
and $3.67 million per year for alternative B, compared to $8.87 million per year for the
rule.
All three studies discussed in this section evaluate regional effects and welfare
changes of partial easing of the ban against importation of Mexican avocados using
partial equilibrium analysis. The USDA studies consider risk free cases while the Orden
and Romano study deals with the various probabilities of pest risk infections occurring.
All three studies show net welfare gain as a result of partial easing of the ban including
the Orden and Romano study under full certainty of pest risk infection. All these studies
also maintain that market forces would equalize the price of domestic avocados and
Mexican avocados in the approved states. However, as discussed before a price
differential exists between the prices of both these types of avocados as well as those
imported from Chile or New Zealand, making the point that the avocados from each
country might not be perfect substitutes for the domestic avocados. The actual Mexican
imports also have been nearly twice the import demand level of 13 million pounds in the
northeastern winter market as predicted by Orden and Romano (1996).
2.6. Summary and Conclusions
This chapter lays out the Agreement on SPS Measures in detail and discusses the
Dispute Settlement Process as outlined by the WTO and its role in bilateral negotiations
between countries trying to reform their domestic SPS rules leading to lowering of
protectionist measures and increased trade. The avocado market in the U.S. is described
with details of major players California, Chile and New Zealand and emphasis on the
special case of Mexican imports. Descriptions of the various rulings regarding imports of
Mexican avocados are provided as well. A picture of the current market and several
economic studies estimating impacts of these rulings are also presented in readiness for
the model developed to capture impacts in the avocados market developed in this study.
7 From calculations presented in USDA/APHIS (2001) $20.55 million is the figure for the aggregate total loss for producers in the regional model, when 85 percent displacement of domestic avocados occurs from the Northeastern region.

37
Chapter 3: Empirical Analysis Using a Partial Equilibrium Trade
Model
3.1. Model Description This thesis develops a perfectly competitive partial equilibrium model to represent
the U.S. avocado market. The U.S. avocado market demand is divided into 5 regions for
the base model: the approved states (combining the Northeastern and East Central States)
and the non-approved states in the Pacific, Southwest, West Central, and Southeast. The
major suppliers to the U.S. market are the domestic producers in California and imports
from Chile, Mexico, and New Zealand. The annual supply and demand are divided into
two time periods: November to February, when Mexican imports are allowed into the
Northeastern states, and March to October, when imports come in from Chile and New
Zealand but not from Mexico. Avocados from different supplying regions are treated as
imperfect substitutes in demand and so are those supplied in different time periods. Thus
there are altogether 7 products, 4 in the first time period and 3 in the second since there is
no Mexican supply in that period. The demand functions are modeled as Constant
Elasticity of Substitution (CES) functions while the supply functions are modeled as
Constant Elasticity of Transformation (CET) functions.
3.1.1. Data The trade data used for the model was obtained from the USDA Foreign Agricultural
Services online database for imports. The data for the domestic production was obtained
from the CAC Industrial Statistics and USDA studies. The benchmark data used for the
model is the average for 1997-1998 to 1999-2000 and is provided in Table 3.1. The
annual production, imports, consumption and prices data summarized in tables in the last
chapter are divided into the two time periods, t = 1,2 as mentioned above and averaged
over the three-year period. USDA studies claim that there is no statistically significant
difference in the wholesale prices in various regions (USDA/FAS, 2001). Hence prices of
avocados from a given supplier are taken as equal in all the regions of the U.S. in which
these products are available.

38
Table 3.1: Benchmark Data, Averages of 1997-98 to 1999-2000
Supply (million of pounds) Pacific Southwest West Central Northeast Southeast
Total
Price
Time Period
Country
Nov-Feb
Mar-Oct
Nov-Feb
Mar-Oct
Nov-Feb
Mar-Oct
Nov-Feb
Mar-Oct
Nov-Feb
Mar-Oct
Nov-Feb
Mar-Oct
Nov-Feb
Mar-Oct
U.S. 30.69 105.24 13.93 40.42 3.53 10.33 1.24 39.00 5.92 15.69 55.31 210.68 1.081 1.118 Chile 14.48 26.73 6.57 10.27 1.67 2.62 0.59 9.91 2.80 3.98 26.10 53.50 0.508 0.556 N Z 0.79 1.54 0.36 0.59 0.09 0.15 0.03 0.57 0.15 0.22 1.38 3.08 1.391 1.091 Mexico - - - - - - 19.74 - - - 19.74 - 0.688 - Total 45.96 133.51 20.86 51.28 5.29 13.10 21.60 49.48 8.87 19.89 102.53 267.26 - - Note: Total supply equals consumption in the region Source: USDA/FAS, 2001

39
Moreover, wholesale prices not being available for the time period under question, import
prices and prices to growers of California avocados were used in the model. In addition,
shipments of avocados to various regions from exporting countries other than Mexico are
not available. Total imports were divided amongst the various regions in the same
fraction as the domestic shipments as an assumption about their regional distribution.
3.1.2 Calibration In order to implement the model, the parameters for the CES demand functions
for avocados in the various regions of the country and during the two time periods had to
be specified. The CES utility and sub-utility functions for each demand region j, where j
are the 5 demand regions, are expressed separately for each time period t=1,2 as:
1,1
,
1
1
1
11
>=
���
���
=
�
�
=
−
=
−
σα
ασ
σ
σσ
σ
n
ii
n
iii xU
(1)
where, αi is a shift parameter to be determined by calibration, xi is the quantity of
avocados from supplying country i, n is the number of goods consumed, and σ is the
elasticity of substitution. In this model, i refers to a supplying country, and n is 4, the
number of supplying countries for the approved states in time period 1 and n = 3 for all
other regions, and for all regions in time period 2.
The demand functions for each demand region j and time period t derived from
above and the true cost of living price index for the CES function are given as:
� −
−
=
iii
iii p
Ipx )1( σ
σ
αα
and, (2)
,)1(
1
1
)1(σσα
−
=
−
���
���= �
n
iiiM pP (3)

40
where I is total expenditures on avocados in a region during a given time period, pi is the
price of good i during that period, and PM is the price index. Consumers cannot store
avocados for long and the price differential as seen from Table 3.1 is not large enough to
induce consumers to buy in a particular time period except for New Zealand, and thus it
is assumed in the model that there is no substitution between time periods by consumers.
For the calibration process, the prices of avocados from various supplying
regions, consumption in various demand regions and expenditure on avocados are
obtained from the benchmark data. The elasticity of substitution between supplying
countries within a time period is taken as 2 since domestic and imported avocados from
various regions can be considered to be good substitutes. Using equations (2) above, the
parameter values of αi for avocados from each supplying region were calculated for all of
the relevant demand regions during the two supplying time periods. The elasticity of
substitution helps determine the demand elasticities, which were calculated for both the
time periods for the U.S. and are given in Table 3.2 as per the following formula,
jt
t
t
t SyP
Py
)1( −+−=∂∂ σσ (4)
where, yt is the demand in time period t=1,2 and Pt is the price of avocados in the same
time period and Sj is the time share of avocados in the demand region
Table 3.2: Calculated Demand Elasticities for the U.S.
3.1.3 Base Model
The base model replicates the benchmark data by using the calibrated parameters.
The demand equations used in this model are CES functions as given by equation (2).
Producers maximize revenue subject to a constant elasticity of transformation function or
a production possibility frontier. The resulting functions are called revenue functions.
Supply functions for each supplying country i are derived from CET Revenue functions
of the form given by:
Pacific Southwest West Central Northeast Southeast
Nov – Feb -1.885 -1.948 -1.987 -1.995 -1.978 March-October -1.604 -1.848 -1.961 -1.853 -1.941

41
[ ],1
,)1(),(/1
21
>−+==
β
βββ VPaaPVPVPR I
(5)
with [ ] βββ /1
21 )1( PaaPPI −+=
R is the revenue function, a the shift parameter for the CET Revenue function, β
the exponent for the CET Revenue function, P1 and P2 the price of avocados during the
two time periods, PI is a price index and V the endowment for the CET Revenue
function.
The conditional supply function for each supplying country i is derived from the
CET Revenue function and can be written as
[ ] ,)1( )1(1
1
2111
VaPPaaPyPR −
−
−+==∂∂ ββ
βββ and (6)
[ ] VPaPaaPyPR )1(
2
1
2122
)1()1( −−
−−+==∂∂ ββ
βββ (7)
From equations (6) and (7), we can get:
12
11
2
1
)1( −
−
−= β
β
PaaP
yy
(8)
The parameters a and β have to be calibrated to a conditional elasticity and in this case it
is calibrated to that of time period 1. The conditional supply elasticity is obtained from
above equations for each supplying country i as:
���
���
−−+
−=∂∂
1)1(
)1(.21
1
1
1
1
1ββ
β
βPaaP
aPyP
Py
(9)
For the model, the aggregate supply elasticity is taken as 0.35 for all producers,
obtained from literature review (Romano, 1998). Export supply elasticities are then

42
calculated for Chile, New Zealand and Mexico by multiplying 0.35 by the inverse of the
export sales share for each region. Thus Chile has an export supply elasticity of 0.8997,
New Zealand 2.751 and Mexico of 6.31 based on their export sales share. For, the U.S.,
the conditional supply elasticity is calculated to be 1.667 from equation (9), assuming
that it has the same slope as the aggregate elasticity.
Equations (8) and (9) are used to solve for a and β using the benchmark data for
supply y1 and y2 and prices P1 and P2 during the two time periods used in the model. For
Mexico, a is 1 since there is no supply in the second time period and β is assumed to be
between the values calculated for Chile and New Zealand.
The endowment V is a set of factors for a particular production possibility
frontier. When price increases, producers would bring more resources into production
increasing V, and this would in turn drive up aggregate supply. Thus, V can be
represented as a linear function of an index of prices during the two time periods and this
would in turn capture the aggregate supply in the model as the following equation:
IcPbV += , (10)
where, b is the intercept for the linear function and c the slope of the function. Initially
from equation (5),
IPR
V = (11)
Using equations (5) the initial V is calculated. Then c is calculated using the
assumed supply elasticities, PI and V as per equation (12).
IPV
c ε= (12)
where, ε is the aggregate supply elasticity for the U.S. and the export supply elasticities
for Chile, New Zealand and Mexico.
Once c is known, b is obtained too by substituting V, c and PI in equation (10).
Finally, once parameters b and c are obtained, the base model can be specified.
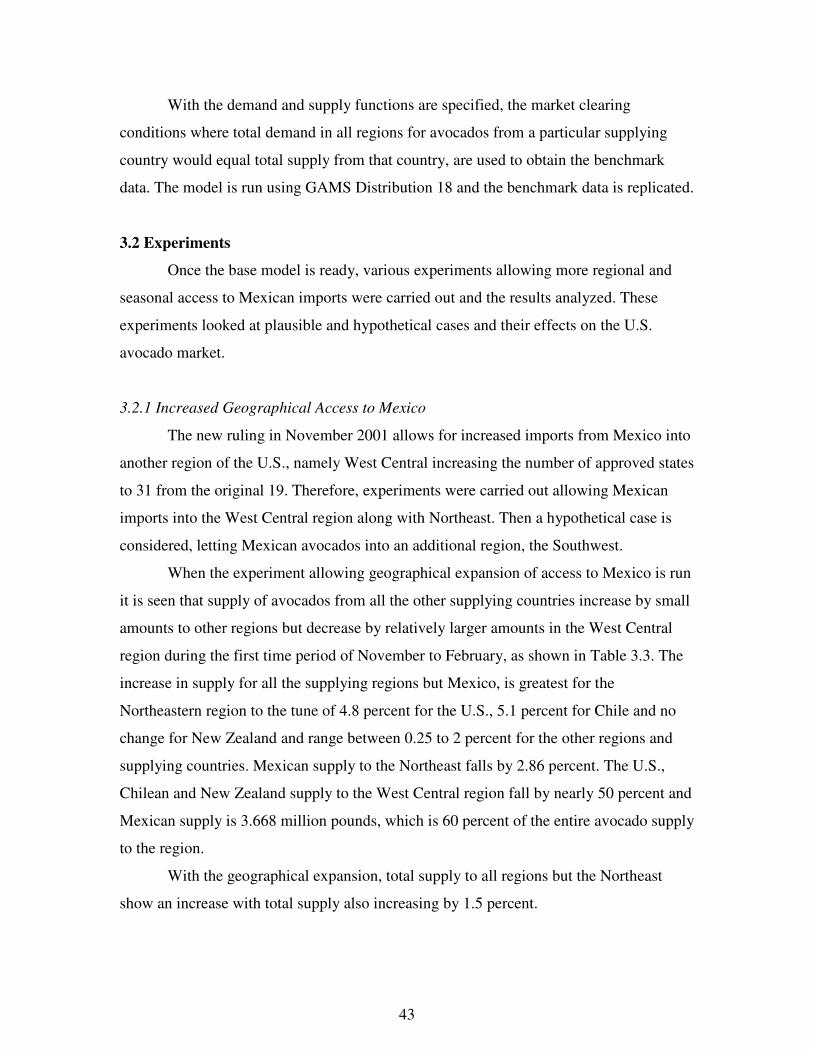
43
With the demand and supply functions are specified, the market clearing
conditions where total demand in all regions for avocados from a particular supplying
country would equal total supply from that country, are used to obtain the benchmark
data. The model is run using GAMS Distribution 18 and the benchmark data is replicated.
3.2 Experiments
Once the base model is ready, various experiments allowing more regional and
seasonal access to Mexican imports were carried out and the results analyzed. These
experiments looked at plausible and hypothetical cases and their effects on the U.S.
avocado market.
3.2.1 Increased Geographical Access to Mexico
The new ruling in November 2001 allows for increased imports from Mexico into
another region of the U.S., namely West Central increasing the number of approved states
to 31 from the original 19. Therefore, experiments were carried out allowing Mexican
imports into the West Central region along with Northeast. Then a hypothetical case is
considered, letting Mexican avocados into an additional region, the Southwest.
When the experiment allowing geographical expansion of access to Mexico is run
it is seen that supply of avocados from all the other supplying countries increase by small
amounts to other regions but decrease by relatively larger amounts in the West Central
region during the first time period of November to February, as shown in Table 3.3. The
increase in supply for all the supplying regions but Mexico, is greatest for the
Northeastern region to the tune of 4.8 percent for the U.S., 5.1 percent for Chile and no
change for New Zealand and range between 0.25 to 2 percent for the other regions and
supplying countries. Mexican supply to the Northeast falls by 2.86 percent. The U.S.,
Chilean and New Zealand supply to the West Central region fall by nearly 50 percent and
Mexican supply is 3.668 million pounds, which is 60 percent of the entire avocado supply
to the region.
With the geographical expansion, total supply to all regions but the Northeast
show an increase with total supply also increasing by 1.5 percent.

44
Table 3.3: Simulated Supply and Price Results for Increased Access to U.S. West Central Region
Supply (million of pounds) Pacific Southwest West Central Northeast Southeast
Total
Price
Time Period
Country
Nov-Feb
Mar-Oct
Nov-Feb
Mar-Oct
Nov-Feb
Mar-Oct
Nov-Feb
Mar-Oct
Nov-Feb
Mar-Oct
Nov-Feb
Mar-Oct
Nov-Feb
Mar-Oct
U.S. 31.11 105.54 14.12 40.54 1.65 10.36 1.30 39.12 6.01 15.73 54.20 211.29 1.066 1.115 Chile 14.72 26.74 6.68 10.27 0.78 2.62 0.62 9.91 2.84 4.00 25.64 53.52 0.5 0.555 N Z 0.79 1.54 0.36 0.59 0.04 0.15 0.03 0.57 0.15 0.23 1.38 3.08 1.379 1.090 Mexico - - - - 3.67 - 19.18 - - - 22.85 - 0.705 - Total 46.62 133.82 21.16 51.40 6.14 13.13 21.13 49.60 9.00 19.96 104.07 267.89 - - Note: Total supply equals consumption in the region

45
Price of U.S., Chilean and New Zealand avocados show a slight fall while that of
Mexican avocados rises in comparison from $ 0.688 to $0.705, a percentage change of
2.4 percent. The total Mexican supply increases by 15.8 percent as a result of the opening
of the market.
There are slight changes seen in the second time period of March to October as
well as a result of the increase in access provided to the Mexican avocados during the
first time period. The U.S. avocado supply to all regions in the country show a small
increase of 0.3 percent, while the Chilean supply increases slightly by 0.04 percent for all
regions while New Zealand avocado supply does not undergo any changes.
The price of the U.S. and Chilean avocados show a slight decrease of 0.27 percent
and 0.18 percent respectively while the price of New Zealand avocados does not show
any change in the second time period. The total supply of avocados in all demand
regions increases nominally by 0.24 percent for this time period.
The above results show a substitution effect between the two time periods because
supply is modeled between the two time periods as a production possibilities frontier. As
a result, changes in relative price leads to displacement of avocados from one time period
to the other. This results in somewhat mitigating the negative effect of opening up the
market for one supplying country on the other supplying countries.
Since, the major avocado producing regions are Pacific and Southeast, further
expansion seems to be possible in the Southwest region. Thus the hypothetical case is
where access to Northeast, West Central and Southwest states is provided to Mexican
avocados. As a result of this experiment, it is observed from Table 3.4 that compared to
the benchmark in Table 3.1, the supply of U.S., Chilean and New Zealand avocados
increase in all regions but West Central and Southwest during the first time period. This
increase is largest in the Northeast region with the maximum percentage increase for
Chile and U.S. of 25.0 percent and no change for New Zealand. The other two regions of
Pacific and Southeast show a very similar pattern in increase of around 7 percent for the
U.S., 8.6 percent for the Chilean and 1.3 percent for the New Zealand avocados.

46
Table 3.4: Simulated Supply Results for Increased Access to U.S. West Central and Southwest Regions
Supply (million of pounds) Pacific Southwest West Central Northeast Southeast
Total
Price
Period
Country
Nov-Feb Mar-Oct
Nov-Feb Mar-Oct Nov-Feb Mar-Oct Nov-Feb Mar-Oct Nov-Feb Mar-Oct Nov-Feb
Mar-Oct Nov-Feb Mar-Oct
U.S. 32.84 106.69 7.36 40.99 1.87 10.47 1.55 39.54 6.34 15.9 49.95 213.60 1.010 1.103 Chile 15.72 26.77 3.52 10.29 0.89 2.63 0.74 9.92 3.04 3.99 23.91 53.60 0.471 0.552 N Z 0.80 1.54 0.18 0.59 0.05 0.15 0.04 0.57 0.15 0.23 1.22 3.08 1.330 1.080 Mexico - - 12.55 - 3.18 - 17.46 - - - 33.19 - 0.763 - Total 49.36 135 23.61 51.87 5.99 13.25 19.79 50.03 9.53 20.12 108.27 270.28 - - Note: Total supply equals consumption in the region

47
The decrease for the regions where Mexican supply is now allowed is large and
similar for all the other supplying regions such that the U.S faces a decrease of 47.2
percent in both the regions while Chile bears a similar decrease of 46.4 percent while the
loss for New Zealand is nearly 44 percent in the West Central region and 50 percent in
the Southwest region.
Altogether the U.S. shows a decrease of 9.7 percent in the total supply to all
regions while Chile has a similar decrease of 8.4 percent and New Zealand of 14.3
percent. The Mexican supply to the Northeast regions falls by 11.6 percent while the total
Mexican supply increases by 68.14 percent compared to the benchmark data as a result of
the increased access. Price of all the supplying countries but Mexico show a fall while
that of Mexican avocados shows a rise.
The fall in prices are 6.6 percent for U.S., 7.3 percent for Chilean and 4.4 percent
for avocados from New Zealand while the price of Mexican avocados increases by 10.9
percent. The overall supply of avocados during this time period shows a fall of 8.4
percent in the Northeast region, and increases of 7.4 percent in the Pacific, 13.2 percent
for the West Central and Southwest regions and 7.42 percent for the Southeast region
while the total supply during this period shows an overall increase of 5.6 percent.
Mexican avocados in the West Central and Southwest provide 53.2 percent of total
demand in these regions and 88 percent in the Northeast.
As a result of the increased geographical access to the Mexican avocados in the
first time period, slight increases can be seen in the supply of avocados in the second time
period from Table 3.4. The U.S. supply to all regions increases by 1.38 percent while the
Chilean supply shows a marginal increase of 0.18 percent. There is no increase in the
supply of New Zealand avocados. The overall supply of avocados to each region
increases by around 1.13 percent as a result. The price of the U.S. avocados shows a fall
of 1.34 percent while the Chilean price falls by 0.72 percent and the New Zealand price
of avocados shows a slight fall of 0.64 percent.
3.2.2 Increased Seasonal Access to Mexico
The second run of experiments consider the case where Mexico is granted
increased seasonal access increasing the months of supply of avocados to six from the

48
original four. The new time period where Mexico supplies avocados to the Northeast
states is 15th October to 15th April.
For this experiment, the shift parameter �i for all demand regions other than the
Northeast are recalibrated to the 6 month supply and price data in the first and second
time period. This data is obtained as before from the USDA Foreign Agricultural Service
online database and is adjusted for the 15th October to 15th April by dividing the supply
during these two months by half and taking the supplies for the other 4 months as given.
For the Northeast demand region, the shift parameters for the four month period are used
since there is no observed supply for Mexico in the 6 month period. This is done only for
the first period and for the second period the �i for the Northeast region is calibrated for
the 6 month supply as done for all the other regions.
As a result of this, in the first time period, the Mexican avocado supply to the
Northeast expands to 31.96 million pounds from the 19.74 pounds that came in during the
four month access period an increase of 62 percent as seen in Table 3.5. The U.S.,
Chilean and New Zealand supplies are displaced from the Northeast and this
displacement is to the tune of 75 percent for the U.S. from the 10.94 million pounds
supplied during the 6 month period in the USDA/FAS data, 69.5 percent for Chile from
3.9 million pounds and 71 percent for New Zealand from 0.31 million pounds. So where
the supply of U.S. avocados would have increased by 9.7 million pounds in the additional
two months it only rises by 1.45 million pounds now, resulting in a loss of supply of
nearly 85 percent. Similarly, for Chile, in the six month period, the supply would have
increased by 3.4 million pounds, but because of Mexican access, this increase is limited
to 0.6 million pounds, a loss of 82 percent and for New Zealand the loss is of nearly 80
percent.
The displaced supply from the other countries is moved partly into the other
demand regions and also into the second time period. Total supply rises even though the
U.S., Chile and New Zealand supplies fall. Prices for U.S., Chile and New Zealand fall
from the 6 month period without Mexican access while the Mexican price rises to $0.756
from the benchmark average of $0.688, an increase of nearly 10 percent.

49
Table 3.5: Simulated Supply and Price Results for Increased Seasonal Access to Northeast Regions
Supply (million of pounds) Pacific Southwest West Central Northeast Southeast
Total
Price
Time Period
Country
Oct-Apr Apr-Oct Oct-Apr Apr-Oct Oct-Apr Apr-Oct Oct-Apr Apr-Oct Oct-Apr Apr-Oct Oct-Apr Apr-Oct Oct-Apr Apr-Oct
U.S. 56.59 81.86 24.02 30.89 5.90 8.09 2.69 31.89 9.38 12.31 98.58 165.05 1.026 1.123 Chile 20.14 21.42 8.55 8.08 2.10 2.12 1.19 8.35 3.22 3.21 35.31 43.19 0.498 0.554 N Z 1.56 0.82 0.66 0.31 0.16 0.08 0.09 0.32 0.26 0.12 2.73 1.66 1.179 1.109 Mexico - - - - - - 31.96 - - - 31.96 - 0.756 - Total 78.29 104.41 33.23 39.28 8.16 10.29 36.13 40.56 12.86 15.64 168.58 209.90 - -

50
Table 3.6: Simulated Supply and Price Results for Increased Seasonal and Geographical Access (West Central Region added)
Supply (million of pounds) Pacific Southwest West Central Northeast Southeast
Total
Price
Time Period
Country
Oct-Apr Apr-Oct Oct-Apr Apr-Oct Oct-Apr Apr-Oct Oct-Apr Apr-Oct Oct-Apr Apr-Oct Oct-Apr Apr-Oct Oct-Apr Apr-Oct
U.S. 57.89 82.57 24.57 31.16 0.77 8.16 2.92 32.17 9.59 12.42 95.74 166.48 1.003 1.114 Chile 20.58 21.45 8.74 8.09 0.34 2.12 1.29 8.36 3.41 3.23 34.36 43.24 0.487 0.551 N Z 1.56 0.82 0.66 0.31 0.03 0.08 0.09 0.32 0.26 0.12 2.60 1.66 1.164 1.103 Mexico - - - - 7.99 - 30.28 - - - 38.28 - 0.791 - Total 80.03 104.84 33.97 39.56 9.13 10.36 34.58 40.85 13.26 15.77 170.98 211.38 - - Note: Total supply equals consumption in the region

51
When Mexico is granted access to the West Central region with an increased time
period of six months, during the first time period, the supply of avocados from the other
countries decreases in all regions but the Northeast states as can be seen in Table 3.7. The
U.S., Chilean and New Zealand supplies in the Northeast increase by 7 to 8.5 percent,
from if Mexico was granted access to only the Northeast region for the six month time
period. The Mexican supply to the Northeast though falls by 5.2 percent. Supply to the
Pacific and Southeast regions increases for the U.S., Chile and New Zealand.
Total Mexican supply is now 38.28 million pounds, up 19.8 percent from when
seasonal access is increased in the Northeastern region only and 93.9 percent from the
four month supply period. The Mexican supply now contributes 87.8 percent to total
supply in the Northeastern and the West Central regions. Prices of the U.S., Chilean and
New Zealand avocados fall while the Mexican prices rise nearly another 5 percent above
the price after expansion of import period to six months in the Northeast and 15 percent
above the benchmark price when Mexico had access only for 4 months.
During the second time period, all the demand regions see a slight increase in
supply from all the supplying countries. Total supply during this time period as a result
increases even though there is a slight fall in prices for these countries during the second
time period as well. But relative prices being higher during the second time period,
suppliers choose to sell more during that period. Total supply during both periods though
increases by nearly 1.4 percent and 0.7 percent respectively.
The second experiment where access is granted to the Southwest region in
addition to the West Central for six months of the year shows increases in supply for the
U.S., Chile and New Zealand in all demand regions other than the West Central and
Southwest, during the first time period as per Table 3.7. The U.S. and Chile show similar
increases of 46 percent in the Northeast states and 13 percent in the Pacific and Southeast
states from the six month supply period in the Northeast. Both of these supplying
countries show a decline in supply to the West Central and Southwest states of over 78
percent for Chile and 82 percent for the U.S. from the Northeast expanded time period
again. New Zealand shows increases of 31 percent in the Northeast states and 1.2 percent
in the Pacific. The decrease of avocados supplied by New Zealand to the West Central
and Southwest regions was nearly 81 percent.

52
Table 3.7: Simulated Supply and Price Results for Increased Seasonal and Geographical Access (West Central and Southwest Regions Added)
Supply (million of pounds) Pacific Southwest West Central Northeast Southeast
Total
Price
Time Period
Country
Oct-Apr Apr-Oct Oct-Apr Apr-Oct Oct-Apr Apr-Oct Oct-Apr Apr-Oct Oct-Apr Apr-Oct Oct-Apr Apr-Oct Oct-Apr Apr-Oct
U.S. 63.91 85.55 4.23 32.29 1.04 8.46 3.94 33.33 10.59 12.87 83.71 172.50 0.910 1.077 Chile 22.66 21.56 1.87 8.13 0.46 2.13 1.74 8.40 3.78 3.24 30.47 43.46 0.442 0.541 N Z 1.58 0.83 0.12 0.32 0.03 0.08 0.17 0.33 0.26 0.13 2.11 1.68 1.105 1.079 Mexico - - 27.38 - 6.72 - 25.47 - - - 59.56 - 0.908 - Total 77.5 103.74 34.65 39.15 8.27 10.26 40.86 40.42 12.84 15.60 171.35 209.17 - - Note: Total supply equals consumption in the region

53
The total avocado supply by Chile decreases by 5.8 percent from the increased
seasonal access to the Northeast only, while that of the U.S. by 2.8 percent and New
Zealand declines by nearly 14 percent. Mexican avocado supply to the Northeast states
decreases by 20 percent while the supply to the West Central and Southwest regions of
6.72 and 27.34 million pounds forms nearly 79 to 81 percent of the total supply in these
regions.
Total supply of Mexican avocados increases by over 86 percent from increased
seasonal access in the Northeast only and is over 200 percent of the avocado supply
during the four winter months. The prices of U.S., Chilean and New Zealand avocados
show a fall and that of Mexican avocados shows an increase of 20 percent from the six
month period price in Northeast and more than 31 percent over the four month period
supply. Moreover, for the first time Mexican and U.S. prices are comparable at 0.908 and
0.910 respectively.
The second time period with increased access to both West Central and Southwest
results in increased supplies to all regions for the U.S. and Chile, with not much change
for the New Zealand supply. The price of U.S., Chilean and New Zealand avocados falls
during this period. The total supply to all the states increases by 0.5 percent in spite of the
decrease in total U.S., Chilean and New Zealand supplies.
3.3 Sensitivity Analysis
The supply and demand elasticities were also varied to obtain a series of runs for
the sensitivity analysis. First the supply elasticities were doubled and then halved. The
demand elasticities were similarly halved and doubled and finally both elasticities were
changed. When access is increases to the West Central region the range of values
obtained for total supply and prices are presented in Table 3.8. The changes for supply as
well as price for all the supplying countries are not very high.
When access to Mexican avocados is granted in the Southwest as well as the West
Central regions, the range of supplied quantities seen in the sensitivity analysis is larger
than the previous case. As per Table 3.9, the largest change is seen in the case of Mexico
where the change is as much as 19 percent of the minimum quantity supplied. The

54
largest price change of nearly 16 percent is also for Mexico while for the other supplying
countries the price change ranges between 5 and 6 percent.
Table 3.8: Sensitivity Analysis Results for Increased Access to U.S. West Central Regions Total Supply
During Nov-Feb
Price Total Supply
During Mar-Oct
Price
Max Min Max Min Max Min Max Min
U.S. 54.355 53.923 1.071 1.064 211.503 211.194 1.115 1.114
Chile 25.819 25.273 0.503 0.498 53.560 53.503 0.556 0.554
N Z 1.557 1.364 1.384 1.316 3.084 2.674 1.144 1.089
Mexico 23.624 22.108 0.718 0.698 - - - -
Table 3.9: Sensitivity Analysis Results for Increased Access to U.S. West Central and
Southwest regions Total Supply
During Nov-Feb
Price Total Supply
During Mar-Oct
Price
Max Min Max Min Max Min Max Min
U.S. 50.314 48.547 1.071 1.003 214.014 213.336 1.115 1.103
Chile 24.768 22.501 0.480 0.456 53.792 53.426 0.554 0.551
N Z 1.297 1.182 1.357 1.285 3.100 2.658 1.140 1.082
Mexico 36.406 30.620 0.808 0.698 - - - -
The new set of sensitivity analysis runs are carried out for the increased seasonal
access provided to Mexican avocados along with geographical expansion into the West
Central region and the West Central and Southwest together. The various elasticity
combinations worked out for this expanded period as well as geographical regions look at
doubling all supply elasticites, doubling supply elasticities of Chile, New Zealand and
Mexico, doubling only the supply elasticity of Mexico, doubling both supply elasticities

55
for Chile, New Zealand and Mexico as well as the demand elasticities in all the demand
regions.
For the seasonal as well as geographical expansions the maximum and minimum
values of the various supplies and prices are shown in Table 3.10. The maximum changes
are for the U.S. supply in time period one where the change amounts to 2.4 percent above
the minimum value. For Mexico the change amounts to 2.2 percent again and it is 3.1
percent for Chile and around 3 percent for New Zealand. During the time period 2 the
changes are much smaller. The largest price changes too are in the first time period
amounting to 1.8 percent for the U.S., 2.3 percent for Chile, 1.9 percent for New Zealand
and 0.4 percent for Mexico.
Table 3.10: Sensitivity Analysis Results for Increased Seasonal and Geographical Access (West Central added)
Total Supply
During Oct-Apr
Price Total Supply
During Oct-Apr
Price
Max Min Max Min Max Min Max Min
U.S. 96.025 93.966 1.021 1.003 166.531 166.128 1.117 1.114
Chile 34.251 33.223 0.498 0.487 43.150 42.921 0.554 0.552
N Z 2.570 2.493 1.198 1.176 1.628 1.578 1.132 1.112
Mexico 40.923 40.028 0.747 0.744 - - - -
The next round of sensitivity analysis runs were made for the increased seasonal
as well as geographic access to both the West Central as well as Southwest regions of the
U.S. and can be seen in Table 3.11. Once again changes up to 7.8 percent are seen for the
U.S. supply over the minimum value during the first time period and of 8.6 for Chile and
4.4 percent for New Zealand and 5.6 percent for Mexico. The price changes are at 4.8
percent for U.S., 5.7 percent for Chile, 4.4 percent for New Zealand and 1.2 percent for
Mexico. During the second time period the changes are slight again.

56
Table 3.11: Sensitivity Analysis Results for Increased Seasonal and Geographical Access (West Central and Southwest added)
Total Supply
During Oct-Apr
Price Total Supply
During Oct-Apr
Price
Max Min Max Min Max Min Max Min
U.S. 85.363 79.166 0.951 0.907 172.719 171.553 1.085 1.076
Chile 30.238 27.854 0.466 0.441 43.381 42.722 0.546 0.542
N Z 2.043 1.957 1.163 1.114 1.648 1.559 1.117 1.089
Mexico 67.476 63.849 0.820 0.81 - - - -

57
Chapter 4: Discussion and Conclusions
This study looks at the effects of phytosanitary and sanitary barriers on trade and
examines the case of Mexican avocados as a successfully negotiated example of trade
liberalization. It develops a partial equilibrium model to study the changes in supply and
prices of domestic and imported avocados when the market is partially opened to trade
with Mexico.
An introduction to the avocados market in the U.S. is provided in Chapter 1 where
the problem statement is presented along with the objectives and methodology. The study
examines the effects on demand, supply, imports, and prices of partial easing of sanitary
and phytosanitary (SPS) barriers to trade in the U.S. market in the case of Mexican
avocados. This section brings out the importance of the SPS Agreement of the WTO that
provides a framework for countries to resolve their trade disputes. The objectives and
methodology are also laid out in this chapter whereby the model developed in this study
would measure the empirical magnitudes of the effects on price, quantities of imports,
domestic production as result of changes in the technical barrier against imports of
avocados from Mexico in the case where there is zero risk of pest infestation.
The second chapter provides an overview of the U.S. avocado market in general.
It starts by detailing the SPS Agreement and its provisions and gives a short summary of
the dispute settlement process at the WTO. Implications of the SPS Agreement are also
discussed and three prominent SPS cases, The EC-Hormones, Australia – Salmon and
Japan - Varietals cases are analyzed in this context. This chapter then explores the U.S.
avocados market and examines the domestic industry and trends therein, as well as
production in Chile and New Zealand. The special case of Mexico is then discussed and
the U.S. Mexico avocado dispute is investigated in some detail. The political economy of
the case is presented covering events of nearly the last 90 years. From the total ban
against imports of Mexican avocados in 1914 to the first ruling in 1997 allowing Mexican
avocados to enter the 19 Northeastern states and then the expansion of this ruling in 2001
to allow access into 31 states of the Northeast as well as West Central, this chapters
covers the negotiation process between Mexico and the U.S. It also highlights the
systems approach method for pest risk mitigation, which brings about the trade

58
liberalization process. Market development since the 1997 import rule are also discussed
and so are three economic assessment studies including risk assessments.
The third chapter develops the model and carries out the various experiments and
presents the results. These results are summarized below.
4.1 Summary of Results
Two sets of experiments are run on the partial equilibrium model developed in
this study. The base model replicates the benchmark data, which is an average of 1997-98
to 1999-2000. The first set of experiments allow more geographical access to Mexican
avocados and the second set of experiments allow more seasonal as well as geographical
access. As a result of geographical expansion in the West Central region, Mexican
avocado imports increase by 16 percent and by nearly 94 percent when the seasonal
access is also increased to 6 months from the original 4 months. In the hypothetical
condition that further access is provided to another region, the Southwest, the increase in
geographical access leads to an increase of 68 percent in the supply, and with the increase
also in seasonal and geographical access, the increase is over 200 percent. The Mexican
supply of avocados forms 5.3 percent of total supply in the benchmark data that is used in
the study and increases to 6.1 percent when the geographical access is increased to West
Central and to 8.8 percent with a further increase in geographical access to include the
Southwest. When the seasonal as well as geographical access is increased to include West
Central, the Mexican supply increases to 10 percent, and to 15.67 percent when the
Southwest is opened to Mexican avocados as well.
The significant results of this analysis are that Mexican imports largely increase
when the market is opened up as would be expected. Domestic supply as well as imports
from Chile and New Zealand fall when Mexican imports are allowed further access,
while consumption and thus overall supply rises. Prices of Californian, Chilean and New
Zealand avocados all show fall in prices while the price of Mexican avocados shows an
increase. When the price of the Mexican avocados increases consumption drops in the
regions where they had already been introduced. In the regions where access is granted
there is a displacement of domestic avocados and those from Chile and New Zealand, and
the new supply consists mainly of avocados from Mexico. Selling in the second time

59
period when there are no Mexican imports rises because of the higher relative price in the
second time period and this offsets part of this displacement. Supply of avocados in the
regions which do not have access to the Mexican avocados rises since the price of
avocados falls across all regions and avocados are partially displaced from the approved
states to the rest of the country.
4.1.1. Comparisons with Other Economic Analysis Studies
The first USDA economic evaluation study that has been discussed in this study
was carried out for the proposed rule in 1995 before allowing exports of Mexican
avocados in the Northeast region. This study had predicted that allowing imports of
Mexican avocados would increase the supply of avocados in the U.S. by 12 percent and
cause the price of domestic avocados to fall by a similar 12.5 percent. The regulatory
flexibility analysis also arrived at a similar result where price would decrease and
domestic supply be displaced. Since our study considers access to the Northeast region as
the benchmark direct comparisons cannot be made with this particular study but the
pattern is similar. The second study was carried out by Orden and Romano (1996) and
Romano (1998) and it included pest infestation risk in the analysis framework. They too
predicted displacement of domestic avocados from the northeastern region and their
absorption in other parts as a result of expanding consumption and reduced domestic
supply in case the ban were partially lifted and fall in prices of domestic avocados. This
too is similar to the trends observed in the model developed in this study. This study in
addition also looks at the effects on the Chilean and New Zealand imports and also at the
movements of supply in all demand regions.
4.1.2 Comparisons with Current Data
As a last step, the quantity of avocados supplied in the U.S. market during 2001-
02 and 2002-03 are presented so that comparisons can be made with the results obtained
for the model in this study.

60
Table 4.1: Current Data for U.S. Production of Avocados and Imports, in millions of pounds and dollars/pound
U.S. Chile N.Z. Mexico
Supply Price Supply Price Supply Price Supply Price
Oct-Apr Apr-Oct Oct-Apr Apr-Oct
Oct-Apr Apr-Oct Oct-Apr Apr-Oct Oct - Apr Apr - Oct Oct - Apr Apr - Oct Oct - Apr Oct - Apr
Total
2001-02 131.52 238.13 0.791 1.012 87.63 55.85 0.492 0.492 4.01 2.138 0.541 0.849 53.3 0.635 572.6 2002-03 112.95 - 0.919 - 129.11 - 0.438 - 2.01 - 0.77 - 124.72 0.343 368.8*
* Total is for Oct-Apr only
Source: CAC (2003), USDA/FAS (2003)
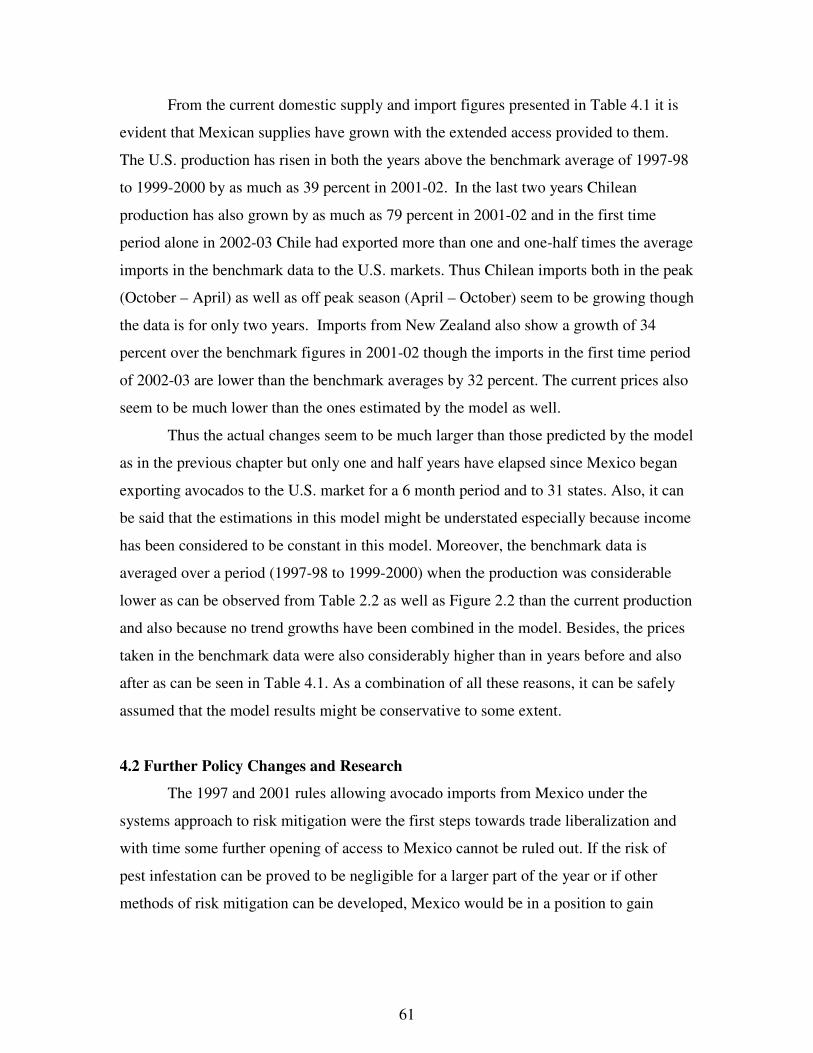
61
From the current domestic supply and import figures presented in Table 4.1 it is
evident that Mexican supplies have grown with the extended access provided to them.
The U.S. production has risen in both the years above the benchmark average of 1997-98
to 1999-2000 by as much as 39 percent in 2001-02. In the last two years Chilean
production has also grown by as much as 79 percent in 2001-02 and in the first time
period alone in 2002-03 Chile had exported more than one and one-half times the average
imports in the benchmark data to the U.S. markets. Thus Chilean imports both in the peak
(October – April) as well as off peak season (April – October) seem to be growing though
the data is for only two years. Imports from New Zealand also show a growth of 34
percent over the benchmark figures in 2001-02 though the imports in the first time period
of 2002-03 are lower than the benchmark averages by 32 percent. The current prices also
seem to be much lower than the ones estimated by the model as well.
Thus the actual changes seem to be much larger than those predicted by the model
as in the previous chapter but only one and half years have elapsed since Mexico began
exporting avocados to the U.S. market for a 6 month period and to 31 states. Also, it can
be said that the estimations in this model might be understated especially because income
has been considered to be constant in this model. Moreover, the benchmark data is
averaged over a period (1997-98 to 1999-2000) when the production was considerable
lower as can be observed from Table 2.2 as well as Figure 2.2 than the current production
and also because no trend growths have been combined in the model. Besides, the prices
taken in the benchmark data were also considerably higher than in years before and also
after as can be seen in Table 4.1. As a combination of all these reasons, it can be safely
assumed that the model results might be conservative to some extent.
4.2 Further Policy Changes and Research
The 1997 and 2001 rules allowing avocado imports from Mexico under the
systems approach to risk mitigation were the first steps towards trade liberalization and
with time some further opening of access to Mexico cannot be ruled out. If the risk of
pest infestation can be proved to be negligible for a larger part of the year or if other
methods of risk mitigation can be developed, Mexico would be in a position to gain

62
further access. This might not be far off in the future either as the success of the
expansion program has been a positive step towards this aim.
The latest on the Mexican avocado story is that USDA has been approached by
Mexico to allow free access into the U.S. markets. APHIS has since carried out risk
assessment studies allowing Mexican imports into all 50 states throughout the whole
year. According to this study, the most likely annual number of avocados infested with
one of the five pathway pests identified by APHIS, that can possibly be imported from
Mexico under free trade is zero. They claim that the systems approach without seasonal
and geographical restrictions is an effective method for mitigation of risk. The
approximate range of Hass avocados imports from Mexico when allowed to enter the
U.S. all year round, would be between 275 and 413 million pounds. In 2002, the avocado
imports summed up to 59 million pounds and is expected to increase four to seven fold in
a free trade scenario. In five years, the approximated range could become 295 to 442
million pounds a year (USDA, 2003).
From the latest study from APHIS it seems that the possibility of opening up the
whole of U.S. to imports from Mexico might not be too distant now. Further research is
suggested on developing a free trade scenario based on the model created in this study.
This model could provide alternative results to the ones presented by USDA as well as
provide the larger picture when countries with growing avocado production targeted
towards the U.S. market are also taken into account.

63
References
Abbott, Frederick M. 1997. “The Intersection of Law and Trade in the WTO System: Economics and the Transition to a Hard Law System” in Understanding Technical Barriers to Agricultural Trade (David Orden and Donna Roberts, editors), St. Paul, MN: International Agricultural Trade Research Consortium, Department of Applied Economics, University of Minnesota. American Farm Bureau. 1991. “NAFTA: Effects on Agriculture,” Fruit and Vegetable Issues No. 4, American Farm Bureau Research Foundation. Brown, Mike. 2001. “Marketing Hass Avocados in the U.S.,” Presentation prepared for SAAGA by Fresh Directions International, Ventura, California. Carman, Holy F. and R. Kim Craft. 1998. “An Economic Evaluation of California Avocado Industry Marketing Programs: 1961 – 1995” Giannini Foundation Research Report Number 345, July. Caswell, Julie. 2000. “Overview” in Incorporating Science, Economics, and Sociology in Developing Sanitary and Phytosanitary Standards in International Trade: Proceedings of a Conference, National Research Council. California Avocado Commission. 2000. “Industry Statistical Data.” < http://www.avocado.org/commission/2000_278.php?sd=commission> California Avocado Commission. 2002. “New Study Reveals Avocados Highest Fruit Source of Vitamin E and other disease fighting Nutrients” <http://www.avocados.org/health/health_461.php?sd=media> California Avocado Commission. 2003. “The Commission: Pounds and dollars by Variety” < http://www.avocados.org/commission/comm_574.php?sd=commission> Field Talk. 2002. “Avocado Commission sues USDA,” Weekly enewsletter. Rincon Publishing, Jan7 Firko, M.J. 1995. “Importation of Avocado Fruit (Persea americana) from Mexico. Supplemenatal Pest Risk Assessment. APHIS/USDA, pp. 40, May. Fintrac, Inc.2001-02. “Avocado,” Hillside Agricultural Program, Product Bulletin # 4 Gascoine, Digby. 2000. “WTO Dispute Settlement: Lessons learnt from the Salmon Case.” Paper presented at the Conference on International Trade Education and Research: Managing Globalization for Prosperity, Melbourne, Australia, 26-27 October. <http://www.arts.monash.edu.au/ausapec/gascoine.PDF >

64
Henson, Spencer and Rupert Loader.1999. “Impact of Sanitary and Phytosanitary Standards on Developing Countries and the Role of the SPS Agreement”. Agribusiness Vol 15, No. 3. pp. 355-369. Hoeflich, Walther Enkerlin. 2000. “Role of Science in Solving Pest Quarantine Problems: Hass Avocado Case Study,” in Incorporating Science, Economics, and Sociology in Developing Sanitary and Phytosanitary Standards in International Trade: Proceedings of a Conference, National Research Council. Josling, Roberts and Orden, forthcoming, Food Regulations and Trade: Towards a Safe and Open Global System, Institute of International Economics Nairn, M.E., P.G. Allen, A.R. Inglis and C. Tanner. 1996. “Australia Quarantine a Shared Responsibility.” Canberra: Department of Primary Industries and Energy. North American Free Trade Agreement between the Government of the United States of America, The Government of Canada and the Government of the United Mexican States. 1993. Chapter 7: Agriculture and Sanitary and Phytosanitary Measures, Section B. Government Printing Office. Nyrop, J.P. 1995. “A Critique of the Risk Management Analysis for Importation of Avocados from Mexico.” Document prepared under contract by the Florida Avocado and Lime Committee, presented at the Washington D.C. public hearing on APHIS rule on Mexican avocados, pp. 26 Orden, David. 2002. “Mexico-U.S. Avocado Trade Expansion.” Paper presented at the conference on Keeping the Border Open, sponsored by the Policy Disputes Information Consortium, Puerto Vallarta, Mexico, March. Pauwelyn, Joost. 1999. “The WTO Agreement on Sanitary and Phytosanitary (SPS) Measures as Applied in the First Three SPS disputes, EC – hormones, Australia – Salmon and Japan – Varietals.” Journal of International Economic Law pp. 641-664. Roberts, Donna and David Orden. 1996. “Determinants of Technical Barriers to Trade: The Case of U.S. Phytosanitary Restrictions in Mexican Avocados, 1972-1995,” in Understanding Technical Barriers to Agricultural Trade (David Orden and Donna Roberts, editors), St. Paul, MN: International Agricultural Trade Research Consortium, Department of Applied Economics, University of Minnesota. Roberts, Donna, Timothy Josling and David Orden 1998. Technical Barriers to Trade: An Analytic Framework, USDA/ERS Agricultural Economic Report 1876, March. Roberts, Donna. 1998. “Preliminary Assessments of the Effects of the WTO Agreement on Sanitary and Phytosanitary Trade Regulations”, Journal of International Economic Law, pp. 377 – 405.

65
Roberts, Donna. 2000. “Sanitary and Phytosanitary Risk Management in the Post-Uruguay Round Era: An Economic Perspective”, in Incorporating Science, Economics, and Sociology in Developing Sanitary and Phytosanitary Standards in International Trade: Proceedings of a Conference, National Research Council. Romano, Eduardo. 1998. “Two Essays on the Sanitary and Phytosanitary Regulations affecting Mexico-U.S. Agricultural Trade” Ph.D. thesis submitted to Virginia Tech. Schuh, G. Edward. 2000. “Historical and Social Science Perspectives on the Role of Risk Assessment and Science in Protecting the Domestic Economy: Some Background” in Incorporating Science, Economics, and Sociology in Developing Sanitary and Phytosanitary Standards in International Trade: Proceedings of a Conference, National Research Council. Stanton, Gretchen Heimpel. 2001. “The WTO Dispute Settlement Framework and Operation” in The Economics of Quarantine and the SPS Agreement (Kym Anderson, Cheryl Mcrae and David Wilson, editors), Centre for International Economic Studies, Adelaide and AFFA Biosecurity Australia, Canberra. Swinbank, Alan.1999.”The Role of WTO and the International Agencies in SPS standard Setting.” Agribusiness, Vol. 15, No. 3, pp 323-333 United States Department of Agriculture/Economic Research Service.1995. “Avocados: An Economic Assessment of the Feasibility of Providing Multi-Peril Crop Insurance,” Unpublished report prepared in co-operation with the University of California for the Federal Crop Insurance Corporation, Diane Bertelsen (Coordinator), Feb 23. United States Department of Agriculture (USDA). 1995. “Notice of Proposed Rule on Importation of Hass Avocados.” Federal Register 7 CFR Part 319, Docket 94-116-3, pp. 34832-34842, July 3. United States Department of Agriculture (USDA). 1997. “Importation of Hass Avocado Fruit Grown in Michocan, Mexico.” Federal Register 7 CFR Part 319, Docket 94-116-5, February 5. United States Department of Agriculture/ Foreign Agricultural Service. 2000. “Chile Avocado Annual Report 2000,” Global Agriculture Information Network (GAIN) Report # CI0046, November. United States Department of Agriculture, Animal and Plant Health Inspection Service (USDA/APHIS). 2001. “Regulatory Impact and Regulatory Flexibility Analysis: The Potential Economic Impact of Expanded Importation of Hass Avocados from Mexico.” October. United States Department of Agriculture (USDA). 2001. “Mexican Hass Avocado Import Program: Final Rule.” Federal Register 7 CFR Part 319, Docket 00-003-4, pp. 55530-55552, November 1.

66
United States Department of Agriculture/Foreign Agricultural Service. 2002. “U.S. Trade Imports – HS – 6 Digit Codes.” FASonline < http://ffas.usda.gov/ustrade/USTImHS6.asp?QI=> United States Department of Agriculture/Foreign Agricultural Service. 2003. “U.S. Trade Imports – HS – 6 Digit Codes.” FASonline < http://ffas.usda.gov/ustrade/USTImHS6.asp?QI=> United States Department of Agriculture, Animal and Plant Health Inspection Service, Plant Protection and Quarantine, Center for Plant Health Science and Technology (USDA/APHIS/PPQ/CPHST). 2003. “Importation of ‘Hass’ Avocado Fruit (Persea Americana cv. Hass) from Mexico: A Risk Assessment <http://www.aphis.usda.gov/ppq/avocados/6-13-03CPHST.PDF> Vogel, David. 1995. Trading Up: Consumer and Environmental Regulations in a Global Economy. Cambridge, Mass.: Harvard University Press. Vogel, David. 1999. “The Hass Avocado Case: A Political Science Perspective,” in Incorporating Science, Economics, and Sociology in Developing Sanitary and Phytosanitary Standards in International Trade: Proceedings of a Conference, National Research Council. World Trade Organization. 1994. The Results of the Uruguay Round of Multilateral Trade Negotiations: The Legal Texts. GATT Secretariat, Geneva, Switzerland. WT/DS245. 2002. “Japan - Measures affecting the Importation of U.S. Apples”. Oral Statement of the United States at the First Panel Meeting, October 21.

67
APPENDIX
Experiment Results Geographical Access Increased Seasonal Access Variable Base
Model West
Central West Central
Southwest Northeast West
Central West Central
Southwest VAR X1 - Demand of avocados in various regions during first time period
CH.NE 0.59 0.62 0.74 1.19 1.29 1.74 CH.PA 14.48 14.72 15.72 20.35 20.58 22.66
CH.WC 1.67 0.78 0.89 2.10 0.34 0.46 CH.SW 6.57 6.68 7.36 8.55 8.74 1.87 CH.SE 2.8 2.84 3.04 3.34 3.41 3.76
CAL.NE 1.24 1.30 1.55 2.69 2.92 3.94 CAL.PA 30.69 31.11 32.84 56.59 57.89 63.91
CAL.WC 3.53 1.65 1.87 5.90 0.77 1.04 CAL.SW 13.93 14.12 7.36 24.02 24.57 4.23 CAL.SE 5.92 6.01 6.34 9.38 9.59 10.59
NZ.NE 0.03 0.03 0.04 0.09 0.09 0.12 NZ.PA 0.79 0.79 0.8 1.56 1.56 1.58
NZ.WC 0.09 0.04 0.05 0.16 0.03 0.03 NZ.SW 0.36 0.36 0.18 0.66 0.66 0.12 NZ.SE 0.15 0.15 0.15 0.26 0.26 0.26
MX.NE 19.74 19.18 17.46 31.96 30.28 25.47 MX.PA - - - - - -
MX.WC - 3.67 3.18 - 7.99 6.72 MX.SW - - 12.55 - - 27.38 MX.SE - - - - - -
VAR X2 Demand of avocados in various regions during second time period CH.NE 9.91 9.91 9.92 8.35 8.36 8.40 CH.PA 26.73 26.74 26.77 21.42 21.45 21.55
CH.WC 2.62 2.62 2.63 2.12 2.12 2.13 CH.SW 10.27 10.27 10.29 8.08 8.09 8.13 CH.SE 3.98 4.0 3.99 3.22 3.23 3.24
CAL.NE 39.00 39.12 39.94 31.89 32.17 33.33 CAL.PA 105.24 105.54 106.69 81.86 82.57 85.55
CAL.WC 10.33 10.36 10.47 8.09 8.16 8.46 CAL.SW 40.42 40.54 40.99 30.89 31.16 32.29 CAL.SE 15.69 15.73 15.9 12.31 12.42 12.87
NZ.NE 0.57 0.57 0.57 0.32 0.32 0.33 NZ.PA 1.54 1.54 1.54 0.82 0.82 0.83
NZ.WC 0.15 0.15 0.15 0.08 0.08 0.08 NZ.SW 0.59 0.59 0.59 0.31 0.31 0.32 NZ.SE 0.22 0.23 0.23 0.12 0.12 0.13
MX.NE - - - - - -

68
Geographical Access Increased Seasonal Access Variable Base Model West
Central West
Central Southwest
Northeast West Central
West Central Southwest
MX.PA - - - - - - MX.WC - - - - - - MX.SW - - - - - - MX.SE - - - - - -
VAR Y1 Supply of avocados during first time period CH 26.1 25.64 23.91 35.31 34.36 30.47
CAL 55.31 54.2 49.95 98.58 95.74 83.71 NZ 1.38 1.38 1.22 2.73 2.60 2.11
MX 19.74 22.85 33.19 31.96 38.28 59.56 VAR Y2 Supply of avocados during second time period
CH 53.50 53.52 53.6 43.19 43.24 43.46 CAL 210.68 211.29 213.6 165.05 166.48 172.50
NZ 3.08 3.08 3.08 1.66 1.66 1.68 MX - - - - - -
VAR V Endowment for CET Revenue Function CH 79.70 79.29 77.78 78.67 77.84 74.52
CAL 266.04 265.58 263.88 264.30 263.11 258.40 NZ 4.61 4.56 4.37 4.40 4.27 3.79
MX 19.74 22.85 33.19 31.96 38.28 59.56 VAR P1 Price during first time period
CH 0.508 0.5 0.471 0.498 0.487 0.442 CAL 1.081 1.066 1.01 1.026 1.003 0.910
NZ 1.391 1.379 1.33 1.179 1.164 1.105 MX 0.688 0.705 0.763 0.756 0.791 0.908
VAR P2 Price during second time period CH 0.556 0.555 0.552 0.554 0.551 0.541
CAL 1.118 1.115 1.103 1.123 1.114 1.077 NZ 1.091 1.09 1.08 1.109 1.103 1.079
MX - - - - - -

69
Vita
Nishita Bakshi Qualifications: Masters in Agriculture and Applied Economics (July, 2003) Dept. of Agriculture and Applied Economics Virginia Polytechnic Institute & State University Blacksburg, VA Post Graduate Diploma in Forestry Management (April, 1999) Indian Institute of Forestry Management Bhopal, India Bachelor of Science (June, 1997) MCM DAV College for Women Chandigarh, India Experience: Graduate Research Assistant (November 2000- December 2002) Dept. of Agriculture and Applied Economics Virginia Polytechnic Institute & State University Blacksburg, VA Senior Research Fellow (April 1999-September 2000) World Bank sponsored project titled, “Economic Valuation of the Bhoj Wetland for Sustainable Use”