sanix incorporated
TRANSCRIPT

SANIX INCORPORATED
Consolidated Financial Summary
For the Fiscal Year ended March 31, 2014
.
The financial figures in this document are based on Japanese Accounting Standards and accompanying laws. Amounts are rounded off to 1
decimal place. This document is an English translation of the Japanese-language original.

May 14, 2014
Consolidated Financial Statements
For the Fiscal year ended March 31, 2014
SANIX INCORPORATED
Stock Listed: Tokyo Stock Exchange First Section, Osaka Stock Exchange First Section, Fukuoka Stock Exchange
Code No.: 4651
URL: http://sanix.jp/index_e.htm
President and CEO: Shin-ichi MUNEMASA
Contact: Kozo INOUE, Management Corporate Officer, General Manager, Management and Planning Division
1. Consolidated Financial Highlights for the Year ended March 31, 2014
(April 1, 2013 to March 31, 2014)
(1) Consolidated Operating Results (Millions of Yen)
(2) Consolidated Financial Position (Millions of Yen)
Note (1) Shareholders’ equity Fiscal Year ended March 31, 2014 11,798million yen
Fiscal Year ended March 31, 2013 8,808 million yen
(3) Consolidated Financial Cash Flows (Millions of Yen)
FY2012 % change FY2013 % change
Net Sales........................ 43,366 37.9 84,221 94.2
Operating Income..............................1,870 356.4 4,508 141.0
Recurring Profit.........................1,788 414.1 4,309 140.9
Net Income............................1,575 - 2,964 88.2
Net Income per Share(¥)...................¥33.01 - ¥62.13 -
Net Income per Share, Diluted(¥)............. - - - -
Return on Equity........................19.8% - 28.8% -
Ratio of Recurring Profit to Net Assets...................7.1% - 10.2% -
Ratio of Operating Income to Net Sales......................4.3% - 5.4% -
(Reference) Comprehensive income........ 1,629 - 2,991 -
Fiscal Year
between April 1 and March 31
FY2012 FY2013
Total Assets................................... 29,196 55,316
Net Assets..................................... 8,837 11,827
Shareholders' Equity Ratio (%)................... 30.2% 21.3%
Net Assets per Share (¥)........................ 184.62 247.17
As of March 31
FY2012 FY2013
Cash Flows from Operating Activities........................2,184 4,933
Cash Flows from Investing Activities.................. (222) (1,728)
Cash Flows from Financing Activities................... 230 2,433
Balance of Cash and Cash Equivalents at End of Period.............3,547 9,204
from April 1 to March 31
Fiscal Year

2. Dividends
3. Forecasts for Consolidated Business Results
(For the fiscal year ending March 31, 2015) (Millions of Yen)
4. Others
(1) Changes in significant subsidiaries during FY2013: No
(2) Changes in accounting principles, procedures, and the presentation
1) Changes due to revisions of accounting standards etc: Adopted
2) Changes other than 1): No
(3) Number of Shares Issued and Outstanding (Shares)
(Reference) Non-consolidated Financial Statement
1.Non-consolidated Highlights for the year ended March 31,2014
(1)Non-consolidated Operating Results
Dividend per Share at the end of 1st Half (¥)........................¥0.00 ¥0.00 ¥0.00
Dividend per Share at the end of the year (¥)........................¥0.00 ¥0.00 ¥0.00
Annual dividend per Share (¥)........................¥0.00 ¥0.00 ¥0.00
Total dividend........................... - - - - - -
Pay-out ratio (%)........................ - - - - - -
Ratio of dividend to total capital (%)........................ - - - - - -
FY2014(Forecast)FY2012
from April 1 to March 31
Fiscal Year
FY2013
% cahnge % change
Net Sales.............................................97.5% 91.8%
Operating Income.............................140.7% 210.5%
Recurring Profit............................. 142.5% 220.2%
Net Income................................ 112.9% 197.8%
Net Income per Share(¥)........................ - -
8,830
¥184.73
14,000
161,500
13,8003,500
Full Year
FY2014
2,240
¥46.86
3,600
First Half
62,600
FY2012 FY2012
Number of shares issued and outstanding at period end........................48,919,396 48,919,396
Number of treasury stocks at period end....................1,210,375 1,186,243
Average Number of shares outstanding during the priod......47,709,229 47,714,474
As of March 31
FY2012 % change FY2013 % change
Net Sales........................ 31,123 12.2 34,356 10.4
Operating Income..............................1,678 - 868 (48.3)
Recurring Profit.........................1,641 - 927 (43.5)
Net Income............................1,755 - 949 (45.9)
Net Income per Share(¥)...................¥36.79 - ¥19.90 -
Net Income per Share, Diluted(¥)............. - - - -
Fiscal Year
between April 1 and March 31

(2) Non-consolidated Financial Position
2.Foercasts for Non-consolidated Business Results
Indication of audit procedure implementation status
This earnings report is exempt from audit procedure based upon the Financial Instruments and Exchange Act. It is under the
audit procedure process at the time of disclosure of this report.
Note to ensure appropriate use of forecasts:
Forecasts in this document are based on assumptions, prospects and plans as of the date of this document. Actual results may
differ significantly from these forecasts, due to various factors affecting the Company’s business performance, such as change in
economical conditions.
FY2012 FY2013
Total Assets................................... 25,933 43,181
Net Assets..................................... 7,581 8,577
Shareholders' Equity Ratio (%)................... 29.2% 19.9%
Net Assets per Share (¥)........................ 158.91 179.70
As of March 31
% cahnge % change
Net Sales.............................................189.0% 322.0%
Recurring Profit............................. 123.0% -
Net Income................................ 58.3% 748.0%
Net Income per Share(¥)........................ - -
1,530
¥32.01
First Half
48,500 145,000
12,5002,400
Full Year
FY2014
8,050
¥168.41

Index of the attachment
ⅠⅠⅠⅠ. Business Results
1. Earnings....................................…….……………........………………………………………………………….. 2
2. Financial Condition......................................………..…..….…….………………………………………………. 5
3. Basic Corporate Policy for Profit Distribution………..….……...…………..………………………………..…... 6
4. Business and Other Risks………………………………………………………………………………………..… 6
ⅡⅡⅡⅡ. Group Outline 8
ⅢⅢⅢⅢ. Management Policies
1. Fundamental Management Policies ...................................................................….....…………….……….… 10
2. Target Management Indices .................…........................................….............…………………..……..….... 10
3. Medium- and Long- Term Business Strategies and Issues to Be Addressed ………...………………...……. 10
4. Challenges the Company Faces...........................................................…...…………………..…….…..……. 11
5. Other Significant Management Issues ...........................................…………………..………….……………. 12
ⅣⅣⅣⅣ. Consolidated Financial Statements
1. Consolidated Balance Sheet…………..……………………………………………..…………………….……..… 13
2. Consolidated Statement of Income and Comprehensive Income……………….……………………………… 15
Consolidated Statement of Income………...……………………………………………………………………… 15
Comprehensive Income…………………………………………………………………………………………….. 16
3. Consolidated Statement of Changes in Net Assets………………………………….…………………………… 17
4. Consolidated Cash Flow Statement…………………………………………………….………………………….. 19
5. Note regarding assumption of a going concern……………………………………….………………………….. 20
6. Segment Information…………………………………………………………………….…………………………... 21
Supplemental information ……………………………………………………………….………………………..…. 22

2
I. Business Results
1. Earnings
(1) Current Fiscal Year Overview
In the current fiscal year, the Japanese economy has been gradually recovering with a solid shift in consumer
spending and visible signs of recovery in production and capital investment, as well as a steady upturn in
employment.
Under such circumstances, our group has been concentrating its business resources and stimulating demand
to rapidly penetrate the commercial PV business based on the “Renewable Energy Feed in Tariff Purchasing
Program,” which started in July 2012. By expanding our operations in the business, we will strive to promote
the contribution of environmentally-friendly energy to society.
The Commercial Photovoltaics (PV) Division recorded substantial revenue growth in the current fiscal year
with commercial PV and wholesale PV components, contributing to sales. In contrast, the Home Sanitation
(HS) Division recorded decreased revenue due to the large shift of its human resources to the commercial PV
business. At the Establishment Sanitation (ES) Division, commercial PV systems for buildings and
condominiums recorded revenue growth. The Environmental Resources Development Division recorded
revenue growth in plastic fuel, electricity sales at TOMAKOMAI Power Plant, and organic waste processing.
As a result, group-wide net sales increased by 94.2% to 84,221 million yen from the same period the
previous year.
In terms of profitability, the Commercial PV Division had substantially increased costs for a proactive
expansion in sales, installation, and the logistic system to address the hike in demand, while commercial PV
systems recorded substantial revenue growth, resulting in increased profit. As a result, for the whole group,
the operating income increased by 141.0% to 4,508 million yen, ordinary income was up 140.9% to 4,309
million yen, with net income increasing by 88.2% to 2,964 million yen from the same period the previous
year.
(thousand of yen)
Consolidated Operating Results FY2012 FY2013 %Change Difference
Net Sales 43,366 84,221 94.2 40,855
Operating Income 1,870 4,508 141.0 2.637
Ordinary Income 1,788 4,309 140.9 2,521
Net Income 1,575 2,964 88.2 1,389

3
Consolidated results of individual divisions for the year were as follows:
a. Commercial Photovoltaic Solution (CPS) Division
The sales of commercial PV systems covering from sales and components sourcing to installation increased by
594.4% to 42,167 million yen from the same period the previous year, while wholesale PV components
increased by 158.7% to 9,172 million yen from the same period the previous year. As a result, the net sales of
the division increased by 433.8% to 51,340 million yen from the same period the previous year.
Absorbing increased proactive costs, such as advertising expenses, labor costs with enhanced recruitment,
and logistics network maintenance costs, with substantial revenue growth effects, the operating income was
4,410 million yen compared with 320 million yen in the same period the previous year.
b. Home Sanitation (HS) Division
The sales of existing products, such as termite control, increased by 33.7% from the same period the previous
year. In contrast, with a significant number of human resources shifted from the division to the CPS Division,
residential PV systems decreased by 83.0% from the same period the previous year. As a result, the net sales
of the division decreased by 27.0% to 10,818 million yen compared to the same period the previous year.
With the rising fixed cost ratio of selling and general administrative expenses to reduced sales, the operating
income decreased by 35. 7% to 1,141 million yen compared to the same period the previous year.
c. Establishment Sanitation (ES) Division
The sales from work on buildings and condominiums related to maintenance and management, decreased by
11.3% compared to the same period the previous year. The sales from the PV systems that we started to sell
in the KANTO region, increased by 133.9% compared to the same period the previous year. As a result, net
sales increased by 51.6% to 6,011 million yen compared to the same period the previous year.
With the revenue growth effect, the operating income increased by 36.5% to 190 million yen compared to the
same period the previous year.
d. Environmental Resources Development (ERD) Division
The sales from plastic fuel, with increased acceptance volume of waste plastic, increased by 5.1% compared to
the same period the previous year. With stable operation of TOMAKOMAI Power Plant, the revenues from
electricity sales increased by 1.4% compared to the same period the previous year. The sales from organic
waste processing with increased acceptance volume increased by 10.4% compared to the same period the
previous year. As a result, the net sales of the division increased by 7.2% to 16,051 million yen compared to
the same period the previous year.
The operating income decreased by 12.9% to 1,364 million yen compared to the same period the previous
year due to high transferring cost the plastic fuel to TOMAKOMAI power plant, and so on.

4
(2) Prospect for Next Year
The prospects for next year are good with expectations for the economic recovery of our group companies
with the upturn in the domestic economy. Although the “Renewable Energy Feed in Tariff Purchasing
Program” reduced the commercial PV purchasing unit price in April 2014 from 36 yen to 32 yen before tax for
10kW or more, our group will still be able to proactively deploy our business.
The Group has been engaging in business, such as direct sales and installation of commercial “Changes in
Organization and Personnel Changes” as of March 26, 2014, the organization was revised to establish direct
sales and installation structures in eastern Japan, with large potential as a market, while handling the
business at our company.
As of April 1, the CPS Division established the SE-West section at our key area in western Japan, as well as the
SE-East section in eastern Japan to establish a direct sales and installation structure, striving to expand
operations further. In addition, to improve profitability, we will endeavor to reduce the cost of components
through self-manufacture of inverters, as well as improving installation.
The HS Division mainly engages in maintenance for existing customers of our residential services, such as
termite control and under-floor ventilation systems. However, the division will record decreased sales due to
the operational transfer of the residential PV system to the SE-West section from this fiscal year.
The ES Division sales will be substantially decreased, due to the operational transfer of the PV systems to the
SE-East section as of April 1. The division will engage in maintaining buildings and condominiums.
The ERD Division will continually work to enhance the quality of plastic fuel to raise the efficiency of the
power generation of TOMAKOMAI Power Plant. The revenues from plastic fuel are expected to remain steady,
while the revenues from electricity sales are expected to increase, projecting increased sales for the division.
With the above-mentioned prospects for the consolidated financial outlook for the next fiscal year of our
whole group, we expect net sales to increase 91.8% to 161,500 billion yen, the operating income to increase
210.5% to 14,000 million yen, the ordinary income to increase 220.2% to 13,800 million yen, and the net
profit to increase 197.8% to 8,830 million yen, compared to the same period the previous year.

5
2. Financial Condition
(1) Assets, Liabilities and Net Assets
Total assets as of the end of the current fiscal year increased by 26,120 million yen to 55,316 million yen from
the previous fiscal year. The total liabilities increased by 23,130 million yen to 43,489 million yen from the
previous fiscal year. Net assets increased by 2,990 million yen to 11,827 million yen from the previous fiscal
year. As a result, the capital-to-asset ratio was 21.3%.
<Assets>
Current assets increased by 163.8% to 38,648 million yen from the end of the previous fiscal year, mainly
due to the increase in cash and deposits and accounts receivable by 14,848 million yen.
Fixed assets increased by 14.6% to 16,668 million yen from the end of the previous fiscal year, mainly due
to the increase in property, plant and equipment by capital expenditure in machines and equipment
together with buildings under installation by 1,855 million yen.
<Liabilities>
Current liabilities increased by 146.0% to 36,581 million yen from the end of the previous fiscal year,
mainly due to the increased notes payable and accounts payable by 14,654 million yen, short-term
loans-payable by 1,662 million yen and income tax payable by 1,357 million yen.
Noncurrent liabilities increased by 25.9% to 6,907 million yen from the end of the previous fiscal year,
mainly due to the increased long-term borrowings by 875 million yen and lease obligations by 251 million
yen.
<Net Assets>
Net assets increased by 33.8% to 11,827 million yen from the previous fiscal year, mainly due to the current
net income of 2,964 million yen.
(2) Cash Flows
Cash and cash equivalents (hereinafter “the funds”) increased from the previous fiscal year by 5,656 million
yen to 9,204 million yen at the end of the current fiscal year.
The cash flow and the factors in the current fiscal year were as follows:
(Net cash provided by operating activities)
For net cash provided by operating activities , the income increased by 2,748 million yen to 4,933 million yen
from the same period the previous year. The key factors include increased notes and account receivable-trade
by 14,848 million yen, and net income before income taxes of 4,309 million yen recorded, with notes and
account payable-trade increased by 14,665 million yen.
(Net cash provided by investing activities )
For net cash provided by investing activities, spending increased by 1,506 million yen to 1,728 million yen
from the same period the previous year, mainly due to the expenditure of 1,686 million yen for tangible fixed
assets obtained.
(Net cash provided by financing activities )
For net cash provided by financing activities, the income was 2,433 million yen with decreased of 2,203
million yen from the same period the previous year, mainly due to increase in short-term loans payable.

6
The Cash Flow Indicators:
(Note)Shareholder’s equity ratio: Shareholder’s equity/Total assets
Share ratio on a market price basis: Total market value of stock/Total assets
Interest-bearing liabilities ratio to cash flow: Operating cash flow/Interest payment
Interest coverage ratio : Operating cash flow/Interest payment
1. Each indicator is calculated based on consolidated financial results.
2. Total market value of stock is calculated by: closing price at the year-end x outstanding shares at the year-end.
3. The operating cash flow in this table is cash flow from operating activities reported on the consolidated cash flow
statement. Interest-bearing liabilities cover all liabilities reported on the consolidated balance sheet for which interest
is paid. Interest payment used in the calculation of the interest coverage ratio is the amount of interest expanse
reported on the consolidated cash flow statement.
3. Basic Shareholder Return Policy; Cash Dividends
As a basic corporate policy, the Company focuses on returning profit to our shareholders, based on the dividend on
the equity ratio, together with the overall consideration of operational expansion and internal reserves.
While recording increased profit in current net income for the current fiscal year, however, retained earnings in the
shareholders' equity was negative. Therefore, much to our regret, no dividend is scheduled for distribution in the
current period. Nevertheless, we are striving to expand the performance and internal reserves to generate profits
to pay dividends again in the near future.
4. Business and Other Risks
Major risks that may affect the operating results and business of the SANIX Group are described below.
Recognizing the possibility of these risks occurring, the SANIX Group endeavors to take proper measures to
avert these risks and minimize any impacts in the event of occurrence.
Certain future-related statements included in this document are estimates made by the Company based on
the information available at the end of the current fiscal year.
(1)Government measures
The SANIX Group’s PV business expects the commercial PV system market to expand rapidly along with
the enforcement of the Act on Special Measures Concerning New Energy Use by Operators of Electric
Utilities. However, if customers become less willing to invest due to revision in the purchase price or
period that is subject to annual review according to the “Renewable Energy Feed in Tariff Purchasing
Program,” or abolition of it, there might be disadvantageous effects on the performance or the financial
state of our group.
(2)Foreign exchange rate fluctuations
In the Group’s PV business, most of the PV modules have been sourced from Chinese and South Korean
FY2009 FY2010 FY2011 FY2012 FY2013
Shareholders' equity ratio 35.1% 34.7% 33.4% 30.2% 21.3%
Shareholders' equity ratio on a market
price basis42.1% 55.6% 53.3% 92.0% 99.2%
Interest-bearing liabillities ratio to
cash flow13.10 136.73 5.34 3.24 1.96
Interest coverage ratio 3.60 0.29 7.36 13.30 25.71

7
manufacturers. Purchase prices are expected to rise in the future, and purchase price fluctuations due to
the exchange rate may impact the Group’s performance and financial state.
(3)Human resources recruitment and retention
Our group’s PV business requires a number of employees to be engaged in various functions from sales
and installation to customer management. To address such needs, mid-career employees will be
proactively hired, including those qualified as electrical engineers. However, any larger-than-expected
shortage in the number of employees due to difficulty in recruitment or considerable rise of labor costs
in sales due to rapid market changes in the PV business may have negative effects on the performance
and the financial state of the group.
(4)Industrial accidents and natural disasters
Although we take all possible measures, if any unexpected, material accident during PV system
installation, or waste disposal operations, or unexpected disasters, such as climatic events, may impact
the group’s performance and financial state.
(5)Resource recycling power generation system
One of the factors for stable operation of the ERD Division is the maintenance or improvement in plastic
fuel quality at SANIX Energy’s TOMAKOMAI Power Plant. However, since plastic fuel originates from
waste, any inconsistency in the quality or properties that may affect the stable operation of the power
plant may be disadvantageous to the performance or financial state of the group.
(6)Power demand trend
The ERD Division may experience fluctuations in the electric power unit price at the electricity sales
business of SANIX Energy’s TOMAKOMAI Power Plant due to demand-supply fluctuations for seasonal
demand and the supply of electricity and the resumption of nuclear power plant operations. Decline of
the electric power unit price above projections may have an unprofitable impact on the group’s
performance and financial status.
(7)Statutory regulations
As our key business lines include PV system sales/installation, residential maintenance, commercial
waste disposal, power generation and electricity sales, we are subject to statutory regulations, such as
the “Installation Industry Act,” “Act on Special Measures Concerning New Energy Use by Operators of
Electric Utilities,” “Act on Specified Commercial Transactions,” “Waste Disposal and Public Cleaning Law
and related laws,” and the “Electricity Business Act.”
The Group endeavors to enhance compliance. However, any enforcement of amendment or
establishment of such regulations, or of administrative action, such as suspension of sales, in whole or in
part, or cancellation of approvals, may impact the group’s performance and financial state.

8
II. Group Outline
The Group consists of the Company and 10 other consolidated subsidiaries. Its major business fields are
sales/installation of PV systems, environmental sanitary services for general households, environmental
sanitary services for corporations and recycling-based power generation. The structure of each company in
relation to the Group’s business fields is as follows:
1) CPS Division
SANIX Engineering Incorporated, a consolidated subsidiary, has been conducting sales and installation for the
rapidly penetrating commercial PV systems. The Company sells wholesale PV component. From March 2015,
the division’s PV operation is scheduled to shift from SANIX Engineering Incorporated to SE-West section and
SE-East section as of June 1.
2) HS Division
The Company engages in environmental sanitation work for general households, specifically termite control,
repairing foundations, under-roof/floor ventilation systems, and PV system installation for households. From
March 2015, the division’s PV operation is scheduled to shift to the SE-West section.
3) ES Division
The Company offers corporate environmental sanitation services, specifically buildings and condominiums
plumbing installation and maintenance, and PV system installation for multi-dwelling business operators.
From March 2015, the division’s PV operations are scheduled to shift to the SE-East section.
4) ERD Division
The Company sells plastic fuel to its consolidated subsidiary SANIX Energy Incorporated. SANIX Energy
generates and sells electricity by using plastic fuel, purchased from SANIX and Hokkaido SANIX Environment
Incorporated, SANIX’s consolidated subsidiary. K.K. C&R, SANIX’s consolidated subsidiary, disposes of
incinerator ash from SANIX Energy. K.K. HOKUHAI, SANIX ’s consolidated subsidiary, leases facilities to K.K.
C&R.
PV modules sold and used for installation by our group have been partially sourced to our consolidated
subsidiary SHANRI (Shanghai) Energy Science and Technology Co., Ltd. Chemicals and business vehicles used
by our group have been sourced and leased from our consolidated subsidiary SUNAIM Incorporated.
Information system operation of our divisions has been outsourced to our consolidated subsidiary SANIX
Software Design Incorporated.

9

10
III. Management Policies
1. Fundamental Business Management Policies
Since its foundation, we have been engaged in overall environmental sanitation management operations,
conducting the environmental sanitation business for households, environmental sanitation for business
offices, and the building maintenance business for buildings and condominiums facilities. In addition,
positioning it as the core business, we decided to concentrate our management resources on the commercial
PV business, in which rapid penetration can be expected along with the enforcement of the “Renewable
Energy Feed in Tariff Purchasing Program,” which started in July 2012. Therefore, the Company will enhance
its corporate value, and accelerate the shift to the power generation business through industrial waste
recycling and energy-related companies.
2. Target Management Indices
As our group’s mid- and long-term management strategy, the Group will drive the PV business to establish its
position in the green energy field, while enhancing the business base together with the resource recycling
power generation business. The targeted management benchmark will be the operating income ratio that
precisely captures the state of productivity in balance with costs. In the medium term, we will target an
operating margin of 10%, expecting a substantial increase in sales in the PV business, which will account for a
significant share of sales.
3. Medium- and Long-Term Business Strategies and Issues to Be Addressed
(1) CPS Division
With proactive promotion of renewable energy by the government, the division will stimulate demand for
commercial PV, a market with huge potential, concentrating the management resources. In the medium term,
We will expand the market share by further expanding the sales structure in western Japan, while
establishing the structure in eastern Japan where full-fledged business is scheduled in the March 2015
period.
(2) HS Division
The division will conduct detailed maintenance for existing customers, including termite control and
under-roof/floor ventilation systems. In addition, from the standpoint of consumer protection, compliance
will be thoroughly ensured.
(3) ES Division
The division will maintain existing customers of building facility maintenance and protection, including
plumbing installation and maintenance for buildings and condominiums.
(4) ERD Division
The division conducts the electricity sales business at TOMAKOMAI Power Plant, using plastic fuel accepted,
processed and produced at 14 plastic resource development plants across the country and Hokkaido SANIX
Environment. From 2016, when retail electricity is liberalized, TOMAKOMAI Power Plant will become a useful
power supply base. Addressing the coming opportunity to incorporate the new power demand brought by
the retail electricity liberalization, we will be engaging in the power retail business with mid- and long-term
prospects.

11
4. Challenges the Company faces
Although the business environment surrounding the company will remain severe, eco-businesses, such as
renewable energy promotion and resource recycling energy deployment, are expected to play an increasingly
important role in society in terms of environmental protection. To promote these businesses, we have been
tackling the following management challenges:
(1)Human resources recruitment and structural enhancement
As the commercial PV business requires engaging a number of employees from sales and installation to
customer management, the recruitment of such employees will be an important challenge. In terms of sales,
we will establish a sales structure that enables community-based introduction and repeat sales as well as
driving the development of potential needs. As for installation, we will establish a structure to address
demand and increase the number of installations by hiring technical staff, including qualified electrical
workers.
(2)Cost reduction of PV system components
The commercial PV business has been rapidly expanding the market. With the rapid increase in the sales of
our products, the Group expects to achieve a dramatic increase in market share. However, addressing the
rapidly changing market is an important challenge. The Group is realizing opportunities, further enhancing
cost reductions and sourcing capabilities on modules and power conditioner components, while executing
cost reductions through in-house manufacturing.
(3)Retail electricity liberalization and stable operation at TOMAKOMAI Power Plant
Companies are attempting to identify business opportunities for the retail electricity liberalization scheduled
in 2016. In order to address the new electricity demand brought by the liberalization, stable operation of
TOMAKOMAI Power Plant, which should be a power base, will be an important challenge for the SANIX Group.
By improving the quality of plastic fuel together with stable operation, we will enhance the potential of the
retail electricity business.
(4)Plastic fuel sales
Our environmental resources development business sells plastic fuel to users as an alternative fossil fuel. In
order to offer this fuel to other users, it is important to ensure the quality and volume. We will strive to
increase the acceptance volume of waste plastic, to expand sales channels of plastic fuel and to create a
structure that enables stable supply.
(5)Promotion of compliance
SANIX Group businesses are subject to statutory regulations, such as the “Installation Industry Act,” “Act on
Special Measures Concerning New Energy Use by Operators of Electric Utilities,” “Act on Specified Commercial
Transactions,” “ Waste Disposal and Public Cleaning Law and related laws,” and the “Electricity Business Act.”
In addition, in terms of consumer protection, it is important to enhance compliance. We will regularly
conduct training, while enhancing the moral and legal knowledge of employees to provide customers with
excellent services.
(6) Enhancement of safety and disaster-prevention measures
The creation of an accident- and disaster-free environment when working at height for PV system installation,
and the operation of equipment and heavy machines at environmental resources development business
plants are important management challenges. While ensuring safe installation work and eliminating unsafe
environments and behavior in operations, we will strive to enhance the disaster prevention systems and take
every possible measure to ensure safety management.

12
5. Other Significant Management Issues
No applicable matter.

13
IV. Consolidated financial Statements
1. Consolidated Balance Sheet
(thousands of Yen)
FY2012 FY2013
Assets:Current Assets: Cash and deposits 3,559,160 9,237,009
Notes and accounts receivable-trade 7,356,616 22,205,080
Merchandise and finished goods 60,036 113,503
Work in process-construction 260,009 584,283
Raw materials and supplies 2,577,620 5,447,067
Deferred tax assets 298,920 597,129
Other 681,265 1,089,619
Allowance for doubtful accounts △142,104 △△△△624,897
Total Current Assets: 14,651,525 38,648,796
Fixed Assets: Property, Plant and Equipment:
Buildings and structures, net 9,705,554 9,601,276
Less: Accumulated Depreciation △7,815,155 △△△△7,710,467
Buildings and Structures (net of depreciation) 1,890,399 1,890,809
Machinery, equipment and vehicles, net 11,981,923 12,316,969
Less: Accumulated Depreciation △11,423,926 △△△△11,046,772
Machinery, Equipment and Vehicles (net of depreciation) 557,997 1,270,196
Land 8,889,529 9,179,989
Lease assets, net 556,626 1,061,376
Less: Accumulated Depreciation △205,382 △△△△345,167
Leased Assets (net) 351,243 716,208
Construction in progress 464,340 905,446
Other 941,983 1,018,076
Less: Accumulated Depreciation △769,376 △△△△799,577
Other, net 172,607 218,498
Total Property, Plant and Equipment: 12,326,117 14,181,149
Intangible Fixed Assets:
Goodwill 625,370 513,363
Other, net 60,123 59,371
Total Property, Plant and Equipment: 685,493 572,735
Investments and Other Assets:
Investment securities 316,576 339,001
Lease and guarantee deposits 705,601 722,807
Deferred tax assets 95,696 312,701
Other 856,122 998,452
Allowance for doubtful accounts △440,823 △△△△458,710
Total Investments and Other Assets: 1,533,173 1,914,251
Total Fixed Assets: 14,544,785 16,668,136
Total Assets: 29,196,310 55,316,932
As of March 31

14
(thousands of Yen)
FY2012 FY2013
Liabilities:Current Liabilities: Notes and accounts payable-trade 5,459,789 20,114,703 Short-term loans payable 3,338,000 5,000,000 Current portion of long-term loans payable 848,190 948,496 Accounts payable-other 3,166,433 4,836,350 Accrued expenses 931,437 1,813,247 Accrued income taxes 119,644 198,410 Lease obligations 362,883 1,720,525 Income taxes payable 249,243 719,070 Provision for bonuses 68,871 204,329 Allowance for resource-recycling expenses 12,320 32,342 Other 316,254 994,394 Total Current Liabilities: 14,873,068 36,581,870Non-Current Liabilities: Bonds payable 50,000 30,000 Long-term loans payable 2,819,551 3,695,132 Lease obligations 272,054 523,758 Deferred tax liabilities 42,647 ---- Long-term lease deposited 46,349 49,317 Provision for retirement benefits 1,419,934 ---- Provision for directors' retirement benefits 179,756 181,256Liability Related to Retirement Benefits - 1,534,705 Provision for disposal site closing expenses 373,699 429,384 Other 282,051 463,833 Total Non-Current Liabilities: 5,486,044 6,907,389
Total Liabilities: 20,359,113 43,489,259Net Assets:Shareholders' Equity: Capital stock 14,041,834 14,041,834 Capital surplus - 4,413 Retained earnings △3,733,267 △△△△768,586 Treasury stock △1,610,889 △△△△1,581,964 Total Shareholders' Equity: 8,697,677 11,695,697Valuation and translation adjustments: Valuation difference on available-for-sale securities 78,147 91,833 Foreign currency translation adjustment 32,356 44,491 Adjustment for Retirement Benefits (Cumulative) - △△△△33,905 Total Valuation and translation adjustments: 110,503 102,419Minority Interests: 29,016 29,556
Total Net Assets: 8,837,197 11,827,673
Total Liabilities and Net Assets: 29,196,310 55,316,932
As of March 31

15
2. Consolidated Statement of Income and Comprehensive Income
(Consolidated Statement of Income)
(thousands of Yen)
FY2012 FY2013
Net sales 43,366,108 84,221,741
Cost of sales 29,995,849 62,800,497
Gross profit 13,370,258 21,421,244
Selling, general and administrative expenses
Sales commission 899,259 947,451
Advertising expenses 1,142,124 1,967,772
Provision of allowance for doubtful accounts 50,395 497,586
Salaries and Bonuses 4,957,186 6,969,933
Provision for bonuses 33,679 103,488
Retirement benefit expenses 139,113 146,306
Provision for directors' retirement benefits 1,500 1,500
Legal welfare expenses 615,345 837,653
Rent expenses 837,843 914,656
Depreciation 123,968 194,628
Others 2,699,345 4,331,950
Total selling, general and administrative expenses 11,499,762 16,912,927
Operating income (loss) 1,870,495 4,508,316
Non-operating income:
Interest income 5,978 13,342
Dividends income 11,530 7,750
Commission for insurance office work 3,774 3,775
Land and house rent revenue 69,985 74,924
Subsidy income - 30,208
Other 46,263 78,599
Total non-operating income 137,531 208,600
Non-operating expenses:
Interest expenses 164,203 188,361
Rent expenses 2,308 2,217
Foreign exchange losses 36,883 104,938
Other 15,725 111,414
Total non-operating expenses 219,120 406,931
Ordinary income (loss) 1,788,906 4,309,984
Extraordinary income:
Gain on sales of securities 138,075 ---- Gain on sales of fixed assets 5,199 ---- Total extraordinary income 143,274 ----Extraordinary loss:
Loss on cancellation of lease contracts 794 ---- Impairment loss 18,657 ---- Total extraordinary loss 19,452 ----Income (loss) before income taxes and minority interests 1,912,729 4,309,984
Income taxes-current 358,674 1,891,559
Income taxes-deferred △21,325 △△△△546,796
Total income taxes 337,348 1,344,763
Income before minority interests 1,575,380 2,965,220
Minority interests in income 368 540
Net income (loss) 1,575,011 2,964,680
from April 1 to March 31

16
(Comprehensive Income)
(thousands of Yen)
FY2012 FY2013
Income before minority interests 1,575,380 2,965,220
Other comprehensive income - -
Share of other comprehensive income of associates accounted
for using equity method25,374 13,685
Foreign currency translation adjustment 28,277 12,135
Total other comprehensive income 53,652 25,821
Comprehensive income 1,629,033 2,991,042
Comprehensive income attributable to - -
Comprehensive income attributable to parent company 1,628,664 2,990,502
Comprehensive income attributable to minority interests 368 540
from April 1 to March 31

17
3. Consolidated Statements of Changes in Net Assets
(thousands of Yen)
FY2012 FY2013
Shareholders' Equity
Capital stock:
Balance at the end of previous period 14,041,834 14,041,834
Changes of items during the period
Total changes of items during the period ― ―
Balance at the end of current period 14,041,834 14,041,834
Retained earnings:
Balance at the end of previous period (5,377,499) (3,733,267)
Changes of items during the period
Net income 1,575,011 2,964,680
Change of scope of consolidation 69,221
Total changes of items during the period 1,644,232 2,964,680
Balance at the end of current period (3,733,267) (768,586)
Treasury Stock:
Balance at the end of previous period (1,610,767) (1,610,889)
Changes of items during the period
Purchase of treasury stock (122) (918)
Disposal of treasury stock ― 29843
Total changes of items during the period (122) 28,924
Balance at the end of current period (1,610,889) (1,581,964)
Total Shareholders' Equity:
Balance at the end of previous period 7,053,567 8,697,677
Changes of items during the period
Net income 1,575,011 2,964,680
Change of scope of consolidation 69,221 ―
Purchase of treasury stock (122) (918)
Disposal of treasury stock ― 34256
Total changes of items during the period 1,644,110 2,998,019
Balance at the end of current period 8,697,677 11,695,697
from April 1 to March 31

18
(thousands of Yen)
FY2012 FY2013
Valuation and Translation Adjustments:
Valuation difference on available- for-sale securities
Balance at the end of previous period 52,772 78,147
Changes of items during the period
Net changes of items other than shareholders' equity 25,374 13,685
Total changes of items during the period 25,374 13,685
Balance at the end of current period 78,147 91,833
Total Valuation and Translation Adjustments:
Balance at the end of previous period 52,772 110,503
Changes of items during the period
Changes of Foreign currency translation adjustment 4,078 -
Net changes of items other than shareholders' equity 53,652 (8,083)
Total changes of items during the period 57,731 (8,083)
Balance at the end of current period 110,503 102,419
Minority Interests:
Balance at the end of previous period 28,647 29,016
Changes of items during the period
Net changes of items other than shareholders' equity 368 540
Total changes of items during the period 368 540
Balance at the end of current period 29,016 29,556
Total Net Assets:
Balance at the end of previous period 7,134,986 8,837,197
Changes of items during the period
Change of scope of consolidation 69,221 -
Changes of Foreign currency translation adjustment
in change in scope of consolidation4,078 -
Net income 1,575,011 2,964,680
Purchase of treasury stock (122) (918)
Disposal of treasury stock - 34,256
Net changes of items other than owners' equity 54,021 (7,543)
Total changes of items during the period 1,702,210 2,990,475
Balance at the end of current period 8,837,197 11,827,673
from April 1 to March 31

19
4. Consolidated Cash Flow Statement
(thousands of Yen)
FY2012 FY2013
Net Cash Provided by (Used in) Operating Activities:
Income before income taxes and minority interests 1,912,729 4,309,984
Depreciation and amortization 386,714 547,507
Loss on disaster 18,657 ----
Increase/ Decrease in reserve for retirement benefits 37,152 112,006
Increase/ Decrease in reserve for directors' retirement benefits 1,500 (1,419,934)
Increase/ Decrease in provision for bonuses 56,924 1,500
Decrease in allowance for resource-recycling expenses (28,290) 135,457
Amortization of goodwill 112,006 20,022
Increase/decrease in allowance for doubtful accounts 38,060 500,680
Interest and dividends income (17,508) 1,482,236
Interest expenses 163,440 (21,093)
Gain/ Loss on sales of fixed assets (5,199) 188,361
Loss on retirement of fixed assets 794 ----
Increase/ Decrease in notes and accounts receivable-trade (4,746,431) ----
Increase/ Decrease in inventories (967,335) ----
Increase/ Decrease in other current assets 442,900 (14,848,763)
Decrease in notes and accounts payable-trade 4,013,467 (3,229,343)
Increase/ Decrease in consumption tax refund receivable 56,512 (537,999)
Increase/ Decrease in other current liabilities 1,131,171 14,665,227
Other (94,866) 469,827
Subtotal 2,512,401 2,915,631
Interest and dividends income received 17,492 20,596
Interest expenses paid (165,264) (191,877)
Payment for damage repairing -
Income taxes paid (202,285) (536,176)
Income taxes refund 22,383 1,720
Net cash provided by operating activities: 2,184,726 4,933,689
Net Cash Provided by (Used in) Investment Activities:
Increase in time deposits (11,300) (21,200)
Proceeds from sales of securities 258,075 (1,686,897)
Proceeds from sales of property, plant and equipment 103,643 18,610
Purchase of property, plant and equipment (615,817) (1,241)
Payments for lease and guarantee deposits - ----
Proceeds from collection of lease and guarantee deposits 48,600 (83,691)
Purchase of investment securities (3,790) 43,984
Other (1,714) 1,676
Net cash provided by investing activities: (222,302) (1,728,759)
From April 1 to March 31

20
(thousands of Yen)
5.Note regarding assumption of a going concern
There is no events or situations that arouse serious doubt regarding the assumption of a going
concern.
FY2012 FY2013
Net Cash Provided by (Used in) Financing Activities:
Increase (decrease) in short-term loans payable 1,013,000 1,662,000
Proceeds from long-term loans payable 210,000 1,870,025
Repayment of long-term loans payable (861,724) (894,137)
Proceeds from issuance of bonds - ----
Redemption of bonds (20,000) (20,000)
Repayments of finance lease obligations (108,801) (186,735)
Net decrease/ increase in treasury stock (122) ----
Cash dividends paid (1) ----
Other (2,158) 2,303
Net cash provided by financing activities: 230,192 2,433,456
Effect of exchange rate changes on cash and cash equivalents (11,055) 18,261
Net increase (decrease) in cash and cash equivalents 2,181,561 5,656,648
Cash and cash equivalents at beginning of peiod 1,365,530 3,547,860
Net increase (decrease) in cash and cash equivalents
in change in scope of consolidation768 ----
Cash and cash equivalents at the end of period 3,547,860 9,204,509
From April 1 to March 31

21
6.Segment Information
Segment Information by Type of Business
Prior consolidated fiscal year (From April 1, 2012 to March 31, 2013)
(Thousands of Yen)
Consolidated fiscal year (From April 1, 2013 to March 31, 2014)
(Thousands of Yen)
Segments CPS HS ES ERD Total Elimination Consolidated
or Group
Sales:
Sales to customers . . . . . . . . . . . . . . . . . . . . 51,340,380 10,818,889 6,011,468 16,051,002 84,221,741 - 84,221,741
Internal sales among segments
and transfer accounts. . . . . . . . . . . . . . . . . . . . . . . . . . - - - - - - -
Total . . . . . . . . . . . . . . . . . . . . . . . . . . . . . . . . . . . . . . . . . . . . . 51,340,380 10,818,889 6,011,468 16,051,002 84,221,741 - 84,221,741
Operating income(loss) . . . . . . . . . . . . . . . . . . . . . 4,410,370 1,141,210 190,383 1,364,711 7,106,674 (2,597,358) 4,508,316
Assets . . . . . . . . . . . . . . . . . . . . . . . . . . . . . . . . . . . . . . . . . . . . .27,018,936 3,181,721 1,482,707 11,969,862 43,653,227 11,663,704 55,316,932
Others:
Depreciation expenses . . . . . . . . . . . . . . . . . . . . . . . . . . . . . . . . . . . . . . . . . . . . . 89,921 37,120 8,829 251,826 387,698 159,808 547,507
Amortization of goodwill . . . . . . . . . . . . . . . . . . . . . . . . . . . . . . . . . . . . . . . . . . . . . - - - 112,006 112,006 - -
Capital expenditures. . . . . . . . . . . . . . . . . . . . . . . . . . . . . . . . . . . . . . . . . . . . . 680,814 181,398 21,141 972,802 1,856,156 158,315 2,014,472
Segments CPS HS ES ERD Total Elimination Consolidated
or Group
Sales:
Sales to customers . . . . . . . . . . . . . . . . . . . . 9,617,646 14,814,917 3,965,643 14,967,900 43,366,108 - 43,366,108
Internal sales among segments
and transfer accounts. . . . . . . . . . . . . . . . . . . . . . . . . . - - - - - - -
Total . . . . . . . . . . . . . . . . . . . . . . . . . . . . . . . . . . . . . . . . . . . . . 9,617,646 14,814,917 3,965,643 14,967,900 43,366,108 - 43,366,108
Operating income(loss) . . . . . . . . . . . . . . . . . . . . . 320,368 1,775,560 139,481 1,567,654 3,803,065 (1,932,569) 1,870,495
Assets . . . . . . . . . . . . . . . . . . . . . . . . . . . . . . . . . . . . . . . . . . . . .3,735,173 6,439,869 1,139,765 10,125,736 21,440,546 7,755,764 29,196,310
Others:
Depreciation expenses . . . . . . . . . . . . . . . . . . . . . . . . . . . . . . . . . . . . . . . . . . . . . 10,519 49,712 9,711 371,927 441,871 56,949 498,821
Amortization of goodwill . . . . . . . . . . . . . . . . . . . . . . . . . . . . . . . . . . . . . . . . . . . . . - - - 112,006 112,006 - -
Capital expenditures. . . . . . . . . . . . . . . . . . . . . . . . . . . . . . . . . . . . . . . . . . . . . 180,108 66,311 1,866 791,198 1,039,484 62,779 1,102,264
22
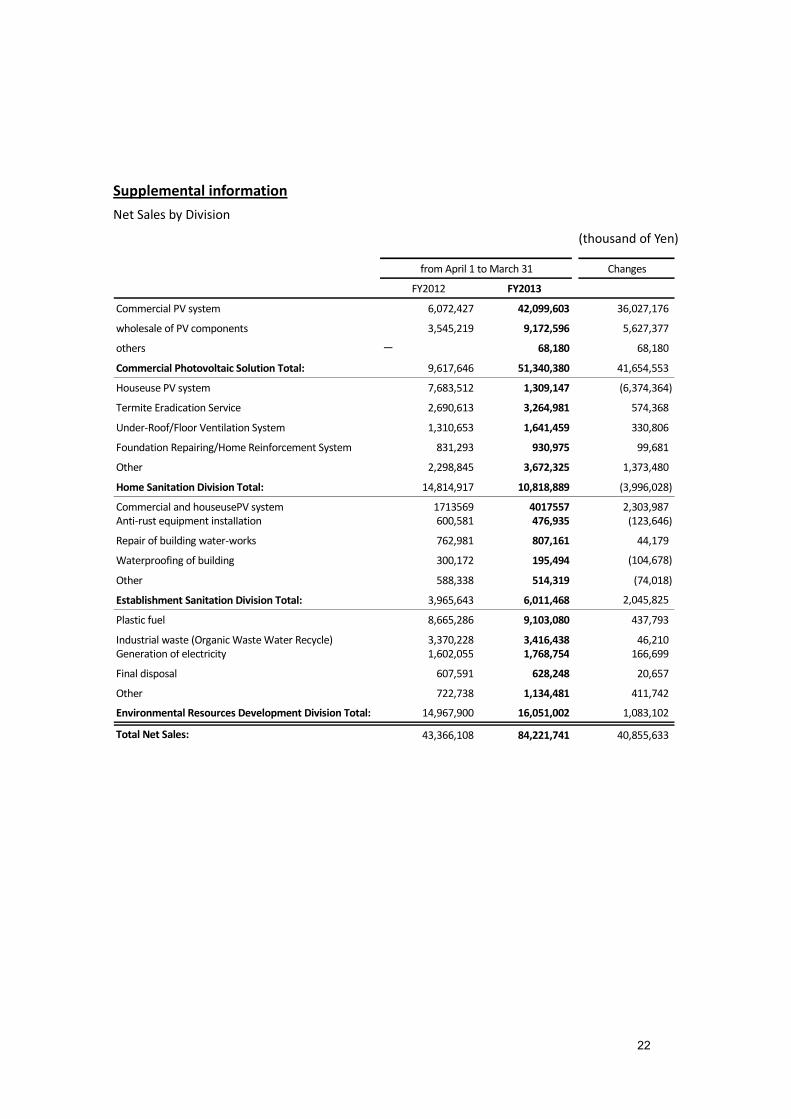
Supplemental information
Net Sales by Division
(thousand of Yen)
Changes
FY2012 FY2013
Commercial PV system 6,072,427 42,099,603 36,027,176
wholesale of PV components 3,545,219 9,172,596 5,627,377
others - 68,180 68,180
Commercial Photovoltaic Solution Total: 9,617,646 51,340,380 41,654,553
Houseuse PV system 7,683,512 1,309,147 (6,374,364)
Termite Eradication Service 2,690,613 3,264,981 574,368
Under-Roof/Floor Ventilation System 1,310,653 1,641,459 330,806
Foundation Repairing/Home Reinforcement System 831,293 930,975 99,681
Other 2,298,845 3,672,325 1,373,480
Home Sanitation Division Total: 14,814,917 10,818,889 (3,996,028)
Commercial and houseusePV system 1713569 4017557 2,303,987
Anti-rust equipment installation 600,581 476,935 (123,646)
Repair of building water-works 762,981 807,161 44,179
Waterproofing of building 300,172 195,494 (104,678)
Other 588,338 514,319 (74,018)
Establishment Sanitation Division Total: 3,965,643 6,011,468 2,045,825
Plastic fuel 8,665,286 9,103,080 437,793
Industrial waste (Organic Waste Water Recycle) 3,370,228 3,416,438 46,210
Generation of electricity 1,602,055 1,768,754 166,699
Final disposal 607,591 628,248 20,657
Other 722,738 1,134,481 411,742
Environmental Resources Development Division Total: 14,967,900 16,051,002 1,083,102
Total Net Sales: 43,366,108 84,221,741 40,855,633
from April 1 to March 31