santa maria valley groundwater assessmentsantabarbaracounty.ca.gov/pwd/water/downloads/irwmp... ·...
TRANSCRIPT

Santa Maria Valley
Groundwater Assessment Santa Barbara County, California
Submitted to: Salt and Nutrient Planning Workgroup Santa Barbara County IRWM Plan 2013
Date: October 9, 2013 Project No: 118210
GEI Consultants, Inc.

S A N T A M A R I A V A L L E Y G R O U N D W A T E R A S S E S S M E N T
Table of Contents
Abbreviations and Acronyms v
1 Introduction 1 1.1 Regulatory Requirements Pertaining to Water Quality in the Santa Maria
Valley 2 1.1.1 Basin Plan and Beneficial Uses 2 1.1.2 Total Maximum Daily Loads 3 1.1.3 Point Source Waste Discharge Requirements 3 1.1.4 Nonpoint Source Discharge Requirements 4 1.1.5 Condition Waiver of Waste Discharge Requirements for
Discharges from Irrigated Lands: Order No. R3-2012-0011(Agricultural Order) 4
1.1.6 Stormwater Regulations 5 1.1.7 Recycled Water Policy 5 1.1.8 Groundwater Basin Adjudication 5
1.2 Working Group Collaboration Process 6 1.2.1 IRWM Planning Framework 6 1.2.2 Guided by Local Stakeholder Interests 6 1.2.3 Water Users and Dischargers 7 1.2.4 Collaborative and Non-Regulatory 7 1.2.5 Regular Meetings Open to the Public 7
1.3 Agency Coordination 7 1.4 Purpose of the Groundwater Assessment 8 1.5 Approach of the Groundwater Assessment 9
1.5.1 Conceptual Model Discussion 9 1.5.2 Hydrology 9 1.5.3 Inputs-Sources of Salt and Nutrient 10 1.5.4 Transport Mechanism 10 1.5.5 Fate 10 1.5.6 Water and Nutrient Management 11
1.6 Existing Water Management and Institutional Framework 11 1.7 Stakeholder Roles and Responsibilities 11 1.8 Organization of This Report 12
2 Existing Monitoring and Uses of Data 21 2.1 Existing Monitoring Programs and the Current Use of Data 21
2.1.1 Geological Survey Monitoring 21 2.1.2 CCRWQCB Monitoring 22 2.1.3 City of Santa Maria 22 2.1.4 Golden State Water Company 22 2.1.5 City of Guadalupe 22

S A N T A M A R I A V A L L E Y G R O U N D W A T E R A S S E S S M E N T
ii
2.1.6 Central Coast Water Authority 22 2.1.7 County of Santa Barbara Public Works Department 23 2.1.8 Waste Water Treatment Plants 23 2.1.9 Central Coast Water Quality Preservation, Inc. 23
2.2 Sources, Nature and Applicability of Data to this Assessment 23
3 Description of Basin 29 3.1 Past Studies and Sources of Information 29 3.2 Geography and Surface Hydrology 29 3.3 Geology, Geologic History and Hydrogeology 30 3.4 Development of Water Resources 31
3.4.1 Groundwater and Wells 32 3.4.2 Twitchell Reservoir 32
3.5 Agricultural Water Supply and Demand 33 3.5.1 Agriculture Water Requirements 33 3.5.2 Agriculture Water Demand – Pumped Groundwater 35 3.5.3 Agriculture Return Flow 36 3.5.4 Orcutt-Solomon Creek at Sand Plant (312ORC) 37 3.5.5 Oso Flaco Creek 38
3.6 Urban Water Supply and Demand 38 3.7 Urban Return Flow 39
3.7.1 City of Santa Maria WWTP 39 3.7.2 City of Guadalupe WWTP 39 3.7.3 Laguna County Sanitation District (Orcutt) WWTP 40
3.8 Existing Water Management 40 3.8.1 Regional 40 3.8.2 System Operators 40
3.9 Management of Salt and Nutrients 41
4 Sources, Transport and Fate of Water, TDS, Sodium, Chloride and Nitrogen (Conceptual Model) 44 4.1 Relationship between hydrology and transport of salt and nutrient 44 4.2 Source, Transport, Fate Cycle Conceptual Model 45
4.2.1 Basin Balance Estimates 50 4.2.2 Evidence in Support of Transport Model 50
5 Evaluation of Existing Monitoring 59 5.1 Existing monitoring programs 59
5.1.1 Measurement of Recharge and Sources of TDS, Cl- and NO3 60 5.1.2 Groundwater measurements and movement of TDS, Cl- and NO3 61 5.1.3 Measurements of TDS, Cl- and NO3 Discharge 62
5.2 Applicability of Existing Data 63 5.3 Gaps Analysis and Uncertainties 65
5.3.1 Well Location, Construction and Hydrogeologic Characteristics 66 5.3.2 Areal Distribution of Ground Water Measurements 66 5.3.3 Characteristics of Subsurface Discharge to the Ocean 67

S A N T A M A R I A V A L L E Y G R O U N D W A T E R A S S E S S M E N T
iii
5.3.4 Vertical Stratification of TDS and NO3 in the Subsurface 67 5.3.5 Surface Water Measurements 67
5.4 Conclusions 68 5.4.1 Salt and Nutrient Input Data 68 5.4.2 Salt and Nutrient Output Data 69
5.5 Monitoring Recommendations 69
6 Summary and Conclusions 71 6.1 Monitoring 71 6.2 Sources, Transport and Fate of Salt and Nutrient 71 6.3 Water Quality Trends 71
References and Other Resources 1
Tables Table 3.5. Irrigated Crop Acres, Unit Applied Water, and Calculated
Applied Water by Crop Category 34 Table 4.2-1. Estimated Annual Chloride and TDS Load Balance, Santa
Maria Valley, 1990 52 Table 4.2-2. Estimated Annual Nitrate Load Balance, Santa Maria Valley,
1990 53 Table 4.2-3. Estimated Annual Chloride and TDS Load Balance, Santa
Maria Valley, 2000 54 Table 4.2-4. Estimated Annual Nitrate Load Balance, Santa Maria Valley,
2000 55 Table 4.2-5. Estimated Annual Chloride and TDS Load Balance, Santa
Maria Valley 2010 56 Table 4.2-6. Estimated Annual Nitrate Load Balance, Santa Maria Valley,
2010 57
Figures Figure 1. Location of Assessment Area: Santa Maria Groundwater
Management Area 14 Figure 1.2a. TDS Balance Diagram, Eastern Santa Maria Valley 15 Figure 1.2b. TDS Balance Diagram, Western Santa Maria Valley 16 Figure 1.2c. Chloride (Cl-) Balance Diagram, Eastern Santa Maria Valley 17 Figure 1.2d. Chloride (Cl-) Balance Diagram, Western Santa Maria Valley 18 Figure 1.2e. Nitrate (NO3) Balance Diagram, Eastern Santa Maria Valley 19 Figure 1.2f. Nitrate (NO3) Balance Diagram, Western Santa Maria Valley 20 Figure 2.1a. Well Network for Monitoring Shallow Groundwater 25 Figure 2.1b. Well Network for Monitoring Deep Groundwater 26 Figure 2.1c. Surface Water and Climatic Monitoring Network 27 Figure 2.1d. Central Coast Ambient Monitoring Program Sampling Sites 28

S A N T A M A R I A V A L L E Y G R O U N D W A T E R A S S E S S M E N T
iv
Figure 4.2. Nitrogen in Root Zone Balance 46 Figure 4.2.1. TDS, CL, and Nitrate Concentrations within Santa Maria Valley
Management Area 58
Appendices A Scope of Work B Suggested Elements of a Salt and Nutrient Management Plan C Salt and Nutrient Planning Working Group
D Fact sheet for Order R3-2012-0011 ("2012 Ag Order") E Preliminary TDS, Cl¯, and NO3 Balance Calculation F Technical Support Memorandum for Root Zone Estimates

S A N T A M A R I A V A L L E Y G R O U N D W A T E R A S S E S S M E N T
v
Abbreviations and Acronyms
CCAMP Central Coast Ambient Monitoring program
CCRWQCB Central Coast Regional Water Quality Control Board
CCWA Central Coast Water Authority
CIMIS California Irrigation Management Information System
CMP Cooperative Monitoring Program
IRWM Integrated Regional Water Management
NPDES National Pollution Discharge Elimination System
POTW Publically-Owned Treatment Works
SMVWMA Santa Maria Valley Water Management Authority
SMVWCD Santa Maria Valley Water Conservation District
TDS total dissolved solids
TMA Twitchell Management Authority
TMDL total maximum daily load
USBR United State Bureau of Reclamation
USGS Unites States Geological Society
WRCB Water Rescources Control Board
WDRs Water Discharge Requirements

1
1 Introduction
This Assessment has been prepared to evaluate sources, transport and fate of “salts” and “nutrients” (Nitrate and other forms of nitrogen) in surface water and groundwater within the Santa Maria Valley. Stakeholders in the Santa Maria Valley are interested in assuring sustainability of water supplies and addressing water quality regulations, specifically the future development of Salt and Nutrient Plans. The goals of this assessment are to 1) identify regulatory requirements, 2) gather data, 3) summarize key issues, and 4) provide recommendations to support future development of Salt and Nutrient Management Plans that are required by regulation for all groundwater basins and sub-basins in California. The assessment is specific to the Santa Maria Valley Groundwater Management Area as defined by The Superior Court (2008) (Figure 1) and is a part of the update to the Santa Barbara County Integrated Regional Water Management (IRWM) Plan 2013 under development by regional interests. Funding has been provided by the California State Department of Water Resources (DWR) as part of a Proposition 84 IRWM Planning Grant to the Santa Barbara County Region. This assessment is intended to support the development of a Salt and Nutrient Management Plan pursuant to State Water Resources Board Policy (Policy 2009-0011).
Over time, salts and nutrients may increase in groundwater basins due to a number of influences. As use and reuse of water has increased in California, understanding these influences and developing strategies to assure sustainable water resources has become more important. Santa Maria Valley water users, through a Salt and Nutrient Planning Working Group (Working Group), have prepared this assessment in order to better understand both existing water quality and the effectiveness of ongoing water resource management efforts. The Group has been responsible for guiding collaboration with local organizations and public agencies, as well as the public. The goals of this assessment are to identify regulatory requirements, gather and evaluate data, summarize key issues, and provide recommendations to support future development of a Salt and Nutrient Management Plan by individual stakeholders within the Santa Maria Valley. This report does not discuss climate change since it is a specific topic addressed in the IRWM Plan update.
This assessment is based on existing hydrologic information and water quality data available through the Working Group and public agencies. Funding is provided through an IRWM Planning Grant for consultant services to assist in development of the report.
The scope of work for this assessment was developed by the Working Group and approved by DWR in conjunction with the grant (Appendix A). This assessment contains several sections:

2
Purpose of the Assessment Overview of regulatory requirements pertaining to water quality in the Santa Maria
Valley Working Group collaborative process Conceptual model of sources, transport, and fate of salt and nutrient Data acquisition, management, and analysis Description of the groundwater basin Overview of salt and nutrient management in the Santa Maria Valley
In addition to this assessment, the Working Group formulated a process to discuss goals and objectives in a separate Technical Memorandum. This process is based on the review of existing data (Section 2 of this Assessment), the development of a shared understanding of salt and nutrient transport and fate (Section 3), and the conclusions of the Groundwater Assessment Report (Section 6). The Working Group addressed both institutional and quantitative goals and objectives.
1.1 Regulatory Requirements Pertaining to Water Quality in the Santa Maria Valley
Quality of surface and groundwater is generally regulated by two agencies, the State Water Resources Control Board (State Board) and the Central Coast Regional Water Quality Control Board (Central Coast Board). These boards have a number of regulatory programs that pertain to the Santa Maria Valley. They include:
Water quality planning programs (adoption, review, and amendment of state-wide and basin water quality control plans and policies), including development and adoption of Total Maximum Daily Loads (TMDLs) and implementation plans
Regulatory programs, including permitting and control of discharges through National Pollutant Discharge Elimination System (NPDES) and Waste Discharge Requirement (WDR) permits, discharge to land (California Code of Regulations Chapter 15), and storm water and storage tank programs
Monitoring and quality assurance programs Nonpoint source management programs, including the “Watershed Management
Initiative” Funding assistance programs, including grants and loans
1.1.1 Basin Plan and Beneficial Uses
The Central Coast Board relies on its adopted “Water Quality Control Plan for the Central Coast Basin Plan” (Basin Plan) to describe the actions necessary to:
Achieve water quality objectives Establish a time schedule for complying with them Describe necessary surveillance and monitoring activities

3
The nature of actions to be taken to meet water quality objectives include, but are not limited to, issuance of WDRs (non-water body discharges) and NPDES permits (for surface water body discharges) for point discharges, establishment of water-quality based effluent limitations, prohibitions of discharge, and the review and establishment of TMDLs.
The Basin Plan also establishes beneficial uses used to guide development of water quality objectives in each surface water body. Each water body is designated for one or more beneficial uses such as domestic, municipal, agricultural, and industrial supply; power generation; recreation; aesthetic enjoyment; navigation; and preservation and enhancement of fish, wildlife, and other aquatic resources. Generally speaking the municipal use and environmental designations carry the strictest water quality standards. Monitoring activities to determine compliance with water quality objectives include discharger self-monitoring required under WDRs and NPDES permits, and monitoring undertaken by the Central Coast Board through its Central Coast Ambient Monitoring Program (CCAMP) program.
1.1.2 Total Maximum Daily Loads
Consistent with Section 303(d) of the Clean Water Act, the State has identified surface water bodies that do not meet water quality standards and considers them “impaired.” In order to improve water quality in the impaired surface water bodies in the Santa Maria Valley, the Central Coast Board has implemented the regulatory process of TMDLs. The TMDL process involves determining the quantity of one or more pollutants that can be allowed in each surface water body without exceeding water quality objectives, and allocating responsibility for managing those pollutants. The role of groundwater in developing a TMDL has not been determined by CCRWQCB.
Although the abbreviation stands for Total Maximum Daily Load, the limitations contained in a TMDL may be other than daily load limits. There can also be multiple TMDLs on a particular surface water body, or there can be one TMDL that addresses numerous pollutants. California’s Porter-Cologne Water Quality Control Act (Section 13242) requires that any TMDL implementation program be adopted as a Basin Plan amendment. The CCRWQCB has initiated a TMDL regulatory process for Total Dissolved Solids (TDS or “salt”) and nutrients in the Santa Maria Valley. In support of the TMDL process, the CCRWQCB is developing a numerical model of elements on the hydrologic system of the Santa Maria Valley that affect sources, transport and fate of TDS in surface and groundwater. The model is intended to guide decisions by the CCRWQCB in its regulatory process. The model was not used in the analysis presented in this report.
1.1.3 Point Source Waste Discharge Requirements
NPDES permits are required by all dischargers—municipal, industrial, and others that discharge pollutants from any point source (such as “end of pipe” systems) into waters of the United States—and are intended to ensure that discharges do not adversely affect the quality and beneficial uses of surface waters. All permit requirements must also comply with the

4
Central Coast Board Basin Plan and any statewide water quality control plans. Permits include requirements for effluent limitations. Permits for discharges to water bodies that do not yet meet water quality objectives may require effluent limitations consistent with a waste load allocation to ensure that the discharge will allow achievement of applicable water quality objectives. An appropriate monitoring and reporting program is included in all permits.
WDRs are issued under State law pursuant to Section 13263 of the Water Code and apply to dischargers that discharge waste to land or to percolation ponds. The disposal method may be by agricultural or non-agricultural irrigation or to ponds, landfills, or leach fields. Similar to NPDES requirements, all WDRs contain effluent limitations, provisions for maintaining an administrative record, and monitoring and reporting requirements. The City of Guadalupe, the City of Santa Maria and the Laguna County Sanitation District discharge wastewater under separate WDRs.
1.1.4 Nonpoint Source Discharge Requirements
The State Boards Nonpoint Source (NPS) Pollution Control Program is responsible for statewide NPS program management, and for providing administrative and technical support for the program to the State and Regional Boards. Nonpoint source is defined to mean any source of water pollution that does not meet the legal definition of “point source” in CWA 502(14). Typically, nonpoint source pollution is transported by rainfall or runoff and may reach surface water or groundwater. Atmospheric deposition and hydrologic modification of surface characteristics (leading to sediment runoff or increased peak runoff, etc.) are also considered nonpoint sources of pollution. The State has several programs to control nonpoint source pollution. They are discussed below.
1.1.5 Condition Waiver of Waste Discharge Requirements for Discharges from Irrigated Lands: Order No. R3-2012-0011(Agricultural Order)
The Central Coast Board employs a regulatory process called a Conditional Waiver of Waste Discharge Requirements to control discharges from irrigated agricultural lands to protect surface water and groundwater quality. This permit applies to owners and operators of irrigated land used for commercial crop production; it is intended to control pollution from pesticides, nutrients, and sediments. Each grower in the Central Coast Region must submit a Notice of Intent to comply with the Order.
On March 15, 2012, the Central Coast Board adopted an updated Conditional Waiver of Waste Discharge Requirements (Agricultural Order No. RB3-2012-0011). The waiver expands the ongoing monitoring and reporting program and places farms in one of three tiers based on risk to water quality. Specifically, the Order includes water quality monitoring of surface and groundwater as well as implementing nutrient management practices pursuant to a plan developed specifically for each farming operation. A fact sheet outlining the

5
requirements of the Order is contained in Appendix D; at this time and during the writing of this report, full implementation of the Order is pending legal challenges.
1.1.6 Stormwater Regulations
The 1987 amendments to the Clean Water Act added Section 402(p) and established initial regulation of municipal and industrial storm water discharges under the NPDES program. In 1990, EPA established application requirements for storm water permits. The regulations require that storm water associated with industrial activities that discharge either directly to surface waters or indirectly through separate municipal storm sewers must be regulated by an NPDES permit. In California a separate statewide general permit has also been issued for construction activity. Currently the City of Santa Maria and the community of Orcutt are subject to municipal stormwater permits focusing on their storm drain systems, which require six types of pollution control activity: public education, pollution source identification and abatement, water quality monitoring, land use regulations, construction site regulation and control of municipal operations.
The State Board issued a general permit regulating all dischargers where construction activity disturbs five or more acres. The intentions of this permit were to eliminate or reduce non-storm water discharges to storm sewer systems and other waters, and to implement and perform inspections of Best Management Practices (BMPs). State agencies such as CALTRANS, municipal agencies and private construction activities are subject to this permit.
1.1.7 Recycled Water Policy
The State of California encourages recycling of water to increase availability and reliability of existing supplies. In order to address long term water quality issues raised by water reuse, the State Board adopted a Recycled Water Policy in February 2009. The purpose of the policy was to protect long term water quality pursuant to existing laws.
The Recycled Water Policy states that Salt and Nutrient Management Plans need to be completed by 2014 to facilitate basin-wide management of salt and nutrient from all sources in a manner that optimizes recycled water use while ensuring protection of groundwater supply and beneficial uses, agricultural beneficial uses, and human health. The Central Coast Board, through its regulation of discharges, now requires operators of publically owned treatment works (POTW) to develop implementation plans to meet the objectives of the Recycled Water Policy, including preparation of Salt and Nutrient Management Plans. The plans will then be adopted by the Central Coast Board as amendments to the region's Basin Plan. The proposed outline for plans developed by the WRCB is contained in Appendix B.
1.1.8 Groundwater Basin Adjudication
The Santa Maria Groundwater Basin was subject to litigation that was partially settled in a June 30, 2005, Stipulation entered by the Superior Court of the State of California, County of

6
Santa Clara (Superior Court, 2008). The Stipulation divided the overall Santa Maria Valley Groundwater Basin into three management areas, the largest of which overlies the main Santa Maria Valley (the Santa Maria Valley Management Area, or SMVMA) which is subject to annual reporting by the Twitchell Management Authority. The other two management areas, the Nipomo Mesa Management Area (NMMA) and the Northern Cities Management Area, are addressed in separate annual reports prepared by separate entities. Most water users, including the public purveyors of water, are subject to the Stipulation. Upon final settlement of the adjudication, all water users in the Valley will be subject to the stipulation.
The Stipulation specifies that monitoring will occur to determine groundwater conditions, land and water uses, sources of water supply, and the disposition of all water supplies in the Valley. Annual Reports by the TMA on the SMVMA to the Court summarize the results of the monitoring and include an analysis of the relationship between projected water demand and supply. Some discussion of water quality is included. Currently the SMVMA annual report is prepared by Luhdorff and Scalmanini Engineers.
1.2 Working Group Collaboration Process The Santa Maria Valley Groundwater study is a new evaluation focusing on salt and nutrient issues that was developed through a collaborative process involving stakeholders within the Santa Maria Valley, as further described below (Appendix C).
1.2.1 IRWM Planning Framework
The development of this report was guided by a Working Group comprising water users, local and state agencies, non-governmental organizations and other interested parties (Appendix C). The Working Group was formed within the framework of the Santa Barbara county IRWM Plan update to focus specifically on salt and nutrient issues in the Santa Maria Valley. The group was open to all interested parties and worked under mutually agreed upon ground rules relating to meeting protocol and decision making. Participation by a diverse group of stakeholders and the public was actively solicited and project development was reported through the County of Santa Barbara IRWM website.
1.2.2 Guided by Local Stakeholder Interests
Local stakeholder in-basin interests provided much of the data used to prepare this report and provided review to assure the report accurately reflects issues related to salt and nutrient planning in the Santa Maria Valley. From the outset, the local stakeholder interests sought a report that could help all users to provide sustainable, local water sources to meet all local needs as well as recognizing the sustainable practices already implemented by stakeholders.

7
1.2.3 Water Users and Dischargers
Two types of operations are essential to characterizing Santa Maria Valley water quality: 1) production and use by municipal and agriculture interests and 2) water discharge by WWTP operators and agriculture (Figures 1.2a, 1.2b, 1.2c, 1.2d, 1.2e, and 1.2f are a set of six conceptual transport and fate diagrams, which are the same diagrams referred to later in this report in several places). Water user groups are well represented in the Working Group. Water users included urban water suppliers, agricultural water users, and environmental demands. In the Santa Maria Valley, urban water suppliers rely on both groundwater and imported deliveries from the State Water Project (SWP). Agricultural water users rely predominately on groundwater extractions. (Some minor sprinkler irrigation relies on treated WWTP effluent.)
Dischargers include WWTPs, municipal storm drains, and agricultural drainage. As described in subsequent sections, discharges within the Santa Maria Valley have been adequately monitored to allow general characterization.
1.2.4 Collaborative and Non-Regulatory
Like all other elements of the IRWM Planning process, the Working Group is non-regulatory and collaborative. The group structured its meetings, adopted ground rules, hired a technical consultant, and modified the scope of work during the initial stages of the process. The scope of work and structure of the work products were deliberately crafted to avoid the appearance of complying with a particular regulatory process, while developing information each of the individual dischargers may use as a basis for meeting State mandates to prepare a Salt and Nutrient Management Plan.
1.2.5 Regular Meetings Open to the Public
Regular monthly meetings were held in the Santa Maria Valley among Working Group members, the technical consultant, and members of the IRWM Planning team. These meetings were used to share information, review interim work products, and provide direction to the technical consultant.
1.3 Agency Coordination This report was prepared under the auspices of the Santa Barbara County Integrated Regional Water Management Plan. The IRWM Planning process includes 28 agencies including the following members of the working group that guided preparation of this report:
Santa Barbara County Water Agency (CWA) Twitchell Management Authority (TMA) Santa Maria Valley Water Conservation District (SMVWCD) City of Santa Maria and City of Guadalupe Golden State Water Company (GSWC)

8
Laguna County Sanitation District (LCSD) Central Coast Regional Water Quality Control Board (CCRWQCB)
These agencies collaborate in a number of areas on an ongoing basis. They each participated as active members of the working group and provided data as well as comments on the direction of the assessment. These agencies will continue to collaborate and provide direction through the IRWM Planning process.
1.4 Purpose of the Groundwater Assessment This groundwater assessment was conceived and scoped based on water users’ interest to assure sustainability of water supplies as well as address concerns about regulatory requirements, specifically future development of Salt and Nutrient Management Plans that are required pursuant to recycled water policy as discussed in Section 1.1. The goals of this assessment are to identify regulatory requirements, gather data, summarize key issues, and provide recommendations to support future development of Salt and Nutrient Management Plans that are required by regulation for all groundwater basins and sub-basins in California. To reach those goals, this report includes the following:
Regulatory overview including identification of current beneficial uses Description of institutional responsibilities and roles among water users Description of transport and fate mechanisms Estimate of the salt and nutrient balance in the Santa Maria Valley Description of ongoing management activities
The identification of current uses and water quality trends in the assessment are based on existing reports and input from the Working Group focusing on: Urban Water Supply Agricultural Water Supply Habitat support
Excessive salts or nutrients in water may threaten both human health and agricultural viability (Center for Watershed Sciences, 2012). Currently the principal source of supply in the Santa Maria Valley is groundwater. Ongoing monitoring suggests that both salt (TDS) and Nutrients, specifically nitrate (NO3), are increasing in some areas of the Valley. NO3 is a component of “salts” and is included in the measurement of TDS. However, due to the nature of its potential effects on human health and environmental resources, NO3 is generally considered separately from other chemical species comprising TDS. In the past decades development of supplemental supplies and new management practices have changed the manner in which salts and nutrients are introduced to the local hydrologic system. At the same time, regulatory agencies may seek to limit discharge of excess salt and

9
nutrients from the Valley through regulation of discharges. Since existing monitoring practices may not provide a comprehensive picture of the benefits of existing and future management practices, conflicts may arise between narrow regulatory objectives and implementation of feasible management practices. This assessment establishes an information base upon which to plan for the sustainability of water resources for all users. It is intended to be a first step in understanding the sources and transport of salts and nutrients within the Santa Maria Valley as well as their fate. This is key to modifying the current monitoring program so that future monitoring may demonstrate how effectively management measures control or reduce salt and nutrient levels in ground- and surface water within the basin.
1.5 Approach of the Groundwater Assessment In order to put available data in a straightforward framework and evaluate changes in conditions with time, the assessment focuses on typical conditions in three years: 1990, 2000 and 2010. Based on a conceptual model of salt and nutrient sources and movement in the basin the following factors were evaluated:
Sources and chemical quality of water sources Nature, amount, and use of water produced Transport of water Changes in water quality Changes in water and nutrient management
1.5.1 Conceptual Model Discussion
The Working Group based its development of a working conceptual model (included as Figures 1.2a through 1.2f) of Santa Maria Valley hydrology on previous work (such as Gibbs 2012 and Luhdorff and Scalmanini, 2011). The conceptual model shows the basic elements of sources, transport, and fate of salt and nutrient. These essential elements are represented numerically in the evaluation section. The calculation of flow volume and salt and nutrient concentration allows estimates of total transport and balance (salt/nutrient transported into and out of the valley) as discussed in Section 3.
1.5.2 Hydrology
For the purposes of understanding salt and nutrients in the Santa Maria Valley, there are three essential hydrologic factors that control transport and fate. They are:
Elements of Recharge: rainfall, stream flow, importation of state water substituted for pumping, waste water treatment ponds, and deep percolation (return flow) from agriculture and other irrigation.

10
Elements of Discharge: flow to surface water bodies that discharge into the ocean, groundwater flow to ocean, and in the case of nutrient, transformation to other forms (such as N2) that have no water quality implications.
Sinks: salt and nutrient accumulation that may occur without deleterious effects.
1.5.3 Inputs-Sources of Salt and Nutrient
The evaluation of salt and nutrient requires data on water quality as well as the volume of water moving into and through the elements of the hydrologic system. For this report, data on sources of salt and nutrient were obtained from water quality sample results posted on the Central Coast Board and USGS websites as well as limited data in other publications (Luhdorff and Scalmanini, 2011). In addition, data were provided by water purveyors including the City of Guadalupe, City of Santa Maria, and Golden State Water Company. Discharge data were obtained from operators of POTWs and the Central Coast Board. Data on nutrient use by agriculture was based on nutrient application guidelines for crops published by the University of California Cooperative Extension Service. These guidelines provide an order of magnitude estimate of nutrient use. Refined estimates could be developed from use of alternative data sources (e.g. Center for Watershed Sciences, 2012), however, professional judgment discussed among the Working Group members indicates a key conclusion of Section 4 (that NO3 loading has decreased with time) would likely not change.
1.5.4 Transport Mechanism
Transport mechanism refers to the manner and means that salt and nutrient move through the Valley’s hydrologic cycle. Salt transport generally follows flow of surface water and groundwater. The transport of nutrients, specifically nitrate (NO3), is more complex as a result of plant uptake and chemical transformations that occur in soil.
1.5.5 Fate
Generally speaking salt and nutrients are removed from the hydrologic system through surface or subsurface flow or disposal (by Laguna Sanitation District). Specific to nitrogen, natural processes may convert nitrate (NO3) into N2 (a gas) or other forms that are less detrimental from a management standpoint. The movement of both salt and nitrates may be attenuated during movement through unsaturated soils above the water table known as the vadose zone. This attenuation may be a factor in understanding the accumulation of salt and nitrate in that zone. The fate of salt is somewhat less complex since the evapotranspiration of water from the root zone by plants does not remove salts. As a result the majority of salt is concentrated by evapotranspiration and remains available for transport by water movement.
Nitrogen, on the other hand, is added to the root zone in any of several forms to support plant growth to meet target yields and extracted with the plant material when it is harvested; keeping track of the fate of nitrogen requires several components: 1) short-term decisions regarding nitrogen management during a crop growing season, 2) annual and multi-year,

11
long-term root zone budgeting for available nutrients, and 3) a basin wide long-term budget to understand the fate of nitrate that leaches past the root zone and into the groundwater basin. The third component, the groundwater basin, is a large-scale system in comparison to the management of each crop growing in a field-scale.
1.5.6 Water and Nutrient Management
Water and nutrient management, practiced by water management agencies (discussed below) and water users, is influenced by changes in annual precipitation, regulations, and pricing. In particular, changes in cost and availability of water and cost of nutrients are considered in this report as a function of time focusing on three points in time, ten years apart, specifically 1990, 2000 and 2010. The operation of Twitchell Reservoir, importation of relatively expensive supplies from the State Water Project, increasing power costs (which increase the cost of pumping and conveying water) and increased fertilizer costs have led to increased management of salt and nutrients.
1.6 Existing Water Management and Institutional Framework Extraction, use and discharge of water are subject to a complex management and institutional framework. Generally speaking, groundwater extraction is subject to court jurisdiction pursuant to adjudication (Superior Court, 2008; Luhdorff and Scalmanini, 2011). The adjudication provides certainty as to allocation of groundwater and requires ongoing monitoring to be summarized in annual reports (Superior Court, 2008). In addition, the court established the Twitchell Management Authority to oversee preparation of the annual report for the SMVMA and provide for long term maintenance of the Twitchell Reservoir. Data for the annual report is developed by local agencies and the U. S. Geologic Survey (USGS). Water imported to the valley from the State Water Project on behalf of municipal users is managed by the Central Coast Water Authority, a joint exercise of powers agency comprising local agencies including the three municipal system operators in the valley.
Surface water is managed through the operation of Twitchell Reservoir and maintenance of the Santa Maria River levee system. Twitchell Reservoir is operated by the Santa Maria Valley Water Conservation District to provide enhanced groundwater recharge and regulate flood flows in the Cuyama and Santa Maria Rivers. The Sisquoc River, the other main tributary to the Santa Maria River, is unregulated.
1.7 Stakeholder Roles and Responsibilities A wide range of interests were represented during scoping and preparation of this report. These interests, or stakeholders, formed a working group (Appendix C) to provide the following:
Guide development of Groundwater Assessment Report Provide information, analysis reports and management program overviews Accept Groundwater Assessment Report

12
Discuss process to Develop Salt/Nutrient Management Plan(s)
The development of this report is part of a broader process to update the Santa Barbara County Integrated Regional Water Management Plan. The Working Group is a subset of the group performing that update and provided regular updates to the IRWM Steering Committee. This assessment will be incorporated into the revised IRWM Plan.
1.8 Organization of This Report This assessment is based on a scope of work developed by the Working Group and approved by the DWR in conjunction with the grant (Appendix A). This assessment contains several sections:
1 Introduction 2 Existing Monitoring and Uses of Data 3 Description of Valley Hydrology and Hydrogeology 4 Sources, Transport and Fate of Sodium, Chloride and Nitrogen 5 Evaluation of Existing Monitoring 6 Summary and Conclusions
In addition to this assessment, the Working Group will formulate a process to develop goals and objectives as a separate Technical Memorandum. This process will be based on the review of existing data (Section 2 of this assessment) and development of shared understanding of salt and nutrient transport and fate (Section 3) and the conclusions of the Groundwater Assessment Report (Section 6). The working group is expected to address both institutional and quantitative goals and objectives.
Section 2 of this report includes a discussion of the source of existing monitoring programs and uses of data collected. The purpose of each major data acquisition program is described along with a summary of data acquisition, management, and availably. Other data acquisition efforts that contributed to this report are described as well.
Section 3 of the report includes a description of water resources and use in the valley. In particular, hydrology and hydrogeology of the valley are discussed as they pertain to transport and fate of salt and nutrient. This description of the valley’s water resources is based on past studies and reports. The information, including current water management, is structured to support development of a conceptual model of the basin.
Section 4 of the report describes the sources, transport, and fate of TDS, chloride and nitrogen. The working group developed a conceptual model of the basin focusing on sources of salt and nitrogen, and mechanism of transport. Three points in time are discussed (1990, 2000, and 2010) in order to capture changes in management that may be reflected in water quality data. Notable changes in nutrient management practices that may reduce nitrogen loading are discussed along with measures to reduce salt levels in urban water supplies and

13
recycled water. The model was used to organize available data in tables showing estimated inputs and outputs of TDS, Cl, and NO3 in the years 1990, 2000, and 2010. These tables show the estimated “balance” of these dissolved species within the hydrologic system for each of the three years.
Section 5 of the report evaluates the existing data used to estimate various elements of the conceptual model (groundwater, surface water, wastewater, etc.). Existing monitoring efforts include:
Measurement of groundwater extraction Measurement of the volume of SWP water imported to the valley Measurement of discharge from waste water treatment plants and tail water systems Measurement of water table fluctuation Measurement of surface and subsurface discharge to the ocean Measurement of surface water quality Measurement of extracted groundwater quality Measurement of return flow quality (to groundwater)
Because existing monitoring programs were not developed to document salt and nutrient issues, this report discusses data collection programs in the context of their applicability to the estimates developed in the report. The conclusions and recommendations resulting from the evaluation of monitoring programs are incorporated into the conclusions and recommendation of this report.

®4 0 42
Miles
Salt and Nutrient Planning WorkgroupSanta Barbara County IRWM Plan 2013
Santa Maria Groundwater Management Area
LOCATION OF ASSESSMENT AREA: SANTA MARIAVALLEY GROUNDWATER MANAGEMENT AREA
FEBRUARY 2013 FIGURE 112-Fe
b-201
3
Z:\Pr
ojects
\1182
10_S
antaM
ariaV
alley
\Santa
Maria
Mana
geme
ntArea
.mxd
R
S
Santa Maria Valley Management AreaCity LimitCounty

Salt and Nutrient Planning WorkgroupSanta Barbara County IRWM Plan 2013
Santa Maria Groundwater Management Area February 2013 Figure 1.2a
TDS Balance Diagram, Eastern Santa Maria Valley

Salt and Nutrient Planning WorkgroupSanta Barbara County IRWM Plan 2013
Santa Maria Groundwater Management Area February 2013 Figure 1.2b
TDS Balance Diagram, Western Santa Maria Valley

Salt and Nutrient Planning WorkgroupSanta Barbara County IRWM Plan 2013
Santa Maria Groundwater Management Area February 2013 Figure 1.2c
Chloride (Cl-) Balance Diagram, Eastern Santa Maria Valley

Salt and Nutrient Planning WorkgroupSanta Barbara County IRWM Plan 2013
Santa Maria Groundwater Management Area February 2013 Figure 1.2d
Chloride (Cl-) Balance Diagram, Western Santa Maria Valley

Salt and Nutrient Planning WorkgroupSanta Barbara County IRWM Plan 2013
Santa Maria Groundwater Management Area February 2013 Figure 1.2e
Nitrate (NO3) Balance Diagram, Eastern Santa Maria Valley

Salt and Nutrient Planning WorkgroupSanta Barbara County IRWM Plan 2013
Santa Maria Groundwater Management Area February 2013 Figure 1.2f
Nitrate (NO3) Balance Diagram, Western Santa Maria Valley

21
2 Existing Monitoring and Uses of Data
Several types of data were utilized for this assessment. When available, firsthand water use information was obtained from city, county, and private agencies; such as the City of Santa Maria, the City of Guadalupe, the Central Coast Water Authority, and Golden State Water Company. The data provided from these agencies often included water quality information including:
Time series data on water levels, water quality, water use and water discharge. Spatial data including crop types and variation in aquifer characteristics, and Guidelines for water and fertilizer use and management.
In other cases, data was developed from University of California, Division of Agricultural and Natural Resources and the Natural Resources Conservation Service information relating to general practices in effect during the time period evaluated.
Information was available from a number of sources listed in the bibliography including agency websites, published reports and agency files. Although data acquisition and analysis focused on the years 1990, 2000, and 2010, all data made available was reviewed for relevance and applicability.
2.1 Existing Monitoring Programs and the Current Use of Data Extensive monitoring of water resources in the Santa Maria Valley has occurred for decades. Measurements of stream flow, groundwater levels and surface- and groundwater quality have been made in support of water resources management. The location and nature of measurements has changed as the perceived need for data collection has changed. This section describes existing water resources monitoring.
2.1.1 Geological Survey Monitoring
Groundwater levels are measured in the spring and a subset of these wells is measured in the fall. Water levels and water quality are measured at multiple completion wells at two locations along the coast to monitor for sea water intrusion. Annual water quality measurements are made in shallow and deep wells indicated in Figures 2.1a and 2.1b. In cooperation with local agencies the United States Geological Survey (USGS) measures stream flow, groundwater elevation and water quality in locations throughout the valley indicated in Figure 2.1c. Continuous stream flow monitoring occurs at two stations, on the Sisquoc River near Garey and the other on the Santa Maria River at the Bonita School Road crossing between the Cities of Santa Maria and Guadalupe. In addition, releases from Twitchell Reservoir are monitored by the U.S. Army Corps of Engineers.

22
2.1.2 CCRWQCB Monitoring
In 1998 the CCRWQCB established its Central Coast Ambient Monitoring Program (CCAMP) which includes 37 surface water sites in the Santa Maria Valley. Sites in the valley include natural stream flow and agricultural tail water discharges. The CCAMP monitoring is done in sites throughout the Central Coast region on a 5-year cycle. Data are used to identify long-term trends in surface water quality, particularly water bodies that may be affected by point or non-point discharges. The monitoring strategy calls for dividing the Central Coast into five watershed rotation areas and conducting sampling each year in one of the areas. Monitoring sites are placed at the lower ends of tributaries and along the main stem of major rivers. In the Santa Maria Valley the monitoring sites are located on the Santa Maria, Sisquoc and Cuyama Rivers as well as Orcutt Creek, Oso Flaco Creek and the Bradley Ditch. The Santa Maria Valley area was last sampled in 2011.
2.1.3 City of Santa Maria
The City of Santa Maria measures water quality and volume of pumped groundwater from each of their production wells. The purpose of these measurements is to comply with water quality regulations and efficiently manage its resources. Due to elevated levels of nitrate in some of the production wells, the City utilizes a blending program whereby lower-quality water is blended with higher-quality water from other wells, or with treated SWP surface water, to meet potable water quality requirements.
2.1.4 Golden State Water Company
Golden State Water Company, which supplies the unincorporated community of Orcutt and other smaller nearby communities with potable water, also measures water quality and the volume of pumped groundwater from each of their production wells. The water quality of most of GSWCs production wells is generally good. As such, a formal blending program has not been implemented.
2.1.5 City of Guadalupe
The City of Guadalupe has two available groundwater production wells and SWP water with which to meet its urban water demand. Water quality measurements are taken regularly to ensure the pumped groundwater that is blended with treated SWP water meets all state water quality regulations. In 2011 and 2012 the City of Guadalupe blended SWP surface water with one of their groundwater production wells to meet their urban water demands.
2.1.6 Central Coast Water Authority
The Central Coast Water Authority performs water quality tests on SWP water delivered to each SWP contractor. Water quality tests and volume measurements are performed at the point of delivery to each contractor. The water volume data is collected for the obvious reason of ensuring that SWP contractors receive their water allotments.

23
2.1.7 County of Santa Barbara Public Works Department
The County of Santa Barbara Public Works Department, Water Resources Division operates a number of rainfall gauges throughout the Santa Maria Valley, including two Primary Rainfall Stations; the Santa Maria City and Sisquoc Fire Station gauges. These gauges collect daily, monthly, and yearly rainfall data, as well as rainfall intensity data. These data sets are used to develop historical rainfall graphs, trend graphs, rainfall contour maps, and frequency-duration curves.
2.1.8 Waste Water Treatment Plants
Each of the wastewater treatment plants (Santa Maria WWTP, Guadalupe WWTP, and Laguna County Sanitation District WWTP) monitors the flow volume and water quality of their treated effluent. The city of Santa Maria WWTP discharges at its effluent to infiltration/evaporation ponds. Laguna County Sanitation District and the City of Guadalupe use their effluent for landscape irrigation purposes. Laguna County Sanitation District also provides further treatment (reverse osmosis) to a portion of its waste stream which creates concentrated brine that is discharged to a (brine) well, the discharge of which is located far below the Santa Maria Valley Groundwater Basin (specifically, below the underground source of drinking and irrigation water).
2.1.9 Central Coast Water Quality Preservation, Inc.
Preservation, Inc. is a grower-directed non-profit that manages the Cooperative Monitoring Program (CMP) to fulfill water quality monitoring required in the Ag Waiver. Preservation Inc. is not a regulatory agency and does not enforce regulations. The CMP consists of monthly monitoring of conventional parameters (i.e. nutrients and general chemical/physical parameters) at roughly 50 sites in agricultural watersheds throughout the Central Coast, including 10 sites in the Santa Maria and Oso Flaco watersheds as shown in Figure 2.1d. All sites exhibited water quality impairment (i.e. 303d-listed) prior to selection for the program. Sites are also monitored for aquatic toxicity to invertebrates, fish, and algae in water (four times per year) and to invertebrates in sediment (once per year). Testing for pesticides, herbicides, and other potential toxicants is performed occasionally during special projects.
2.2 Sources, Nature and Applicability of Data to this Assessment USGS – The USGS collects groundwater samples from various wells in the Santa Maria Valley. As groundwater hydrology is an interpretive science, known points of data are used to interpolate and extrapolate information regarding a given groundwater basin. In general, water level measurements are the principal source of information about the hydrologic stresses acting on an aquifer, and how these stresses affect groundwater recharge, storage, and discharge. Additionally, water quality measurements are used to determine the relative health of the aquifer, and to identify degradation or contamination of the aquifer. The goal of the water level and water quality monitoring is to obtain the groundwater data needed for operating, administering, managing, researching, and planning water resources programs.

24
The water quality information from the USGS is invaluable to the salt and nutrient analysis. The data provides a snapshot of the composition of water in the basin. When combined with flow and quality data from other sources (surface water, M&I pumping, WWTPs, etc.) a clearer picture of the interaction between the various water sources begins to develop. USGS data is used in developing the SMVMA Annual Reports.
CCAMP – As indicated in the previous section, CCAMP collects stream flow and water quality measurements on tributaries, main-stems, and water-bodies of special concern. Salt and nutrient loading on surface water within the Santa Maria Valley are seasonally dependent, and highly variable. The yearlong monitoring provided by CCAMP captures this variability and allows for a one-year “snapshot” of salt and nutrient levels in surface waters and discharge from certain areas of the groundwater basin.
SMVMA Reports – The Santa Maria Valley Management Area Reports compile the volume and water quality data for each purveyor into a single source (for example see Luhdorff and Scalmanini 2012). When water data from the various sources was not provided, the SMVMA Reports were used to supplement water use, water quality and discharge estimates.
Water Purveyors – The water volume and quality data collected by each water purveyor was utilized to develop the water, salt, and nutrient balance estimates in this report.
WWTP Operators – In similar fashion to the water purveyors, the volume and quality data collected by the WWTP operators was used to develop the water, salt, and nutrient balance estimates used in this report.
County Agricultural Commissioner– Crop land use information, and crop water use was provided to estimate the agricultural applied water demand.
Central Coast Water Quality Preservation, Inc. – Surface water sampling has been conducted on behalf of the growers since 2004. The volume and quality data was used to develop the water, salt, and nutrient balance estimates used in this report.

Salt and Nutrient Planning WorkgroupSanta Barbara County IRWM Plan 2013
Santa Maria Groundwater Management Area February 2013 Figure 2.1a
Well Network for Monitoring Shallow Groundwater

Salt and Nutrient Planning WorkgroupSanta Barbara County IRWM Plan 2013
Santa Maria Groundwater Management Area February 2013 Figure 2.1b
Well Network for Monitoring Deep Groundwater

Salt and Nutrient Planning WorkgroupSanta Barbara County IRWM Plan 2013
Santa Maria Groundwater Management Area February 2013 Figure 2.1c
Surface Water and Climatic Monitoring Network

®4 0 42
Miles
Salt and Nutrient Planning WorkgroupSanta Barbara County IRWM Plan 2013
Santa Maria Groundwater Management Area
CENTRAL COAST AMBIENT MONITORINGPROGRAM SAMPLING SITES
FEBRUARY 2013 FIGURE 2.1D12-Fe
b-201
3
Z:\Pr
ojects
\1182
10_S
antaM
ariaV
alley
\CCA
MP_S
ites.m
xd
RS ! ' CCAMP Site
Monitoring Site - 303(d) list for salts
³± ±PTWW Wastewater Treatment Plant
Canal DitchChannelPipelineBasinsSanta Maria Valley Management AreaCity LimitCounty
29
3 Description of Basin
This section discusses the hydrology, hydrogeology and development of water resources of the Santa Maria Valley as it pertains to transport and fate of TDS, Cl- and NO3. The importance of water to the valley’s economy has resulted in numerous studies of water resources and ongoing monitoring of water supplies and water quality. The discussion below is a summary; more detailed discussions are provided in the references listed in the Section References, particularly USGS Professional Paper 1000 (Worts, 1951), annual reports prepared by the Twitchell Project Authority (Luhdorff and Scalmanini, 2008, 2009, 2010, 2011 and 2012) and the County’s Triennial Groundwater report (Gibbs 2012).
3.1 Past Studies and Sources of Information This report relies on a wide range of sources of information including but not limited to the major sources mentioned below. Studies developed to describe and evaluate water resources are listed in the references section of this report. Key evaluations of water resources by Lippincott and the United States Bureau of Reclamation described surface hydrology of the Santa Maria River and its tributaries and led to development of the Santa Maria Project (Twitchell Reservoir) to provide flood protection and enhanced groundwater recharge.
Detailed studies by the US Geological Survey have described surface and groundwater resources including elements of recharge and discharge as well as water quality. The US Geological Survey established ground and surface water monitoring which has continued as a cooperative program with the County Water Resources Division and the Santa Maria Valley Water Conservation District. In addition, the Twitchell Management Authority prepares an annual report pursuant to the recent adjudication (Luhdorff and Scalmanini, 2012) and the RWQCB periodically samples water quality at a number of surface water locations (CCAMP). Finally, water purveyors make regular tests of supplies and waste water treatment plant operators make measurements of discharges.
3.2 Geography and Surface Hydrology Santa Maria Valley is a broad alluvial plain generally considered to include the lower portion of the Sisquoc River and the Santa Maria River. Low hills drained by smaller streams occur along the southern margin. The Valley is bounded by the Solomon hills in the South, the Nipomo Mesa to the north, the Sierra Madre Mountains to the northeast and east and the Pacific Ocean to the west. This assessment focuses on the lower portion of the basin which encompasses approximately 260 square miles including areas of both agriculture and urban and suburban development.

30
Figure 1 contains rivers, urban areas, and surface water features (including Twitchell Reservoir). Location and depth of monitoring wells, rainfall and stream flow gages, and location of CIMIS stations are found in Section 2 of this report and available from the Annual Report of Hydrological Conditions, Water Requirement, Supplies, and Disposition (Luhdorff and Scalmanini, 2012).
The Santa Maria Valley is traversed by the Santa Maria River along its northern margin and lower reaches of its tributaries, the Sisquoc and Cuyama Rivers, to the east. Although the Santa Maria River and its tributaries are ephemeral, surface flow is responsible for a majority of groundwater recharge. But due to extreme variation in flow, surface water is not used directly (diverted) as a water supply. However, significant recharge does occur during and after storm events thus recharge from the larger tributaries affects groundwater quality.
Twitchell Reservoir was designed to capture intermittent storm runoff in order to provide increased groundwater recharge and flood protection. The reservoir has demonstrated effective management over the lower Cuyama River, but inflow is highly variable. For example inflow reached a peak of 190,000 Acre-feet in 1983 but the reservoir has received little or no inflow for up to three years at a time. Since 1965 (when the reservoir was placed in operation) reservoir storage has exceeded 100,000 AF only 8 times.
Other significant surface water recharge occurs as a result of infiltration of treated waste-water and from surface streams such as the Orcutt/Solomon Creek system and Bradley Ditch. Generally speaking, surface recharge that occurs east of Black Road percolates to the deeper elements of the aquifer system. Treated sewage effluent from the City of Santa Maria is recharged to the groundwater system from percolation ponds in the vicinity of Black road. The majority of this recharge is believed to percolate to the deeper elements of the Aquifer and recharge the lower (confined/semi-confined) zone underlying the western most portion of the valley. Tertiary treated sewage effluent from the Laguna County Sanitation District (serving Orcutt and unincorporated Santa Maria) is used for irrigation. The City of Guadalupe discharges treated water through sprinkler irrigation on an area of grasses to the north and east of the City. Any recharge to the groundwater from the City of Guadalupe discharge is mostly confined to the uppermost aquifer zone in an area west of most groundwater development.
Two surface discharge points that discharge out of the SMMA towards the ocean exist; 1) Orcutt Creek that discharges to SM River prior to the ocean outlet and 2) Oso Flaco Creek [detailed descriptions are found in the CMP 2008 summary report Follow-up Monitoring Report, WQ Results from Upstream Monitoring, 2008]
3.3 Geology, Geologic History and Hydrogeology The materials underlying the Santa Maria Valley comprise extensive deposits of water bearing alluvium and semi-consolidated sedimentary materials of Plio-Pleistocene to Recent age. These materials have accumulated in a broad asymmetrical syncline or trough formed

31
by downward warping of underlying bedrock. The water-bearing materials are as much as 1,200 feet thick beneath the central portion of the valley and extend beneath the ocean to the west. The older (and deeper) water-bearing materials include the Careaga Sand and overlying Paso Robles Formation. Quaternary age alluvium overlies the Paso Robles Formation. Dune sand and bedrock occur along the margins of the basin but are not widely developed as sources of water. (The occurrence of these materials is described in several reports including Worts, 1951, Gibbs, 2012 and Luhdorff and Scalmanini, 2012).
In general the alluvial materials and the Paso Robles Formation become progressively less coarse grained from east to west (Luhdorff and Scalmanini, 2012). In the westernmost portion of the Valley, the alluvium appears crudely stratified with a confining or semi-confining horizon dividing the aquifer into at least two zones west of the Bonita School Road. Both the upper and lower zones of the aquifer are described as extending to the west beneath the ocean for as much as several miles (Worts, 1951).
The aquifer is unconfined in most of the basin (east of Black Road) and stream flow, rainfall, and return flows all contribute significant recharge. The westernmost portion of the aquifer includes two zones separated by an impermeable (confining) zone. Agricultural return flows and rainfall are the main sources of recharge to the upper (unconfined) zone. The lower zone is confined and receives most of its recharge from where it is unconfined east of Black Road and may receive some recharge from interzonal flow in wells that are completed in both zones. Local water level elevations suggest that both aquifer zones discharge to the Pacific Ocean to the west. No evidence of sea water intrusion has been found in monitoring wells located along the westernmost edge of the basin.
3.4 Development of Water Resources The majority of water available to the Santa Maria Valley has historically derived from stream flow in the Santa Maria River originating from the Cuyama and Sisquoc rivers. This stream flow is not developed directly as a supply, but rather is the main source of groundwater recharge in the area. Releases from Twitchell Reservoir are used exclusively to augment natural recharge to the groundwater basin. Thus, quality in aquifers underlying much of the Santa Maria Valley has historically reflected the water quality of stream flow in the Cuyama and Sisquoc rivers.
Urban supplies are developed from both groundwater and imported (surface) sources. Typical deliveries of water to urban users are about 23,000 AFY, with a peak historical demand of 25,600 AF in 2007. Agricultural users are supported entirely by wells and water use ranges from 80,000 to 130,000 AFY on roughly 50,000 acres of irrigated crops. In the Santa Maria Valley habitat is supported by surface flows and in some areas shallow groundwater. Water supported habitat includes willows and wetlands along the lower Santa Maria River and Green Canyon and the lagoon at the mouth of the Santa Maria River. No estimates of water needed to support these habitats are available.

32
Groundwater storage within the basin varies as a function of annual rainfall, and to a lesser extent, importation of State Water Project supplies. Groundwater storage has been estimated to be about 2.5 million AF (MAF) in 1984 and 1.97 MAF in 1991 (Ahlroth, 2002). Substantial fluctuations in water levels are caused by variations in annual rainfall and are documented by the County Water Agency in regular reports (Gibbs 2012).
Until 1996 groundwater was the source of supply for all users in the Valley; in that year urban water users began importing water from the State Water Project. Currently the Santa Maria Valley relies on groundwater to meet all agricultural and some urban needs and with imported water being used extensively in the City of Santa Maria and to some extent in the City of Guadalupe and the community of Orcutt.
Water is imported to the Santa Maria Valley through the Coastal Branch of the State Water Project for municipal use. Municipal supplies are delivered directly to the cities of Santa Maria and Guadalupe and the Tanglewood community serviced by the Golden State Water Company (GSWC, formerly Southern California Water Company). The GSWC serves both groundwater and SWP supplies to the community of Orcutt and its immediate area. GSWC makes its SWP deliveries to the community of Orcutt through interconnections with the City of Santa Maria. (The GSWC provides solely groundwater to the small towns of Sisquoc and Garey.)
3.4.1 Groundwater and Wells
Groundwater development began in the early 1900’s and rapidly became the principle source of water for all uses. For decades until the importation of State Water supplies, groundwater was the sole source of supply. Roughly 80 percent or more of the water used in any given year is developed from wells. Wells are generally completed in alluvium or the Paso Robles formation with some being completed in the deeper Careaga Sand.
3.4.2 Twitchell Reservoir
Twitchell Reservoir was constructed as a dual purpose reservoir, built by USBR under contract with SBCWA to provide both flood protection and groundwater recharge. The dam was completed on and put into service in 1966. The reservoir provides no direct deliveries for supply; its releases are controlled to provide infiltration to alluvium in the Santa Maria River.
As discussed by Luhdorff and Scalmanini, inflow and storage in the reservoir vary greatly; this variation results in significant variation in recharge to the groundwater basin (see Figure 2.3-1a and Table 2.3-1 of Luhdorff and Scalmanini, 2011). The average annual recharge is estimated to be 32,000 AFY. The principle area of recharge is dictated by geologic conditions and is in the Santa Maria River from the confluence of the Cuyama and Sisquoc Rivers to Bonita School Road crossing.

33
Analysis by Luhdorff and Scalmanini suggests that operation of the Reservoir has changed the nature of recharge to the groundwater basin from the Cuyama River. Prior to construction of the reservoir, much of the storm runoff from the Cuyama drainage passed to the ocean immediately during and after high flow events. During operation of the reservoir, storm runoff is captured for later recharge to the groundwater basin. Low flow from the Cuyama River tends to have higher TDS than storm runoff. Thus the reservoir captures higher quality water for recharge and increases the percentage and amount of higher quality water recharging the groundwater basin (Luhdorff and Scalmanini, 2012). Water quality trends in groundwater, particularly in the zones affected by Twitchell recharge, supports their interpretation. The Operation of Twitchell Reservoir has been estimated to provide an average of 32,000 AFY (Luhdorff and Scalmanini, 2012) of recharge to the groundwater basin.
3.5 Agricultural Water Supply and Demand For the purpose of this report, an agriculture water supply and demand estimate for three ten-year periods 1981-1990, 1991-2000, and 2001-2010 was utilized, as shown in Table 3.5. All agricultural water demand in the Santa Maria Valley Management Area (SMVMA) is supplied by local groundwater, with the exception of some wastewater effluent.
3.5.1 Agriculture Water Requirements
The estimated agricultural water requirement for each time period was based on crop acreage and estimated groundwater pumping to meet crop water requirements found in the 2011 Annual Report of Hydrogeologic Conditions, Water Requirements, Supplies and Disposition, Santa Maria Valley Management Area, (Luhdorff and Scalmanini, 2012). The report contains an estimate for applied water required for crops, groundwater pumping by year, back to 1945. However, the total applied water for each crop type (calculated as crop acres multiplied by applied water per acre) is only shown in Annual Reports since 2008, and not shown for the years prior to 2008. Available data from the Annual Reports included annual acres by crop and total annual pumpage (Table 3.5, below); estimates of annual pumping was available and plotted in Figure 3.1-1c of the Annual Report (Luhdorff and Scalmanini, 2012).
The average water requirements (in terms of groundwater pumping requirements) were used to represent applied water required for the three periods; years 1981-1990, 1991-200, and 2001-2010. Dividing the average pumping by the average acres within each crop allowed for a comparison of unit water use by crop category. Observation of the applied crop water duties in comparison to a 5-year average of crop water duties from the Annual Report combined with professional judgment was used to assign pumping by crop type in each of the three time periods used for this study.
Infiltration of rainfall, an important mechanism, is known to vary significantly in correlation with the wet, normal, and dry years. Thus change to climate may affect the sources and transport of salts and nutrients; however, climate change was not a focus of this study.

34
Table 3.5. Irrigated Crop Acres, Unit Applied Water, and Calculated Applied Water by Crop Category

35
The Historical Distribution of Irrigated Acres, Table 3.1-1b of the Annual Report, provided information on the land use changes over time for the crop categories: Rotational Vegetables, Strawberries, Vineyard, Pasture, and Other. Rotational Vegetables consists of lettuce, celery, broccoli, and cauliflower crops. During the three time periods the SMVMA has experienced an increase in truck crop type acreage. Over these time periods, rotational vegetables became the largest crop category, strawberry acreage increased significantly in last decade, vineyard acres remained fairly consistent, and pasture (including alfalfa), field, and orchard acreages have declined.
The following description of the agriculture land use is from Luhdorff and Scalmanini, (2011):
“In 2010, approximately 50,650 acres in the Santa Maria Valley were irrigated cropland, with the predominant majority (87 percent) in truck crops, specifically Rotational Vegetables (33,850 acres) and Strawberries (10,000 acres). Vineyard comprised the next largest category (4,700 acres), with Grain, Pasture, Nursery, and Orchard in descending order of acreage (990, 320, 215, 20 and 34 acres, respectively). Fallow cropland was estimated to be just over 500 acres. Cropland occupies large portions of the Santa Maria Valley floor, Orcutt Upland, Oso Flaco area, and Sisquoc plain and terraces.
Total irrigated acreage of about 50,650 acres in 2010 is near the upper end of the range over the last 15 years, and within the reported historical range between roughly 34,000 acres in 1945 and 53,000 acres in 1995, as shown in Table 3.1-1b (USGS, Worts, G.F., 1951; California DWR, 1959, 1968, 1977, 1985, and 1995; LSCE, 2000 and 2009). The 2010 irrigated acreage is consistent with those of the last decade, during which total acreages gradually increased from 48,200 acres in 1998. The 2010 cropland locations continue the historical trend of agricultural expansion onto portions of the Orcutt Upland and Sisquoc Valley as urban land use expands into former cropland near the central portions of the Santa Maria Valley and Orcutt Upland.”
3.5.2 Agriculture Water Demand – Pumped Groundwater
Agriculture is the dominant local industry within the SMVMA and principle water user. All agricultural applied water relies solely on groundwater pumping. The total acres irrigated has remained relatively constant since 1981 with the annual agricultural water demand varying between wet, normal, and dry precipitation years as much as 50,000 AFY, ranging from below 80,000 AFY to over 130,000 AFY (Luhdorff and Scalmanini, 2011).
Agricultural water demand is indirectly calculated using crop water requirements multiplied by the number of acres of each crop type. For this report, the estimate of annual pumped groundwater to meet total agricultural water requirement for all crops was utilized from the SMVMA Annual Report (Luhdorff and Scalmanini, 2011). Applied crop water requirements

36
(AW) vary by each crop type and vary substantially for a wet, normal, and dry precipitation year. For the purpose of this assessment, the AW for each of the crop type categories in each of the three periods was estimated based on available information. The estimated annual pumping was averaged for the 10-year periods then divided by the average crop acres by crop categories; a comparison of unit water use for each crop category required some professional judgment in assigning the unit water use in order to match the total average pumping with the sum of each crop category pumping. Unit crop water use is based on Crop ET, Effective Precipitation, and Irrigation System Distribution Uniformity factors.
During the period of 1981 to 2010 the total irrigated area of about 50,000 acres have remained fairly constant with some of the crops acres changing from one crop type to another reflecting growers’ crop selection as market conditions change over time. Annual groundwater pumping to meet crop water requirements varies substantially by the type of rainfall that happens in a given growing season. The main reason for this is the effect that effective precipitation has on crop water requirements for wet years versus dry years in this coastal climate. Improvements to irrigation methods over time have increased the distribution uniformity and increased the effectiveness of applied water over the basin; irrigation method improvements are a positive improvement regarding the basin water management and noteworthy in conjunction with the effect of precipitation on agricultural water requirements.
The variation in total crop water requirements (ETc) and AW (ETaw) to meet the crops’ annual needs are influenced by the coastal climate. The primary factors that influence this variability between years are the total Evapotranspiration (ETc) and the amount of precipitation utilized by each crop type to meet the ETc, known as the Effective Precipitation (Pe). During the time period of 1981 to 2010, the California Irrigation Management Information System (CIMIS) has improved irrigation scheduling and on-farm irrigation efficiency for applied water has improved as irrigation methods have changed over to micro-irrigation systems. An indication of this improvement is shown in the decrease over time of the annual unit applied water, in AF/A for the basin’s crops. The improvements to irrigation methods provide a positive effect in both reduced groundwater pumping and help to reduce water movement past the root zone, therefore, helping to contain nutrients in the active root zone where plants can uptake the available nitrate (NO3). However reduced movement of water through and past the root zone may cause levels of salts in root zone soils to rise.
3.5.3 Agriculture Return Flow
A description of the agriculture return flow component is contained in Chapter 4 of the Luhdorff and Scalmanini, 2011 and included in this assessment. The annual report provides an estimate of return flow for the basin due to irrigation; however, this estimate accounts for effective precipitation, but, does not include the amount of precipitation that moves through the root zone. Therefore, it is possible a more detailed site-specific assessment of the water

37
quality monitoring by drainage areas is necessary to understand the salt and nutrient characteristics by drainage area.
“For the range of crops and irrigation systems in the SMVMA, most crops are considered to consumptively use about 80 to 85 percent of the water applied to them, resulting in an estimated 15 to 20 percent of applied water exceeding crop consumption and deep percolating as return flow to the underlying aquifer system (the one exception to the preceding ranges is wine grapes, where 95% of applied water is estimated to be consumptively used, resulting in return flow of only 5% of applied water).
For the full range of crop categories in the SMVMA, return flow rates in 2010 are estimated to range from less than 0.1 af/ac for Vineyard, to about 0.4 af/ac for the predominant Rotational Vegetables in the Valley, to a maximum of about 0.7 af/ac for Pasture. The respective estimated agricultural return flow rates are detailed in Appendix E. When combined with their respective individual crop acreages, it is estimated that just under 17,000 af of applied agricultural irrigation deep percolated to groundwater as return flows in the SMVMA in 2010.” (Luhdorff & Scalmanini, 2010)
AW in excess of crop water requirement is considered deep percolation once beyond the crop root depth. Deep percolation either returns to the groundwater source or is intercepted by the subsurface tile drains that collect into a surface drain, or it can also be intercepted directly by the surface drain. In either case, the surface drain eventually discharges through an outlet to a surface drainage. Tile drainage discharges in two main locations west of Black Road: Oso Flaco Creek and Orcutt Creek. Some additional tile drainage flows into the lower Santa Maria River.
Since the Agricultural Waiver program changes occurred in 2004, the Central Coast Water Quality Preservation, Inc. has collected surface water samples from the two main drainages that outlet the SMMA. They have also collected samples from the minor drainages that collect to the main drainages. The characteristics of the two minor drainages as measured during a wet period when the drainage flows were fairly consistent year round are included in the following sections as sample observation of a localized intermittent drainages; the sample data is limited and not intended to be used as a representative of all drainage: [The descriptions in Section 3.5.4 and Section 3.5.5 are from the 2008 Upstream Monitoring Report, provided to the Grower Groups and RWQCB through the efforts of Preservation Inc.]
3.5.4 Orcutt-Solomon Creek at Sand Plant (312ORC)
Flows at core CMP site 312ORC were moderate and fairly consistent during 2008, averaging 7.9 CFS. Flows from each of the two contributing channels (Orcutt-Solomon Creek further upstream – 312ORI, and the north fork Solomon Creek – 312ORN) were lower and

38
comparable, with each appearing to contribute about half of the flows aggregated at 312ORC, with 312ORI slightly higher. All sites in the watershed had measurable flows during all 2008 monitoring events.
Nitrate concentrations at 312ORC and in both of the contributing creek channels (312ORN and 312ORI) were consistently high throughout 2008. At 312ORC, concentrations ranged from 19.0 to 72.6 mg/L as N, with a median of 40.3 mg/L. On the basis of median values, 312ORN contributions were somewhat lower and 312ORI somewhat higher, however 312ORN had a maximum nitrate concentration of 380 mg/L.
Nitrate Loads were around 60 lbs. N/hr on a median basis at 312ORC. Contributing loads from 312ORI were typically a bit higher than those from 312ORN, with some exceptions.
3.5.5 Oso Flaco Creek
Flows were present at measurable levels at all Oso Flaco watershed sites during at least ten of the twelve 2008 monitoring events. Flows were highest at the core CMP site (312OFC), with a median value of 2.14 CFS. Flows were lowest at the Bonita School Rd/Division St intersection (312BSR) and where Oso Flaco Creek crosses Highway 1 (312OSR), with median values of 0.19 and 0.33 CFS respectively.
Nitrate concentrations were very high throughout the Oso Flaco watershed, with average values near or above 30 mg/L as N at all sites. Concentrations were lower during the January winter storm event, with values below 10 mg/L at all sites except for the core CMP site (312OFC), which had a concentration of 11.5 mg/L. The highest concentrations on the watershed in 2008 were at the more upstream sites, 312OSR and 312BSR, which had maximum concentrations of 95.6 and 125.0 mg/L, respectively.
Nitrate Loads were highest at the core CMP site (312OFC), following patterns in flow. Median loads at the upstream monitoring sites were roughly three to six times lower, at 2.5 to 5.2 lbs. N/hr.
3.6 Urban Water Supply and Demand The three main public water system operators serving urban users currently deliver approximately 17 percent of the water used in the Valley. Development of most groundwater for municipal purposes is from numerous water supply wells located in the vicinity of the Santa Maria Airport and the town of Orcutt. The City of Guadalupe and the communities of Sisquoc and Garey are served by wells within each community. Historic demand in urban areas of Guadalupe, Santa Maria and Orcutt is tied to population water use by the urban suppliers (GEI 2012).
Water supply and water quality concerns led to importation of SWP supplies in the 1990s. Prior to the late 1990s, all municipal and agricultural water requirements in the Santa Maria Valley were met by local pumping. Since the beginning of SWP availability in 1997,

39
deliveries of SWP water have replaced some of the local pumping for municipal supply. In particular, the City of Santa Maria and Golden State Water Company have reduced pumping in the vicinity of the Santa Maria Airport. The reduction since 1997 has been estimated to be 50-percent on an average annual basis.
Santa Maria relies on the SWP for its principle supply while relying on groundwater for backup. Currently the City of Guadalupe relies on a blend of groundwater and SWP supplies. The Golden State Water Company supplies up to 20-percent of its deliveries from the SWP due to limitations in its allocation from that source. Due to their remote location, the small communities of Garey and Sisquoc are supplied by wells. The importation of SWP supplies has improved the quality of water delivered to customers in the Cities of Santa Maria and Guadalupe, and the TDS of treated wastewater recharged to the groundwater basin at their waste water treatment facilities. However, SWP importation does result in importation of salts to the basin.
3.7 Urban Return Flow Urban return flow is primarily effluent from three publicly owned and operated wastewater treatment plants. A much smaller amount percolates from excess irrigation applied to urban landscaping. The three publically owned WWTPs serve the City of Santa Maria, the City of Guadalupe and the community of Orcutt and unincorporated Santa Maria area. Effluent concentrations of TDS, NO3 and Cl- as well as contributions to groundwater are shown in Appendix E. The nature and discharge of return for each WWTP is summarized below.
3.7.1 City of Santa Maria WWTP
The City of Santa Maria operates a WWTP located on Black Road west of the City. The City’s treated wastewater is percolated to the groundwater pursuant to a Waste Discharge Requirement issued by the CCRWQCB. The volume and quality of the effluent stream are monitored pursuant to that permit and form the basis for estimates used in Appendix E. The importation and use of SWP water and concurrent reduction in regenerative water softener use have lowered the TDS level of the water entering the aquifer from the percolation ponds.
A lesser volume of water, not related to the WWTP, is returned to the groundwater from infiltration of flow from Blosser Channel, Bradley Channel, and Main St. Ditch. During periods of high runoff, these surface drainages flow to the Santa Maria River but during periods of lower flow, most flow seeps into the ground. 3.7.2 City of Guadalupe WWTP
The City of Guadalupe operates a WWTP located at the northwest edge of its incorporation boundary. The City’s treated wastewater is spray irrigated to pasture land pursuant to a Waste Discharge Requirement issued by the CCRWQCB. The volume and quality of the effluent

40
stream are monitored pursuant to that permit and form the basis for estimates used in Appendix E. The importation and use of SWP water has lowered the TDS level of the water discharged.
3.7.3 Laguna County Sanitation District (Orcutt) WWTP
The Laguna County Sanitation District operates a WWTP located northwest of the community of Orcutt and surrounding unincorporated Santa Maria which it serves. Tertiary treated wastewater is treated and discharged pursuant to a Waste Discharge Requirement issued by the CCRWQCB. A portion of the effluent stream is treated by reverse osmosis to reduce TDS. The effluent is discharged as recycled water by irrigation and some industrial uses. Brine resulting from the reverse osmosis is injected into a deep disposal well below the aquifer zones and is permitted by the EPA. The volume and quality of each element of the effluent stream are monitored pursuant to that permit and form the basis for estimates used in Appendix E.
3.8 Existing Water Management Several public agencies are responsible for various aspects of water management in the Santa Maria Valley. However no single agency is responsible for all aspects of water supply or water quality.
3.8.1 Regional
SMVMA - Santa Maria Valley Water Conservation District. SMVWCD was established as a Special District in 1937. The SMVWCD has a contract with SBCWA to pay capital costs and operation of Twitchell Reservoir. The district encompasses an area generally thought to benefit from recharge from Twitchell Reservoir. TMA – Twitchell Management Authority. The TMA was established pursuant to the settlement of the adjudication and comprises representatives of urban and agricultural interests. The TMA prepares an annual report to court and addresses long term maintenance of Twitchell Reservoir associated with protecting reservoir yield. CCRWCB - Central Coast Regional Water Quality Control Board. The CCRWQCB is a regulatory agency responsible for oversight of discharges to surface water and implementing water recycling policy. RCD – Cachuma Resource Conservation District. The RCD provides technical support to growers for improved water and nutrient management. 3.8.2 System Operators
City Santa Maria (water, sewer) – The City of Santa Maria water provides water and sewer service to customers within its service area. The City balances its water resources to fully utilize its State Water supply in the most cost effective manner while meeting both drinking water and wastewater effluent quality requirements.

41
City of Guadalupe (water, sewer) – The City of Guadalupe serves customers throughout its boundaries and utilizes a single well for urban water demands. Connected to the Coastal Branch, the City receives deliveries of state water and blends with one groundwater well prior to distribution. The City operates a WWTP and discharges its effluent through spray irrigation.
Golden State Water Company (water purveyor) – Golden State Water Company delivers water to urban users in the community of Orcutt. GSWC utilizes a number of groundwater production wells (of varying water quality) and SWP water as their source. As some of the production wells are of marginal quality, GSWC blends water from its various sources to assure drinking water standards are met.
3.9 Management of Salt and Nutrients Management of salts and nutrients associated with agricultural, urban, and environmental water uses within the Santa Maria Groundwater Basin has evolved over time. The reasons include various social, technical, economical, and environmental factors such as cost of fertilizer and energy as well as regulatory mandates. The following outline shows the agricultural and urban changes in management of salts and nutrients that were identified during preparation of this assessment. Because many practices were implemented incrementally, the management changes are described, in general, as occurring during a sequence of three time periods, 1990, 2000, and 2010.
In the context of implementing policy or regulatory changes in the Santa Maria Valley, it is also important to recognize that significant management practices have already been established within the basin. Therefore, any future regulatory actions need to be taken in a way to maximize the benefit of continued cooperative programs. Otherwise, there is a risk that regulatory actions inhibit management measures intended to improve the salt and nutrient management of the basin. For example, strict limitations of discharges of NO3 from farmlands may cause increased development of low NO3 groundwater zones rather than encourage the use of NO3 containing water as a source of fertilizer.
The Salt and Nitrate management practices that are being implemented over time by agricultural and urban water users within the Santa Maria Valley relate to several concepts of salt and nutrient management including; 1) reducing deep percolation past the root zone, 2) utilizing a higher percentage of the nitrates applied in the root zone, 3) introduction of higher quality water sources, and 4) increased removal of salt and nutrient through water treatment or use techniques.
In many instances economics were a main driver of management practices for agricultural and urban interests. In other situations regulatory pressures strongly influenced urban interests, and in recent times, agricultural interests. Because urban and agricultural uses rely on a common groundwater resource and a shared economic dependence on this resource, several management practices have been instituted as joint efforts among various

42
stakeholders. As a result, some practices are listed below are not identified with a particular water user group.
Prior to 1990, Management Practices that notably changed included: All municipal needs met by local groundwater, however, in the 1960s both urban and
agriculture water users invested in Twitchell Reservoir, the operations of which increased the recharge water.
Agricultural irrigation mainly used furrow irrigation method; sprinklers were used for soil pre-irrigation and preparing the field for planting; once a crop germinated, sprinklers were removed
Dairies were operating in the area, which produced a source of animal waste (a source of salts and nitrogen)
A large poultry farm operated in the area, which produced a source of animal waste (a source of salts and nitrogen)
Main crops grown were potatoes, sugar beets, and some vegetables
During the 1990’s, Management Practices that notably changed included: Dairies and feed lots stopped operations in the area during this decade; thus decreasing
sources of animal waste (a source of salts and nitrogen) Vegetables were well established by this time in the area; acres increased from over
35,000 acres in 1990 to around 38,000 acres in 2000 (L&S 2010 Annual Report) Strawberry acreage started in the area, which increased to around 3,000 acres planted
by 2000 Drip irrigation technology and field application of drip irrigation methods advanced Municipal users approved importation of State Water Project water to offset sole
reliance on groundwater for urban uses. (Significant deliveries began in 1997.)
During the 2000’s, Management Practices that notably changed included: The Municipal water users received delivery of State Water Project water which offset
groundwater pumping and imported lower TDS and nutrient supply The poultry farm in the area ended operation; thus, decreasing a source of animal
waste Crop acres were predominately strawberries and vegetable row crops; strawberries
increased to about 10,000 acres by 2010, while vegetables decreased slightly to 34,000 acres
Cost of fertilizers fluctuated in price 20 to 30 percent which increased uncertainty, which encouraged more conservative fertilizer practices, including development of new management techniques
Split application, or methods for improving the timing of fertilizer applications with a crop needs became common practice
Slow release fertilizers introduced which improve nutrient management

43
Use of transplant seedlings lowered the number of days between planting and harvest and reduced water and nutrient use on a per-crop basis
Drip irrigation systems were more widely installed, resulting in better distribution uniformity and fertilizer application
Sprinkler irrigation method remains necessary during the early stages of crops for salt management in the root zone
Agricultural Waiver regulations adopted in 2004 required additional water quality monitoring
Municipal disposal of brine collected from urban water users
Since 2010, Management Practices that notably changed include: Municipal use of higher nitrate production wells for a portion of urban landscape
irrigation Cost of fertilizers increased 2 to 3 times in comparison to prices prior to 1990 (based
on USDA information) Fertilizer application methods continue to improve as costs of fertilizer rises and
growers implement improved practices, such as, transplanting seedlings to establish a crop and use of techniques to control release of NO3 from fertilizer materials
Slow release fertilizers widely utilized Agricultural Waiver adopted in 2012 requires additional management practices
through development of a farm plan with sections on irrigation and nutrient management for Tier 1, Tier 2, and Tier 3 farms; for Tier 3 farms only, the farm plan must include a developed on-farm irrigation and nutrient plan
City of Guadalupe is blending imported SWP water with well water to deliver to urban water users
Laguna County Sanitation District implemented an ordinance that prohibits the use of salt load regenerating water softeners in construction after January 1, 2012.

44
4 Sources, Transport and Fate of Water, TDS, Sodium, Chloride and Nitrogen (Conceptual Model)
In order to understand and quantify the sources of transport and fate of salt and nutrient in the Santa Maria Valley, the Working Group developed a working conceptual model (Figures 1.2a through 1.2f) of Santa Maria Valley hydrology based on previous work (such as Gibbs 2012 and Luhdorff and Scalmanini, 2011). The conceptual model shows the basic elements of sources, transport, and fate of salt and nutrients. These essential elements are represented numerically in the evaluation section. The calculation of flow volume and salt and nutrient concentration allows estimates of total transport and balance (salt/nutrient transported into and out of the valley) as discussed below.
For the purposes of this report, three water quality factors are considered: total dissolved Solids (TDS), Chloride (Cl-) and Nitrate (NO3). Each factor was selected based on availability of data, and potential limitations increasing levels place on use of water resource in the valley.
4.1 Relationship between hydrology and transport of salt and nutrient
Since both Salts and Nutrients are soluble in water, elements of surface and groundwater flow comprise the transport medium and are responsible for their distribution. The materials through which groundwater moves may attenuate the flow of certain dissolved constituents through adsorption on geologic media.
The quantity and quality of sources dictate the volume of salts and nutrients introduced into the valley; other factors increase/concentrate salts and nutrients. Water entering the valley by natural flow or due to importation (SWP) carries dissolved solids and nitrates. The salts and nutrients may be concentrated or diluted by various mechanisms during use and transport of surface and groundwater. Those factors include evapotranspiration, leaching or adsorption in the vadose zone etc.
This assessment focuses on specific chemical species that have been identified as important to water users in the Valley. Although many chemical species may be of concern in a particular area, water users in the Valley have identified TDS (as an indicator of salt), Chloride (Cl-) and Nitrate (NO3) as the constituents of concern for the following reason:
TDS: may limit crops and is a drinking water standard Cl-: may affect soil characteristics to reduce crop yield

45
NO3: has been identified as a potential health threat, the State Department of Public Health has established a drinking water standard of 45 parts per million as nitrate.
Although conditions may change in the future, the trends of these constituents are highest priority to the working Group and are incorporated into the conceptual model. The conceptual model was developed to provide a simplified description of hydrogeology, flow mechanisms and sources of TDS, Cl- and NO3 in the Valley. The model was a basis for estimating the balance between inputs and discharge of salts and nutrients in the basin.
4.2 Source, Transport, Fate Cycle Conceptual Model The Working Group developed a conceptual model as a basis for a simplified calculation of source, transport and fate of TDS, chloride, and nitrate. The conceptual model was represented in diagrams showing sources, flow, discharge and potential areas of accumulation of TDS, Chloride and NO3. Due to differences in subsurface conditions, the western and eastern portions of the valley were represented in separate diagrams; resulting in a total of six diagrams (two each for TDS, Cl- and NO3) see figures 1.2a through 1.2f. The diagrams were kept generic so as to be able to encompass changes in management practices discussed in Section 3.
There are numerous elements of the Conceptual Model, but these elements generally fall in to one of three “systems”: the agricultural extraction and return flow “system”, the urban supply and return flow “system” and the remaining element of the model representing the surface and groundwater hydrology. The elements of the conceptual model are discussed in these three categories below.
Some features of the conceptual model (such as ET and plant root zone) were placed in the agricultural system for convenience. Both the agricultural and urban systems share elements with the groundwater system; however the specific operations of each have differing impacts on the basin. There are also elements of the groundwater system that occur independent of the agricultural and urban systems.
In addition, a Source, Transport, and Fate Cycle of nitrate as “N” (NO3–N) for the basin and root zone was developed since it requires two types of accounting or budgets to understand and manage: a root-zone budget to determine Nitrate efficiency use, and a groundwater basin balance to estimate whether accumulation of N in the form of NO3 (nitrate) is taking place. Nitrogen is added to the soil root zone in various forms of pounds of N expressed as equivalent NO3-N. Nitrate, NO3, is the form of Nitrogen available and used by plants as uptake that leads to Nitrogen removal at harvest. Nitrate, NO3, is also the form of Nitrogen that may leach to groundwater or may or may not get reapplied to the root zone or discharged to drain outlet, possibly outside of the basin boundary and eventually reaching the ocean. For the purpose of calculating the estimated amount of N, the terms in the mass balance equations are expressed as pounds of N as NO3-N. The conceptual diagram for nitrogen in the root zone is shown in Figure 4.2.


47
The components shown in the “nitrate in rootzone” balance can be used in a mass balance equation to estimate nitrogen loading to the groundwater based on the following equation:
NGroundwater = NFertilizer + NAW – NHarvest + NFixation – NDenit/Volat – NDrainage - NErosion
NGroundwater – Pounds of N leached below the root zone NFertilizer – Pounds of N added to meet target yield NAW – Pounds of N added based on source water concentration NHarvest – Pounds of N removed at harvest, a component of crop uptake NCrop uptake = NHarvest + NResidue NResidue – Pounds of N returned or added to root zone as crop residue from crop
uptake NFixation – Pounds of N added to the root zone NDenit/Volat – Pounds of N removed from the root zone NDrainage - Pounds of N removed by drainage to outside of groundwater boundary NErosion - Pounds of N transported by soil erosion outside groundwater boundary
Two important factors that affect nitrogen loading and movement to the groundwater include: the amount of nitrate in the root zone and the crops’ applied water. Management of N added as fertilizer and the efficiency of the type of N, and the amount of and timing of water applied for irrigation are the factors that have effected improvements over time. A factor that is not easily controlled by the grower’s management is the timing of rainfall, which can transport the available nitrate in the root zone. It is important to recognize the root zone balance is an estimate of potential to transport NO3 to the groundwater since it can only be transported to the groundwater when leaching of water occurs below a root zone and the leaching path connects it to the groundwater. From this evaluation, estimating the pounds of N loading to groundwater was based on available UCCE information. In general logic, if the amount of NO3 contained in the soil profile and the source water applied for irrigation are accounted for, then the NFertilizer applied to meet the crop yield target can be more effectively managed to reduce the potential loading to the groundwater.
The Agricultural System, as its name suggests, consists of the elements of the Conceptual Model related to agricultural production in the Santa Maria Valley. Groundwater pumping for the purpose of crop irrigation makes up the most significant portion of salt and nutrient movement out of the aquifer. Likewise, deep percolation of applied water makes up a significant portion of salt and nutrient movement back into the groundwater basin. The elements of the Conceptual Model, as they relate to the Agricultural System are as follows:
Agricultural Deep Percolation – The drainage of agricultural applied water which moves below the effective depth of the root zone and is not captured in tile drains or as tailwater, but is stored in subsurface strata. Deep percolation of agricultural water carries salts and nutrients that have leached out of the root zone, into the groundwater basin. There are indications that microbial activity plays a role in GW leaching.

48
ET – Evapotranspiration is the combined loss of water from a given area by evaporation from the land and transpiration from plants.
Ag Plant Material – Some of the salts, nutrients, and water present in the crops are removed from the groundwater basin once those crops are harvested. However, plant material remaining after harvest is worked back into the ground and may become available to the next crop or may be leached below the root zone.
Ag Pumping – Groundwater pumping for agricultural purposes occurs from both the confined and unconfined aquifers. Groundwater is the sole source of applied water for agriculture users in the Santa Maria Groundwater Basin.
Ag Runoff and Tailwater – Excess water applied for agricultural uses may result in surface runoff from agricultural lands, or may be captured below the root zone in tile drains, or is leached as deep percolation.
Root Zone – The root zone depth is the zone in which water and nutrients can be utilized by the crop, varies from crop type to crop type.
Applied Water – Applied water for agricultural uses is the amount of water pumped from the groundwater basin for agricultural uses. The applied water volume takes into account the evapotranspiration rate for the specific crop in the climate of the area, irrigation efficiency, and crop-specific water requirements that may include salt leaching.
The Urban System consists of elements of the Conceptual Model related to municipal and industrial water production and water importation into the Santa Maria Valley. While the urban water use is significantly less than the agricultural water use, elements of the Urban System still have an impact on the groundwater basin.
Brine Disposal – Effluent from a wastewater treatment plant that has been processed with reverse osmosis, or other salt-removal equipment, results in two wastewater streams; a highly concentrated solution of salts and other dissolved solids; and high quality recycled water. While the high quality recycled water may be infiltrated into the groundwater basin, or used for irrigation, the highly concentrated brine must be properly disposed of. In the case of Laguna County Sanitation District, the brine is injected into a deep well below the underground source of drinking water (USDW) aquifer, which is protected by a packer between the tubing and casing, a cemented exterior casing, and injection below the Sisquoc confining layer.
Deep Percolation, Municipal/Industrial – The drainage of municipal/industrial water that is not evaporated or utilized by landscaping, may move downward by gravity below the maximum effective depth of the root zone toward storage in subsurface strata. Deep percolation of municipal/industrial water may carry contaminants into the groundwater basin.
Municipal and Industrial Pumping – Groundwater pumping occurs from both the confined and unconfined aquifers. Groundwater, in conjunction with imported SWP water, provides the municipalities and agencies with potable water for their urban users.

49
SWP – Water within the Santa Maria Valley groundwater basin received from the State Water Project, originating outside the basin that adds to recharge of the basin.
Well and SWP Infiltration – Infiltration of groundwater and State Water from over-application of landscape irrigation.
WWTP Infiltration – Effluent from a wastewater treatment plant treated to appropriate level can be used for landscape irrigation, as well as agricultural, industrial, and other beneficial uses. Effluent may also be placed in ponds to evaporate and/or percolate into the groundwater basin.
The Groundwater elements of the Conceptual Model relate to the movement of groundwater into, out of, and within the groundwater basin that aren’t directly related to the Agricultural and Urban extraction and recharge.
Abandoned Well – There are a number of abandoned wells in the Santa Maria Valley which once drew from either the confined or unconfined aquifer, or both. Groundwater from the deeper confined aquifer is generally of better quality than groundwater from the shallower unconfined aquifer. Abandoned wells that once drew from both aquifers that have not been properly destroyed allow for the movement of groundwater from one aquifer to another, which results in the degradation of the water quality of the confined aquifer; .improperly constructed or maintained well heads may allow contaminants to enter groundwater.
Groundwater Discharge to Ocean –The Santa Maria Valley groundwater basin gradient is generally sloped toward the ocean. Infiltration from rivers, rainwater, and other activities maintains sufficient gradient that some groundwater flows out into the ocean. Once groundwater is discharged to the ocean, it cannot be recovered.
High Flows to Ocean – In high-flow years when the Santa Maria River, Sisquoc River, and Cuyama River are transporting more water than can be used or infiltrated into the groundwater basin, surface water is discharged to the ocean. Once surface water is discharged to the ocean, it cannot be recovered.
Recharge from East Area of Valley – Groundwater from the unconfined aquifer in the East Area of the Santa Maria Valley flows west due to the gradient of the groundwater basin. As it moves west, a horizontal layer of semi-impermeable soil divides the aquifer into unconfined (upper) and confined (lower) portions. The flow remaining above the layer continues to move through the unconfined aquifer in the west area of the valley, while a portion of the groundwater moves below the semi-impermeable layer and recharges the confined aquifer.
Recharge from Cuyama River – Releases from Twitchell Reservoir are designed to more effectively recharge the groundwater basin by infiltration through the riverbed.
Recharge from Orcutt Creek – A portion of the surface water that flows down Orcutt Creek recharges the groundwater basin by infiltration through the riverbed.
Recharge from Sisquoc River – A portion of the surface water that flows down the Sisquoc River recharges the groundwater basin by infiltration through the riverbed.

50
Semi-Impermeable Layer – A layer of impermeable or semi-impermeable material that separates the shallow unconfined aquifer from the deep confined aquifer.
Unconfined Aquifer – A condition in which the water in an aquifer forms a free surface under atmospheric pressure.
Water Table – The upper surface of the zone of saturation on which the water pressure in the porous medium equals atmospheric pressure.
Due the nature of data available for this analysis, estimates of basin balance and accumulation of TDS, NO3 and Cl- contain significant uncertainty. Recommendations for changes in various monitoring efforts to reduce this uncertainty are provided in Section 5.
4.2.1 Basin Balance Estimates
Existing data were obtained and applied to elements of the conceptual model to estimate the volume of TDS, Cl- and NO3 entering, moving through and leaving the basin. The analysis was based on a simple accounting balance approach and represents an “order of magnitude” calculation of the “balance” of TDS and NO3 in the Valley for the years of 2010, 2000, and 1990 and is shown in Tables 4.2-1 through 4.2-6 (see also Appendix E).
This analysis shows evidence that the degree of loading of TDS and NO3 to the Valley is decreasing with time. This trend would be expected given the management activities discussed in Section 4. In addition, the loading of TDS to groundwater in the basin may have decreased to a level where groundwater quality is stable as reflected in monitoring results in some areas (Figure 4.2.1). This analysis focuses on general trends thus does not include consideration of rare and catastrophic events such as large wildfires that may introduce
The amount of Nitrate loading has decreased substantially, but water quality samples in some areas continue to show elevated levels of NO3 even with the substantial management techniques in place. This is consistent with the loading estimates for 2010 which suggest levels of NO3 entering the Valley hydrologic system continue to exceed the amounts discharged. Since there is a great level of uncertainty in the balance estimates, more research may be useful to understand Nitrogen losses from the various elements that store and transport NO3 within the system. That additional research is beyond the scope of this report and the regulatory processes discussed in Section 1.
4.2.2 Evidence in Support of Transport Model
Coastal monitoring wells are the most down-gradient measurements of water quality in the basin. Although originally installed to monitor for potential sea water intrusion, regular measurements of water quality in these well show several important features. First, while shallow groundwater has experienced increasing specific conductance (an indication of TDS concentrations) over the last 30 years, the intermediate and deep zones do not show a similar trend (Luhdorff and Scalmanini, 2011), particularly in the southern installation of wells. Water in the intermediate and lowermost zones indicates lower specific conductance and less increase
51
over time. These data presented in the Annual Report support the interpretation by Luhdorff and Scalmanini that increased recharge of stormwater to the basin from Twitchell Reservoir has generally stabilized water quality in the zone influenced by recharge from the Santa Maria River east of Bonita School Road crossing. Shallow groundwater west of Bonita School Road is more influenced by returnflow than recharge from the river and in that area the shallow groundwater has experienced increasing Specific Conductance (or TDS).
Two lines of evidence suggest the mechanism by which Nitrate is transported in the groundwater basin: water quality trends in coastal wells and the difference in water quality between shallow and deeper zones east of the Bonita School road. Luhdorff and Scalmanini observes that nitrate in coastal wells in shallow and intermediate zones in the northerly monitoring well cluster began increasing in the 1980s while Nitrate levels in deep zones has remained low. Nitrate levels in shallow groundwater throughout the valley have increased while deeper zones remain relatively low. This trend is shown in monitoring wells and in the isolation tests performed by the City of Santa Maria on their well # 9 (e-mail correspondence, City of Santa Maria).
These data are consistent with the conceptual model which describes downward movement of TDS and NO3 during periods of above average rainfall. A higher concentration of TDS and NO3 is not expected to migrate rapidly through the saturated zone to the deep zone, but rather migrate to the west along the regional groundwater gradient toward the coast.
The shallowest zones west of Bonita School Road may be intercepted by drains or discharge naturally to surface water bodies. This is consistent with the higher levels of TDS and NO3 measured in surface water in this area.
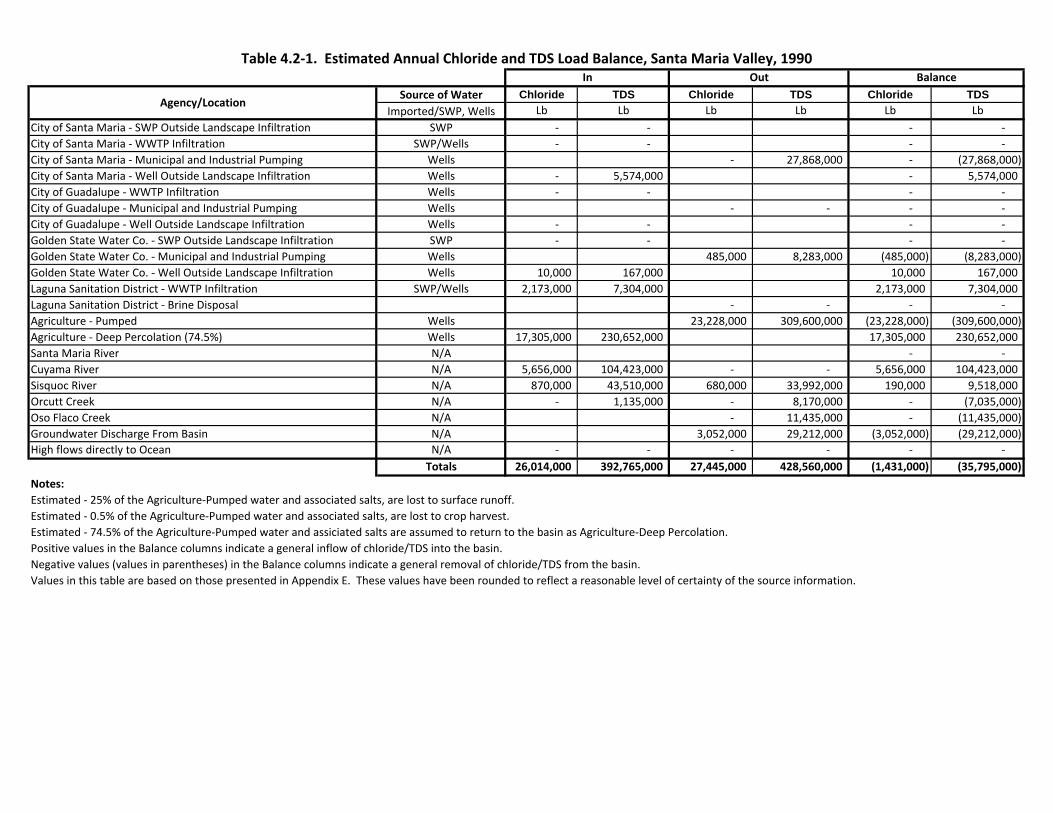
Source of Water Chloride TDS Chloride TDS Chloride TDSImported/SWP, Wells Lb Lb Lb Lb Lb Lb
City of Santa Maria ‐ SWP Outside Landscape Infiltration SWP ‐ ‐ ‐ ‐ City of Santa Maria ‐ WWTP Infiltration SWP/Wells ‐ ‐ ‐ ‐ City of Santa Maria ‐ Municipal and Industrial Pumping Wells ‐ 27,868,000 ‐ (27,868,000) City of Santa Maria ‐ Well Outside Landscape Infiltration Wells ‐ 5,574,000 ‐ 5,574,000 City of Guadalupe ‐ WWTP Infiltration Wells ‐ ‐ ‐ ‐ City of Guadalupe ‐ Municipal and Industrial Pumping Wells ‐ ‐ ‐ ‐ City of Guadalupe ‐ Well Outside Landscape Infiltration Wells ‐ ‐ ‐ ‐ Golden State Water Co. ‐ SWP Outside Landscape Infiltration SWP ‐ ‐ ‐ ‐ Golden State Water Co. ‐ Municipal and Industrial Pumping Wells 485,000 8,283,000 (485,000) (8,283,000) Golden State Water Co. ‐ Well Outside Landscape Infiltration Wells 10,000 167,000 10,000 167,000 Laguna Sanitation District ‐ WWTP Infiltration SWP/Wells 2,173,000 7,304,000 2,173,000 7,304,000 Laguna Sanitation District ‐ Brine Disposal ‐ ‐ ‐ ‐ Agriculture ‐ Pumped Wells 23,228,000 309,600,000 (23,228,000) (309,600,000) Agriculture ‐ Deep Percolation (74.5%) Wells 17,305,000 230,652,000 17,305,000 230,652,000 Santa Maria River N/A ‐ ‐ Cuyama River N/A 5,656,000 104,423,000 ‐ ‐ 5,656,000 104,423,000 Sisquoc River N/A 870,000 43,510,000 680,000 33,992,000 190,000 9,518,000 Orcutt Creek N/A ‐ 1,135,000 ‐ 8,170,000 ‐ (7,035,000) Oso Flaco Creek N/A ‐ 11,435,000 ‐ (11,435,000) Groundwater Discharge From Basin N/A 3,052,000 29,212,000 (3,052,000) (29,212,000) High flows directly to Ocean N/A ‐ ‐ ‐ ‐ ‐ ‐
Totals 26,014,000 392,765,000 27,445,000 428,560,000 (1,431,000) (35,795,000) Notes:
Values in this table are based on those presented in Appendix E. These values have been rounded to reflect a reasonable level of certainty of the source information.
Estimated ‐ 0.5% of the Agriculture‐Pumped water and associated salts, are lost to crop harvest.Estimated ‐ 74.5% of the Agriculture‐Pumped water and assiciated salts are assumed to return to the basin as Agriculture‐Deep Percolation.Positive values in the Balance columns indicate a general inflow of chloride/TDS into the basin.Negative values (values in parentheses) in the Balance columns indicate a general removal of chloride/TDS from the basin.
Estimated ‐ 25% of the Agriculture‐Pumped water and associated salts, are lost to surface runoff.
Table 4.2‐1. Estimated Annual Chloride and TDS Load Balance, Santa Maria Valley, 1990In Out Balance
Agency/Location

In Out Balance Balance NO3‐NSource of Water Nitrate Nitrate Nitrate Equivalent
Imported/SWP, Wells Lb Lb Lb LbCity of Santa Maria ‐ SWP Outside Landscape Infiltration SWP ‐ ‐ ‐ City of Santa Maria ‐ WWTP Infiltration SWP/Wells ‐ ‐ ‐ City of Santa Maria ‐ Municipal and Industrial Pumping Wells 114,800 (114,800) (25,900) City of Santa Maria ‐ Well Outside Landscape Infiltration Wells 23,000 23,000 5,200 City of Guadalupe ‐ WWTP Infiltration Wells ‐ ‐ ‐ City of Guadalupe ‐ Municipal and Industrial Pumping Wells ‐ ‐ ‐ City of Guadalupe ‐ Well Outside Landscape Infiltration Wells ‐ ‐ ‐ Golden State Water Co. ‐ SWP Outside Landscape Infiltration SWP ‐ ‐ ‐ Golden State Water Co. ‐ Municipal and Industrial Pumping Wells 92,900 (92,900) (21,000) Golden State Water Co. ‐ Well Outside Landscape Infiltration Wells 1,900 1,900 400 Laguna Sanitation District ‐ WWTP Infiltration SWP/Wells 138,700 138,700 31,300 Laguna Sanitation District ‐ Brine Disposal ‐ ‐ ‐ Agriculture ‐ Pumped Wells 1,381,200 (1,381,200) (311,800) Agriculture ‐ Deep Percolation Wells 19,225,800 19,225,800 4,339,900 Santa Maria River N/A ‐ ‐ Cuyama River N/A 2,200 ‐ 2,200 500 Sisquoc River N/A 23,800 18,600 5,200 1,200 Orcutt Creek N/A 20,200 145,100 (124,900) (28,200) Oso Flaco Creek N/A ‐ 306,900 (306,900) (69,300) Groundwater Discharge From Basin N/A 417,400 (417,400) (94,200) High flows directly to Ocean N/A ‐ ‐ ‐ ‐
Totals 19,435,600 2,476,900 16,958,700 3,828,000 Notes:
Values in this table are based on those presented in Appendix E. These values have been rounded to reflect a reasonable level of certainty.
Positive values in the Balance columns indicate a general inflow of nitrate into the basinNegative values (values in parentheses) in the Balance columns indicate a general removal of nitrate from the basin.
Table 4.2‐2. Estimated Annual Nitrate Load Balance, Santa Maria Valley, 1990
Agency/Location

Source of Water Chloride TDS Chloride TDS Chloride TDSImported/SWP, Wells Lb Lb Lb Lb Lb Lb
City of Santa Maria ‐ SWP Outside Landscape Infiltration SWP 13,000 2,052,000 13,000 2,052,000 City of Santa Maria ‐ WWTP Infiltration SWP/Wells 124,000 508,000 124,000 508,000 City of Santa Maria ‐ Municipal and Industrial Pumping Wells 42,000 1,031,000 (42,000) (1,031,000) City of Santa Maria ‐ Well Outside Landscape Infiltration Wells 8,000 206,000 8,000 206,000 City of Guadalupe ‐ WWTP Infiltration Wells 19,000 744,000 19,000 744,000 City of Guadalupe ‐ Municipal and Industrial Pumping Wells 28,000 949,000 (28,000) (949,000) City of Guadalupe ‐ Well Outside Landscape Infiltration Wells 6,000 229,000 6,000 229,000 Golden State Water Co. ‐ SWP Outside Landscape Infiltration SWP 167,000 2,551,000 167,000 2,551,000 Golden State Water Co. ‐ Municipal and Industrial Pumping Wells 973,000 14,330,000 (973,000) (14,330,000) Golden State Water Co. ‐ Well Outside Landscape Infiltration Wells 20,000 288,000 20,000 288,000 Laguna Sanitation District ‐ WWTP Infiltration SWP/Wells 2,261,000 8,306,000 2,261,000 8,306,000 Laguna Sanitation District ‐ Brine Disposal ‐ ‐ ‐ ‐ Agriculture ‐ Pumped Wells 21,161,000 271,079,000 (21,161,000) (271,079,000) Agriculture ‐ Deep Percolation (74.5%) Wells 15,765,000 201,954,000 15,765,000 201,954,000 Santa Maria River N/A ‐ ‐ Cuyama River N/A 4,786,000 95,721,000 ‐ ‐ 4,786,000 95,721,000 Sisquoc River N/A 1,160,000 44,960,000 906,000 35,125,000 254,000 9,835,000 Orcutt Creek N/A ‐ 1,167,000 ‐ 8,402,000 ‐ (7,235,000) Oso Flaco Creek N/A ‐ 11,435,000 ‐ (11,435,000) Groundwater Discharge From Basin N/A 3,052,000 29,212,000 (3,052,000) (29,212,000) High flows directly to Ocean N/A ‐ ‐ ‐ ‐ ‐ ‐
Totals 24,329,000 358,686,000 26,162,000 371,563,000 (1,833,000) (12,877,000) Notes:
Agency/Location
Values in this table are based on those presented in Appendix E. These values have been rounded to reflect a reasonable level of certainty of the source information.
Estimated ‐ 25% of the Agriculture‐Pumped water and associated salts, are lost to surface runoff.Estimated ‐ 0.5% of the Agriculture‐Pumped water and associated salts, are lost to crop harvest.Estimated ‐ 74.5% of the Agriculture‐Pumped water and assiciated salts are assumed to return to the basin as Agriculture‐Deep Percolation.Positive values in the Balance columns indicate a general inflow of chloride/TDS into the basin.Negative values (values in parentheses) in the Balance columns indicate a general removal of chloride/TDS from the basin.
4.2‐3. Estimated Annual Chloride and TDS Load Balance, Santa Maria Valley, 2000In Out Balance

In Out Balance Balance NO3‐NSource of Water Nitrate Nitrate Nitrate Equivalent
Imported/SWP, Wells Lb Lb Lb LbCity of Santa Maria ‐ SWP Outside Landscape Infiltration SWP 21,300 ‐ 21,300 4,800 City of Santa Maria ‐ WWTP Infiltration SWP/Wells ‐ ‐ ‐ ‐ City of Santa Maria ‐ Municipal and Industrial Pumping Wells 16,500 (16,500) (3,700) City of Santa Maria ‐ Well Outside Landscape Infiltration Wells 3,300 3,300 700 City of Guadalupe ‐ WWTP Infiltration Wells 2,200 ‐ 2,200 500 City of Guadalupe ‐ Municipal and Industrial Pumping Wells 3,000 (3,000) (680) City of Guadalupe ‐ Well Outside Landscape Infiltration Wells 700 700 160 Golden State Water Co. ‐ SWP Outside Landscape Infiltration SWP 44,500 ‐ 44,500 10,000 Golden State Water Co. ‐ Municipal and Industrial Pumping Wells 12,900 (12,900) (2,900) Golden State Water Co. ‐ Well Outside Landscape Infiltration Wells 4,800 4,800 1,100 Laguna Sanitation District ‐ WWTP Infiltration SWP/Wells 191,700 191,700 43,300 Laguna Sanitation District ‐ Brine Disposal ‐ ‐ ‐ Agriculture ‐ Pumped Wells 5,045,600 (5,045,600) (1,139,000) Agriculture ‐ Deep Percolation Wells 18,036,600 18,036,600 4,071,500 Santa Maria River N/A ‐ ‐ Cuyama River N/A 77,000 ‐ 77,000 17,400 Sisquoc River N/A 51,400 40,100 11,300 2,600 Orcutt Creek N/A 81,000 583,100 (502,100) (113,300) Oso Flaco Creek N/A ‐ 306,900 (306,900) (69,300) Groundwater Discharge From Basin N/A 417,400 (417,400) (94,200) High flows directly to Ocean N/A ‐ ‐ ‐ ‐
Totals 18,514,500 6,425,500 12,089,000 2,729,000 Notes:
Values in this table are based on those presented in Appendix E. These values have been rounded to reflect a reasonable level of certainty.
Agency/Location
4.2‐4. Estimated Annual Nitrate Load Balance, Santa Maria Valley, 2000
Positive values in the Balance columns indicate a general inflow of nitrate into the basinNegative values (values in parentheses) in the Balance columns indicate a general removal of nitrate from the basin.

Source of Water Chloride TDS Chloride TDS Chloride TDSImported/SWP, Wells Lb Lb Lb Lb Lb Lb
City of Santa Maria ‐ SWP Outside Landscape Infiltration SWP 11,000 1,732,000 11,000 1,732,000 City of Santa Maria ‐ WWTP Infiltration SWP/Wells 3,856,000 17,671,000 3,856,000 17,671,000 City of Santa Maria ‐ Municipal and Industrial Pumping Wells 382,000 7,171,000 (382,000) (7,171,000) City of Santa Maria ‐ Well Outside Landscape Infiltration Wells 76,000 1,434,000 76,000 1,434,000 City of Guadalupe ‐ WWTP Infiltration Wells 168,000 1,606,000 168,000 1,606,000 City of Guadalupe ‐ Municipal and Industrial Pumping Wells 45,000 1,532,000 (45,000) (1,532,000) City of Guadalupe ‐ Well Outside Landscape Infiltration Wells 9,000 306,000 9,000 306,000 Golden State Water Co. ‐ SWP Outside Landscape Infiltration SWP 300 42,000 300 42,000 Golden State Water Co. ‐ Municipal and Industrial Pumping Wells 751,000 13,003,000 (751,000) (13,003,000) Golden State Water Co. ‐ Well Outside Landscape Infiltration Wells 15,000 262,000 15,000 262,000 Laguna Sanitation District ‐ WWTP Infiltration SWP/Wells 1,085,000 4,493,000 1,085,000 4,493,000 Laguna Sanitation District ‐ Brine Disposal 993,000 2,244,000 (993,000) (2,244,000) Agriculture ‐ Pumped Wells 23,238,000 279,780,000 (23,238,000) (279,780,000) Agriculture ‐ Deep Percolation Wells 17,312,000 208,436,000 17,312,000 208,436,000 Santa Maria River N/A ‐ ‐ Cuyama River N/A 4,786,000 95,721,000 ‐ ‐ 4,786,000 95,721,000 Sisquoc River N/A 1,160,000 44,960,000 906,000 35,125,000 254,000 9,835,000 Orcutt Creek N/A ‐ 1,167,000 ‐ 8,402,000 ‐ (7,235,000) Oso Flaco Creek N/A ‐ 11,435,000 ‐ (11,435,000) Groundwater Discharge From Basin N/A 3,531,000 29,562,000 (3,531,000) (29,562,000) High flows directly to Ocean N/A ‐ ‐ 1,893,000 26,655,000 (1,893,000) (26,655,000)
Totals 28,478,300 377,830,000 31,739,000 414,909,000 (3,260,700) (37,079,000) Notes:
High flows directly to Ocean include flow from Blosser Creek, Bradley Channel, Greene Valley Creek, and Main Street Canal.Values in this table are based on those presented in Appendix E. These values have been rounded to reflect a reasonable level of certainty of the source information.
Table 4.2‐5. Estimated Annual Chloride and TDS Load Balance, Santa Maria Valley, 2010
Agency/Location
Negative values (values in parentheses) in the Balance columns indicate a general removal of Chloride/TDS from the basin.Positive values in the Balance columns indicate a general inflow of Chloride/TDS into the basin.
Estimated ‐ 0.5% of the Agriculture‐Pumped water and associated salts, are lost to crop harvest.Estimated ‐ 74.5% of the Agriculture‐Pumped water and assiciated salts are assumed to return to the basin as Agriculture‐Deep Percolation.
Estimated ‐ 25% of the Agriculture‐Pumped water and associated salts, are lost to surface runoff.
In Out Balance

In Out Balance Balance NO3‐NSource of Water Nitrate Nitrate Nitrate Equivalent
Imported/SWP, Wells Lb Lb Lb LbCity of Santa Maria ‐ SWP Outside Landscape Infiltration SWP 18,000 ‐ 18,000 4,100 City of Santa Maria ‐ WWTP Infiltration SWP/Wells 406,200 ‐ 406,200 91,700 City of Santa Maria ‐ Municipal and Industrial Pumping Wells 224,600 (224,600) (50,700) City of Santa Maria ‐ Well Outside Landscape Infiltration Wells 44,900 44,900 10,100 City of Guadalupe ‐ WWTP Infiltration Wells 44,100 ‐ 44,100 10,000 City of Guadalupe ‐ Municipal and Industrial Pumping Wells 4,800 (4,800) (1,100) City of Guadalupe ‐ Well Outside Landscape Infiltration Wells 1,000 1,000 230 Golden State Water Co. ‐ SWP Outside Landscape Infiltration SWP 100 ‐ 100 20 Golden State Water Co. ‐ Municipal and Industrial Pumping Wells 14,600 (14,600) (3,300) Golden State Water Co. ‐ Well Outside Landscape Infiltration Wells 5,000 5,000 1,100 Laguna Sanitation District ‐ WWTP Infiltration SWP/Wells 178,700 178,700 40,300 Laguna Sanitation District ‐ Brine Disposal 79,700 (79,700) (18,000) Agriculture ‐ Pumped Wells 7,693,000 (7,693,000) (1,736,600) Agriculture ‐ Deep Percolation Wells 14,537,000 14,537,000 3,281,500 Santa Maria River N/A ‐ ‐ Cuyama River N/A 77,000 ‐ 77,000 17,400 Sisquoc River N/A 51,400 40,100 11,300 2,600 Orcutt Creek N/A 81,000 583,100 (502,100) (113,300) Oso Flaco Creek N/A ‐ 306,900 (306,900) (69,300) Groundwater Discharge From Basin N/A 794,500 (794,500) (179,300) High flows directly to Ocean N/A ‐ 646,100 (646,100) (145,800)
Totals 15,444,400 10,387,400 5,057,000 1,142,000 Notes:
Values in this table are based on those presented in Appendix E. These values have been rounded to reflect a reasonable level of certainty.
Estimated ‐ 74.5% of the Agriculture‐Pumped water and assiciated salts are assumed to return to the basin as Agriculture‐Deep Percolation.Positive values in the Balance columns indicate a general inflow of nitrate into the basin
High flows directly to Ocean include flow from Blosser Creek, Bradley Channel, Greene Valley Creek, and Main Street Canal.
Agency/Location
Negative values (values in parentheses) in the Balance columns indicate a general removal of nitrate from the basin.
Table 4.2‐6. Estimated Annual Nitrate Load Balance, Santa Maria Valley, 2010
Estimated ‐ 25% of the Agriculture‐Pumped water and associated salts, are lost to surface runoff.Estimated ‐ 0.5% of the Agriculture‐Pumped water and associated salts, are lost to crop harvest.

®4 0 42
Miles
Salt and Nutrient Planning WorkgroupSanta Barbara County IRWM Plan 2013
Santa Maria Groundwater Management Area
TDS, CHLORIDE AND NITRATE CONCENTRATIONS WITHINSANTA MARIA VALLEY ASSESSMENT AREA
FEBRUARY 2013 FIGURE 4.2.122-A
ug-20
12
Z:\P
rojec
ts\11
8210
_San
taMari
aVall
ey\Sa
ntaMa
riaMa
nage
mentA
rea_w
ells.m
xd
RS
!A Water WellSanta Maria Valley Management AreaCity LimitCounty
0
20
40
60
80
100
120
140
600
650
700
750
800
850
900
1995 1997 1999 2001 2003 2005 2007 2009 2011 2013 2015
Nitrat
e and
Chlor
ide (m
g/L)
TDS (m
g/L)
Year
09N/34W-03A2
TDS
Nitrate
Chloride
0
20
40
60
80
100
120
0
200
400
600
800
1000
1200
1400
1995 1997 1999 2001 2003 2005 2007 2009 2011 2013 2015
Nitrat
e and
Chlor
ide (m
g/L)
TDS (m
g/L)
Year
10N/33W-20H1
TDS
Nitrate
Chloride
0
10
20
30
40
50
60
70
1150116011701180119012001210122012301240
1995 1997 1999 2001 2003 2005 2007 2009 2011 2013 2015
Nitrat
e and
Chlor
ide (m
g/L)
TDS (m
g/L)
Year
10N/33W-30G1
TDS
Nitrate
Chloride
0
10
20
30
40
50
60
70
900
1000
1100
1200
1300
1400
1975 1980 1985 1990 1995 2000 2005 2010 2015
Nitrat
e and
Chlor
ide (m
g/L)
TDS (m
g/L)
Year
11N/36W-35J5
TDS
Nitrate
Chloride
0102030405060708090
1100
1200
1300
1400
1500
1600
1975 1980 1985 1990 1995 2000 2005 2010 2015
Nitrat
e and
Chlor
ide (m
g/L)
TDS (m
g/L)
Year
11N/36W-35J4
TDS
Nitrate
Chloride
0102030405060708090
700
800
900
1000
1100
1200
1300
1400
1975 1980 1985 1990 1995 2000 2005 2010 2015
Nitrat
e and
Chlor
ide (m
g/L)
TDS (m
g/L)
Year
11N/36W-35J3
TDS
Nitrate
Chloride
0
10
20
30
40
50
60
70
80
600
650
700
750
800
850
900
1975 1980 1985 1990 1995 2000 2005 2010 2015
Nitrat
e and
Chlor
ide (m
g/L)
TDS (m
g/L)
Year
11N/36W-35J2
TDS
Nitrate
Chloride
Well Depth: 615'
Well Depth: 495'Well Depth: 135'
Well Depth: 228'
Well Depth: 175'
Well Depth: 662'
Well Depth: 331'

59
5 Evaluation of Existing Monitoring
A significant amount of the data used in this report has been extracted from the annual reports prepared for the TMA which rely on both existing monitoring programs and other data collected from water and wastewater system operators. In addition, the USGS, CCWQP and CCRWQCB collect stream flow and water quality data. This section discusses the data and its utility for this report.
5.1 Existing monitoring programs Existing monitoring programs and the data collected in the Santa Maria Valley (Valley) are described in Section 2 of this report. This section evaluates the applicability of the existing monitoring to the salt and nutrient transport and fate analysis in Section 3 and identifies gaps in the data that have constrained the evaluation of past and present salt and nutrient management measures. While each monitoring program reviewed was set up to meet certain objectives, none of the programs were established to support this specific evaluation. This discussion does not evaluate data collection programs themselves or whether the data collected meets other objectives.
Existing data collection provides information on:
Salt and nutrient inputs Climate conditions Surface flow (volume and quality) Water table gradient and fluctuation Ground water quality in the saturated zone, Water quality variation of drainage and other shallow groundwater discharges
The existing monitoring provides measurement of salts (TDS), Chloride Cl- and Nitrogen (NO3) at certain locations on a regular basis; however, measurements of TDS, Cl- and NO3 in other areas within in the Valley are not adequate to define all parameters represented in Figures 1.2a to 1.2f. As a result the current monitoring programs provided a sufficient basis for only a very general estimate of loading, transport and discharge as related to each parameter in the diagram.
As discussed in this section, data available for salt and nutrient assessment is of variable quality. In general public agency data collection is of good to excellent quality for the periods collected. Water production and discharge information from water purveyors and water treatment plants is detailed and complete for the period evaluated. Stream flow data is not consistently available due to a number of factors including cost and practicality. Private

60
well production and nutrient use data were not available and were estimated from published cropping and best practices information.
5.1.1 Measurement of Recharge and Sources of TDS, Cl- and NO3
Recharge to the basin both replenishes water supplies and introduces TDS, Cl- and NO3 into the hydraulic system. Recharge to the hydrologic system occurs from three sources:
Rainfall Surface recharge (from streams flowing into the valley) Imported water
In addition, TDS, Cl- and NO3 are added as water softener discharge and as a result of fertilizer use. TDS, Cl- and NO3 are concentrated as water is used for urban, industrial and agricultural purposes.
Rainfall has been measured at two locations in the valley since 1900. Rainfall records are on file with the Santa Barbara County Flood Control and Water Conservation District (SBCFCD) and have been evaluated by that agency as a basis for drainage facility designs. Rainfall records are complete and provide daily measurements.
Surface water flows are derived from runoff and flow into the valley from surrounding watersheds including the Cuyama and Sisquoc rivers. The movement of water through the Valley hydrologic system is currently measured by stream gages in four locations. These are important measurements as there is significant variation in rainfall, which causes extreme ranges of stream flow. Surface flow measurements are used to describe elements of surface hydrology in Luhdorff and Scalmanini, 2012. In addition, two gages on the Santa Maria River and gages on five tributary streams are no longer operated, but past records provides insight regarding stream flow during non-measurement periods. This data was also used to predict runoff from drainages with no gage data but similar land uses.
Data from gaging has been used to estimate the recharge form certain streams. Stream gage information has been collected by the USGS, the SBCFCD and through occasional estimates by RWQCB and Central Coast Water Quality Preservation, Inc. (CCWQP). Stream gage data collected on the Cuyama River (as releases from Twitchell Reservoir), Sisquoc River, and Santa Maria River provide the basis for estimating the volume of recharge from unregulated flow and from releases from Twitchell Reservoir. These data have been collected for many years and are reliable. Gaging is the basis for estimates of annual recharge from surface flow. However, water quality data for these sources of recharge has been collected intermittently. Data collected indicates a range of TDS, Cl- and NO3 depending on season and level of flow. Data used in the analysis relied on averages of reported water quality and applied to annual flow.

61
Water quality data on smaller streams flowing in the Valley is contained in studies by the USGS and has been collected by CCWQP and RWQCB. No systematic measurements of flow in smaller streams are available, but the SBCFCD has measured depth of flow in discharge from the Green Canyon Watershed since 2006. From this limited data, rough estimates of annual flow were made. This data relates to discharge since recharge in smaller watersheds is generally due to direct infiltration of precipitation.
In the most northwesterly portion of the valley, several locations along Oso Flaco Creek and Orcutt-Solomon Creek are monitored for water quality monthly by the CCWQP. Flow velocity is estimated when water quality samples are collected, but the stream channel conditions are not generally conducive to accurate calculations of flow volume. In addition, this flow is generally discharged from shallow groundwater and does not contribute to recharge by surface streams.
5.1.2 Groundwater measurements and movement of TDS, Cl- and NO3
Groundwater levels and water quality are measured regularly at a number of points throughout the Valley (Luhdorff and Scalmanini, 2012). As many as 149 potential monitoring wells exist in the Valley; water quality information is currently measured in 14 wells. Existing groundwater monitoring wells that are included in the Annual Report for the Santa Maria Basin (Luhdorff and Scalmanini, 2012) are separated into two well networks; wells to monitor shallow groundwater and wells to monitor deep groundwater. Figures showing the shallow and deep well networks are included in Section 2 as Figures 2a and 2b (figures 2a and 2b in this assessment are the same as Figures 2a and 2b of the Annual Report prepared by Luhdorff and Scalmanini, 2012). At this time, four shallow wells and 10 deep wells are actively monitored for water quality.
With the exception of wells along the coast that were installed to monitor potential sea water intrusion and wells for water quality monitoring at the land fill and WWTPs, the other wells for which data were available were not constructed specifically for data collection. These wells serve other purposes such as agricultural and municipal production. However, water level, production, and water quality measurement data from municipal supply wells has been detailed enabling the calculation of the amount of TDS, Cl- and NO3 produced for urban use.
The data collected from irrigation production wells can be used only for estimates of water quality due to lack of available pumping records and only intermittent water quality testing. In addition, these wells typically are not equipped to allow sampling of individual aquifer zones. In the analysis reported in Section 3, values of water quality were averaged from wells of known depth and used with estimates of applied water as a basis for calculating volumes of TDS, Cl- and NO3 removed from the groundwater by agricultural pumping. Applied water was estimated from published crop data and surveys of land use which identify crop types and acreages. Applied water estimates were used to develop volumes of water pumped for agricultural use.

62
Spot measurements of agricultural drain flows made during water quality sampling by CCWQP and the CCRWQCB were used to estimate volumes of TDS, Cl- and NO3 discharged from shallow groundwater. Variation in water table elevation during wet periods will cause changes in drainage volume and subsurface transport so that salt and nutrients are discharged from shallow groundwater into surface drainages at varying rates. Since this flow is discharged from shallow groundwater, it was considered to contribute to recharge by surface streams.
Existing drain and surface water flow measurements and water quality measurements provide an estimate of load discharging out of the groundwater basin. However, these measurements do not extend throughout the 10-year analysis periods and therefore do not capture changes that may have occurred due to changes in management practices.
5.1.3 Measurements of TDS, Cl- and NO3 Discharge
Discharge of water from the basin is an essential mechanism for removing salt and nutrient from the basin. Discharge of water occurs through four basic mechanisms:
Subsurface discharge through aquifer zones that extend beneath the ocean Surface flow from collection systems that receive agricultural drain water and
surface runoff Natural surface flow (including runoff from urban and agricultural lands) in streams
and the Santa Maria River Discharge through the Laguna County Sanitation District deep injection well.
Subsurface discharge to the ocean has been estimated from well data by the USGS and California Department of Water Resources (DWR) and is based on a groundwater gradient and a hypothetical cross-section of the Santa Maria Groundwater basin aquifer at the shoreline through the USGS coastal wells (Miller and Evanson 1966; DWR 2002). The accuracy of these estimates is constrained by a limited understanding of hydraulic characteristics of subsurface materials used in calculation of subsurface discharge. Water quality samples from these wells at various depths allow estimation of transport of TDS, Cl-, and NO3 from the groundwater basin as underflow and discharge to the ocean.
Surface flow from discharge of agricultural drains is discussed in the previous section. Other shallow discharges in the Valley vary as a function of rainfall and location. Estimates used in the analysis are based on occasional measurements of surface flow made during water quality sampling. Therefore, the variation of flow is not well documented. Since 2005, some monthly sampling of drainages has occurred through the Cooperative Management Program operated by CCWQP. Measurements made in high flow conditions provide some support for estimates of wet condition discharge. Flow and water quality measurements were combined to estimate average annual discharge of water as well as TDS, Cl- and NO3 from the drains. Discharge from drains was assumed to be transported from the basin.

63
In addition to the flow measurements made by CCWQP, stage measurements made in Green Canyon by the SBCFCD were converted into flow measurements using standard formulas for concrete structures of similar profile. This flow was prorated for two other, similar, watersheds (Bradley and Blosser drainages). Flows over 1 cfs in each drainage were considered to flow from the basin transporting TDS, Cl- and NO3. Volume of flow over 1 cfs and average water quality was used to estimate the volume of TDS, Cl- and NO3 discharged by this mechanism.
Surface flow is actively measured at Twitchell Reservoir (as reservoir releases) and four other stream gages in the basin by the USGS and FCD; two inactive gages are planned to be reestablished. Measurements in locations with good control are within typical accuracy for surface flow measurements. Other locations, such as the lower Santa Maria River have poorly defined channel geometry and thus flow is not presently gaged.
Discharge to the lower Cuyama River from Twitchell Reservoir is measured by the operator, the SMVWCD. During periods when releases are made, virtually all flow in the lower Cuyama River is from the reservoir. Measurement of releases has been standard operating procedure since the Reservoir was completed in 1958. Water quality measurements from reservoir discharges of Cuyama River flow have been taken only in the last few years. The available data were combined with measurements of releases for groundwater recharge to estimate TDS, Cl- and NO3 loading to the ground water basin.
Discharge of brine to the deep injection well by the LCSD is measured as a condition of operation of the WWTP. The data from those measurements are complete and provide an accurate measure of salt discharged from the basin through deep injection since 2003.
TDS, Cl- and NO3 in the groundwater are measured by several interests including public water suppliers and the USGS. The data summarized as part of the Annual Report (Luhdorff and Scalmanini, 2012); TDS and NO3 measurements are reported from 10 deep wells and 4 shallow wells. Samples at each sample point are from a single zone; no data are available to show vertical variation.
No unsaturated (vadose) zone measurements are reported in the Annual Report. Estimates of TDS, Cl- and NO3 in the vadose zone were utilized in the evaluation discussed in Section 3.
5.2 Applicability of Existing Data This section discusses the adequacy of existing data as a basis to estimate the salt and nutrient balance in the Santa Maria Valley discussed in Section 3.
Volume measurements for sources Imported water (SWP supplies) is directly monitored and high-quality volumetric
and water quality data collected, which allows for the accurate characterization of salt and nutrient inflow.

64
Urban groundwater extractions for municipal use are directly monitored and high-quality volumetric and water quality data collected, which allows for the characterization of the salt and nutrient value in water extracted for municipal use.
For agricultural groundwater extractions, only indirect estimates of volume, and no direct data on water quality, are available. A limited number of USGS sampling points were used to estimate quality of water produced for agricultural uses, but information on the zones developed was limited. Use of estimates and uncertain data introduces significant uncertainty into the analysis.
Vadose zone conditions between the root zone and the top of the water table were not considered in the evaluation.
The analysis in Section 3 was based on static conditions; no estimates of attenuation during transport were developed.
Water Quality Measurements for Sources Rainfall: No water quality measurements are presently made of precipitation.
Generally speaking NO3 and TDS levels of precipitation are low and may be considered negligible compared to other sources. Therefore, the lack of water quality measurement for rainfall does not significantly affect the analysis.
Stream Flow: Most stream infiltration occurs during high flows in the Sisquoc River or releases from Twitchell Reservoir. Water quality samples are taken from lower Cuyama River twice a year (when flowing); few water quality measurements are taken of other stream flows on a regular basis. Thus, the existing data are not sufficient to fully characterize water quality of stream flow as a source of ground water recharge. Thus the stream flow infiltration estimates reflected in the analysis introduced uncertainty in sources of TDS and NO3 from surface flow.
Groundwater Extractions: Complete high-quality water quality data extracted for municipal use allows characterization of salt and nutrient in water extracted. No direct data on quality of water extracted in agricultural areas is readily available except at a limited number of USGS sampling points which introduces significant uncertainty in estimating the volume of TDS, Cl- and NO3 in groundwater being pumped and applied for irrigation purposes. Since agricultural pumping is the largest source of extraction and water use in the valley, the uncertainty in the water quality information is directly reflected in uncertainty in the overall estimates in the analysis.
Imported Water (SWP supplies): Complete, high-quality water quality data allows characterization of salt and nutrient imported through SWP deliveries.
Transport Mechanism Groundwater Movement: The volumes of TDS, Cl- and NO3 in transport within
aquifers were not used in the analysis and no estimates were developed. Information on thickness and gradient is available in previous reports at a regional scale. However, no data are available with which to characterize changes in TDS, Cl- and NO3 at depth and therefore data are not adequate for detailed estimates needed to

65
calculate amount of salt and nutrient being transported within the groundwater basin. Since volumes in transport were not a factor in the analysis, any lack of information did not significantly affect the analysis..
Sinks and Fates Discharge to Deep Wells: The discharge of brine to a deep injection well by LCSD
is well documented through reports to permitting agencies. Thus estimates of discharge of TDS through brine discharge used in the analysis are considered reliable.
Subsurface Groundwater Flow: The migration of groundwater beneath the coastal area may be estimated by local gradient calculations and the volume of salt and nutrient transported from the basin may be estimated based on water quality measurements from the coastal piezometers. Seasonal variation in water quality in the piezometers appears adequately documented through biannual measurements. However, variation along the shoreline is not well documented given there are only two piezometer clusters and there appears to be variation in nutrient level measured at the two locations.
Surface Discharge from Field Drains: Some monthly measurements, conducted by CCWQP through the Cooperative Monitoring Program, may represent a composite sample of surface discharge of field drainage and subsurface drainage collected by surface drains.
Assimilative Capacity No estimates of assimilative capacity were made as part of the analysis in Section 3.
5.3 Gaps Analysis and Uncertainties In this section, the existing monitoring system is evaluated, focusing on its ability to define sources, fate and changes of salts and nutrients in the analysis of the hydrologic system discussed in Section 3. Several important points underlie this gaps analysis. Previous sections have described a westward groundwater gradient and significant subsurface discharge to the ocean. Groundwater flow rates have been estimated by the USGS to be less than a few hundred feet per year. In addition, this report (Section 3, Figure 3-2) and others (Luhdorff and Scalmanini, 2012) note increases in NO3 in monitoring wells in several areas of the Valley, particularly the western portions.
Other sections of this report outline changes in management techniques that reduce loading of nutrients to the basin. However, the existing monitoring shown in Figure 3-2 indicates continued increase or no reduction in NO3 in all groundwater measured within the study area. This suggests that benefits from reduced NO3 loading require many years to manifest themselves at existing measurement points.

66
5.3.1 Well Location, Construction and Hydrogeologic Characteristics
Vertical and horizontal locational information of all monitoring wells is good. Well head location and elevation of all monitoring wells has been established by GPS and/or surveying. However, 29 of the monitoring wells are “unclassified” as to depth of production zone. They are therefore not assigned to the shallow or deep monitoring well network due to inadequate documentation of production zones or vertical extent of filter pack material. In addition, some wells sampled may be completed in both confined and unconfined horizons. Because the water level elevation in confined and unconfined zones may be at different levels, water level data from multiple completion wells is not easily interpreted and water quality data from the well cannot be ascribed to a particular level in the aquifer system.
The location of existing monitoring wells provides uneven and sparse coverage of key areas in the eastern basin. In particular, effects of NO3 in that area is not well documented. In addition, recharge along the Santa Maria River is not well documented.
Documentation of geologic materials encountered during well construction is inconsistent. The records of the coastal piezometers detail variation in geologic materials and the relationship to screened intervals. In most other wells used for monitoring, little or no reliable information on subsurface materials is available.
5.3.2 Areal Distribution of Ground Water Measurements
The areal distribution of groundwater measurements was sufficient to generally define the regional water table and surface gradients. However, existing measurements were not adequate to define the vertical and horizontal distribution of salt and nutrients within the basin. Currently, water level elevation is measured in 91 wells on an annual or semiannual basis while in a subset of those wells, 26 wells, water levels are made quarterly or semi-annually. Spring measurements are in March or April (before the irrigation season). Additional measurements are made in the fall, after the end of the most intense irrigation season. Some wells, such as those in or near the municipal well fields, are measured more frequently.
Of the 149 potential water level monitoring wells in the basin, 79 wells could be locations for monitoring water quality (37 shallow, 38 deep, and four unclassified). Water quality information was available from 14 wells, four of which are reported as shallow wells.
The location of existing monitoring wells provides uneven and sparse coverage of key areas in the eastern basin. In particular, lack of monitoring wells means that ground water quality in that area is not well documented.
A significant number of unused wells in the western portion of the Valley may be completed in both the upper and lower zones of the aquifer. These wells may allow flow between the upper and lower aquifer zones. The effect of these wells on water level and migration of NO3 is not understood. Although data from shallow or deep wells was assumed to represent

67
only the designated level, this distinction may or may not be important throughout westernmost portions of the Valley.
5.3.3 Characteristics of Subsurface Discharge to the Ocean
Variation of the horizontal extent and permeability of the zone discharging to the ocean is not well defined. Simplifying assumptions underlie the indirect methods used to estimate rate of discharge. In addition, horizontal variation of nutrient and salt levels along the shoreline is documented but not well defined. Only two piezometer clusters are monitored and there appears to be vertical variation in nutrient level at each location and variation between the two locations. The Annual Report (Luhdorff and Scalmanini, 2012), points out that the deep aquifer zone at the northerly monitoring well has shown gradually increasing levels of nitrate up to the present. In contrast, in all aquifer zones near the southerly monitoring well set, the groundwater has consistently shown very low concentrations of nitrates through the present. These variations suggest uncertainty in estimates of discharge of TDS, Cl- and NO3 from the basin through the discharge path to the ocean developed in the analysis in Section 3.
5.3.4 Vertical Stratification of TDS and NO3 in the Subsurface
Wells currently sampled for water quality are characterized as “deep,” “shallow” or “unknown.” However, these wells are spaced a considerable distance apart, thus only a coarse characterization of vertical groundwater quality, in the most general sense, is possible at the present time. Information is not readily available in the agricultural areas to characterize vertical variation of water quality within the aquifer zones developed as water sources. However, preliminary data provided from the City of Santa Maria suggests that in some areas NO3 levels in ground-water may be significantly higher in the upper levels of the aquifer compared to lower zones. If this is the case, wells may be constructed and operated to take advantage of high or low NO3 levels to meet water user preferences and needs.
5.3.5 Surface Water Measurements
Measurement of flow and water quality in surface streams in the Santa Maria Valley is a challenge due to the extremes of rainfall and streambed characteristics. The costs associated with surmounting these challenges and installing effective monitoring have resulted in-stream monitoring focused on the needs of the entity performing the monitoring. Specific challenges in surface water monitoring include:
1. Variation in surface flow due to seasonal/annual variation in rainfall 2. Variation in flow along stream courses due to infiltration 3. Lack of gaging station control (cross section) 4. Gages in need of being reestablished 5. Interpretation of surface drainage sampling to represent groundwater discharge.

68
Both substantial uncertainties and significant gaps exist in flow and water quality measurements used in the analysis in Section 3. As a result, the analysis and any conclusions drawn from it should be regarded as general in nature.
5.4 Conclusions 5.4.1 Salt and Nutrient Input Data
Inputs are sources of salt and nutrient that contribute to the hydrologic system including rainfall, recharge from Twitchell Reservoir, importation of water from the SWP, and applied fertilizer. The inputs include infiltration from other surface streams and applied irrigation water.
1. Inflow of water to the basin from sources including rainfall, Twitchell Reservoir releases and SWP deliveries is well documented for the analysis period. The data available for calculation of inputs to the conceptual model balance estimates are well defined and detailed.
2. Salt (TDS) loading data for imported SWP water and infiltration of treated sewage effluent is well documented for the analysis period. (This includes sources such as water softeners.) The data available for calculation of inputs to the conceptual model balance estimates are well defined and detailed.
3. Nitrogen (NO3) loading data for imported SWP water and infiltration of treated sewage effluent is well documented for the analysis period. The data available for calculation of inputs to the conceptual model balance estimates are well defined and detailed.
4. Water quality data from Twitchell Reservoir releases is sparse for the analysis period. TDS and NO3 data available for calculation of inputs from Twitchell Reservoir to the conceptual model balance estimates lack precision.
5. Streamflow and infiltration data from natural streamflow has been collected intermittently at several sites for the analysis period and generally lacks precision due to the physical characteristics of the measuring points and lack of continuity. TDS and NO3 data available for calculation of inputs to the conceptual model balance estimates lack precision.
6. Water quality data from natural stream flow has been collected intermittently at several sites for the analysis period and generally lacks precision due to lack of time series data. TDS and NO3 data available for calculation of inputs to the conceptual model balance estimates lack precision.
7. Irrigation production data for the analysis period were obtained from the Annual Report Luhdorff and Scalmanini (2012). The data were based on cropping information and not actual pumping or electrical use records. These estimates have some basis but there has been no evaluation of their precision.
8. Water quality data for water used for irrigation was not available for the analysis period; water quality was estimated from groundwater quality measurements made at existing monitoring wells. Source zones (aquifer zones sampled) for approximately

69
30% of the wells are not known. The correspondence between agricultural production zones and the zones represented by monitoring wells is not well documented. TDS and Nitrogen (NO3) data available for calculation of irrigation water inputs to the conceptual model balance estimates lack precision.
9. Nitrogen application for the analysis period is estimated from NRCS and UCCE guidance materials and anecdotal evidence regarding management practices; no direct data on fertilizer use is available for this analysis. Transformation of the various forms of N to NO3 was estimated based on academic research. Nitrogen (NO3) data available for calculation of applied fertilizer inputs to the conceptual model balance estimates lack precision.
5.4.2 Salt and Nutrient Output Data
Outputs are elements of the hydrologic system and other mechanisms that remove salt and nutrient from the Santa Maria Valley. They include stream flow to the ocean, groundwater flow (underflow) to the west beneath the coast, crop material removed at harvest.
10. Streamflow and discharge to streams has been collected intermittently at several sites and generally lacks precision due to the physical characteristics of the measuring points. TDS and Nitrogen (NO3) data available for calculation of values used in the conceptual model balance estimates lack precision.
11. Subsurface discharge of water is estimated from gradient data developed from 6 deep wells and 3 shallow wells in the western portion of the valley. Other data (permeability and depth of the aquifer) are based on two piezometer clusters near the ocean spaced 1.5 miles apart. Estimates of subsurface discharge have some basis but there has been no evaluation of their accuracy.
12. Subsurface discharge of TDS, Cl- and NO3 are estimated from water quality data collected intermittently at two piezometer clusters near the ocean spaced 1.5 miles apart. Estimates of subsurface water quality have some basis. Volume of discharge of TDS, Cl- and Nitrogen (NO3) data available as inputs to the conceptual model balance estimates have some basis but there has been no evaluation of their accuracy.
13. TDS, Cl- and NO3 in plant material removed at harvest are estimated from agricultural land use, simplifying assumptions for each crop type, NRCS and UCCE guidance materials, and anecdotal evidence regarding soil management practices; no direct data on TDS, Cl- and NO3 in plant material removed at harvest was readily available for this analysis.
5.5 Monitoring Recommendations As discussed in Section 2 of this report, several entities monitor one or more of the following: surface flow, groundwater levels and water quality. These entities include the USGS, the RWQCB, the County of Santa Barbara, Twitchell Management Authority (TMA), and other parties (such as CCWQP). In accordance with the terms of the Settlement

70
Agreement and Order, the TMA manages a hydrologic monitoring program in the Santa Maria Valley. The original monitoring program has been recently expanded to include a CIMIS station (detailed climate conditions) at the Santa Maria Airport, biannual water quality measurements in the Cuyama River and expanded water level measurement in existing monitoring wells. Additional monitoring will be considered by the Twitchell Management Authority as part of development of their annual budget. This additional data collection is focused on the ongoing requirements of the Court and may or may not pertain to salt and nutrient management.
Recommendation 1: Continue to collect data under existing and newly expanded monitoring programs so that groundwater basin water quality and levels conditions can be reassessed in the future.
Recommendation 2: Periodic samples should be taken to document water quality of Twitchell Reservoir releases. The water quality benefits of releases from Twitchell Reservoir for groundwater recharge are not well documented. These releases appear to improve water quality in areas between the confluence of the Sisquoc and Cuyama Rivers and the Bonita School Road crossing west of the City of Santa Maria. This data will be used along with ground water monitoring to confirm the benefits.
Recommendation 3: Install transducers on northern perimeter wells. Groundwater movement at the boundaries of the study area is a key component to understanding the transport of salts and nutrients and the volume of water in the basin. Transducers provide regular level data to better understand seasonal trends.
Recommendation 4: An additional monitoring well is recommended to be installed in the northern portion of the City of Santa Maria in order to have a more comprehensive understanding of water level and quality in the northern portion of the aquifer Depending on the water quality and geologic materials encountered during drilling, consideration should be given to installation of piezometers rather that completion of the well at a single level.
Recommendation 5: The Green Canyon watershed gage should be rated (for depth vs. flow) and storm water samples collected. Information gathered should be used to evaluate the utility of using the watershed as a basis for estimating salt and nutrient movement from tributary watersheds.
Implementation of these recommendations and any other monitoring should be based on a clear understanding of the purpose and utility of data collected. Data collected should rely on proven and cost effective techniques and applied in defensible and meaningful ways.

71
6 Summary and Conclusions
This report addresses Total Dissolved Solids (TDS), Chloride (Cl-) and Nitrate (NO3) as indicators of salt and nutrient conditions in the Santa Maria Valley. The evaluation focused on conceptual model “snapshots” of 1990, 2000 and 2010 and was based on available information. The main conclusions are listed below.
6.1 Monitoring • Available existing data provides basis for coarse estimates TDS, Cl- and NO3
balance in the Santa Maria Valley area. • Current monitoring was established to address water management issues and water
quality issues in relation to beneficial uses in the basin. • Existing monitoring characterizes quantity and quality of imported (SWP) supplies
and discharged waste water treatment throughout the analysis period. • Monitoring of the smaller steams and agricultural drains improved during the
analysis period. • The available data are not temporally and spatially sufficient to document
effectiveness of past and ongoing salt and nutrient management. • Salt and nutrients discharged to the basin surface and groundwater by agricultural
uses may be better understood in the future by monitoring under the proposed Ag Waiver.
6.2 Sources, Transport and Fate of Salt and Nutrient • TDS and Cl- sources include surface water, imported (SWP) water, water softeners,
and naturally occurring geologic contributions • NO3 sources include municipal waste streams and fertilizer use (for both agriculture
and landscaping) • Significant reduction in NO3 loading has occurred in the past 20 years due to
improved nutrient management. • Salt and Cl- loading appears to have decreased in since 2000 • Salts and nutrients are transported by both surface- and groundwater. • Salts and nutrients are transported from the valley by both surface and subsurface
flow.
6.3 Water Quality Trends • TDS and Cl- have increased only modestly in monitoring wells along the coast.

72
• NO3 levels have increased substantially in shallow wells, particularly in the western portion of the Valley.
• NO3 levels began increasing in coastal monitoring wells in the mid to late 1980’s, suggesting slow response to fertilizer use that has occurred for decades.
• Water quality trends in monitoring wells at the coast do not yet reflect reductions in NO3 loading that appear to have begun in the 1990’s.

1
References and Other Resources
Geology and Hydrology References and Resources Ahlroth, J., 1992. Santa Maria Ground Water Budget Status, Santa Barbara County Water Agency memorandum, August 26, 1992. Arnold and Anderson, 1907. Geology and Oil Resources of the Santa Maria Oil District, Santa Barbara County, California, U.S. Geological Survey Bulletin 322. Brown and Caldwell, 1976. Development of a Nonpoint Source Pollution Control Program for the Santa Maria Valley. California Department of Water Resources, Southern District, 2002. Water Resources of the Arroyo Grande – Nipomo Mesa Area. California Regional Water Quality Control Board, 1995. Assessment of Nitrate Contamination in Ground Water Basins of the Central Coast Region Preliminary Working Draft, Central Coast Region. Hopkins, Curtis, 2000. Hydrogeological Review of the Santa Maria Valley Groundwater Basin Water Budget Models, Memo to the Santa Barbara County Water Agency, Santa Barbara County, California. Hughes, Jerry L., 1977. Evaluation of Ground Water Quality in the Santa Maria Valley, California, U.S. Geological Survey, Water-Resources Investigation 76-128. Lippincott, J.B., 1931. Report on Water Conservation and Flood Control of the Santa Maria River in Santa Barbara and San Luis Obispo Counties. Luhdorff and Scalmanini Engineers, 2008. Monitoring Program for the Santa Maria Valley Management Area, prepared for Superior Court of California, County of Santa Clara, and Twitchell Management Authority.
Luhdorff & Scalmanini Engineers, 2009. 2008 Annual Report of Hydrogeologic Conditions, Water Requirements, Supplies and Disposition, Santa Maria Valley Management Area. Prepared for Superior Court of California, County of Santa Clara, and Twitchell Management Authority.

2
Luhdorff & Scalmanini Engineers, 2010. 2009 Annual Report of Hydrogeologic Conditions, Water Requirements, Supplies and Disposition, Santa Maria Valley. Prepared for Superior Court of California, County of Santa Clara, and Twitchell Management Authority.
Luhdorff & Scalmanini Engineers, 2011. 2010 Annual Report of Hydrogeologic Conditions, Water Requirements, Supplies and Disposition, Santa Maria Valley. Prepared for Superior Court of California, County of Santa Clara, and Twitchell Management Authority.
Luhdorff & Scalmanini Engineers, 2012. 2011 Annual Report of Hydrogeologic Conditions, Water Requirements, Supplies and Disposition, Santa Maria Valley. Prepared for Superior Court of California, County of Santa Clara, and Twitchell Management Authority.
Luhdorff & Scalmanini Engineers, 2000. Development of a Numerical Ground-Water Flow Model and Assessment of Ground–Water Basin Yield, Santa Maria Valley Ground-Water Basin, March 2000. Miller and Evanson, 1966. Utilization of Groundwater in the Santa Maria Valley Area, California, USGS Water Supply Paper 1819-A. Morro Group, The, 1990. Review of Groundwater Conditions in the Northern Santa Maria Basin and Scenarios for the Evaluation of Impacts of Development on the Water Resources of Nipomo Mesa, Appendix A. Santa Barbara County Resource Management Department, Orcutt Community Plan Update Proposed Final Environmental Impact Report (95 EIR-01), 1995. Santa Barbara County Water Agency, 1994. Santa Maria Valley Water Resources Report. Superior Court of California, County of Santa Clara, Judgment after Trial, entered January 25, 2008 incorporating 2005 Settlement Stipulation for the Santa Maria groundwater basin adjudication. Toups Corporation, 1976. Santa Maria Valley Water Resources Study. Water Agency, Santa Barbara County. 1998. Santa Maria Groundwater Basin. Water Agency Summary Report. Woodring and Bramlette, 1950. Geologic Map of the Santa Maria District, Santa Barbara County, California. Worts, G.F., 1951. Geology and Groundwater Resources of the Santa Maria Valley Area, California, U.S. Geological Survey Water Supply Paper 1000.

3
General (Regional) References and Resources California Department of Fish and Game. 1945. Report on the Relation to maintenance of Fish Resource of Proposed Dams and Diversions in Santa Barbara County, CA. Administrative Report 45-25: 1-11. California Department of Water Resources. 1995. Compilation of Federal and State Drinking Water Standards and Criteria, Quality Assurance Technical Document 3. California Natural Resources Agency. 2009. California Water Plan Update 2009. Vol. 4, Reference Guide, 2009 California Climate Adaptation Strategy. California Regional Water Quality Control Board. 1995. Assessment of Nitrate Contamination in Ground Water Basins of the Central Coast Region Preliminary Working Draft, Central Coast Region. Cosby, P .G and J. A. Ahlroth. 1991. Santa Barbara County Growth Inducement Potential of State Water Importation, Santa Barbara County Water Agency. Cosby, P .G and J. A. Ahlroth. 2003. Santa Barbara County Water Supply and Demand Update, Santa Barbara County Water Agency. Dames & Moore. 1993. Santa Barbara County Comprehensive Plan, Final Program EIR. Groundwater Section Conservation Element. Gibbs, Dennis. 2009. 2008 Santa Barbara County Groundwater Report. Santa Barbara County Public Works Department, Water Resources Division, Water Agency.
Gibbs, Dennis. 2012. 2011 Santa Barbara County Groundwater Report. Santa Barbara County Public Works Department, Water Resources Division, Water Agency. National Marine Fisheries Service (NMFS). 2005. Endangered and Threatened Species; Designation of Critical Habitat for Seven Evolutionarily Significant Units of Pacific Salmon and Steelhead in California; Final Rule. 50 CFR Part 226. September 2, 2005. National Marine Fisheries Service (NMFS). 2009. Southern California steelhead recovery plan. Public Review Draft Version. Southwest Regional Office, Long Beach, California. Pierotti, B. and R. 1998, Evaluation of Groundwater Overdraft in the Southern Central Coast Region. Santa Barbara County Flood Control. 1996. 1996 Precipitation Report.

4
Santa Barbara County Planning & Development Department. 1994. Santa Barbara County Comprehensive Plan, Conservation Element, Groundwater Resources Section. Santa Barbara County Planning and Development Department. 1995. Environmental Thresholds and Guidelines Manual. Santa Barbara County Water Agency. 1977. Adequacy of the Groundwater Basins of Santa Barbara County. Santa Barbara County water Agency. May 2007. Countywide Integrated Regional Water Management Plan. Solak, Mark, et al. 1996. Precipitation Augmentation Potential from Convection Band Seeding in Santa Barbara County. U.S. Forest Service. 2005. Land Management Plan Part 2 Los Padres National Forest Strategy. Pacific Southwest Region. R5-MB-078. US Fish and Wildlife Service. Climate Change in the Pacific Region, http://www.fws.gov/pacific /Climatechange/challenges.html. Turner, K.M. 1992. Reliability of Storage Schemes, Tree Rings, and Hurst Phenomena. California Department of Water Resources. Recycled Water and Salt/Nutrient Regulatory References and Resources California Department of Health Services. 2001. California Health Laws Related to Recycled Water—June 2001 Update, p. 51–57. California Department of Health Services, Sacramento, CA. California Department of Water Resources. 2003. Recycled Municipal Water, Section 14, Chapter 5, Resource Management Strategies. In California Water Plan Update 2003, vol. I. California Department of Water Resources, Sacramento, CA. California Department of Water Resources. 2004. The California Water Plan, vol. 2. Resource Management Strategies. Bulletin 160, 2004 Draft. California Department of Water Resources, Sacramento, CA.

5
California Recycled Water Task Force. 2003. Final Report: Water Recycling 2030. Recommendations of the California Recycled Water Task Force, June 2003. California Department of Water Resources, Sacramento, CA. California State Water Resources Control Board Office of Water Recycling. 2002. Survey of Recycled Water Use in California. California State Water Resources Control Board Office of Water Recycling, Sacramento, CA. Crook, J., and R. Y. Surampalli. 1996. Water reclamation and reuse criteria in the U.S. Wat. Sci. Technol. 33:451–462. State of California. 2000. PorterCologne Water Quality Control Act. California Administrative Code, Division 7. State Water Resources Control Board, Sacramento, CA. State of California. 1978. Wastewater reclamation criteria, p. 1557–1609. California Administrative Code. Title 22, Division 4. California Department of Health Services, Berkeley, CA. Tchobanoglous, G., F. L. Burton, and H. D. Stensil. 2003. Wastewater Engineering, Treatment, and Reuse. 4th ed. McGrawHill, New York, NY. Water Use, Water Quality and Nitrate, Technical and Management References and Resources Bianchi, M., D. Mountjoy, and A. Jones. 2009. The Farm Water Quality Plan. Oakland: University of California Division of Agriculture and Natural Resources, Publication 8332. Bolda, M., M. Gaskell, J. Fallon, M. Sanchez, T. Bottoms and T. Hartz. May 2012. Strawberry plant nutrient sufficiency levels revised, Tim Hartz (speaker). Strawberry Field Day, Friday, May 11, 2012. Manzanita Berry Farms, 1891 West Main, Santa Maria, CA 93458. Burt, C.M., A. J. Clemmens, T. S. Streldoff, K. H. Solomon, R. D. Bliesner, L. A. Hardy, T. A. Howell, and D. E. Eisenhouer. 1997. Irrigation Performance Measures: Efficiency and Uniformity. Journal of Irrigation and Drainage Engineering, November/December 1997. Paper No. 11971. Cachuma Resources Conservation District and the Dunes Center. August 2004. Final Nitrate and Sediment Assessment, Oso Flaco Watershed, San Luis Obispo County, CA and Appendix A: Example Farm Plan. Prepared for: California Regional Water Quality Control Board, Central Coast Region.

6
Cahn, Michael. 2012. Irrigation Management of Strawberries (PowerPoint). Presentation by Irrigation and Water Resources Advisor, UCCE, Monterey County. 2012. Cahn, Michael. 2012. Tools for Improved Irrigation Management (PowerPoint); 2012 Irrigation and Nutrient Management and Water Quality Field Day. Cooperative Extension Monterey County. California Department of Water Resources. 2004. Central Coast Hydrologic Region, Santa Maria River Valley Groundwater Basin. California’s Groundwater Bulletin 118. California Regional Water Quality Control Board, Central Coast Region. 2012. Conditional Waiver of Waste Discharge Requirements for Discharges from Irrigated Lands. California State Water Resources Control Board. 2012. Addressing Nitrate in California’s Drinking Water. Technical Report 2: Nitrogen Sources and Loading to Groundwater. Center for Watershed Sciences, University of California, Davis. http://groundwaternitrate.uscdavis.com Callado, Rodolfo. May, 2012. Fertilizer and nutrient applications 2011; informational discussion. Mesa Vineyard Management Inc., 2570 Prell Road, Santa Maria, CA 93456. Central Coast Vineyard Team. 2012. Sustainability in Practice (SIP) Program for Certified Sustainable Vineyards. http://www.vineyardteam.org/. List of SIP Certified Vineyards is found at www.sipthegoodlife.org Central Coast Water Board Staff. November, 2010. Appendix F, Draft Technical Memorandum: Cost Considerations Concerning Conditional Waiver of Wast Discharge Requirement for Discharges from Irrigated Lands (Draft Agricultural Order No. R3-2020-0006). California Regional Water Quality Control Board, Central Coast Region. Dzurella, Kristin N. et al. February, 2012. Nitrate Source Reduction to Protect Groundwater Quality, Technical Report 3, Addressing Nitrate in California’s Drinking Water with a Focus on Tulare Lake Basin and Salinas Valley Groundwater. Report for the State Water Resources Control Board Report to the Legislature; prepared by Center for Watershed Sciences, University of California, Davis, California Nitrate Project, Implementation of Senate Bill X2 1, Tulare Lake Basin and Salinas Valley Pilot Studies for California State Water Resources Control Board. Fine, L. O., C. G. Carlson, and J. H. Bischoff. 1988. Irrigation: Your Water, Your Soil, and Their Compatibility. Water Resources Institute, South Dakota State University, Brookings South Dakota.

7
Fry, Bob. 2010. AWEP Lettuce Nitrogen Management Program for the Salinas Valley (PowerPoint); 2010 Irrigation and Nutrient Management and Cover Crop and Water Quality Field Day. USDA/NRCS, Davis, CA. GEI Consultants. 2012. Santa Barbara County Water Supply and Demand Current Uses and Future Estimates. Prepared for Santa Barbara County Water Agency. Greene, Sarah. November 18th, 2011. Update on Cooperative Monitoring: Water Quality Results for Santa Barbara Co. (PowerPoint). Presentation by Central Coast Water Quality Preservation, Inc., at AWQC Meeting, Buellton. Hartz, Tim. 2012. Nitrogen Management Project @ Dole Veg Corp (PowerPoint); 2012 Irrigation and Nutrient Management and Water Quality Field Day. Cooperative Extension Monterey County. http://cemonterey.ucdavis.edu/Custom_Program567/Presentations/ Heinrich, Aaron. and Richard Smith, UCCE, Monterey. 2012. Nutrient Uptake by Spinach (PowerPoint); 2012 Irrigation and Nutrient Management and Water Quality Field Day. Cooperative Extension Monterey County. Hoffman, Georges and Oswald Van Cleemput. September, 2004. Soil and Plant Nitrogen. International Fertilizer Industry Association, Paris. Hughes, Jerry L. July 1977. Evaluation of Ground-water Quality in the Santa Maria Valley, California. U.S. Geological Survey Water-Resources Investigations 76-128 prepared in cooperation with the CA State Water Resources Control Board and the CA Regional Water Quality Control Board, Central Coast Region. Jones, Kenneth R. May 1985. Water Quality Objectives for the Santa Maria Ground Water Basin Staff Report (Revised). California Regional Water Quality Control Board, Central Coast Region. Levine, A. D. and T. Asano. 2004. Recovering sustainable water from wastewater. Environ. Sci. Technol. 38:202A–208A. Maan, Asif A. June 11, 2012. Nitrogen Management Efforts (PowerPoint). CA Department of Food and Agriculture, Fertilizer Research and Education Program. Monterey County Water Resources Agency. 1999. Fact Sheet 4: Using the Nitrate Present in Soil and Water in Your Fertilizer Calculations.

8
Natural Resources Conservation Service. May 2011. Conservation Practice Standard: Irrigation Water Management (Ac.). Publication CODE 449. Natural Resources Conservation Service. August 2006. Conservation Practice Standard: Nutrient Management (Ac.). Publication CODE 590. Pettygrove, G. S., T. K. Hartz, R. Smith, T. R. Lockhart, B. R. Hanson, L. E. Jackson, and S. R. Grattan. 1998. Management Goals and Management Practices: Nutrient Management Goals and Management Practices for Cool-Season Vegetables. Oakland: University of California Division of Agriculture and Natural Resources, Publication 8097. Pettygrove, G. S., T. K. Hartz, B. R. Hanson, L. E. Jackson, R. Smith, T. R. Lockhart, and S. R. Grattan. 1998. Reference: Nutrient Management in Cool-Season Vegetables. Oakland: University of California Division of Agriculture and Natural Resources, Publication 8098. Robins, Paul. 2012. Regional Irrigation Efficiency Program (PowerPoint); 2012 Irrigation and Nutrient Management and Water Quality Field Day. Cooperative Extension Monterey County. At: http://cemonterey.ucdavis.edu/Vegetable_Crops/2011_Irrigation_and_Nutrient_ManagementMeeting_and_Cover_Crop_a/ Schmidt, Kirk and Sarah Greene. September, 2010. Central Coast Region Conditional Waiver Cooperative Monitoring Program, Follow-Up Monitoring Report: Water Quality Results from Upstream Monitoring 2008. Central Coast Water Quality Preservation, Inc. Schmidt, Kirk and Sarah Green. Feb 19, 2008. Cooperative Monitoring Program (PowerPoint); (Helping Central Coast Growers Comply with the Ag Waiver). Central Coast Water Quality Preservation, Inc., Irrigation and Nutrient Meeting, Salinas, CA. Sheikh, B., E. Rosenblum, S. Kasower, and E. Hartling. 1998. Accounting for all the benefits of water recycling. In Proceedings, Water Reuse ’98. Smith, Richard, Michael Cahn, Aaron Heinrich, and Barry Farrara. 2012. Fertilization Trials on Spinach and Nitrogen Fertilizer Technology Update (PowerPoint); 2012 Irrigation and Nutrient Management and Water Quality Field Day. Cooperative Extension Monterey County. Smith, Richard. 2012. Nitrogen Management of Lettuce: Field Scale Studies (PowerPoint); 2012 Irrigation and Nutrient Management and Water Quality Field Day. Cooperative Extension Monterey County.

9
Smith, Richard. 2010. Practical Soil Nitrate Testing and Fertilizer Management (PowerPoint); 2010 Irrigation and Nutrient Management and Cover Crop and Water Quality Field Day. Cooperative Extension Monterey County. Styles, Stuart, Lynn Groundwater, and Curtis Lutje. 2011. Strawberries: Effects of Modifying Irrigation Methods for Transplant Establishment. ITRC Paper No. P 11-002. www.itrc.org/papers/strawberries.htm Styles, Stuart, and Chuck Bates. 2011. Strawberry Transplants: Modifying Irrigation Methods for Establishment. ITRC Paper No. P 11-003. www.itrc.org/papers/strawberriesia.htm UCCE, Monterey. 2011. Nitrogen Management strategies to comply with water quality regulation (PowerPoint); 2011 Irrigation and Nutrient Management Meeting and Cover Crop and Water Quality Field Day Presentations. Monterey County, Cooperative Extension Monterey County, 1432 Abbott Street, Salinas, CA 93901.

Appendix A
Scope of Work

Appendix B
Suggested Elements of a Salt and Nutrient Management Plan

Appendix C
Salt and Nutrient Planning Working Group

Appendix D
Fact sheet for Order R3-2012-0011 ("2012 Ag Order")

Appendix E
Preliminary TDS, Cl¯, and NO3 Balance Calculations

Appendix F
Technical Support Memorandum for Root Zone Estimates