santa monica community college district 2017 … · santa monica community college district...
TRANSCRIPT
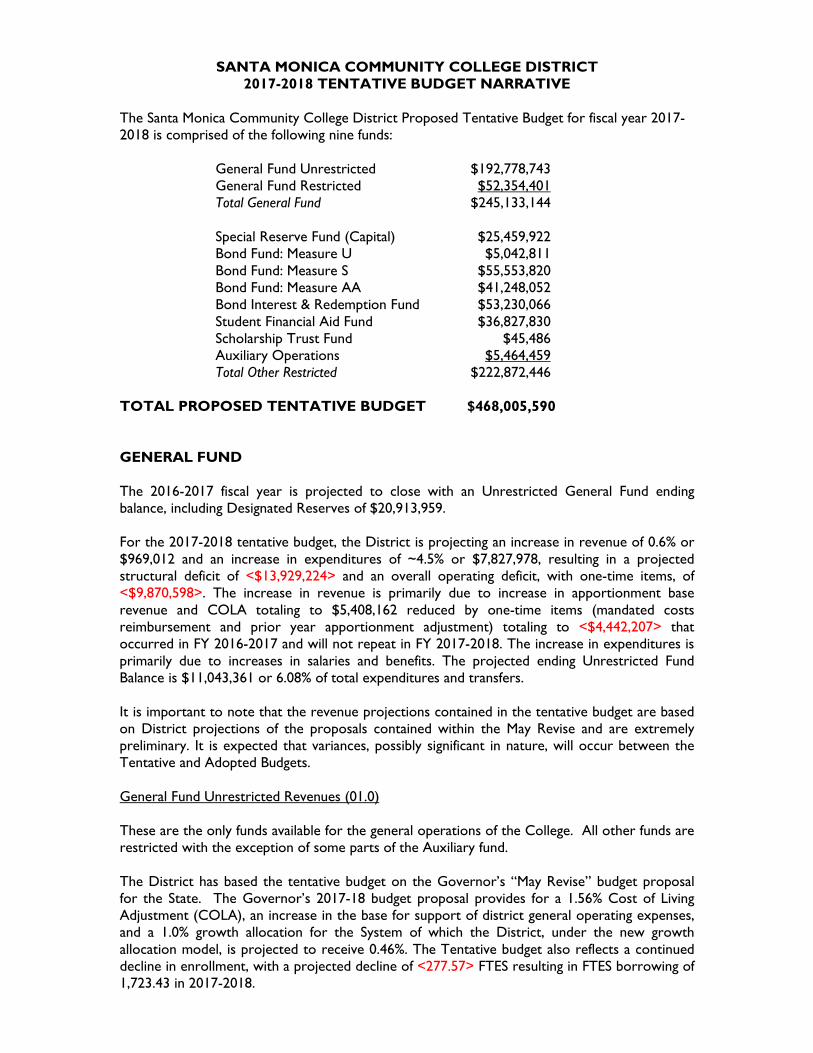
SANTA MONICA COMMUNITY COLLEGE DISTRICT 2017-2018 TENTATIVE BUDGET NARRATIVE
The Santa Monica Community College District Proposed Tentative Budget for fiscal year 2017-2018 is comprised of the following nine funds:
General Fund Unrestricted $192,778,743 General Fund Restricted $52,354,401 Total General Fund $245,133,144 Special Reserve Fund (Capital) $25,459,922 Bond Fund: Measure U $5,042,811 Bond Fund: Measure S $55,553,820 Bond Fund: Measure AA $41,248,052 Bond Interest & Redemption Fund $53,230,066 Student Financial Aid Fund $36,827,830 Scholarship Trust Fund $45,486 Auxiliary Operations $5,464,459 Total Other Restricted $222,872,446
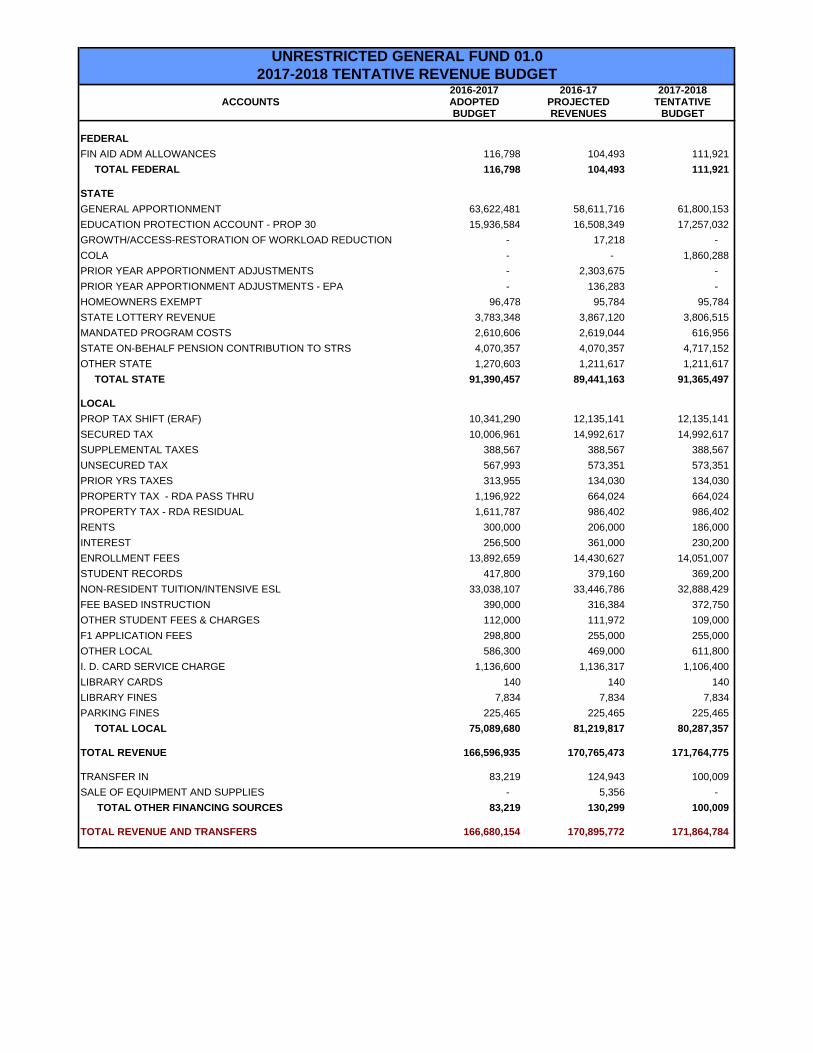
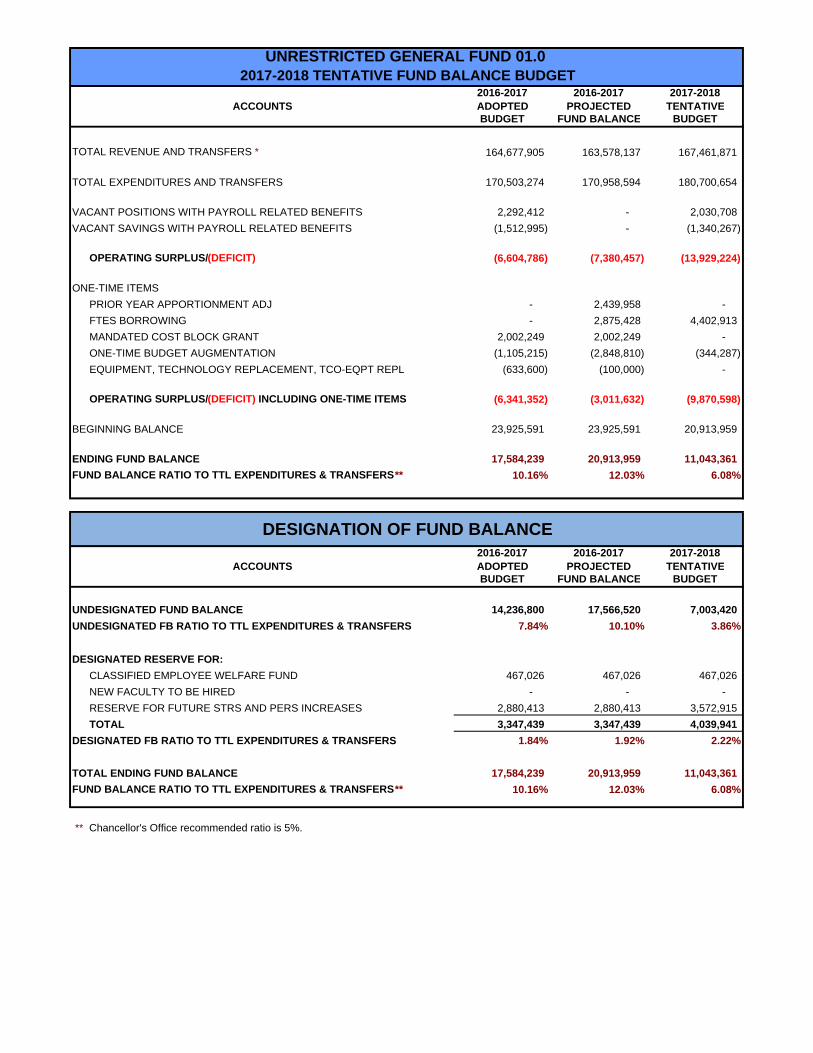
TOTAL PROPOSED TENTATIVE BUDGET $468,005,590 GENERAL FUND The 2016-2017 fiscal year is projected to close with an Unrestricted General Fund ending balance, including Designated Reserves of $20,913,959. For the 2017-2018 tentative budget, the District is projecting an increase in revenue of 0.6% or $969,012 and an increase in expenditures of ~4.5% or $7,827,978, resulting in a projected structural deficit of <$13,929,224> and an overall operating deficit, with one-time items, of <$9,870,598>. The increase in revenue is primarily due to increase in apportionment base revenue and COLA totaling to $5,408,162 reduced by one-time items (mandated costs reimbursement and prior year apportionment adjustment) totaling to <$4,442,207> that occurred in FY 2016-2017 and will not repeat in FY 2017-2018. The increase in expenditures is primarily due to increases in salaries and benefits. The projected ending Unrestricted Fund Balance is $11,043,361 or 6.08% of total expenditures and transfers. It is important to note that the revenue projections contained in the tentative budget are based on District projections of the proposals contained within the May Revise and are extremely preliminary. It is expected that variances, possibly significant in nature, will occur between the Tentative and Adopted Budgets. General Fund Unrestricted Revenues (01.0) These are the only funds available for the general operations of the College. All other funds are restricted with the exception of some parts of the Auxiliary fund. The District has based the tentative budget on the Governor’s “May Revise” budget proposal for the State. The Governor’s 2017-18 budget proposal provides for a 1.56% Cost of Living Adjustment (COLA), an increase in the base for support of district general operating expenses, and a 1.0% growth allocation for the System of which the District, under the new growth allocation model, is projected to receive 0.46%. The Tentative budget also reflects a continued decline in enrollment, with a projected decline of <277.57> FTES resulting in FTES borrowing of 1,723.43 in 2017-2018.

The largest source of revenue for the District is state funding. The state funding formula is based on the combination of property taxes, enrollment fees, and principal apportionment funds added together to equal the estimated State General Revenue. The figures in the tentative budget are based on estimates from the Chancellor’s Office adjusted by the District’s enrollment projections. Local revenues are a combination of property taxes and revenue generated at the college level through the charging of fees and fines, through interest earned on cash and non-resident tuition revenue. General Fund Unrestricted Expenditures (01.0) The District’s largest expenditures (90.0% of the total budget) are related to salary and benefits. The salary and benefit related expenditure projections reflect appropriate step, column and longevity increases for all qualified employees. Expenditure projections also include a negotiated salary increase of 2.2%, increased parity and part-time office hours in the salary of SMC Faculty Association and a 2.2% “me too” increase for Classified Schools Employee Association and SMC Police Officer Association. The discretionary section of the expenditure budget (Supplies and Services), reflects a increase of approximately $283,642 from 2016-2017 projected expenditures. The increase is primarily due to increase in bad-debts for students, managed print services, software upgrades reduced by non-recurring items and budget cuts from the prior year. The amount of $13,264,918 for the Contracts/Services line item in the tentative budget includes: Rents/Leases (i.e. Performing Arts Center, Swimming Pool, Big Blue Bus) 21%; Bank Fees and Bad Debt 15%; Repairs of Equipment/Maintenance 10%; Advertising 10%; Software Licensing 6%; Other Contract Services 6%; Consultants 5%; Managed Print Services 4%; Legal Services (including those for the Personnel Commission) 4%; Postage and Delivery Services 3%; Conferences and Training 3%; Off-Campus Printing 3%; LACOE Contracts (i.e. PeopleSoft, HRS) 2%; Professional Growth 2%; Memberships and Dues 1%; Audit 1%; Recruiting-Students 1% and Other Services – all under 1% of budget per category (e.g. Repairs-Facility, Field trip, Mileage, Commencement, Fingerprinting, Board Meetings, etc.) 3%. It is expected that adjustments to projections will occur between the tentative budget and adopted the budget as more information becomes available from the State. RESTRICTED FUNDS General Fund Restricted (01.3) This fund represents restricted funding that is received by the District from Federal, State, and Local sources. All grants that do not end by June 30, 2018, will be carried over to the 2018-2019 budget, if permissible. When received, new grants will be presented to the Board of Trustees for approval, and the District’s budget will be augmented to reflect the increase. Special Reserve Fund (40.0) Capital This fund is also known as the Capital Expenditures Fund. The major source of revenue for this fund is the non-resident capital surcharge. These funds are used for capital outlay related projects, including the installment payments for the AET Certificate of Participation and any

required expenditure matches to State capital outlay funding. State funding for capital projects is also accounted for in this fund. All capital expenditures and revenue in the Special Reserve Fund, as well as Funds 42.2, 42.3, and 42.4 reflect the total expenditure allocation and the total revenue for all projects and are not limited to the current year, thus resulting in a zero ending balance. These funds are legally restricted and may not be transferred into the unrestricted general fund. Bond Fund Measure U (42.2) This fund reflects the revenue from the sale of bonds approved through Measure U and the interest earned in the fund. The expenditures in this fund relate to the College construction plan approved under Measure U. Bond Fund Measure S (42.3) This fund reflects the revenue from the sale of bonds approved through Measure S and the interest earned in the fund. The expenditures in this fund relate to the College construction plan approved under Measure S. Bond Fund Measure AA (42.4) This fund reflects the revenue from the sale of bonds approved through Measure AA and the interest earned in the fund. The expenditures in this fund relate to the College construction plan approved under Measure AA. Bond Interest and Redemption Fund (48.0) This fund is administered by the County of Los Angeles Department of Auditor-Controller. It reflects the receipt of property tax revenues due to voted indebtedness for bond issues, the payment of interest on those bonds, plus the redemption of the bonds that mature within the 2017-2018 fiscal year. This information is provided by the County of Los Angeles Department of Auditor-Controller through the Los Angeles County Office of Education. Student Financial Aid Fund (74.0) This fund consists of all student financial aid programs (PELL, SEOG, Loans, Cal Grants and Full-time Student Success Grants). The transfer line items reflect a transfer from the Unrestricted General Fund to meet the match requirements of the individual grant programs. Scholarship Trust Fund (75.0) This fund is to account for gifts, donations, bequests, and devises (subject to donor restrictions) which are to be used for scholarships or for grants in aid to students. Auxiliary Operations This budget reflects the revenue and expenditures of the auxiliary operations of the District, namely the Bookstore, the food and vending concessions, and college expenditures in programs such as Athletics, Music, Theatre Arts, the Corsair student newspaper and transportation. CONCLUSION This is the tentative budget recommended for acceptance. It is expected that changes will occur between now and the Adopted Budget. Some changes will be the result of revised state
revenue, and others will be internal adjustments resulting from new or updated revenue information and expenditure reduction efforts.
2016-2017 2016-17 2017-2018ACCOUNTS ADOPTED PROJECTED TENTATIVE
BUDGET REVENUES BUDGET
FEDERAL
FIN AID ADM ALLOWANCES 116,798 104,493 111,921
TOTAL FEDERAL 116,798 104,493 111,921
STATE
GENERAL APPORTIONMENT 63,622,481 58,611,716 61,800,153
EDUCATION PROTECTION ACCOUNT - PROP 30 15,936,584 16,508,349 17,257,032
GROWTH/ACCESS-RESTORATION OF WORKLOAD REDUCTION - 17,218 -
COLA - - 1,860,288
PRIOR YEAR APPORTIONMENT ADJUSTMENTS - 2,303,675 -
PRIOR YEAR APPORTIONMENT ADJUSTMENTS - EPA - 136,283 -
HOMEOWNERS EXEMPT 96,478 95,784 95,784
STATE LOTTERY REVENUE 3,783,348 3,867,120 3,806,515
MANDATED PROGRAM COSTS 2,610,606 2,619,044 616,956
STATE ON-BEHALF PENSION CONTRIBUTION TO STRS 4,070,357 4,070,357 4,717,152
OTHER STATE 1,270,603 1,211,617 1,211,617
TOTAL STATE 91,390,457 89,441,163 91,365,497
LOCAL
PROP TAX SHIFT (ERAF) 10,341,290 12,135,141 12,135,141
SECURED TAX 10,006,961 14,992,617 14,992,617
SUPPLEMENTAL TAXES 388,567 388,567 388,567
UNSECURED TAX 567,993 573,351 573,351
PRIOR YRS TAXES 313,955 134,030 134,030
PROPERTY TAX - RDA PASS THRU 1,196,922 664,024 664,024
PROPERTY TAX - RDA RESIDUAL 1,611,787 986,402 986,402
RENTS 300,000 206,000 186,000
INTEREST 256,500 361,000 230,200
ENROLLMENT FEES 13,892,659 14,430,627 14,051,007
STUDENT RECORDS 417,800 379,160 369,200
NON-RESIDENT TUITION/INTENSIVE ESL 33,038,107 33,446,786 32,888,429
FEE BASED INSTRUCTION 390,000 316,384 372,750
OTHER STUDENT FEES & CHARGES 112,000 111,972 109,000
F1 APPLICATION FEES 298,800 255,000 255,000
OTHER LOCAL 586,300 469,000 611,800
I. D. CARD SERVICE CHARGE 1,136,600 1,136,317 1,106,400
LIBRARY CARDS 140 140 140
LIBRARY FINES 7,834 7,834 7,834
PARKING FINES 225,465 225,465 225,465
TOTAL LOCAL 75,089,680 81,219,817 80,287,357
TOTAL REVENUE 166,596,935 170,765,473 171,764,775
TRANSFER IN 83,219 124,943 100,009
SALE OF EQUIPMENT AND SUPPLIES - 5,356 -
TOTAL OTHER FINANCING SOURCES 83,219 130,299 100,009
TOTAL REVENUE AND TRANSFERS 166,680,154 170,895,772 171,864,784
2017-2018 TENTATIVE REVENUE BUDGETUNRESTRICTED GENERAL FUND 01.0

2016-2017 2016-2017 2017-2018ACCOUNTS ADOPTED PROJECTED TENTATIVE
BUDGET EXPENDITURES BUDGET
INSTRUCTION 27,115,586 27,623,667 29,709,557 ACADEMIC MANAGERS 6,850,507 6,789,790 6,459,657 NON-INSTRUCTION 6,198,965 6,321,016 6,560,076 HOURLY INSTRUCTION 32,352,405 33,954,555 35,101,096 HOURLY INSTRUCTION - FEE BASED INSTRUCTION 100,569 78,714 92,442 HOURLY NON-INSTRUCTION 4,656,702 4,559,146 4,722,290 VACANT POSITIONS - - 397,938 VACANCY SAVINGS - - (262,639) TOTAL ACADEMIC 77,274,734 79,326,888 82,780,417
CLASSIFIED REGULAR 22,024,140 22,839,283 23,808,167 CLASSIFIED MANAGERS 5,688,827 5,733,083 5,652,342 CLASS REG INSTRUCTION 3,160,183 3,381,841 3,438,519 CLASSIFIED HOURLY 1,521,974 2,611,939 1,390,898 CLASS HRLY INSTRUCTION 585,740 612,434 564,313 VACANT POSITIONS 1,848,722 - 1,239,728 VACANCY SAVINGS (1,220,157) - (818,220) TOTAL CLASSIFIED 33,609,429 35,178,580 35,275,747
STRS 6,919,881 7,076,657 8,019,476 STATE ON-BEHALF PENSION CONTRIB TO STRS 4,070,357 4,070,357 4,717,152 PERS 5,102,073 5,236,266 5,952,500 OASDI/MEDICARE 3,633,276 3,779,431 3,882,542 H/W 14,104,007 14,653,738 15,643,262 RETIREES' H/W 3,414,309 3,571,593 3,964,468 RETIREE - OPEB 2,000,000 - - SUI 184,978 186,194 188,563 WORKERS' COMPENSATION 1,990,850 2,068,666 2,121,924 ALTERNATIVE RETIREMENT 500,000 500,000 500,000 BENEFITS REL TO FEE BASED INSTRUCTION 22,124 17,317 20,338 BENEFITS RELATED TO VACANT POSITIONS 443,690 - 393,042 BENEFITS RELATED TO VACANCY SAVINGS (292,838) - (259,408) TOTAL BENEFITS 42,092,707 41,160,219 45,143,859
SUPPLIES 1,094,840 965,826 1,023,897 TCO-SUPPLIES - 100,000 -
TOTAL SUPPLIES 1,094,840 1,065,826 1,023,897
CONTRACTS/SERVICES 14,002,571 13,055,799 13,264,918 INSURANCE 995,855 927,056 927,056 UTILITIES 3,000,394 2,875,660 2,992,112 TOTAL SERVICES 17,998,820 16,858,515 17,184,086
EQUIPMENT 200,000 - - TECHNOLOGY REPLACEMENT 183,600 - - TCO - EQUIPMENT REPLACEMENT 250,000 - -
TOTAL CAPITAL 633,600 - -
TOTAL EXPENDITURES 172,704,130 173,590,028 181,408,006
OTHER OUTGO - TRANSFERS 314,876 314,876 324,876 OTHER OUTGO - STUDENT AID 2,500 2,500 2,500 TOTAL TRANSFERS/FINANCIAL AID 317,376 317,376 327,376
TOTAL EXPENDITURES & TRANSFERS 173,021,506 173,907,404 181,735,382
2017-2018 TENTATIVE EXPENDITURE BUDGETUNRESTRICTED GENERAL FUND 01.0
2016-2017 2016-2017 2017-2018ACCOUNTS ADOPTED PROJECTED TENTATIVE
BUDGET FUND BALANCE BUDGET
TOTAL REVENUE AND TRANSFERS * 164,677,905 163,578,137 167,461,871
TOTAL EXPENDITURES AND TRANSFERS 170,503,274 170,958,594 180,700,654
VACANT POSITIONS WITH PAYROLL RELATED BENEFITS 2,292,412 - 2,030,708
VACANT SAVINGS WITH PAYROLL RELATED BENEFITS (1,512,995) - (1,340,267)
OPERATING SURPLUS/(DEFICIT) (6,604,786) (7,380,457) (13,929,224)
ONE-TIME ITEMS
PRIOR YEAR APPORTIONMENT ADJ - 2,439,958 -
FTES BORROWING - 2,875,428 4,402,913
MANDATED COST BLOCK GRANT 2,002,249 2,002,249 -
ONE-TIME BUDGET AUGMENTATION (1,105,215) (2,848,810) (344,287)
EQUIPMENT, TECHNOLOGY REPLACEMENT, TCO-EQPT REPL (633,600) (100,000) -
OPERATING SURPLUS/(DEFICIT) INCLUDING ONE-TIME ITEMS (6,341,352) (3,011,632) (9,870,598)
BEGINNING BALANCE 23,925,591 23,925,591 20,913,959
ENDING FUND BALANCE 17,584,239 20,913,959 11,043,361
FUND BALANCE RATIO TO TTL EXPENDITURES & TRANSFERS ** 10.16% 12.03% 6.08%
2016-2017 2016-2017 2017-2018ACCOUNTS ADOPTED PROJECTED TENTATIVE
BUDGET FUND BALANCE BUDGET
UNDESIGNATED FUND BALANCE 14,236,800 17,566,520 7,003,420
UNDESIGNATED FB RATIO TO TTL EXPENDITURES & TRANSFERS 7.84% 10.10% 3.86%
DESIGNATED RESERVE FOR:
CLASSIFIED EMPLOYEE WELFARE FUND 467,026 467,026 467,026
NEW FACULTY TO BE HIRED - - -
RESERVE FOR FUTURE STRS AND PERS INCREASES 2,880,413 2,880,413 3,572,915
TOTAL 3,347,439 3,347,439 4,039,941
DESIGNATED FB RATIO TO TTL EXPENDITURES & TRANSFERS 1.84% 1.92% 2.22%
TOTAL ENDING FUND BALANCE 17,584,239 20,913,959 11,043,361
FUND BALANCE RATIO TO TTL EXPENDITURES & TRANSFERS ** 10.16% 12.03% 6.08%
** Chancellor's Office recommended ratio is 5%.
2017-2018 TENTATIVE FUND BALANCE BUDGETUNRESTRICTED GENERAL FUND 01.0
DESIGNATION OF FUND BALANCE
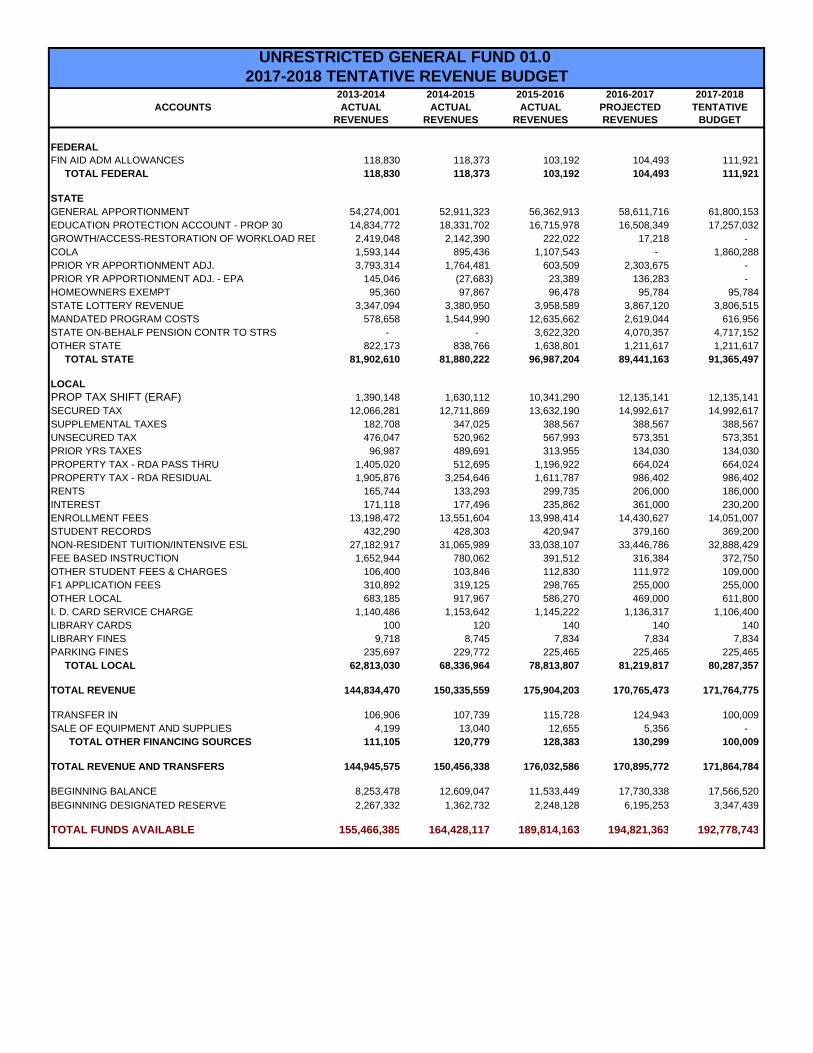
2013-2014 2014-2015 2015-2016 2016-2017 2017-2018ACCOUNTS ACTUAL ACTUAL ACTUAL PROJECTED TENTATIVE
REVENUES REVENUES REVENUES REVENUES BUDGET
FEDERALFIN AID ADM ALLOWANCES 118,830 118,373 103,192 104,493 111,921 TOTAL FEDERAL 118,830 118,373 103,192 104,493 111,921
STATEGENERAL APPORTIONMENT 54,274,001 52,911,323 56,362,913 58,611,716 61,800,153 EDUCATION PROTECTION ACCOUNT - PROP 30 14,834,772 18,331,702 16,715,978 16,508,349 17,257,032 GROWTH/ACCESS-RESTORATION OF WORKLOAD RED 2,419,048 2,142,390 222,022 17,218 - COLA 1,593,144 895,436 1,107,543 - 1,860,288 PRIOR YR APPORTIONMENT ADJ. 3,793,314 1,764,481 603,509 2,303,675 - PRIOR YR APPORTIONMENT ADJ. - EPA 145,046 (27,683) 23,389 136,283 - HOMEOWNERS EXEMPT 95,360 97,867 96,478 95,784 95,784 STATE LOTTERY REVENUE 3,347,094 3,380,950 3,958,589 3,867,120 3,806,515 MANDATED PROGRAM COSTS 578,658 1,544,990 12,635,662 2,619,044 616,956 STATE ON-BEHALF PENSION CONTR TO STRS - - 3,622,320 4,070,357 4,717,152 OTHER STATE 822,173 838,766 1,638,801 1,211,617 1,211,617 TOTAL STATE 81,902,610 81,880,222 96,987,204 89,441,163 91,365,497
LOCALPROP TAX SHIFT (ERAF) 1,390,148 1,630,112 10,341,290 12,135,141 12,135,141 SECURED TAX 12,066,281 12,711,869 13,632,190 14,992,617 14,992,617 SUPPLEMENTAL TAXES 182,708 347,025 388,567 388,567 388,567 UNSECURED TAX 476,047 520,962 567,993 573,351 573,351 PRIOR YRS TAXES 96,987 489,691 313,955 134,030 134,030 PROPERTY TAX - RDA PASS THRU 1,405,020 512,695 1,196,922 664,024 664,024 PROPERTY TAX - RDA RESIDUAL 1,905,876 3,254,646 1,611,787 986,402 986,402 RENTS 165,744 133,293 299,735 206,000 186,000 INTEREST 171,118 177,496 235,862 361,000 230,200 ENROLLMENT FEES 13,198,472 13,551,604 13,998,414 14,430,627 14,051,007 STUDENT RECORDS 432,290 428,303 420,947 379,160 369,200 NON-RESIDENT TUITION/INTENSIVE ESL 27,182,917 31,065,989 33,038,107 33,446,786 32,888,429 FEE BASED INSTRUCTION 1,652,944 780,062 391,512 316,384 372,750 OTHER STUDENT FEES & CHARGES 106,400 103,846 112,830 111,972 109,000 F1 APPLICATION FEES 310,892 319,125 298,765 255,000 255,000 OTHER LOCAL 683,185 917,967 586,270 469,000 611,800 I. D. CARD SERVICE CHARGE 1,140,486 1,153,642 1,145,222 1,136,317 1,106,400 LIBRARY CARDS 100 120 140 140 140 LIBRARY FINES 9,718 8,745 7,834 7,834 7,834 PARKING FINES 235,697 229,772 225,465 225,465 225,465 TOTAL LOCAL 62,813,030 68,336,964 78,813,807 81,219,817 80,287,357
TOTAL REVENUE 144,834,470 150,335,559 175,904,203 170,765,473 171,764,775
TRANSFER IN 106,906 107,739 115,728 124,943 100,009 SALE OF EQUIPMENT AND SUPPLIES 4,199 13,040 12,655 5,356 -
TOTAL OTHER FINANCING SOURCES 111,105 120,779 128,383 130,299 100,009
TOTAL REVENUE AND TRANSFERS 144,945,575 150,456,338 176,032,586 170,895,772 171,864,784
BEGINNING BALANCE 8,253,478 12,609,047 11,533,449 17,730,338 17,566,520
BEGINNING DESIGNATED RESERVE 2,267,332 1,362,732 2,248,128 6,195,253 3,347,439
TOTAL FUNDS AVAILABLE 155,466,385 164,428,117 189,814,163 194,821,363 192,778,743
UNRESTRICTED GENERAL FUND 01.0 2017-2018 TENTATIVE REVENUE BUDGET
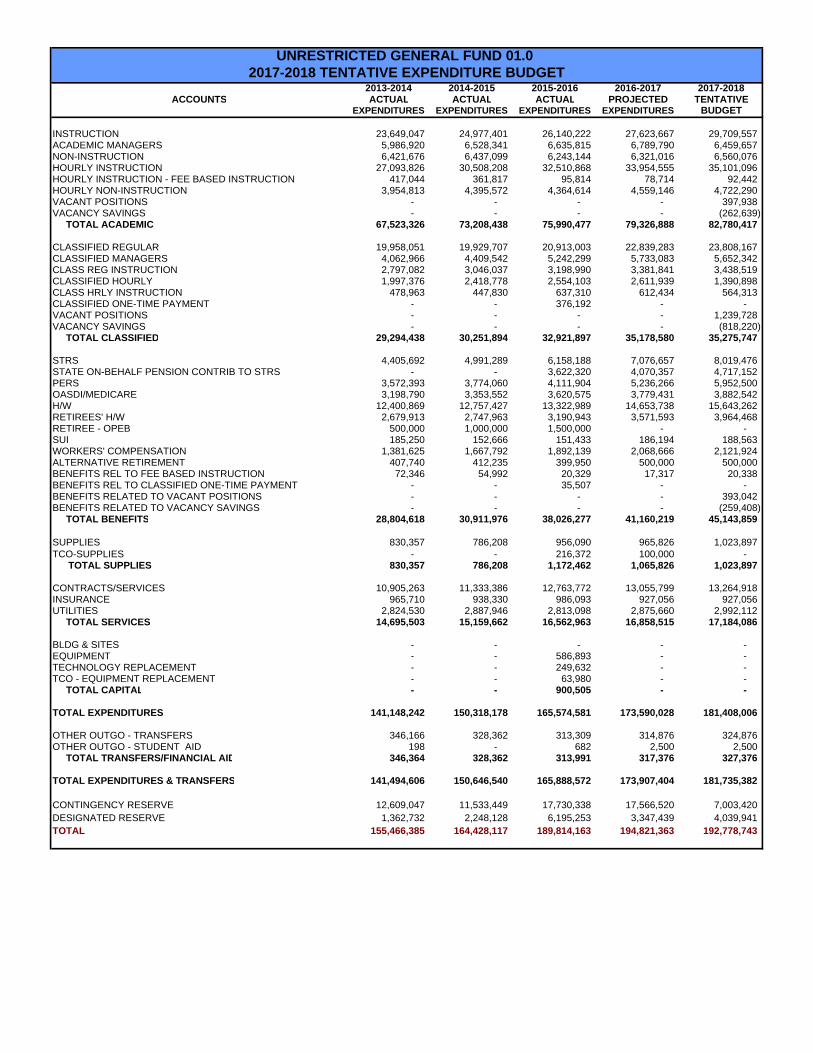
2013-2014 2014-2015 2015-2016 2016-2017 2017-2018ACCOUNTS ACTUAL ACTUAL ACTUAL PROJECTED TENTATIVE
EXPENDITURES EXPENDITURES EXPENDITURES EXPENDITURES BUDGET
INSTRUCTION 23,649,047 24,977,401 26,140,222 27,623,667 29,709,557 ACADEMIC MANAGERS 5,986,920 6,528,341 6,635,815 6,789,790 6,459,657 NON-INSTRUCTION 6,421,676 6,437,099 6,243,144 6,321,016 6,560,076 HOURLY INSTRUCTION 27,093,826 30,508,208 32,510,868 33,954,555 35,101,096 HOURLY INSTRUCTION - FEE BASED INSTRUCTION 417,044 361,817 95,814 78,714 92,442 HOURLY NON-INSTRUCTION 3,954,813 4,395,572 4,364,614 4,559,146 4,722,290 VACANT POSITIONS - - - - 397,938 VACANCY SAVINGS - - - - (262,639) TOTAL ACADEMIC 67,523,326 73,208,438 75,990,477 79,326,888 82,780,417
CLASSIFIED REGULAR 19,958,051 19,929,707 20,913,003 22,839,283 23,808,167 CLASSIFIED MANAGERS 4,062,966 4,409,542 5,242,299 5,733,083 5,652,342 CLASS REG INSTRUCTION 2,797,082 3,046,037 3,198,990 3,381,841 3,438,519 CLASSIFIED HOURLY 1,997,376 2,418,778 2,554,103 2,611,939 1,390,898 CLASS HRLY INSTRUCTION 478,963 447,830 637,310 612,434 564,313 CLASSIFIED ONE-TIME PAYMENT - - 376,192 - - VACANT POSITIONS - - - - 1,239,728 VACANCY SAVINGS - - - - (818,220) TOTAL CLASSIFIED 29,294,438 30,251,894 32,921,897 35,178,580 35,275,747
STRS 4,405,692 4,991,289 6,158,188 7,076,657 8,019,476 STATE ON-BEHALF PENSION CONTRIB TO STRS - - 3,622,320 4,070,357 4,717,152 PERS 3,572,393 3,774,060 4,111,904 5,236,266 5,952,500 OASDI/MEDICARE 3,198,790 3,353,552 3,620,575 3,779,431 3,882,542 H/W 12,400,869 12,757,427 13,322,989 14,653,738 15,643,262 RETIREES' H/W 2,679,913 2,747,963 3,190,943 3,571,593 3,964,468 RETIREE - OPEB 500,000 1,000,000 1,500,000 - - SUI 185,250 152,666 151,433 186,194 188,563 WORKERS' COMPENSATION 1,381,625 1,667,792 1,892,139 2,068,666 2,121,924 ALTERNATIVE RETIREMENT 407,740 412,235 399,950 500,000 500,000 BENEFITS REL TO FEE BASED INSTRUCTION 72,346 54,992 20,329 17,317 20,338 BENEFITS REL TO CLASSIFIED ONE-TIME PAYMENT - - 35,507 - - BENEFITS RELATED TO VACANT POSITIONS - - - - 393,042 BENEFITS RELATED TO VACANCY SAVINGS - - - - (259,408) TOTAL BENEFITS 28,804,618 30,911,976 38,026,277 41,160,219 45,143,859
SUPPLIES 830,357 786,208 956,090 965,826 1,023,897 TCO-SUPPLIES - - 216,372 100,000 -
TOTAL SUPPLIES 830,357 786,208 1,172,462 1,065,826 1,023,897
CONTRACTS/SERVICES 10,905,263 11,333,386 12,763,772 13,055,799 13,264,918 INSURANCE 965,710 938,330 986,093 927,056 927,056 UTILITIES 2,824,530 2,887,946 2,813,098 2,875,660 2,992,112 TOTAL SERVICES 14,695,503 15,159,662 16,562,963 16,858,515 17,184,086
BLDG & SITES - - - - - EQUIPMENT - - 586,893 - - TECHNOLOGY REPLACEMENT - - 249,632 - - TCO - EQUIPMENT REPLACEMENT - - 63,980 - - TOTAL CAPITAL - - 900,505 - -
TOTAL EXPENDITURES 141,148,242 150,318,178 165,574,581 173,590,028 181,408,006
OTHER OUTGO - TRANSFERS 346,166 328,362 313,309 314,876 324,876 OTHER OUTGO - STUDENT AID 198 - 682 2,500 2,500 TOTAL TRANSFERS/FINANCIAL AID 346,364 328,362 313,991 317,376 327,376
TOTAL EXPENDITURES & TRANSFERS 141,494,606 150,646,540 165,888,572 173,907,404 181,735,382
CONTINGENCY RESERVE 12,609,047 11,533,449 17,730,338 17,566,520 7,003,420 DESIGNATED RESERVE 1,362,732 2,248,128 6,195,253 3,347,439 4,039,941 TOTAL 155,466,385 164,428,117 189,814,163 194,821,363 192,778,743
UNRESTRICTED GENERAL FUND 01.0 2017-2018 TENTATIVE EXPENDITURE BUDGET

2016-2017 2016-2017 2017-2018ACCOUNTS ADOPTED PROJECTED TENTATIVE
BUDGET REVENUES BUDGET
FEDERAL
PERKINS IV TITLE I-C 677,180 677,180 636,677
FWS-FEDERAL WORK STUDY 496,100 496,100 496,100
TANF-TEMPORARY ASSISTANCE FOR NEEDY FAMILIES 58,631 59,652 56,669
FEDERAL CARRYOVERS 1,308,352 1,308,352 1,429,012
OTHER FEDERAL 1,798,372 3,050,310 1,826,883
TOTAL FEDERAL 4,338,635 5,591,594 4,445,341
STATE
LOTTERY 1,182,296 1,182,296 1,182,674
BASIC SKILLS INITIATIVE 351,560 351,560 355,897
SFAA-STUDENT FINANCIAL AID ADMIN 887,982 887,982 843,583
EOPS-EXTENDED OPPORTUNITY PROG & SERV 1,315,554 1,315,554 1,249,776
CARE-COOP AGENCIES RESOURCES FOR EDUCATION 88,792 88,792 84,352
DSPS-DISABLED STUDENTS PROGRAM & SERVICES 2,232,010 2,232,010 2,082,753
CALWORKS 267,669 317,502 301,628
STUDENT SUCCESS (CREDIT) 4,922,659 4,922,659 6,054,038
STUDENT SUCCESS (NON-CREDIT) 65,883 80,031 76,029
STUDENT SUCCESS (STUDENT EQUITY) 1,523,065 1,950,876 1,853,332
ENROLLMENT GROWTH 154,000 154,000 -
STRONG WORKFORCE PROGRAM - 871,012 -
PHYSICAL PLANT & INSTRUCTIONAL SUPPORT 1,464,456 1,751,382 -
STATE ON-BEHALF PENSION CONTRIBUTION TO STRS 632,052 632,052 632,052
STATE CARRYOVERS 5,302,122 5,352,122 10,862,220
OTHER STATE 2,207,621 2,396,127 498,090
TOTAL STATE 22,597,721 24,485,957 26,076,424
LOCAL
PICO PROMISE 141,782 144,618 144,618
HEALTH FEES 1,366,750 1,366,750 1,323,151
PARKING FEES 1,844,371 1,844,371 1,795,164
DONATIONS-KCRW 2,998,849 2,903,190 3,693,344
RADIO GRANTS 1,206,947 1,286,109 -
COMMUNITY SERVICES 861,020 722,703 705,200
CONSOLIDATED CONTRACT ED-LOCAL 256,140 342,448 336,923
LOCAL CARRYOVERS 241,489 337,148 -
OTHER LOCAL 5,825,000 5,845,000 5,738,990
TOTAL LOCAL 14,742,348 14,792,337 13,737,390
TOTAL REVENUE 41,678,704 44,869,888 44,259,155
RESTRICTED GENERAL FUND 01.3 2017-2018 TENTATIVE REVENUE BUDGET
2016-2017 2016-2017 2017-2018ACCOUNTS ADOPTED PROJECTED TENTATIVE
BUDGET EXPENDITURES BUDGET
INSTRUCTION 76,008 37,258 68,971 MANAGEMENT 1,706,344 2,007,754 1,830,941 NON-INSTRUCTION 1,893,634 2,214,197 1,954,869 HOURLY INSTRUCTION 96,840 205,509 79,899 HOURLY NON-INSTRUCTION 5,107,514 5,556,322 5,240,280 TOTAL ACADEMIC 8,880,340 10,021,040 9,174,960
CLASSIFIED REGULAR 4,597,660 4,772,684 5,653,844 CLASSIFIED MANAGERS 578,581 576,047 598,914 CLASS REG INSTRUCTION 33,250 76,579 110,924 CLASSIFIED HOURLY 1,837,777 2,124,132 1,909,283 CLASS HRLY INSTRUCTION 232,500 204,266 273,750 TOTAL CLASSIFIED 7,279,768 7,753,708 8,546,715
BENEFITS HOLDING ACCOUNT 5,152,656 1,988,708 5,856,380 STRS - 537,050 - STATE ON-BEHALF PENSION CONTRIB TO STRS - 632,052 - PERS - 491,454 - OASDI/MEDICARE - 384,295 - H/W - 969,063 - SUI - 4,895 - WORKERS' COMP. - 177,718 - ALTERNATIVE RETIREMENT - 51,541 - TOTAL BENEFITS 5,152,656 5,236,776 5,856,380
TOTAL SUPPLIES 1,038,863 1,469,255 1,066,418
CONTRACTS/SERVICES 7,216,393 8,330,236 8,072,818 INSURANCE 4,709,360 4,709,360 4,623,350 UTILITIES 178,800 178,800 160,050 TOTAL SERVICES 12,104,553 13,218,396 12,856,218
BLDG & SITES 1,911,110 1,753,310 1,660,763 EQUIPMENT/LEASE PURCHASE 4,001,859 4,604,537 3,763,312 TOTAL CAPITAL 5,912,969 6,357,847 5,424,075
TOTAL EXPENDITURES 40,369,149 44,057,022 42,924,766 OTHER OUTGO - STUDENT AID 548,357 638,644 660,292 OTHER OUTGO - TRANSFERS 83,219 124,943 100,009 TOTAL OTHER OUTGO 631,576 763,587 760,301
TOTAL EXPENDITURES & OTHER OUTGO 41,000,725 44,820,609 43,685,067
RESTRICTED GENERAL FUND 01.32017-2018 TENTATIVE EXPENDITURE BUDGET

2016-2017 2016-2017 2017-2018ACCOUNTS ADOPTED PROJECTED TENTATIVE
BUDGET FUND BALANCE BUDGET
TOTAL REVENUE AND TRANSFERS 41,678,704 44,869,888 44,259,155
TOTAL EXPENDITURES AND TRANSFERS 41,000,725 44,820,609 43,685,067
OPERATING SURPLUS/(DEFICIT) 677,979 49,279 574,088
BEGINNING BALANCE 8,045,967 8,045,967 8,095,246
CONTINGENCY RESERVE/ENDING FUND BALANCE 8,723,946 8,095,246 8,669,334
FUND BALANCE RATIO TO TTL EXPENDITURES & TRANSFERS 21.28% 18.06% 19.85%
RESTRICTED GENERAL FUND 01.32017-2018 TENTATIVE FUND BALANCE BUDGET
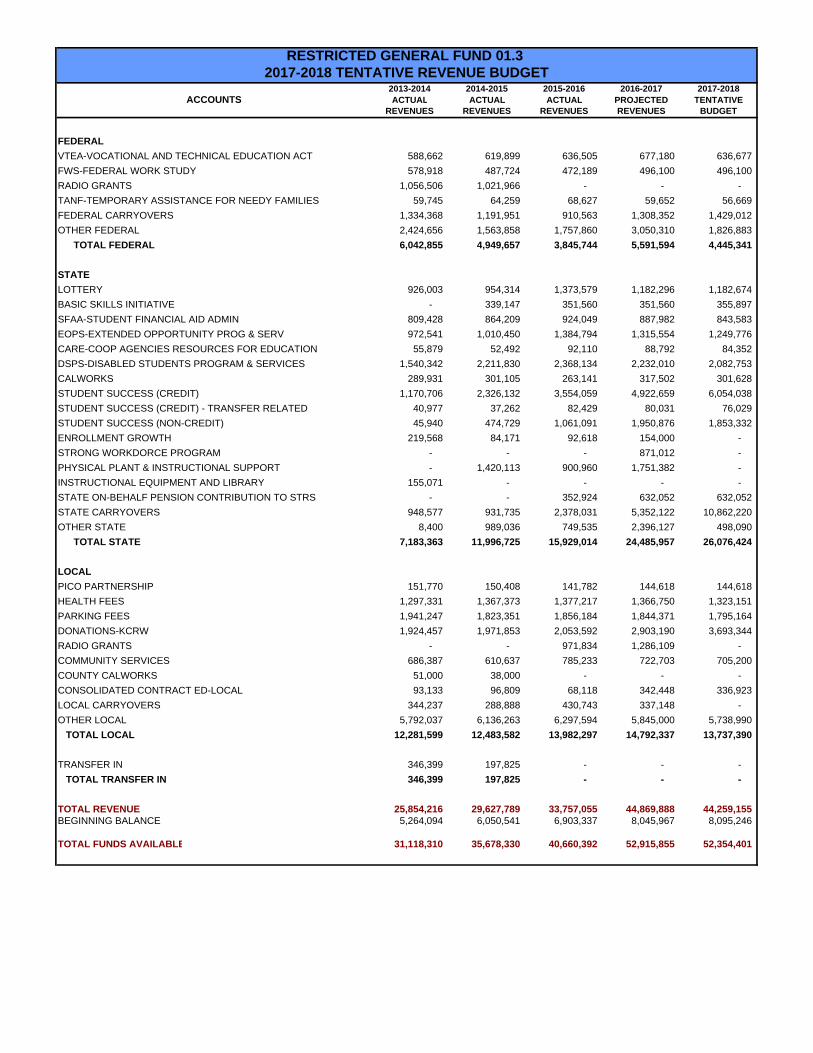
2013-2014 2014-2015 2015-2016 2016-2017 2017-2018ACCOUNTS ACTUAL ACTUAL ACTUAL PROJECTED TENTATIVE
REVENUES REVENUES REVENUES REVENUES BUDGET
FEDERAL
VTEA-VOCATIONAL AND TECHNICAL EDUCATION ACT 588,662 619,899 636,505 677,180 636,677
FWS-FEDERAL WORK STUDY 578,918 487,724 472,189 496,100 496,100
RADIO GRANTS 1,056,506 1,021,966 - - -
TANF-TEMPORARY ASSISTANCE FOR NEEDY FAMILIES 59,745 64,259 68,627 59,652 56,669
FEDERAL CARRYOVERS 1,334,368 1,191,951 910,563 1,308,352 1,429,012
OTHER FEDERAL 2,424,656 1,563,858 1,757,860 3,050,310 1,826,883
TOTAL FEDERAL 6,042,855 4,949,657 3,845,744 5,591,594 4,445,341
STATE
LOTTERY 926,003 954,314 1,373,579 1,182,296 1,182,674
BASIC SKILLS INITIATIVE - 339,147 351,560 351,560 355,897
SFAA-STUDENT FINANCIAL AID ADMIN 809,428 864,209 924,049 887,982 843,583
EOPS-EXTENDED OPPORTUNITY PROG & SERV 972,541 1,010,450 1,384,794 1,315,554 1,249,776
CARE-COOP AGENCIES RESOURCES FOR EDUCATION 55,879 52,492 92,110 88,792 84,352
DSPS-DISABLED STUDENTS PROGRAM & SERVICES 1,540,342 2,211,830 2,368,134 2,232,010 2,082,753
CALWORKS 289,931 301,105 263,141 317,502 301,628
STUDENT SUCCESS (CREDIT) 1,170,706 2,326,132 3,554,059 4,922,659 6,054,038
STUDENT SUCCESS (CREDIT) - TRANSFER RELATED 40,977 37,262 82,429 80,031 76,029
STUDENT SUCCESS (NON-CREDIT) 45,940 474,729 1,061,091 1,950,876 1,853,332
ENROLLMENT GROWTH 219,568 84,171 92,618 154,000 -
STRONG WORKDORCE PROGRAM - - - 871,012 -
PHYSICAL PLANT & INSTRUCTIONAL SUPPORT - 1,420,113 900,960 1,751,382 -
INSTRUCTIONAL EQUIPMENT AND LIBRARY 155,071 - - - -
STATE ON-BEHALF PENSION CONTRIBUTION TO STRS - - 352,924 632,052 632,052
STATE CARRYOVERS 948,577 931,735 2,378,031 5,352,122 10,862,220
OTHER STATE 8,400 989,036 749,535 2,396,127 498,090
TOTAL STATE 7,183,363 11,996,725 15,929,014 24,485,957 26,076,424
LOCAL
PICO PARTNERSHIP 151,770 150,408 141,782 144,618 144,618
HEALTH FEES 1,297,331 1,367,373 1,377,217 1,366,750 1,323,151
PARKING FEES 1,941,247 1,823,351 1,856,184 1,844,371 1,795,164
DONATIONS-KCRW 1,924,457 1,971,853 2,053,592 2,903,190 3,693,344
RADIO GRANTS - - 971,834 1,286,109 -
COMMUNITY SERVICES 686,387 610,637 785,233 722,703 705,200
COUNTY CALWORKS 51,000 38,000 - - -
CONSOLIDATED CONTRACT ED-LOCAL 93,133 96,809 68,118 342,448 336,923
LOCAL CARRYOVERS 344,237 288,888 430,743 337,148 -
OTHER LOCAL 5,792,037 6,136,263 6,297,594 5,845,000 5,738,990
TOTAL LOCAL 12,281,599 12,483,582 13,982,297 14,792,337 13,737,390
TRANSFER IN 346,399 197,825 - - -
TOTAL TRANSFER IN 346,399 197,825 - - -
TOTAL REVENUE 25,854,216 29,627,789 33,757,055 44,869,888 44,259,155 BEGINNING BALANCE 5,264,094 6,050,541 6,903,337 8,045,967 8,095,246
TOTAL FUNDS AVAILABLE 31,118,310 35,678,330 40,660,392 52,915,855 52,354,401
RESTRICTED GENERAL FUND 01.3 2017-2018 TENTATIVE REVENUE BUDGET
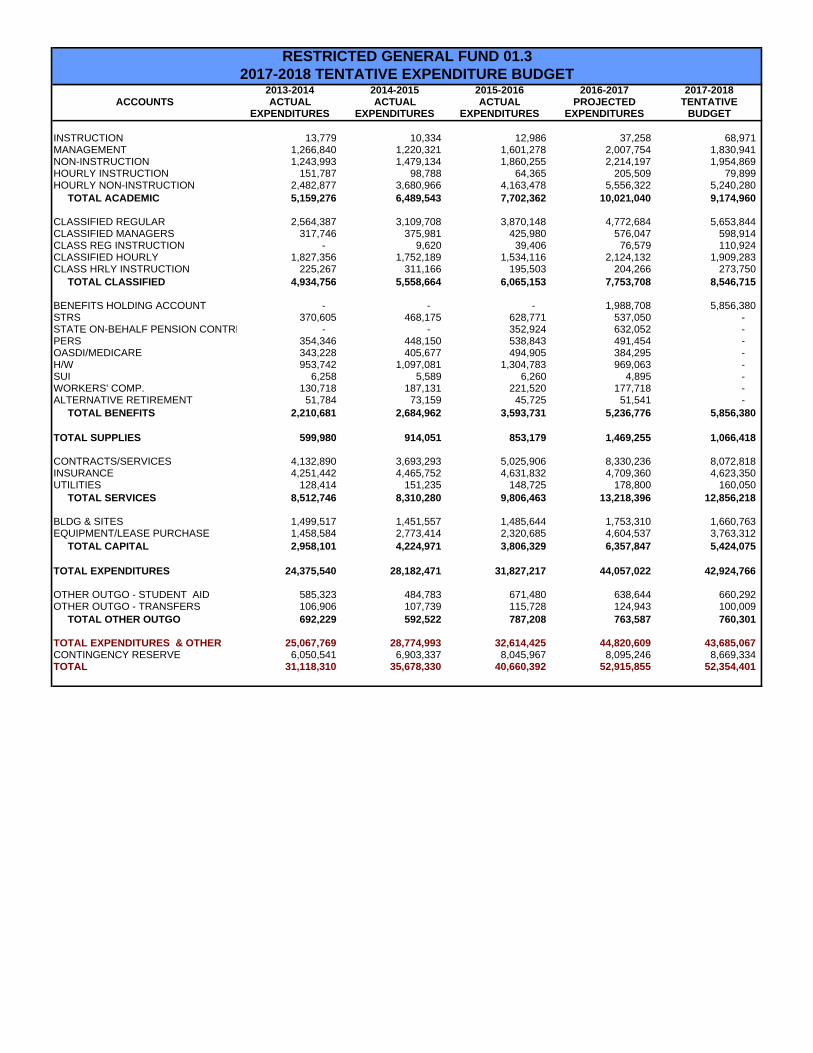
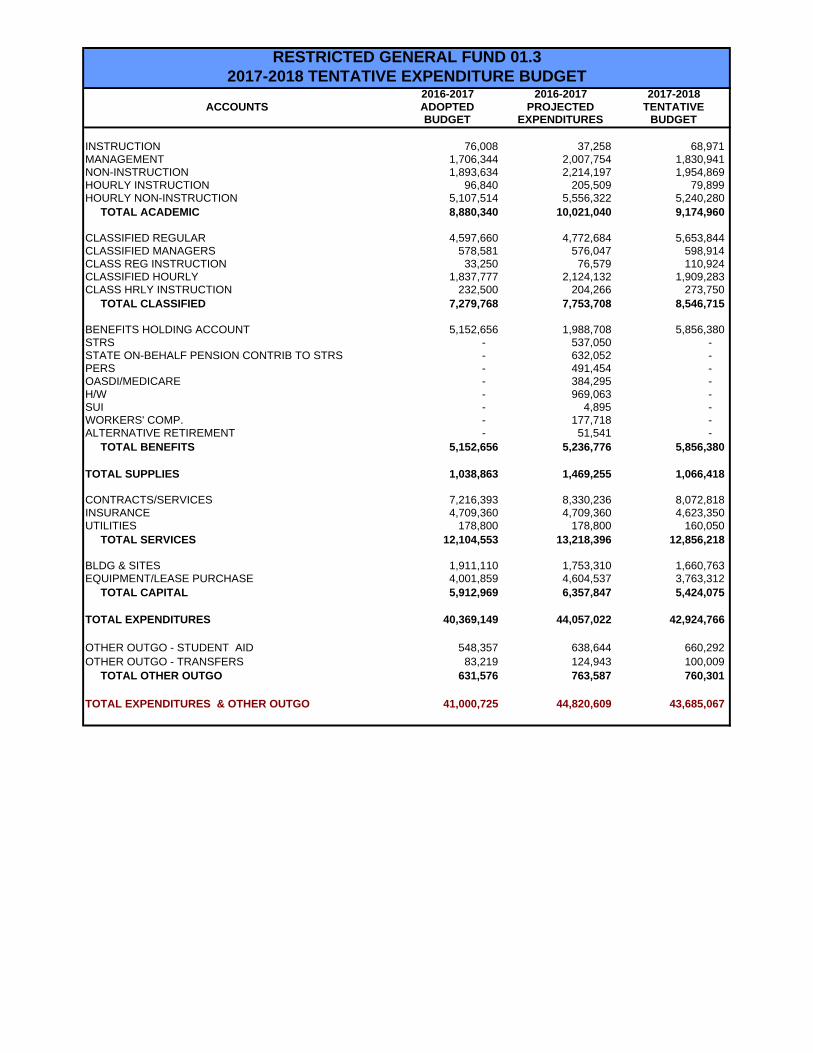
2013-2014 2014-2015 2015-2016 2016-2017 2017-2018ACCOUNTS ACTUAL ACTUAL ACTUAL PROJECTED TENTATIVE
EXPENDITURES EXPENDITURES EXPENDITURES EXPENDITURES BUDGET
INSTRUCTION 13,779 10,334 12,986 37,258 68,971 MANAGEMENT 1,266,840 1,220,321 1,601,278 2,007,754 1,830,941 NON-INSTRUCTION 1,243,993 1,479,134 1,860,255 2,214,197 1,954,869 HOURLY INSTRUCTION 151,787 98,788 64,365 205,509 79,899 HOURLY NON-INSTRUCTION 2,482,877 3,680,966 4,163,478 5,556,322 5,240,280 TOTAL ACADEMIC 5,159,276 6,489,543 7,702,362 10,021,040 9,174,960
CLASSIFIED REGULAR 2,564,387 3,109,708 3,870,148 4,772,684 5,653,844 CLASSIFIED MANAGERS 317,746 375,981 425,980 576,047 598,914 CLASS REG INSTRUCTION - 9,620 39,406 76,579 110,924 CLASSIFIED HOURLY 1,827,356 1,752,189 1,534,116 2,124,132 1,909,283 CLASS HRLY INSTRUCTION 225,267 311,166 195,503 204,266 273,750 TOTAL CLASSIFIED 4,934,756 5,558,664 6,065,153 7,753,708 8,546,715
BENEFITS HOLDING ACCOUNT - - - 1,988,708 5,856,380 STRS 370,605 468,175 628,771 537,050 - STATE ON-BEHALF PENSION CONTRI - - 352,924 632,052 - PERS 354,346 448,150 538,843 491,454 - OASDI/MEDICARE 343,228 405,677 494,905 384,295 - H/W 953,742 1,097,081 1,304,783 969,063 - SUI 6,258 5,589 6,260 4,895 - WORKERS' COMP. 130,718 187,131 221,520 177,718 - ALTERNATIVE RETIREMENT 51,784 73,159 45,725 51,541 - TOTAL BENEFITS 2,210,681 2,684,962 3,593,731 5,236,776 5,856,380
TOTAL SUPPLIES 599,980 914,051 853,179 1,469,255 1,066,418
CONTRACTS/SERVICES 4,132,890 3,693,293 5,025,906 8,330,236 8,072,818 INSURANCE 4,251,442 4,465,752 4,631,832 4,709,360 4,623,350 UTILITIES 128,414 151,235 148,725 178,800 160,050 TOTAL SERVICES 8,512,746 8,310,280 9,806,463 13,218,396 12,856,218
BLDG & SITES 1,499,517 1,451,557 1,485,644 1,753,310 1,660,763 EQUIPMENT/LEASE PURCHASE 1,458,584 2,773,414 2,320,685 4,604,537 3,763,312 TOTAL CAPITAL 2,958,101 4,224,971 3,806,329 6,357,847 5,424,075
TOTAL EXPENDITURES 24,375,540 28,182,471 31,827,217 44,057,022 42,924,766 OTHER OUTGO - STUDENT AID 585,323 484,783 671,480 638,644 660,292 OTHER OUTGO - TRANSFERS 106,906 107,739 115,728 124,943 100,009 TOTAL OTHER OUTGO 692,229 592,522 787,208 763,587 760,301
TOTAL EXPENDITURES & OTHER 25,067,769 28,774,993 32,614,425 44,820,609 43,685,067 CONTINGENCY RESERVE 6,050,541 6,903,337 8,045,967 8,095,246 8,669,334 TOTAL 31,118,310 35,678,330 40,660,392 52,915,855 52,354,401
RESTRICTED GENERAL FUND 01.32017-2018 TENTATIVE EXPENDITURE BUDGET

2016-2017 2016-2017 2017-2018ACCOUNTS ADOPTED PROJECTED TENTATIVE
BUDGET BUDGET
REVENUE
STATE
PHYSICAL PLANT & INSTRUCTIONAL SUPPORT 1,464,456 1,751,382 -
PROP 39 - CLEAN ENERGY PROJECTS 794,724 794,724 898,563
STATE CARRYOVERS 1,408,210 1,408,210 3,263,202
TOTAL STATE 3,667,390 3,954,316 4,161,765
LOCAL
PROPERTY TAX - RDA PASS THRU - 733,922 -
RENTS 260,817 260,817 260,817
INTEREST 142,219 142,219 214,992
NON-RESIDENT CAPITAL CHARGE 2,946,451 2,946,451 2,651,806
LOCAL INCOME 137,688 137,688 137,688
TOTAL LOCAL 3,487,175 4,221,097 3,265,303
TOTAL REVENUES 7,154,565 8,175,413 7,427,068
EXPENDITURES
SUPPLIES 1,500 1,500 1,500
CONTRACT SERVICES 370,000 1,870,356 1,864,172
CAPITAL OUTLAY 21,449,767 2,937,405 23,594,250
TOTAL EXPENDITURES 21,821,267 4,809,261 25,459,922
TOTAL EXPENDITURES AND TRANSFERS 21,821,267 4,809,261 25,459,922
OPERATING SURPLUS/(DEFICIT) (14,666,702) 3,366,152 (18,032,854)
BEGINNING BALANCE 14,666,702 14,666,702 18,032,854
ENDING FUND BALANCE - 18,032,854 -
2017-2018 TENTATIVE REVENUE AND EXPENDITURE BUDGETCAPITAL OUTLAY FUND 40.0

2016-2017 2016-2017 2017-2018ACCOUNTS ADOPTED PROJECTED TENTATIVE
BUDGET BUDGET
REVENUE
OTHER FINANCING SOURCES - - -
INTEREST 143,673 143,673 38,118
TOTAL REVENUE 143,673 143,673 38,118
EXPENDITURES
SUPPLIES - - -
CONTRACT SERVICES - - -
CAPITAL OUTLAY 19,007,304 14,002,611 5,042,811
TOTAL EXPENDITURES 19,007,304 14,002,611 5,042,811
OPERATING SURPLUS/(DEFICIT) (18,863,631) (13,858,938) (5,004,693)
BEGINNING BALANCE 18,863,631 18,863,631 5,004,693
ENDING FUND BALANCE - 5,004,693 -
MEASURE U FUND 42.22017-2018 TENTATIVE REVENUE AND EXPENDITURE BUDGET

2016-2017 2016-2017 2017-2018ACCOUNTS ADOPTED PROJECTED TENTATIVE
BUDGET BUDGET
REVENUE
OTHER FINANCING SOURCES 20,000,000 20,000,000 -
INTEREST 481,920 481,920 581,255
TOTAL REVENUE 20,481,920 20,481,920 581,255
EXPENDITURES
SUPPLIES - - -
CONTRACT SERVICES 208,500 223,226 176,000
CAPITAL OUTLAY 65,851,327 10,864,036 55,377,820
TOTAL EXPENDITURES 66,059,827 11,087,262 55,553,820
OPERATING SURPLUS/(DEFICIT) (45,577,907) 9,394,658 (54,972,565)
BEGINNING BALANCE 45,577,907 45,577,907 54,972,565
ENDING FUND BALANCE - 54,972,565 -
MEASURE S FUND 42.32017-2018 TENTATIVE REVENUE AND EXPENDITURE BUDGET

2016-2017 2016-2017 2017-2018ACCOUNTS ADOPTED PROJECTED TENTATIVE
BUDGET BUDGET
REVENUE
OTHER FINANCING SOURCES 50,000,000 50,000,000 -
INTEREST 693,621 693,621 389,154
TOTAL REVENUE 50,693,621 50,693,621 389,154
EXPENDITURES
SUPPLIES 4,500 32,343 37,500
CONTRACT SERVICES 138,750 172,781 195,000
CAPITAL OUTLAY 123,376,610 82,455,838 41,015,552
TOTAL EXPENDITURES 123,519,860 82,660,962 41,248,052
OPERATING SURPLUS/(DEFICIT) (72,826,239) (31,967,341) (40,858,898)
BEGINNING BALANCE 72,826,239 72,826,239 40,858,898
ENDING FUND BALANCE - 40,858,898 -
MEASURE AA FUND 42.42017-2018 TENTATIVE REVENUE AND EXPENDITURE BUDGET

2016-2017 2016-2017 2017-2018ACCOUNTS ADOPTED PROJECTED TENTATIVE
BUDGET BUDGET
BEGINNING BALANCE 31,253,945 31,253,945 24,300,255
ADJUSTMENT TO BEGINNING BALANCE - - -
ADJUSTED BEGINNING BALANCE 31,253,945 31,253,945 24,300,255
REVENUE
FEDERAL REVENUES - - -
STATE REVENUES - - -
VOTER INDEBTED TAXES 28,929,811 28,929,811 28,929,811
TOTAL REVENUE 28,929,811 28,929,811 28,929,811
TOTAL FUNDS AVAILABLE 60,183,756 60,183,756 53,230,066
EXPENDITURES
DEBT REDEMPTION 18,643,586 18,643,586 18,643,586
INTEREST CHARGES 17,239,915 17,239,915 17,239,915
TOTAL EXPENDITURES 35,883,501 35,883,501 35,883,501
ENDING FUND BALANCE 24,300,255 24,300,255 17,346,565
**The Bond Interest and Redemption Fund is controlled by the County of Los Angeles Department of Auditor-Controller.
INTEREST AND REDEMPTION FUND 48.02017-2018 TENTATIVE REVENUE AND EXPENDITURE BUDGET
2016-2017 2016-2017 2017-2018ACCOUNTS ADOPTED PROJECTED TENTATIVE
BUDGET BUDGET
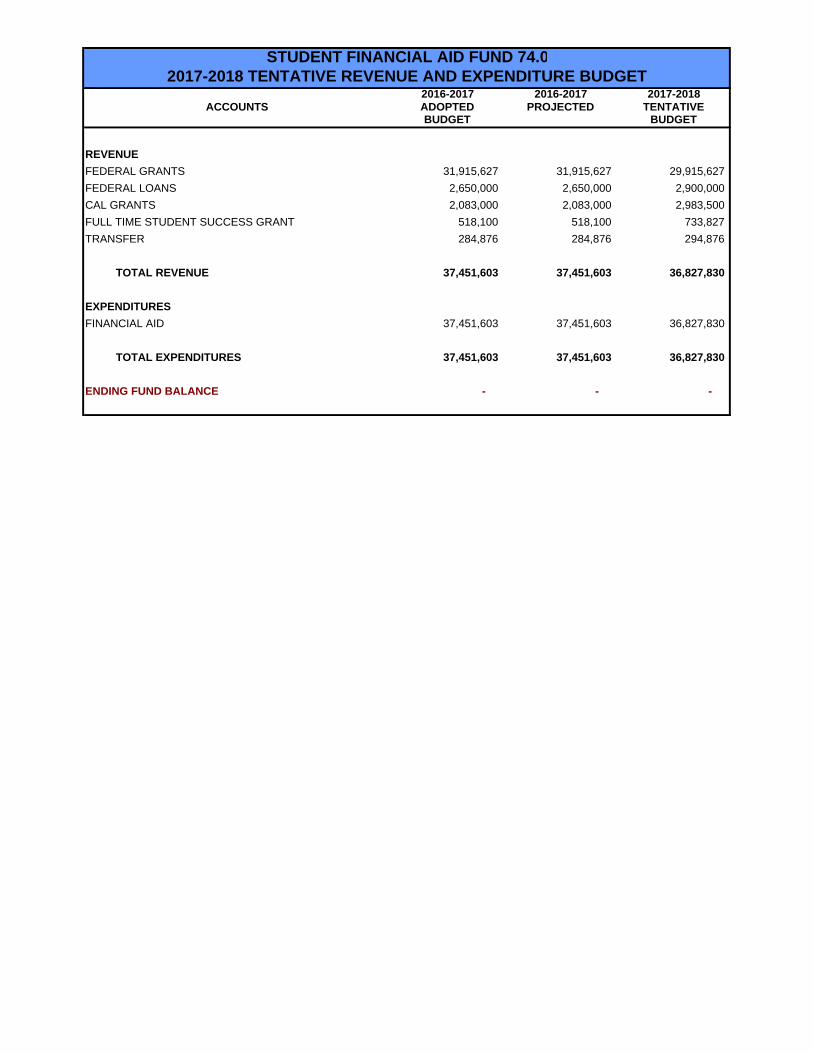
REVENUE
FEDERAL GRANTS 31,915,627 31,915,627 29,915,627
FEDERAL LOANS 2,650,000 2,650,000 2,900,000
CAL GRANTS 2,083,000 2,083,000 2,983,500
FULL TIME STUDENT SUCCESS GRANT 518,100 518,100 733,827
TRANSFER 284,876 284,876 294,876
TOTAL REVENUE 37,451,603 37,451,603 36,827,830
EXPENDITURES
FINANCIAL AID 37,451,603 37,451,603 36,827,830
TOTAL EXPENDITURES 37,451,603 37,451,603 36,827,830
ENDING FUND BALANCE - - -
STUDENT FINANCIAL AID FUND 74.02017-2018 TENTATIVE REVENUE AND EXPENDITURE BUDGET

2016-2017 2016-2017 2017-2018ACCOUNTS ADOPTED PROJECTED TENTATIVE
BUDGET BUDGET
BEGINNING BALANCE 15,286 15,286 15,386
REVENUE
TRANSFER 30,000 30,000 30,000
INTEREST 100 100 100
TOTAL REVENUE 30,100 30,100 30,100
TOTAL FUNDS AVAILABLE 45,386 45,386 45,486
EXPENDITURES
SCHOLARSHIP 30,000 30,000 30,000
TOTAL EXPENDITURES 30,000 30,000 30,000
ENDING FUND BALANCE 15,386 15,386 15,486
SCHOLARSHIP TRUST FUND 75.02017-2018 TENTATIVE REVENUE AND EXPENDITURE BUDGET

2016-2017 2016-2017 2017-2018 ADOPTED PROJECTED TENTATIVE
ACCOUNTS BUDGET BUDGET
BEGINNING BALANCE 2,595,962 2,595,962 2,668,504
ADJ. TO BEG. BALANCE - - -
ADJUSTED BEGINNING BALANCE 2,595,962 2,595,962 2,668,504
REVENUE
GROSS SALES 6,029,478 5,565,038 5,485,366
LESS: COST OF GOODS (4,217,863) (3,873,746) (3,832,214)
NET 1,811,615 1,691,292 1,653,152
VENDOR INCOME 726,000 726,000 726,000
AUXILIARY PROGRAM INCOME 523,615 497,723 395,803
NET INCOME 3,061,230 2,915,015 2,774,955
INTEREST 18,000 21,000 21,000
TOTAL REVENUE 3,079,230 2,936,015 2,795,955
TOTAL FUNDS AVAILABLE 5,675,192 5,531,977 5,464,459
EXPENDITURES
STAFFING 982,752 946,143 966,958
FRINGE BENEFITS 316,050 273,958 277,609
OPERATING 1,900,681 1,643,372 1,710,117
TOTAL EXPENDITURES 3,199,483 2,863,473 2,954,684
ENDING FUND BALANCE 2,475,709 2,668,504 2,509,775
AUXILIARY FUND 2017-2018 TENTAIVE REVENUE AND EXPENDITURE BUDGET