santa teresa high school - esuhsd - parents/instruction/testing... · santa teresa high school is...
TRANSCRIPT

2017-18 School Accountability Report Card for Santa Teresa High School Page 1 of 10
Santa Teresa High School
6150 Snell Rd. • San Jose, CA 95123 • 408.347.6200 • Grades Greg Louie, Principal [email protected]
sths.schoolloop.com
2017-18 School Accountability Report Card
Published During the 2018-19 School Year
----
----
East Side Union High School District
830 N. Capitol Avenue San Jose, CA 95133
(408) 347-5000 www.esuhsd.org
District Governing Board
Frank Biehl
J. Manuel Herrera
Van Thi Le
Pattie Cortese
Lan Nguyen
District Administration
Chris D. Funk Superintendent
Glenn Vander Zee Assistant Superintendent
Educational Services
Chris Jew Associate Superintendent
Business Services
Dr. John Rubio Associate Superintendent
Human Resources
---- ----
School Description Santa Teresa High School focuses on the "Saints Way"--Social Emotional Learning, Content Area Mastery, Performance, and Assessment, and Educational Empowerment. It is the mission of Santa Teresa High School to provide a safe and caring learning environment where students achieve the academic, aesthetic, personal, and social development required to continue learning and pursuing post secondary education, to compete in a changing job market, and to participate in a multicultural, democratic society. Santa Teresa High School is home to more than 2150 amazing students who mature into fantastic young adults due to academic growth and personal achievement. With the assistance of nearly 150 staff members, the students at Santa Teresa High School have a variety of academic and extra-curricular opportunities that make an excellent high school experience. Santa Teresa High School offers 24 Advanced Placement courses (American Government, Art History, Biology, Calculus AB, Calculus BC, Chemistry, Computer Science A, English Language, English Literature, Environmental Science, French Language, Macro Economics, Physics 1 and 2, Principles of Computer Science, Psychology, Spanish Language, Spanish Literature, Statistics, Studio Art: 2D, Studio Art: Drawing and Painting, US History, and World History), a variety of World Languages (American Sign Language, French, Spanish, and Vietnamese), a variety of Performing Arts (Concert Band, Drama, Film Studies, Guitar, Jazz Ensemble, Marching Band, Musical Theater, Technical Theater, and Wind Ensemble), a variety of Visual Arts (Art, Crafts, Digital Photography, Drawing and Painting, and Multimedia) and two Career Technical Education pathways: Computer Science and Multi-Media. In addition, Santa Teresa High School boasts an award winning Leadership program, nearly three dozen different student clubs, an award winning International Relations Club, an award winning Marching Band, an award winning Robotics program, and an award winning Spirit program. For our students who need a little extra help, Santa Teresa High School offers tutorial three days a week during the school day; co-taught Biology, co-taught English 1, co-taught Physics, co-taught American Government, and co-taught Economics; a comprehensive tutoring map; a plethora of tutoring programs available throughout the week, and our Student Family Center. Athletically, Santa Teresa High School is one of the few schools with nearly all of the teams competing in the highest division and routinely competing in the various CCS tournaments. Santa Teresa High School is a tremendously safe campus due to the vigilance of all students and staff and the support and involvement of our families. Drugs and weapons are not a part of the ST culture. Also, Santa Teresa High School is blessed with tremendous parent and guardian support. Santa Teresa High School would not enjoy success without the continued support of the Santa Teresa Organization of Parents and Staff (STOPS), the Santa Teresa Athletic Booster Club (STABC), the Santa Teresa Music and Arts Association (STMAA), the African American Student Advocates (AASA), and the Latino Parent Coalition (LPC). Welcome to the home of the Saints!
2017-18 School Accountability Report Card for Santa Teresa High School Page 2 of 10
About the SARC By February 1 of each year, every school in California is required by state law to publish a School Accountability Report Card (SARC). The SARC contains information about the condition and performance of each California public school. Under the Local Control Funding Formula (LCFF) all local educational agencies (LEAs) are required to prepare a Local Control and Accountability Plan (LCAP), which describes how they intend to meet annual school-specific goals for all pupils, with specific activities to address state and local priorities. Additionally, data reported in an LCAP is to be consistent with data reported in the SARC. • For more information about SARC requirements, see the California
Department of Education (CDE) SARC web page at https://www.cde.ca.gov/ta/ac/sa/.
• For more information about the LCFF or LCAP, see the CDE LCFF web page at https://www.cde.ca.gov/fg/aa/lc/.
• For additional information about the school, parents/guardians and community members should contact the school principal or the district office.
2017-18 Student Enrollment by Grade Level
Grade Level Number of Students
Grade 9 565
Grade 10 566
Grade 11 528
Grade 12 561
Total Enrollment 2,220
2017-18 Student Enrollment by Group
Group Percent of Total Enrollment
Black or African American 3.4
American Indian or Alaska Native 0.2
Asian 22.3
Filipino 4.0
Hispanic or Latino 39.9
Native Hawaiian or Pacific Islander 0.2
White 24.7
Socioeconomically Disadvantaged 25.6
English Learners 6.6
Students with Disabilities 10.4
Foster Youth 0.2
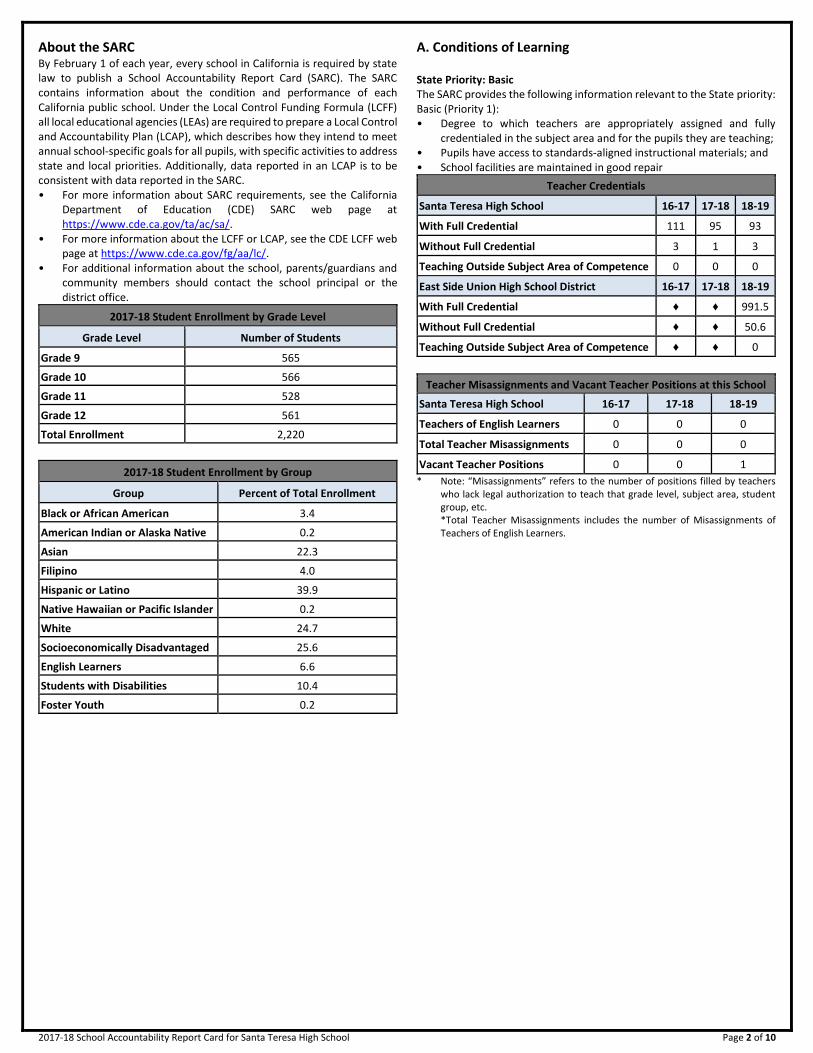
A. Conditions of Learning State Priority: Basic The SARC provides the following information relevant to the State priority: Basic (Priority 1): • Degree to which teachers are appropriately assigned and fully
credentialed in the subject area and for the pupils they are teaching; • Pupils have access to standards-aligned instructional materials; and • School facilities are maintained in good repair
Teacher Credentials
Santa Teresa High School 16-17 17-18 18-19
With Full Credential 111 95 93
Without Full Credential 3 1 3
Teaching Outside Subject Area of Competence 0 0 0
East Side Union High School District 16-17 17-18 18-19
With Full Credential ♦ ♦ 991.5
Without Full Credential ♦ ♦ 50.6
Teaching Outside Subject Area of Competence ♦ ♦ 0
Teacher Misassignments and Vacant Teacher Positions at this School
Santa Teresa High School 16-17 17-18 18-19
Teachers of English Learners 0 0 0
Total Teacher Misassignments 0 0 0
Vacant Teacher Positions 0 0 1
* Note: “Misassignments” refers to the number of positions filled by teachers who lack legal authorization to teach that grade level, subject area, student group, etc. *Total Teacher Misassignments includes the number of Misassignments of Teachers of English Learners.

2017-18 School Accountability Report Card for Santa Teresa High School Page 3 of 10
Quality, Currency, Availability of Textbooks and Instructional Materials (School Year 2018-19)
Textbooks and Instructional Materials
Year and month in which data were collected: October 2018
Core Curriculum Area Textbooks and Instructional Materials/Year of Adoption
Reading/Language Arts English 1 – “The Language of Literature" Grade 9 McDougal Littell 2002 English 2 – “The Language of Literature” Grade 10 McDougal Littell 2002 English 3 – MyPerspectives: American Literature//Pearson English 4--"The Language of Literature" Grade 12 Mcdougal Littell 2002 ERWC -- Expository Reading and Writing Course Student Reader AP Composition and Language-- The Norton Reader AP Composition and Literature--The Intro to Literature
The textbooks listed are from most recent adoption: Yes
Percent of students lacking their own assigned textbook: 0%
Mathematics CCSS Math 1 – "Big Ideas Integrated Mathematics I," Big Ideas Learning, LLC 2016 CCSS Math 2 – "Big Ideas Integrated Mathematics II," Big Ideas Learning, LLC 2016 CCSS Math 3 – "Big Ideas Integrated Mathematics III," Big Ideas Learning, LLC 2016 Math Analysis – “Precalculus With Limits A Graphing Approach” Brooks/Cole Cengage Learning 2012 AP Calculus AB - Calculus w/Analytic Geometry, 9th ed: Houghton Mifflin Harcourt; 2010 AP Calculus BC - Calculus w/Analytic Geometry, 9th ed: Houghton Mifflin Harcourt; 2010 AP Statistics - The Practice of Statistics, 4th ed: Freeman; 2010 Exploring Computer Science - ECS: Exploring Computer Science; Joanna Goode, Gail Chapman 2016 AP Computer Science A - Online materials AP Computer Science Principles - Online materils Mathematical Reasoning with Connections - MRWC materials
The textbooks listed are from most recent adoption: Yes
Percent of students lacking their own assigned textbook: 0%
Science A Hands on Introduction to Forensic Science 2014 Biology – NGSS Biology - The Living Earth -- STEMscopes, eTextbook and Web-based resources Chemistry – “Chemistry: Connections to our Changing World” Prentice-Hall/2000, 2002 Physics – “Principles and Problems" Glencoe 2002 AP Biology- AP Biology In Focus- Prentice Hall 2004 AP Chemistry- Chemistry The Central Science- Prentice-Hall 1991 AP Physics 1 and 2- Physics AP- Wiley 2012 AP Environmental Science- Living In The Environment- Cengage 2015
The textbooks listed are from most recent adoption: Yes
Percent of students lacking their own assigned textbook: 0%
History-Social Science World History – “Modern World History” McDougal-Littell 2003 US History – “The American Vision” Glencoe/McGraw Hill 2006 American Government – "Government Alive! Power, Politics and You" TCI 2014 Economics – “Econ Alive! The Power to Choose" TCI 2015 AP World History - "The Earth and Its Peoples AP Edition" Cengage Learning 2018 AP US History - "America's History for the AP Course" Bedford 2014 AP Government - "Government in America" Pearson Learning 2014 AP Macro/Micro Economics - "Economics (AP)" McGraw Hill 2014 AP Human Geography - "The Cultural Landscape: An Introduction" Prentice Hall 2014 AP Psychology - "Psychology for AP" Worth 2015 World Geography - "Geography Alive!" TCI 2011
The textbooks listed are from most recent adoption: Yes
Percent of students lacking their own assigned textbook: 0%
Note: Cells with N/A values do not require data.

2017-18 School Accountability Report Card for Santa Teresa High School Page 4 of 10
School Facility Conditions and Planned Improvements (Most Recent Year) Overview The District makes every effort to ensure that all schools are clean, safe, and functional. To assist in this effort, the district uses a facility survey instrument developed by the State of California Office of Public School Construction. The results of this survey are available at the school office and at the district office. Santa Teresa High School was opened in 1974. Although the main school campus was constructed in 1967, the school facilities are maintained in a good state of repair. The facilities are clean, safe, and adequate for providing a quality education for all students. All classrooms provide adequate space for teaching and learning. Each building also provides an office for teachers to use during their prep periods. Exterior campus grounds feature large expanses of lawn, dotted with trees and other shrubbery. Athletic fields are adequate for physical education classes. The football field, track and stadium were renovated to a waterless turf field, rubberized track and new aluminum stands with a press box and ticket booth. At night the campus is well lit with under eave and pole lighting. All student and almost all staff restrooms are newly renovated. The floors and walls of the student restrooms are tiled, as are the floors and most of the walls in the staff restrooms. Santa Teresa High School is extremely suitable as a learning environment. Lighting in all areas is adequate for instruction, and there is a suitable HVAC system in place. The fire alarm system has been refurbished with a new control panel. The theater was completely renovated and Santa Teresa has a very good technology infrastructure. Thanks to our community for passing the Measure- E Bond, we built a new multi-purpose building and modernized the 200 building and both of the main student restrooms. The new multi-purpose building was completed in 2010 and it has two regular classrooms with 21st century teaching units and SMART boards. This building has a large 5000 square foot room that will be used for testing, presentations, and large group meetings. The multi-purpose building also includes additional restrooms for students and staff. The 200 building was renovated, transforming the original classrooms into 21st century teaching units, complete with greater natural light, SMART boards, tack-able wall space, and shared iPad carts. The Counseling offices were relocated to a wing of the original campus library and new offices were built. The bookroom, originally in the 100 building was moved to the 200 building and designed to eventually accommodate student tablets and e-readers rather than bulky textbooks. August 2015, stadium lights were installed for Friday Night football games, marching band practices, and men and women soccer games. A concession stand and restroom facility was also installed at the stadium in the Summer/Fall of 2017. Hardscape and landscape projects were completed during the 2017-18 school year, converting the wasted space at the entrance of the Santa Teresa Blvd parking lot to a welcoming, lit plaza; replacing the bricks around the 500 buildings with drought tolerant plants; asphalting the space to the north of the 600 building; installing drought tolerant plants around the 600 building; and reseeding the grass area in the center of the campus. Cleaning Process and Schedule The district’s Board of Trustees has adopted cleaning standards for all schools in the district. The Leadership Team works daily with the custodial staff to develop cleaning schedules to ensure a clean and safe school. Deferred Maintenance Budget The district participates in the State School Deferred Maintenance Program, which provides state matching funds on a dollar-for-dollar basis, to assist school districts with expenditures for major repair or replacement of existing school building components. Typically, this includes roofing, plumbing, heating, air conditioning, electrical systems, interior or exterior painting, and floors systems. Maintenance Projects Local Measure A, Measure G, and Measure E bond funds and state matching funds have been used to renovate existing facilities. Modernization Projects During the 2017-18 school year, the School Site Council agreed to allocate Measure Z funds to build additional science classrooms, a MakerSpace for Robotics, Computer Science, and Visual Arts classes and replace the grass soccer field with an all-weather turf field for PE classes, athletic teams, and marching band.
School Facility Good Repair Status (Most Recent Year) Year and month in which data were collected: 6/22/2018
System Inspected Repair Status Repair Needed and
Action Taken or Planned
Systems: Gas Leaks, Mechanical/HVAC, Sewer
XGood
Interior: Interior Surfaces
XGood
Building P3 & P4 interior walls need paint - workorder submitted P1 - P4 - need carpet replacement - workorder submitted Building 600 Theater - walls need paint - workorder submitted
Cleanliness: Overall Cleanliness, Pest/ Vermin Infestation
XGood
Soccer Complex - infestation squirrels - workorder submitted Softball North / South - infestation squirrels - workorder submitted
Electrical: Electrical
XGood
Tennis Courts - electrical outlets not functioning - workorder submitted

2017-18 School Accountability Report Card for Santa Teresa High School Page 5 of 10
School Facility Good Repair Status (Most Recent Year) Year and month in which data were collected: 6/22/2018
System Inspected Repair Status Repair Needed and
Action Taken or Planned
Restrooms/Fountains: Restrooms, Sinks/ Fountains
XFair
Building 400 Science East - restrooms continue to back up during rain - workorder submitted Building 800 - restroom backs up - workorder submitted
Safety: Fire Safety, Hazardous Materials
XGood
Structural: Structural Damage, Roofs
XGood
Building P1 & P2 -Outside structural walls damaged - workorder submitted Building 400 Science East - roof leaks - workorder submitted
External: Playground/School Grounds, Windows/ Doors/Gates/Fences
XGood
Tennis Courts - need resurfaced - under contract for April 2019 Soccer Complex - holes on field due to pest infestation - workorder submitted North & South Softball - erosion from pest infestation - workorder submitted
Overall Rating XGood
----------
B. Pupil Outcomes
State Priority: Pupil Achievement The SARC provides the following information relevant to the State priority: Pupil Achievement (Priority 4): • Statewide assessments (i.e., California Assessment of Student
Performance and Progress [CAASPP] System, which includes the Smarter Balanced Summative Assessments for students in the general education population and the California Alternate Assessments [CAAs] for English language arts/literacy [ELA] and mathematics given in grades three through eight and grade eleven. Only eligible students may participate in the administration of the CAAs. CAAs items are aligned with alternate achievement standards, which are linked with the Common Core State Standards [CCSS] for students with the most significant cognitive disabilities); and
• The percentage of students who have successfully completed courses
that satisfy the requirements for entrance to the University of California and the California State University, or career technical education sequences or programs of study
2017-18 CAASPP Results for All Students
Subject
Percent of Students Meeting or Exceeding the State Standards (grades 3-8 and 11)
School District State
16-17 17-18 16-17 17-18 16-17 17-18
ELA 77.0 73.0 63.0 59.0 48.0 50.0
Math 50.0 45.0 39.0 38.0 37.0 38.0
Note: Percentages are not calculated when the number of students tested is ten or less, either because the number of students in this category is too small for statistical accuracy or to protect student privacy. Note: ELA and mathematics test results include the Smarter Balanced Summative Assessment and the CAA. The “Percent Met or Exceeded” is calculated by taking the total number of students who met or exceeded the standard on the Smarter
Balanced Summative Assessment plus the total number of students who met the standard (i.e., achieved Level 3–Alternate) on the CAAs divided by the total number of students who participated in both assessments.
CAASPP Test Results in Science for All Students
Subject
Percent of Students Scoring at Proficient or Advanced (meeting or exceeding the state standards)
School District State
16-17 17-18 16-17 17-18 16-17 17-18
Science N/A N/A N/A N/A N/A N/A
Note: Cells with N/A values do not require data. Note: The 2016–17 and 2017–18 data are not available. The CDE is developing a new science assessment based on the Next Generation Science Standards for California Public Schools (CA NGSS). The CAST was pilot-tested in spring 2017 and field-tested in spring 2018. The CAST will be administered operationally during the 2018–19 school year. The CAA for Science was pilot-tested for two years (i.e., 2016–17 and 2017–18) and the CAA for Science will be field-tested in 2018–19. Note: Science test results include the CAST and the CAA for Science. The “Percent Met or Exceeded” is calculated by taking the total number of students who met or exceeded the standard on the CAST plus the total number of students who met the standard (i.e., achieved Level 3–Alternate) on the CAA for Science divided by the total number of students who participated on both assessments.
State Priority: Other Pupil Outcomes The SARC provides the following information relevant to the State priority: Other Pupil Outcomes (Priority 8): • Pupil outcomes in the subject area of physical education
Grade Level
2017-18 Percent of Students Meeting Fitness Standards
4 of 6 5 of 6 6 of 6
---9--- 9.8 36.3 42.3
* Percentages are not calculated when the number of students tested is ten or less, either because the number of students in this category is too small for statistical accuracy or to protect student privacy.

2017-18 School Accountability Report Card for Santa Teresa High School Page 6 of 10
School Year 2017-18 CAASPP Assessment Results - English Language Arts (ELA) Disaggregated by Student Groups, Grades Three through Eight and Eleven
Student Group Total
Enrollment Number Tested
Percent Tested
Percent Met or Exceeded
All Students 512 497 97.07 72.84
Male 258 250 96.90 69.60
Female 254 247 97.24 76.11
Black or African American 16 16 100.00 56.25
American Indian or Alaska Native -- -- -- --
Asian 99 99 100.00 85.86
Filipino 22 22 100.00 81.82
Hispanic or Latino 206 197 95.63 58.88
White 150 144 96.00 83.33
Two or More Races 16 16 100.00 75.00
Socioeconomically Disadvantaged 98 95 96.94 62.11
English Learners 48 48 100.00 29.17
Students with Disabilities 52 52 100.00 15.38
Students Receiving Migrant Education Services -- -- -- --
Note: ELA test results include the Smarter Balanced Summative Assessment and the CAA. The “Percent Met or Exceeded” is calculated by taking the total number of students who met or exceeded the standard on the Smarter Balanced Summative Assessment plus the total number of students who met the standard (i.e., achieved Level 3–Alternate) on the CAAs divided by the total number of students who participated in both assessments. Note: Double dashes (--) appear in the table when the number of students is ten or less, either because the number of students in this category is too small for statistical accuracy or to protect student privacy. Note: The number of students tested includes all students who participated in the test whether they received a score or not; however, the number of students tested is not the number that was used to calculate the achievement level percentages. The achievement level percentages are calculated using only students who received scores.

2017-18 School Accountability Report Card for Santa Teresa High School Page 7 of 10
School Year 2017-18 CAASPP Assessment Results - Mathematics Disaggregated by Student Groups, Grades Three through Eight and Eleven
Student Group Total
Enrollment Number Tested
Percent Tested
Percent Met or Exceeded
All Students 519 494 95.18 44.74
Male 263 248 94.3 45.97
Female 256 246 96.09 43.5
Black or African American 16 16 100 25
American Indian or Alaska Native -- -- -- --
Asian 101 96 95.05 75
Filipino 23 21 91.3 47.62
Hispanic or Latino 209 198 94.74 25.25
White 151 144 95.36 54.17
Two or More Races 16 16 100 37.5
Socioeconomically Disadvantaged 101 94 93.07 30.85
English Learners 51 46 90.2 17.39
Students with Disabilities 59 50 84.75 2
Students Receiving Migrant Education Services -- -- -- --
Note: Mathematics test results include the Smarter Balanced Summative Assessment and the CAA. The “Percent Met or Exceeded” is calculated by taking the total number of students who met or exceeded the standard on the Smarter Balanced Summative Assessment plus the total number of students who met the standard (i.e., achieved Level 3–Alternate) on the CAAs divided by the total number of students who participated in both assessments. Note: Double dashes (--) appear in the table when the number of students is ten or less, either because the number of students in this category is too small for statistical accuracy or to protect student privacy. Note: The number of students tested includes all students who participated in the test whether they received a score or not; however, the number of students tested is not the number that was used to calculate the achievement level percentages. The achievement level percentages are calculated using only students who received scores.
C. Engagement
State Priority: Parental Involvement The SARC provides the following information relevant to the State priority: Parental Involvement (Priority 3): • Efforts the school district makes to seek parent input in making decisions for the school district and each school site
Opportunities for Parental Involvement (School Year 2018-19) Parent Community Involvement Specialist: Elvin Jackson (408) 347-6233 To ensure ongoing communication, Santa Teresa utilizes Schoolloop to provide parents with immediate access to their students’ grades, attendance, school programs, and activities as well as to facilitate parent communication with staff members. Parent and community participation is essential to student achievement and Santa Teresa High School provides a number of parent organizations. The school has an active School Site Council, a music and arts booster club (Santa Teresa Music and Arts Association), an athletics booster club (Santa Teresa Athletic Boosters Club), a parent/teacher association (Santa Teresa Organization of Parents and Staff (STOPS), and parent advocacy groups, (Latino Parent Coalition and African American Student Advocates). Santa Teresa High School parents, guardians, and community members selflessly devote their time to assist with the first day of school, test preparation, school activities, extra curricular programs, and teams and clubs. To support parents, Santa Teresa hosts a variety of parent information nights, including, but not limited to Financial Aid Night, Freshman Parent Orientation, grade level workshops, college information, Advanced Placement information nights, and at-risk forums.
State Priority: School Climate The SARC provides the following information relevant to the State priority: School Climate (Priority 6): • Pupil suspension rates; • Pupil expulsion rates; and • Other local measures on the sense of safety.

2017-18 School Accountability Report Card for Santa Teresa High School Page 8 of 10
School Safety Plan Santa Teresa has a very detailed, comprehensive safety plan that outlines protocols, systems, and procedures in the event of any/all emergencies. This plan also contains the yearly safety goals as determined by the students, staff, and parents. The Safety Plan is developed by the Santa Teresa Safety Committee and reviewed by the School Site Council and District Safety Committee before it is presented to the East Side Union High School District Board of Trustees for adoption. The Safety Plan and drill procedures are reviewed during the year with all staff. Safety alerts are shared with all staff as needed throughout the school year. In addition, all required drills are calendared and completed and the results are communicated to all staff. Santa Teresa’s campus is supervised by administration, advisors, monitor, one on-campus San Jose Police Officer, and certificated staff during school day hours. The Santa Teresa High School Site Safety Plan is in compliance with district polices that govern all school sites in developing, implementing a comprehensive, enforceable, and continuous living document that deals with Behavior policy, Rules and regulations, Dress code, Tardy, Attendance, Referral process, Multi-service team, Safety team and Protocols for safety/emergency drills. We have partnerships with community agencies, City of San Jose, San Jose Police Department, and other Safety and Mental Health agencies and groups that offer support services.
Suspensions and Expulsions
School 2015-16 2016-17 2017-18
Suspensions Rate 2.2 3.9 5.4
Expulsions Rate 0.1 0.0 0.1
District 2015-16 2016-17 2017-18
Suspensions Rate 3.8 4.0 3.7
Expulsions Rate 0.1 0.1 0.1
State 2015-16 2016-17 2017-18
Suspensions Rate 3.7 3.7 3.5
Expulsions Rate 0.1 0.1 0.1
D. Other SARC Information
The information in this section is required to be in the SARC but is not included in the state priorities for LCFF.
Academic Counselors and Other Support Staff at this School
Number of Full-Time Equivalent (FTE)
Academic Counselor------- 3.6
Counselor (Social/Behavioral or Career Development) 0
Library Media Teacher (Librarian) .5
Library Media Services Staff (Paraprofessional) 0
Psychologist------- 0
Social Worker------- 1
Nurse------- 0
Speech/Language/Hearing Specialist 0
Resource Specialist (non-teaching)------- 0
Other------- 0
Average Number of Students per Staff Member
Academic Counselor------- 617 * One Full Time Equivalent (FTE) equals one staff member working full time; one FTE could also represent two staff members who each work 50 percent of full time.

2017-18 School Accountability Report Card for Santa Teresa High School Page 9 of 10
Average Class Size and Class Size Distribution (Secondary)
Average Class Size Number of Classrooms*
1-22 23-32 33+
Subject 2015-16 2016-17 2017-18 2015-16 2016-17 2017-18 2015-16 2016-17 2017-18 2015-16 2016-17 2017-18
English------- ----------
27.0 27.0 28.0 15 14 10 72 71 72 3 2 5
Mathematics ----------
27.0 23.0 27.0 11 13 15 15 16 53 15 5
Science------- ----------
29.0 28.0 29.0 9 9 10 28 65 48 34 1 14
Social Science ----------
30.0 29.0 29.0 8 8 7 28 51 52 32 9 11
* Number of classes indicates how many classrooms fall into each size category (a range of total students per classroom). At the secondary school level, this information is reported by subject area rather than grade level.
Professional Development provided for Teachers Professional development opportunities for staff members are multifaceted and clearly and consistently linked to the state’s standards, district goals, the school’s core values, and occur during the school year and summer break. Our school has a coherent, comprehensive plan for professional development that is data driven and directly linked to teaching and learning. Not only do teachers and staff participate in staff development opportunities at the school, but they also take advantage of multiple professional development opportunities at the District and throughout the country. In addition, many teachers take professional growth classes at local colleges and universities and attend workshops offered by the Santa Clara County Office of Education. BTSA and new teacher orientation meetings support new instructors. The school has created and successfully implemented a collaboration model for professional development. School wide and departmental meetings are held regularly so that teachers can continue to work on professional development to support school-wide efforts to align curriculum with rigorous state content standards as well as to provide instructional support for literacy and differentiation to assure the achievement of all students. To ensure a cycle of continuous improvement, professional development is personalized to address the needs of all subject-area teachers, staff, and administrators. Not only do professional development activities for teachers reflect a best practices approach, but they also align with the California Standards for the Teaching Profession. Teachers and staff participate in professional development that is aligned with their individual fields and district plans at multiple levels. At the school level, professional development is structured to have a generalized focus (e.g., higher order thinking, teaching, and learning, Common Core State Standards, etc.), and specific facets of the professional development program (e.g., specific instructional strategies) are personalized to address the specific content area dynamics and needs. The district also offers a multitude of professional development opportunities to broaden teachers’ knowledge, enhance their classroom management skills, and augment their repertoire of best practices instructional strategies.
FY 2016-17 Teacher and Administrative Salaries
Category District Amount
State Average for Districts In Same
Category
Beginning Teacher Salary $55,349 $50,747
Mid-Range Teacher Salary $90,881 $86,127
Highest Teacher Salary $112,154 $106,915
Average Principal Salary (ES) $0
Average Principal Salary (MS) $0 $136,636
Average Principal Salary (HS) $146,943 $150,286
Superintendent Salary $286,275 $238,058
Percent of District Budget
Teacher Salaries 34.0 34.0
Administrative Salaries 4.0 5.0 * For detailed information on salaries, see the CDE Certificated Salaries &
Benefits webpage at www.cde.ca.gov/ds/fd/cs/.
FY 2016-17 Expenditures Per Pupil and School Site Teacher Salaries
Level Expenditures Per Pupil Average
Teacher Salary Total Restricted Unrestricted
School Site-------
$8,266 $1,441 $6,825 $89,639
District-------
♦ ♦ $7,376 $89,332
State------- ♦ ♦ $7,125 $85,815
Percent Difference: School Site/District -7.8 2.6
Percent Difference: School Site/ State 3.7 8.0
* Cells with ♦ do not require data. The California Department of Education issued guidance to LEAs on August 1, 2018, regarding how to calculate school-level per-pupil expenditures that will be reported on 2018-19 report cards.
Types of Services Funded
Santa Teresa High School receives a small portion of LCAP funds, which helps to fund 1.4 FTE Counseling, 1.0 Social Worker, 1.0 Parent Community Information Specialist, and a 0.5 Librarian. In addition, $14,000 was allocated for summer training regarding “Practical Teaching Strategies for Block Schedule Classes” (~$7000); overtime for Classroom teachers for training (~$250/teacher; up to $7000); ITL facilitated best practices based on training, and reproduction costs and $10,000 was allocated for after-school tutoring and library supervision.

2017-18 School Accountability Report Card for Santa Teresa High School Page 10 of 10
Dropout Rate and Graduation Rate (Four-Year Cohort Rate)
Santa Teresa High School 2014-15 2015-16 2016-17
Dropout Rate 6.0 3.6 3.8
Graduation Rate 89.7 92.6 92.0
East Side Union High School District 2014-15 2015-16 2016-17
Dropout Rate 11.7 10.0 20.5
Graduation Rate 83.0 85.0 71.5
California 2014-15 2015-16 2016-17
Dropout Rate 10.7 9.7 9.1
Graduation Rate 82.3 83.8 82.7
Career Technical Education Participation
Measure CTE Program Participation
Number of pupils participating in CTE 384
% of pupils completing a CTE program and earning a high school diploma
100%
% of CTE courses sequenced or articulated between the school and institutions of postsecondary education
100%
Courses for University of California (UC) and/or California State University (CSU) Admission
UC/CSU Course Measure Percent
2017-18 Students Enrolled in Courses Required for UC/CSU Admission
98.4
2016-17 Graduates Who Completed All Courses Required for UC/CSU Admission
53.4
* Where there are student course enrollments.
2017-18 Advanced Placement Courses
Subject Number of AP Courses
Offered*
Percent of Students In AP Courses
Computer Science 0 ♦
English------- 5 ♦
Fine and Performing Arts 3 ♦
Foreign Language 4 ♦
Mathematics 7 ♦
Science------- 11 ♦
Social Science 9 ♦
All courses 39 26.5
Completion of High School Graduation Requirements
Group Graduating Class of 2017
School District State
All Students 97.1 84.1 88.7
Black or African American 95.8 75.3 82.2
American Indian or Alaska Native 0.0 0.0 82.8
Asian 100.0 95.0 94.9
Filipino 95.5 92.2 93.5
Hispanic or Latino 92.6 76.3 86.5
Native Hawaiian/Pacific Islander 50.0 67.7 88.6
White 99.3 92.7 92.1
Two or More Races 100.0 89.2 91.2
Socioeconomically Disadvantaged 100.0 83.8 88.6
English Learners 74.1 62.3 56.7
Students with Disabilities 64.8 62.0 67.1
Foster Youth 0.0 59.3 74.1
Career Technical Education Programs Santa Teresa High School offers the following Career Technical Education Programs. These programs integrate core academic knowledge with technical and occupational knowledge to provide students with a pathway to postsecondary education and careers. CTE Computer Science Pathway: Four year Oracle Certified Computer Science program CTE Multi-media Pathway: Four year Multi-media program that also serves as a magnet program. Silicon Valley CTE (SVCTE): Variety of afternoon courses that prepare high school students for future careers and workforce. Work Experience
DataQuest DataQuest is an online data tool located on the CDE DataQuest web page at https://dq.cde.ca.gov/dataquest/ that contains additional information about this school and comparisons of the school to the district and the county. Specifically, DataQuest is a dynamic system that provides reports for accountability (e.g., test data, enrollment, high school graduates, dropouts, course enrollments, staffing, and data regarding English learners).
Internet Access Internet access is available at public libraries and other locations that are publicly accessible (e.g., the California State Library). Access to the Internet at libraries and public locations is generally provided on a first-come, first-served basis. Other use restrictions may include the hours of operation, the length of time that a workstation may be used (depending on availability), the types of software programs available on a workstation, and the ability to print documents.